FinOps Circular Workflow Template for PowerPoint & Google Slides


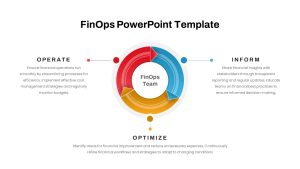
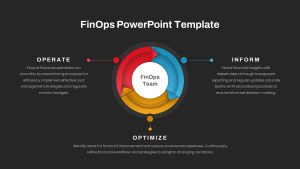
Leverage this dynamic circular infographic to illustrate the core functions of your FinOps team using a three-stage workflow diagram. At its center, the bold “FinOps Team” label anchors three color-segmented rings—red for Operate, blue for Inform, and yellow for Optimize—each extending outward with arrowheads to underscore continuous iteration. Adjacent text blocks provide space for bullet points or brief descriptions of how you streamline financial operations, share data-driven insights, and refine cost-management strategies. The balanced layout features clean vector shapes, minimal drop shadows, and ample white space, delivering a professional aesthetic that suits executive briefings and operational reviews alike.
Fully editable via master slides, this template lets you customize every element in seconds. Swap out section titles, adjust ring segment proportions, or update accent colors to match your brand palette. Replace placeholder text and icons with your own content, or drag and drop new visual assets into the slide. The underlying grid ensures precise alignment, while vector-based graphics maintain crisp resolution on any screen or print format. Reorder or duplicate segments to expand beyond three phases, and apply simple entrance animations for dynamic storytelling in both PowerPoint and Google Slides.
In addition, embed data callouts within each ring segment for extra context and integrate this diagram with your quarterly planning or audit templates. The clean typography and balanced spacing ensure readability on any screen. Download this template to unify your FinOps narrative and align teams in minutes.
Who is it for
FinOps managers, financial operations teams, and CFO departments seeking a clear visual to outline operational processes, reporting cadences, and continuous optimization cycles will benefit from this template.
Other Uses
Repurpose this layout to map project management phases, IT service workflows, or cross-functional process diagrams. Update ring labels to represent marketing sprints, product iteration cycles, or audit review stages for versatile application across functions.
Login to download this file

Item ID
SB04335
Related Templates

Sales Process Workflow Funnel Diagram PowerPoint Template for PowerPoint & Google Slides
Funnel
Workflow PowerPoint Process infographic for PowerPoint & Google Slides
Process
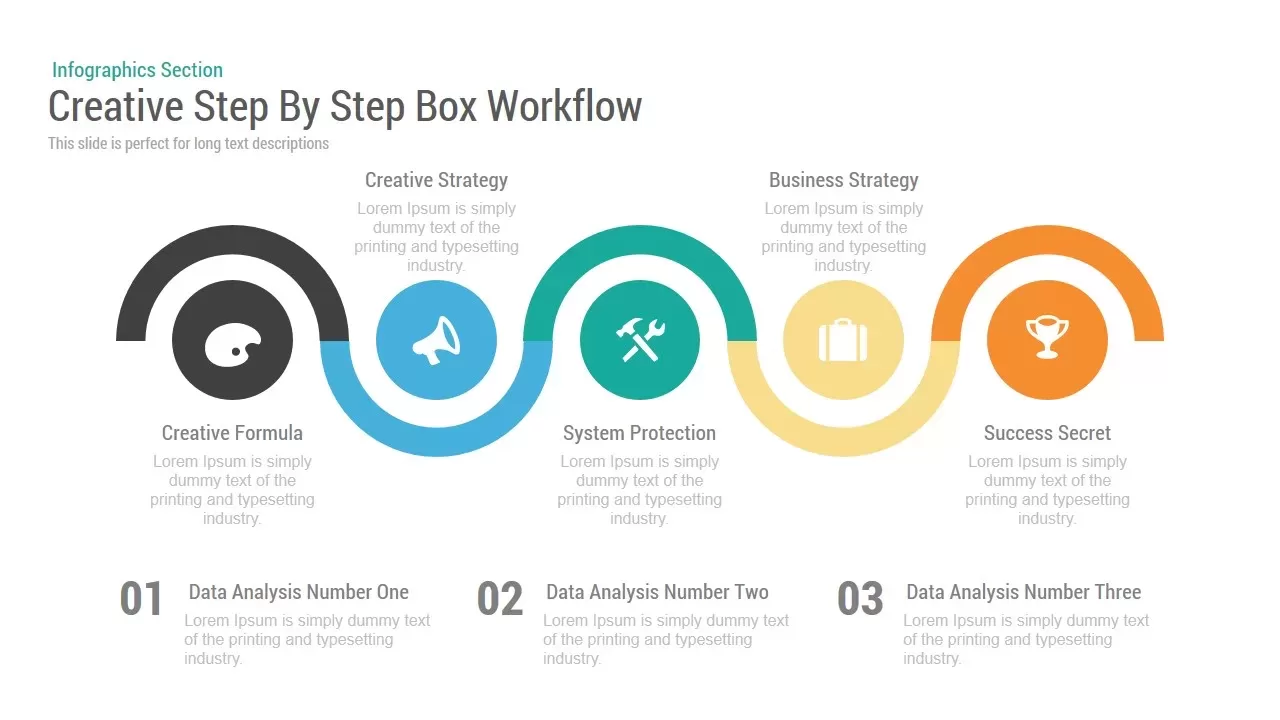
Creative Step By Step Workflow template for PowerPoint & Google Slides
Process
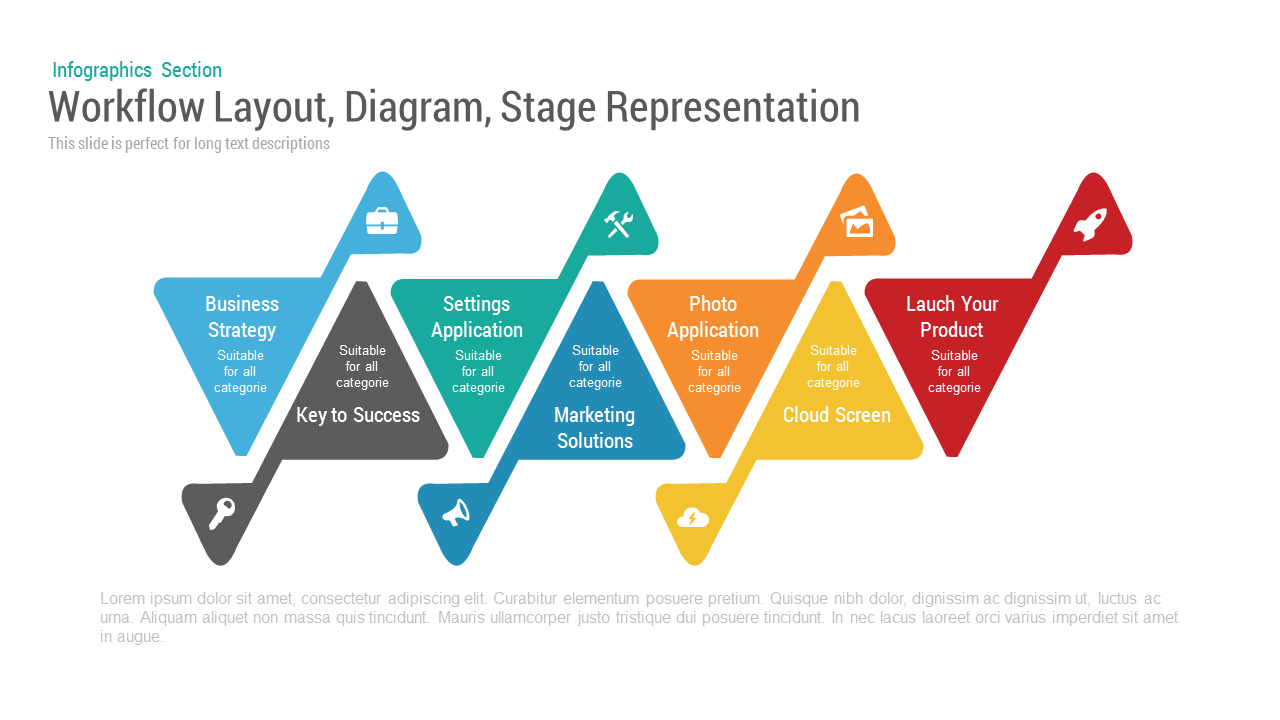
Workflow Diagram template for PowerPoint & Google Slides
Process
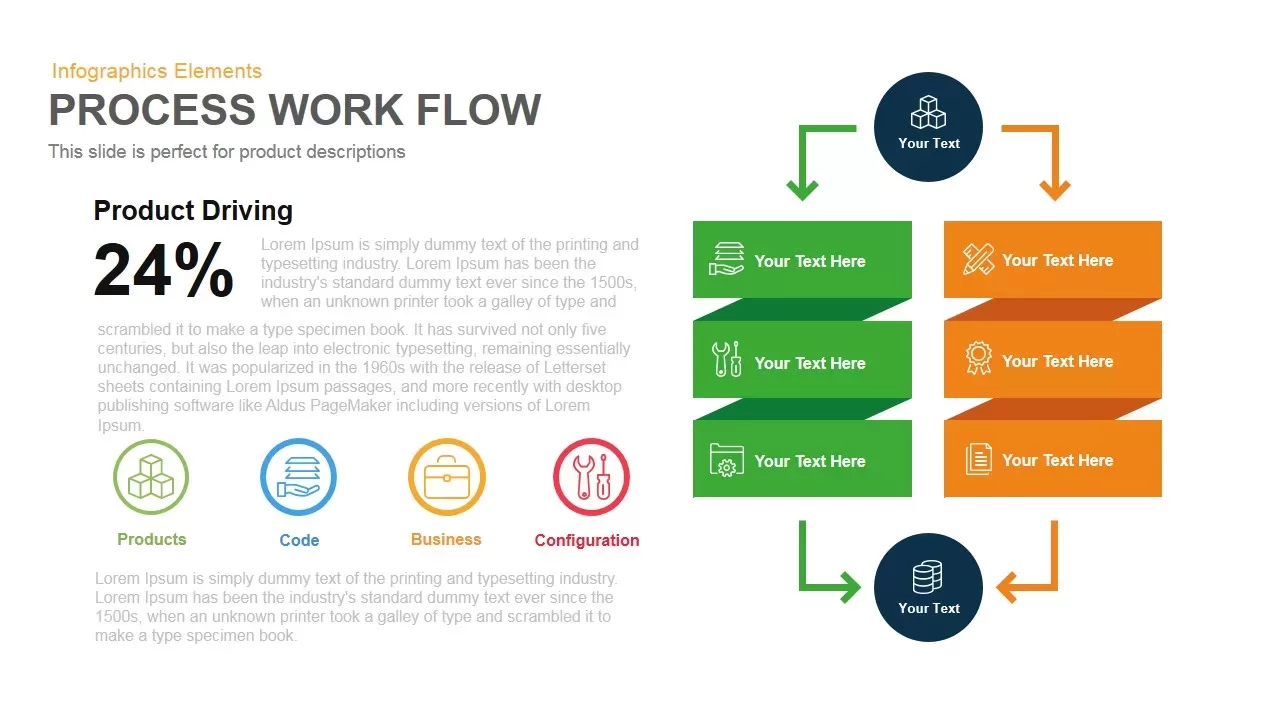
Process Workflow template for PowerPoint & Google Slides
Infographics
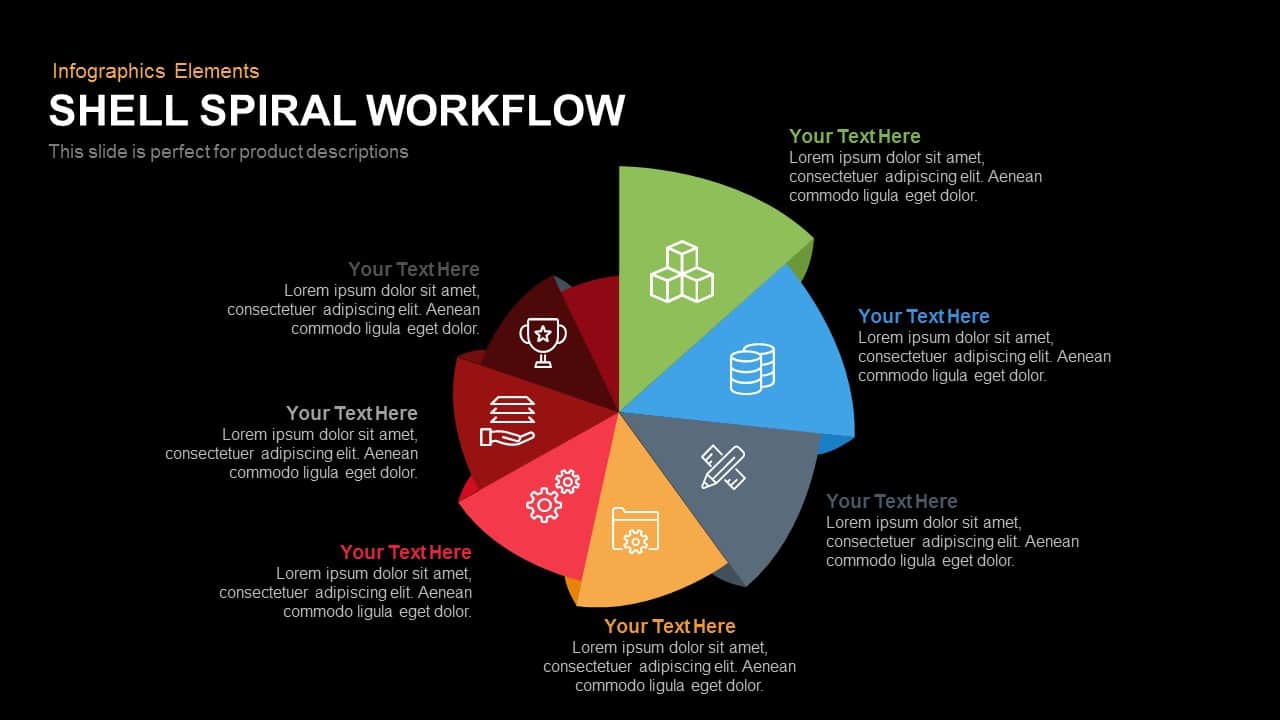
Shell Spiral Workflow Template for PowerPoint & Google Slides
Infographics
7-Step Workflow Process Diagram Template for PowerPoint & Google Slides
Process

Arrow Step Infographics Workflow Template for PowerPoint & Google Slides
Arrow
Gradient Seven-Stage Bubble Workflow Template for PowerPoint & Google Slides
Process
Eight Stage Hourglass Workflow Diagram Template for PowerPoint & Google Slides
Process
Three Staged Business Workflow template for PowerPoint & Google Slides
Business

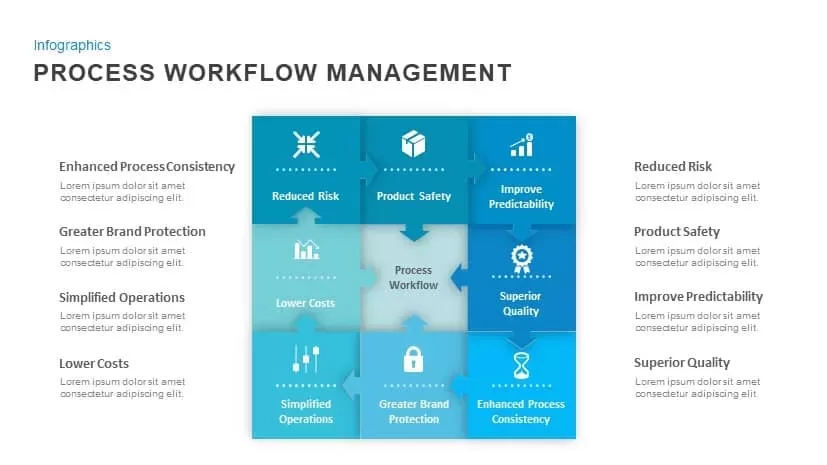
Process Workflow Management template for PowerPoint & Google Slides
Process
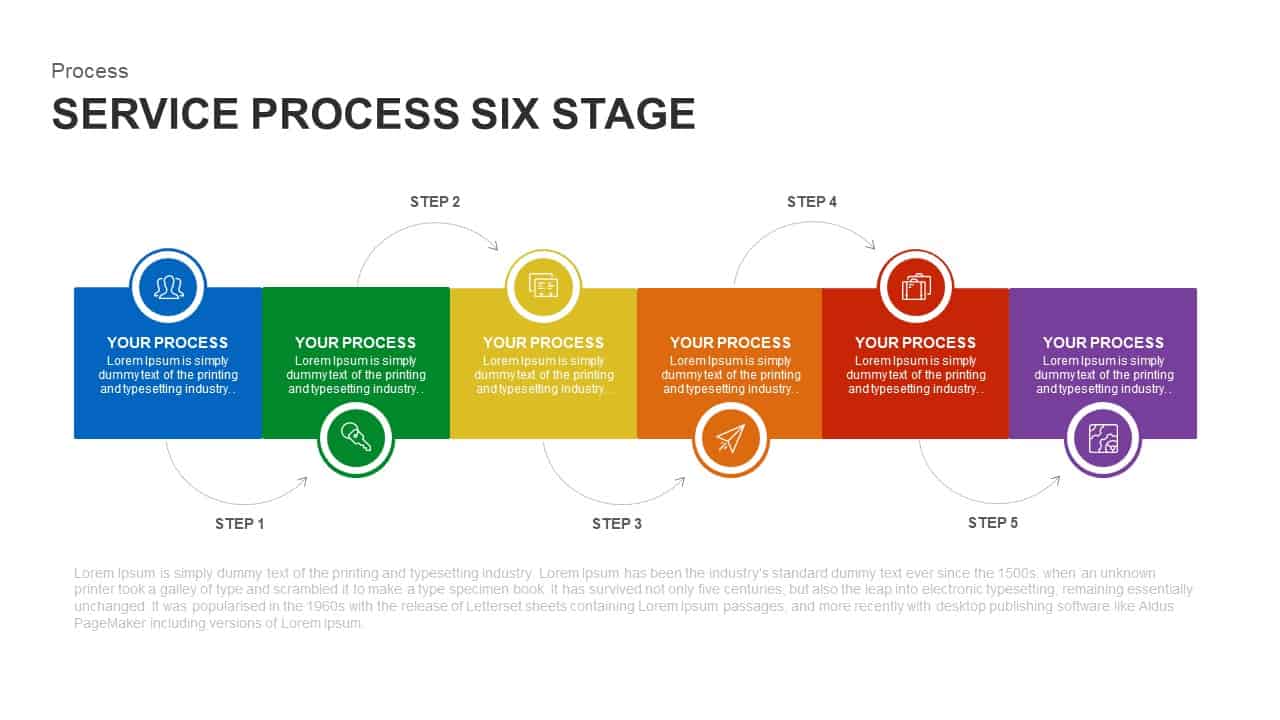
Six-Stage Service Process Workflow Template for PowerPoint & Google Slides
Process

HR Workflow Process Management Template for PowerPoint & Google Slides
HR
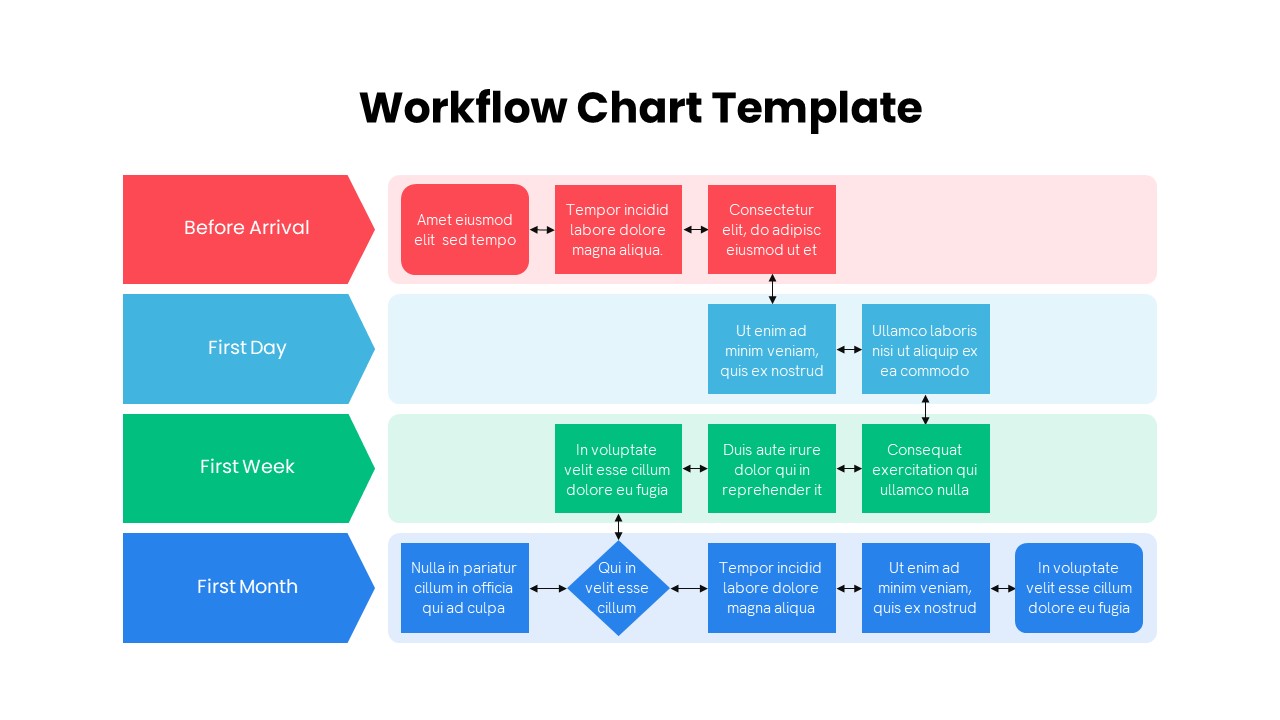
Colorful Multistage Workflow Chart Template for PowerPoint & Google Slides
Flow Charts
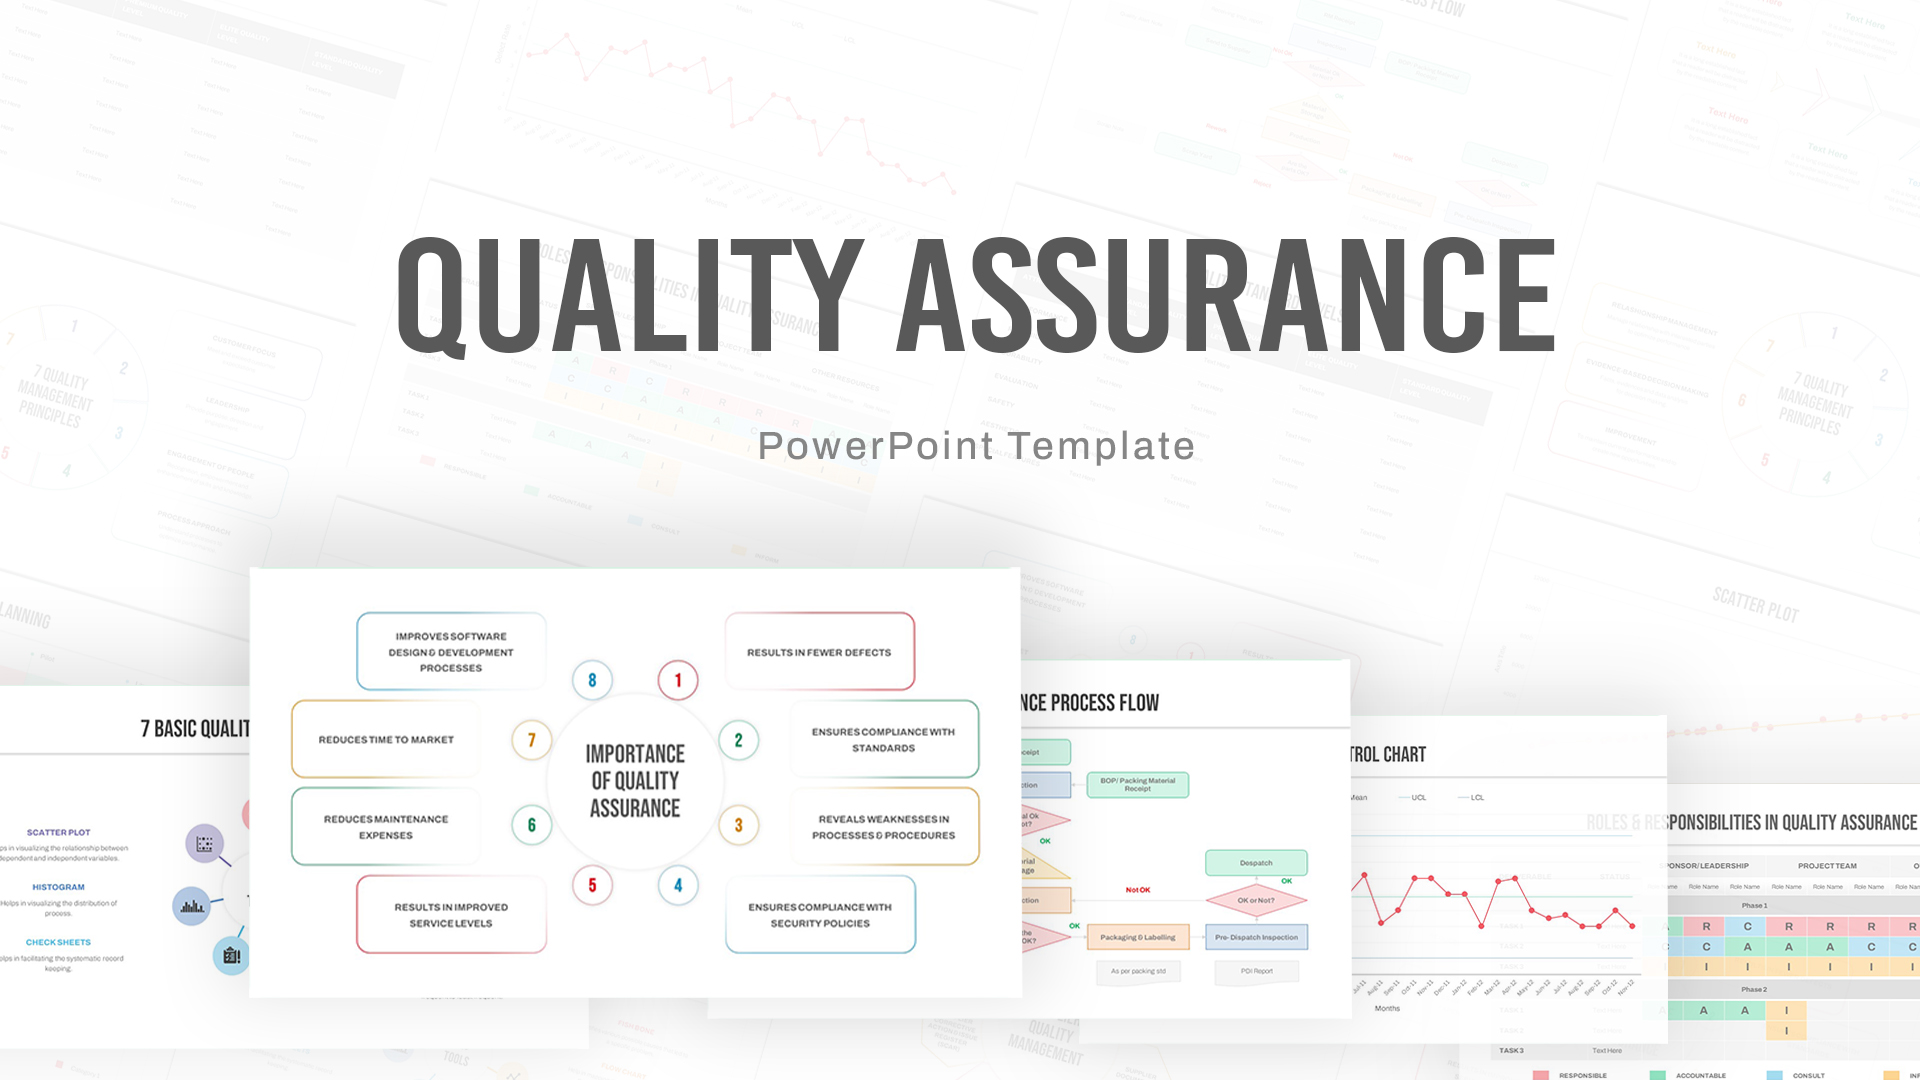
Comprehensive Quality Assurance Workflow Template for PowerPoint & Google Slides
Company Profile
ETL Data Pipeline Workflow Diagram Template for PowerPoint & Google Slides
Process
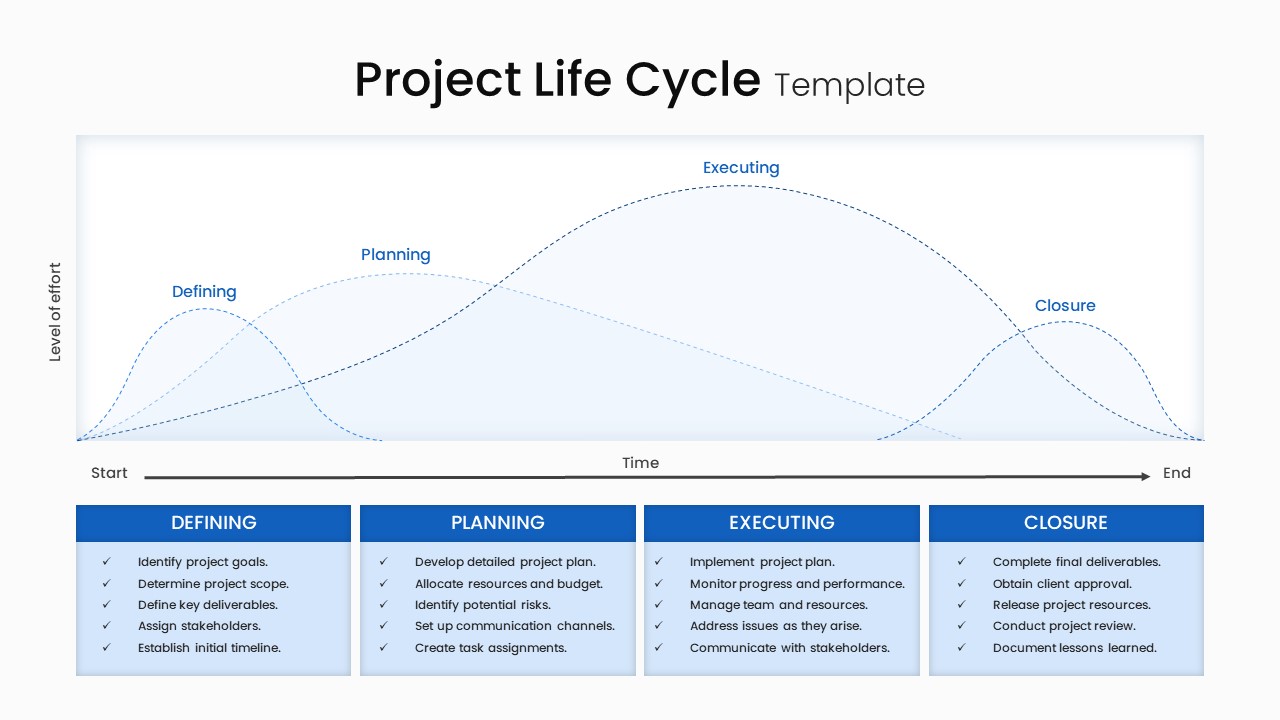
Project Life Cycle Workflow Diagram Template for PowerPoint & Google Slides
Process
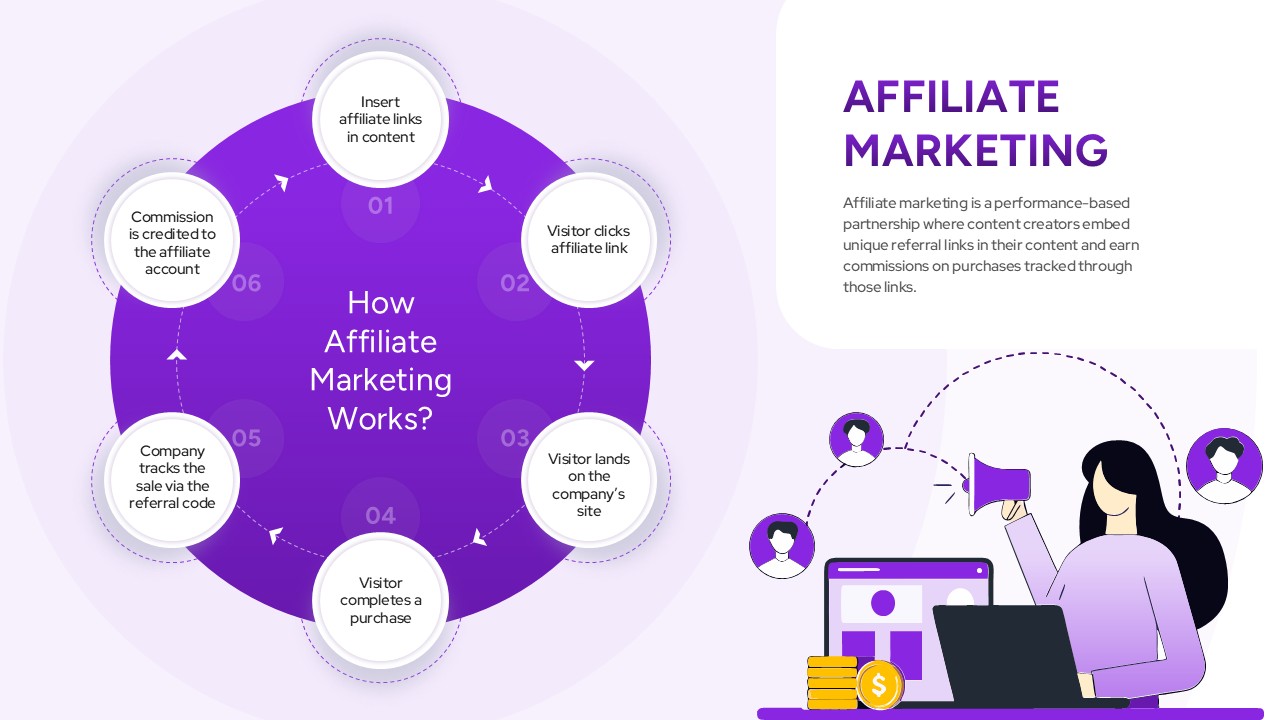
Affiliate Marketing Workflow Diagram Template for PowerPoint & Google Slides
Customer Experience
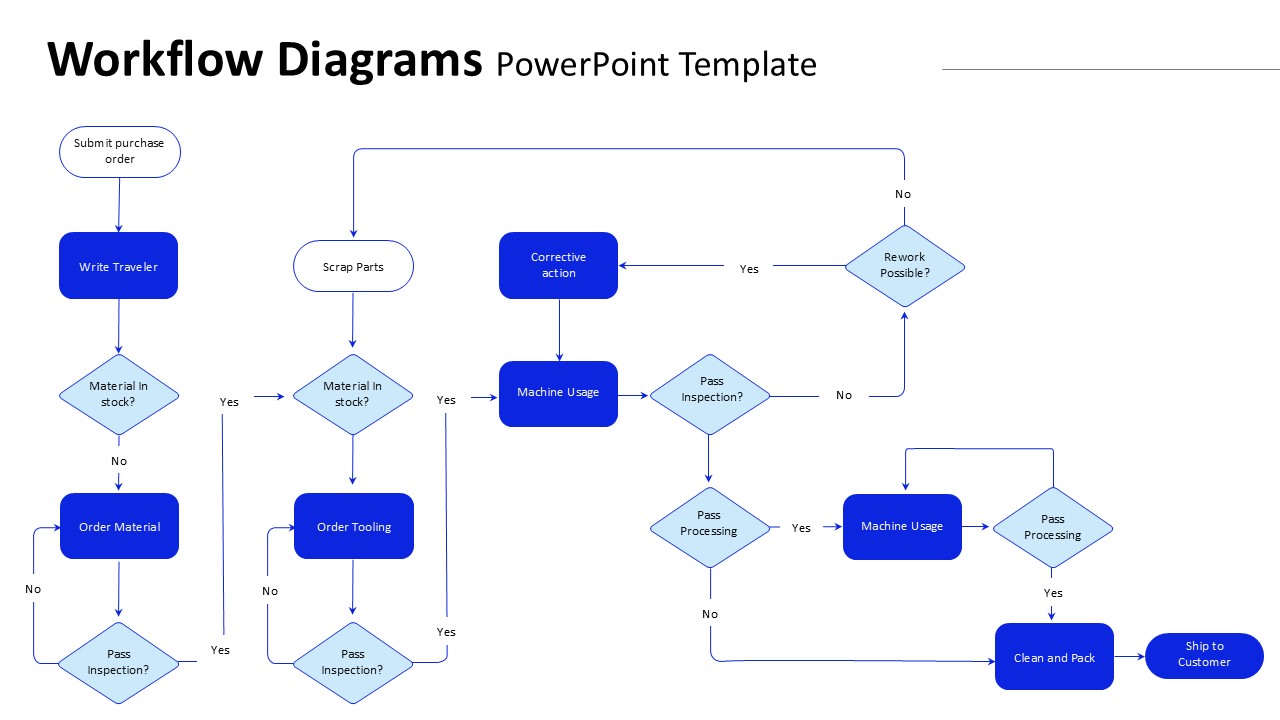
Manufacturing Workflow Diagram Template for PowerPoint & Google Slides
Flow Charts
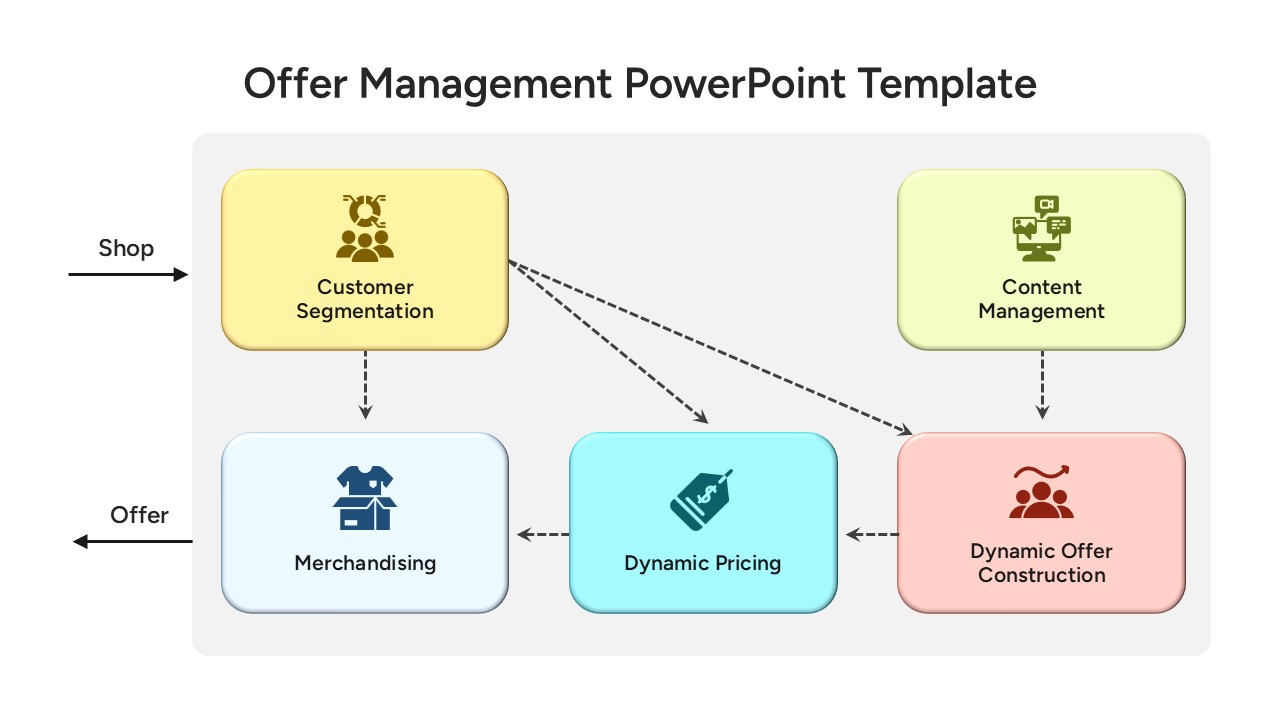
Offer Management Workflow Template for PowerPoint & Google Slides
Customer Journey
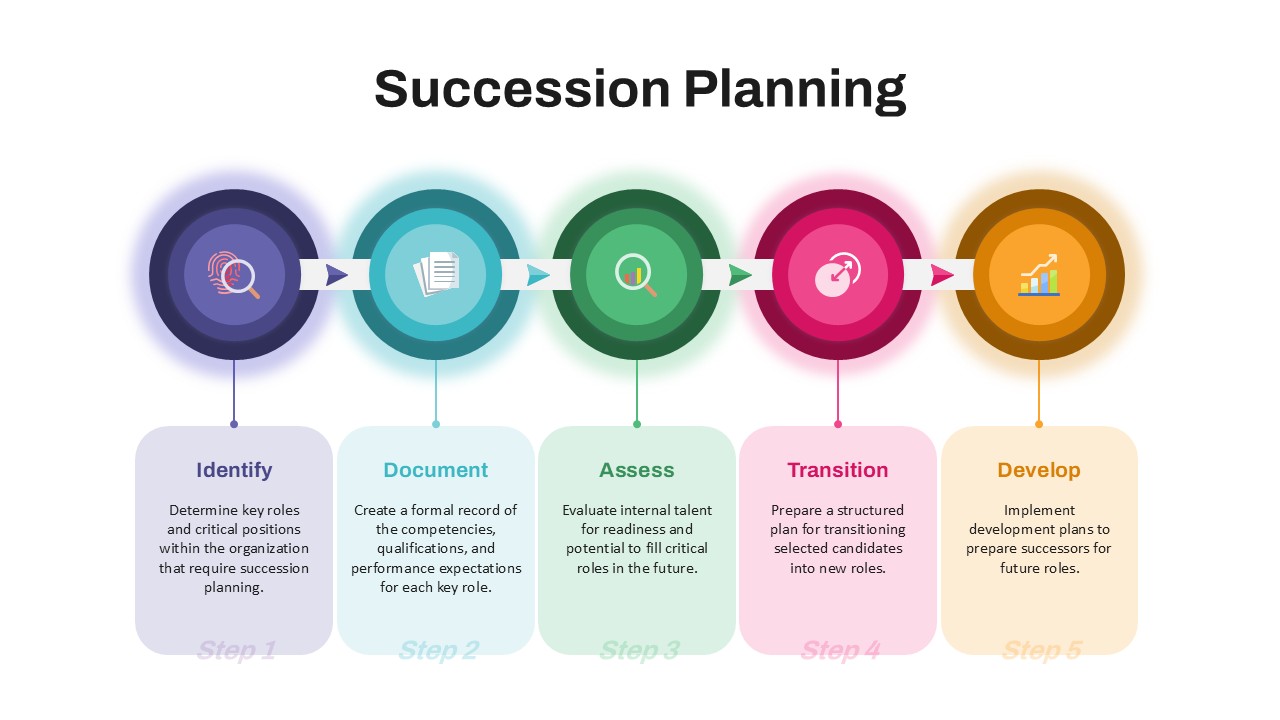
Advanced Succession Planning Workflow Template for PowerPoint & Google Slides
Employee Performance
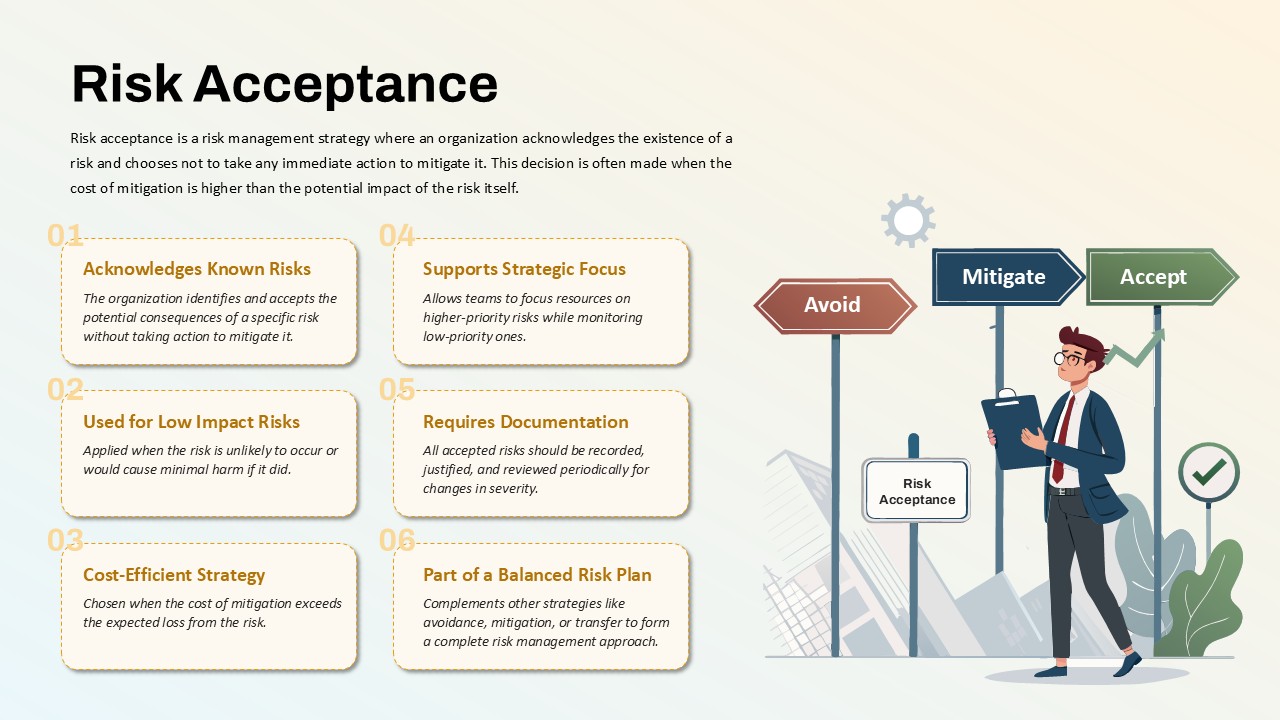
Risk Acceptance Workflow Template for PowerPoint & Google Slides
Risk Management
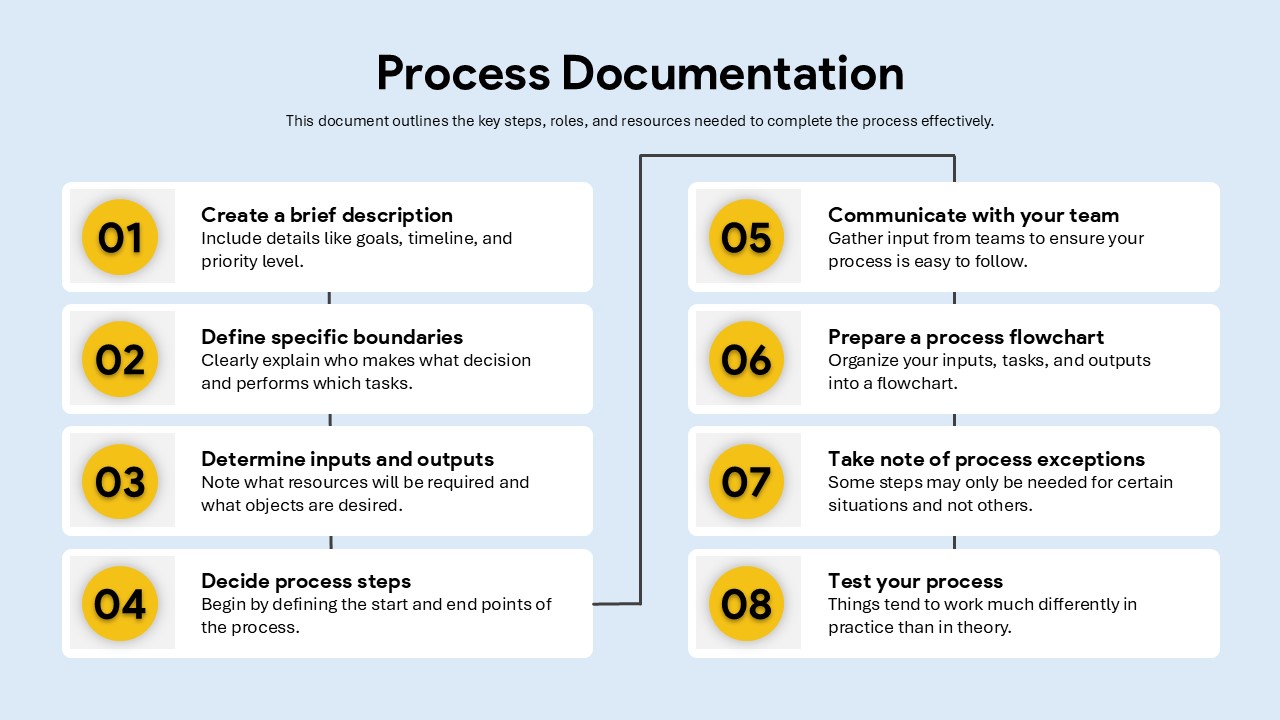
Process Documentation Workflow Slide Template for PowerPoint & Google Slides
Process
Customer Data Platform Workflow Diagram Template for PowerPoint & Google Slides
Information Technology
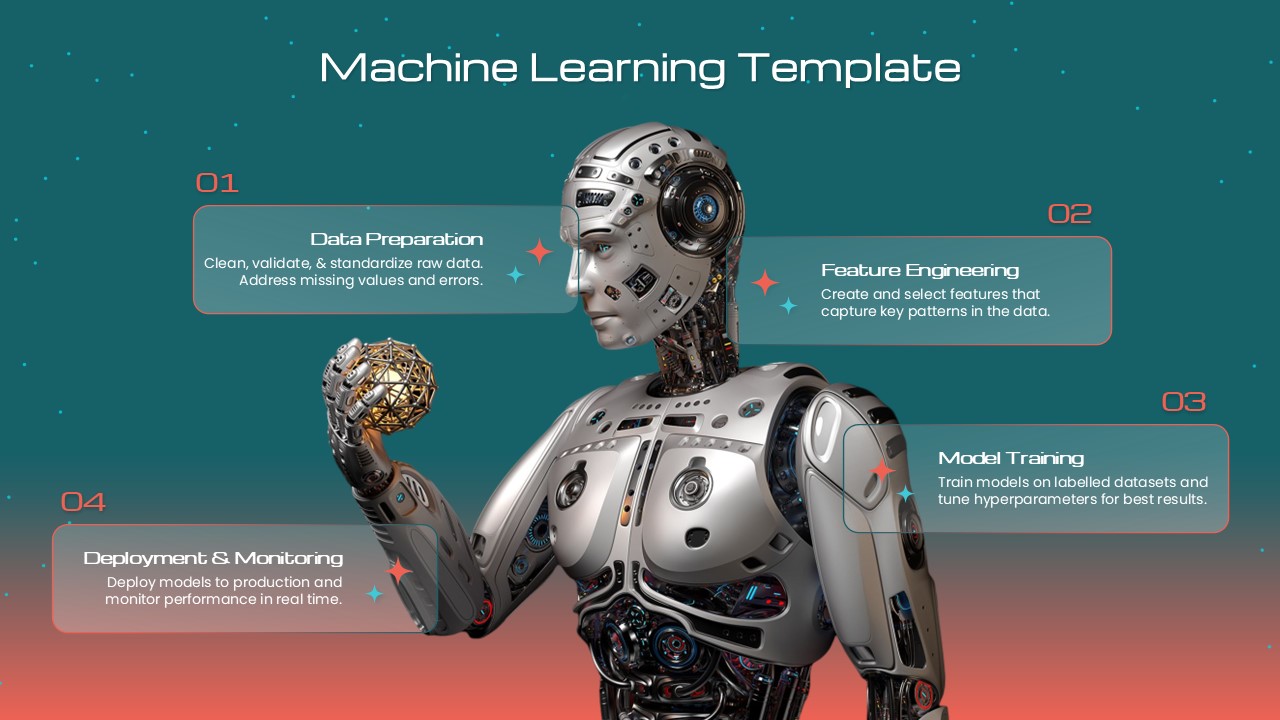
Futuristic Machine Learning Workflow Template for PowerPoint & Google Slides
Machine Learning
Machine Learning 4-Step Workflow Template for PowerPoint & Google Slides
Machine Learning
Six Step Project Workflow Template for PowerPoint & Google Slides
Project
Server Migration Plan Workflow Template for PowerPoint & Google Slides
Information Technology
Free 6-Step Curved Workflow Timeline for PowerPoint & Google Slides
Timeline
Free
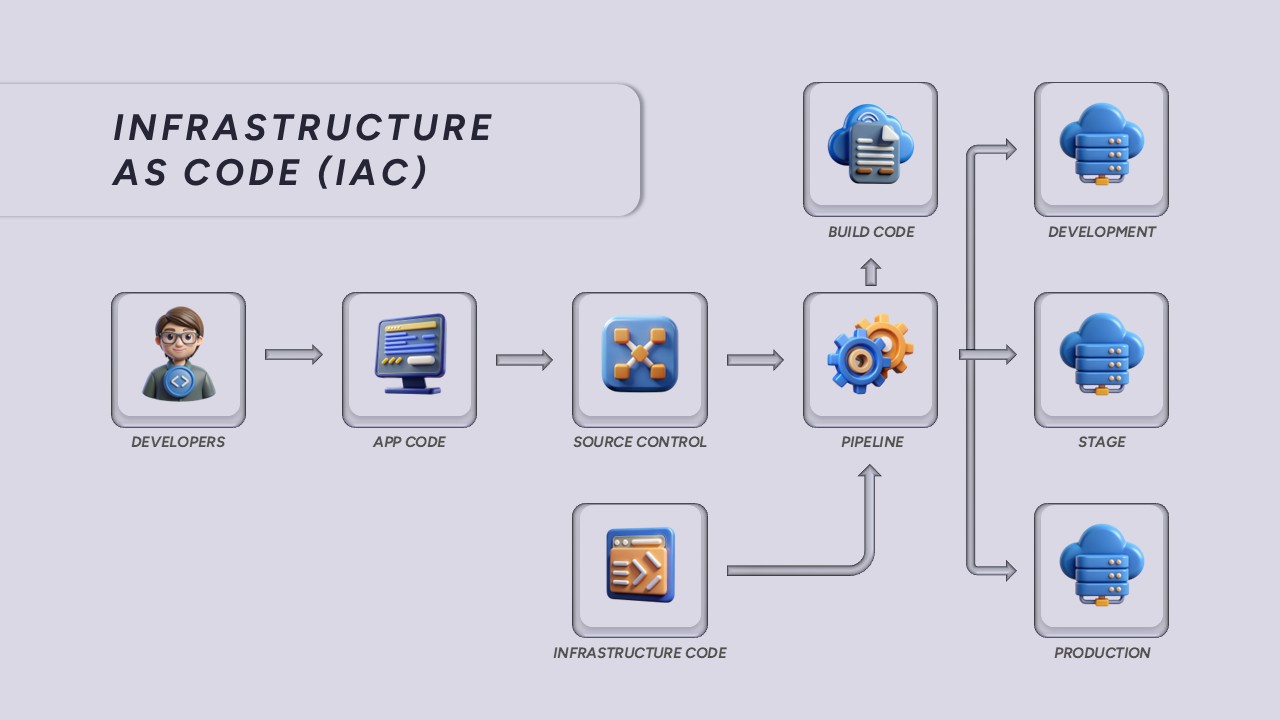
Infrastructure as Code (IAC) Workflow template for PowerPoint & Google Slide
Technology
Workflow Process Template for PowerPoint and Keynote
Process
4 Step Creative Circular Diagram Template for PowerPoint & Google Slides
Infographics
8 Steps Circular Process Diagram Template for PowerPoint & Google Slides
Process
Six Step Creative Circular Diagram Template for PowerPoint & Google Slides
Circular
Six Section Circular Infographic Diagram Template for PowerPoint & Google Slides
Circular
Eight-Section Circular Diagram template for PowerPoint & Google Slides
Circular

Light Bulb Idea Circular Diagram Template for PowerPoint & Google Slides
Infographics
Five-Section Circular Arrow Diagram Template for PowerPoint & Google Slides
Circular
8-Step Circular Arrow Diagram Template for PowerPoint & Google Slides
Arrow
Four Section Circular Text Boxes Diagram Template for PowerPoint & Google Slides
Circular
Eight-Step Circular Diagram Infographic Template for PowerPoint & Google Slides
Circular

8-Step Puzzle Circular Diagram Template for PowerPoint & Google Slides
Circular
Circular Timeline Infographics Template for PowerPoint & Google Slides
Timeline
4 Staged Circular Business Process Diagram template for PowerPoint & Google Slides
Process
Five Stage Circular Arrow Diagram Template for PowerPoint & Google Slides
Process
Five-Step Circular Process Diagram Template for PowerPoint & Google Slides
Circular
Six-Stage Clockwise Circular Diagram Template for PowerPoint & Google Slides
Circular
Circular Three-Step Infographic Diagram Template for PowerPoint & Google Slides
Circular
8 Step Circular Process Flow Diagram Template for PowerPoint & Google Slides
Process
6-Step Circular Process Flow Diagram Template for PowerPoint & Google Slides
Process
8-Stage Chevron Circular Diagram Template for PowerPoint & Google Slides
Process
Colorful Circular Puzzle Diagram Template for PowerPoint & Google Slides
Circular
6-Part Circular Gear Infographic Diagram Template for PowerPoint & Google Slides
Process
Colorful 5-Step Circular Process Template for PowerPoint & Google Slides
Process

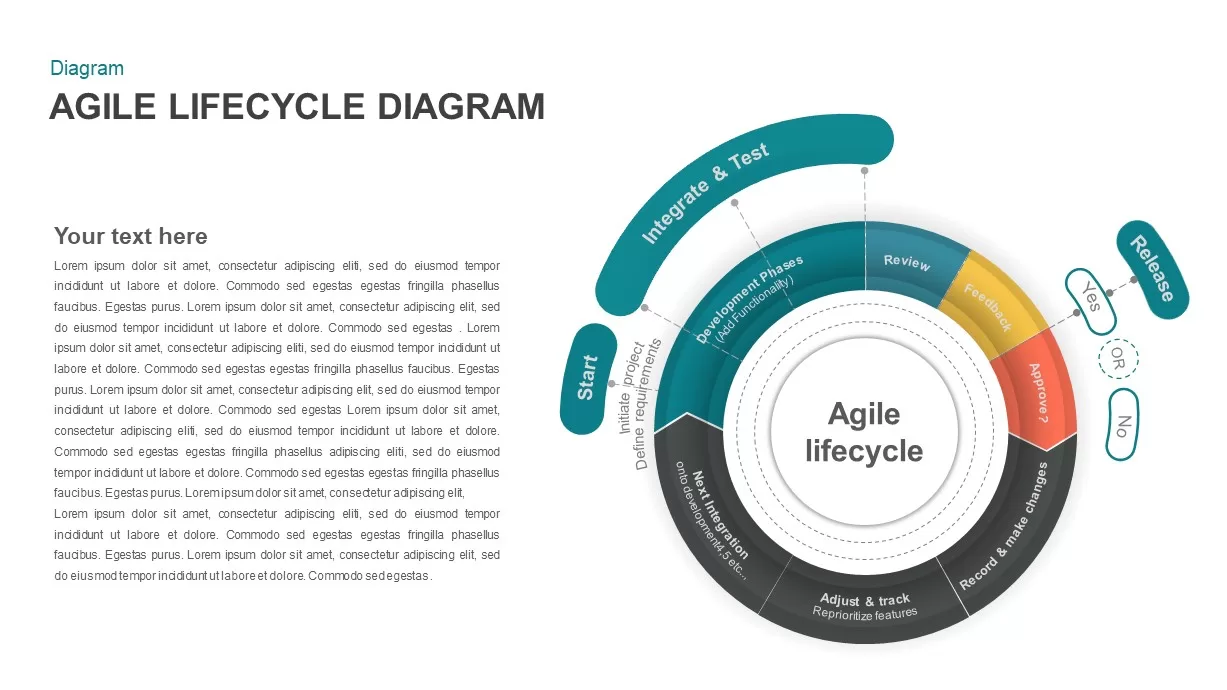
Agile Lifecycle Circular Diagram Template for PowerPoint & Google Slides
Circular
Circular CRM Process Infographic Diagram Template for PowerPoint & Google Slides
Circular
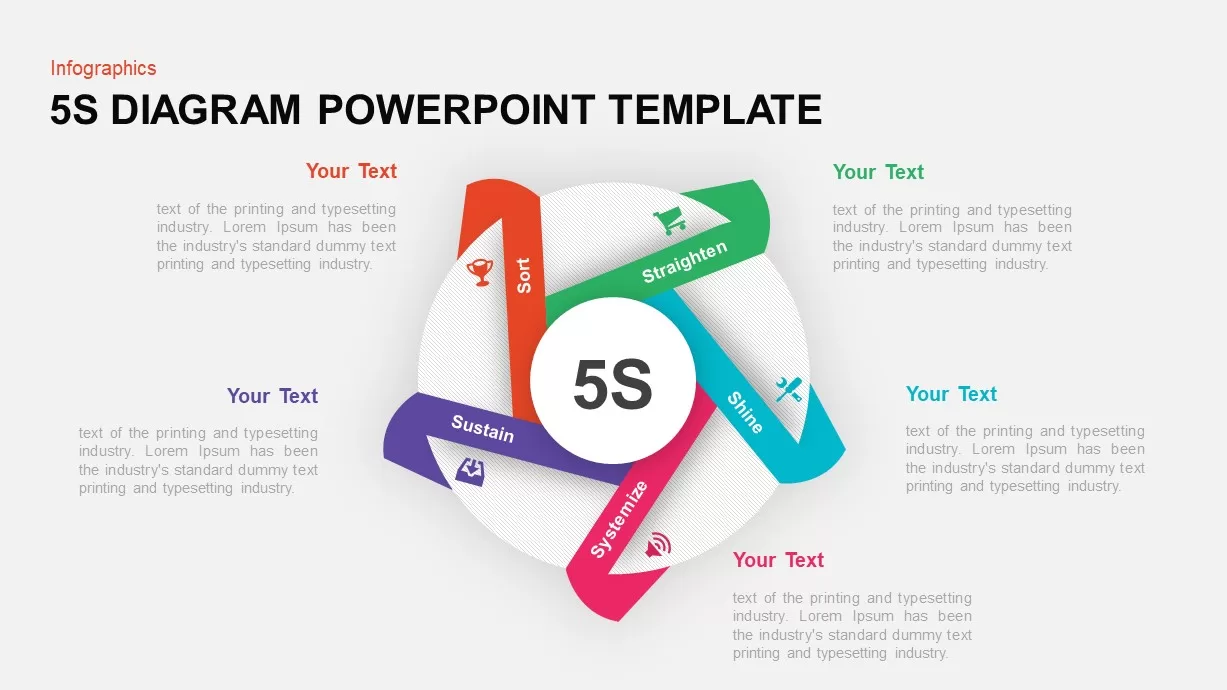
5S Lean Methodology Circular Diagram Template for PowerPoint & Google Slides
Process
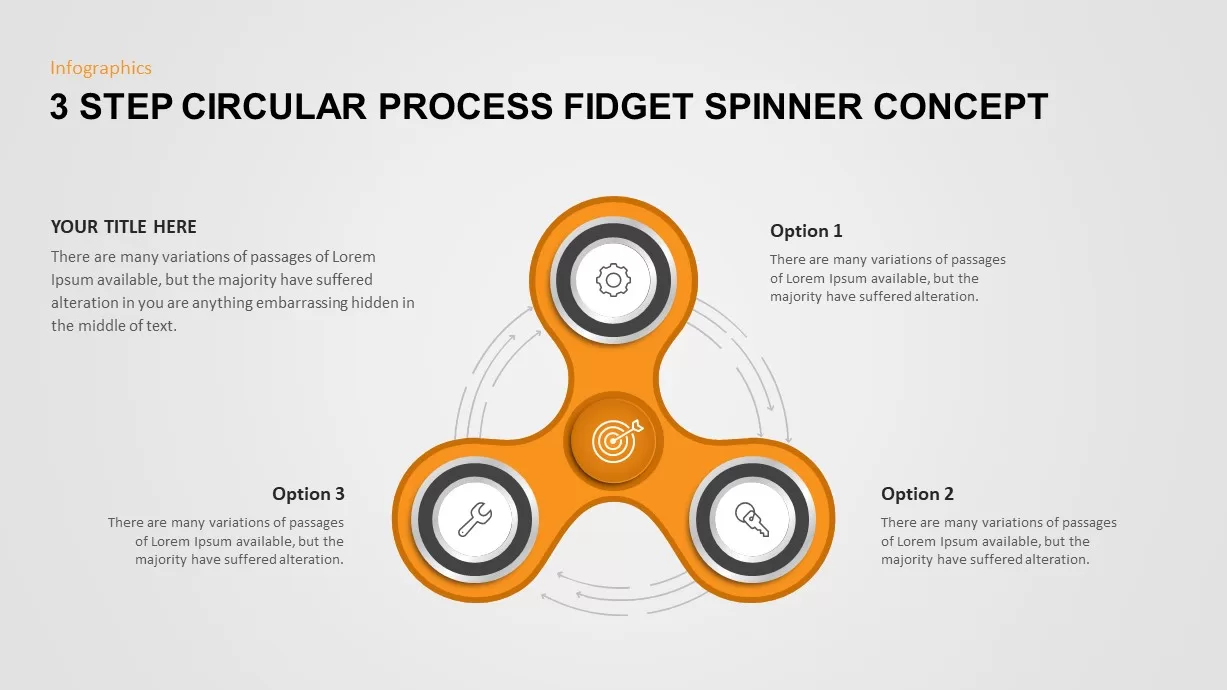
3 Step Circular Process Fidget Spinner Template for PowerPoint & Google Slides
Process
Four-Step Circular Process Infographics Template for PowerPoint & Google Slides
Circular
Modern Circular Infographics Template for PowerPoint & Google Slides
Circular
Four-Item Circular Diagram Concept Template for PowerPoint & Google Slides
Circular
Five-Step Circular Badge Infographics Template for PowerPoint & Google Slides
Circular
8-Step Circular Diagram Infographics Template for PowerPoint & Google Slides
Circular
Circular Business Ecosystem Diagram Template for PowerPoint & Google Slides
Business Strategy
Circular Arrows Infographic Template for PowerPoint & Google Slides
Business
Circular SWOT Analysis Infographic Template for PowerPoint & Google Slides
SWOT
Free Circular Multi-Step Flow Chart Diagram Template for PowerPoint & Google Slides
Flow Charts
Free
Circular Profile Resume and Skills Template for PowerPoint & Google Slides
Company Profile
Three-Segment Circular Arrow Cycle Template for PowerPoint & Google Slides
Circular
Circular Arrows Process Flow template for PowerPoint & Google Slides
Process
Accomplishment Circular Infographic Template for PowerPoint & Google Slides
Accomplishment
Circular Arrow Process Diagram Template for PowerPoint & Google Slides
Circular
Supply Chain Circular Process Infographics Template for PowerPoint & Google Slides
Business Strategy
10-Step Circular Process Diagram Template for PowerPoint & Google Slides
Process
Circular Project Status Template for PowerPoint & Google Slides
Project Status
Dynamic Circular Hub-and-Spoke Infographic Template for PowerPoint & Google Slides
Circular
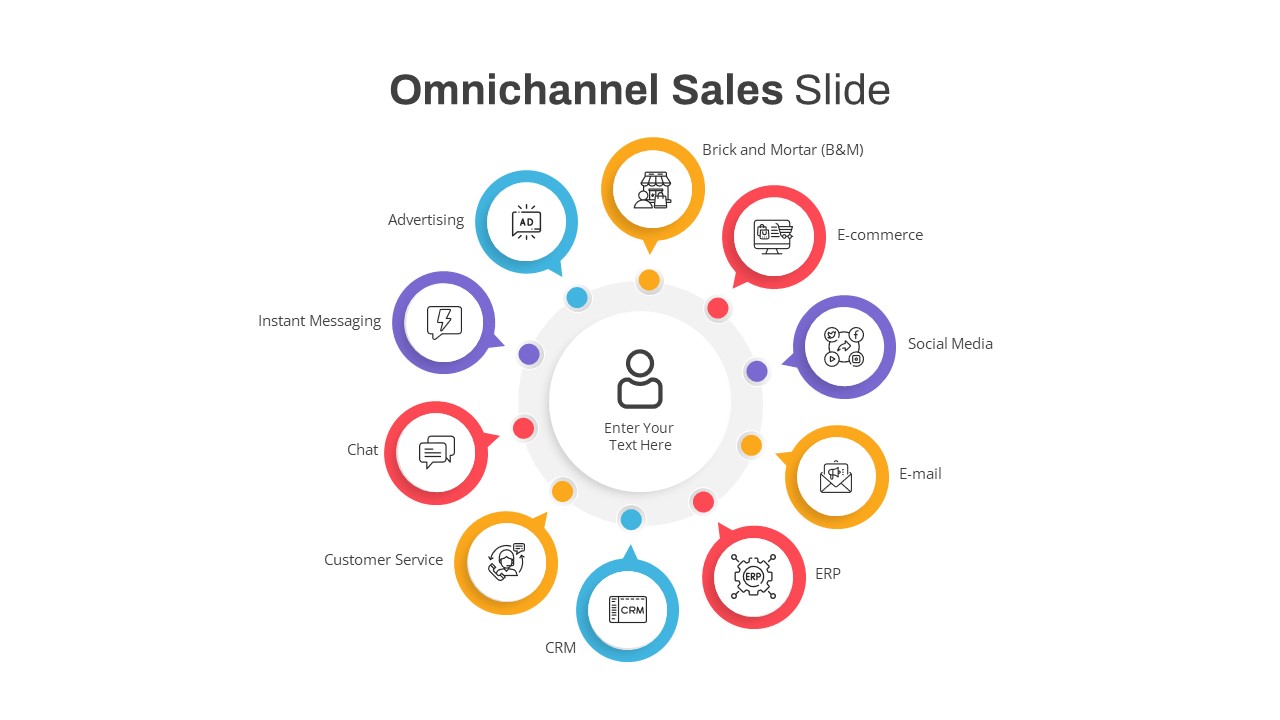
Omnichannel Sales Circular Hub & Spoke Template for PowerPoint & Google Slides
Digital Marketing
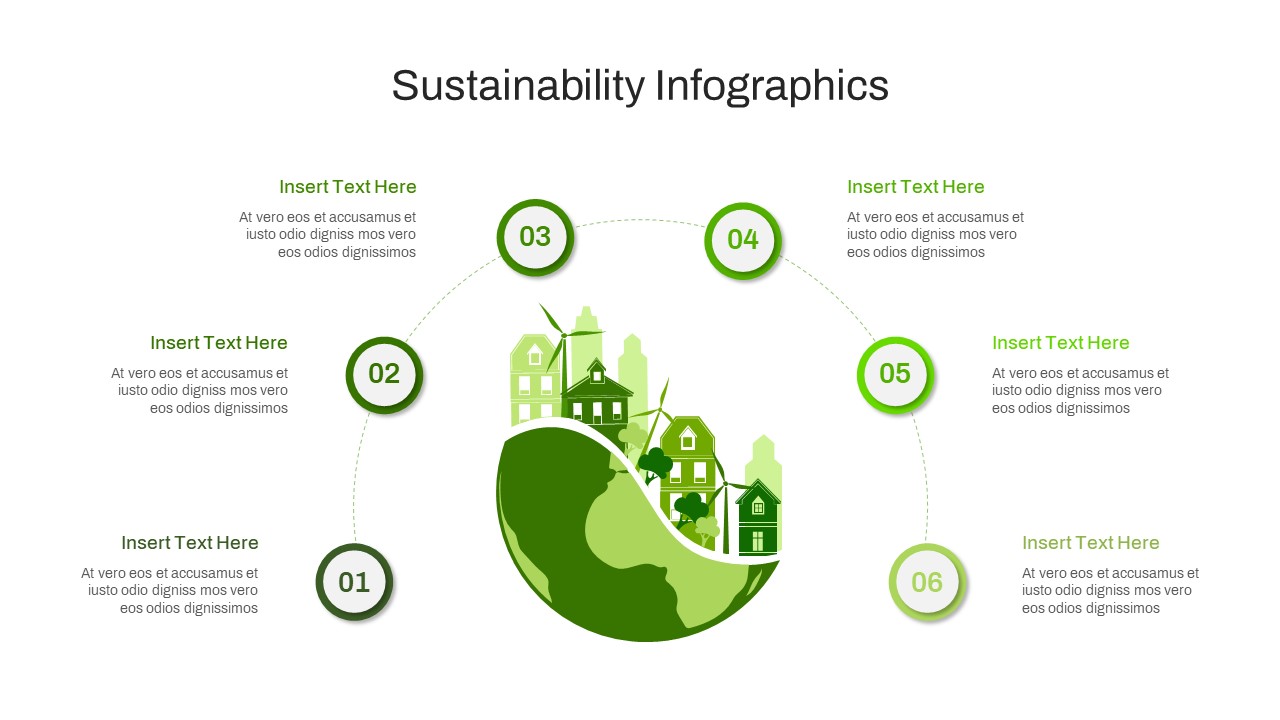
Circular Sustainability Infographic Template for PowerPoint & Google Slides
Process
Release Management Cycle Circular Diagram Template for PowerPoint & Google Slides
Software Development
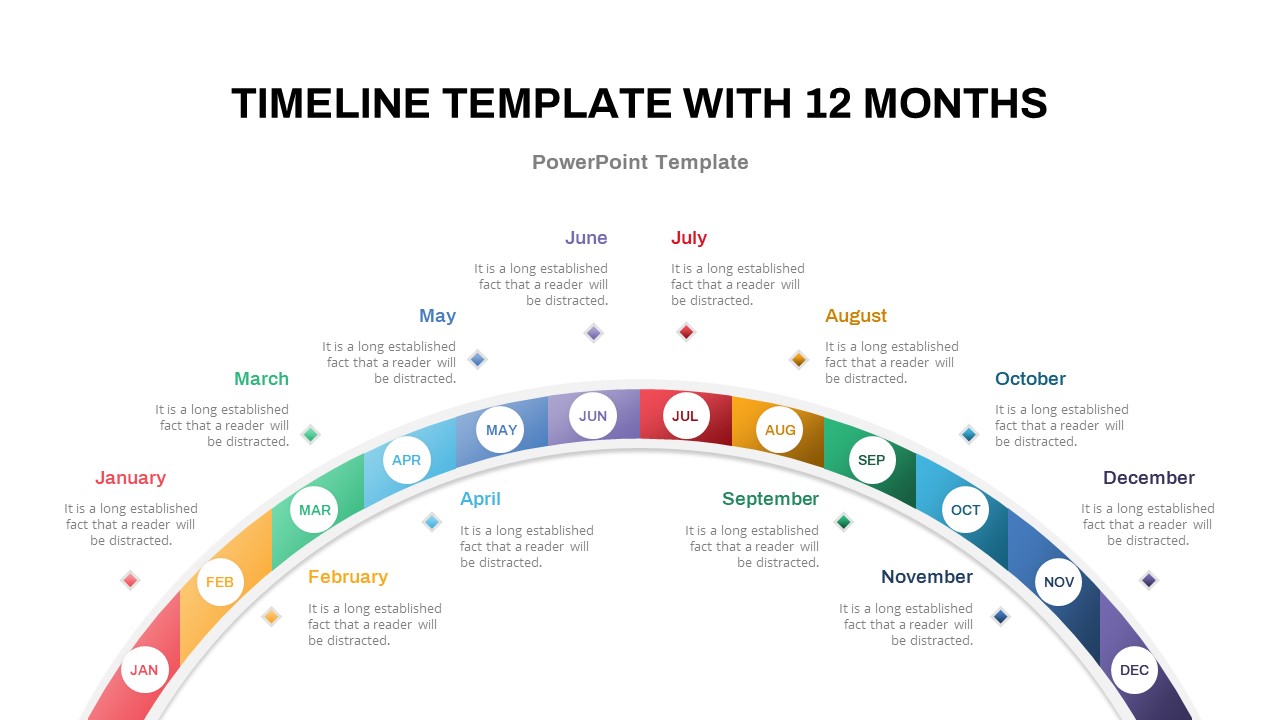
12-Month Semi-Circular Timeline Diagram Template for PowerPoint & Google Slides
Timeline
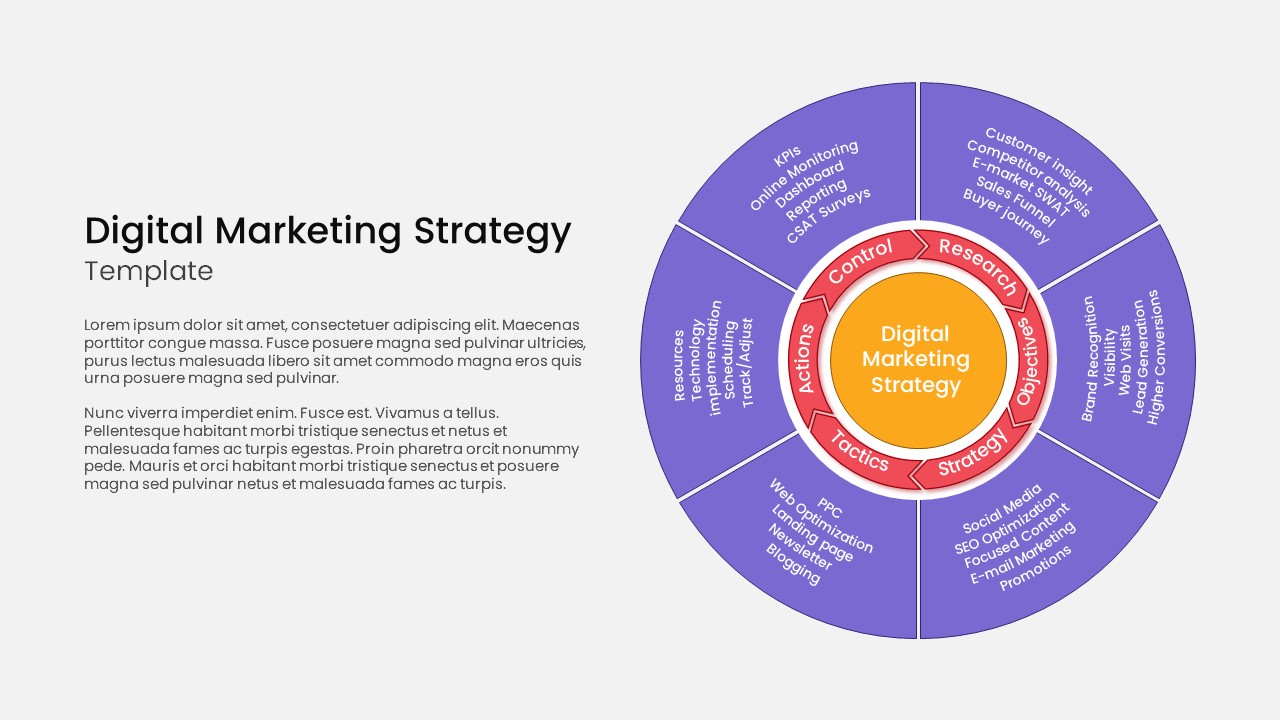
Circular Hub Digital Marketing Strategy Template for PowerPoint & Google Slides
Digital Marketing
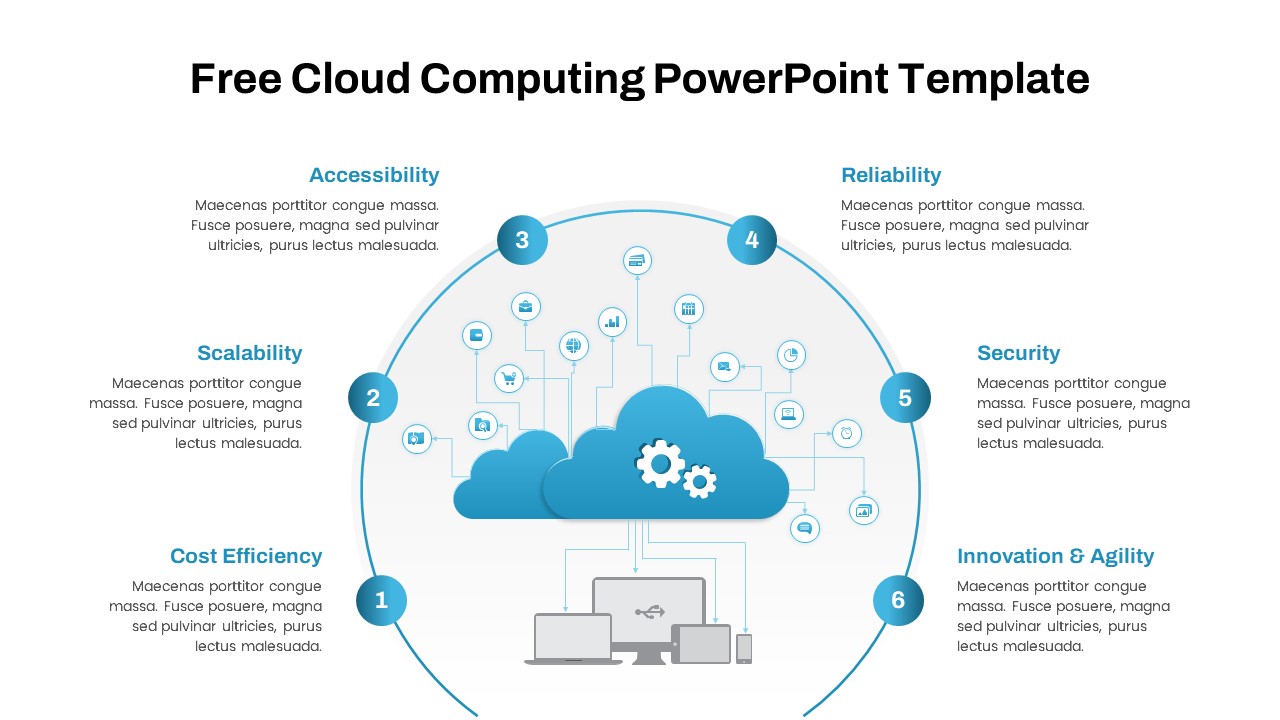
Free Cloud Computing Six-Step Circular Template for PowerPoint & Google Slides
Cloud Computing
Free
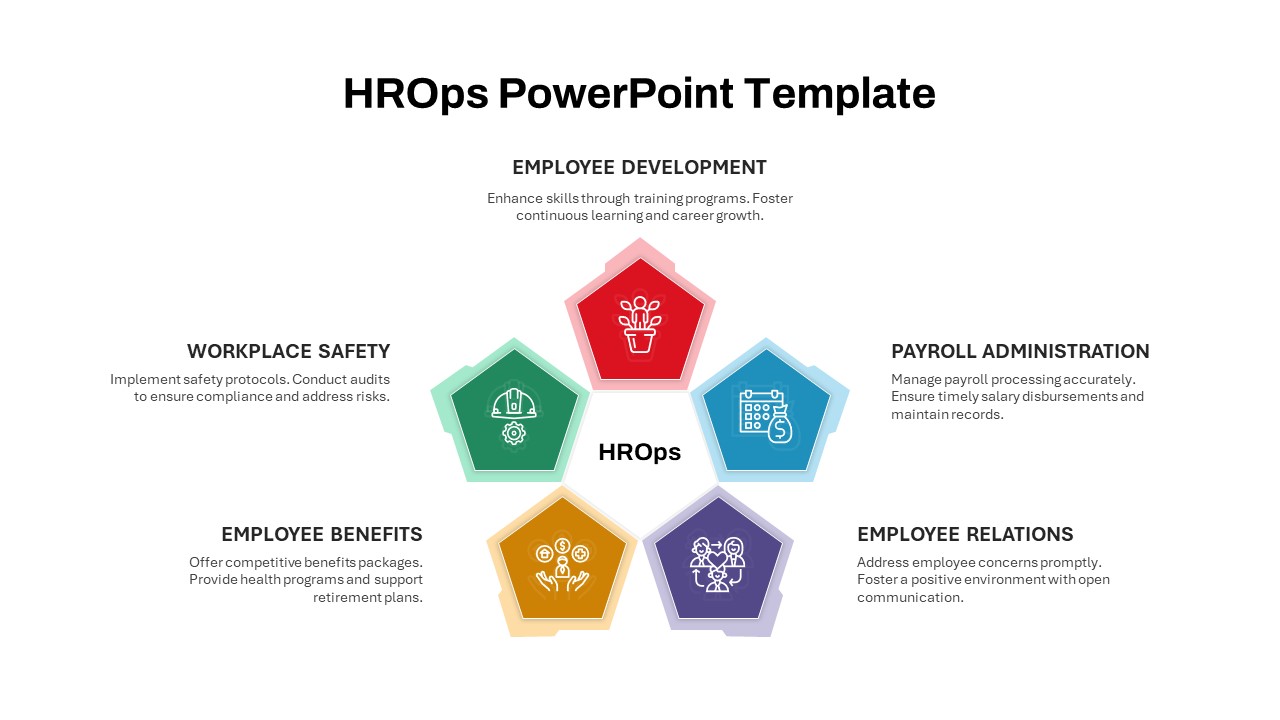
HROps Hub and Spoke Circular Diagram Template for PowerPoint & Google Slides
Circular
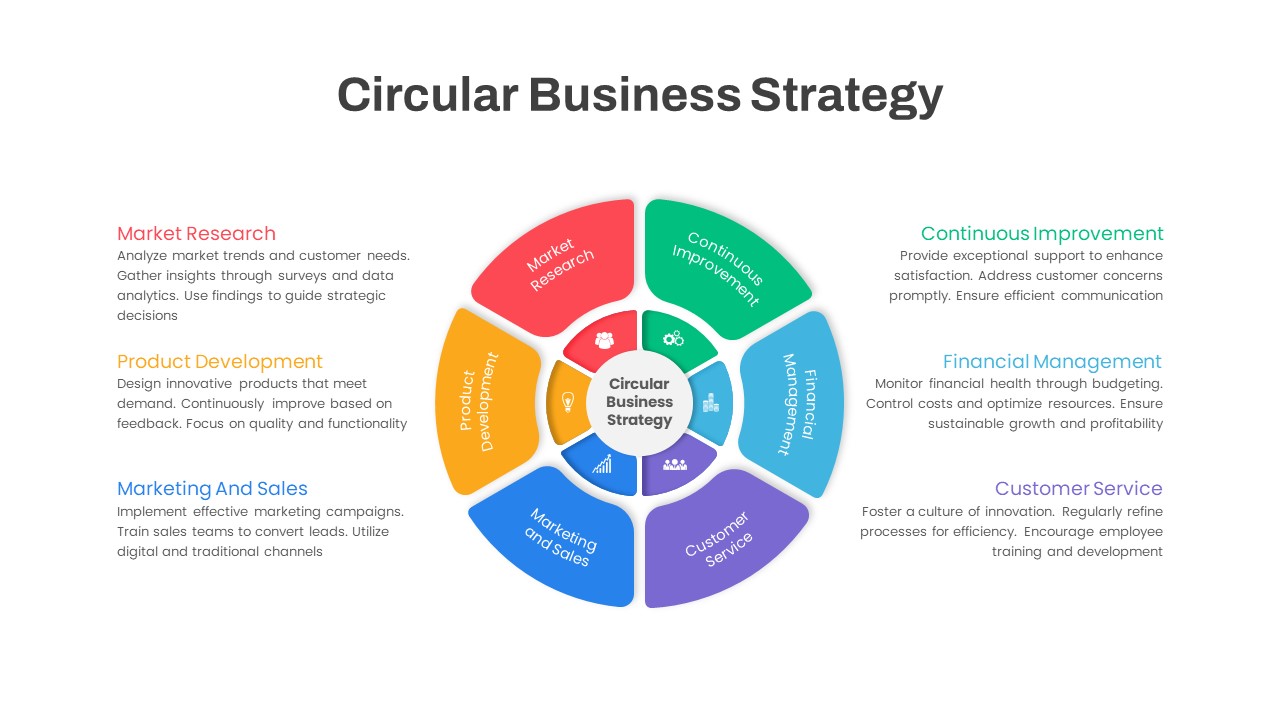
Circular Business Strategy Infographic Template for PowerPoint & Google Slides
Circular
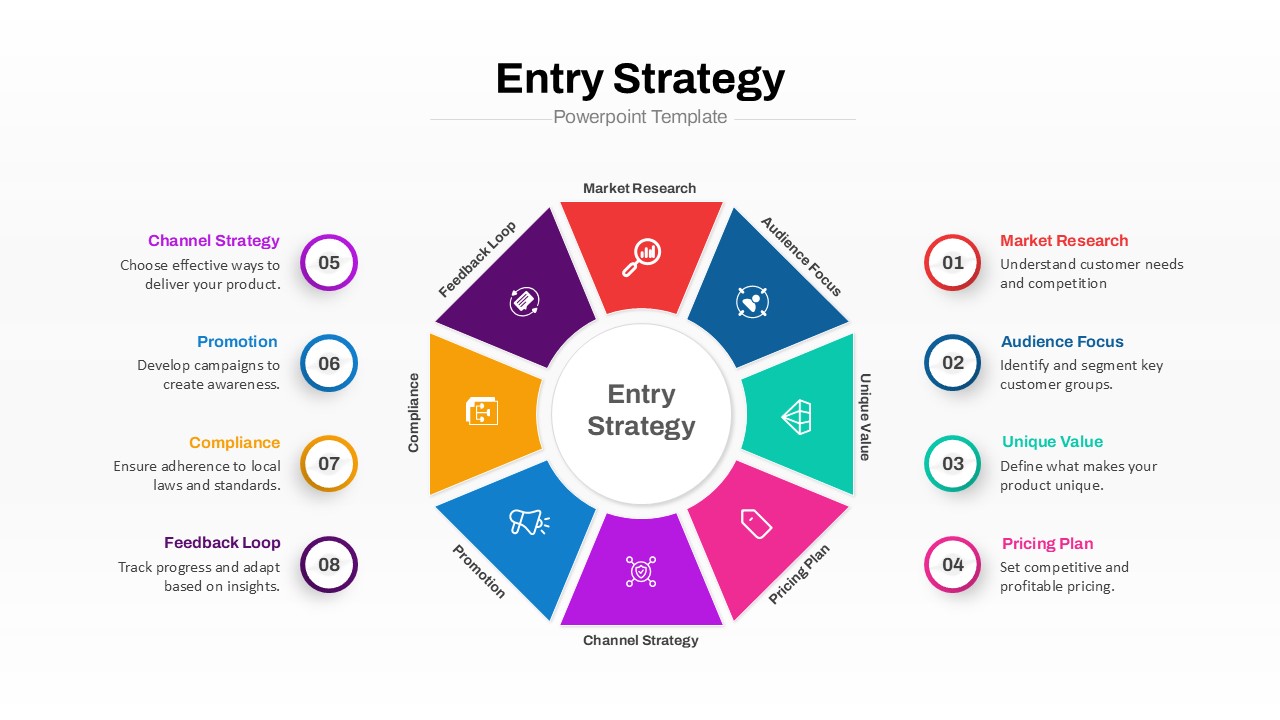
Entry Strategy Circular Diagram Template for PowerPoint & Google Slides
Circular
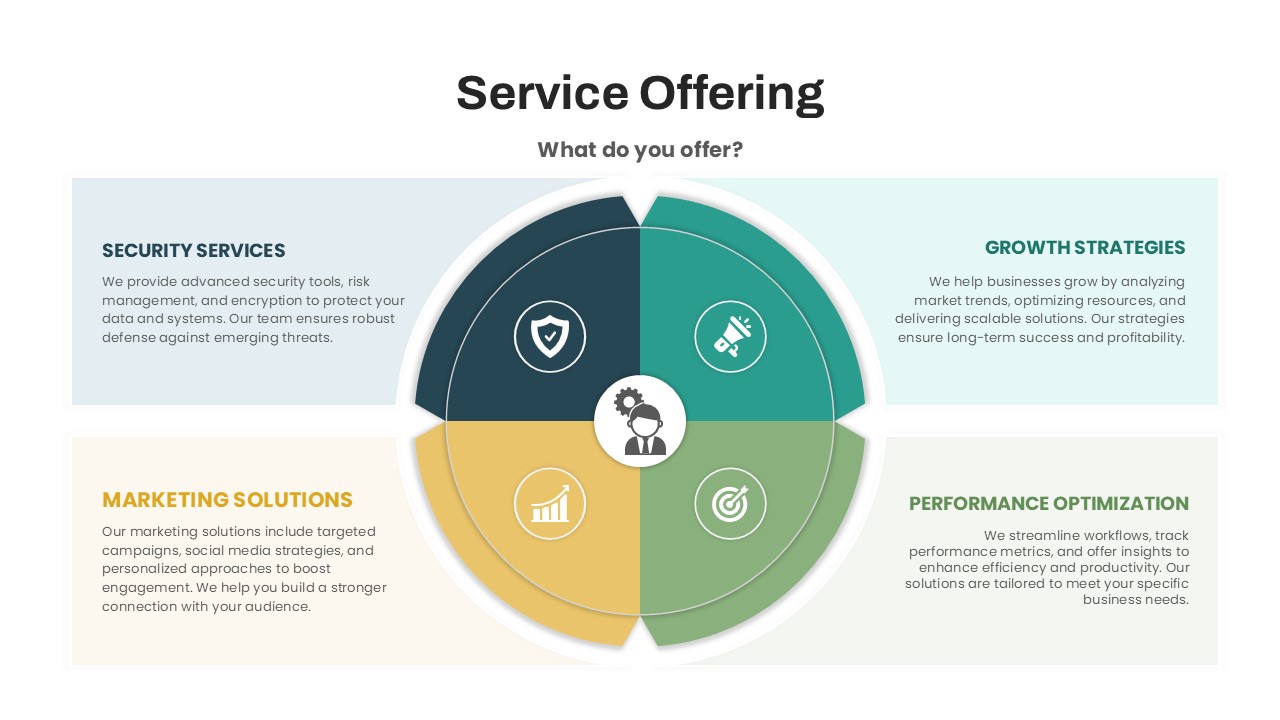
Circular Service Offering Diagram Template for PowerPoint & Google Slides
Circular
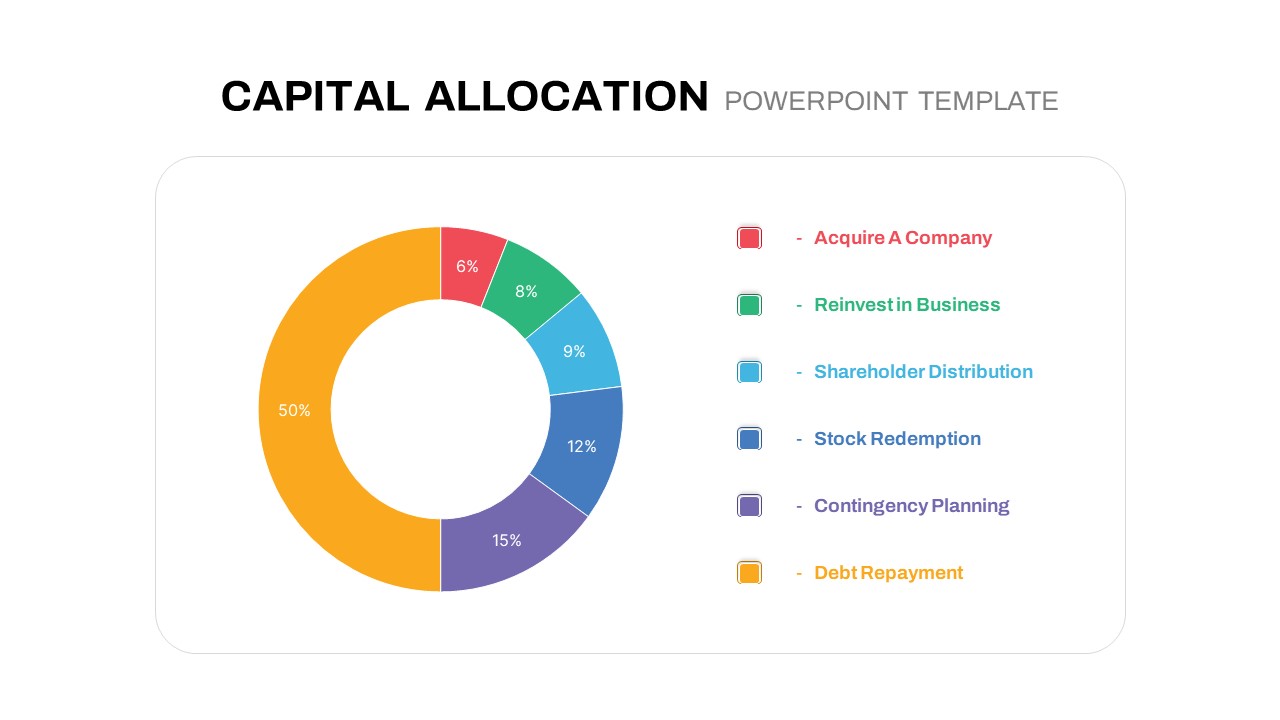
Circular Capital Allocation Diagram Template for PowerPoint & Google Slides
Business Models
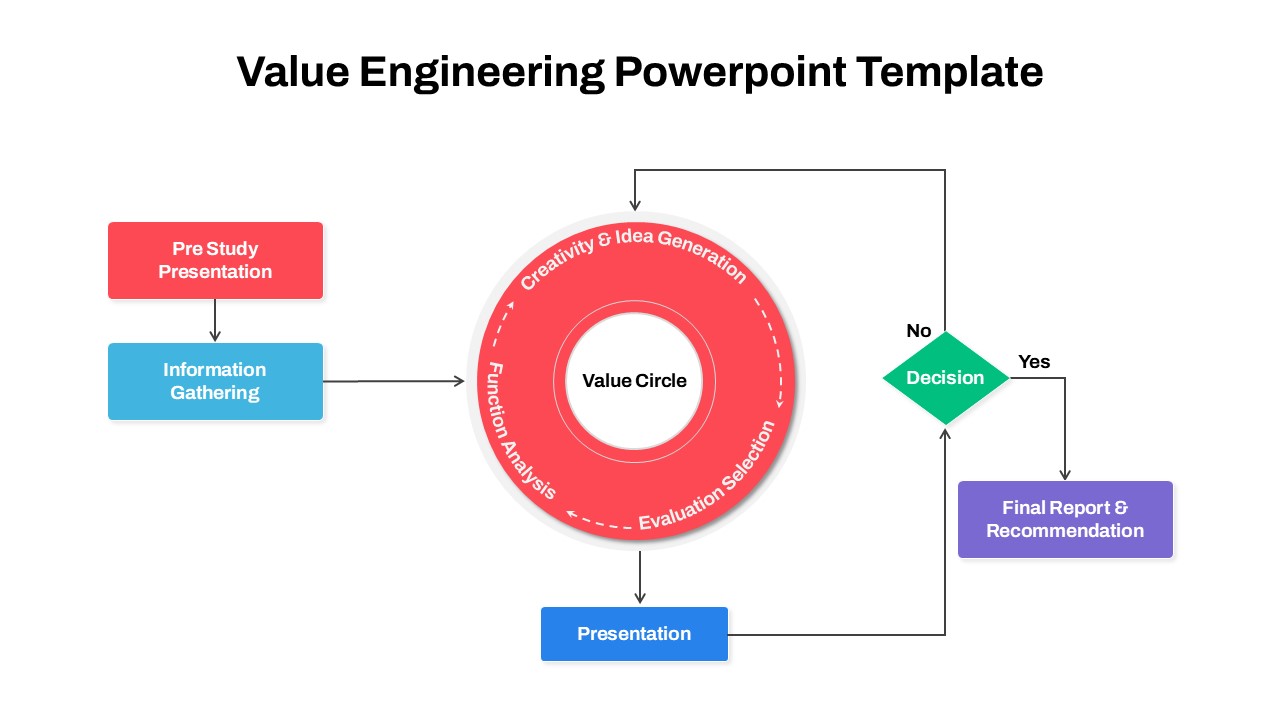
Circular Value Engineering Diagram Template for PowerPoint & Google Slides
Process
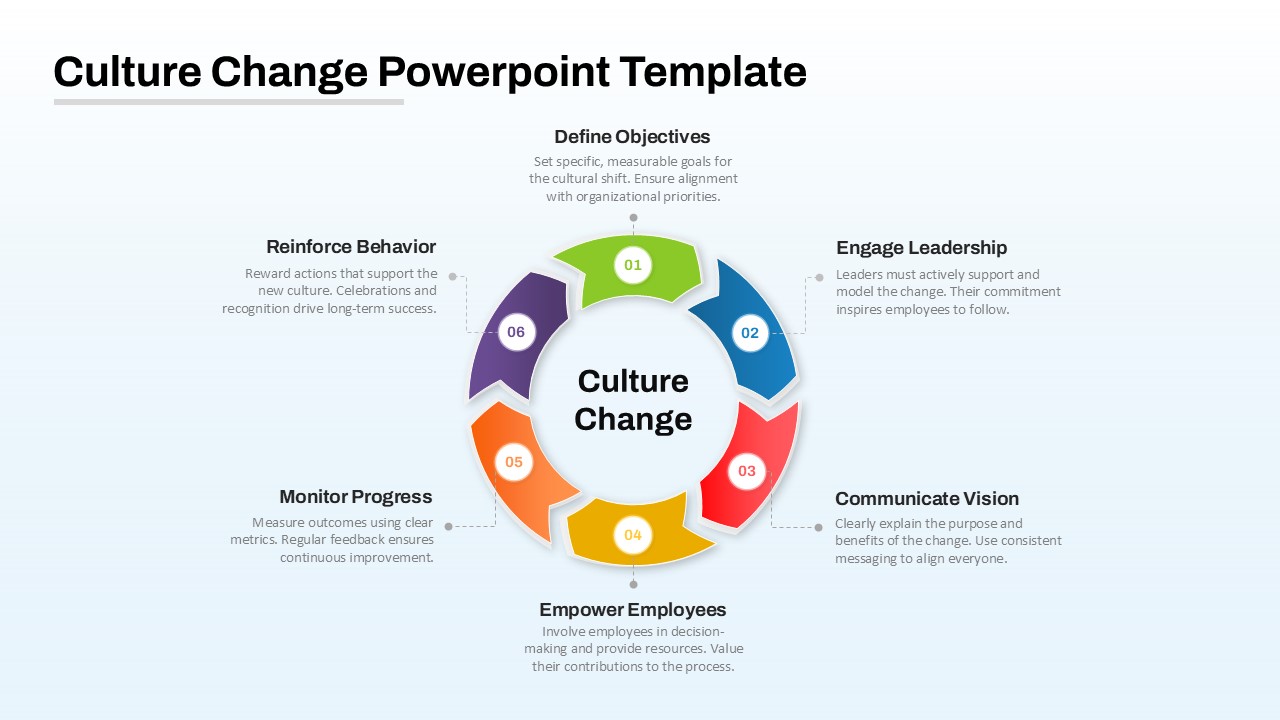
Culture Change Circular Process Diagram Template for PowerPoint & Google Slides
Process
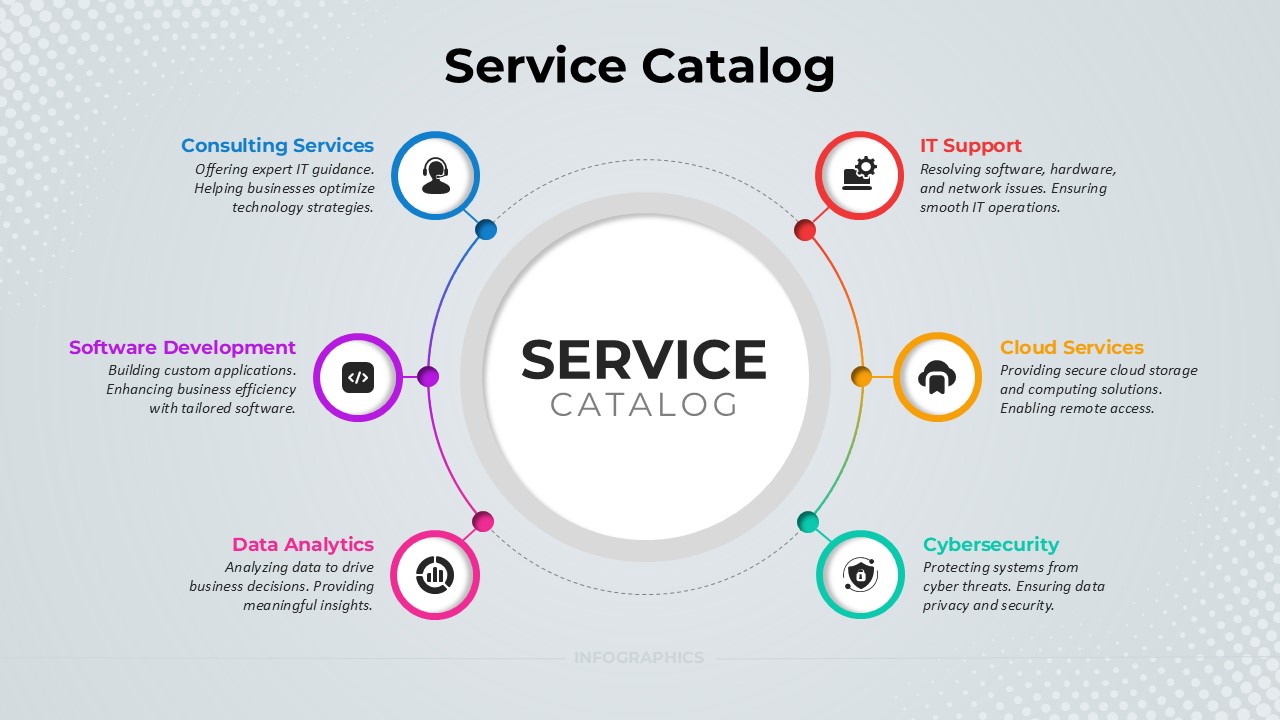
Service Catalog Circular Infographic Template for PowerPoint & Google Slides
Circular
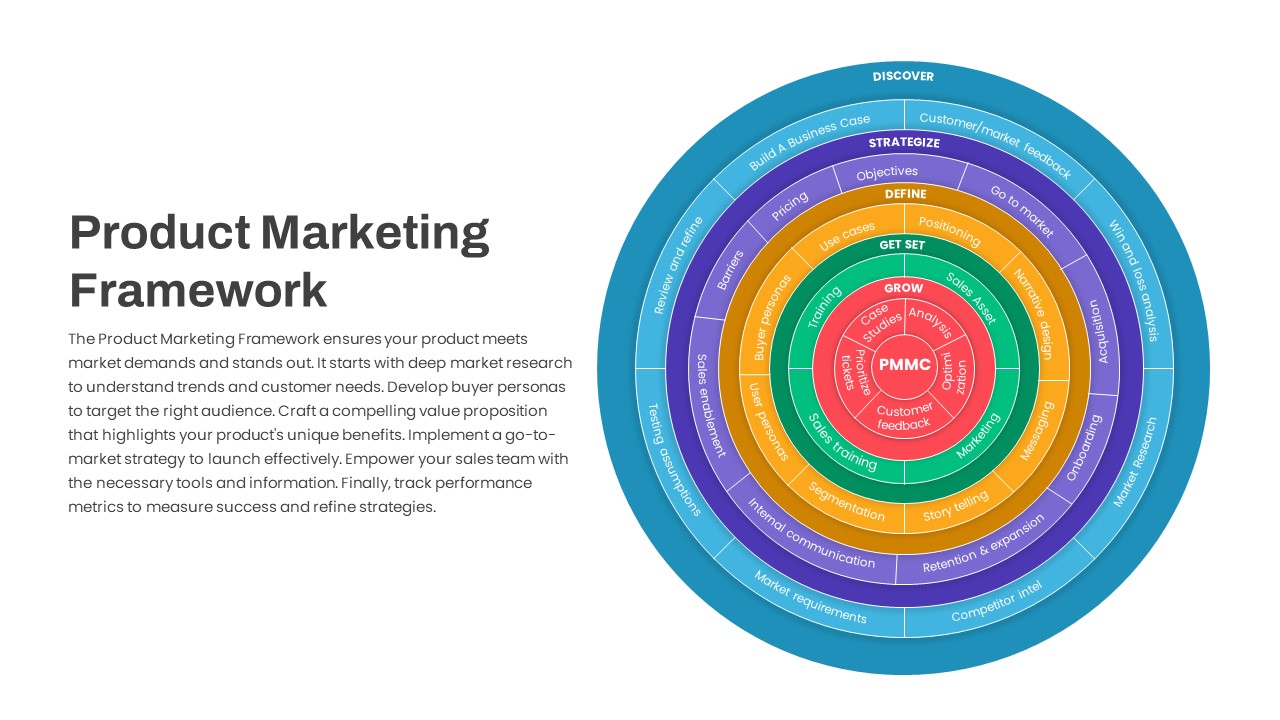
Product Marketing Framework Circular Template for PowerPoint & Google Slides
Circular
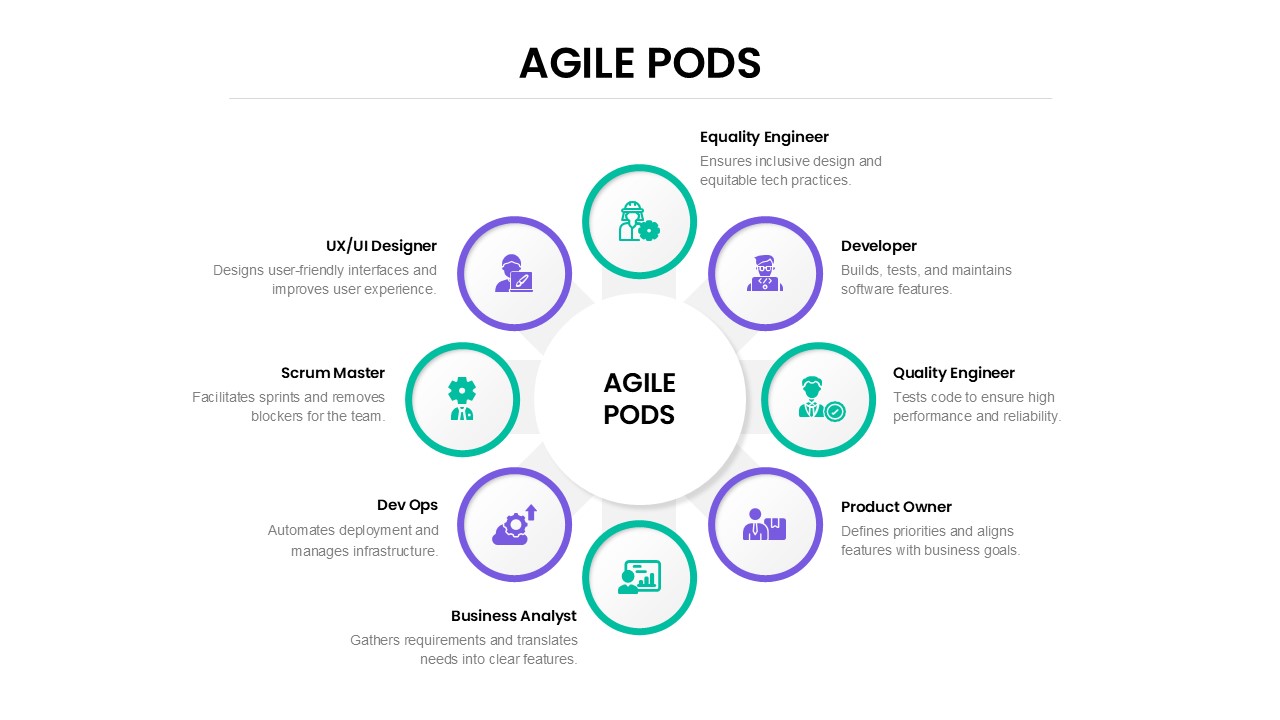
Agile Pods Team Roles Circular Diagram Template for PowerPoint & Google Slides
Circular
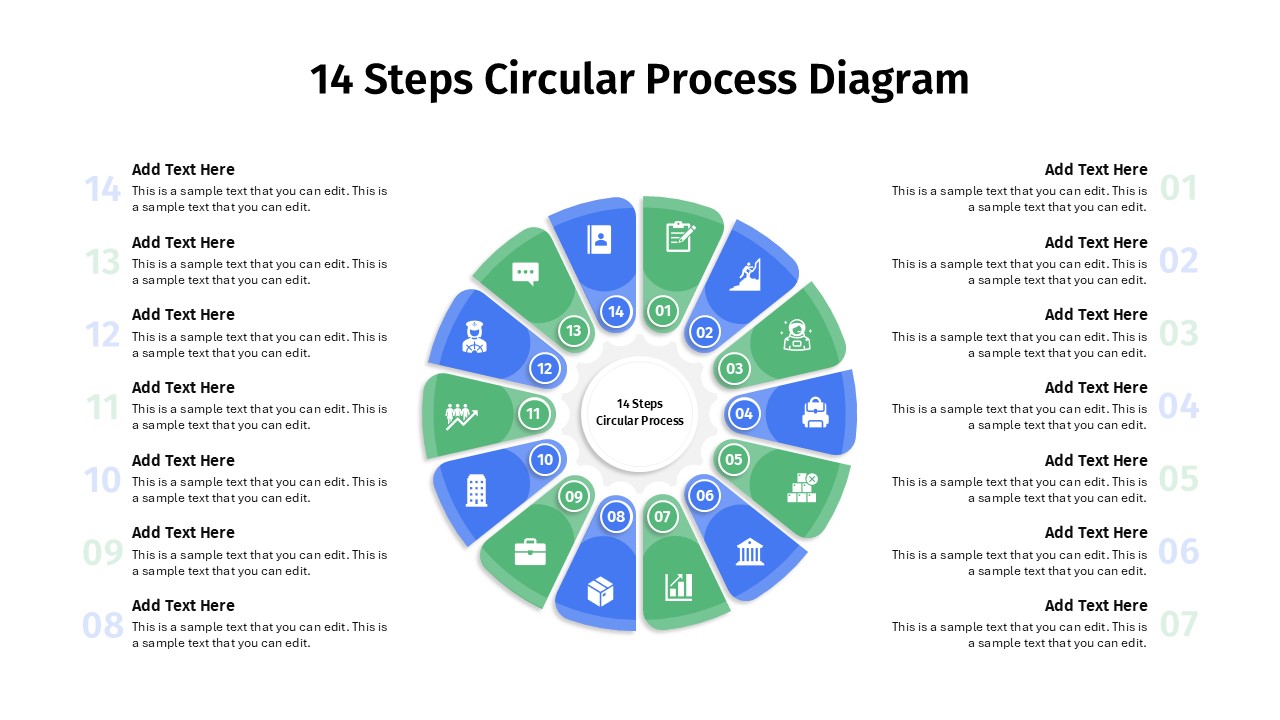
14 Steps Circular Process Diagram Template for PowerPoint & Google Slides
Circular
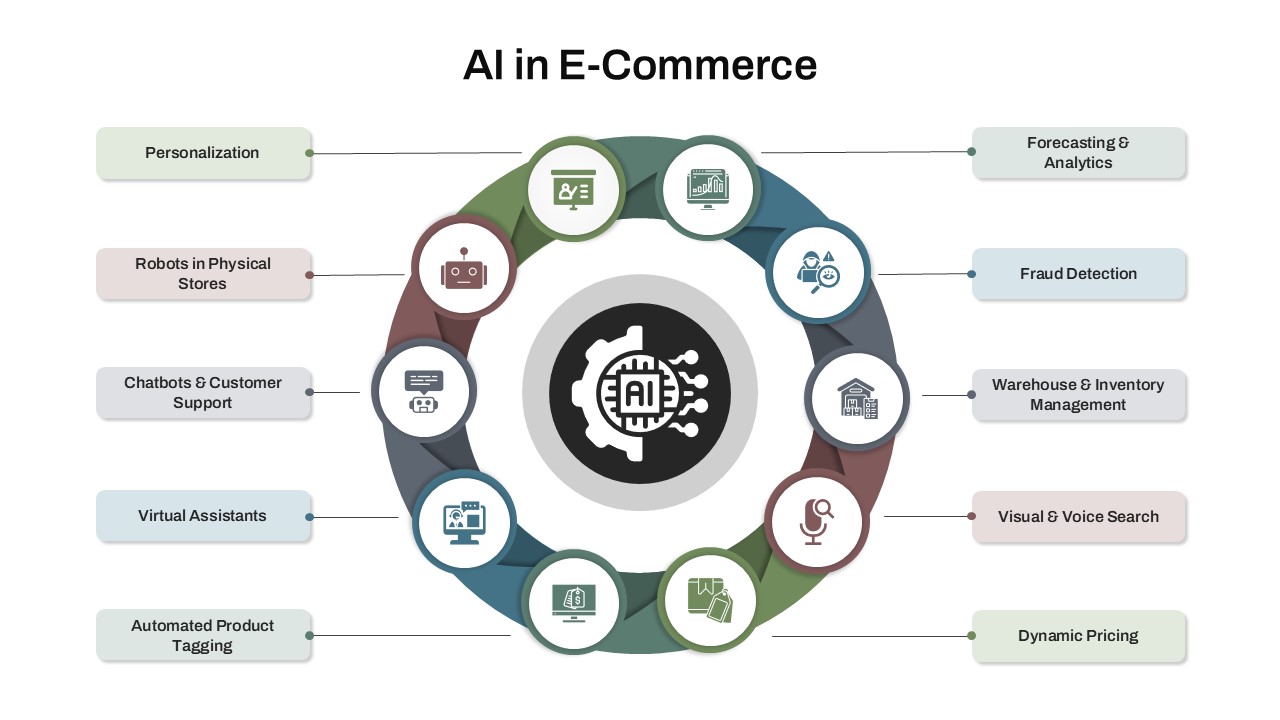
AI in E-Commerce Circular Infographic Template for PowerPoint & Google Slides
AI
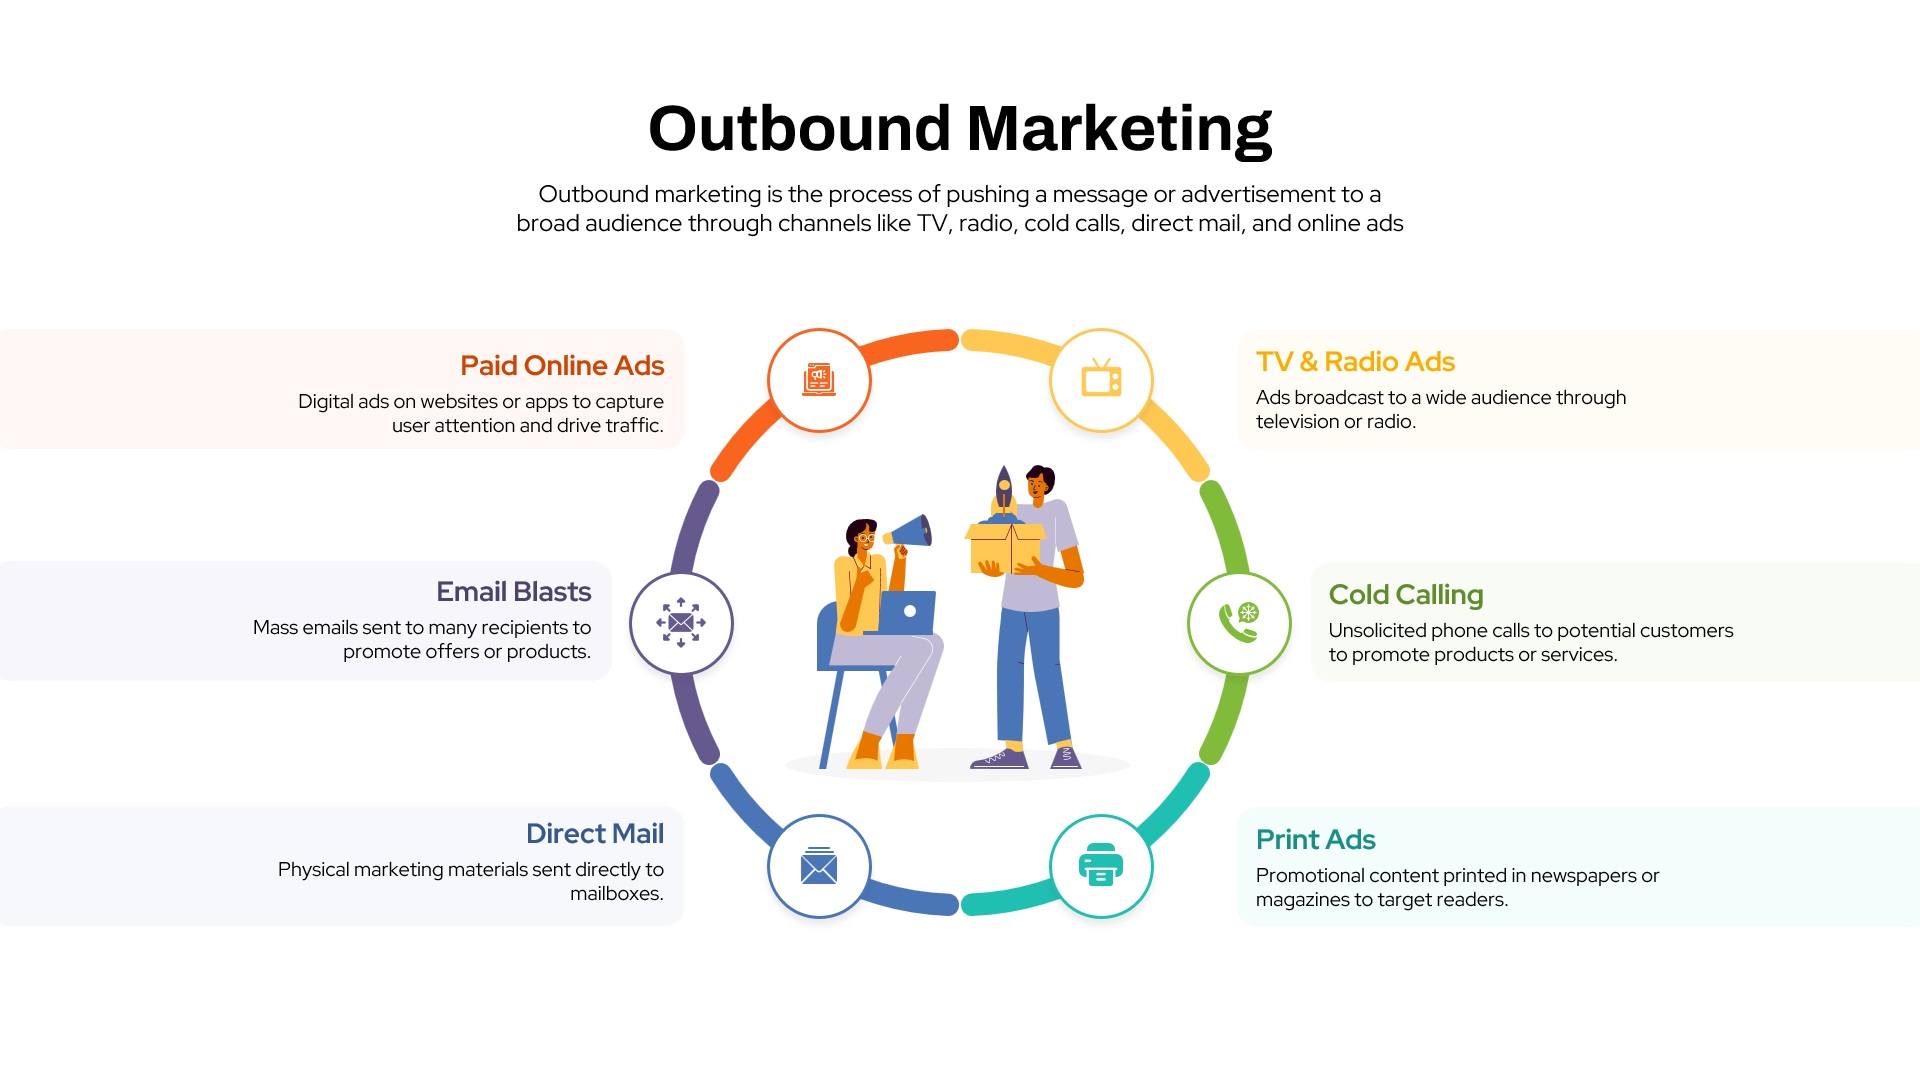
Outbound Marketing Circular Diagram Template for PowerPoint & Google Slides
Advertising
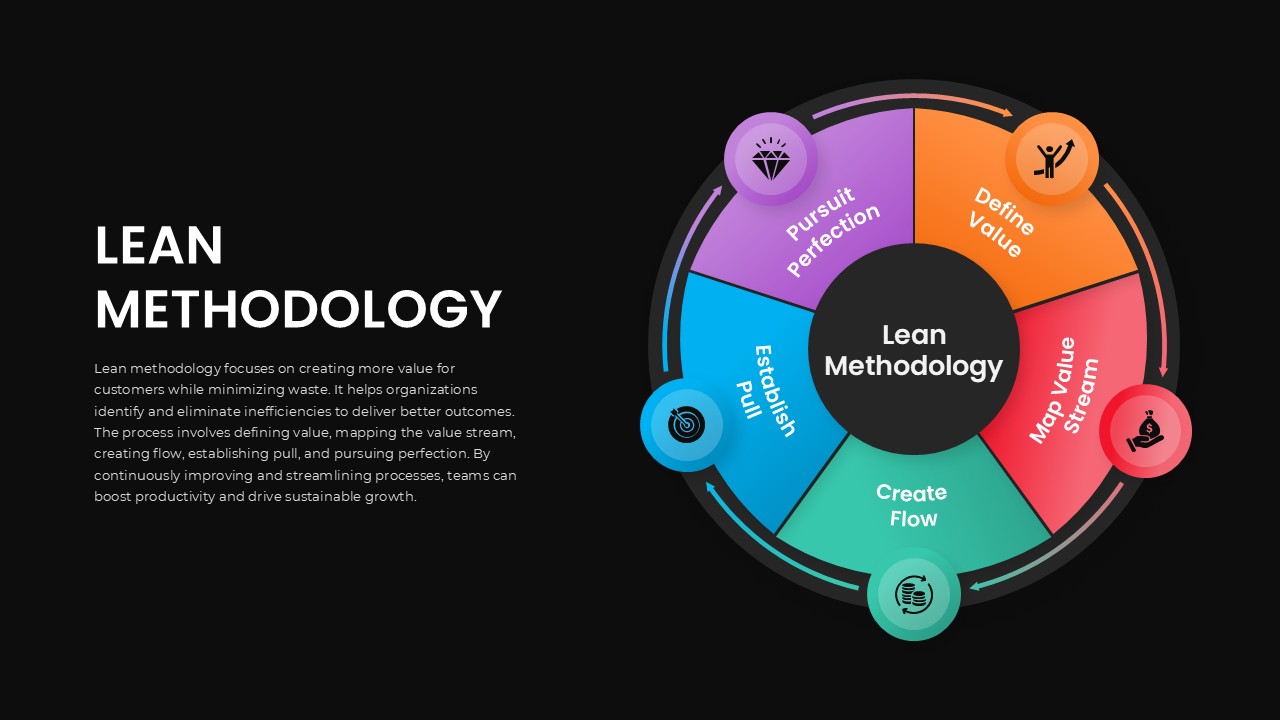
Lean Methodology Circular Process Template for PowerPoint & Google Slides
Process
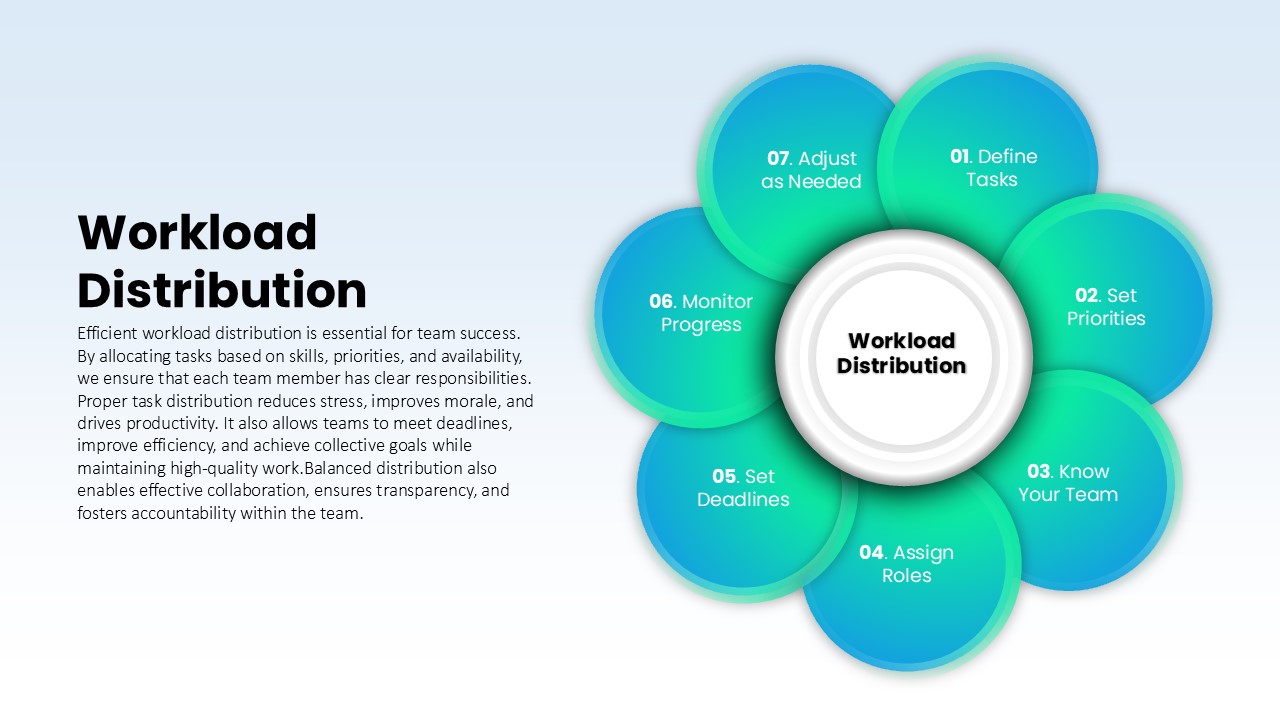
Workload Distribution Circular Diagram Template for PowerPoint & Google Slides
Circular
SWOT Analysis Infographic with Circular Icons Template for PowerPoint & Google Slides
SWOT
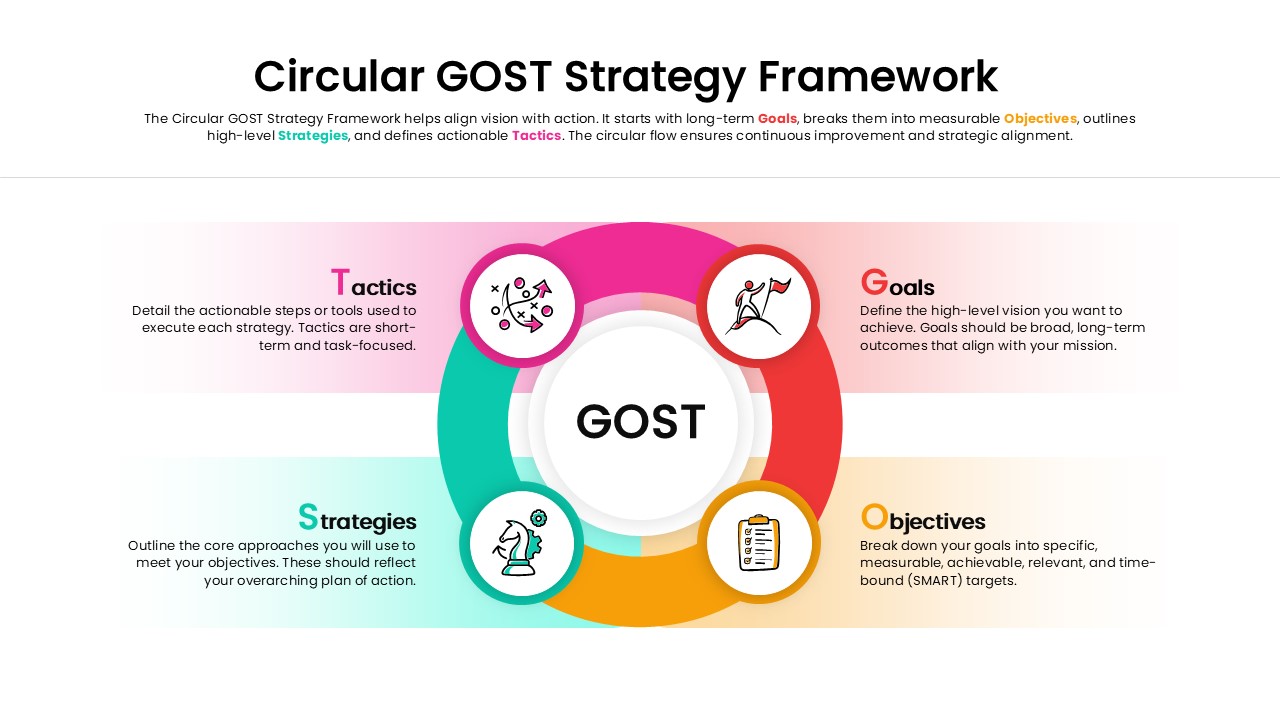
Circular GOST Strategy Framework Template for PowerPoint & Google Slides
Goals