Eight Section Circular Diagram Template for PowerPoint & Google Slides


Description
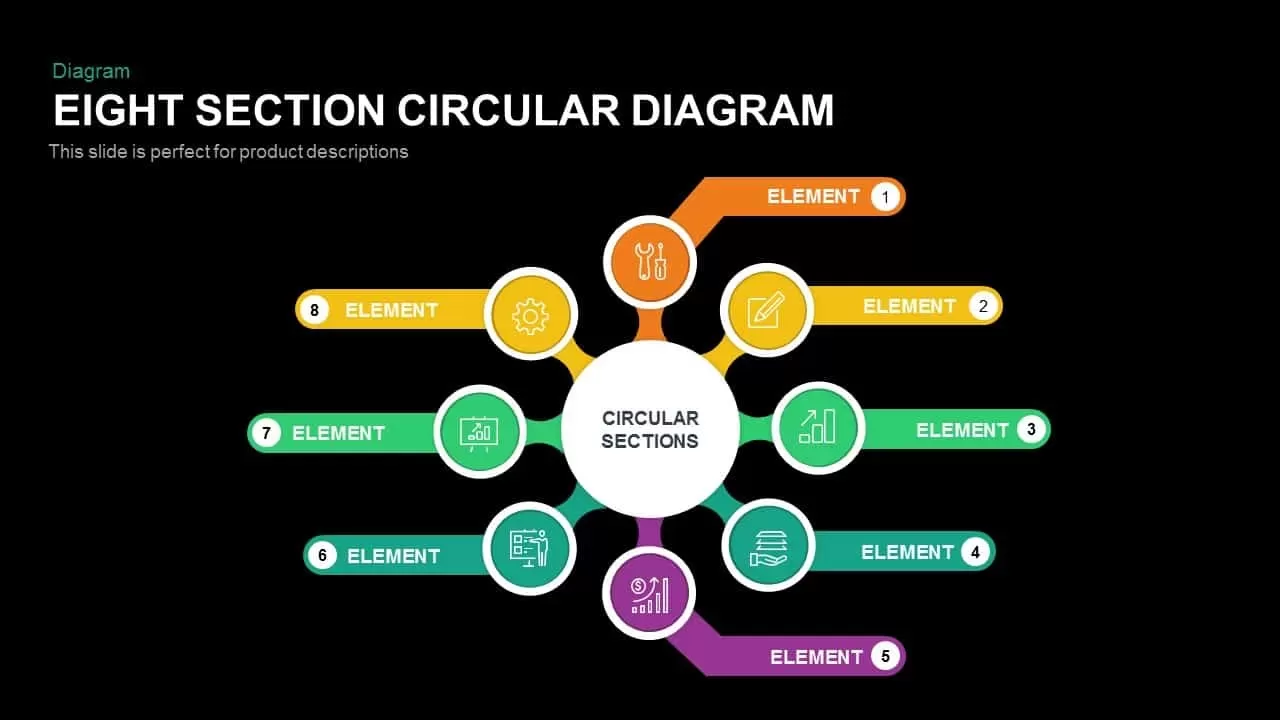
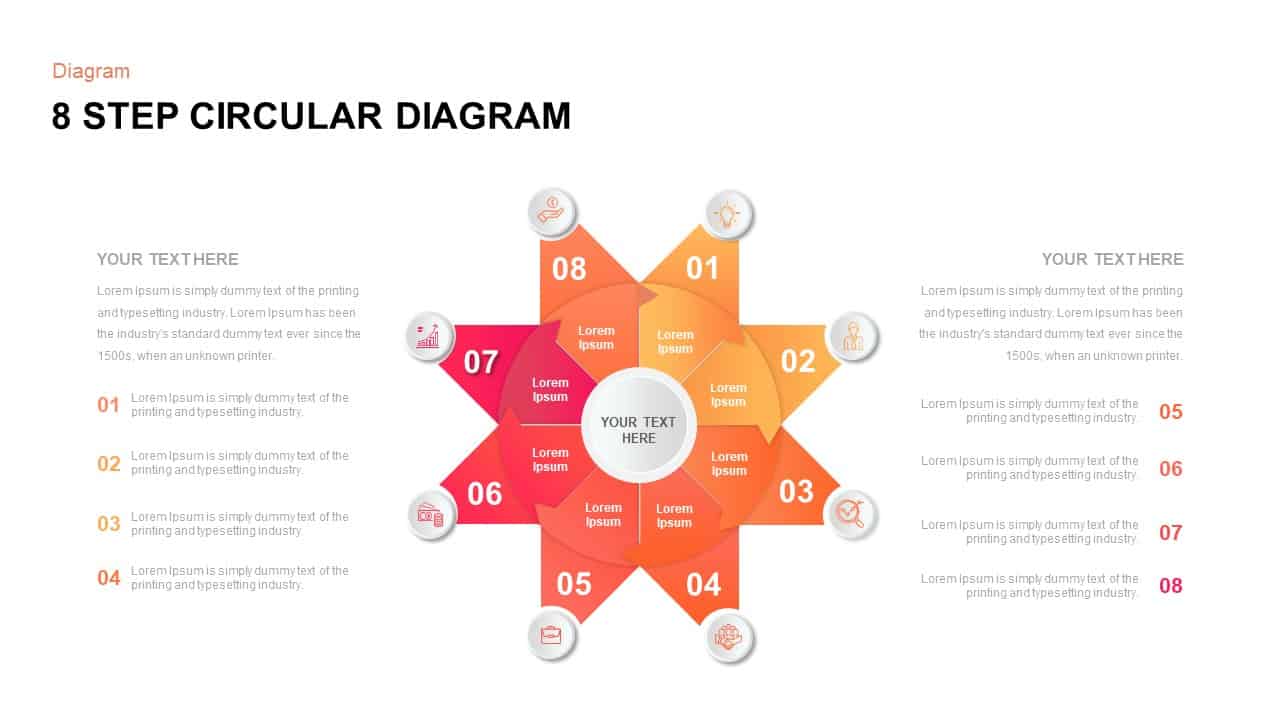
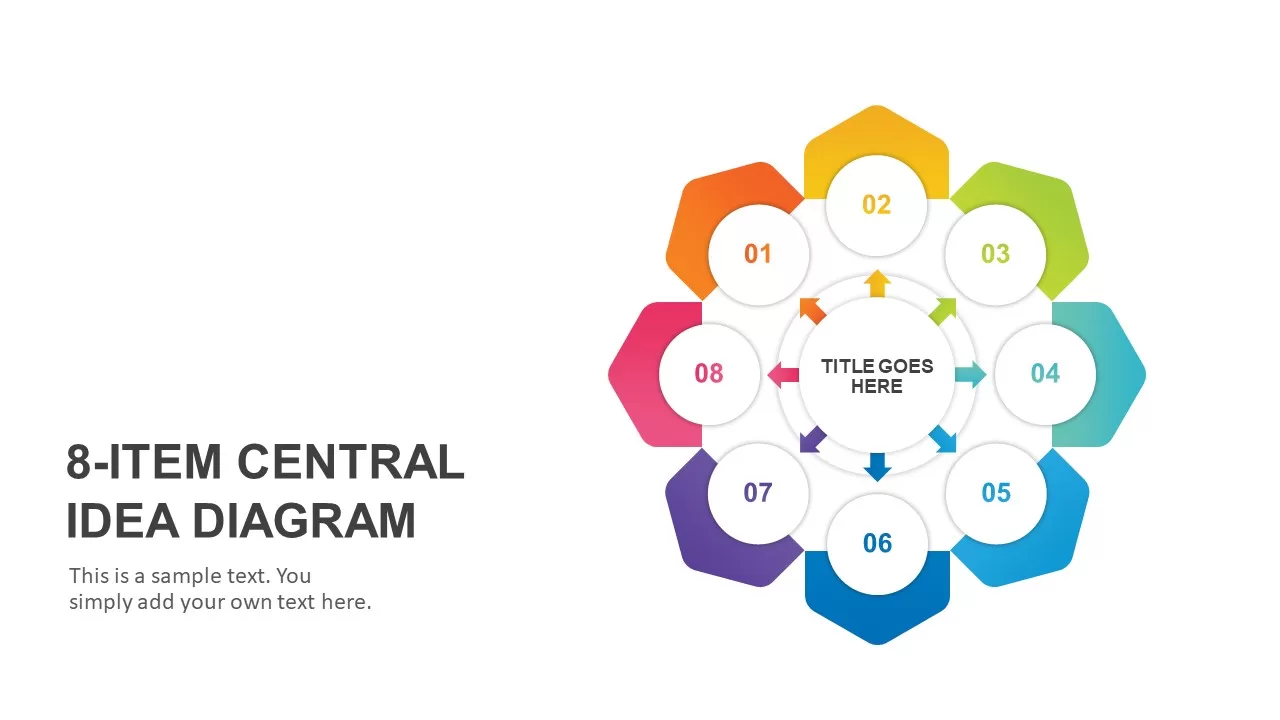
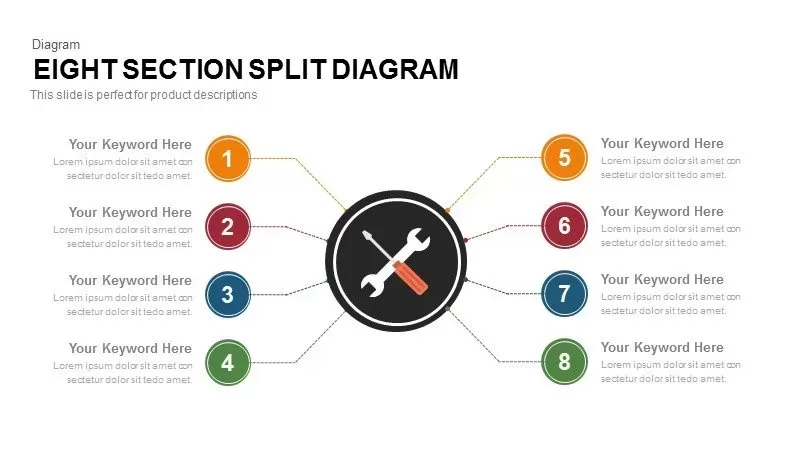
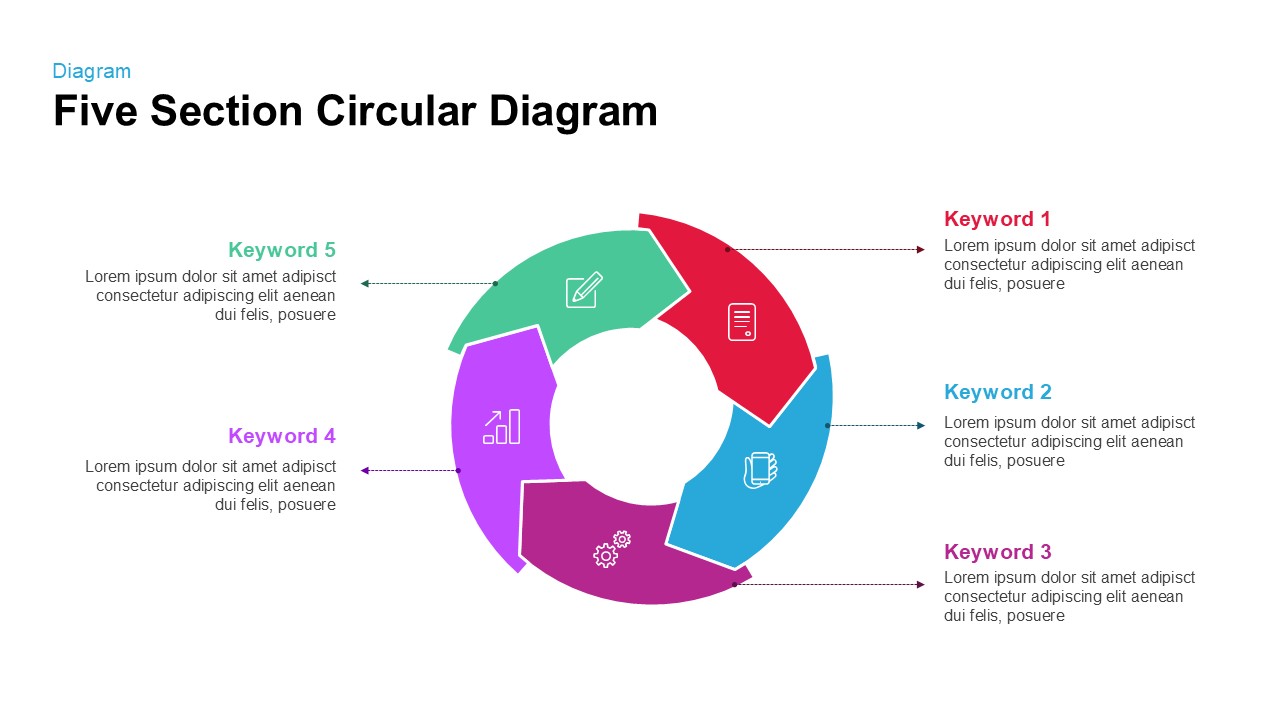
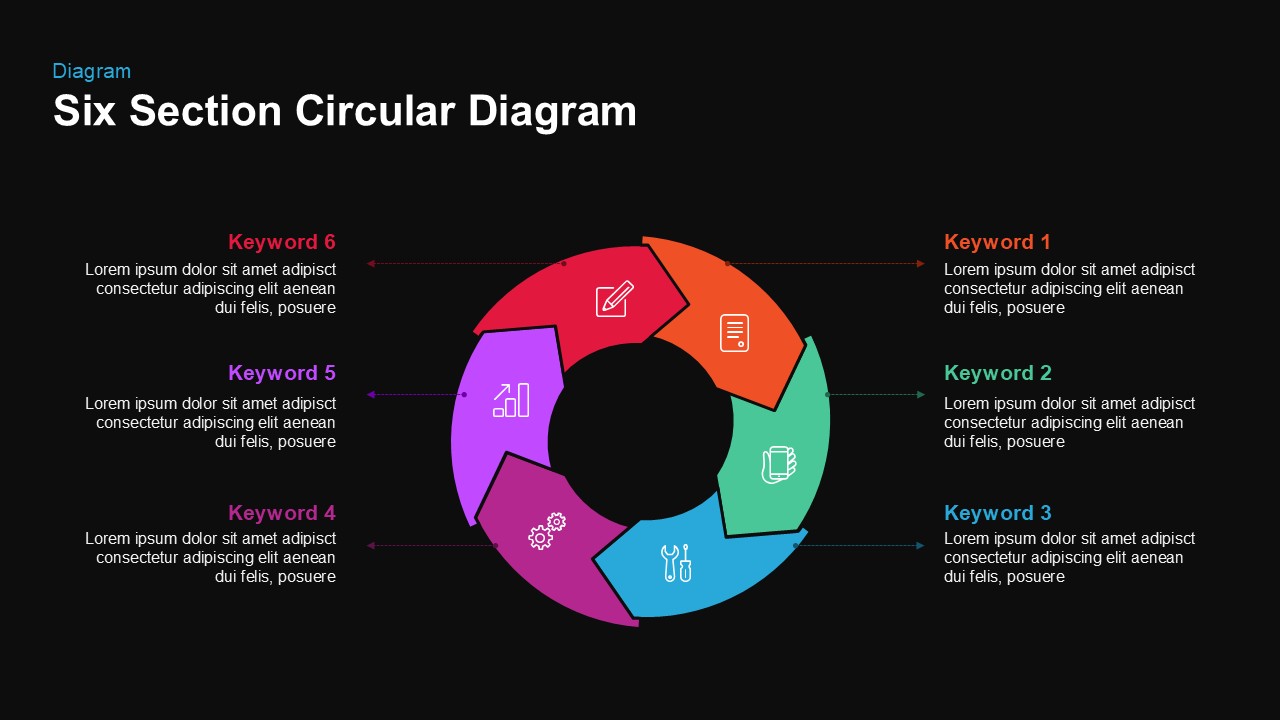
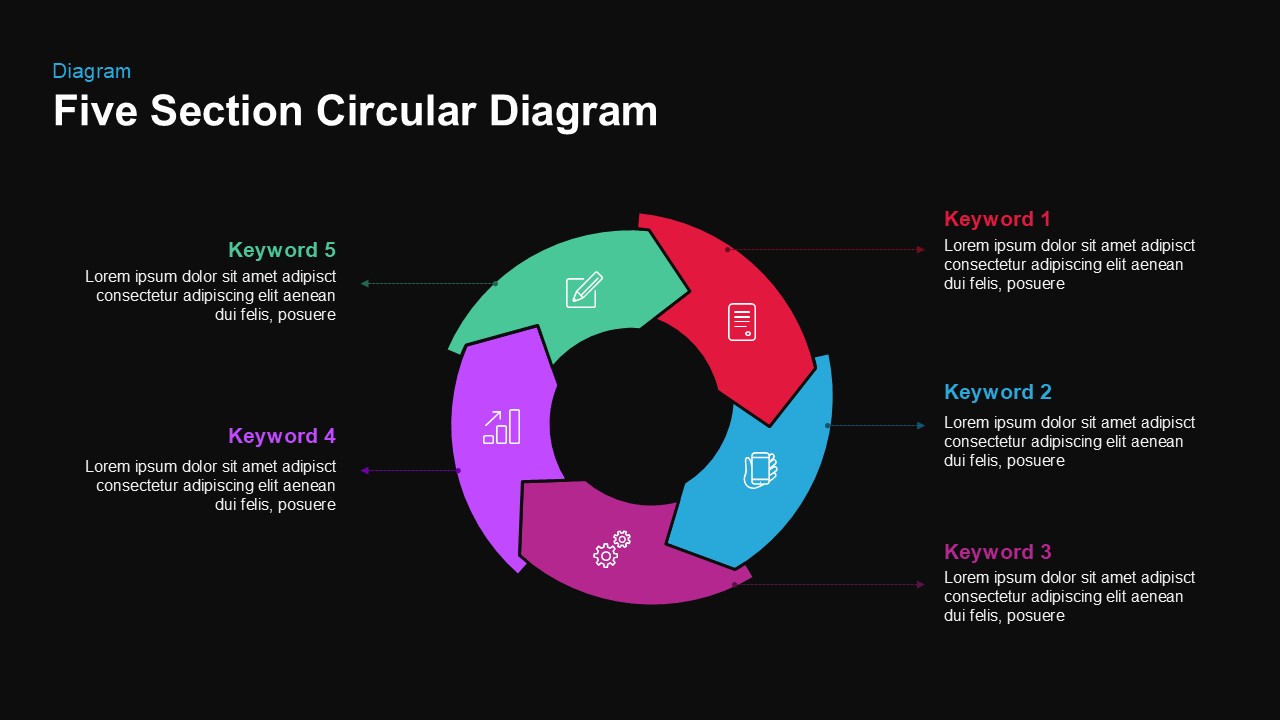
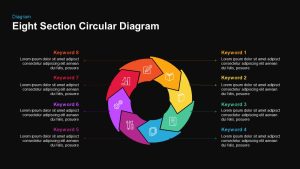
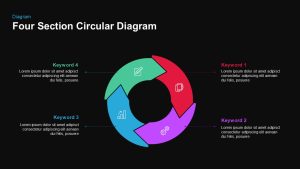
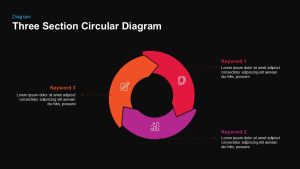
This slide features a dynamic eight-section circular diagram comprised of interconnected arrow segments arranged in a ring to visualize cyclical workflows or life cycles. Each segment is distinguished by a vibrant hue—ranging from warm oranges and yellows through cool greens and blues to rich purples and reds—and houses a minimalist white icon, emphasizing rotation and continuity. Dotted pointer lines link each arrow to an external text placeholder labeled “Keyword 1” through “Keyword 8,” providing ample space for short titles and descriptive copy. The clean flat design, consistent use of rounded edges, and generous white space ensure legibility and a modern aesthetic that adapts seamlessly to diverse brand palettes.
Powered by fully editable vector shapes and icons, this template offers intuitive placeholder fields for headlines and body text. Users can effortlessly change segment colors, swap iconography, adjust arrow widths, or reorganize segment order without compromising graphic fidelity. Master slides and customizable layers facilitate quick theme updates and maintain design consistency across multiple decks. Optimized for both PowerPoint and Google Slides, the slide preserves layout integrity across devices, eliminating formatting conflicts and manual resizing.
Additional editing options allow control over pointer line styles, arrow curvature, and segment spacing to suit presentation narratives. Instantly adjust dashed connector colors, line weights, or switch to solid arrows with a single click. Seamless integration with slide transitions means each section can animate in sequence to guide audience focus. The slide also supports custom icon uploads and text formatting choices, enabling unique visual storytelling that aligns with corporate branding, educational objectives, or strategic roadmaps.
Who is it for
Designed for project managers, process engineers, business analysts, and marketing strategists who need to break down complex workflows into sequential steps. Trainers, consultants, and educators can also leverage the circular layout to structure tutorials, program curricula, or iterative review sessions with optimal clarity.
Other Uses
Beyond process mapping, repurpose this circular diagram to visualize lifecycle stages, customer journey touchpoints, quality control cycles, or compliance checklists. Use the eight-segment ring to track product roadmaps, annual planning cycles, performance review stages, or any multi-phase initiative requiring clear, step-by-step presentation.
Login to download this file

Item ID
SB00251
Related Templates

Eight Section Circular Diagram Template for PowerPoint & Google Slides
Circular
Eight-Section Circular Diagram template for PowerPoint & Google Slides
Circular
Eight Section Lab Infographic with Icons Template for PowerPoint & Google Slides
Circular

Eight Section Donut Chart Infographic Template for PowerPoint & Google Slides
Pie/Donut
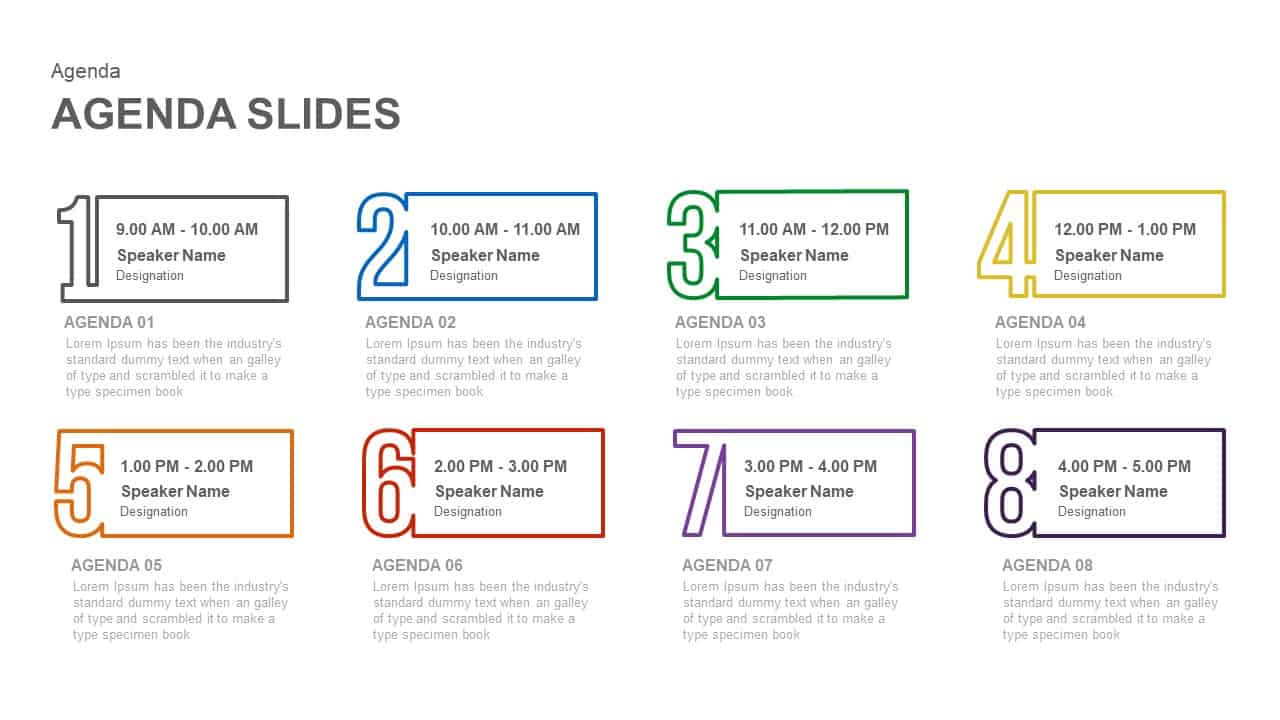
Eight Section Agenda Slide Layout Template for PowerPoint & Google Slides
Agenda
Eight-Step Circular Diagram Infographic Template for PowerPoint & Google Slides
Circular
Eight Step Circular Diagram Template for PowerPoint & Google Slides
Circular
Eight-Stage Circular Process Infographic Template for PowerPoint & Google Slides
Circular
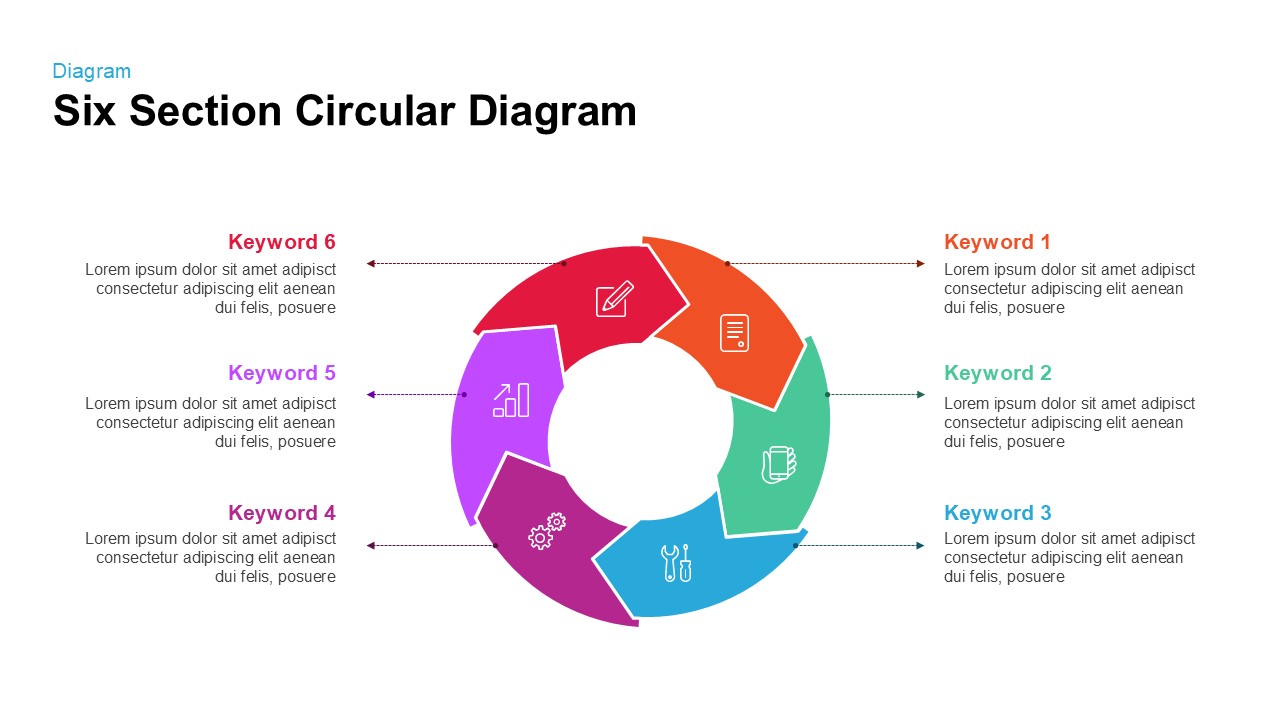
Six Section Circular Infographic Diagram Template for PowerPoint & Google Slides
Circular
Five-Section Circular Arrow Diagram Template for PowerPoint & Google Slides
Circular
Four Section Circular Text Boxes Diagram Template for PowerPoint & Google Slides
Circular
Free Eight Circle Creative Diagram template for PowerPoint & Google Slides
Circular
Free
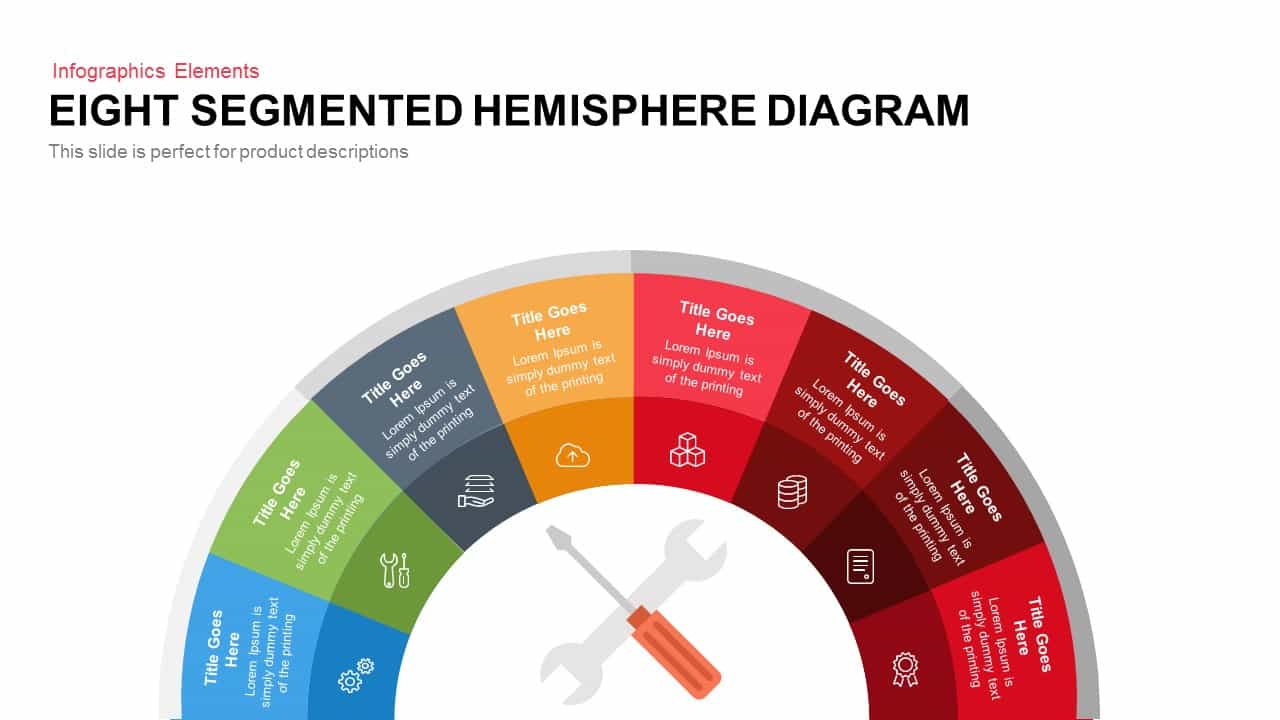
Eight Segmented Hemisphere Diagram Template for PowerPoint & Google Slides
Process

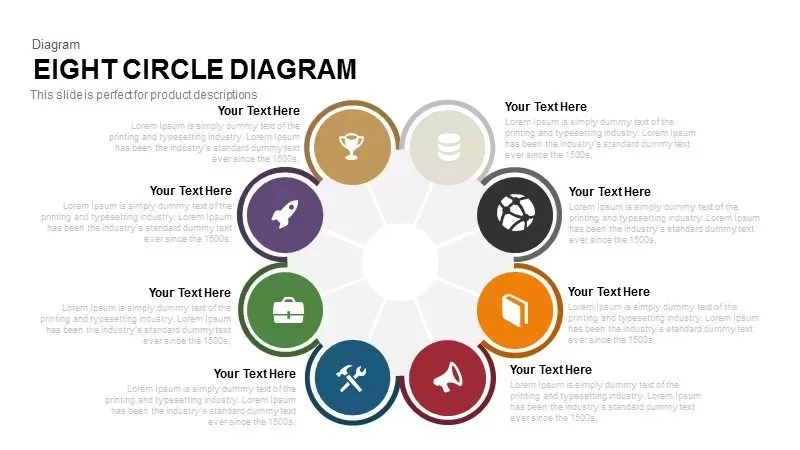
Eight Circle Diagram Template for PowerPoint & Google Slides
Circular
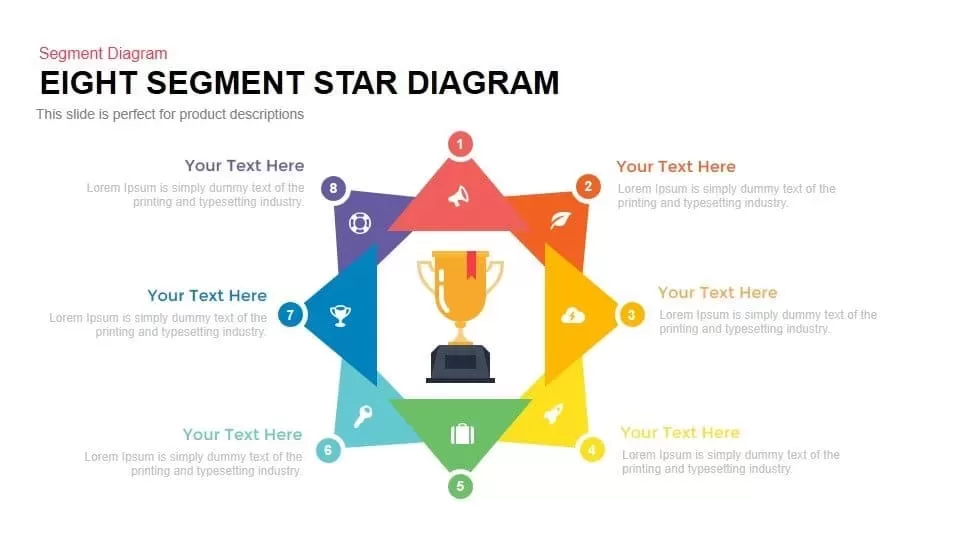
Eight Segment Star Diagram Infographic Template for PowerPoint & Google Slides
Process
Eight-Step Hub and Spoke Diagram Template for PowerPoint & Google Slides
Process
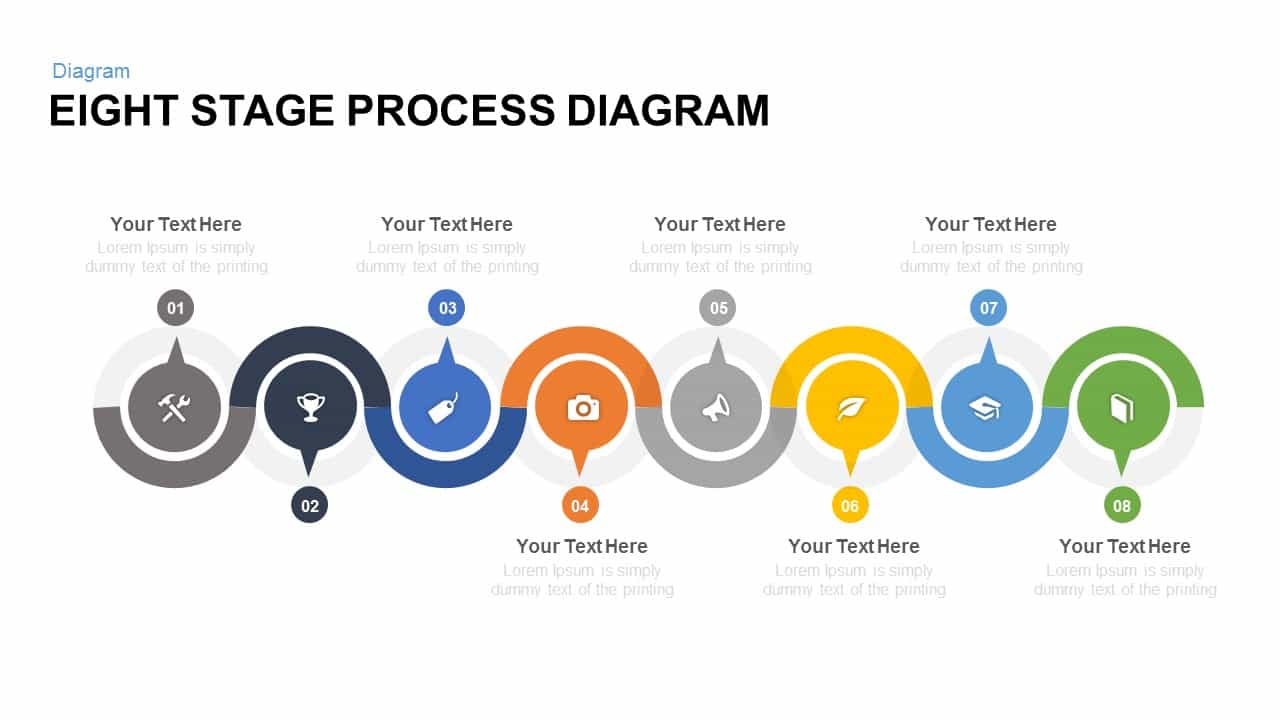
Eight Stage Process Diagram template for PowerPoint & Google Slides
Process

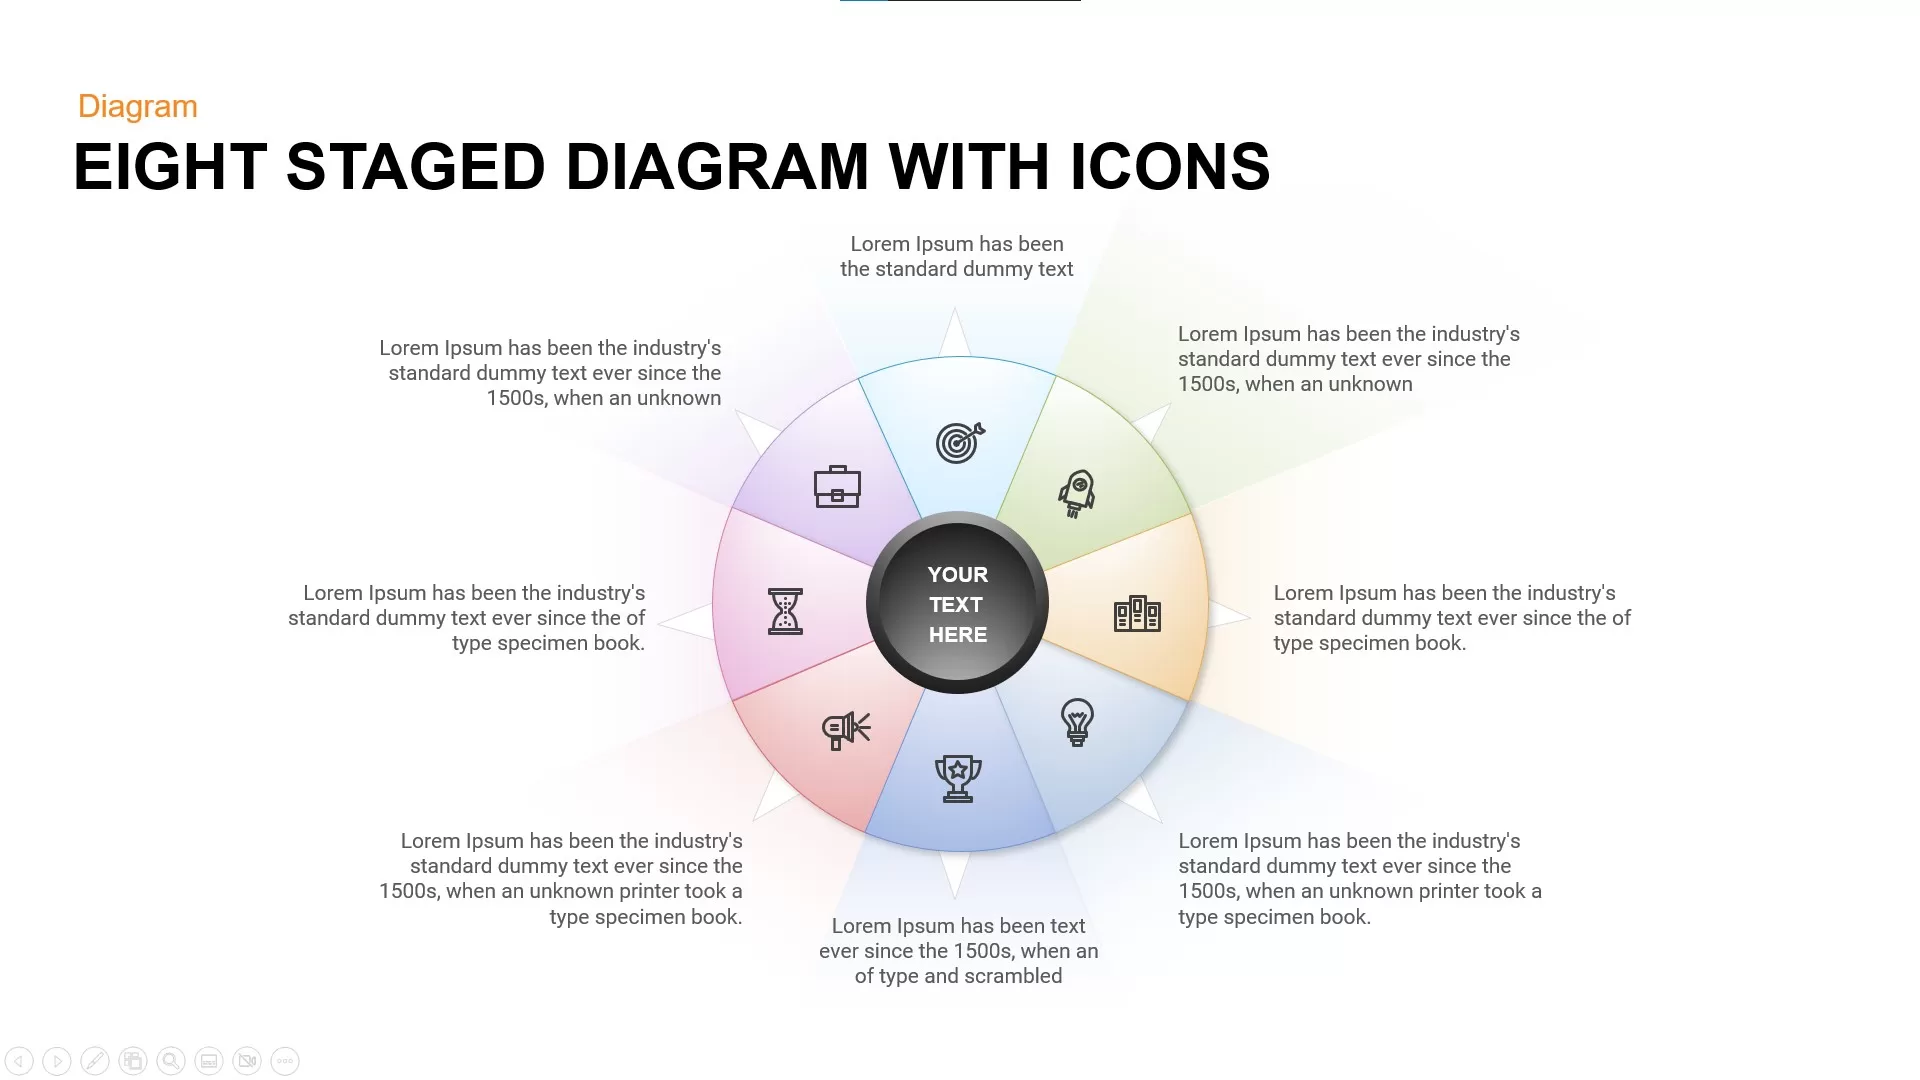
Eight Staged Diagram with Icons template for PowerPoint & Google Slides
Process
Free
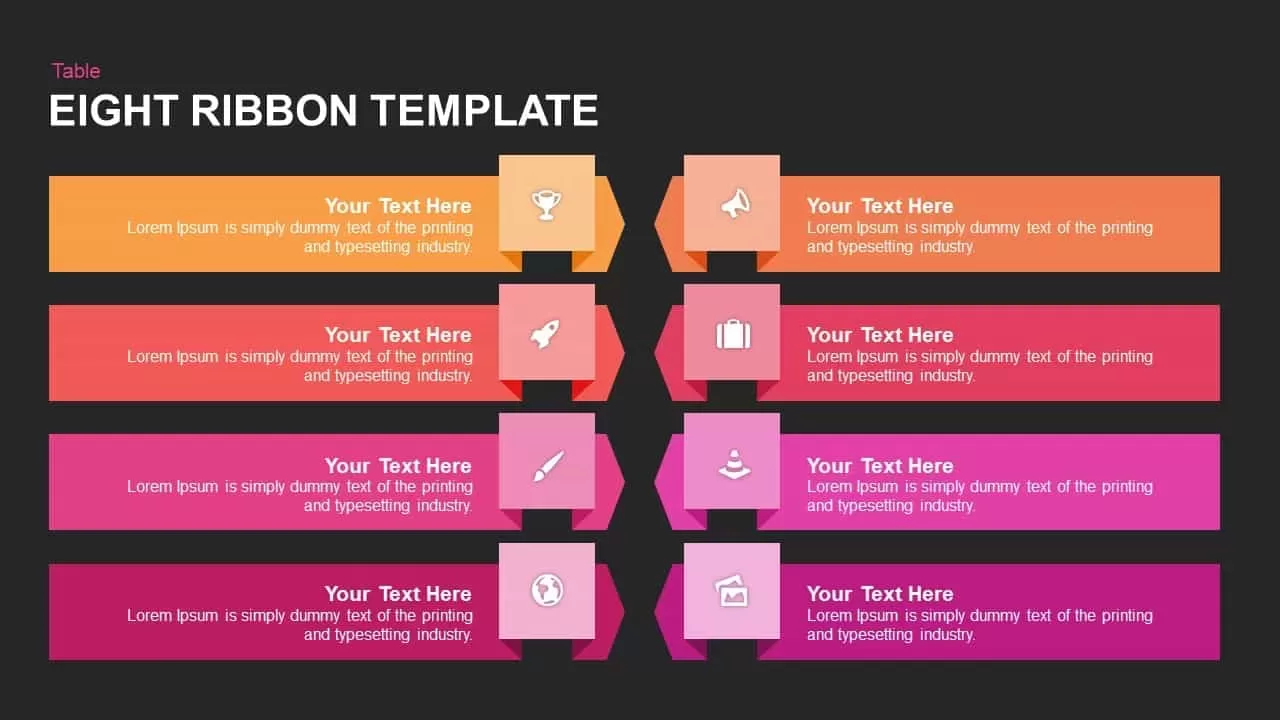
Multi-Color Eight-Step Ribbon Diagram Template for PowerPoint & Google Slides
Process

Eight-Stage Zigzag Arrow Diagram Template for PowerPoint & Google Slides
Process

Eight-Stage Radial Process Flow Diagram Template for PowerPoint & Google Slides
Process
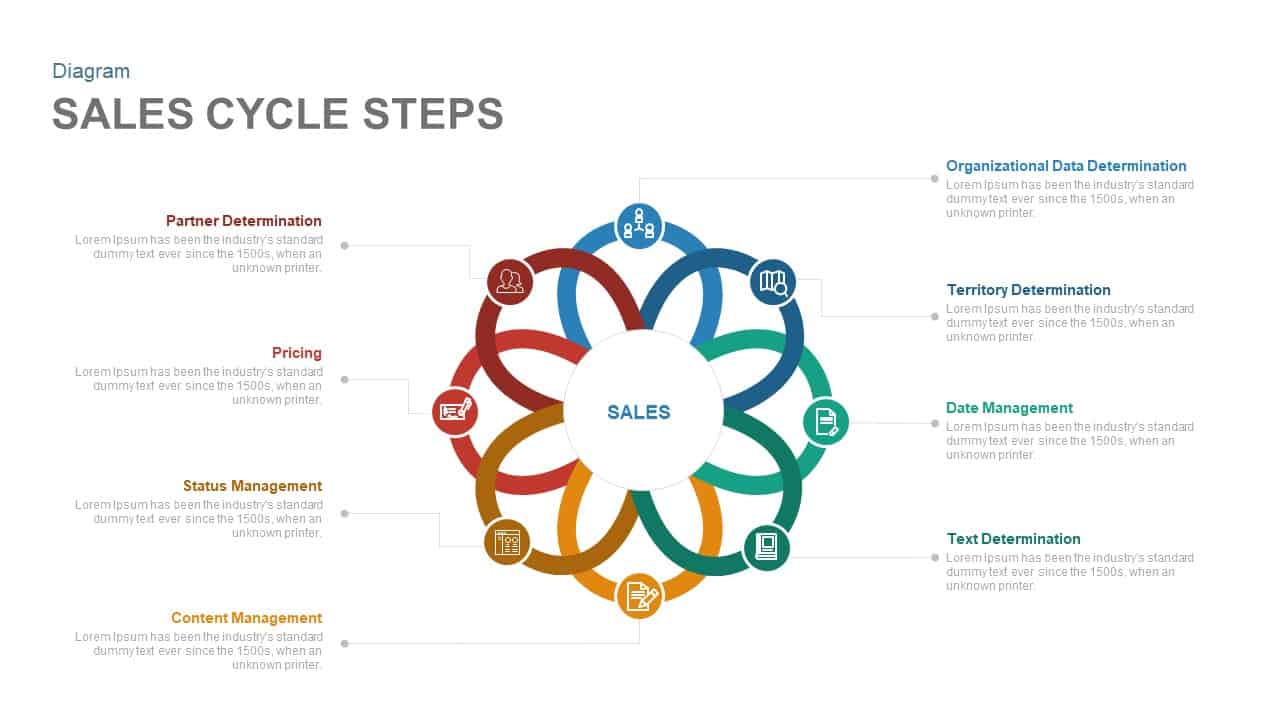
Eight-Step Sales Cycle Diagram Template for PowerPoint & Google Slides
Process
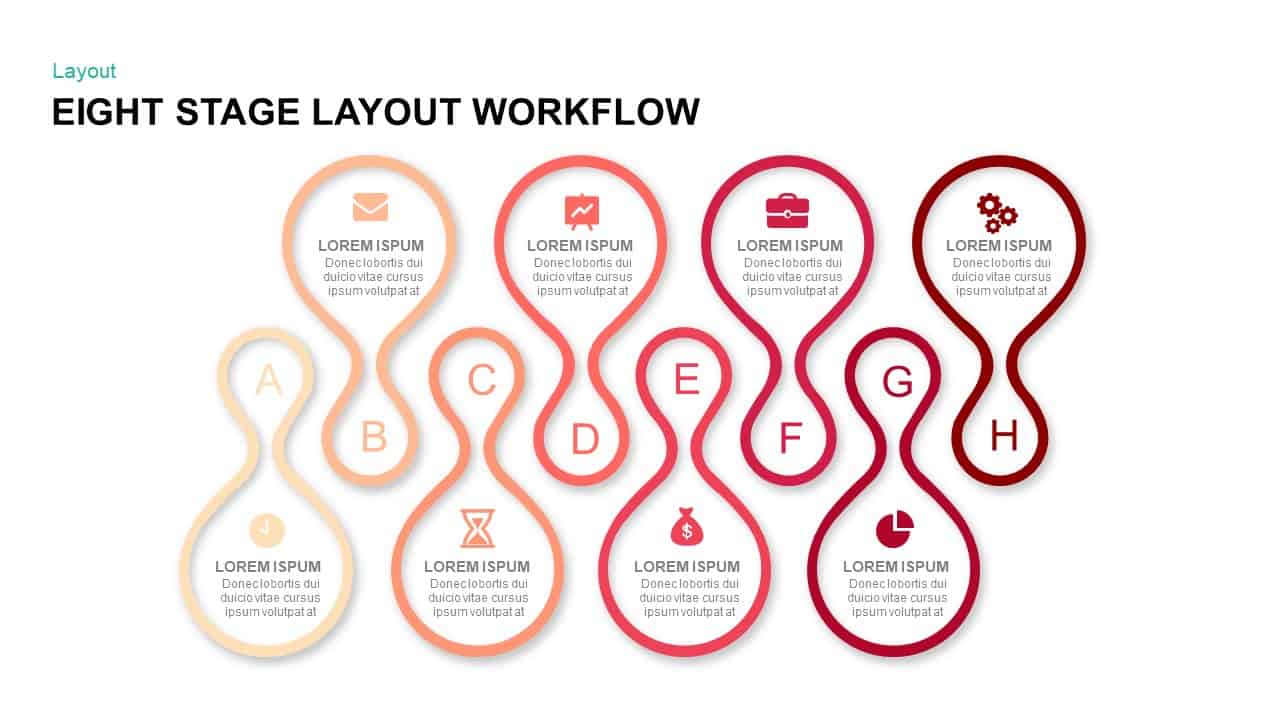
Eight Stage Hourglass Workflow Diagram Template for PowerPoint & Google Slides
Process
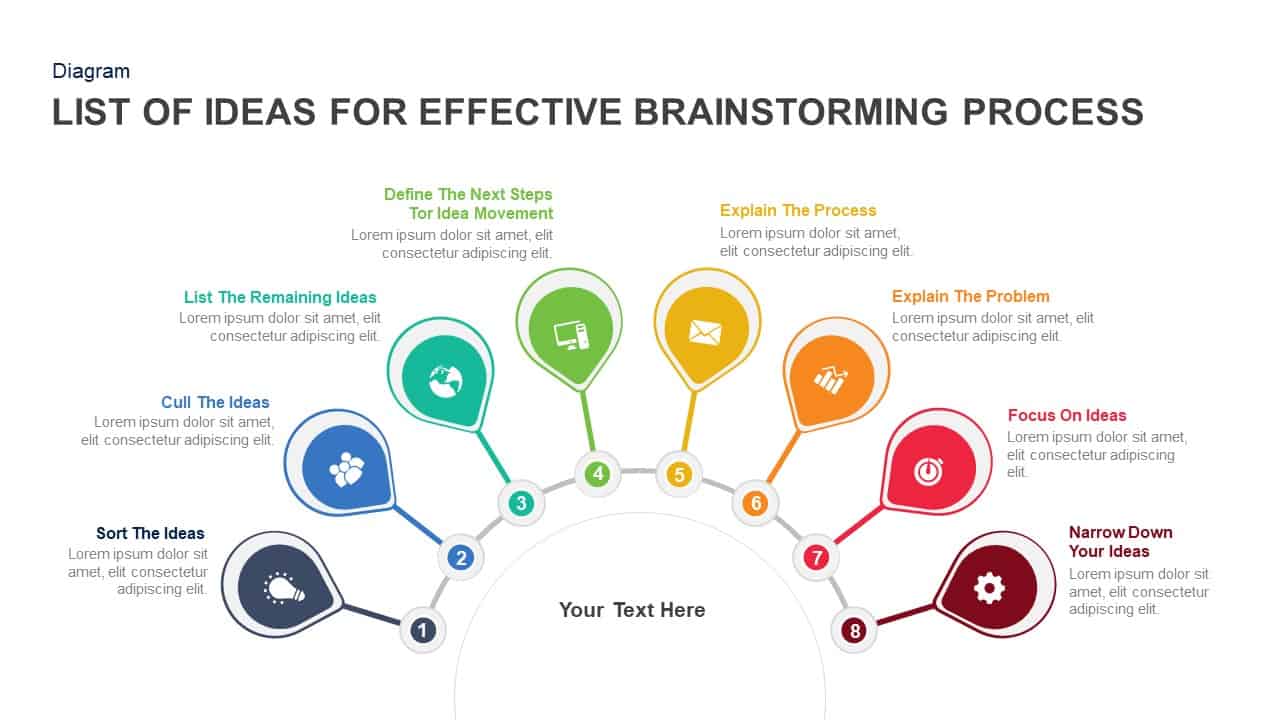
Eight-Step Brainstorming Process Diagram Template for PowerPoint & Google Slides
Process
Eight-Step Inward Arrow Diagram Template for PowerPoint & Google Slides
Arrow
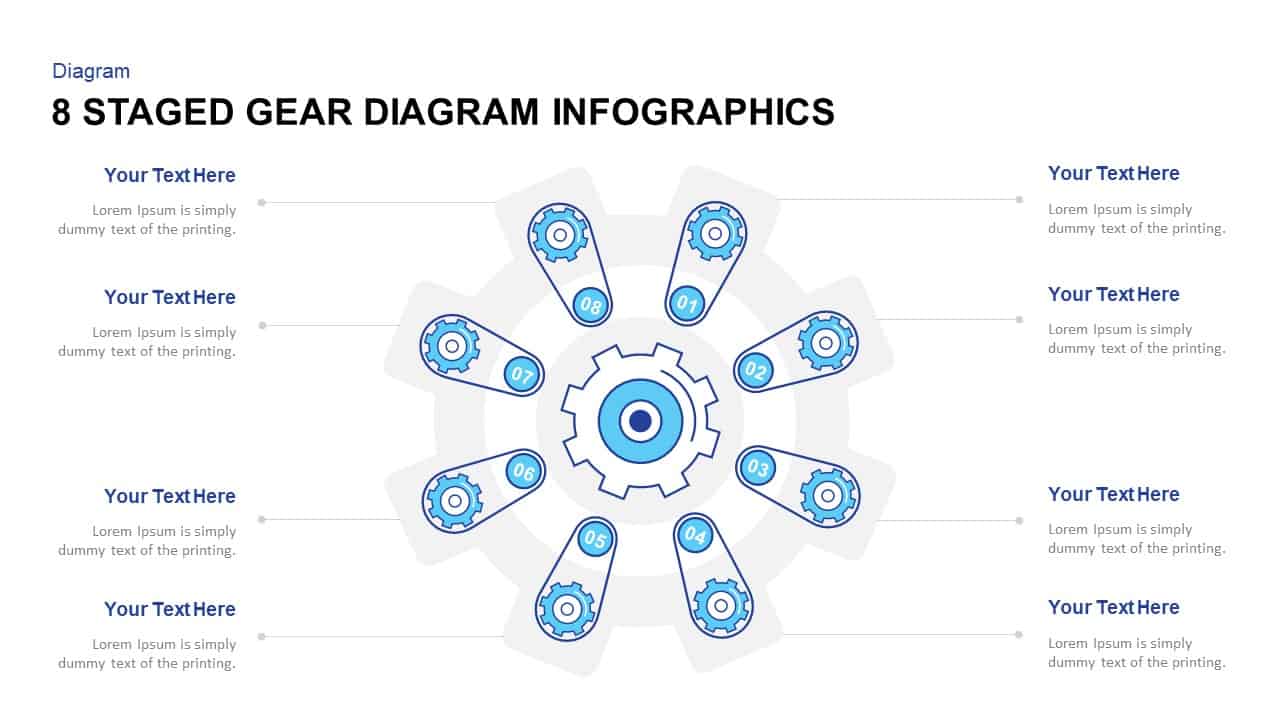
Eight-Stage Gear Diagram Process Template for PowerPoint & Google Slides
Process

Eight-Node Mind Map Infographic Diagram Template for PowerPoint & Google Slides
Mind Maps
Eight-Item Central Idea Diagram Template for PowerPoint & Google Slides
Circular
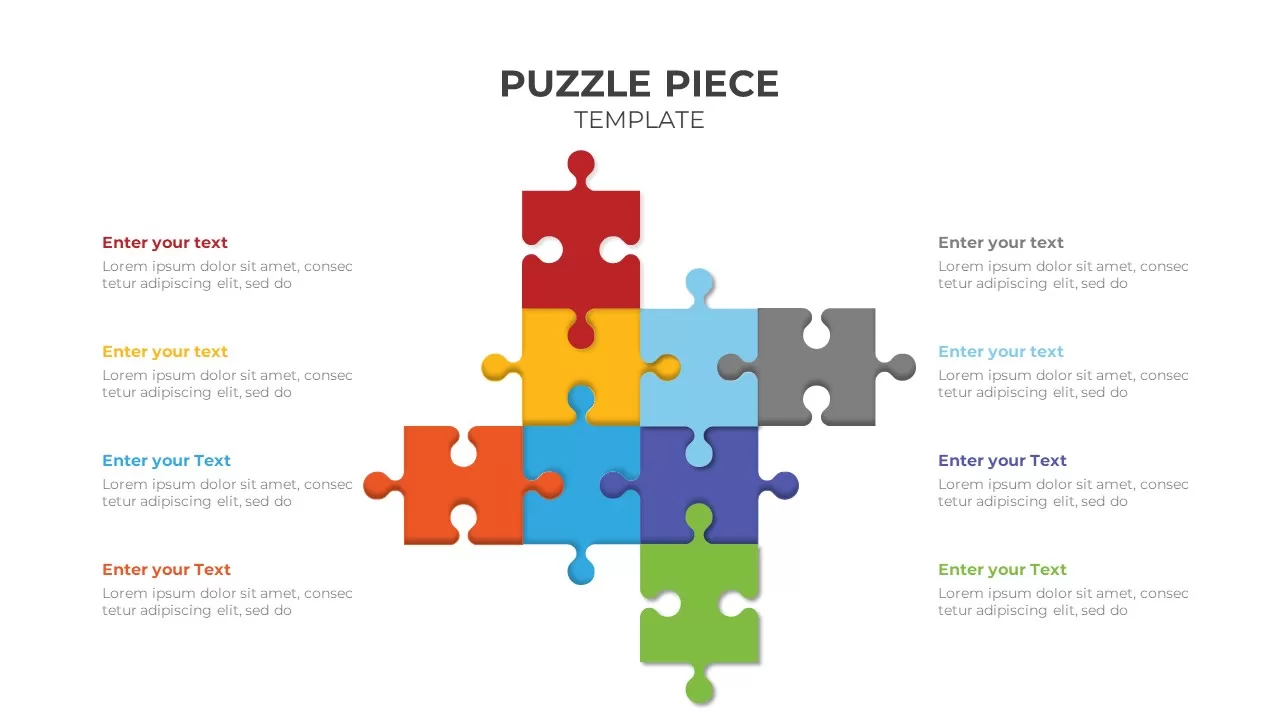
Colorful Eight-Piece Puzzle Diagram Template for PowerPoint & Google Slides
Process
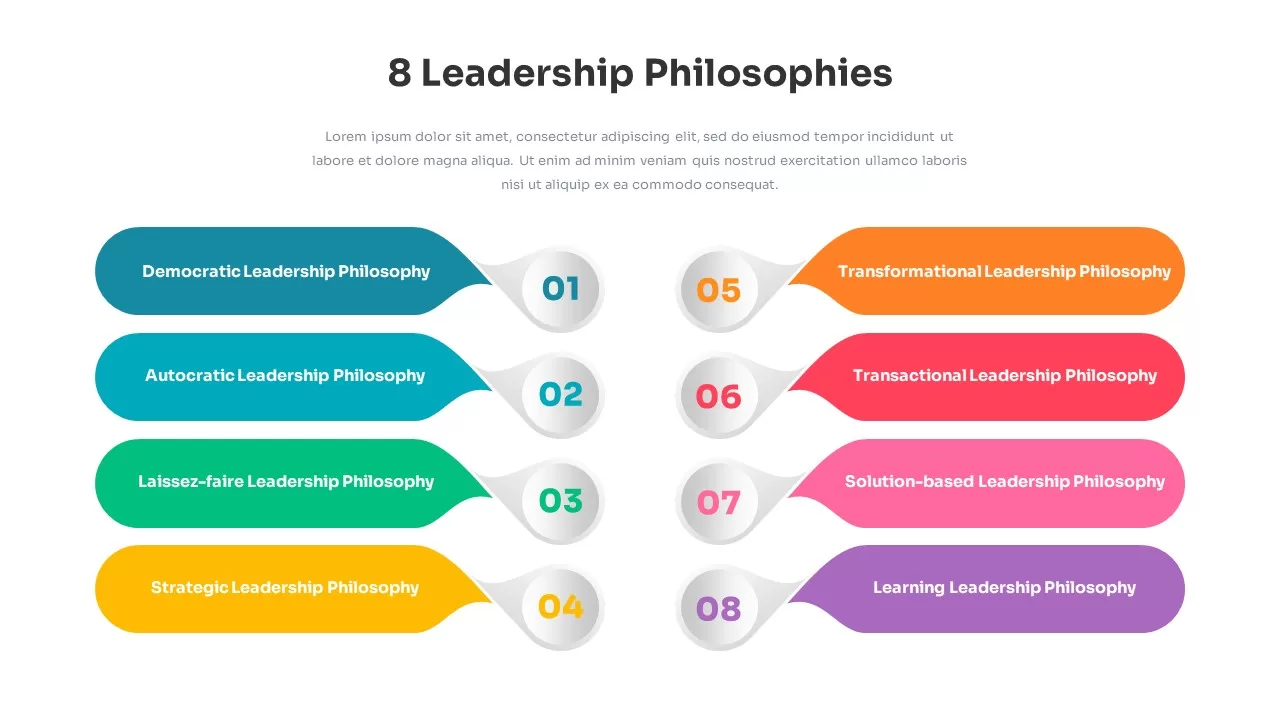
Eight Leadership Philosophies Diagram Template for PowerPoint & Google Slides
Leadership
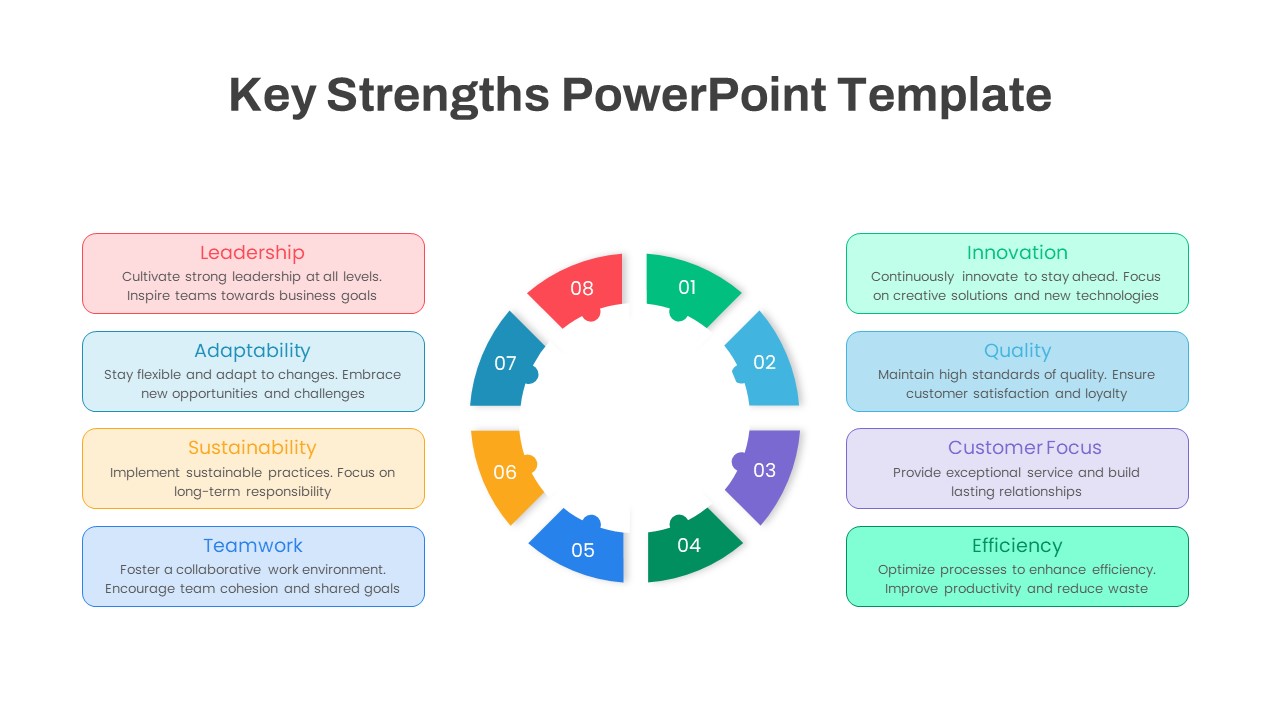
Eight-Segment Key Strengths Diagram Template for PowerPoint & Google Slides
Circular
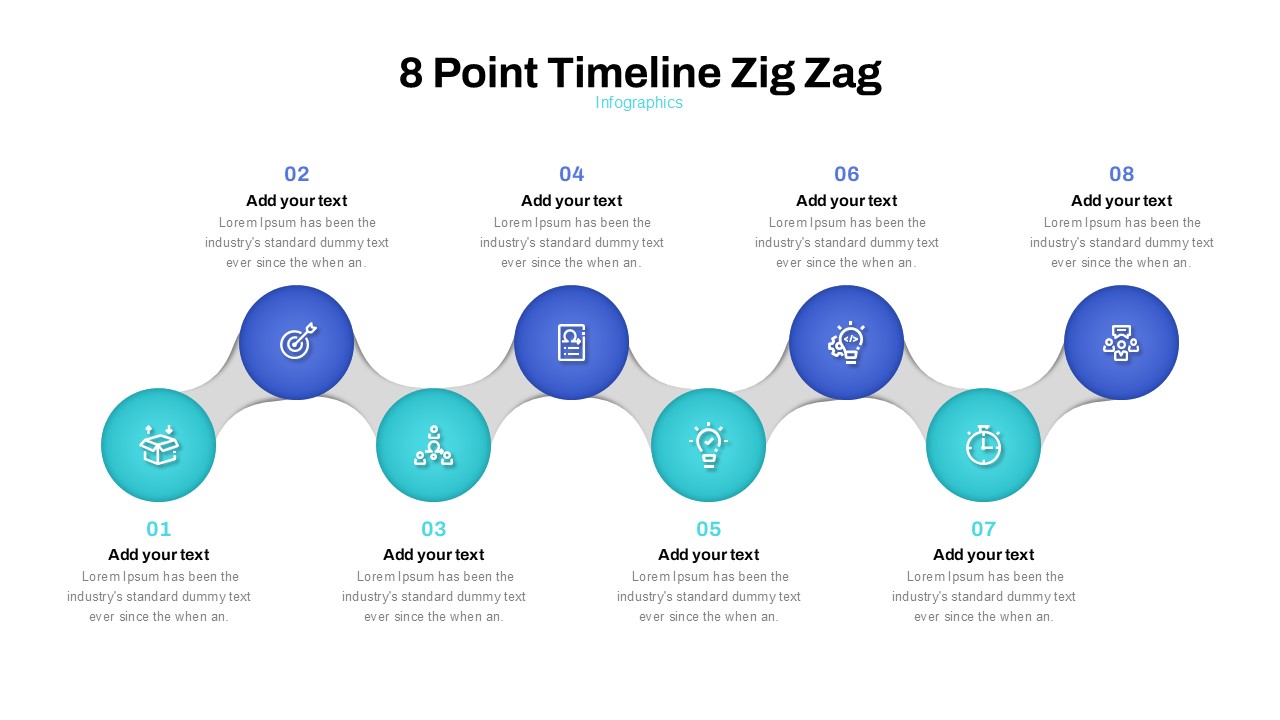
Zig Zag Eight-Point Timeline Diagram Template for PowerPoint & Google Slides
Timeline
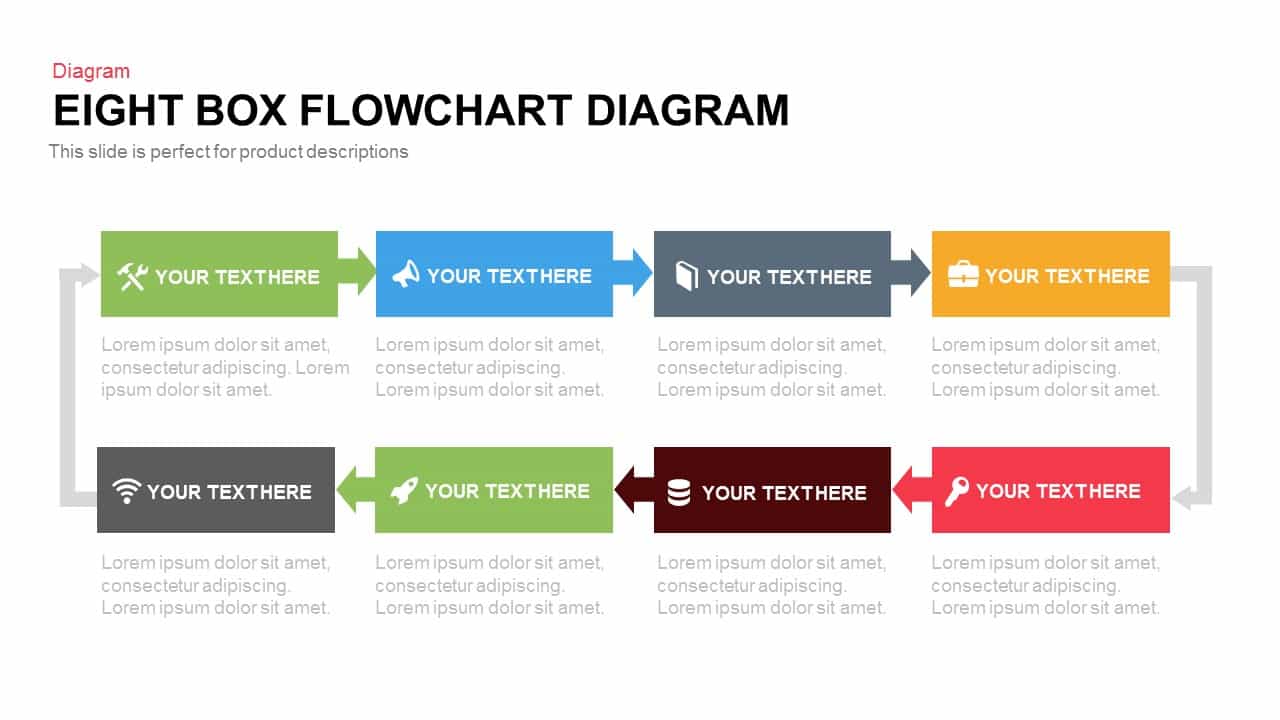
Eight Box Flowchart template for PowerPoint & Google Slides
Flow Charts
Eight-Segment 3D Arrow Infographics Template for PowerPoint & Google Slides
Arrow
Eight Post-It Note Arrow Infographic Template for PowerPoint & Google Slides
Arrow
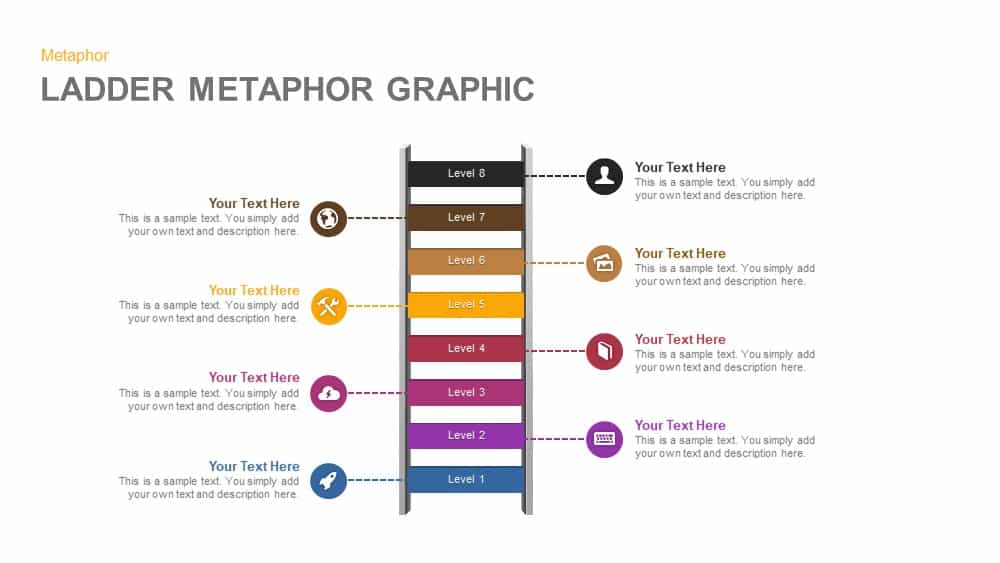
Eight-Level Ladder Metaphor Graphic Template for PowerPoint & Google Slides
Process
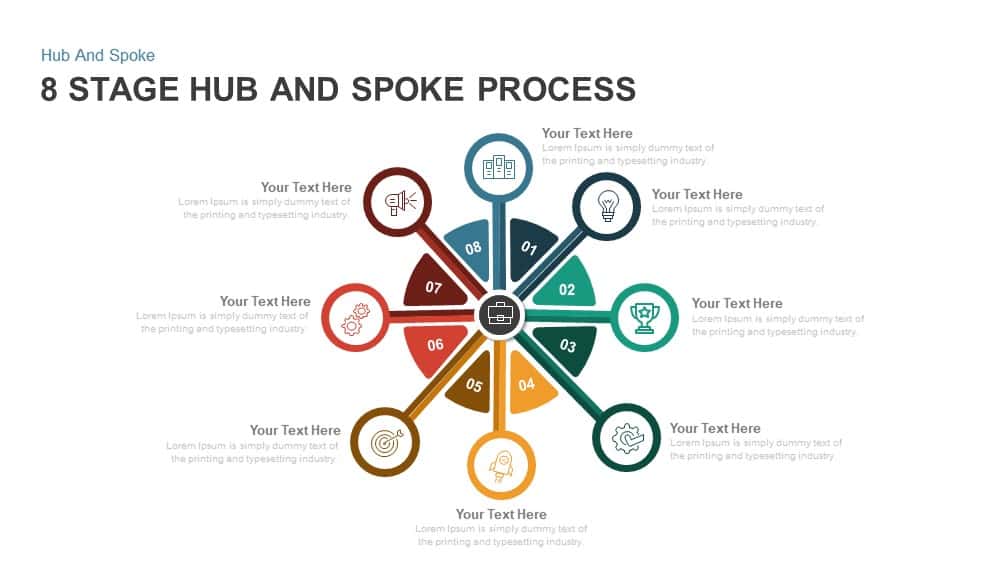
Eight-Stage Hub & Spoke Process Template for PowerPoint & Google Slides
Process
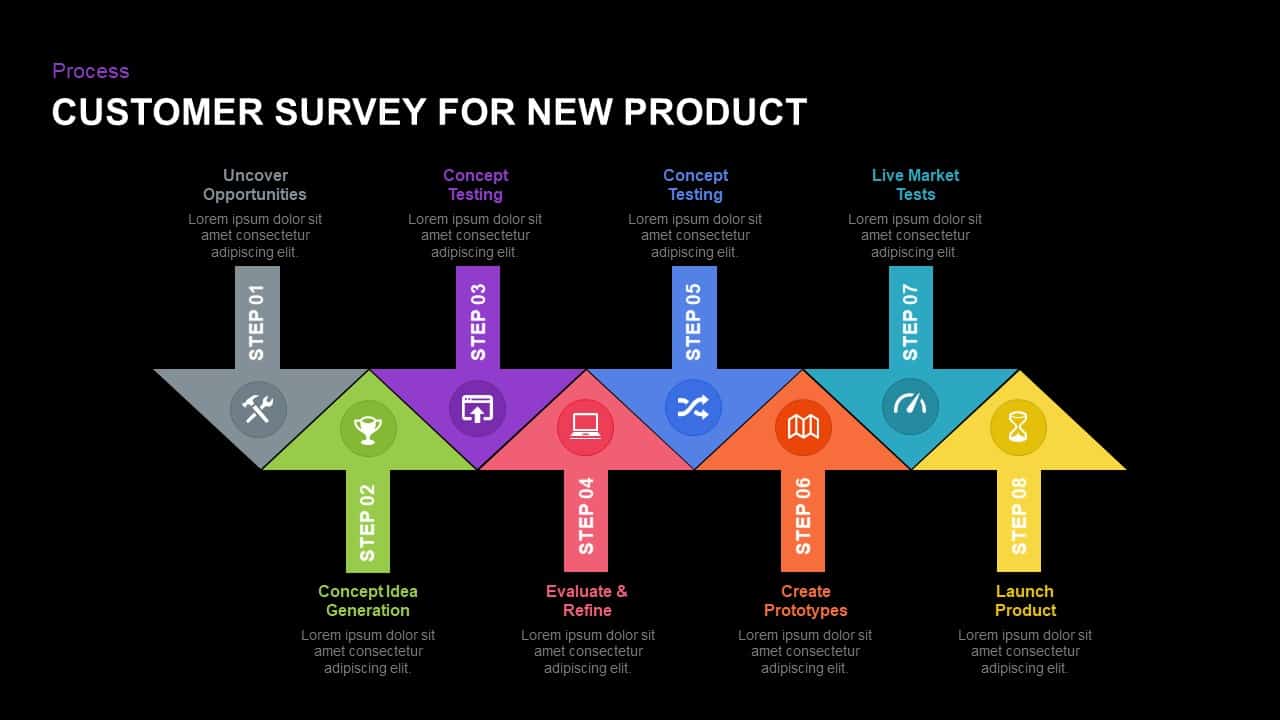
Eight-Step New Product Survey Process Template for PowerPoint & Google Slides
Process
Corporate Meeting Agenda Eight-Step Template for PowerPoint & Google Slides
Agenda
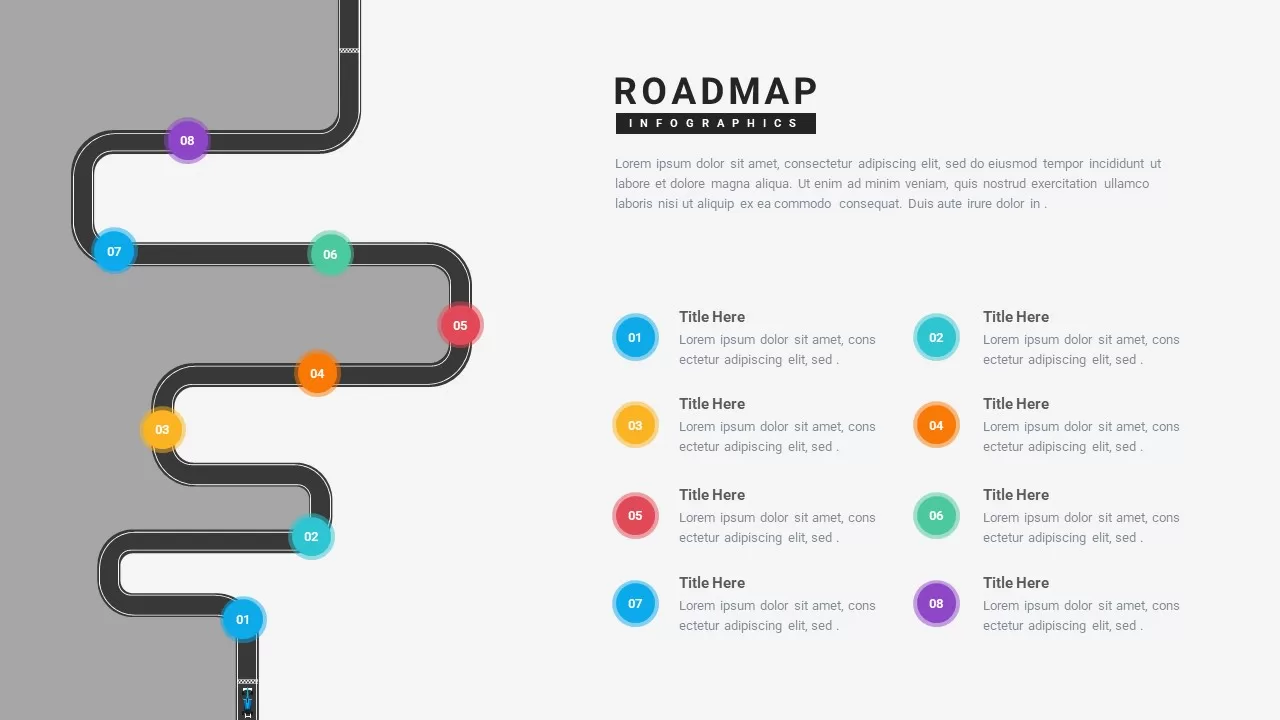
Eight-Step Winding Roadmap Infographic Template for PowerPoint & Google Slides
Roadmap
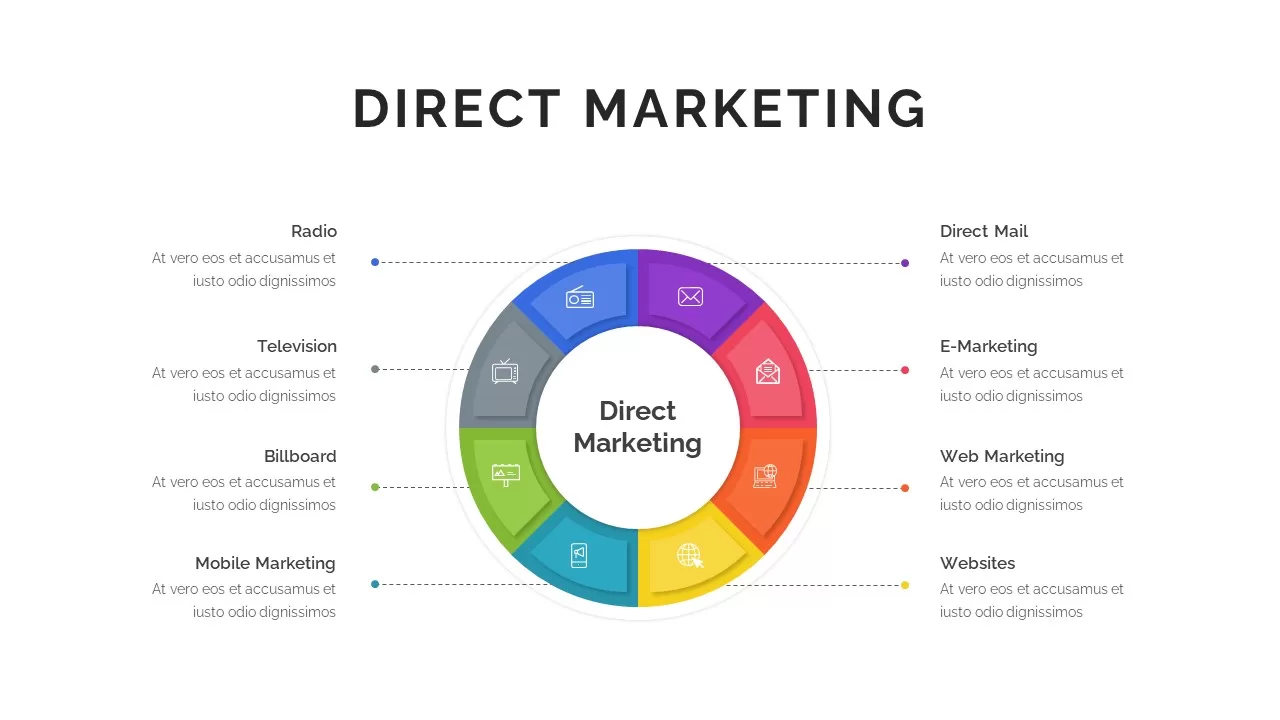
Eight-Segment Direct Marketing Wheel Template for PowerPoint & Google Slides
Circular
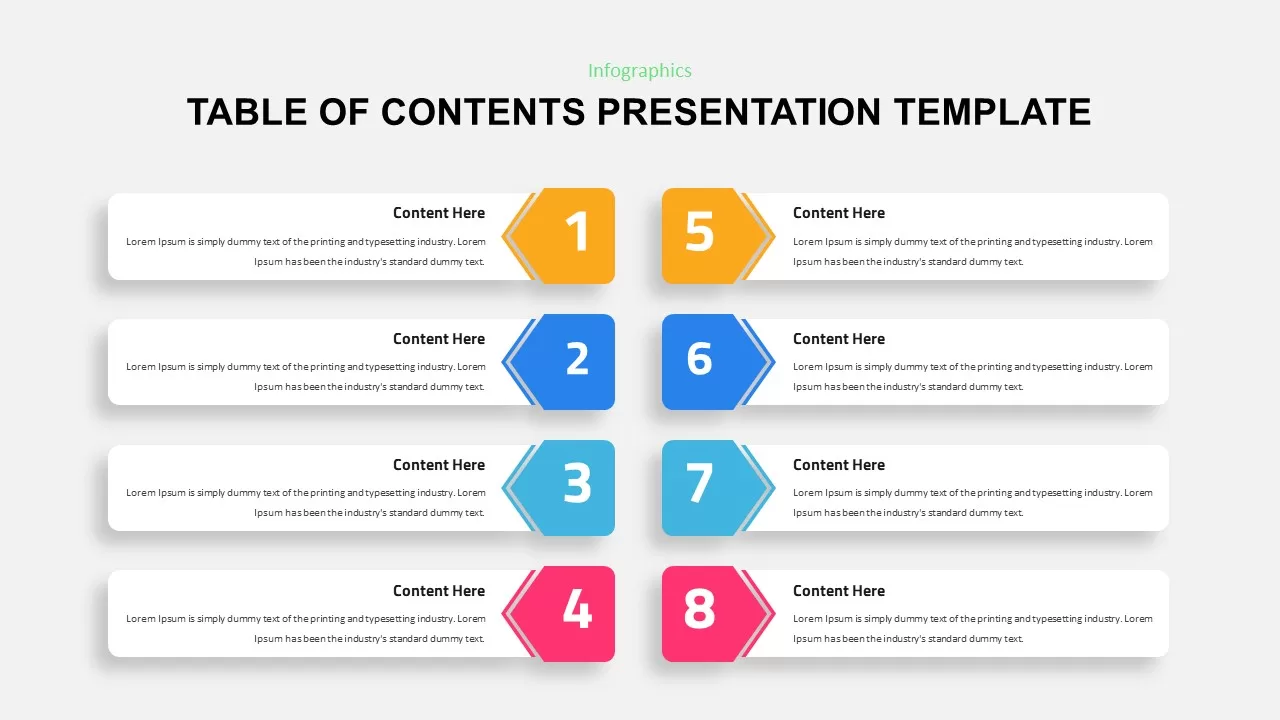
Eight-Step Colorful Table of Contents Template for PowerPoint & Google Slides
Infographics
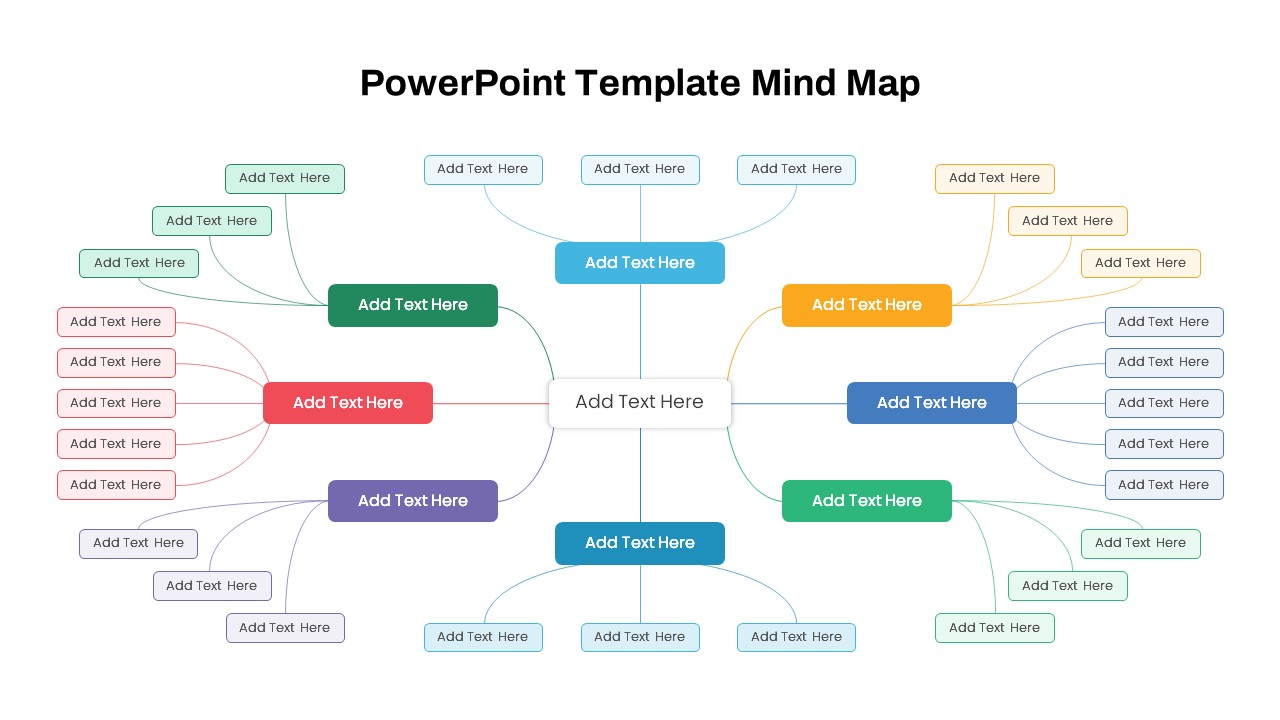
Modern Custom Eight-Branch Mind Map Template for PowerPoint & Google Slides
Mind Maps
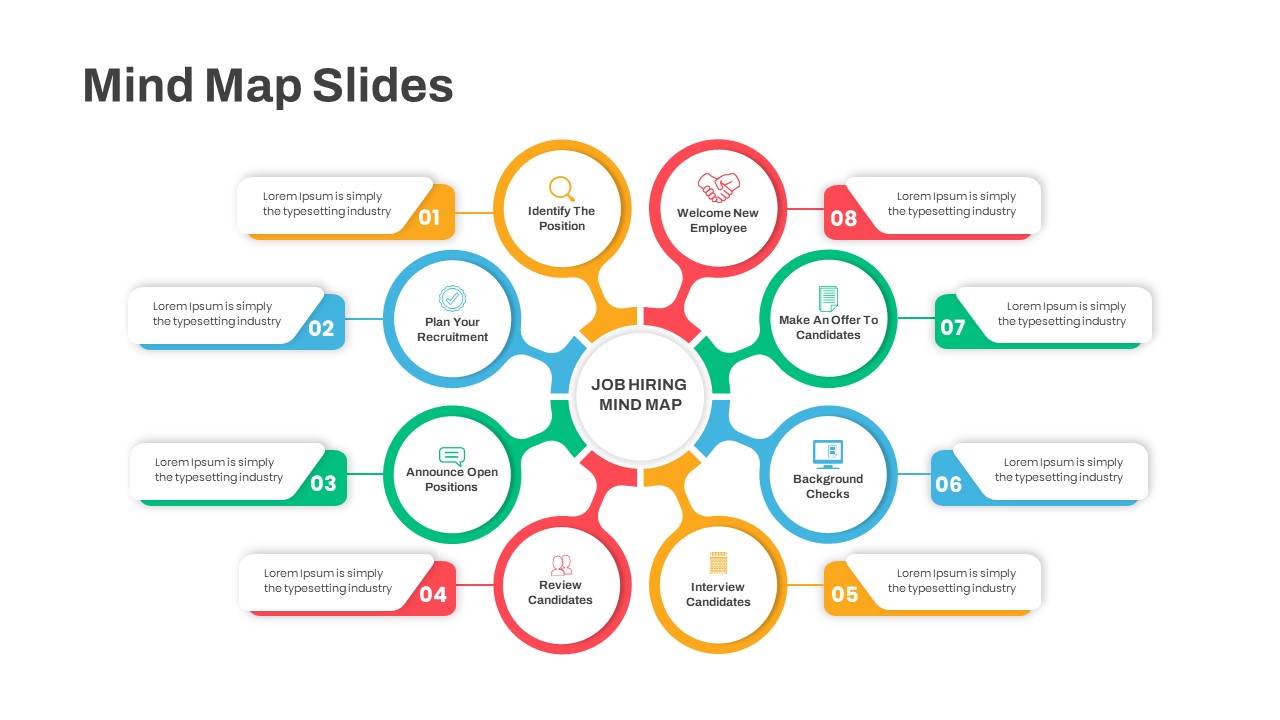
Eight-Step Job Hiring Mind Map Template for PowerPoint & Google Slides
Mind Maps
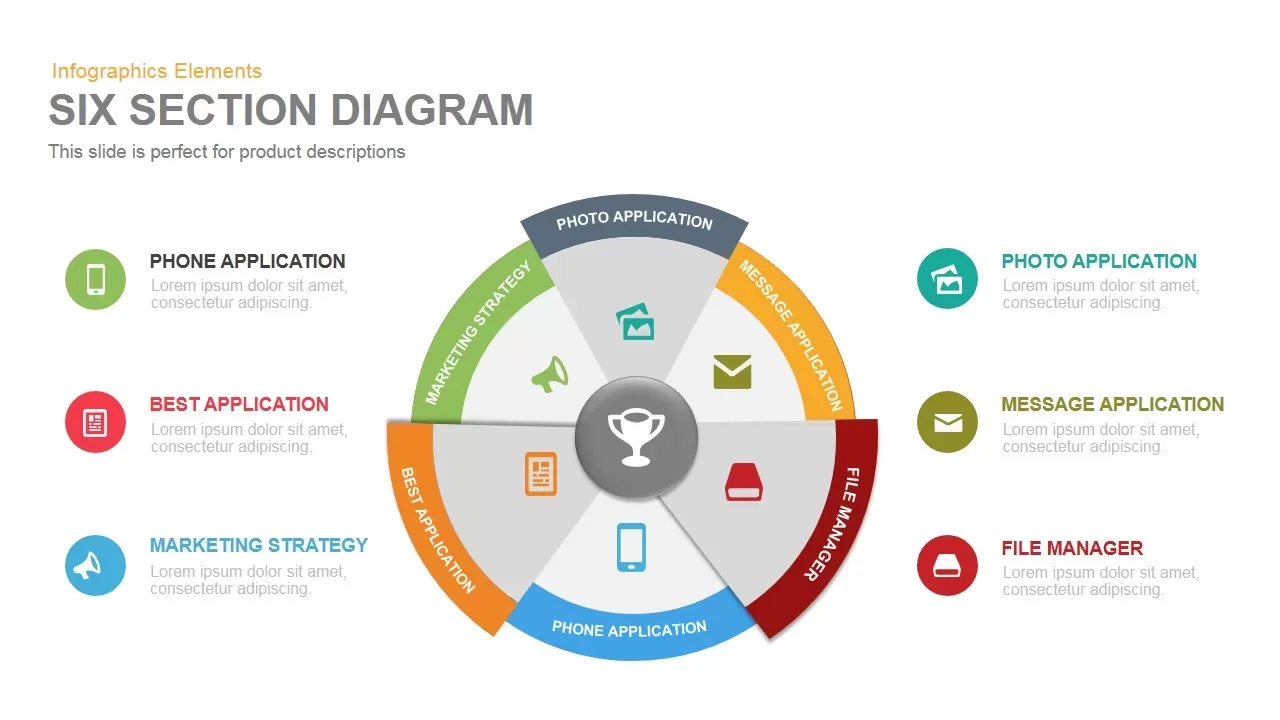
Six Section Diagram template for PowerPoint & Google Slides
Circular
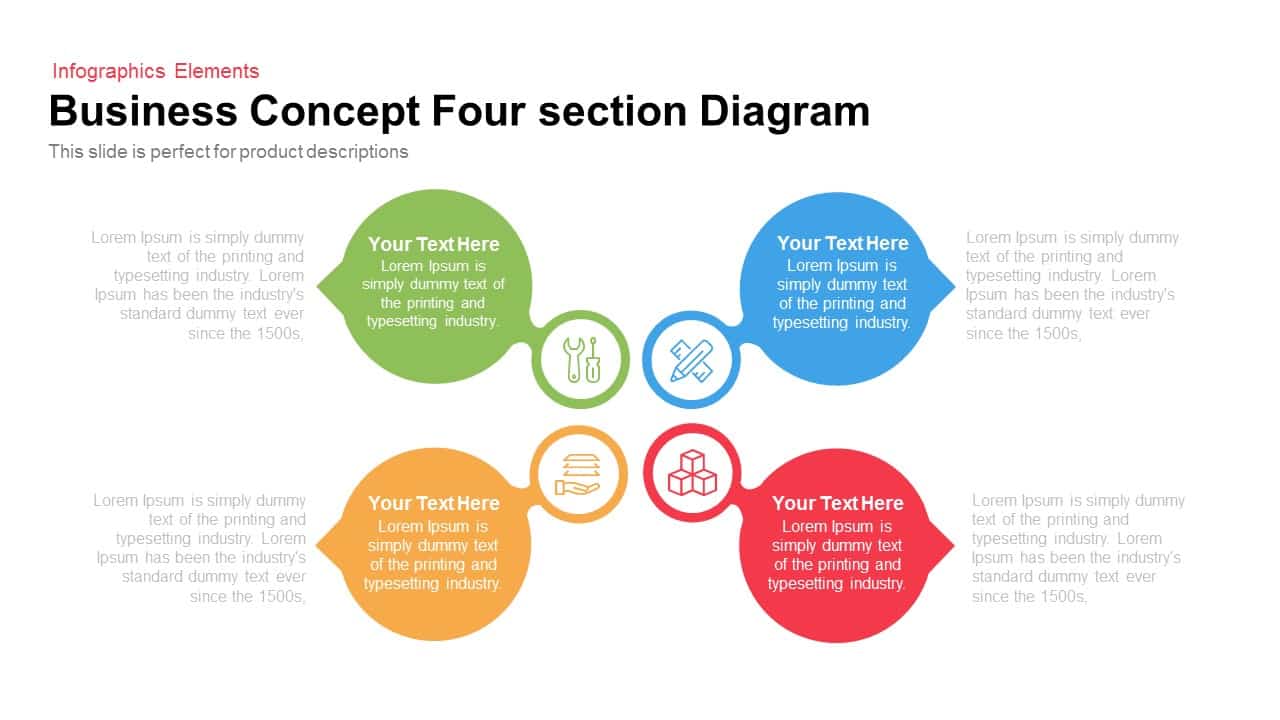
Business Concept 4 section Diagram template for PowerPoint & Google Slides
Infographics
4 Section Pipe Diagram Process Flow Template for PowerPoint & Google Slides
Process
Three-Section Fishbone Process Diagram template for PowerPoint & Google Slides
Process
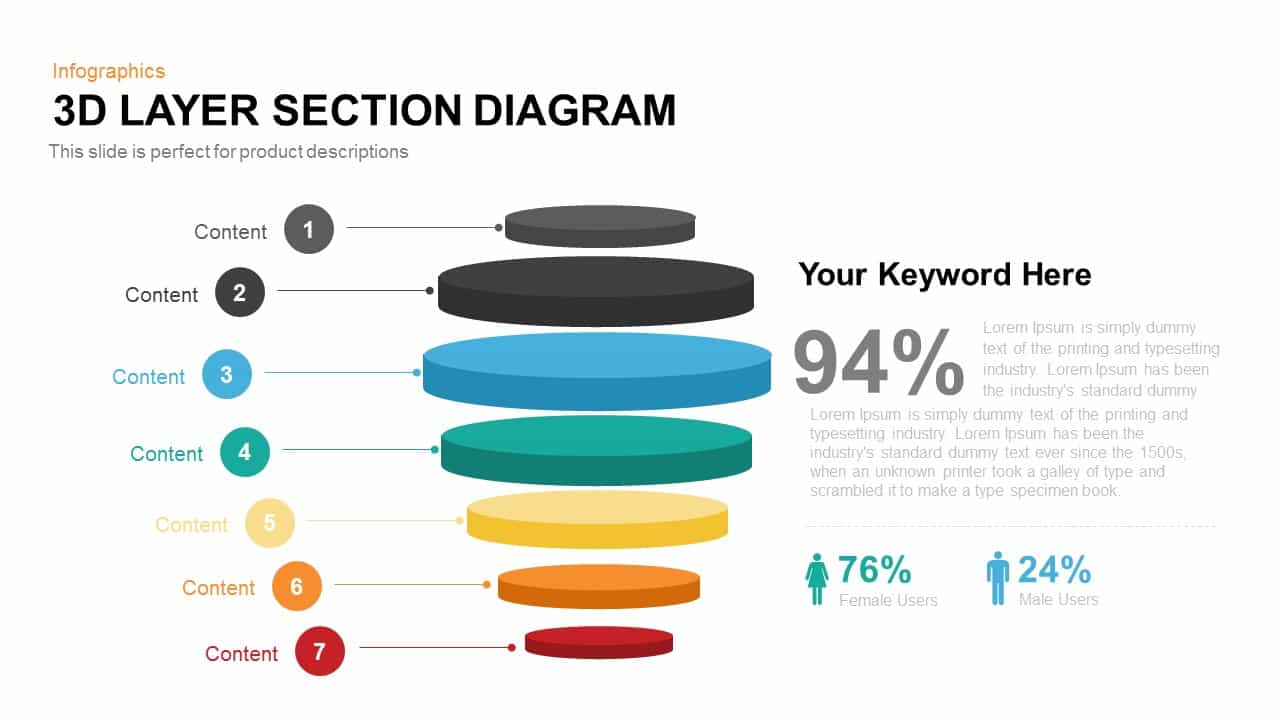
Modern 3D Layer Section Diagram Template for PowerPoint & Google Slides
Circular
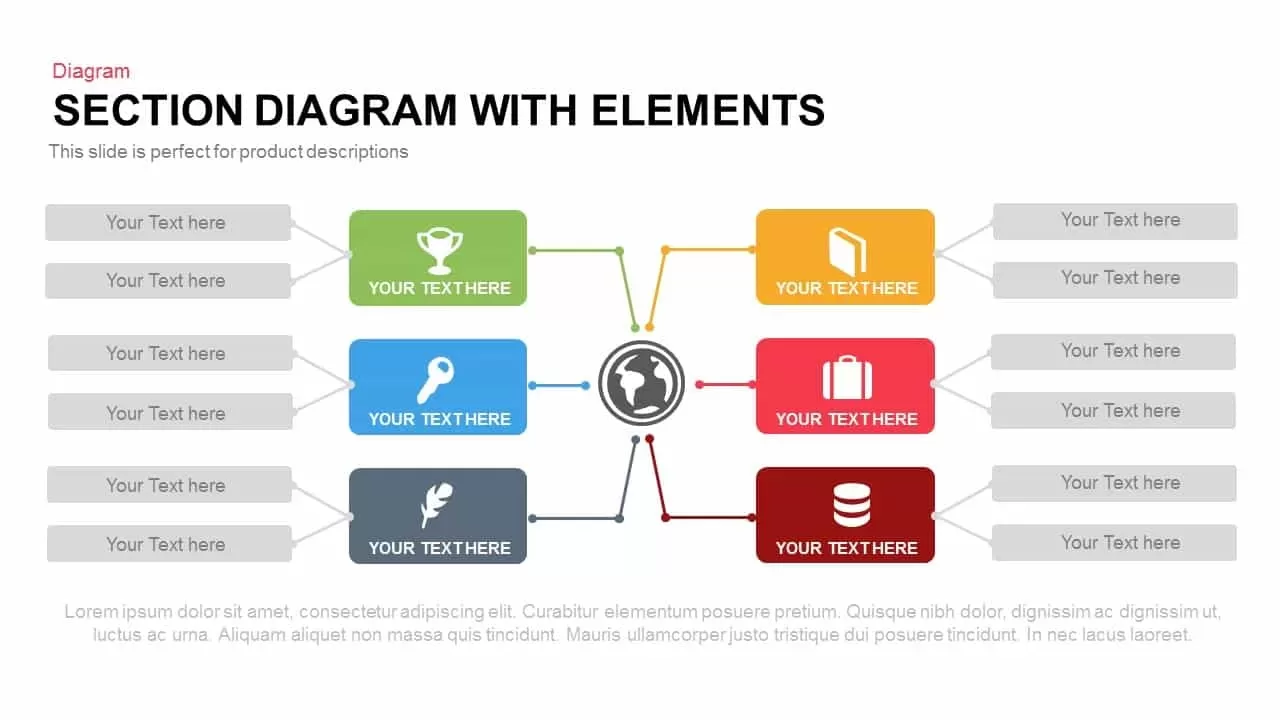
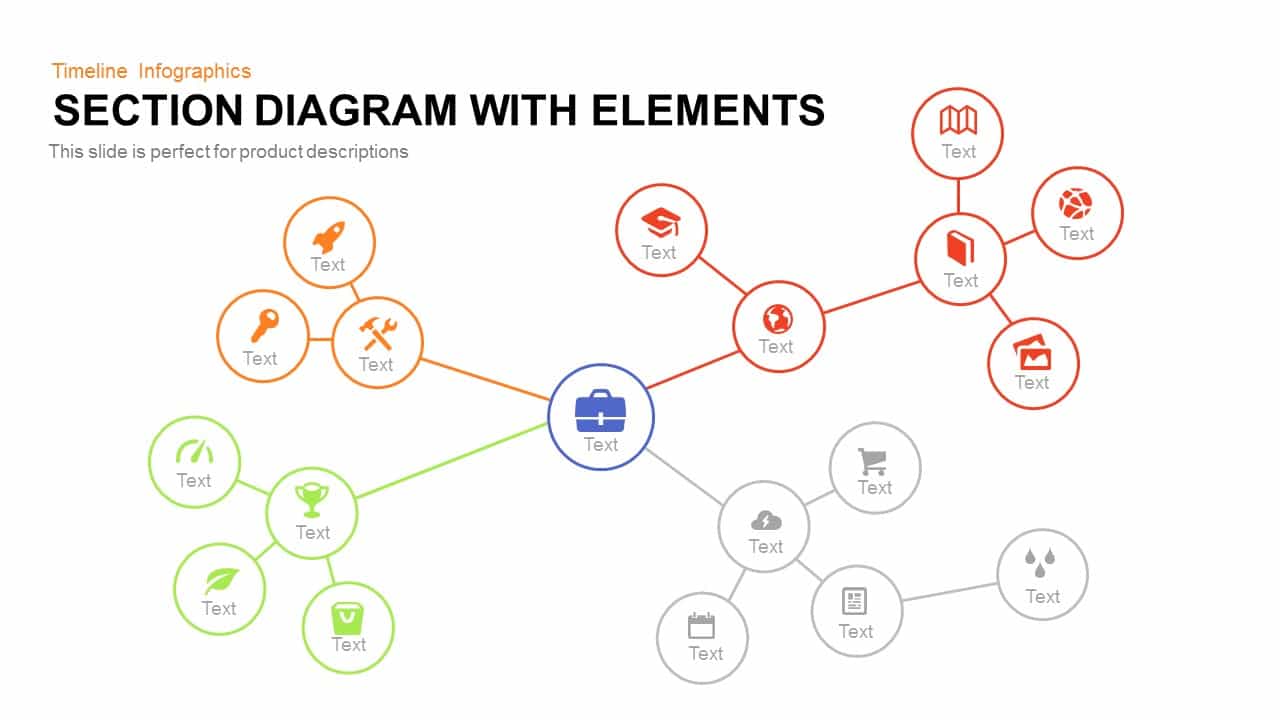
Section Diagram Elements Infographic Template for PowerPoint & Google Slides
Process
Four Section Comparison Chart Diagram Template for PowerPoint & Google Slides
Infographics
Section Diagram template for PowerPoint & Google Slides
Circular
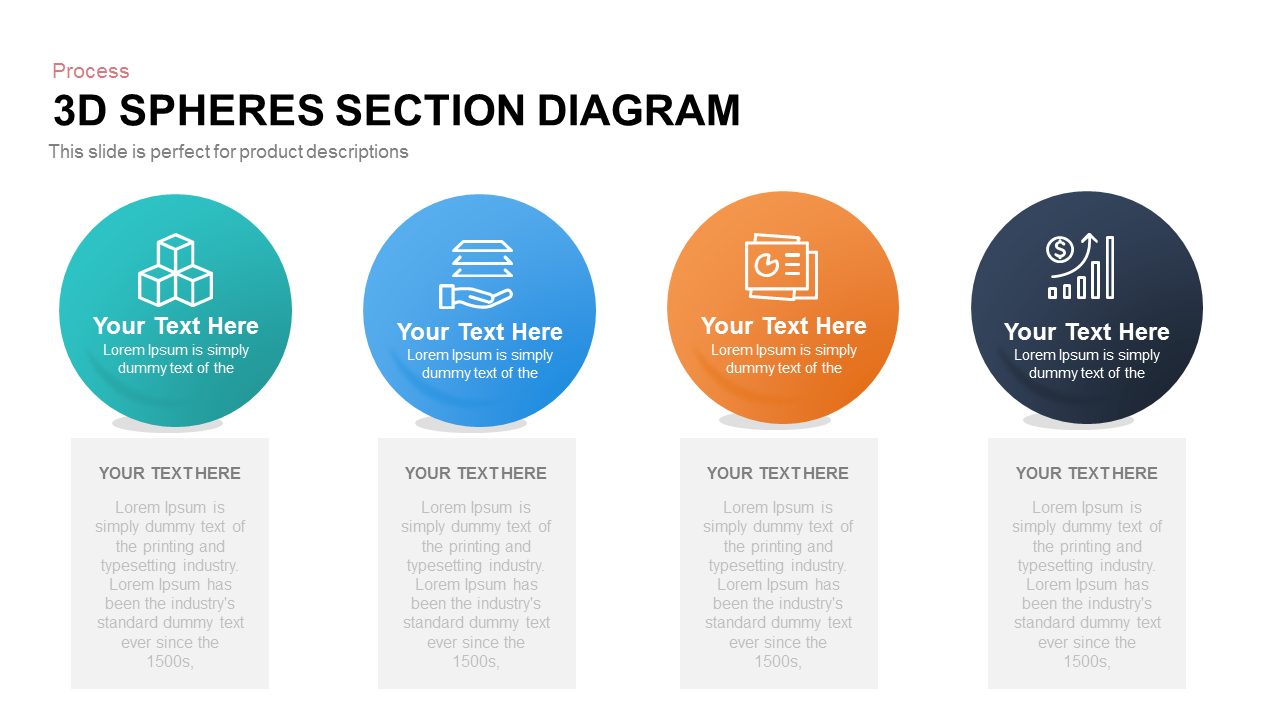
Four-Part 3D Spheres Section Diagram template for PowerPoint & Google Slides
Process
8-Section Split Diagram with Hub Icon template for PowerPoint & Google Slides
Circular
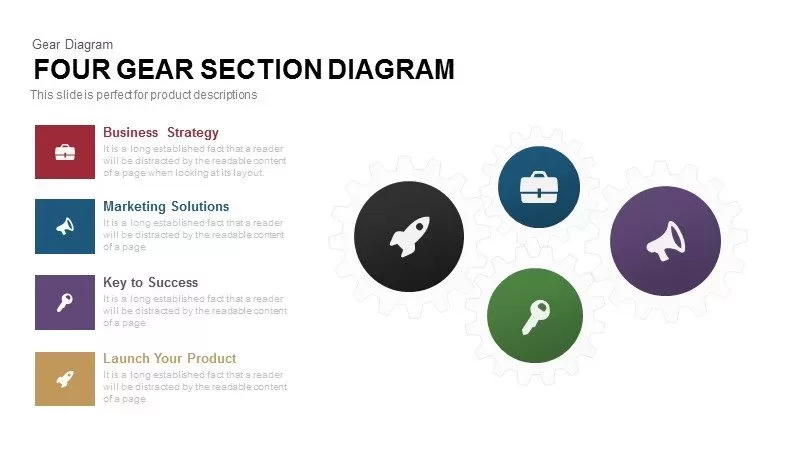
Four Gear Section Diagram Template for PowerPoint & Google Slides
Circular
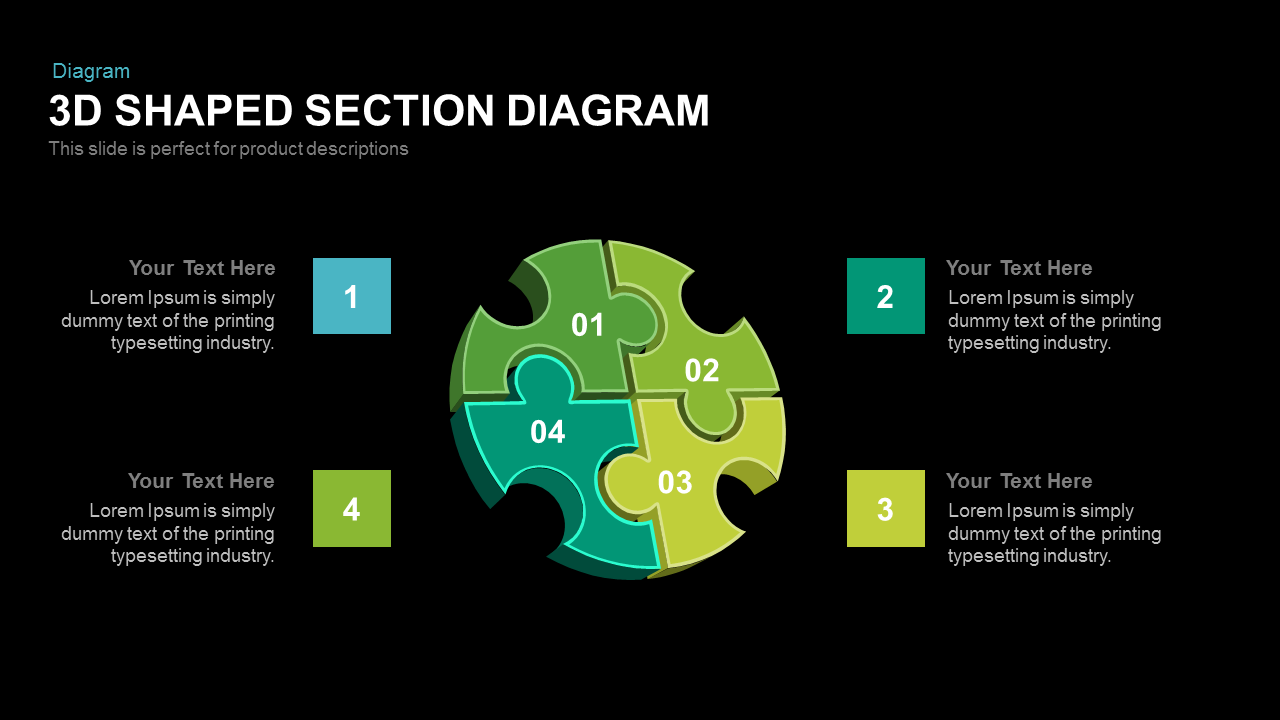
3D Shaped Section Diagram template for PowerPoint & Google Slides
Infographics
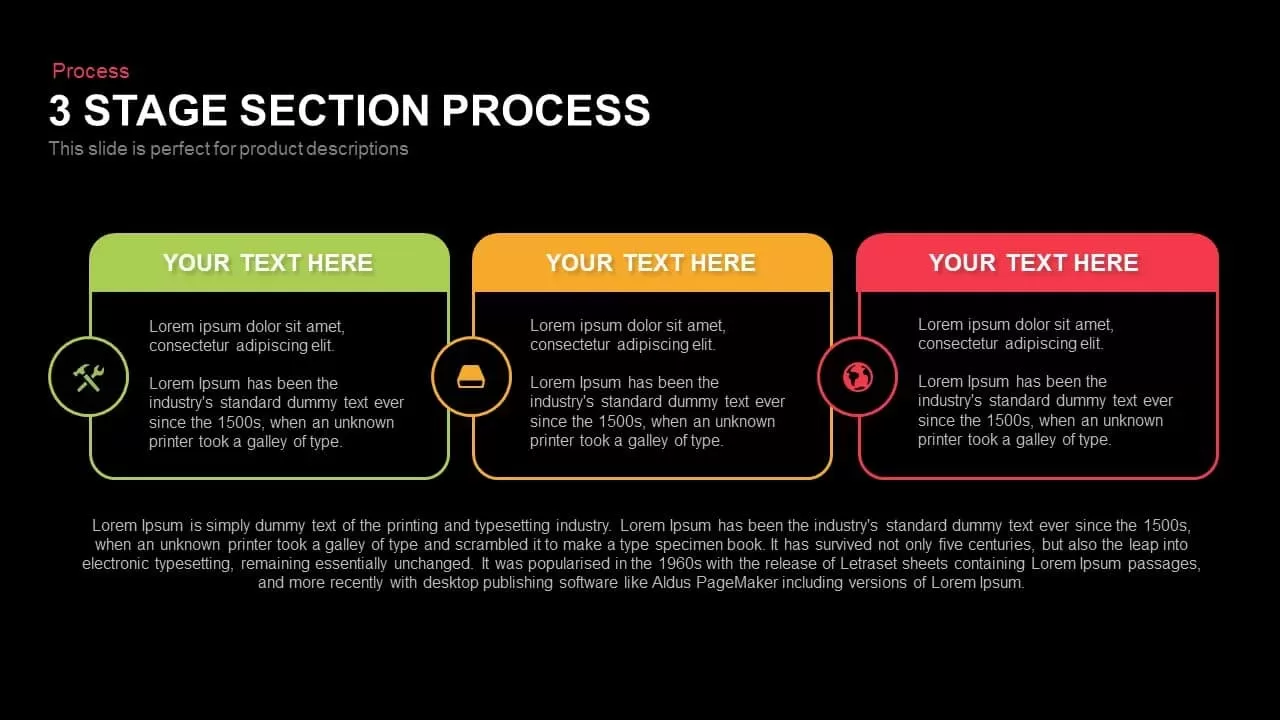
3 Stage Section Process Diagram Template for PowerPoint & Google Slides
Process
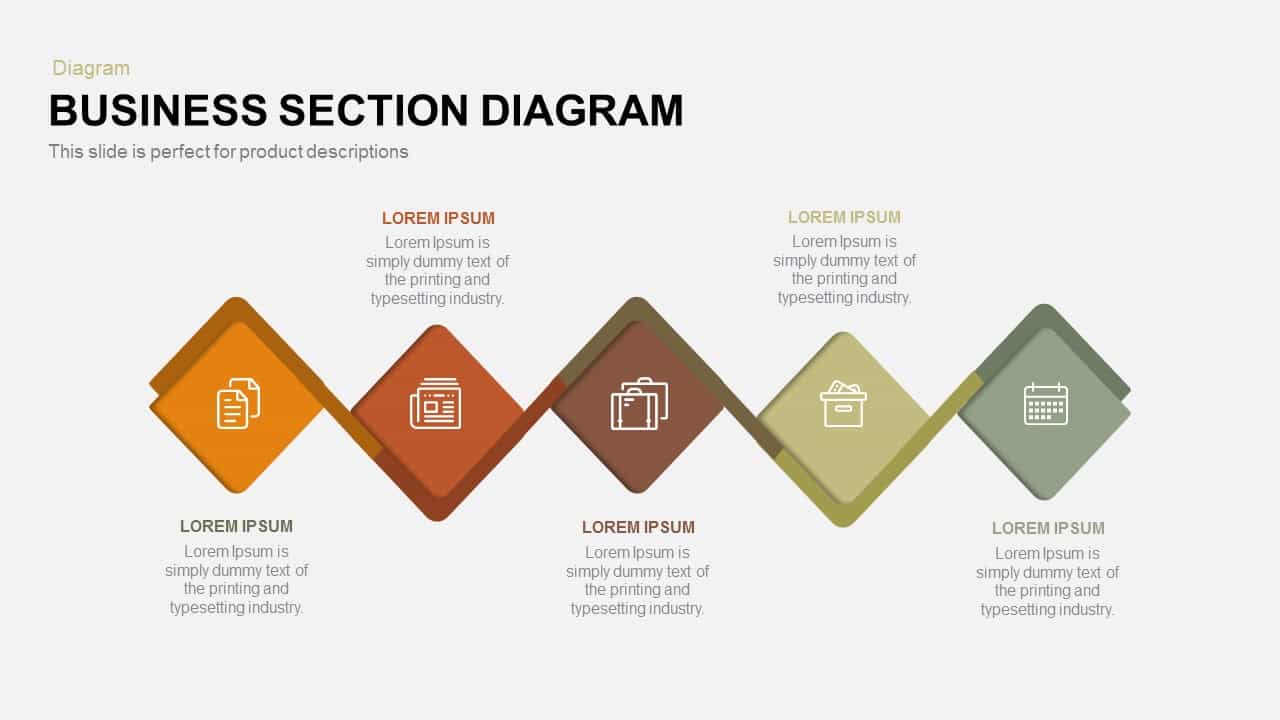
Business Section Diamond Process Diagram Template for PowerPoint & Google Slides
Process
Five-Section Arrow Signpost Diagram Template for PowerPoint & Google Slides
Arrow
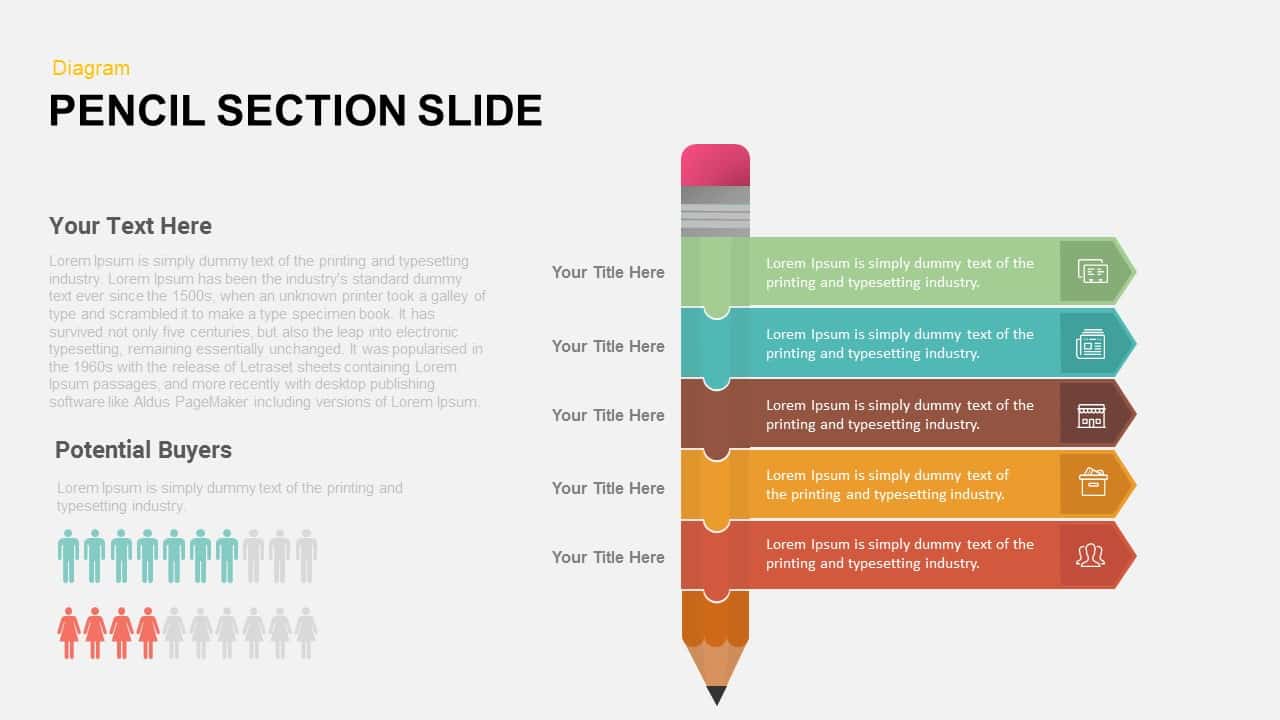
Pencil Section Five-Part Diagram Template for PowerPoint & Google Slides
Process
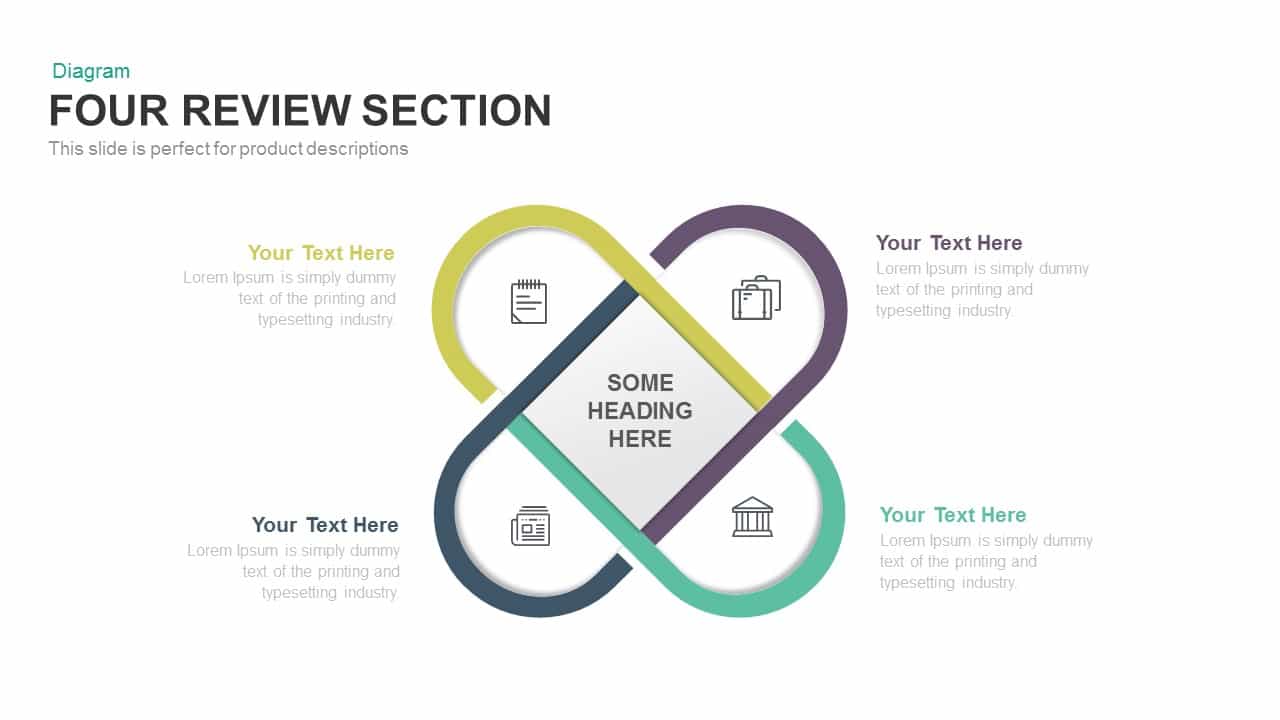
Clean Four-Section Review Diagram Template for PowerPoint & Google Slides
Agenda
Modern Multi-Section Circle Diagram Template for PowerPoint & Google Slides
Circular
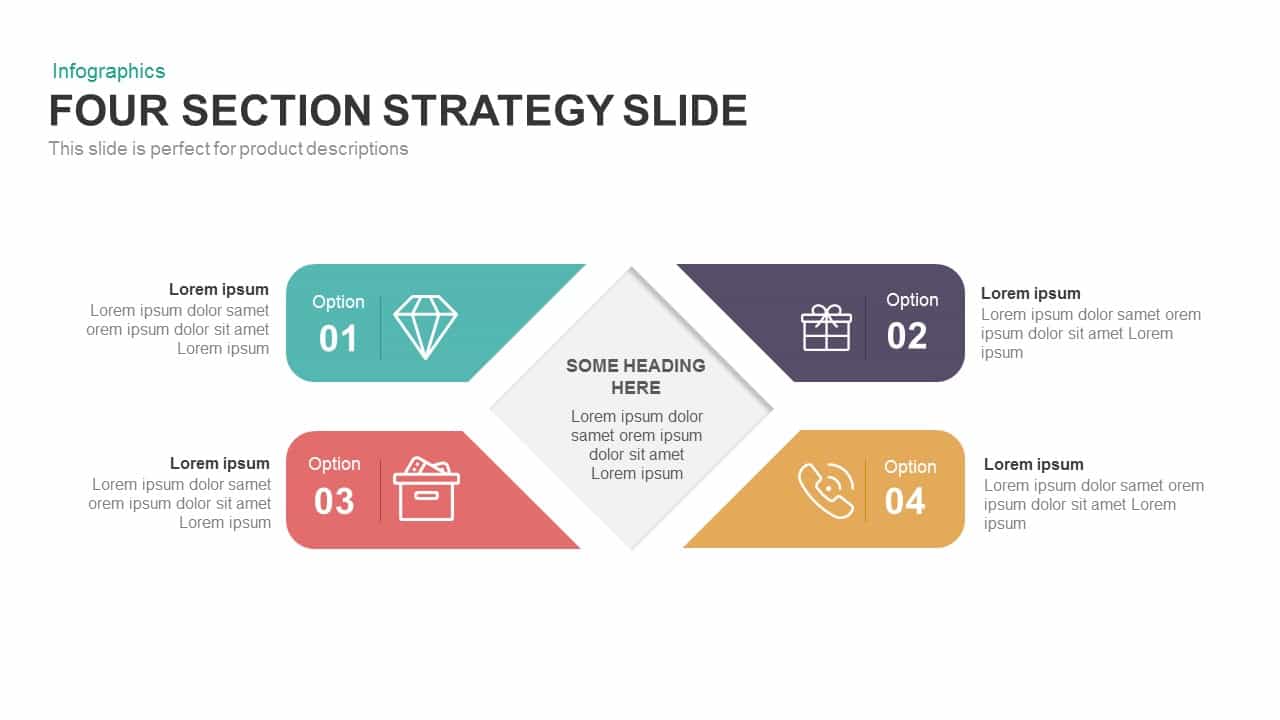
Four-Section Strategy Diagram Slide Template for PowerPoint & Google Slides
Business Strategy
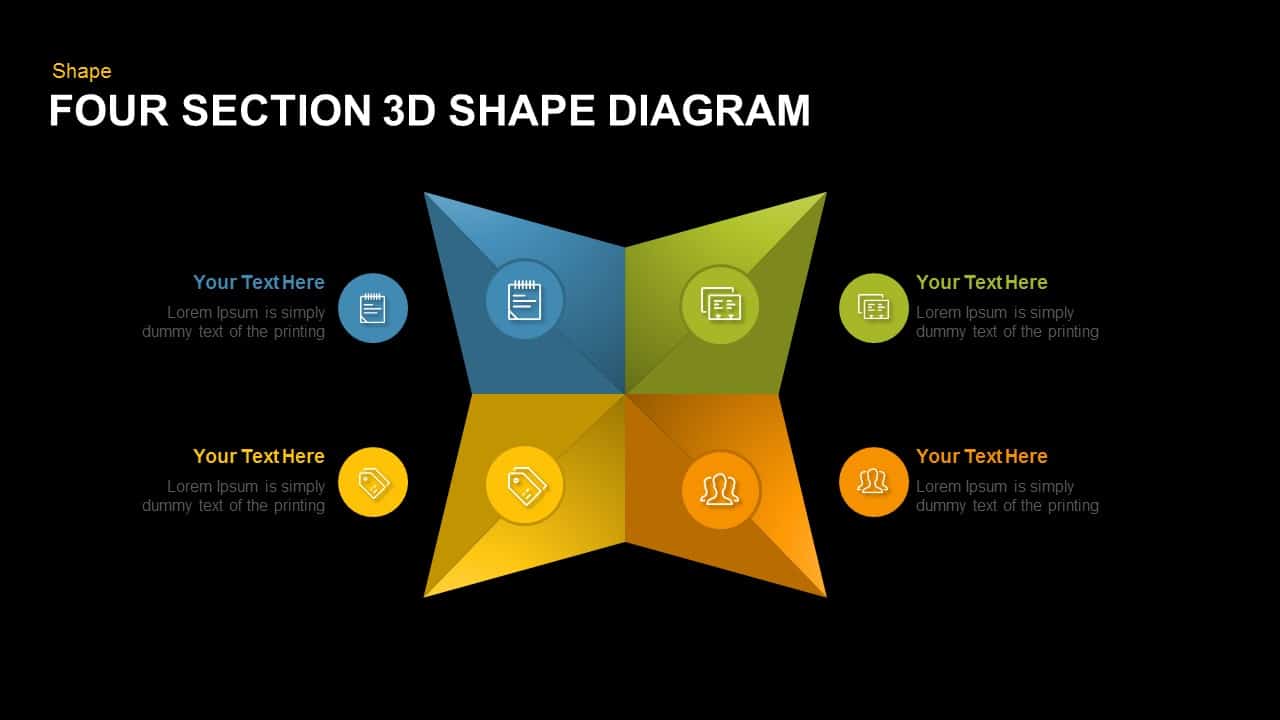
Editable Four-Section 3D Shape Diagram Template for PowerPoint & Google Slides
Comparison
Four-Section Arrow Infographic Diagram Template for PowerPoint & Google Slides
Arrow
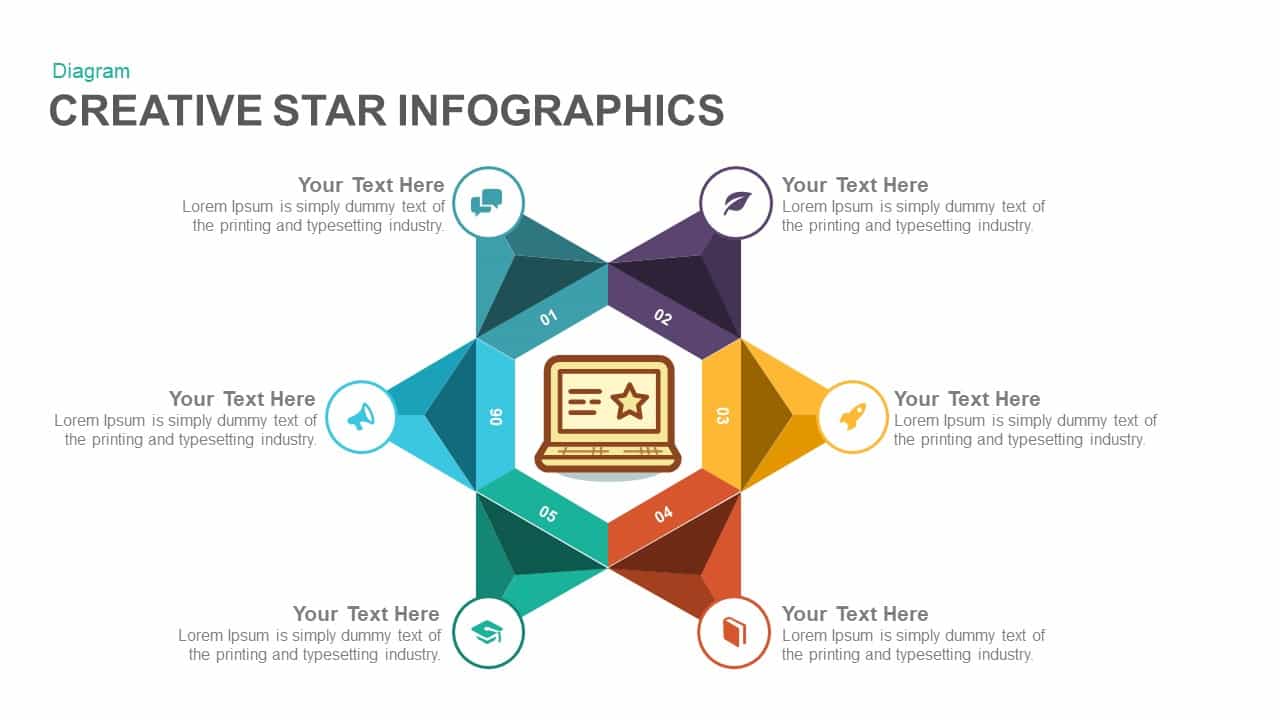
Six-Section Star Infographic Diagram Template for PowerPoint & Google Slides
Circular
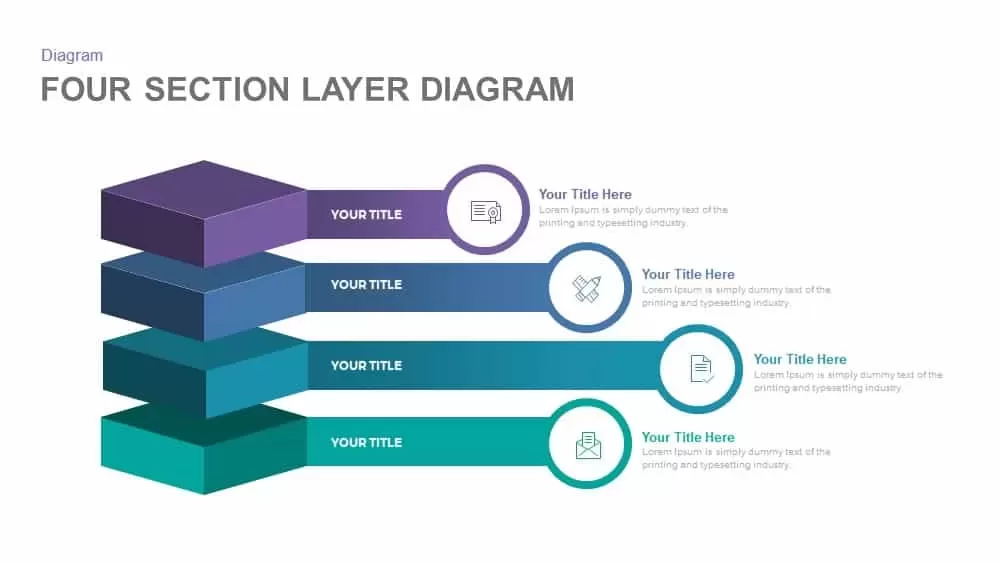
Professional Four-Section Layer Diagram Template for PowerPoint & Google Slides
Process
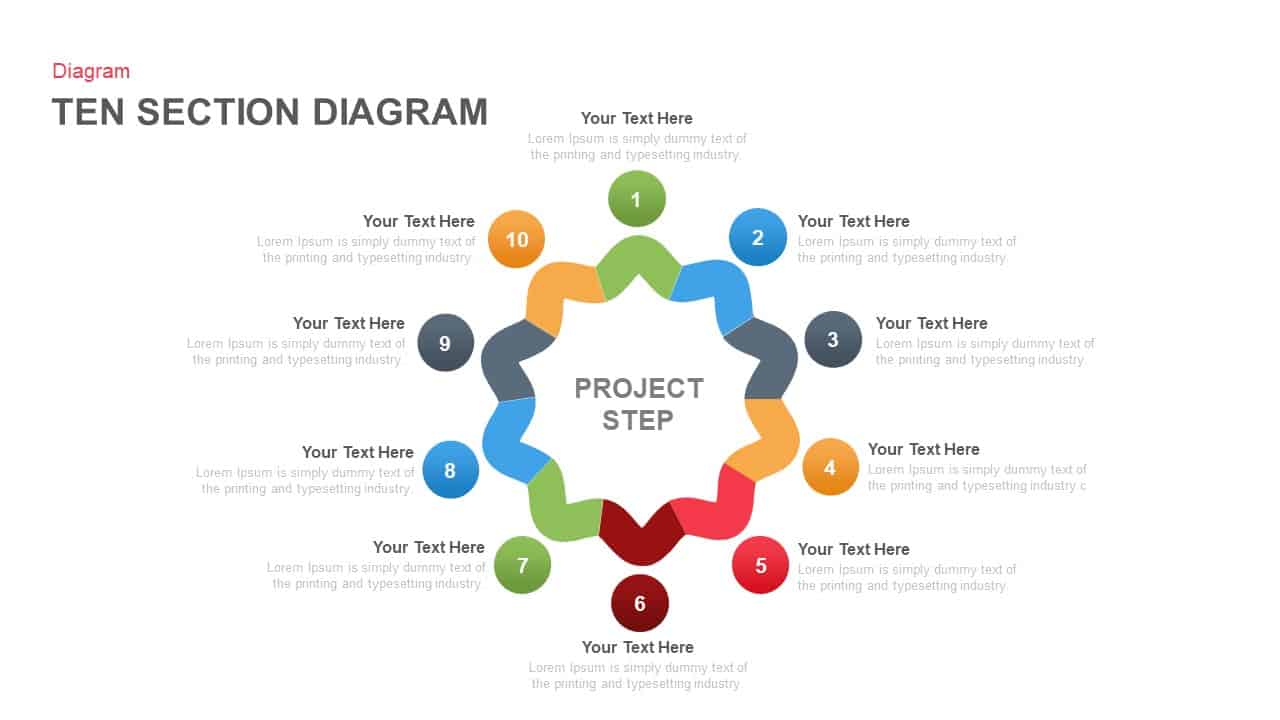
Ten-Section Project Steps Diagram Template for PowerPoint & Google Slides
Process
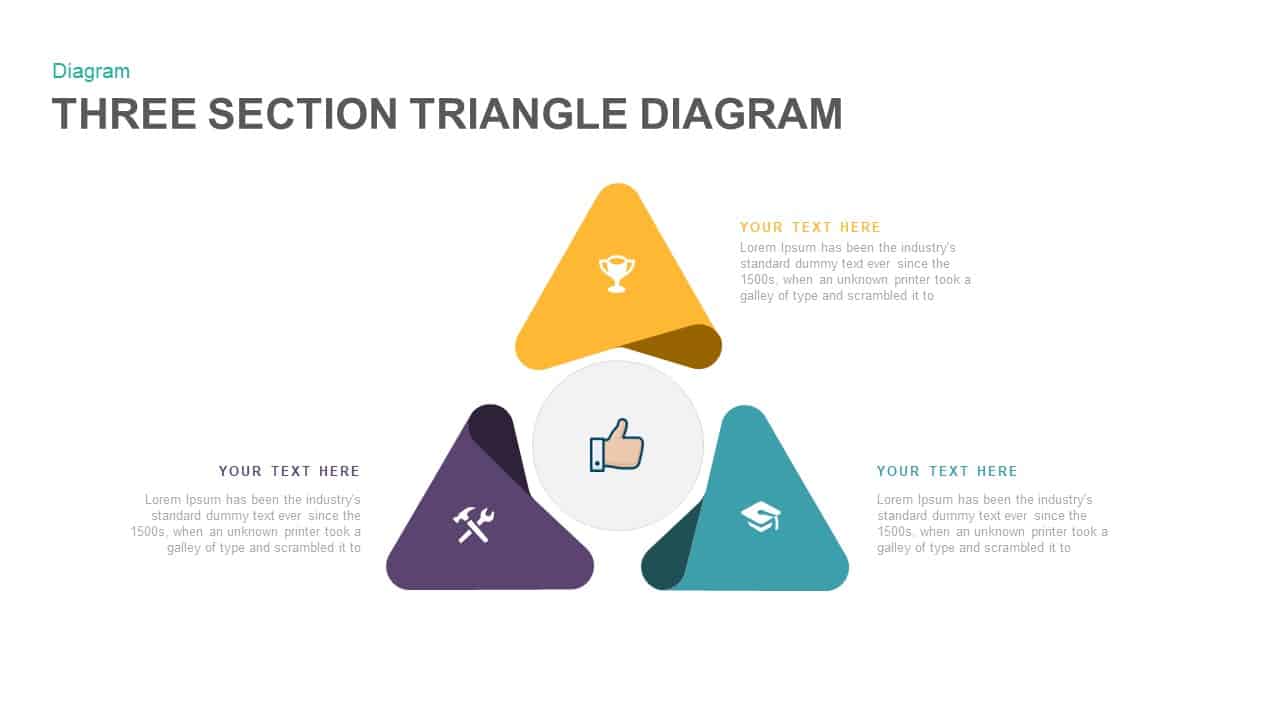
Three Section Triangle Diagram Template for PowerPoint & Google Slides
Process
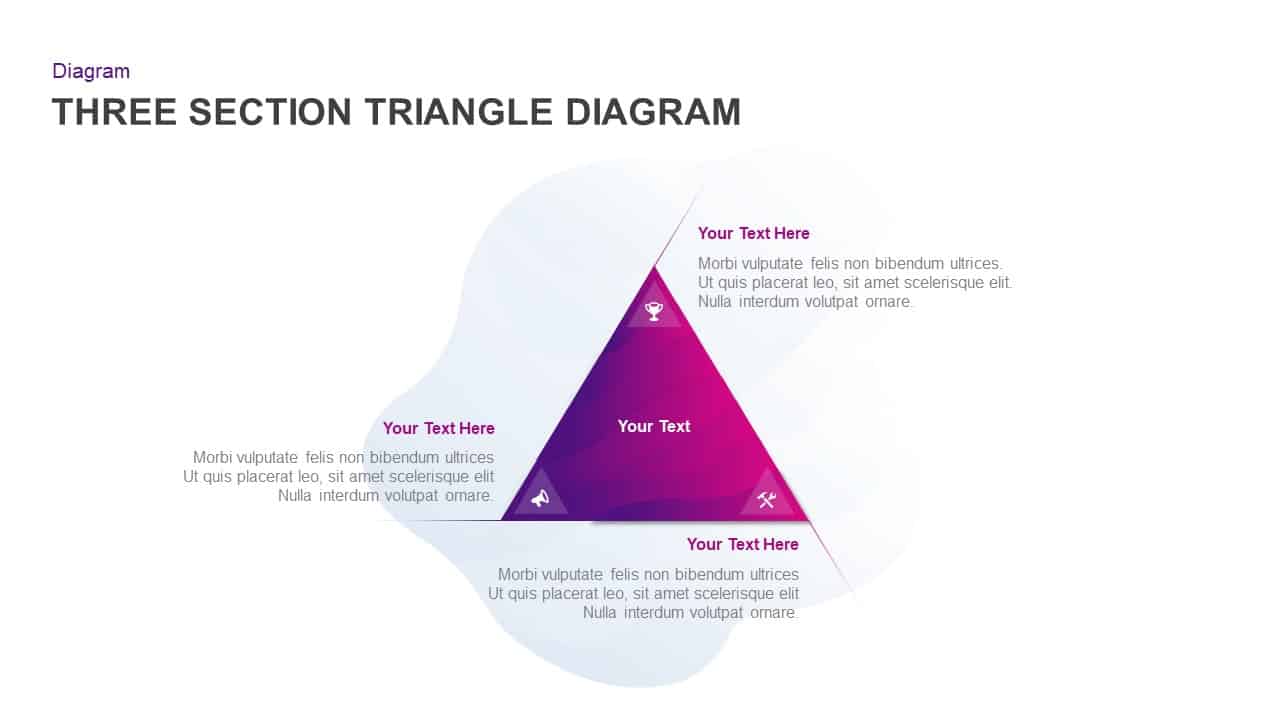
Three-Section Triangle Diagram Template for PowerPoint & Google Slides
Pyramid
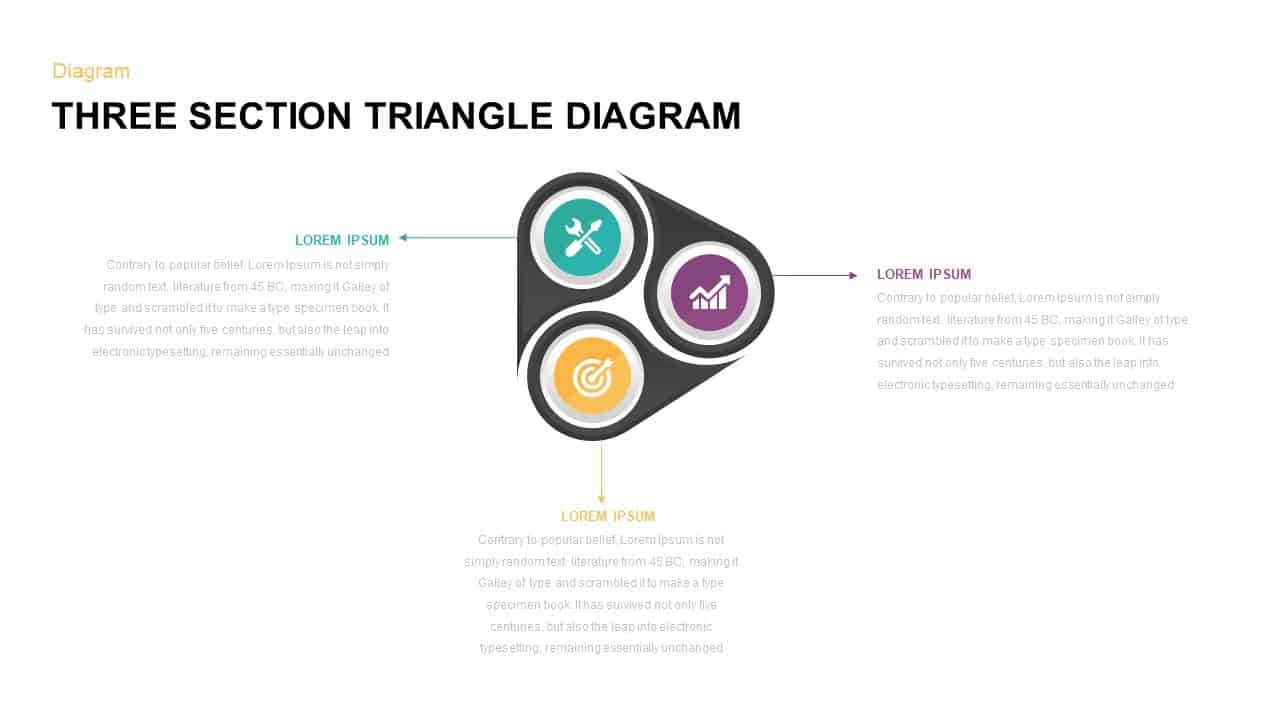
Three Section Triangle Diagram Template for PowerPoint & Google Slides
Process
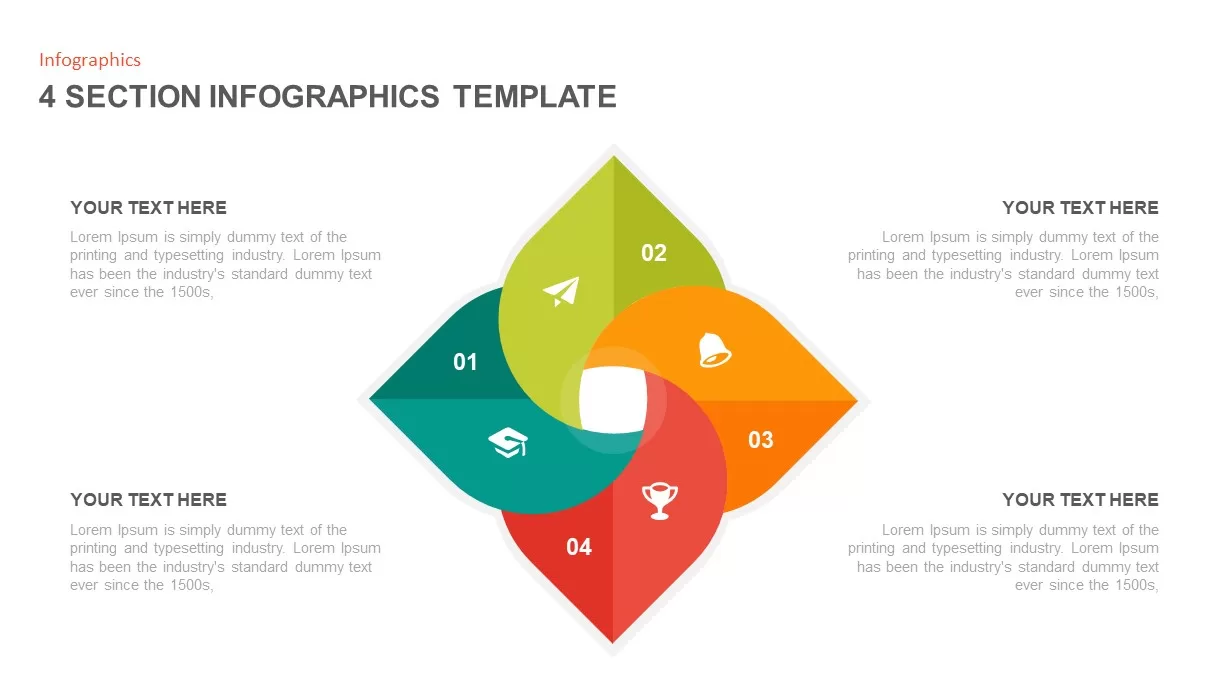
Four Section Diagram Infographics template for PowerPoint & Google Slides
Process
Four Section Infographic Diagram Template for PowerPoint & Google Slides
Circular
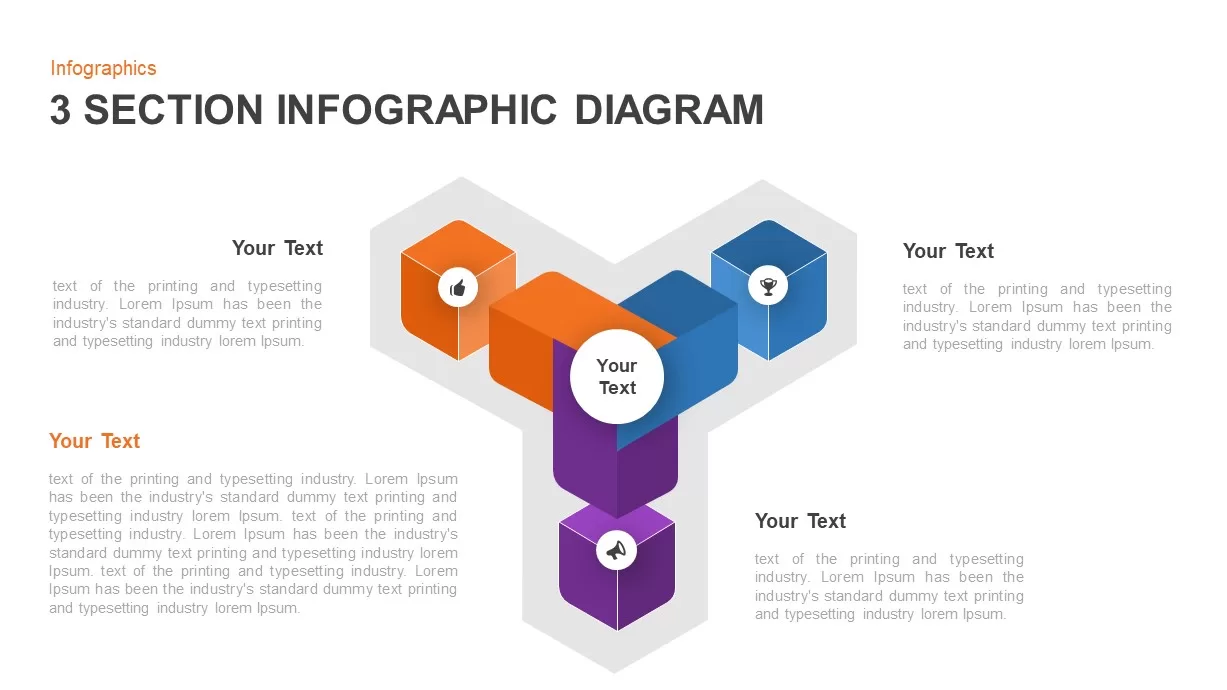
3 Section Infographic Diagram Template for PowerPoint & Google Slides
Process
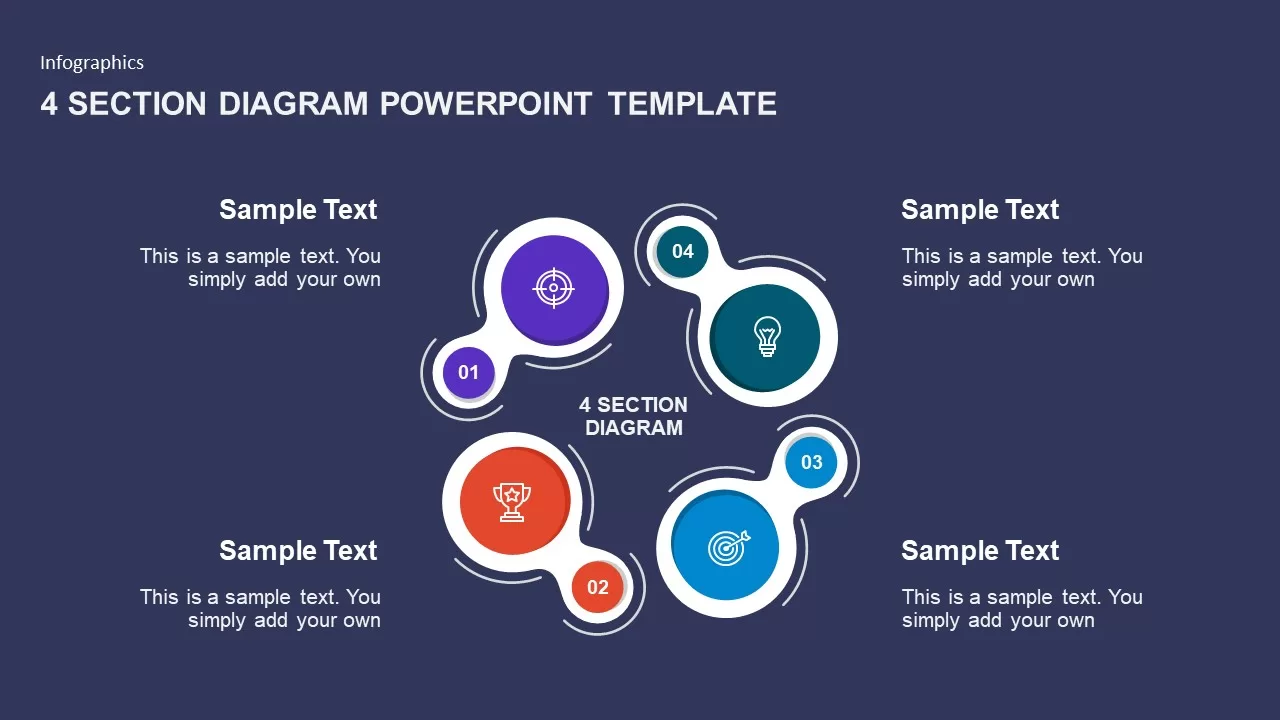
4 Section Diagram template for PowerPoint & Google Slides
Infographics
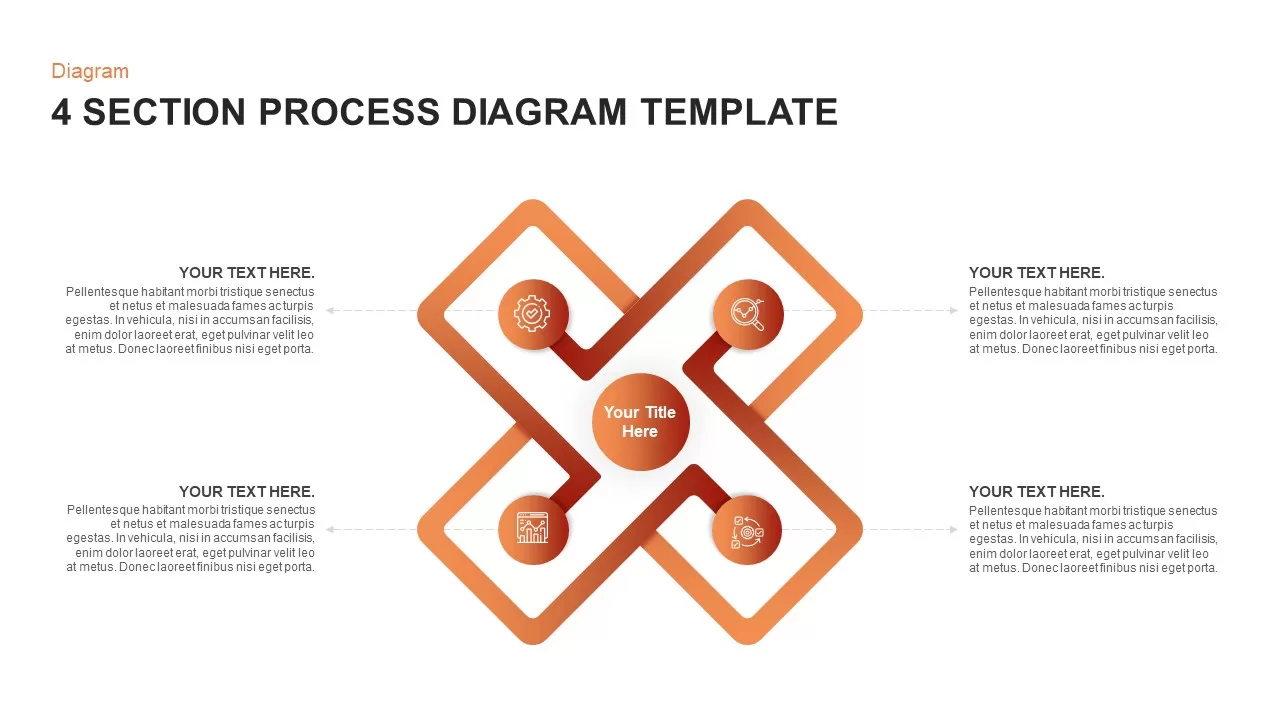
Modern 4 Section Process Diagram Template for PowerPoint & Google Slides
Process
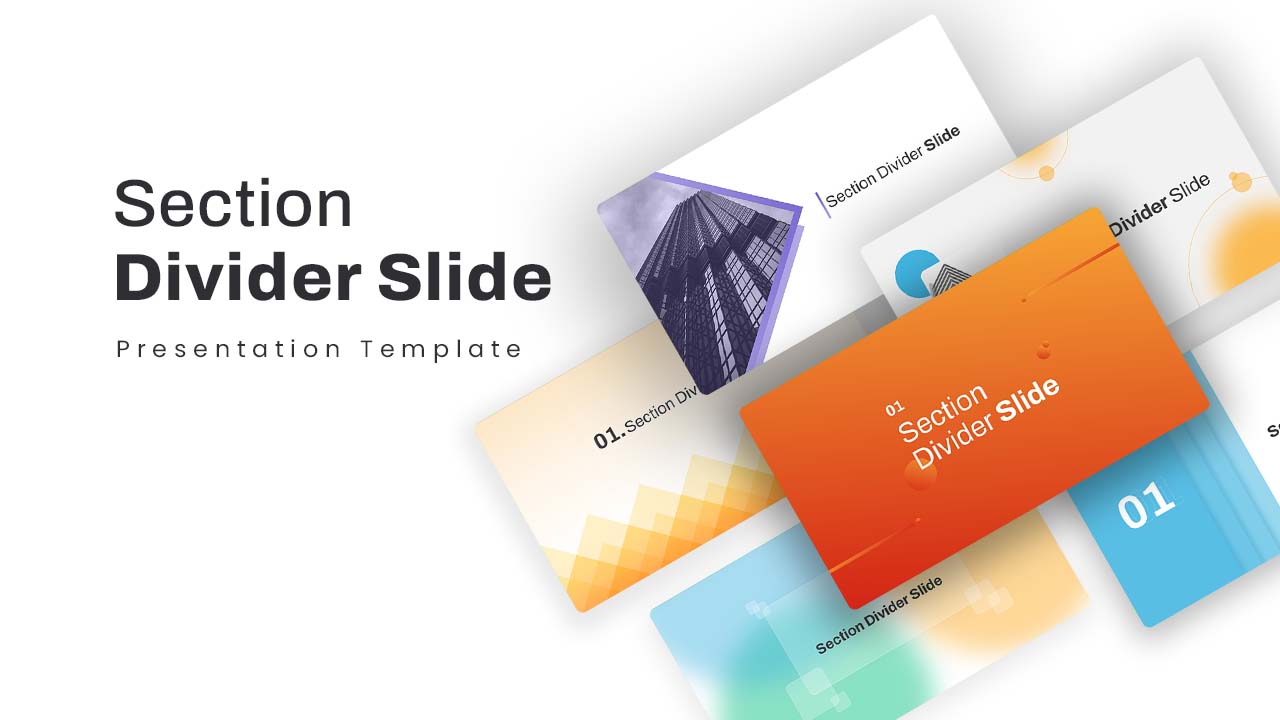
Creative Section Divider Slides Template for PowerPoint & Google Slides
Decks
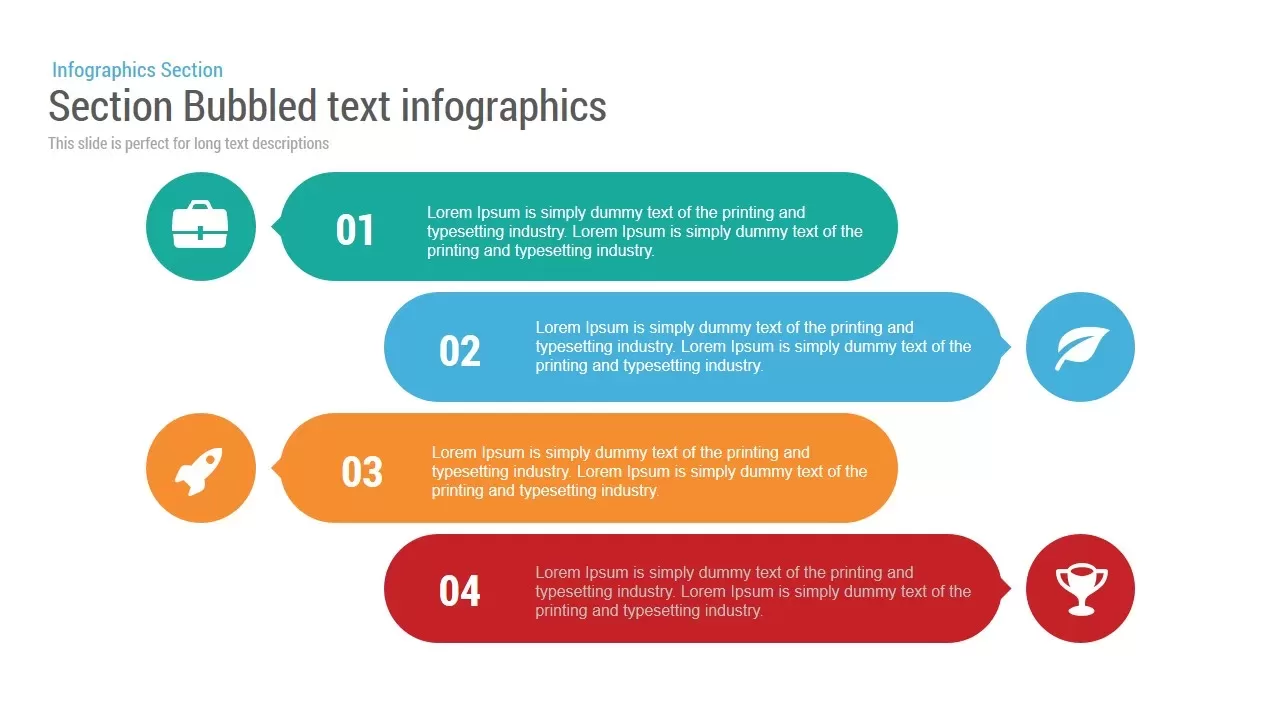
Section Bubbled Text template for PowerPoint & Google Slides
Infographics
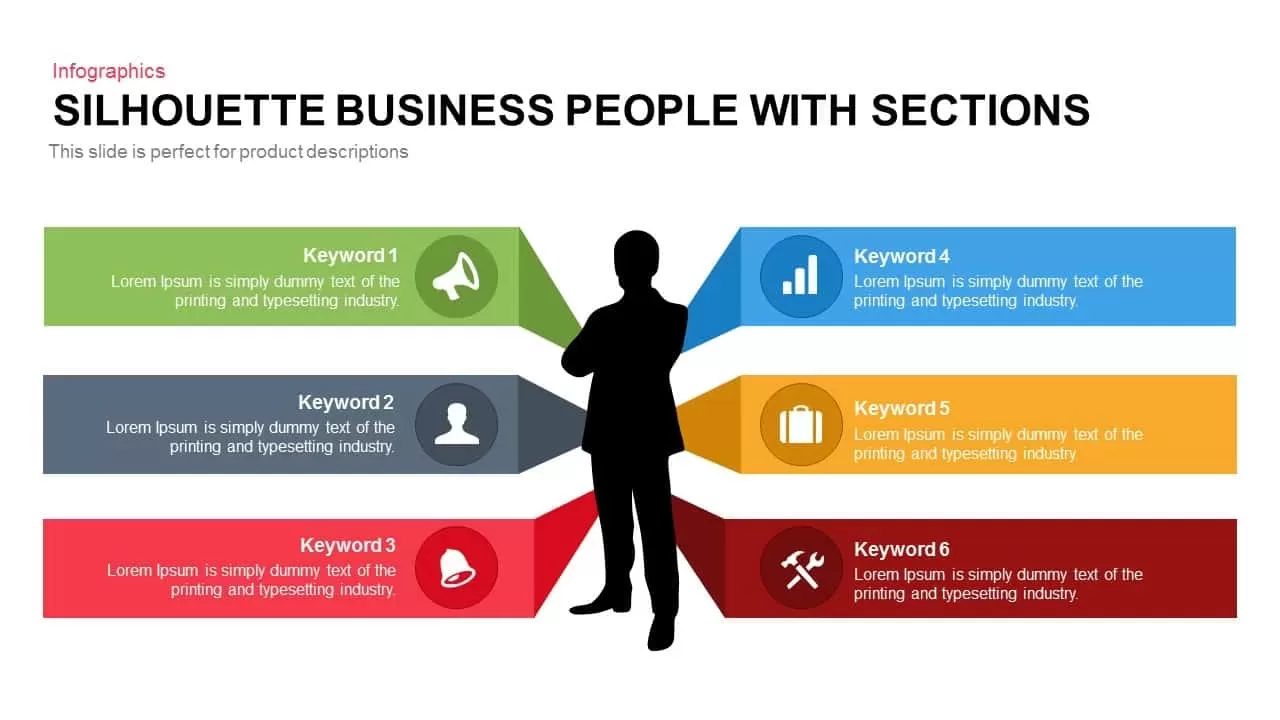
6-Section Silhouette template for PowerPoint & Google Slides
Arrow
Icon Section Flow template for PowerPoint & Google Slides
Process

Modern Ten-Block Section Title Chart template for PowerPoint & Google Slides
Comparison
Curved Five-Section Timeline Infographic template for PowerPoint & Google Slides
Timeline
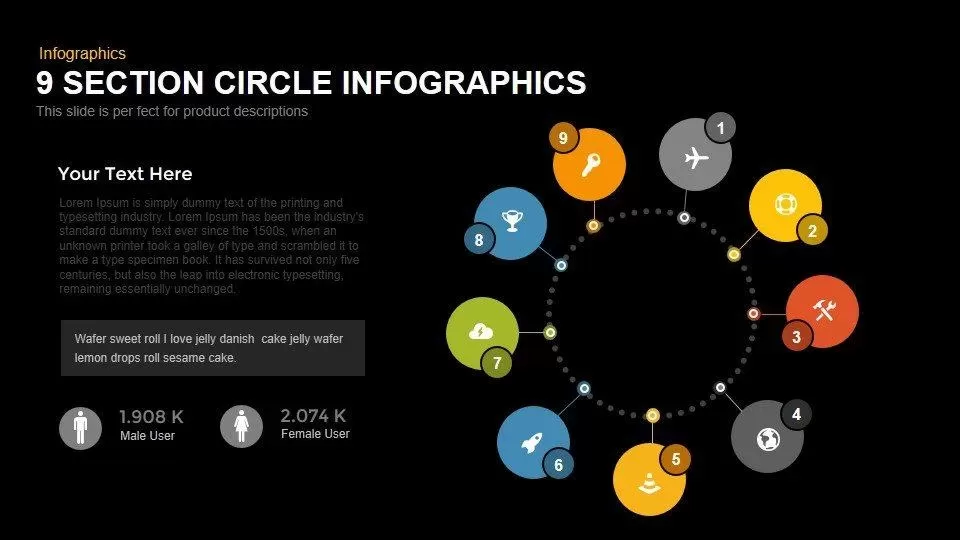
Modern 9-Section Circle Infographics Template for PowerPoint & Google Slides
Circular
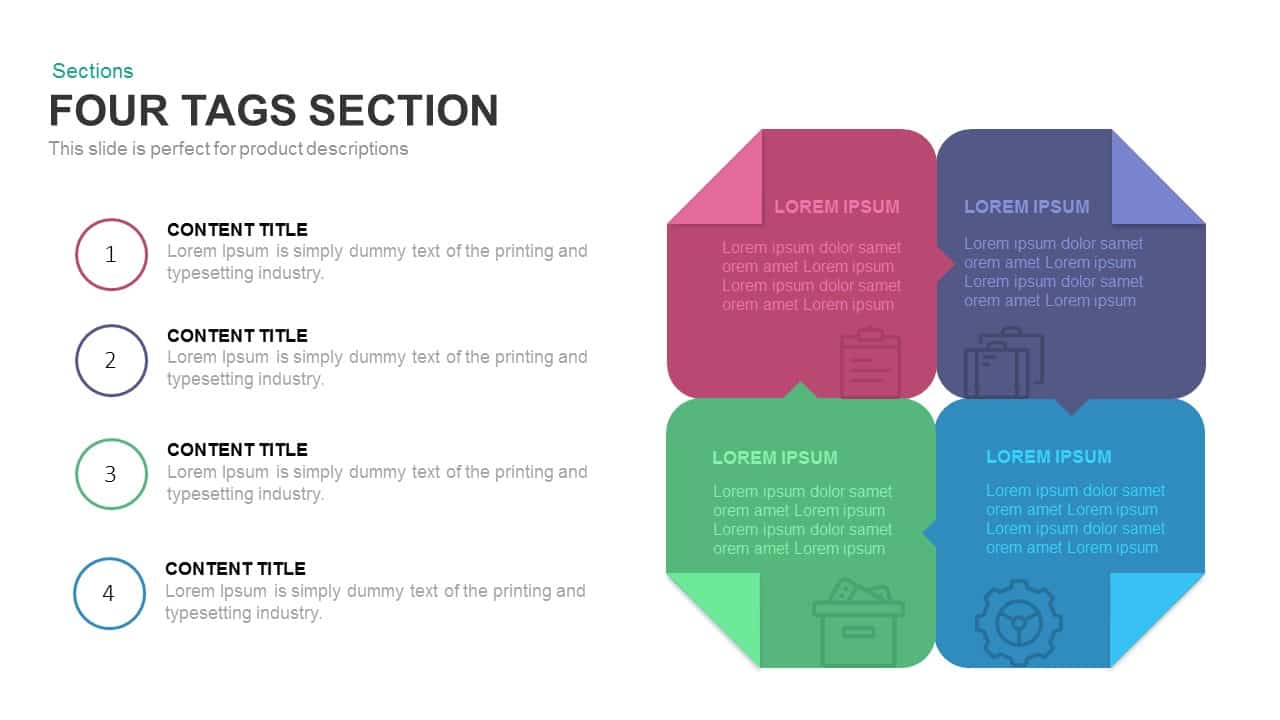
Four-Tag Section Ribbon Infographic Template for PowerPoint & Google Slides
Comparison
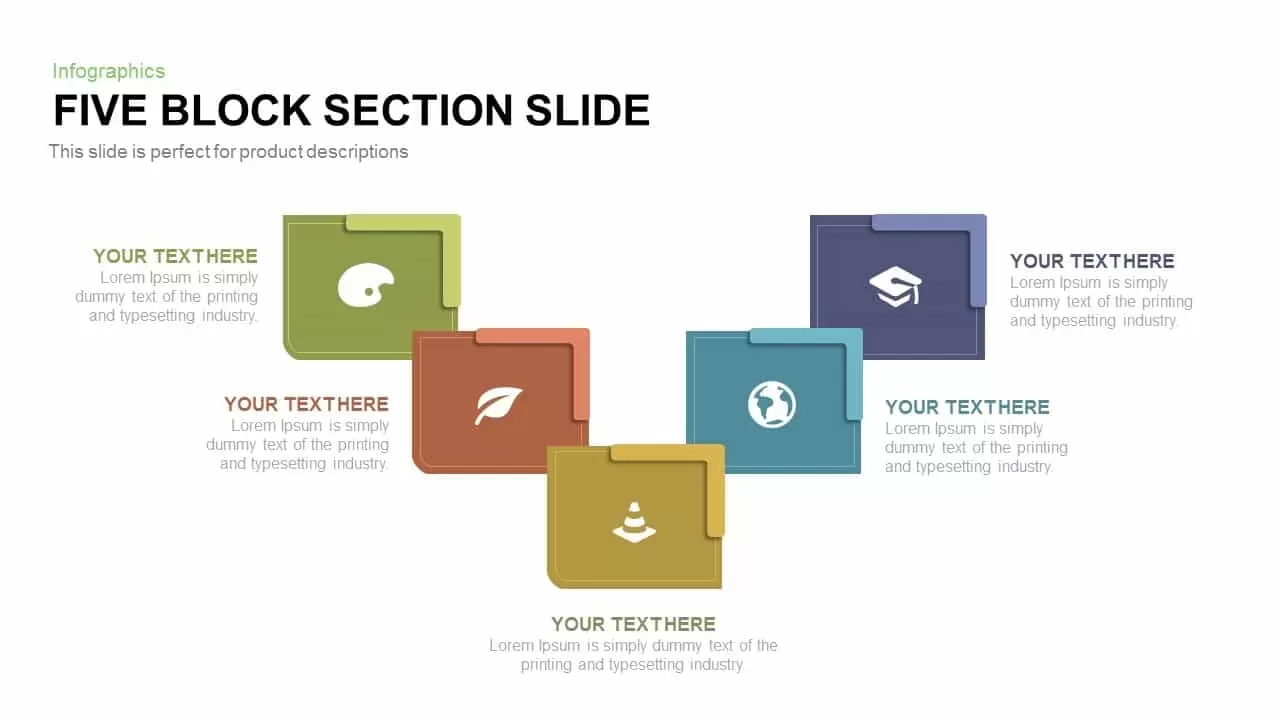
Five-Block Section Feature Highlights Template for PowerPoint & Google Slides
Comparison
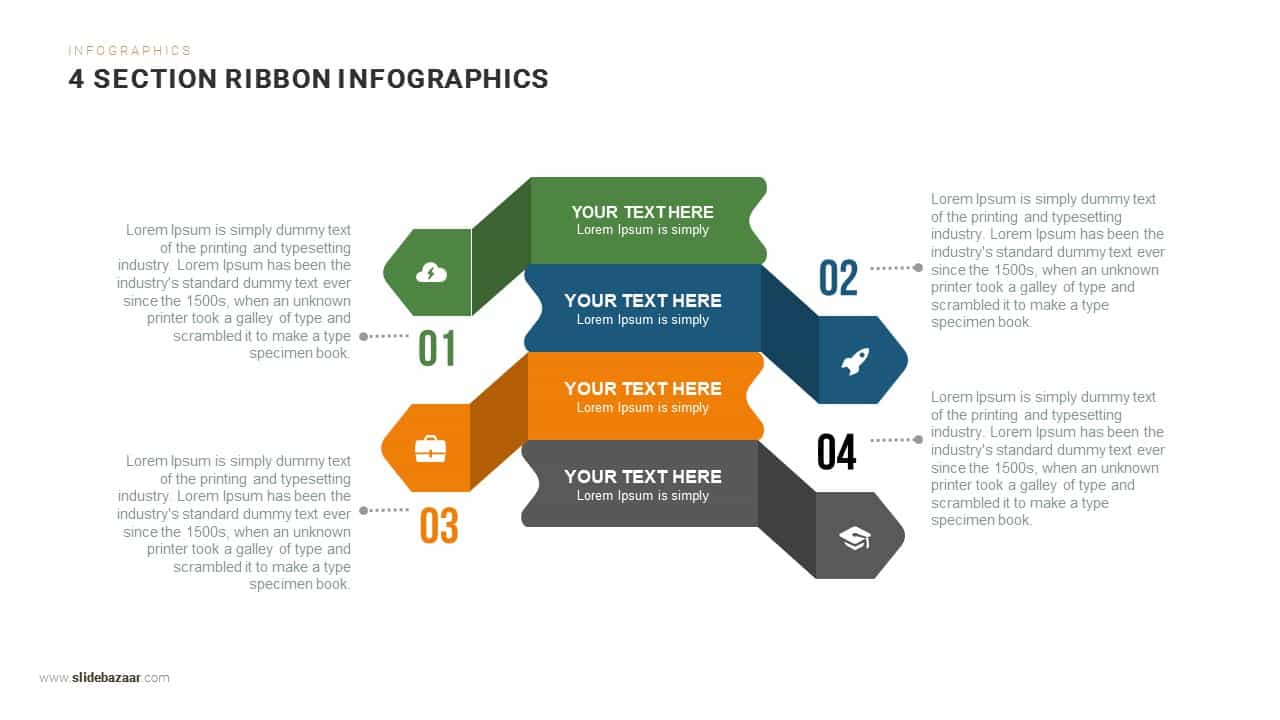
Four-Section Ribbon Infographics Template for PowerPoint & Google Slides
Process
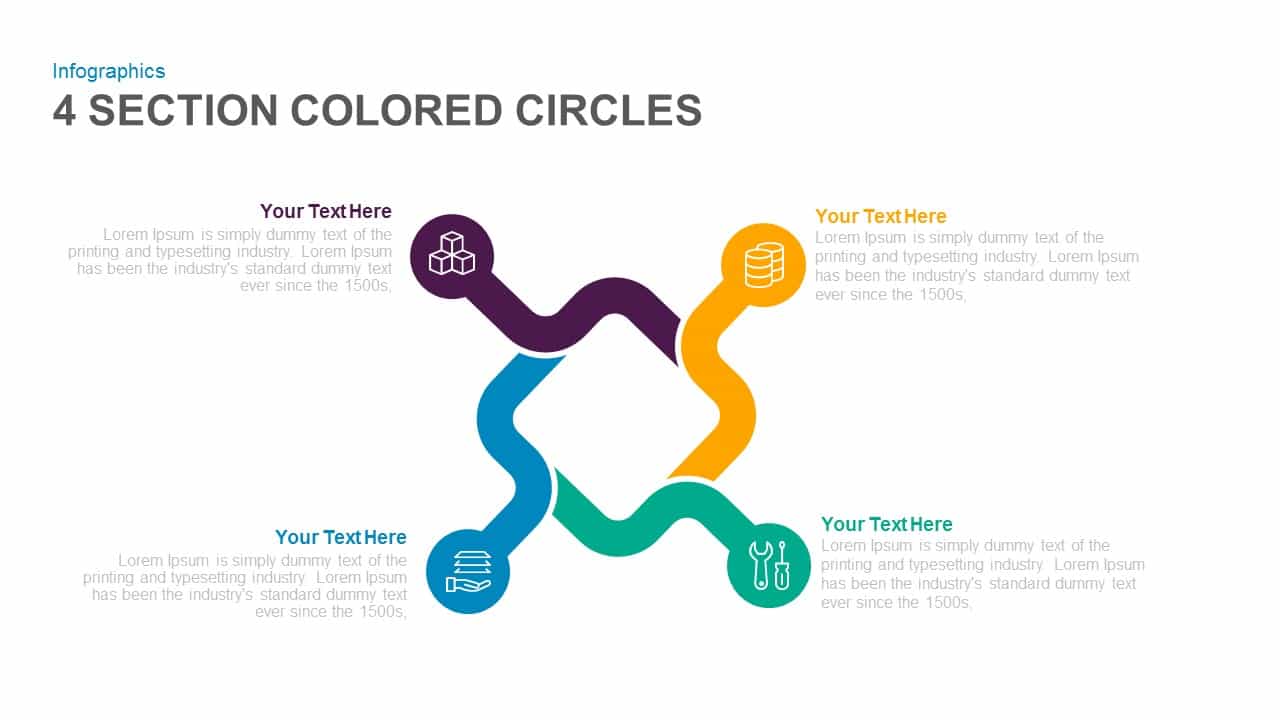
Four-Section Colored Circle Infographic Template for PowerPoint & Google Slides
Circular
Four Section Medical Process template for PowerPoint & Google Slides
Process
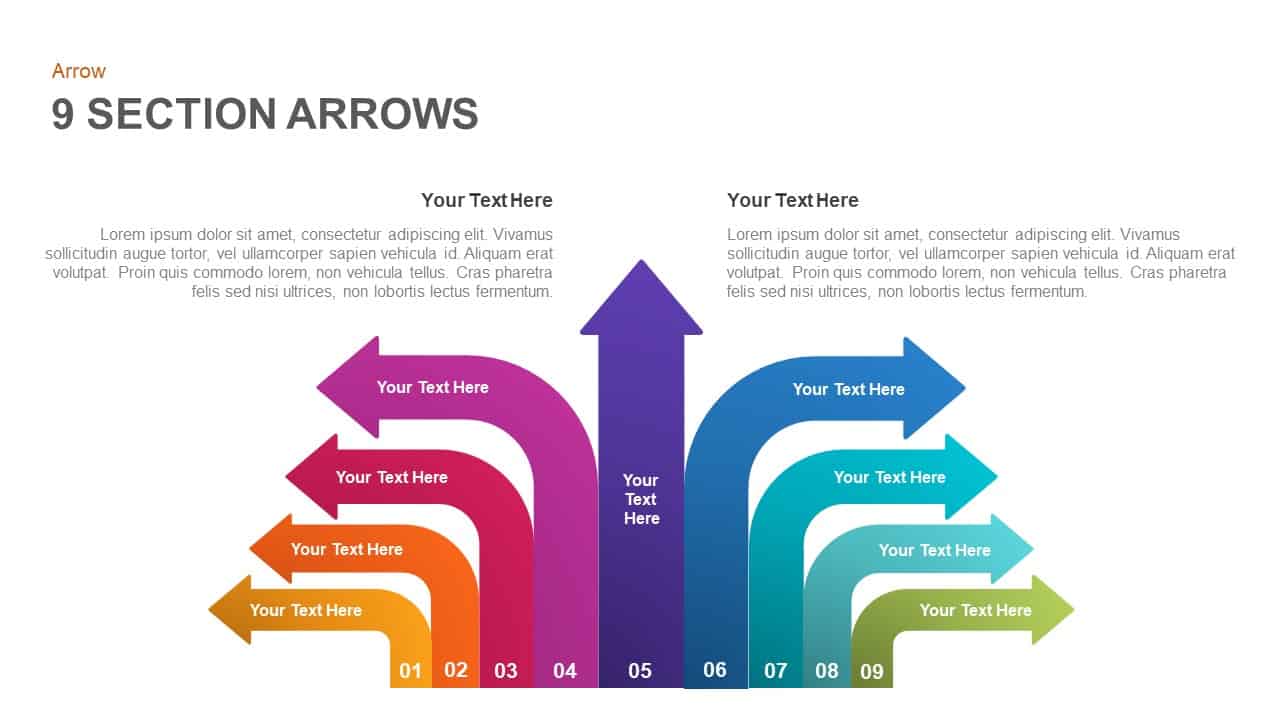
9-Section Diverging Arrows Infographic Template for PowerPoint & Google Slides
Arrow
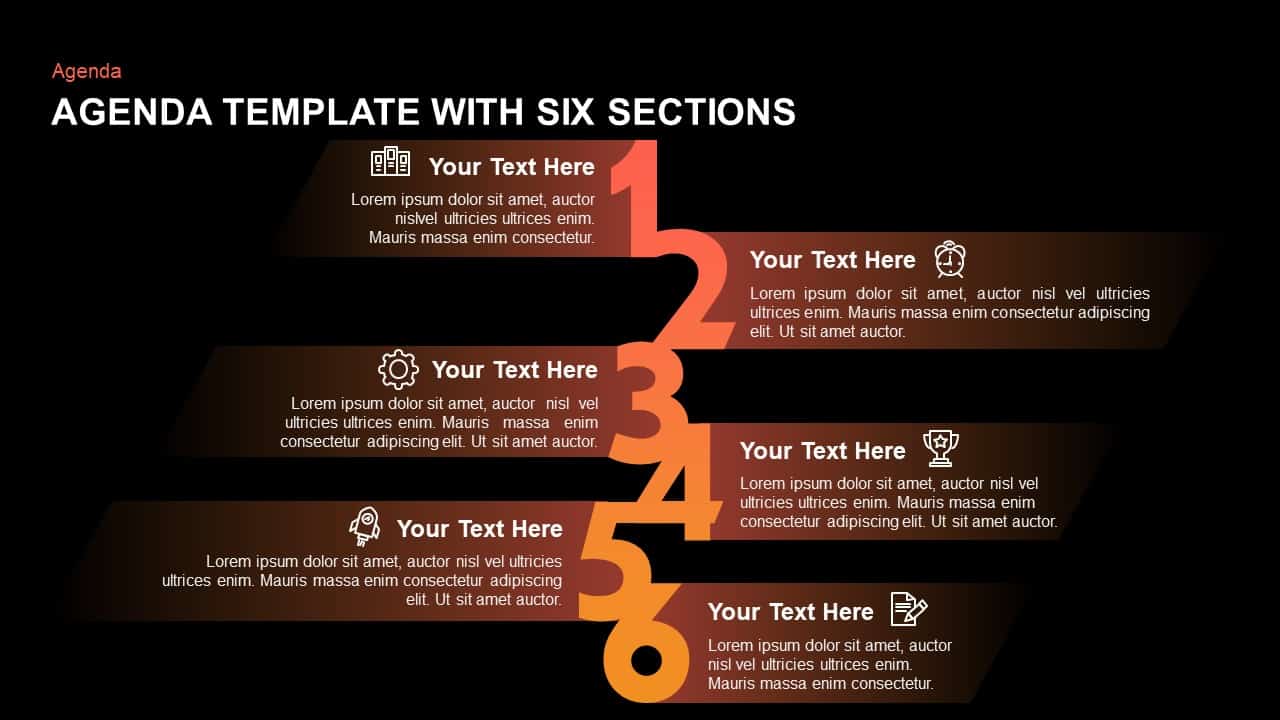
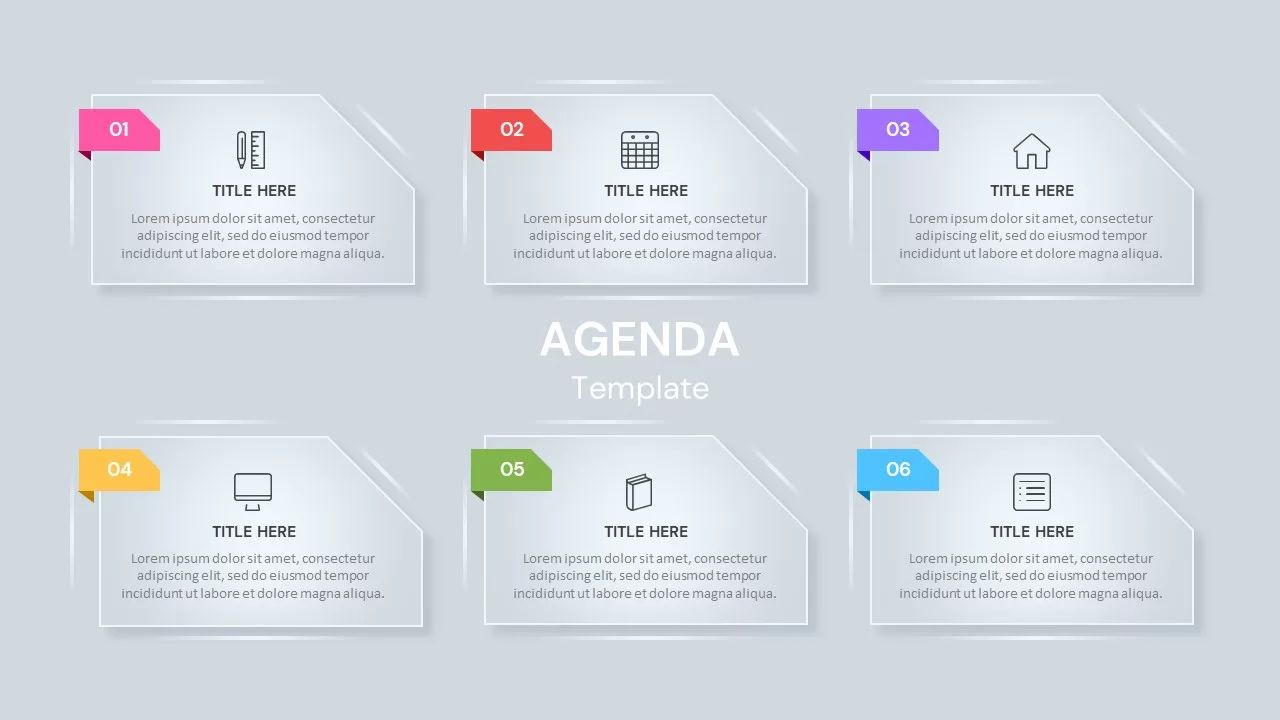
Six-Section Professional Agenda Template for PowerPoint & Google Slides
Agenda
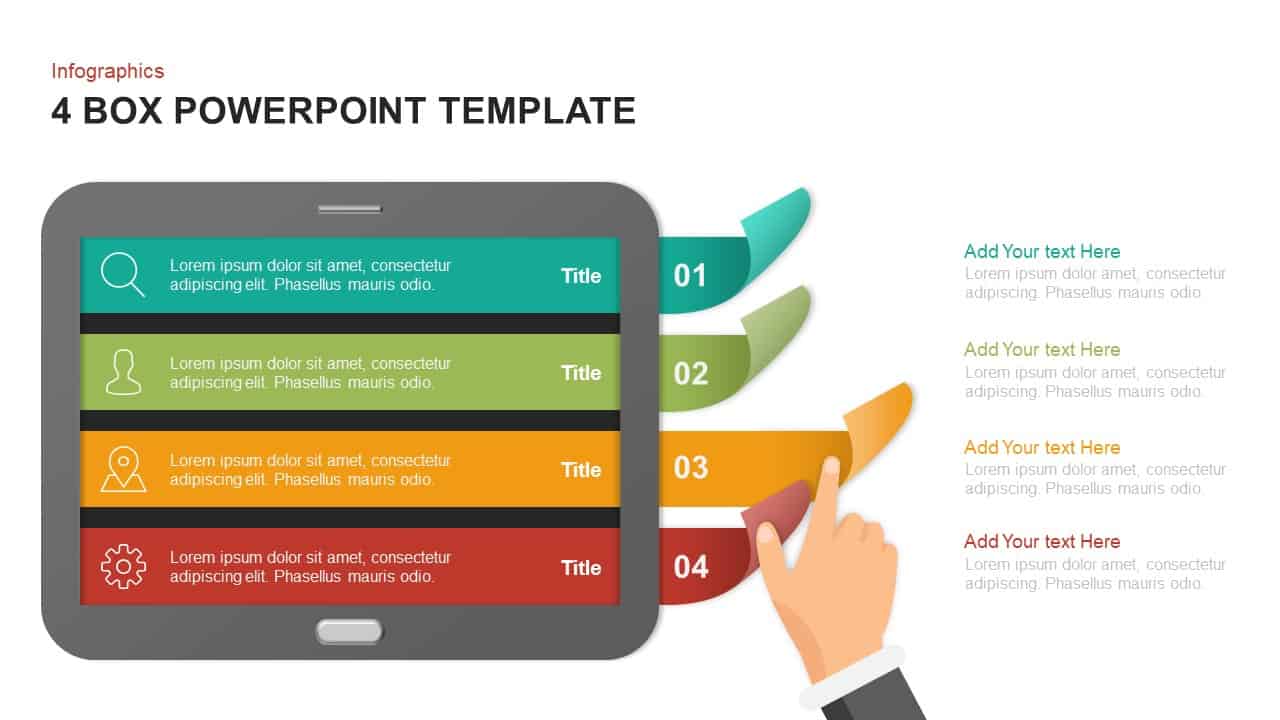
Tablet Four-Section Menu Interface Template for PowerPoint & Google Slides
Agenda
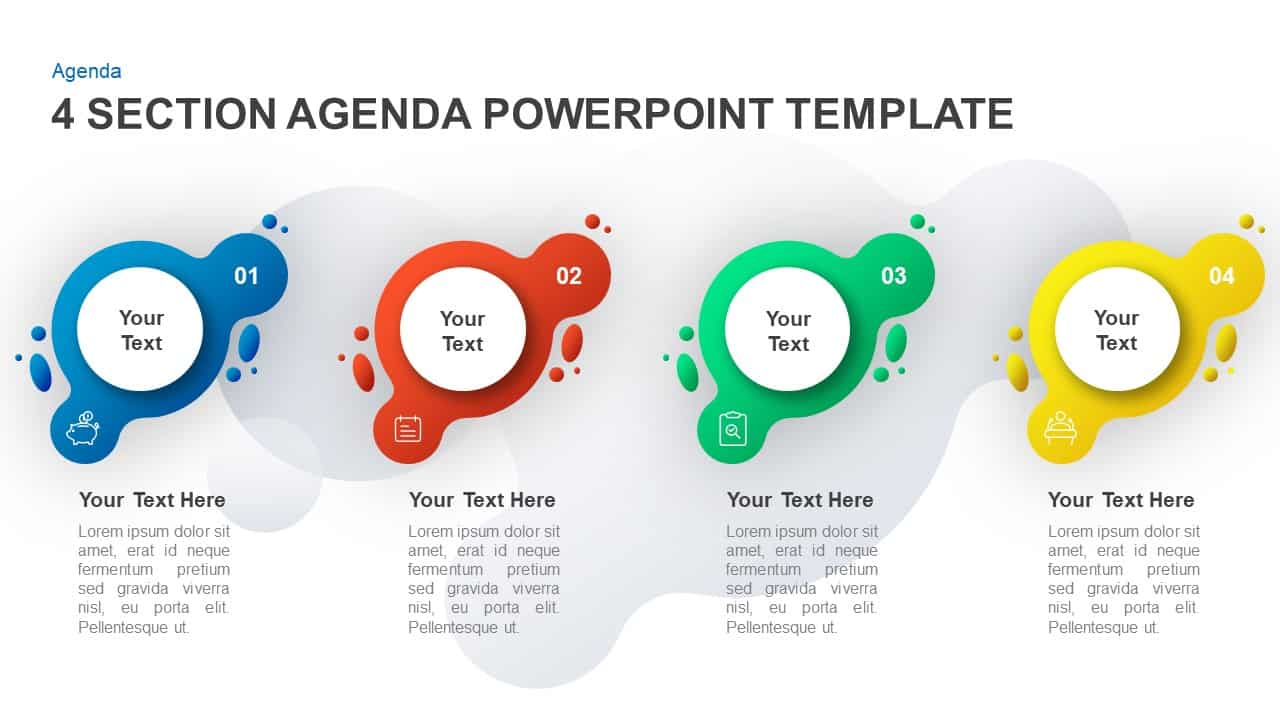
4-Section Agenda Blobs Infographic Template for PowerPoint & Google Slides
Agenda
Six-Section Color-Coded Agenda Template for PowerPoint & Google Slides
Agenda
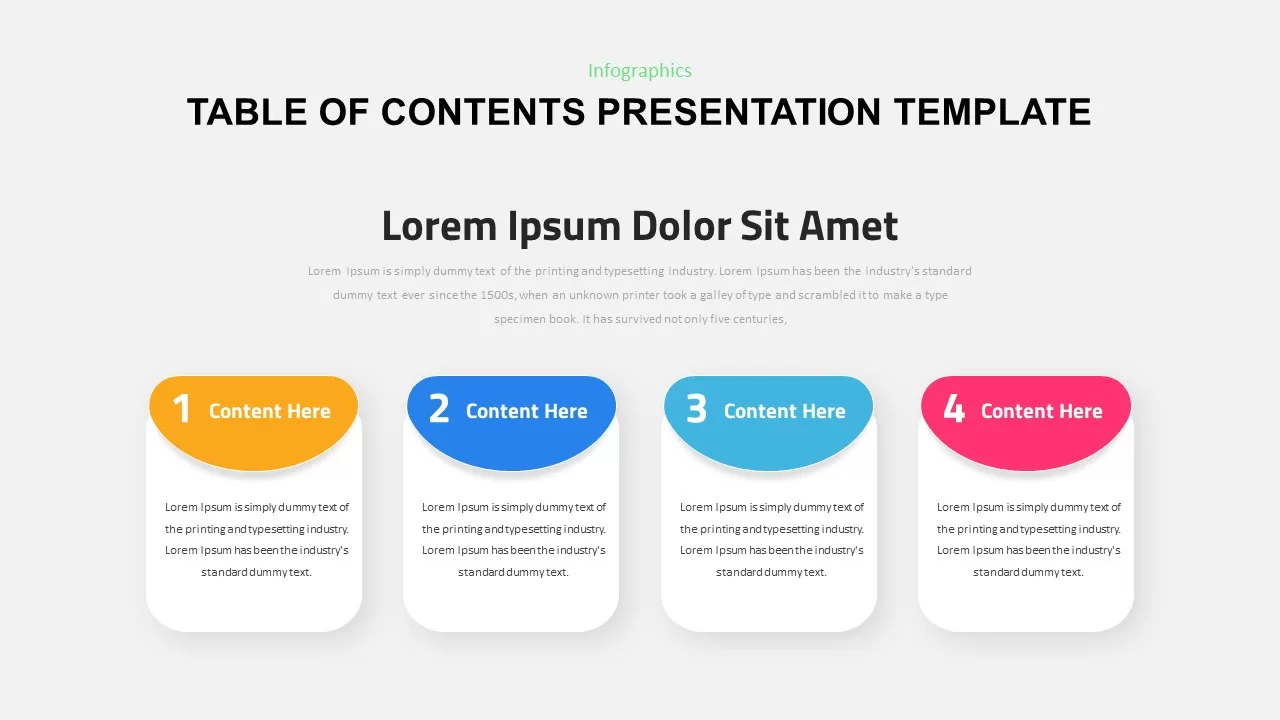
Four-Section Table of Contents Template for PowerPoint & Google Slides
Agenda
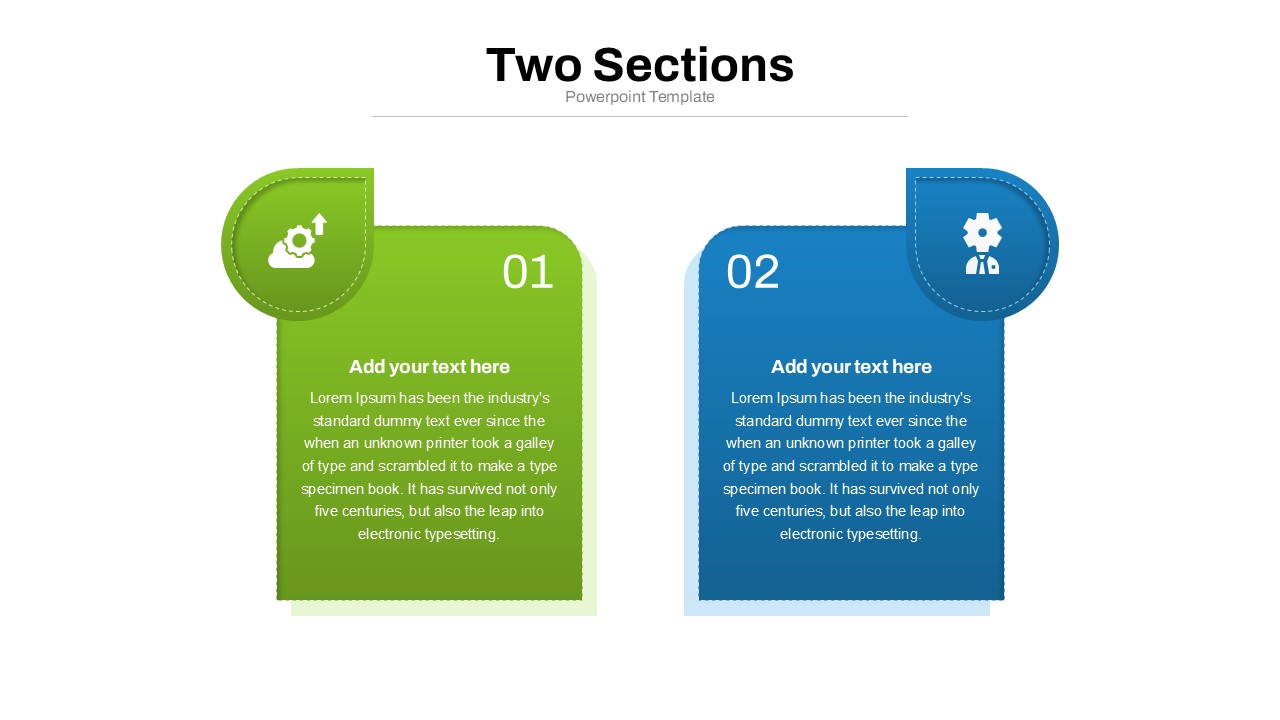
Two Section Comparison template for PowerPoint & Google Slides
Business Proposal
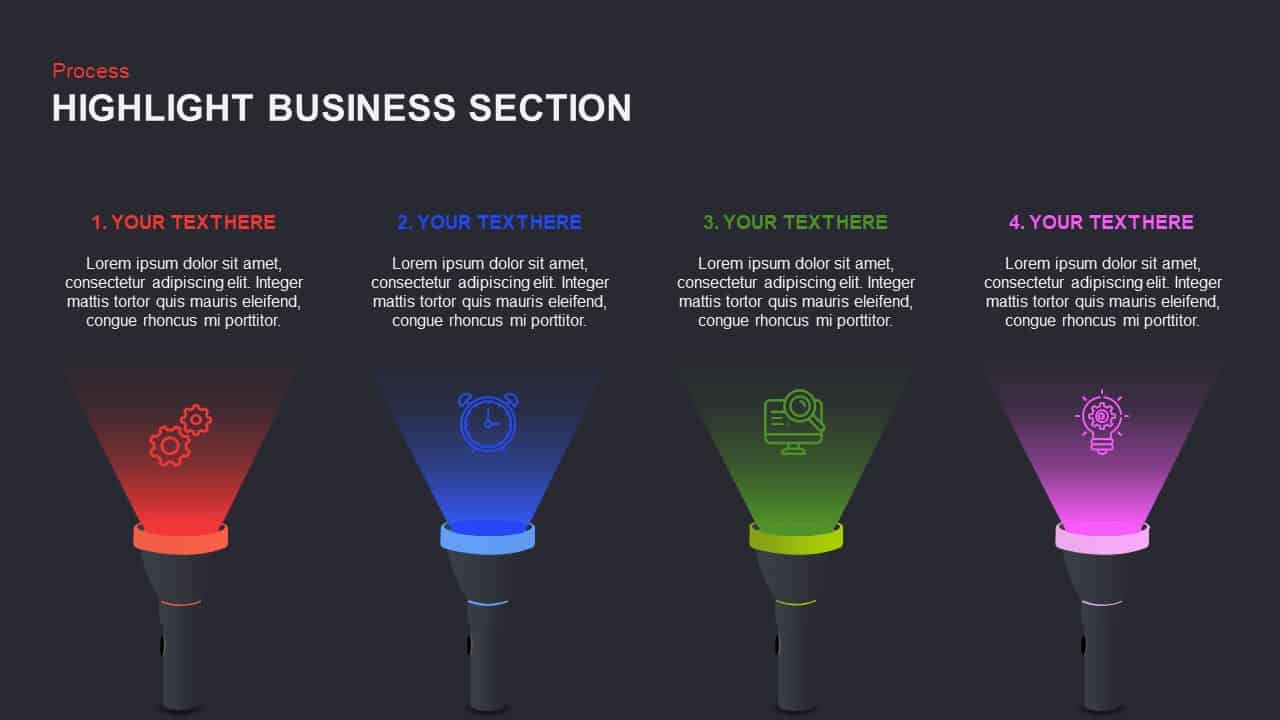
Highlight Business Section for PowerPoint & Google Slides
Process
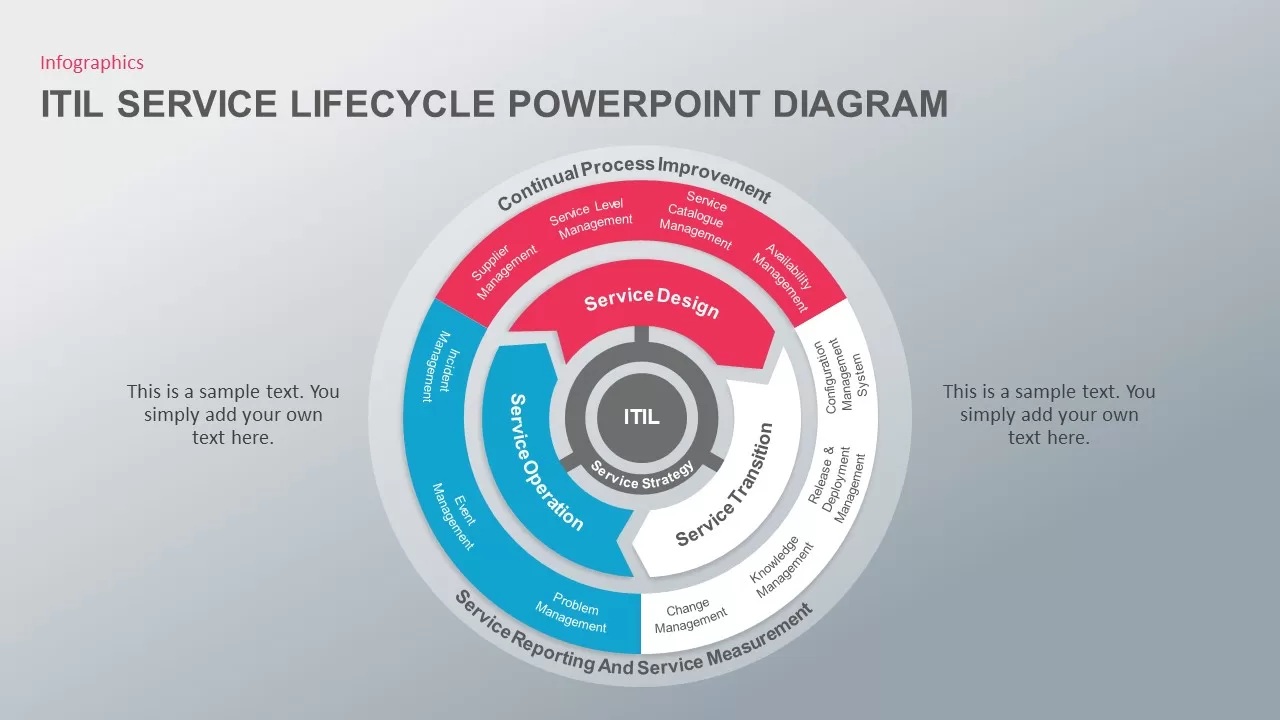
ITIL Service Lifecycle Circular Diagram Template for PowerPoint & Google Slides
Circular
Capacity Planning Circular Diagram Template for PowerPoint & Google Slides
Circular
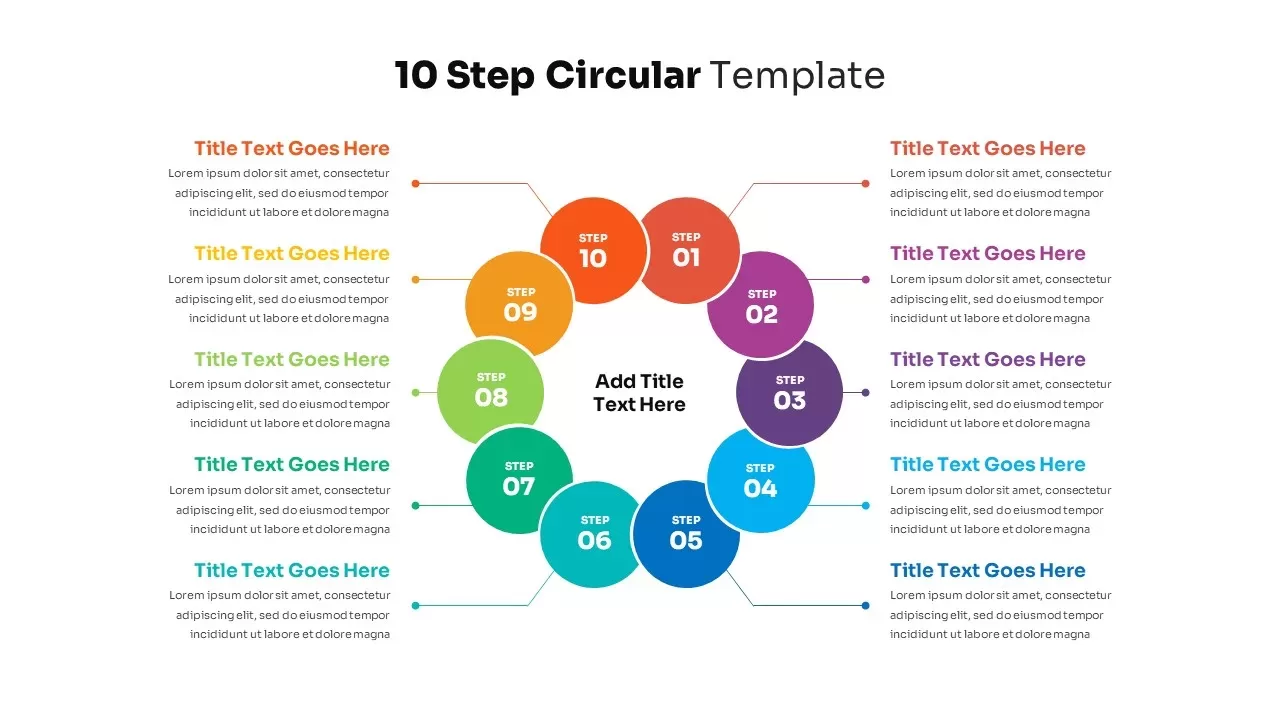
10-Step Circular Diagram Template for PowerPoint & Google Slides
Circular
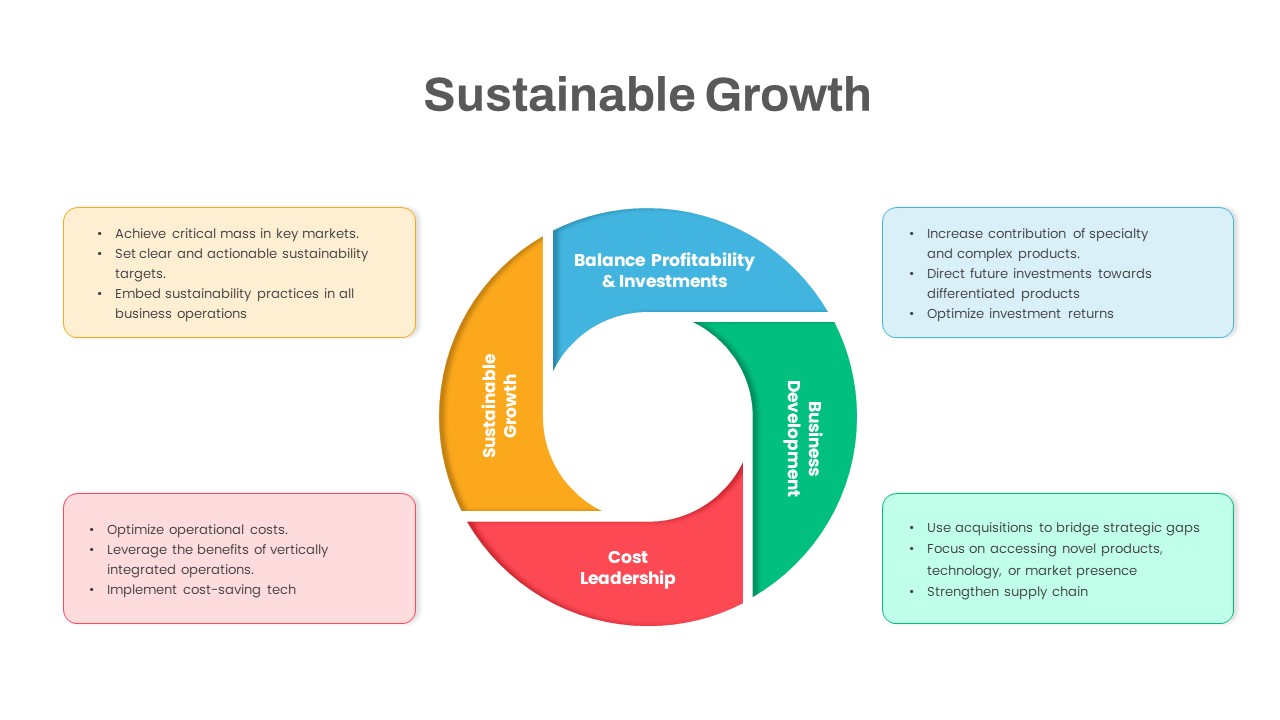
Sustainable Growth Circular Diagram Template for PowerPoint & Google Slides
Circular