Curved Five-Section Timeline Infographic template for PowerPoint & Google Slides

Five Section Timeline Template for PowerPoint & Google Slides
Presenting historical milestones, project implementation schedules, company growth trajectories, or phased product roadmaps requires a clean, sequential visual layout. A five section timeline template gives project leads, business strategists, startup founders, and executive presenters an intuitive timeline framework to illustrate chronological progress. Featuring a serpentine path connecting five distinct milestone nodes alongside key year markers, this slide converts complex historical data into an executive-ready presentation.
Map Chronological Milestones with a Curved 5-Stage Path
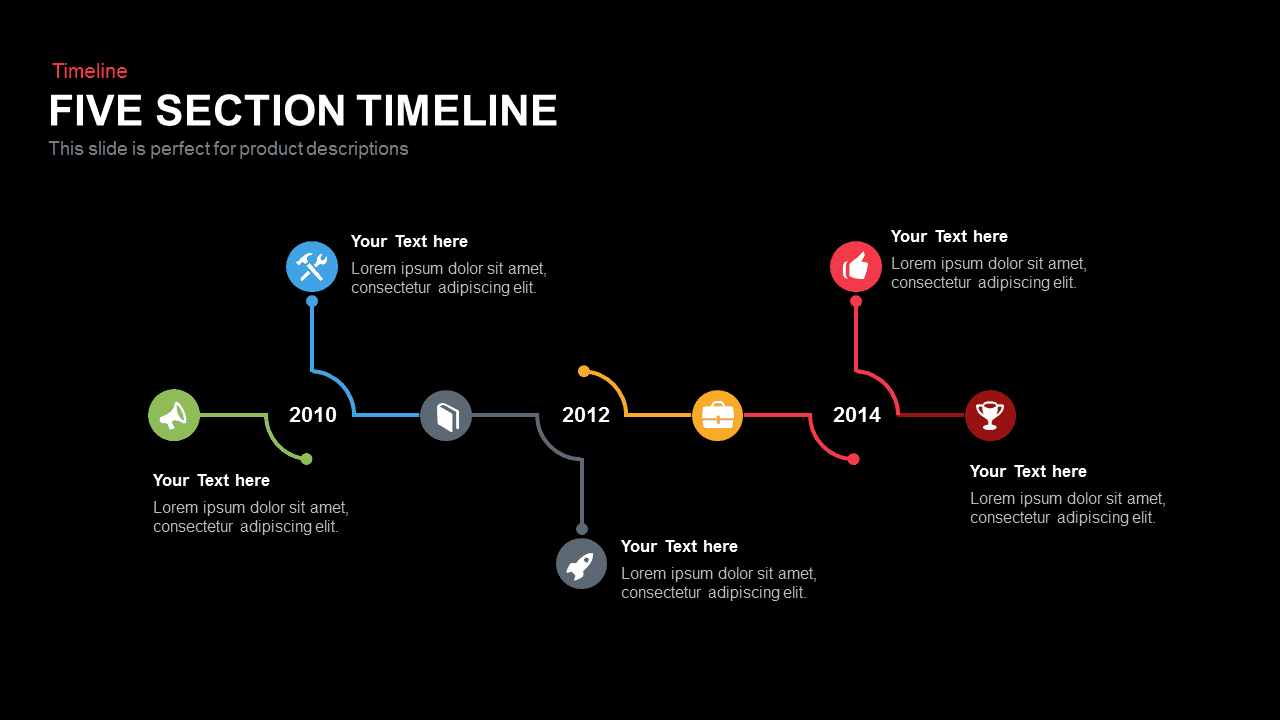
- Serpentine Milestone Path: A continuous, flowing timeline line connects five milestone nodes across distinct chronological points (2010, 2012, 2014) to establish clear historical momentum.
- Five Color-Coded Icon Nodes: Prominent circular badges anchor each key phase in vibrant, distinct colors:
- Megaphone Node (Green): Positioned at the timeline start to represent announcement, launch, or marketing initiation.
- Tools Node (Blue): Curved upward above the 2010 marker to signify development, engineering, or setup.
- Book Node (Slate Grey): Centered along the main path to denote documentation, research, or policy development.
- Rocket Node (Dark Grey): Branching downward below the 2012 marker to symbolize deployment, launch, or rapid growth.
- Briefcase Node (Gold/Yellow): Centered along the line to highlight business deals, management, or corporate expansion.
- Thumbs-Up Node (Bright Red) & Trophy Node (Dark Red): Positioned near the 2014 marker to emphasize success, milestone approval, and key achievements.
- Alternating Top and Bottom Callouts: Text containers (“Your Text here”) alternate above and below the timeline line, creating a balanced reading flow that maximizes canvas space.
- Fully Editable Shape Network: Effortlessly update year markers, edit text placeholders, adjust path line colors, swap vector icons, and customize formatting across major presentation platforms.
Whether you are detailing a company history timeline, presenting quarterly progress reports, or outlining multi-year strategic objectives to executive stakeholders, this five section timeline infographic ensures your narrative stays structured, clear, and visually engaging.
Login to download this file

Item ID
SB00329


Related Templates

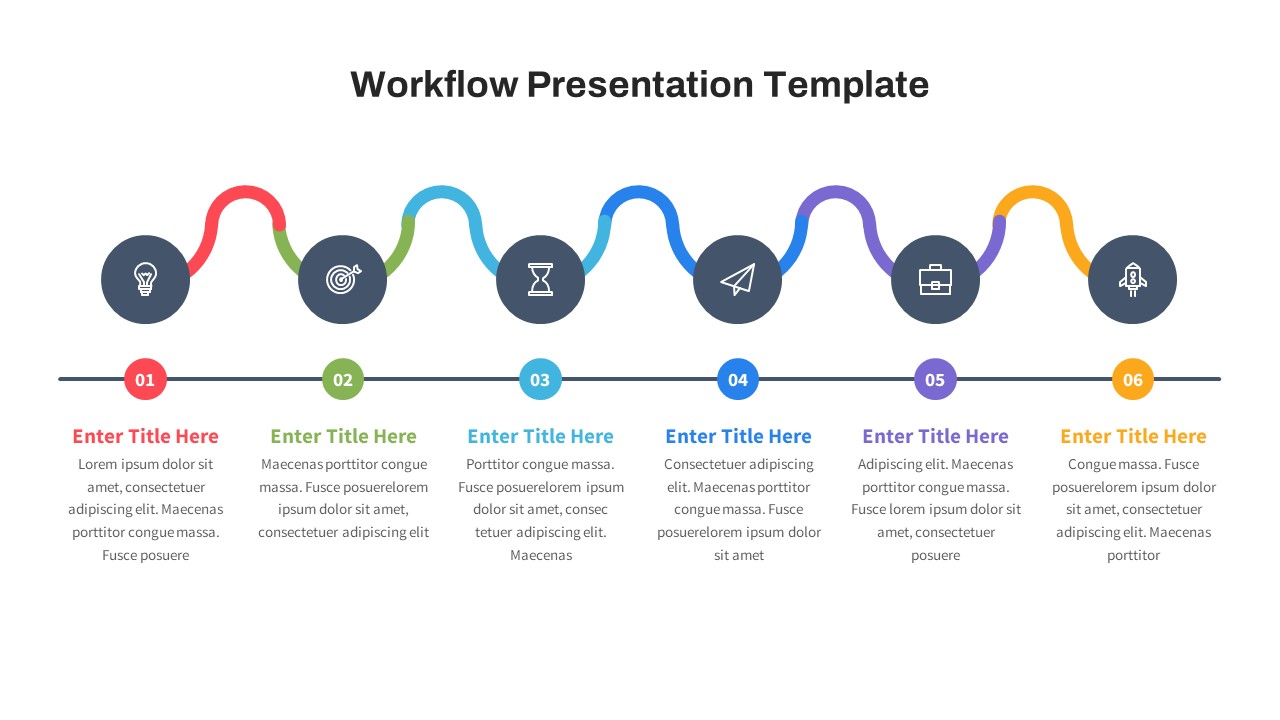
Free 6-Step Curved Workflow Timeline for PowerPoint & Google Slides
Timeline
Free
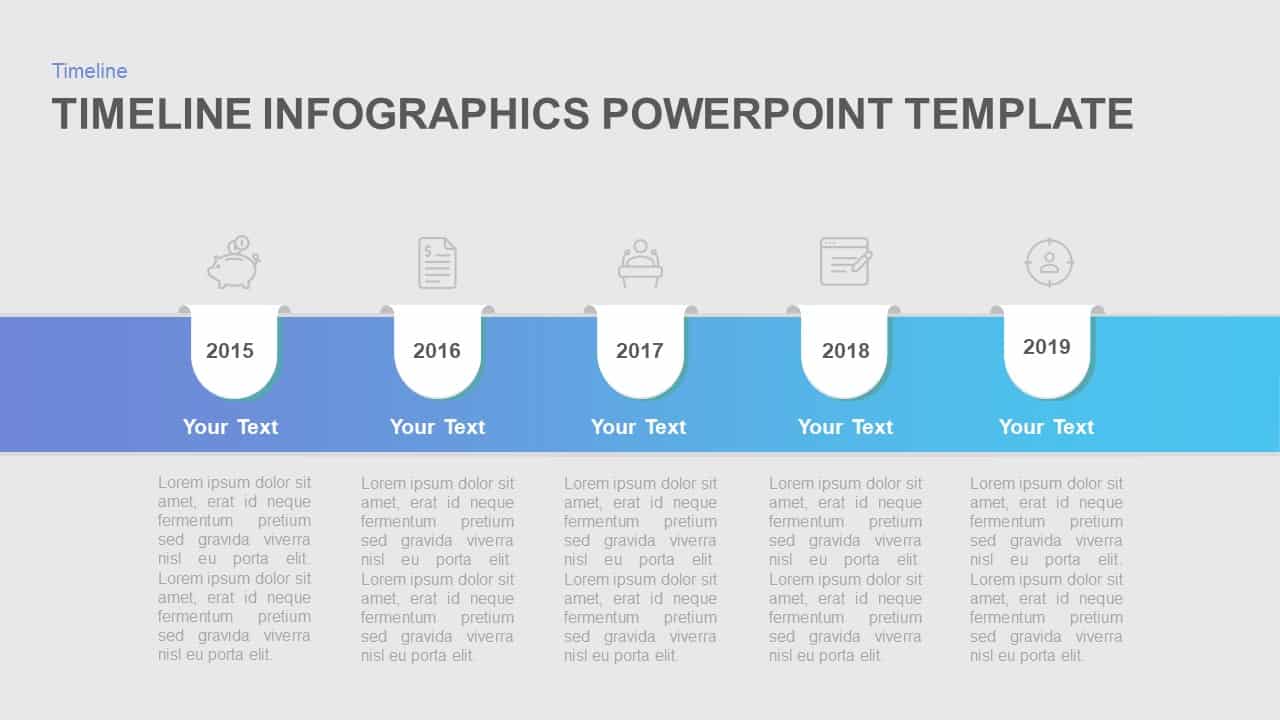
Five-Year Gradient Timeline Infographic Template for PowerPoint & Google Slides
Timeline
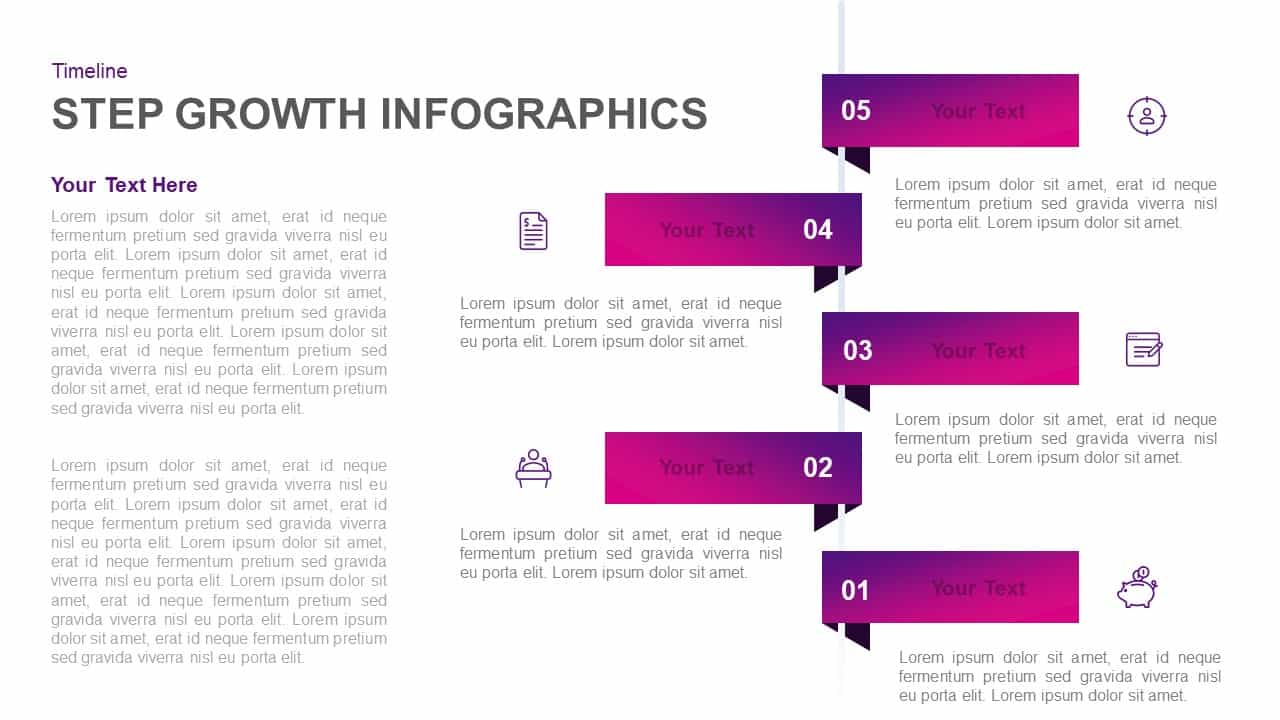
Five-Step Growth Timeline Infographic Template for PowerPoint & Google Slides
Timeline
Curved Arrow Infographic Template
Process
Free Curved Arrows Infographic
Project
Free
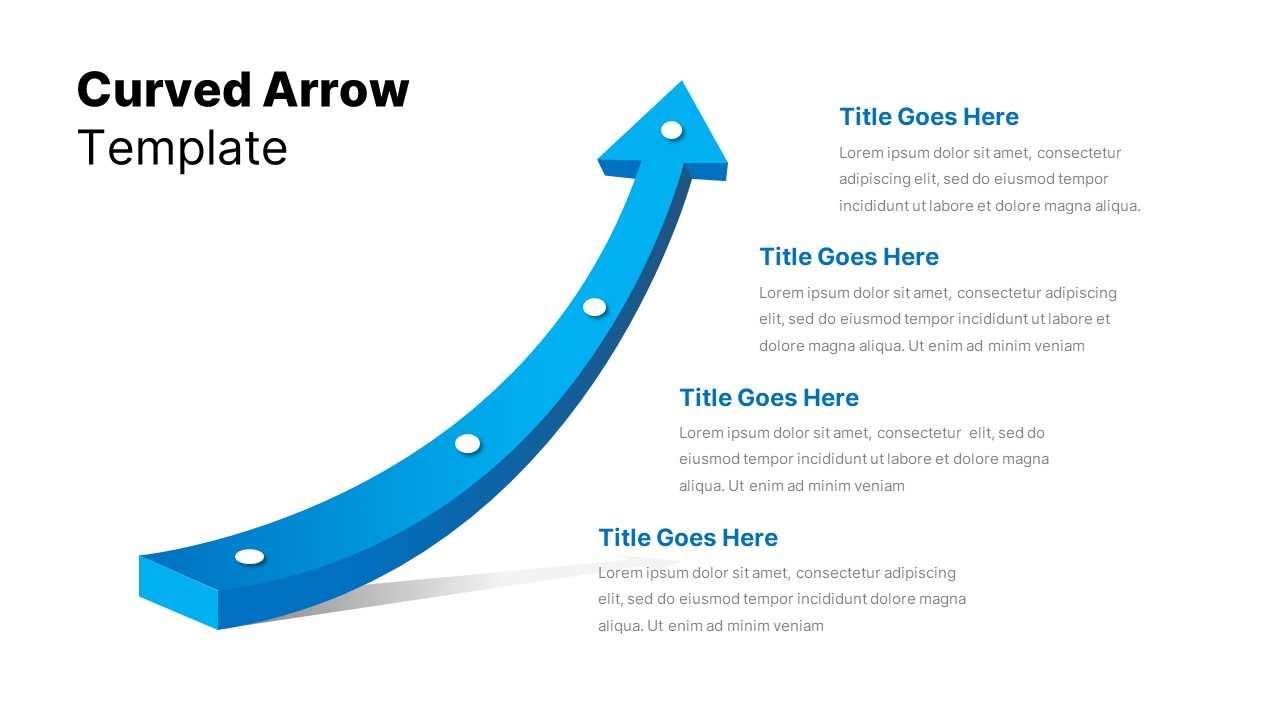
4 Step Curved Arrow Infographic
Arrow
Five-Stage Diamond Timeline Chart Template for PowerPoint & Google Slides
Timeline
Five-Year Ribbon Timeline Diagram Template for PowerPoint & Google Slides
Timeline
Five-Stage Sequential Tags Timeline Template for PowerPoint & Google Slides
Timeline
Five-Step Cascade Diagram & Timeline Template for PowerPoint & Google Slides
Process
Text-Only Five-Phase Timeline Template for PowerPoint & Google Slides
Timeline
Colorful Curved Roadmap Phases Template for PowerPoint & Google Slides
Roadmap
Curved Roadmap with Iconic Signposts Template for PowerPoint & Google Slides
Roadmap
Dynamic Curved Arrow Process Roadmap Template for PowerPoint & Google Slides
Process
Curved Arrow Flow Diagram template for PowerPoint & Google Slides
Business
Curved Arrow Process Flow template for PowerPoint & Google Slides
Process
Curved 8Ps of Marketing Diagram Template for PowerPoint & Google Slides
Marketing
Curved Roadmap Concept for PowerPoint and Google Slides
Roadmap
Curved Arrow Template for PPT & Google Slides Themes
Process
Curved Arrow template for PPT & Google Slides Themes
Process