E-commerce Analytics Dashboard Template for PowerPoint & Google Slides

Description
Leverage this e-commerce analytics dashboard slide to visualize online performance metrics and growth trends with a modern dark-theme layout. The left side features a stylized computer monitor mockup displaying summary bars and a rising yellow trend arrow emerging from the screen, symbolizing key KPIs such as conversion rate or revenue uplift. On the right, a bold percentage placeholder (e.g., 94%) draws focus to critical performance indicators, while a multi-series bar column chart beneath compares data across segments with contrasting orange, teal, and golden bars. The vibrant elements pop against the black background, ensuring clarity on large displays, shared digital documents, or printed handouts.
Built on editable master slides for both PowerPoint and Google Slides, this template features vector-based graphics and intuitive placeholders that let you update percentage values, replace color swatches, or swap out legend icons in seconds. Adjust bar heights, edit text blocks, or recolor elements to reflect your brand identity without disrupting slide integrity. With neatly organized layers and alignment guides, users can maintain consistent formatting and accelerate slide creation, reducing preparation time and eliminating version control issues across teams.
Use optional animations to reveal the trend arrow, metrics, and chart bars sequentially, guiding audience attention through your narrative. The flat design, crisp typography, and subtle shadows enhance readability in both dimly lit boardrooms and video conferences. The responsive layout adapts seamlessly to different aspect ratios, making it ideal for executive briefings, marketing presentations, or quarterly business reviews.
Beyond e-commerce analytics, repurpose this slide to track marketing funnel performance, product launch impact, website traffic segmentation, or customer lifetime value analysis. Duplicate chart elements to compare date ranges or add callouts to highlight anomalies. This slide serves as a versatile asset for data-driven storytelling in any industry.
Who is it for
E-commerce managers, digital marketers, and data analysts will find this slide indispensable for conveying online performance insights and conversion trends. Marketing teams can showcase campaign ROI, while C-suite executives can review live metrics at a glance. Analytics consultants and product leaders can also adapt the layout for A/B testing results or quarterly dashboards.
Other Uses
Repurpose this template for tracking marketing funnel metrics, website traffic breakdowns, or social media engagement rates. Extend the chart elements to compare year-over-year performance, or replace the trend arrow with other icons to illustrate process flows. Ideal for investor pitch decks, training modules, and strategic planning workshops.
Login to download this file

Item ID
SB00259
Related Templates

Product Usage Analytics Dashboard Chart Template for PowerPoint & Google Slides
Bar/Column

Data Analytics Dashboard Design template for PowerPoint & Google Slides
Bar/Column
Business Dashboard Analytics & KPIs Template for PowerPoint & Google Slides
Bar/Column
Social Media Analytics Dashboard Template for PowerPoint & Google Slides
Digital Marketing

Free Data Analytics Dashboard Template for PowerPoint
Charts
Free
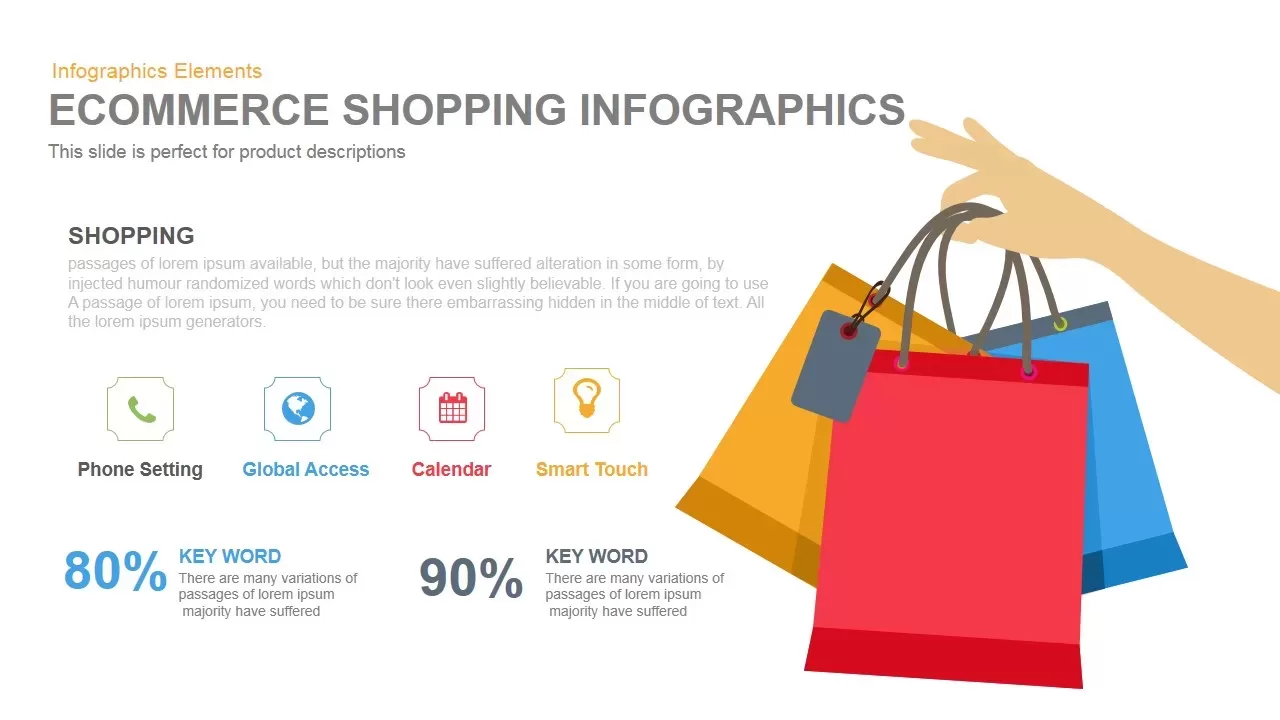
E-commerce Shopping template for PowerPoint & Google Slides
Marketing
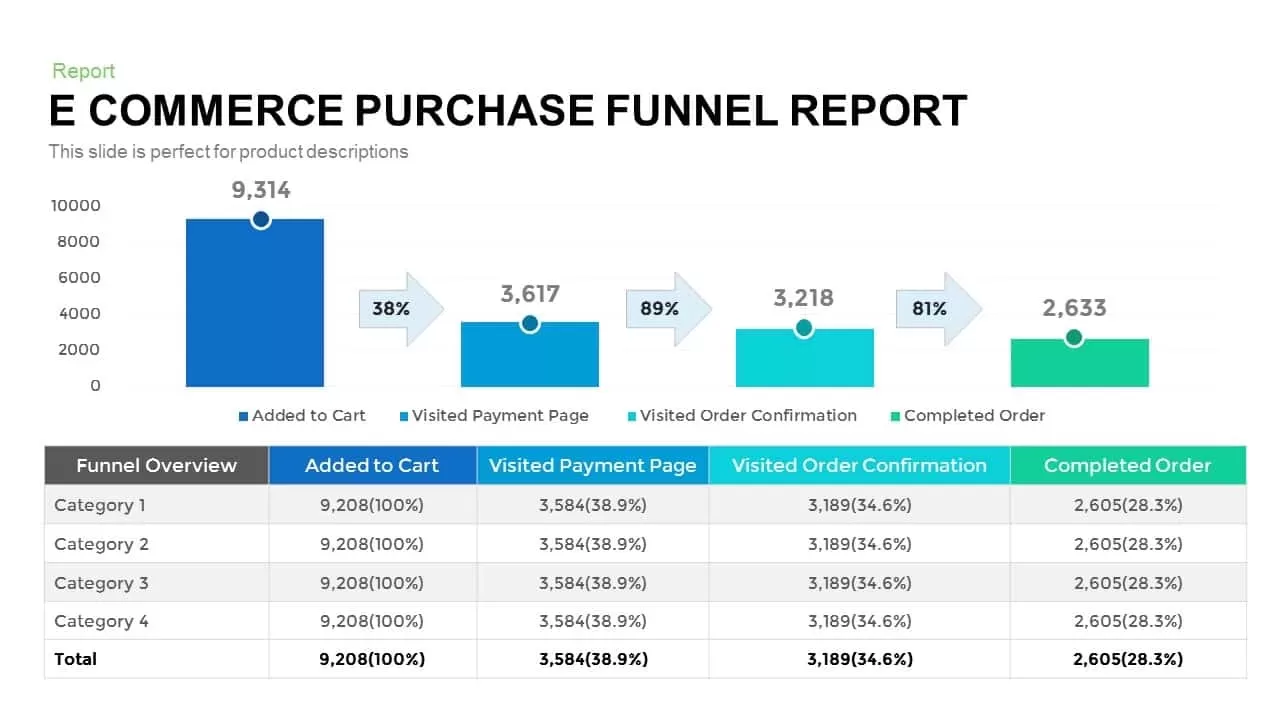
E-commerce Purchase Funnel Report template for PowerPoint & Google Slides
Funnel
E-commerce Company Profile Presentation Template for PowerPoint & Google Slides
Company Profile
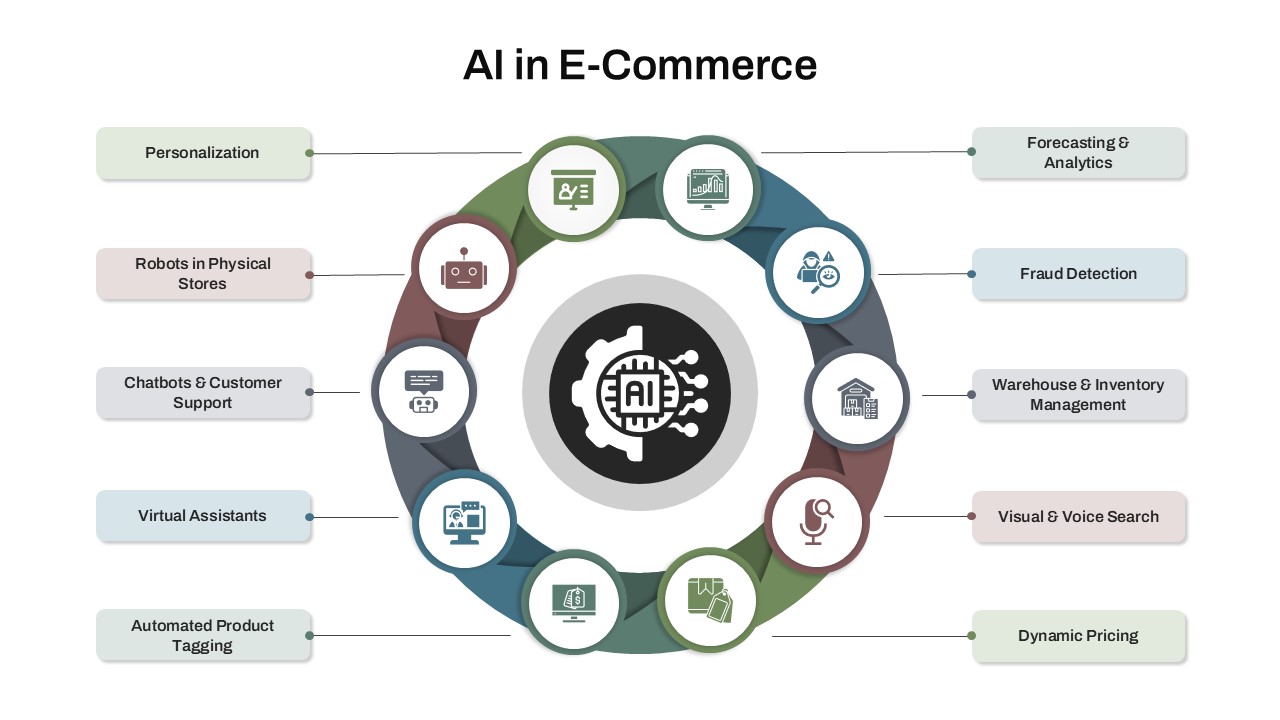
AI in E-Commerce Circular Infographic Template for PowerPoint & Google Slides
AI
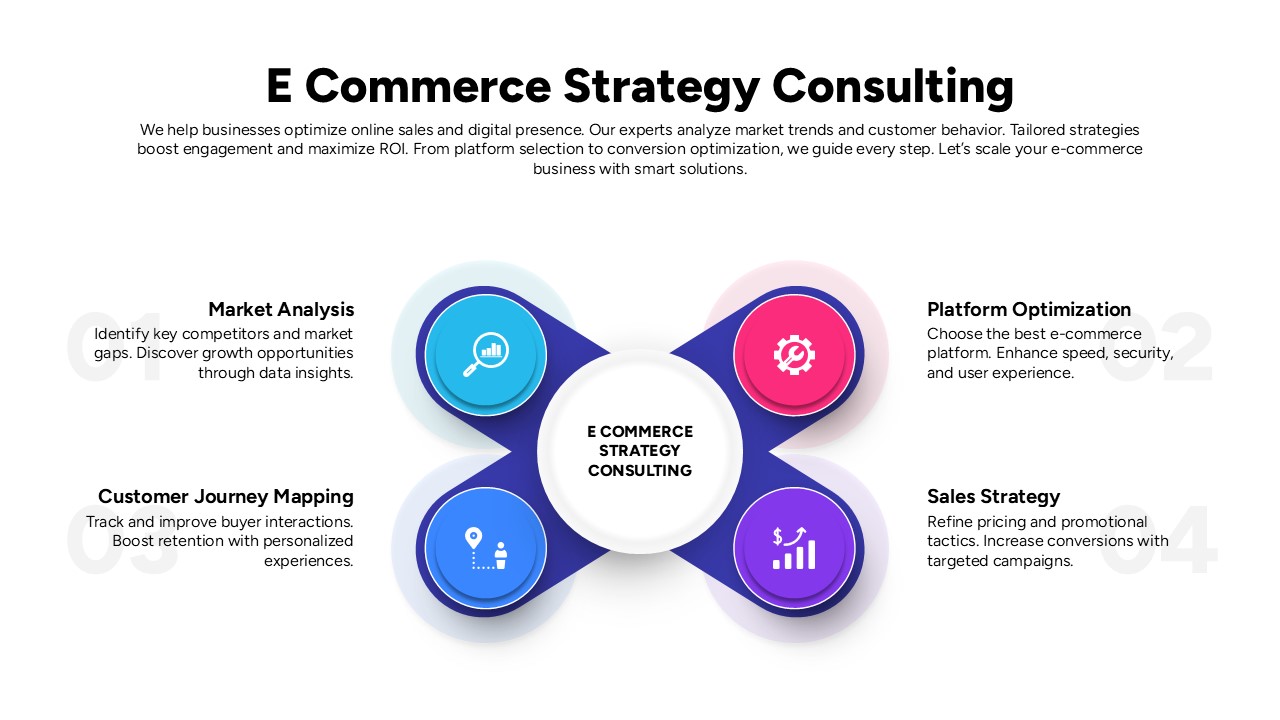
E-commerce Strategy Consulting Template for PowerPoint & Google Slides
Digital Marketing
Creative data chart analytics template for PowerPoint & Google Slides
Charts
Multi-Series Curved Line Graph Analytics Template for PowerPoint & Google Slides
Comparison Chart
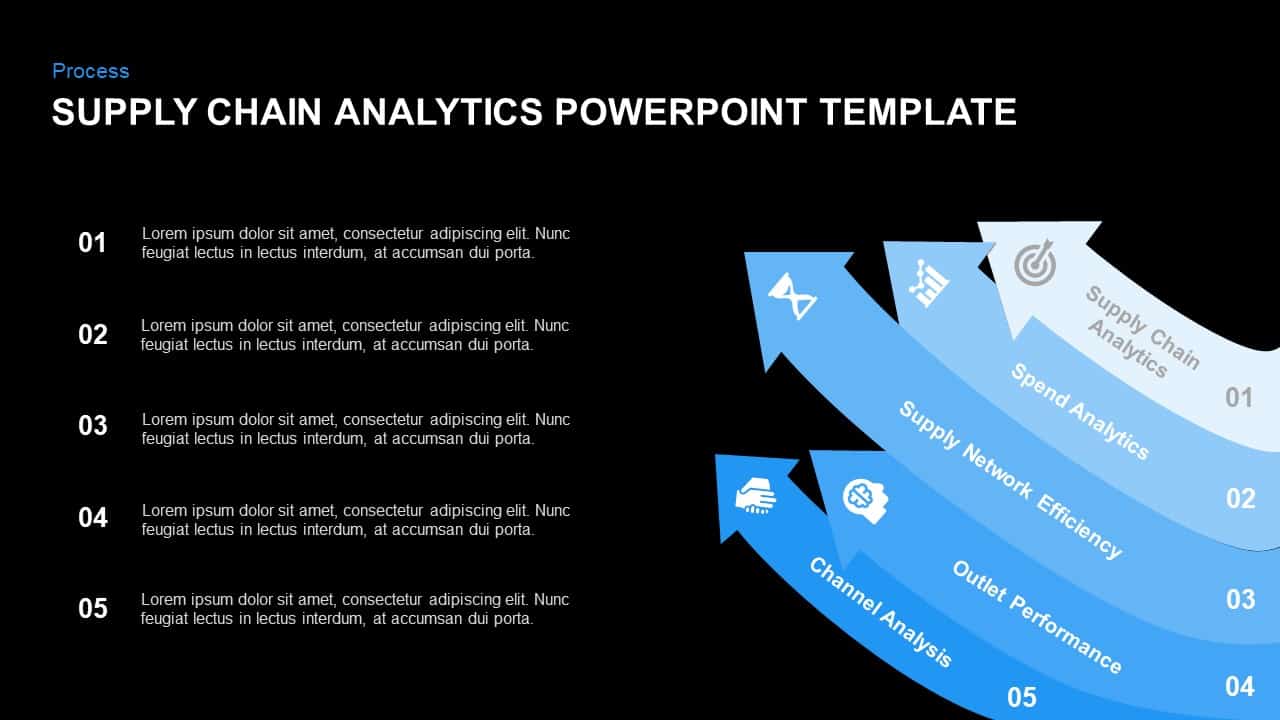
Supply Chain Analytics Process Template for PowerPoint & Google Slides
Process
Data Management and Analytics Diagram Template for PowerPoint & Google Slides
Circular

Dynamic Marketing Radar Chart Analytics Template for PowerPoint & Google Slides
Comparison
Digital Marketing Analytics Presentation Template for PowerPoint & Google Slides
Digital Marketing
Free TikTok Marketing Analytics Overview Template for PowerPoint & Google Slides
Company Profile
Free
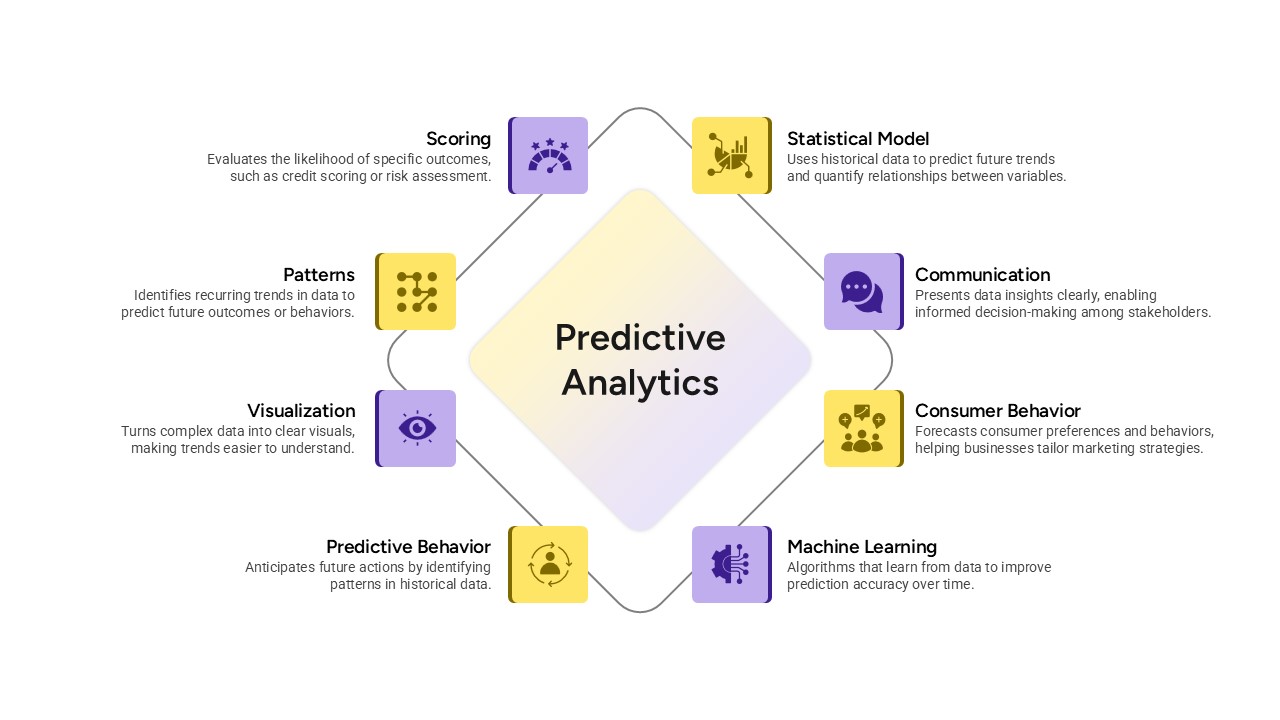
Predictive Analytics Diagram Template for PowerPoint & Google Slides
Process
Free Facebook Page Analytics Slide for PowerPoint & Google Slides
Customer Experience
Free
Free KPI Dashboard PowerPoint Template for PowerPoint & Google Slides
Charts
Free
Dynamic Data Dashboard Infographic Template for PowerPoint & Google Slides
Bar/Column

Efficiency KPI Dashboard Metaphor Template for PowerPoint & Google Slides
Infographics

Professional Team Efficiency Dashboard Template for PowerPoint & Google Slides
Business Report
Project Management Dashboard Template for PowerPoint & Google Slides
Project
Website Performance Dashboard template for PowerPoint & Google Slides
Charts
Sales Performance Dashboard template for PowerPoint & Google Slides
Business Report
Immigration Data Dashboard Template for PowerPoint & Google Slides
Bar/Column
Employee Skill Analysis Dashboard Template for PowerPoint & Google Slides
Employee Performance
Sales Growth Dashboard: KPI Gauge & Line Template for PowerPoint & Google Slides
Revenue
Social Media Performance Dashboard Template for PowerPoint & Google Slides
Bar/Column

Net Promoter Score Dashboard Template for PowerPoint & Google Slides
Customer Experience
Modern Project Status Report Dashboard Template for PowerPoint & Google Slides
Project Status
Performance KPI Dashboard Slide Template for PowerPoint & Google Slides
Business Report
Bull and Bear Stock Market Dashboard Template for PowerPoint & Google Slides
Infographics
KPI Dashboard template for PowerPoint & Google Slides
Business Report
KPI Dashboard Overview template for PowerPoint & Google Slides
Finance
KPI Dashboard Data Visualization Template for PowerPoint & Google Slides
Bar/Column
KPI Dashboard Data Overview Slide Template for PowerPoint & Google Slides
Bar/Column
Professional Nurse Infographic Dashboard Template for PowerPoint & Google Slides
Nursing
Interactive Benchmarking Gauge Dashboard Template for PowerPoint & Google Slides
Pie/Donut
Heat Map Risk Matrix Dashboard Template for PowerPoint & Google Slides
Comparison Chart
Project Status Dashboard Table Template for PowerPoint & Google Slides
Project Status
Project Status Dashboard with Metrics Template for PowerPoint & Google Slides
Project Status
Colorful Project Status Dashboard Template for PowerPoint & Google Slides
Project Status
Weekly Update Schedule Dashboard Template for PowerPoint & Google Slides
Agenda
Project Status Dashboard Template for PowerPoint & Google Slides
Project Status
Weekly Status Report Dashboard Template for PowerPoint & Google Slides
HR
Free Metro UI Dashboard Infographic Template for PowerPoint & Google Slides
Business Report
Free
Website Performance Monitoring Dashboard Template for PowerPoint & Google Slides
Business Report
One Pager Project Status Dashboard Template for PowerPoint & Google Slides
Project Status
One Pager Annual Report Dashboard Template for PowerPoint & Google Slides
Business Report
Social Media Statistics 2023 Dashboard Template for PowerPoint & Google Slides
Comparison
Mastodon Metrics Infographic Dashboard Template for PowerPoint & Google Slides
Business Report
Soccer Match Stats Dashboard Slide Template for PowerPoint & Google Slides
Graphics
Employee Satisfaction Survey Dashboard Template for PowerPoint & Google Slides
Employee Performance
Customer Satisfaction KPI Dashboard Template for PowerPoint & Google Slides
Customer Experience
Weekly Project Status Dashboard Template for PowerPoint & Google Slides
Project Status
Freight Logistics Dashboard Infographic Template for PowerPoint & Google Slides
Comparison Chart
Free Quarterly Business Review Dashboard Template for PowerPoint & Google Slides
Business
Free
Cost Cutting Savings Dashboard Template for PowerPoint & Google Slides
Pie/Donut
Macroeconomic Indicators Dashboard Template for PowerPoint & Google Slides
PEST
Free Monthly Report PowerPoint Template for PowerPoint & Google Slides
Business Report
Free
Michigan County Map with KPI Dashboard Template for PowerPoint & Google Slides
World Maps
Quarterly Financial Summary Dashboard Template for PowerPoint & Google Slides
Business Report
Banking Financial Overview Dashboard Template for PowerPoint & Google Slides
Finance
Quarterly Business Review Dashboard Template for PowerPoint & Google Slides
Pitch Deck
Monthly Business Review Dashboard Deck Template for PowerPoint & Google Slides
Business Report
DevOps KPI Dashboard Performance Metrics Template for PowerPoint & Google Slides
Software Development
Purchasing KPI Metrics Dashboard Template for PowerPoint & Google Slides
Business Report
Procurement KPI Dashboard & Metrics Template for PowerPoint & Google Slides
Business Report
Project Progress Dashboard Pie Charts Template for PowerPoint & Google Slides
Project
Monthly Sales Performance Dashboard Template for PowerPoint & Google Slides
Charts
HR Report Dashboard Template for PowerPoint & Google Slides
Employee Performance
Budget Forecast Dashboard & Donut Charts Template for PowerPoint & Google Slides
Pie/Donut
Risk Level Gauge Comparison Dashboard Template for PowerPoint & Google Slides
Comparison
Inventory Management Dashboard Template for PowerPoint & Google Slides
Process
Digital Marketing KPIs Dashboard Dark Template for PowerPoint & Google Slides
Business Report
Employee Performance Metrics Dashboard Template for PowerPoint & Google Slides
Employee Performance
Turnover Analysis Dashboard Template for PowerPoint & Google Slides
Employee Performance
Project Tracking Dashboard Table Template for PowerPoint & Google Slides
Project Status
Action Items Management Dashboard Table Template for PowerPoint & Google Slides
Project Status
Electronic Health Records Dashboard template for PowerPoint & Google Slides
Health
Customer Interview Insights Dashboard Template for PowerPoint & Google Slides
Customer Experience
Account Overview Dashboard template for PowerPoint & Google Slides
Business
Project Status Dashboard Report Template for PowerPoint & Google Slides
Project Status
Project Status Update Dashboard Table Template for PowerPoint & Google Slides
Project Status
Cohort Analysis Retention Dashboard Template for PowerPoint & Google Slides
Comparison Chart
Project Status Dashboard Template for PowerPoint & Google Slides
Project Status
Dashboard Project Status Template for PowerPoint & Google Slides
Project Status
Project Status Template Dashboard with Gauge for PowerPoint & Google Slides
Project Status
Task Completion Rate Dashboard Template for PowerPoint & Google Slides
Business
Project Status Dashboard with RAG Legend Template for PowerPoint & Google Slides
Project Status
End of Year Review Dashboard Template for PowerPoint & Google Slides
Business Report
Construction Project Dashboard Template for PowerPoint & Google Slides
Project
Employee Headcount Dashboard Report Template for PowerPoint & Google Slides
Employee Performance
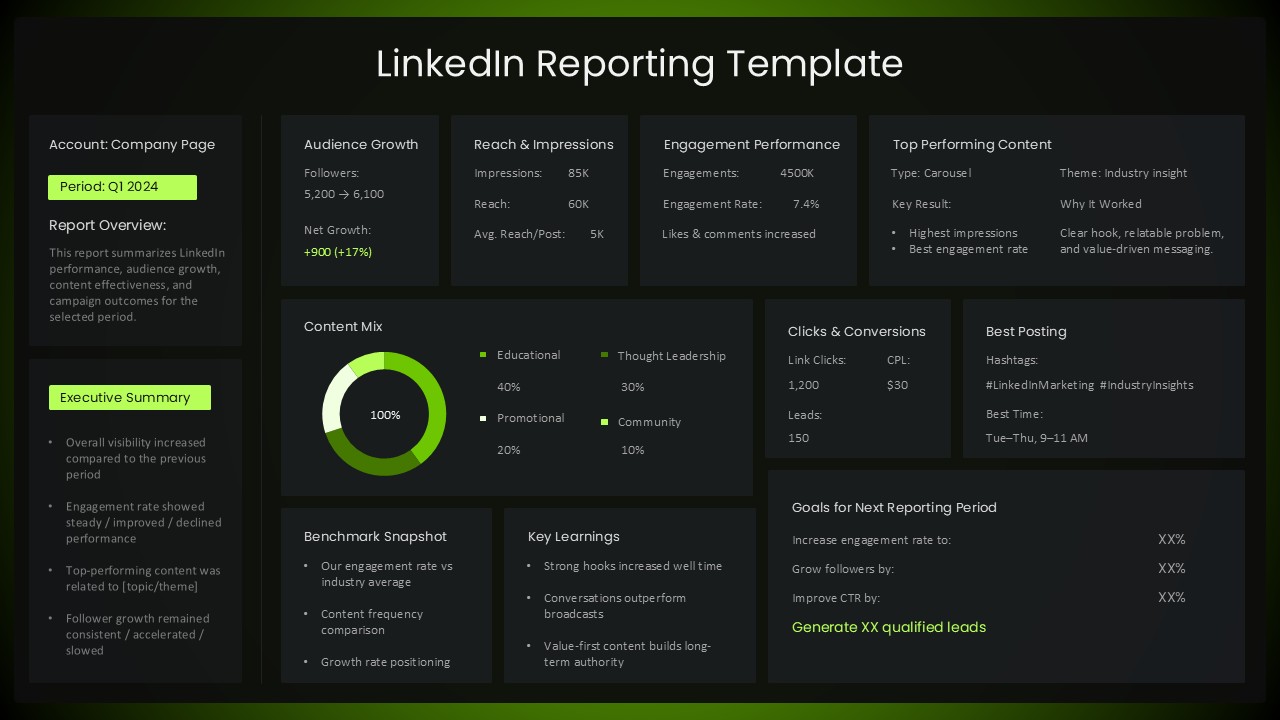
LinkedIn Performance Reporting Dashboard Template for PowerPoint & Google Slides
Digital Marketing
4DX Scoreboard KPI Gauge Dashboard Template for PowerPoint & Google Slides
Business Strategy
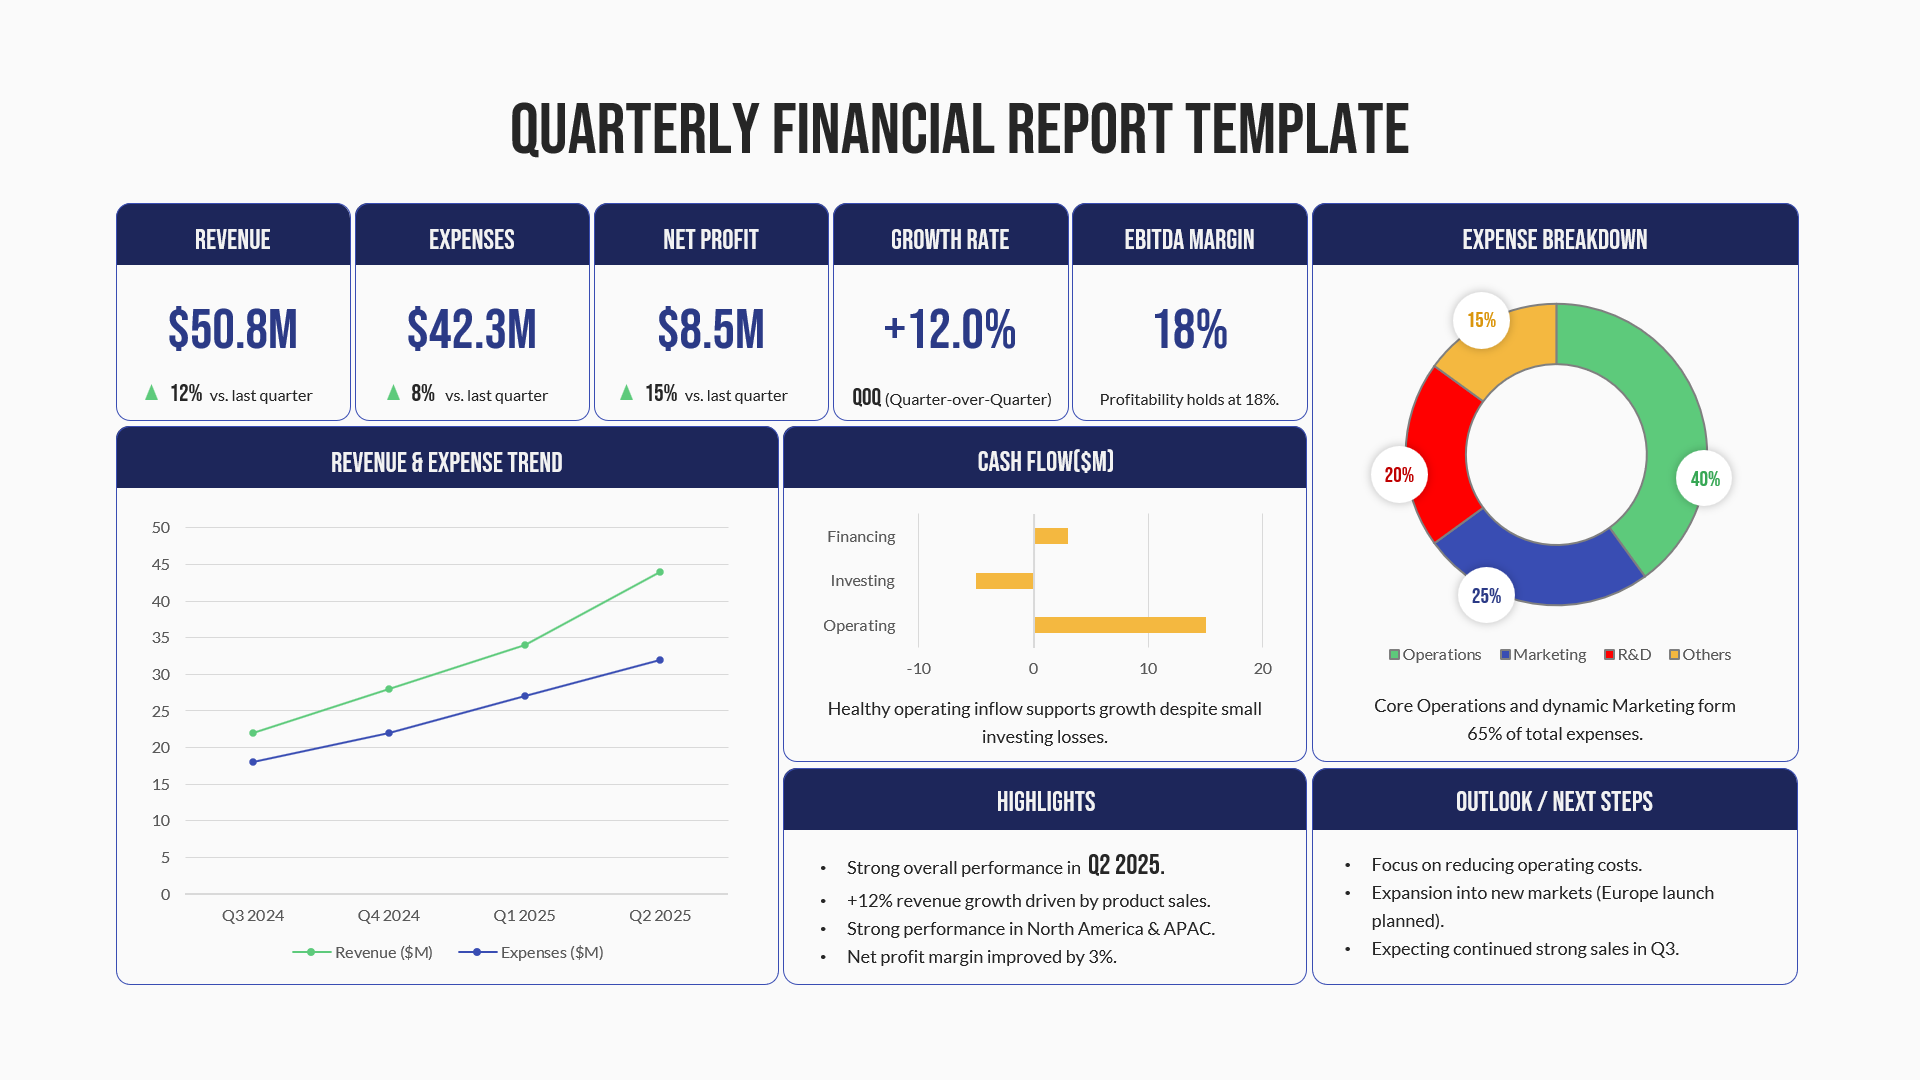
Quarterly Financial Report Dashboard Template for PowerPoint & Google Slides
Finance
Incident Tracking Dashboard for PowerPoint & Google Slides
Business Plan
MVP Product Roadmap Delivery Dashboard for PowerPoint & Google Slides
Roadmap