E-Waste Management Diagram Template for PowerPoint & Google Slides


Description
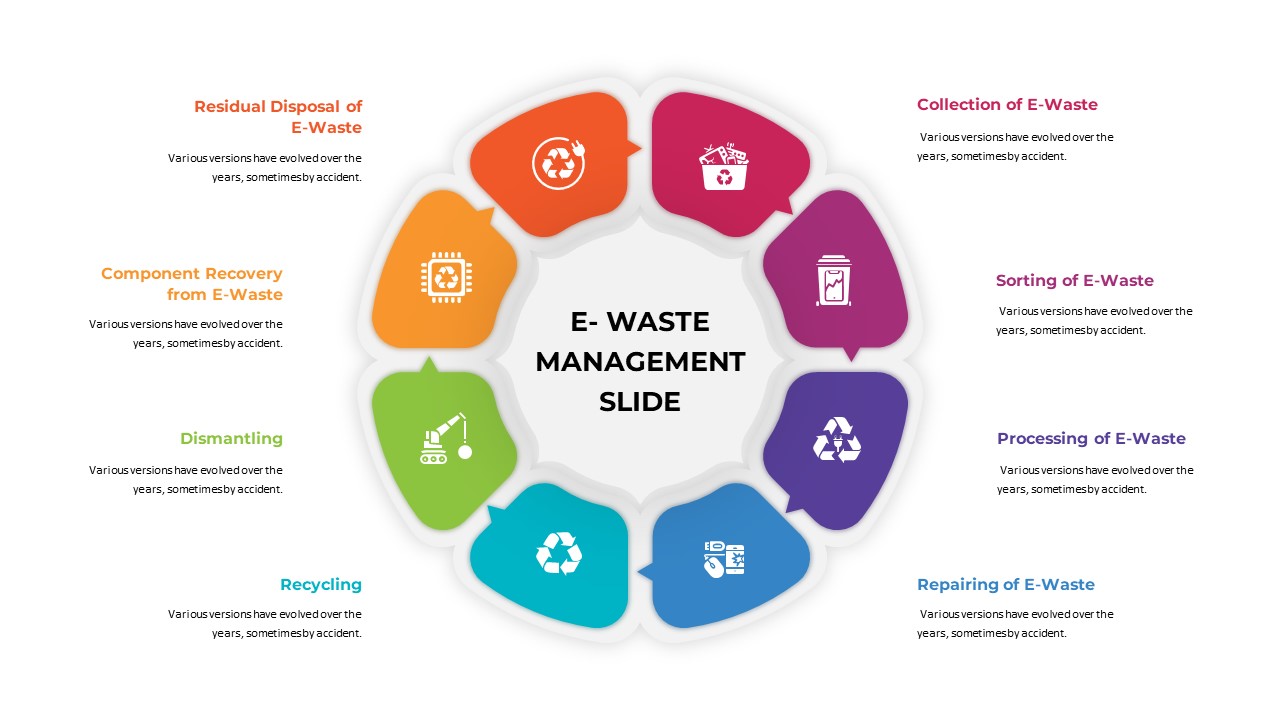
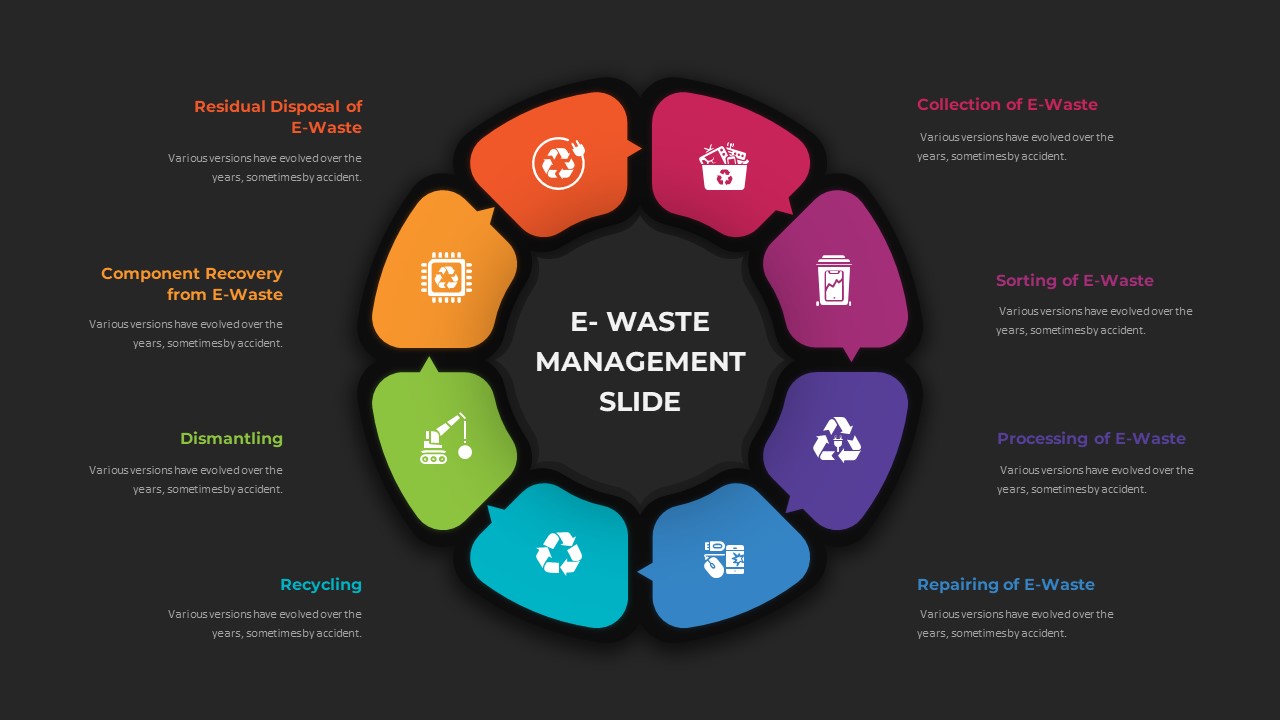
Leverage this infographic slide to illustrate your e-waste management workflow across eight distinct stages, guiding audiences through collection, sorting, processing, repairing, recycling, dismantling, component recovery, and residual disposal. A central text placeholder anchors the cycle, while each spoke features an editable icon on a pastel-colored segment—ranging from magenta and purple to cyan and green—ensuring each phase stands out without overwhelming viewers. Crisp drop shadows and smooth curves create depth, and intuitive connector points align seamlessly with your brand colors. Built with master slides and fully editable vector shapes, this design empowers you to adjust icons, update segment hues, or redefine labels within seconds.
Efficient customization is at your fingertips: replace default icons using the integrated library, apply alternate color palettes to match corporate themes, or swap segment positions to highlight priority stages. The clean white background and balanced spacing maintain focus on content, making it ideal for boardroom presentations, sustainability reports, and academic lectures. The modular slide structure supports both PowerPoint and Google Slides, preserving full resolution on any device and eliminating formatting headaches.
Optimize your workflow with built-in animations and slide transitions that draw attention to each milestone without distracting audiences. Use the theme color tool to instantly recolor all segments, or apply gradient overlays for a contemporary look. The slide’s robust design ensures compatibility with virtual meeting platforms and supports high-definition exports for printed materials. Ideal for consulting firms, environmental agencies, and corporate ESG teams, this template accelerates workflow and delivers a polished, professional narrative on e-waste strategies.
With this versatile infographic, you can drive audience engagement by visualizing complex processes in a clear, memorable layout. Whether you’re summarizing a recycling initiative, outlining a circular economy strategy, or mapping a product lifecycle, the hub-and-spoke format fosters easy comprehension and discussion. Leverage intuitive placeholders, smart guides, and consistent typography to maintain professional polish and accelerate slide creation.
Who is it for
Environmental managers, sustainability consultants, and corporate ESG teams will benefit from this circular infographic when presenting e-waste strategies, recycling roadmaps, or process workflows. Project managers, government agencies, and academic researchers can leverage the modular layout to illustrate lifecycle analyses, policy implementation steps, or educational modules.
Other Uses
Repurpose this slide to map product lifecycles, supply chain processes, or resource recovery programs. Use the eight-segment format to illustrate customer journey stages, training modules, or iterative development cycles across various industries. With color-coded icons and a central hub, the diagram adapts seamlessly to marketing plans, risk assessments, and operational briefings.
Login to download this file

Item ID
SB03299
Related Templates

E-Waste Management Process Flow Diagram Template for PowerPoint & Google Slides
Process
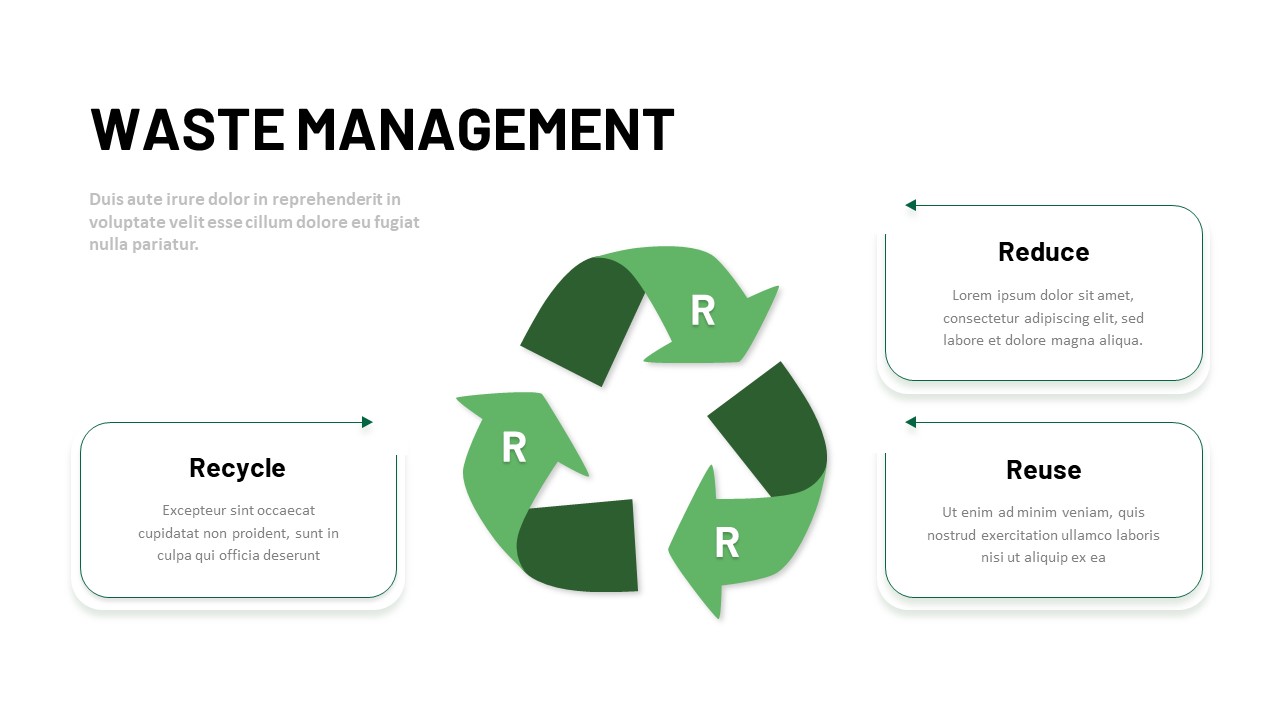
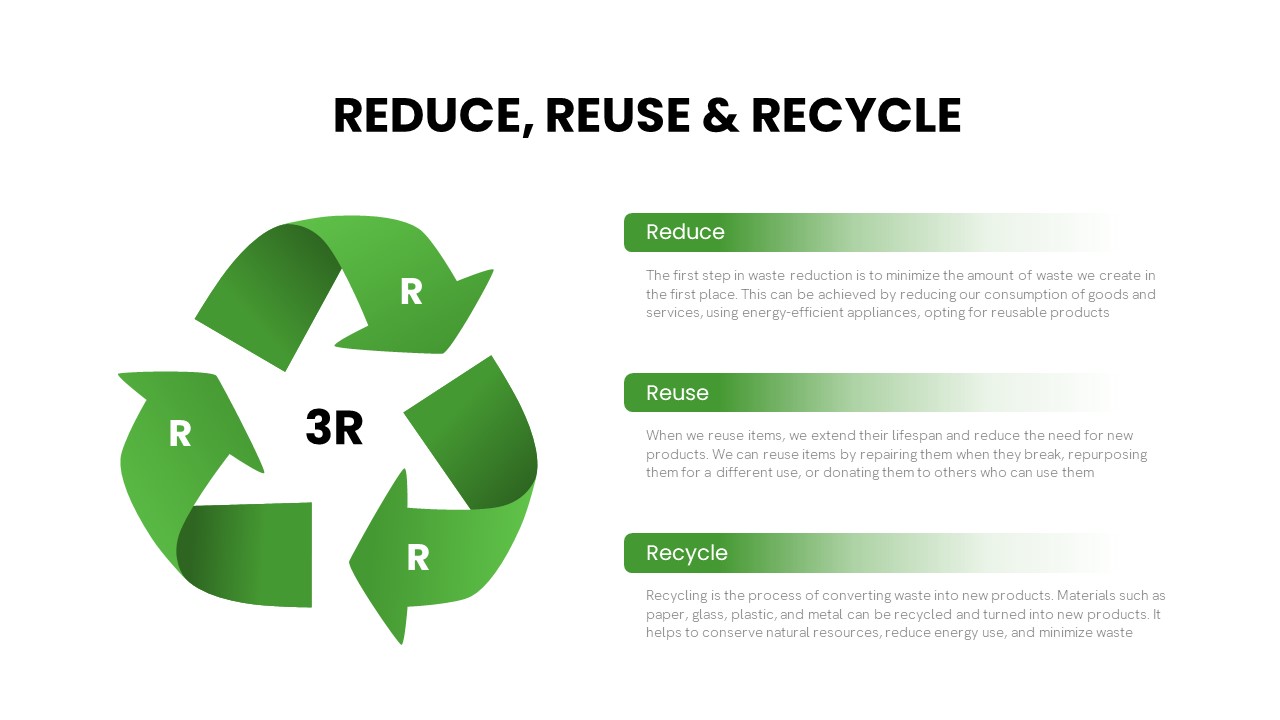
3R Waste Management Cycle Diagram Template for PowerPoint & Google Slides
Circular
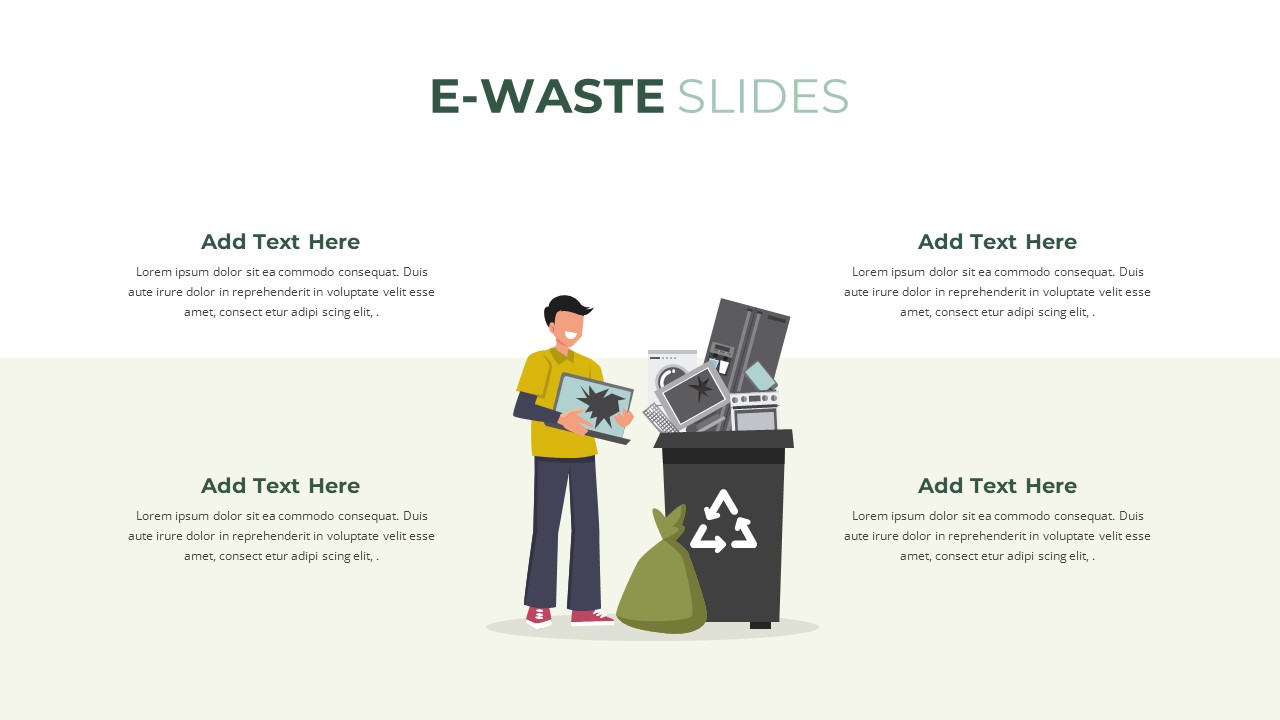
E-Waste Management Slide Template for PowerPoint & Google Slides
Infographics
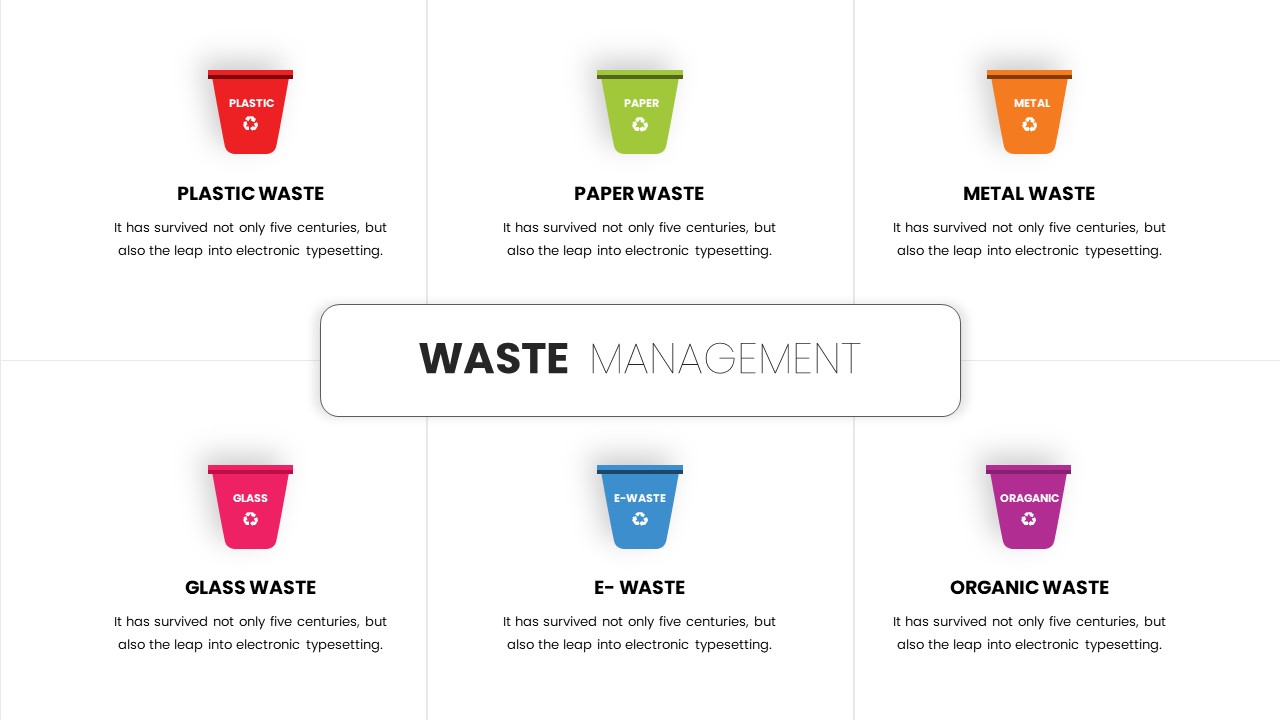
Six-Category Waste Management Overview Template for PowerPoint & Google Slides
Comparison
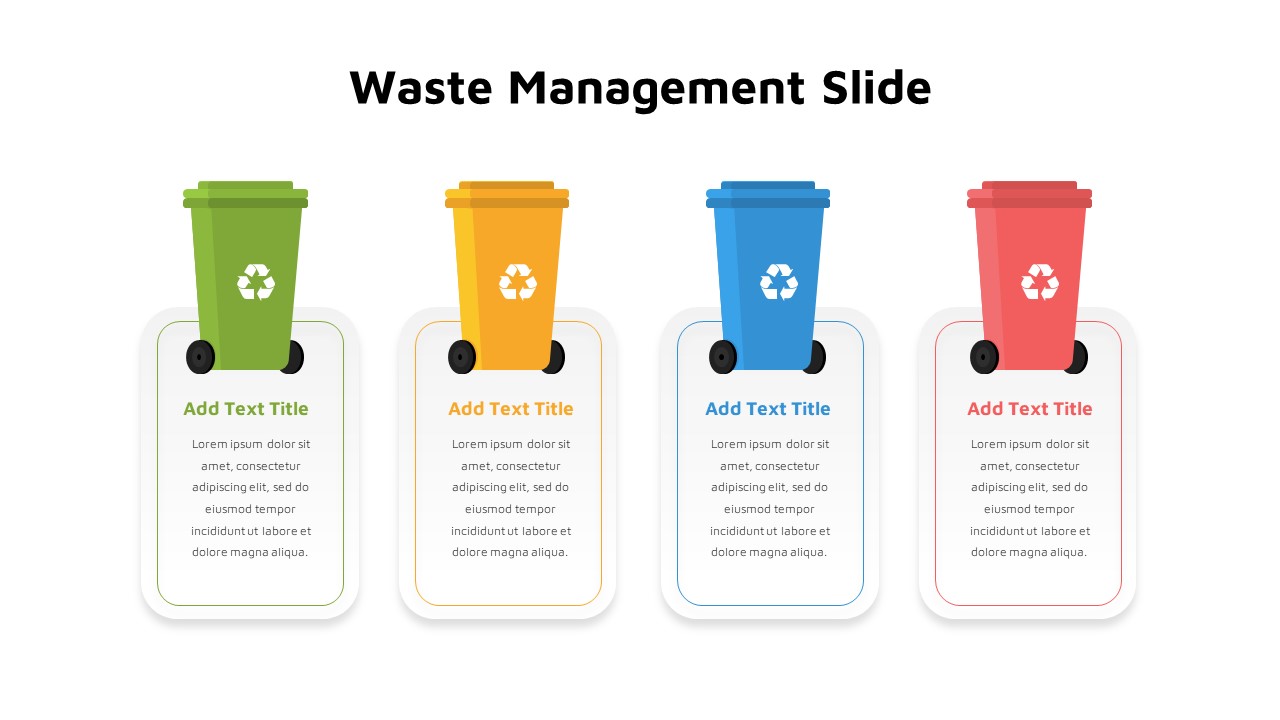
Color-Coded Waste Management Bins Template for PowerPoint & Google Slides
Comparison
3R Waste Management Cycle Overview template for PowerPoint & Google Slides
Process
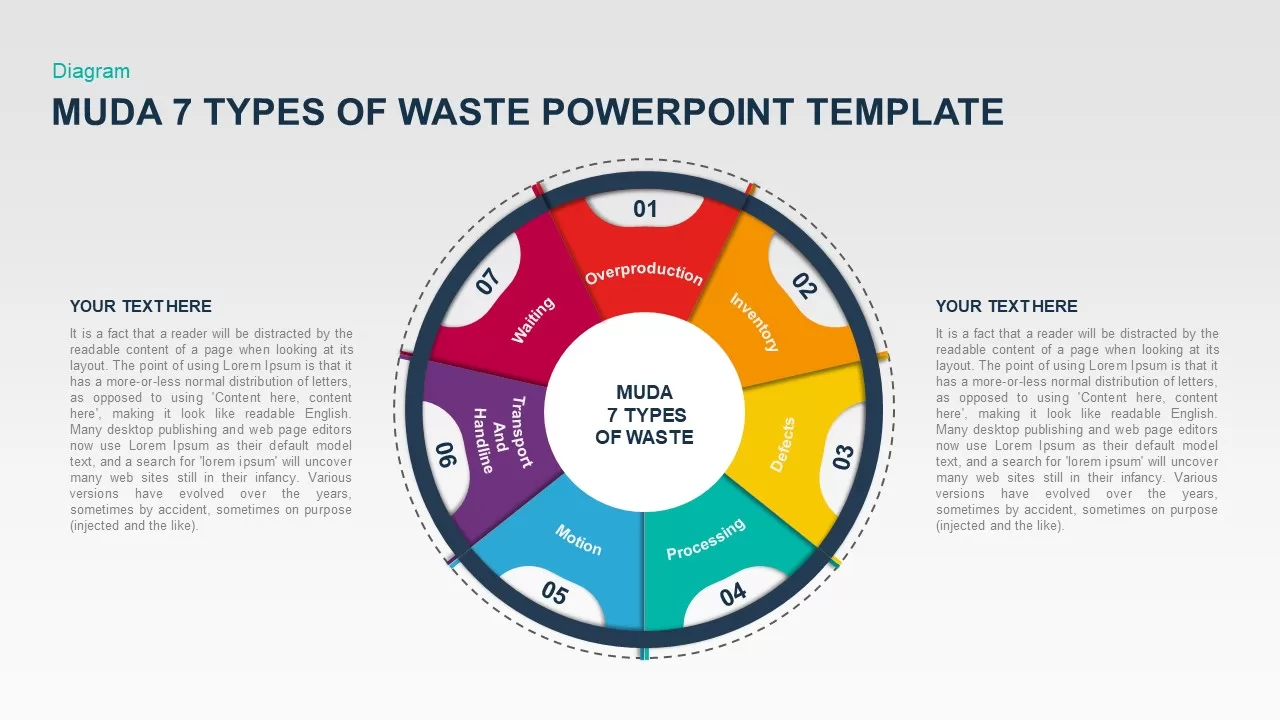
MUDA Seven Types of Waste Diagram Template for PowerPoint & Google Slides
Circular
Risk Management Mind Map Radial Diagram template for PowerPoint & Google Slides
Mind Maps
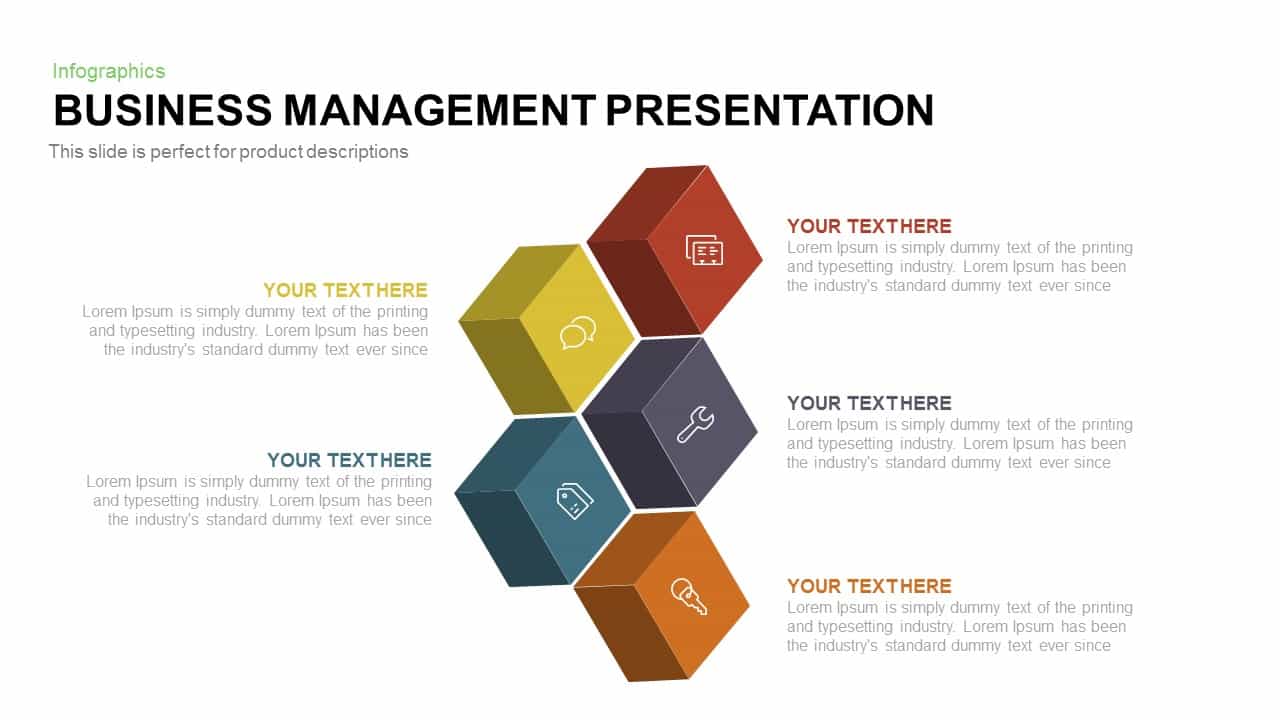
Business Management Hexagon Diagram Template for PowerPoint & Google Slides
Comparison
Marketing Risk Management Gear Diagram Template for PowerPoint & Google Slides
Risk Management
Risk Management Heat Map Diagram Template for PowerPoint & Google Slides
Comparison Chart
Data Management and Analytics Diagram Template for PowerPoint & Google Slides
Circular
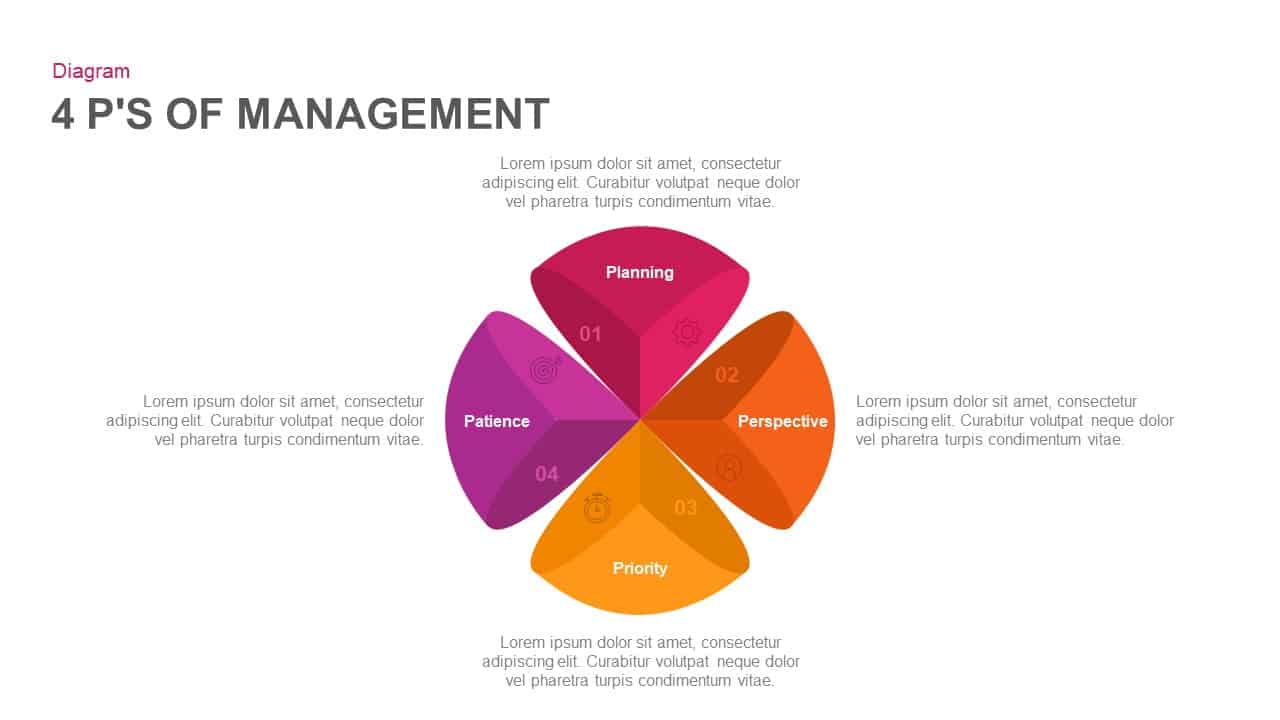
4 Ps of Management Circular Diagram Template for PowerPoint & Google Slides
Circular
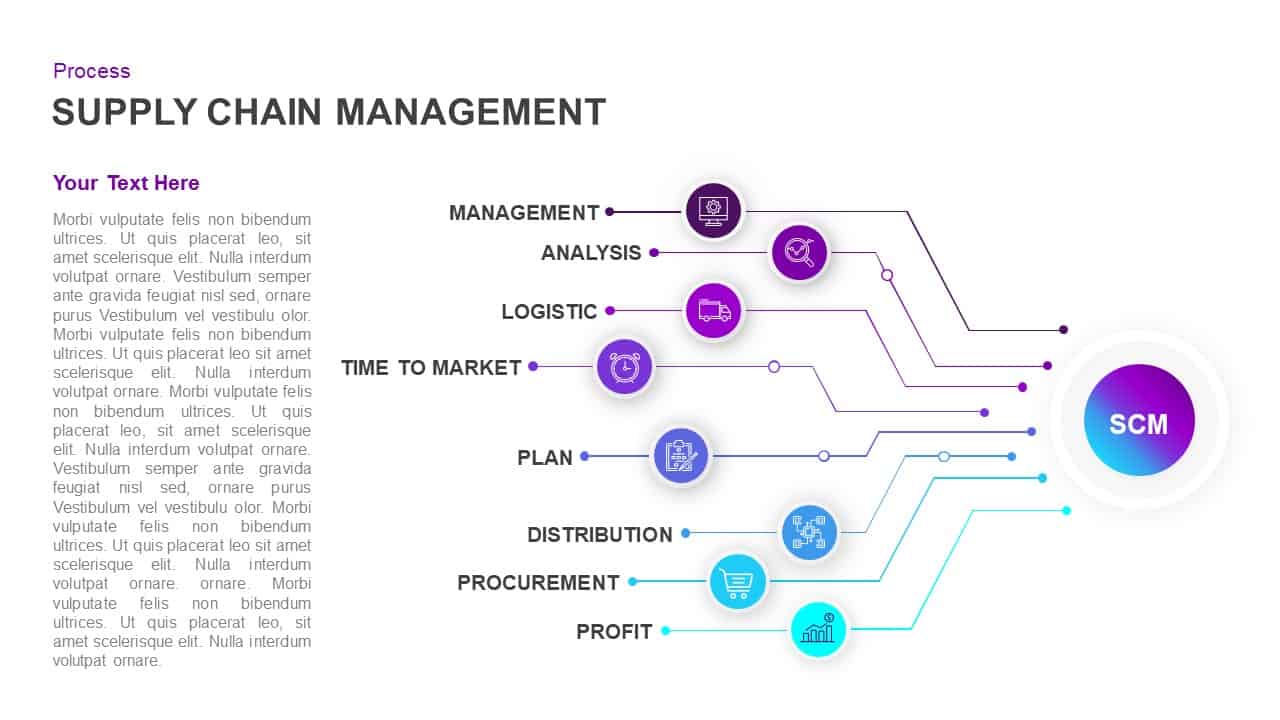
Supply Chain Management Process Diagram Template for PowerPoint & Google Slides
Process
Business Process Management Flow Diagram Template for PowerPoint & Google Slides
Process

Lewin’s Change Management Diagram Template for PowerPoint & Google Slides
Process
Enterprise Risk Management Cycle Diagram Template for PowerPoint & Google Slides
Process
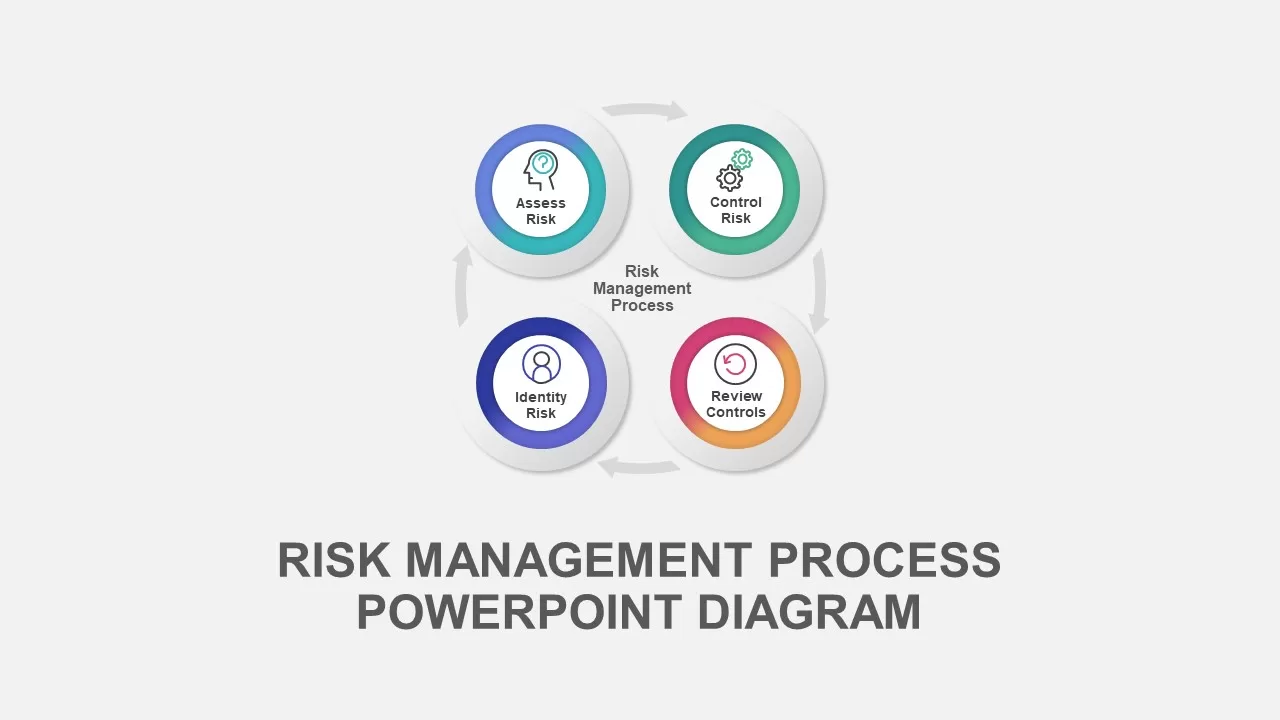
Risk Management Process Diagram Template for PowerPoint & Google Slides
Risk Management
Quality Management System Circular Diagram template for PowerPoint & Google Slides
Process
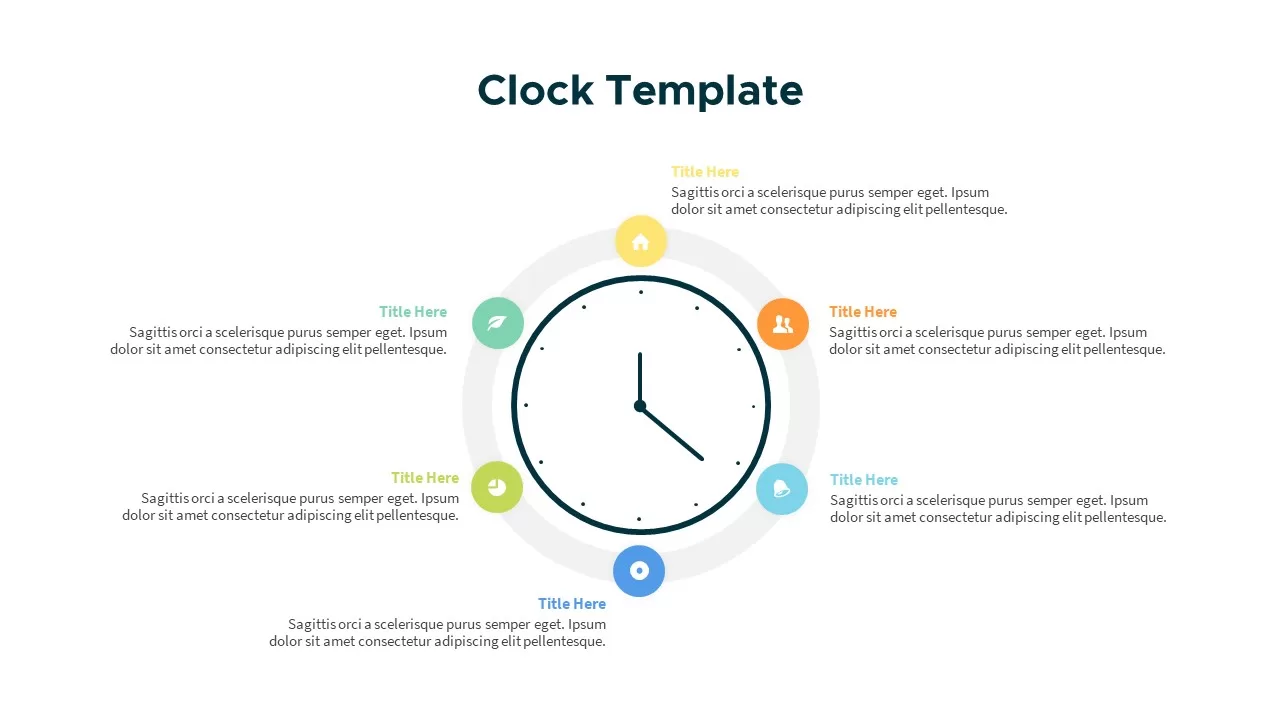
Clock Diagram for Time Management Template for PowerPoint & Google Slides
Circular
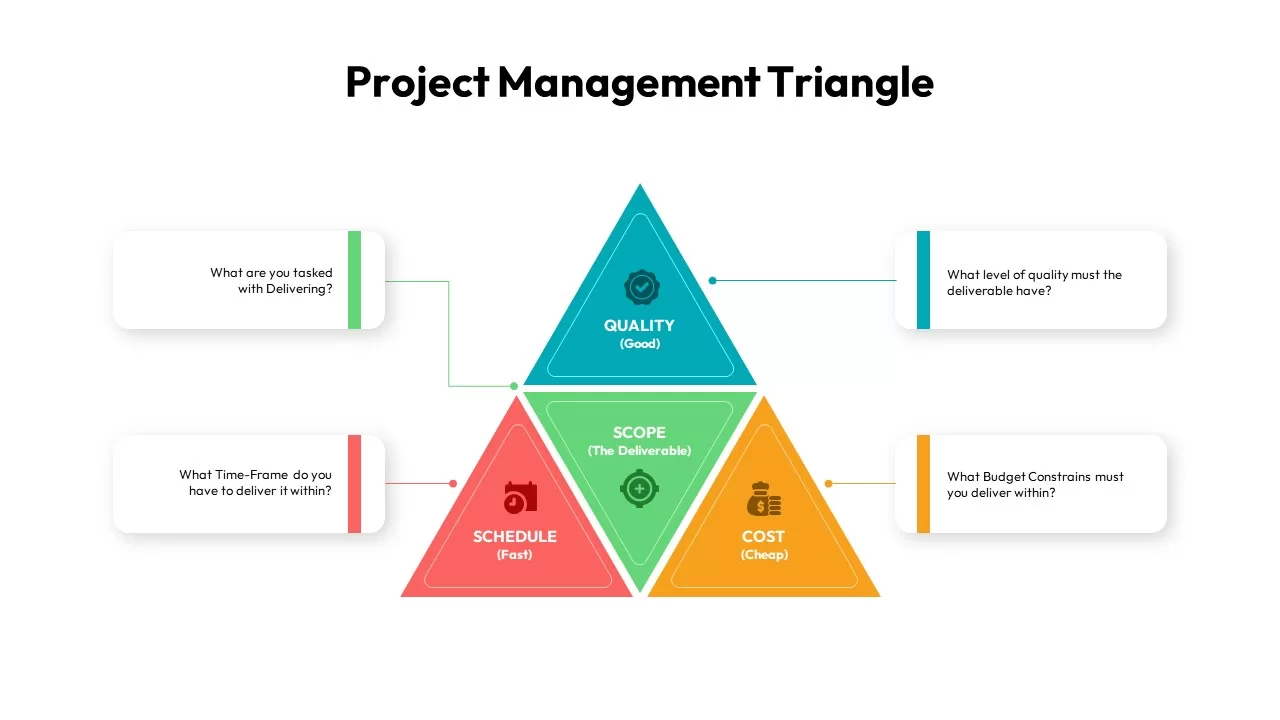
Project Management Triangle Diagram Template for PowerPoint & Google Slides
Project
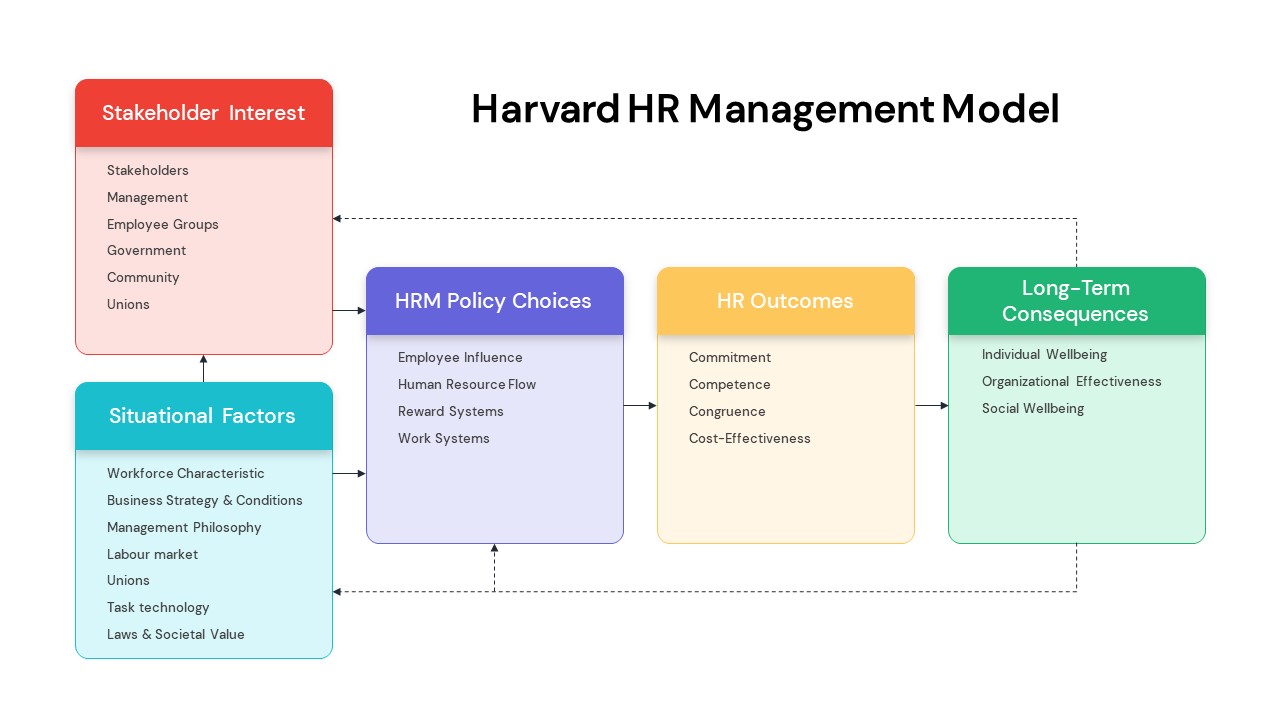
Harvard HR Management Model Diagram Template for PowerPoint & Google Slides
Process
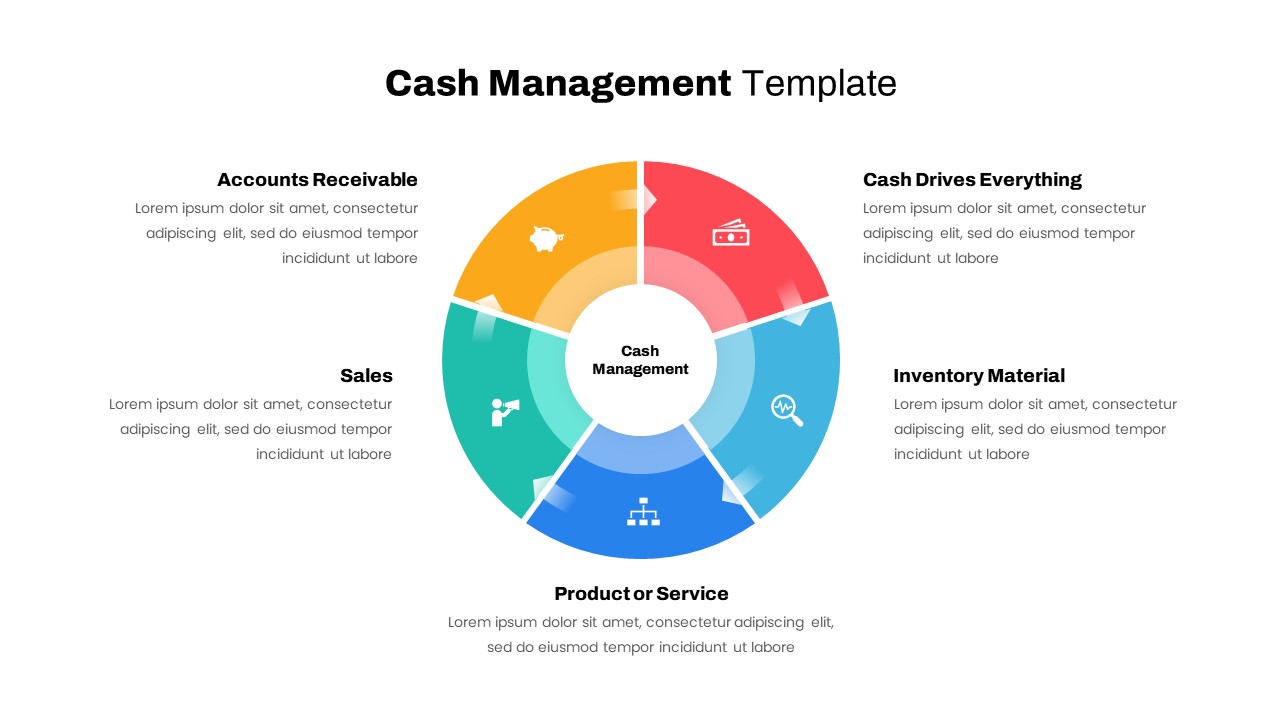
Cash Management Infographic Diagram Template for PowerPoint & Google Slides
Circular
Release Management Cycle Circular Diagram Template for PowerPoint & Google Slides
Software Development
Free Time Management Clock Cycle Diagram Template for PowerPoint & Google Slides
Process
Free
HR Management System Lifecycle Diagram Template for PowerPoint & Google Slides
Recruitment
Vendor Management Process Diagram Template for PowerPoint & Google Slides
Process
Change Management Process Cycle Diagram Template for PowerPoint & Google Slides
Process
IAM Access Management Structure Diagram Template for PowerPoint & Google Slides
Flow Charts
Cashflow Management Cycle Diagram Template for PowerPoint & Google Slides
Finance
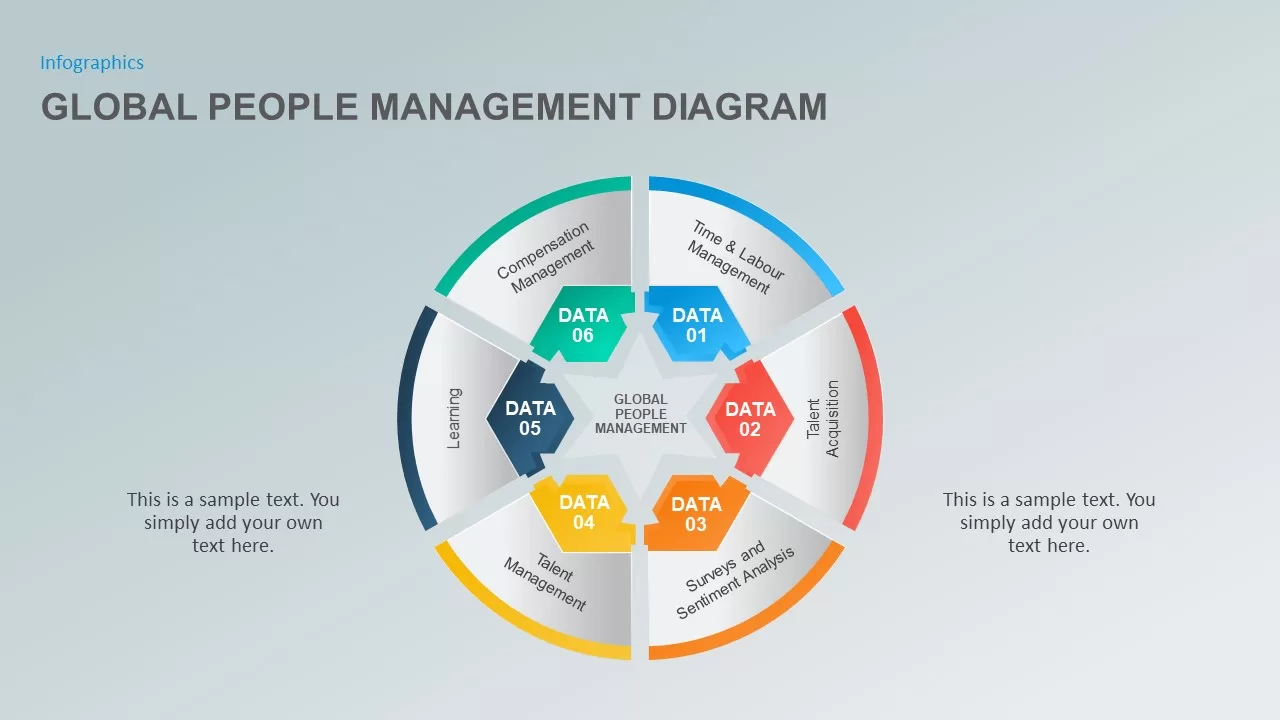
The Global People Management Diagram for PowerPoint & Google Slides
Business Models

Project Management Dashboard Template for PowerPoint & Google Slides
Project
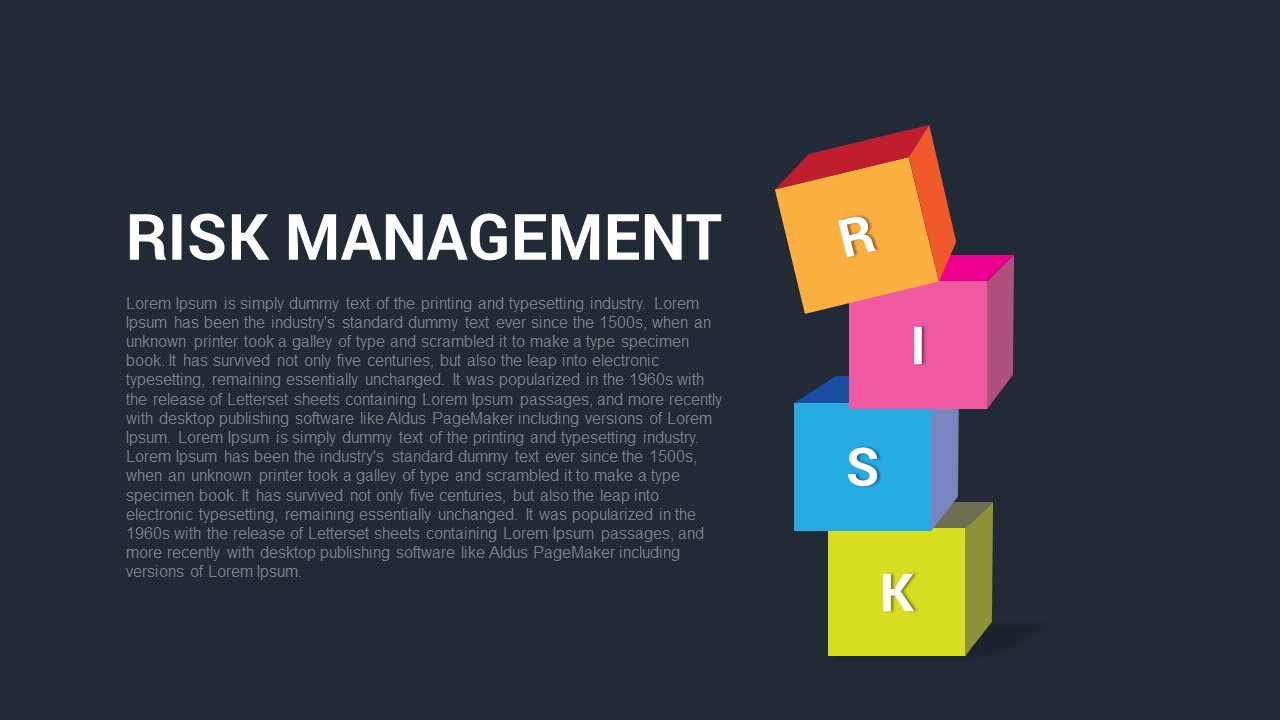
Risk Management Presentation Template for PowerPoint and Google Slides
Decks

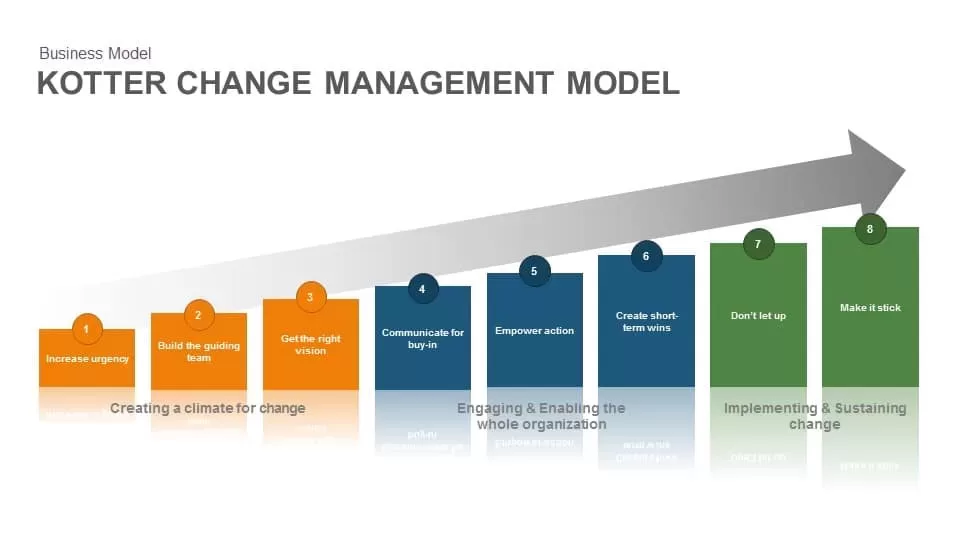
Kotter Change Management Model template for PowerPoint & Google Slides
Business Strategy
Logistics and Supply Chain Management Template for PowerPoint & Google Slides
Process
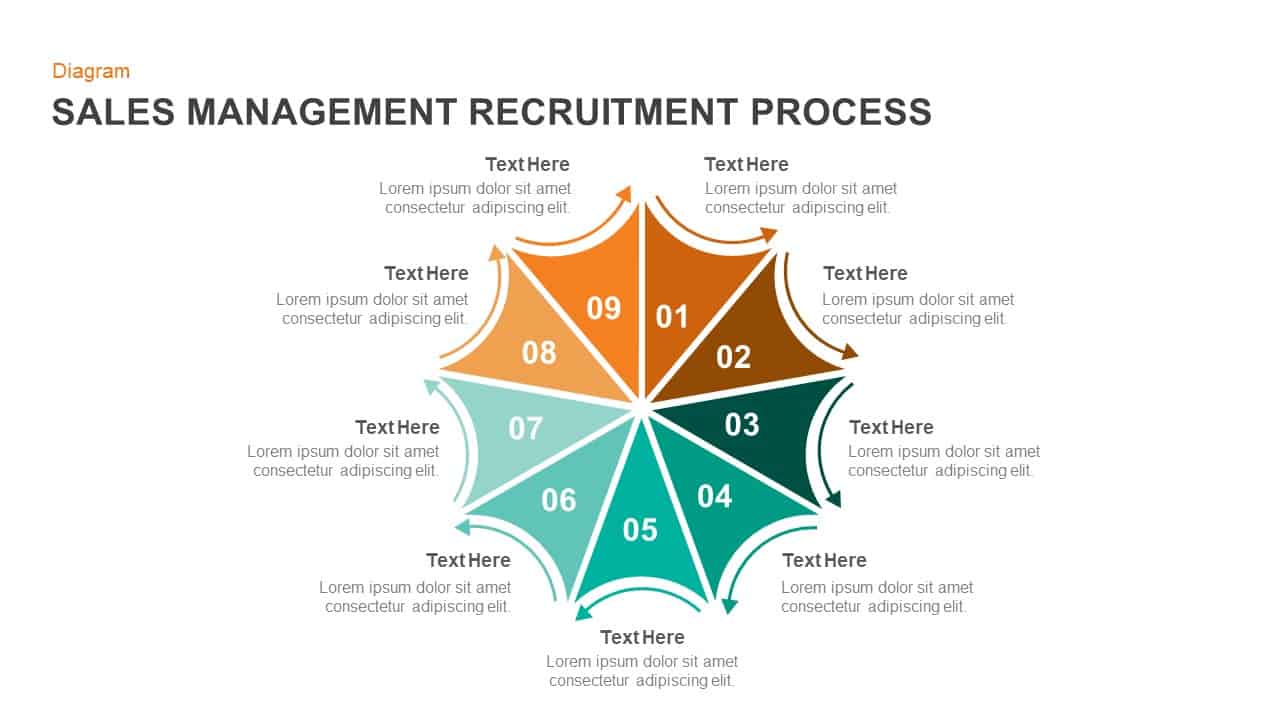
Sales Management Recruitment Process template for PowerPoint & Google Slides
Process
Performance Review Process Management Cycle template for PowerPoint & Google Slides
Employee Performance
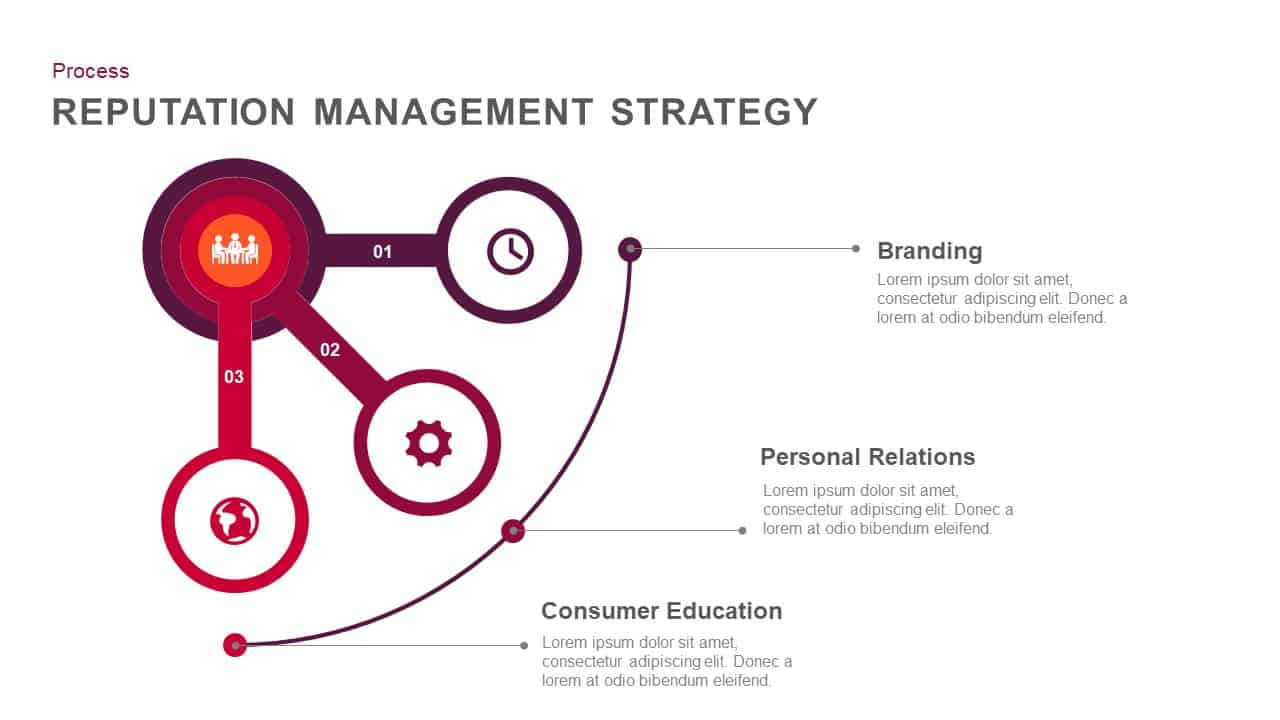
Reputation Management Strategy template for PowerPoint & Google Slides
Business Strategy

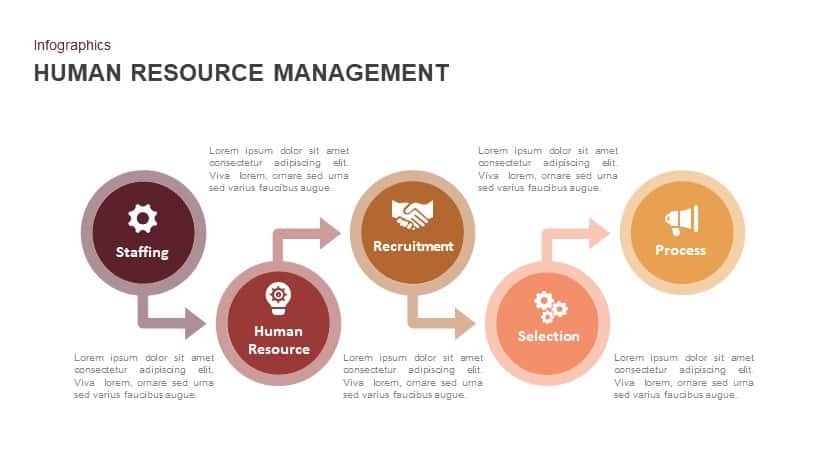
Human Resource Management template for PowerPoint & Google Slides
HR
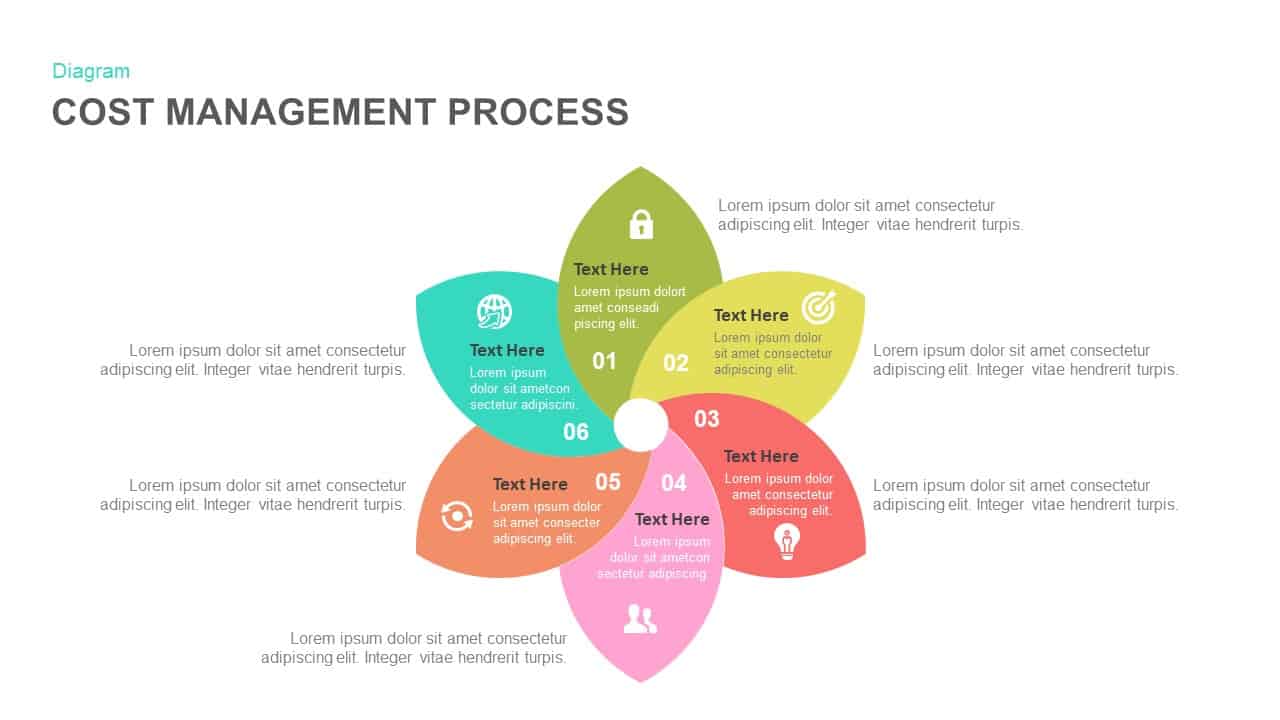
Cost Management Process template for PowerPoint & Google Slides
Process
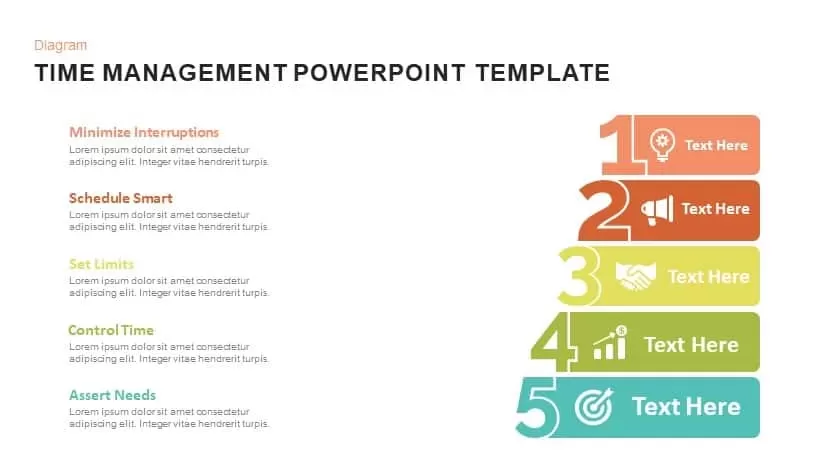
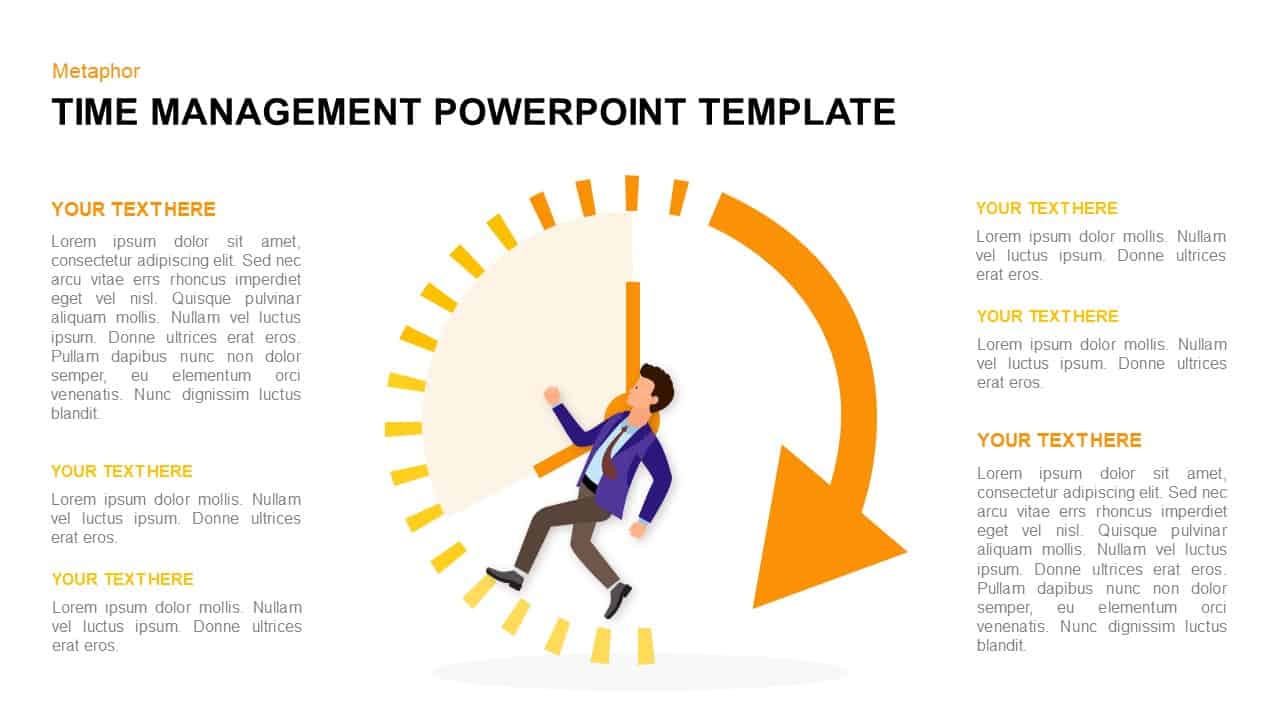
Time Management template for PowerPoint & Google Slides
Business Strategy
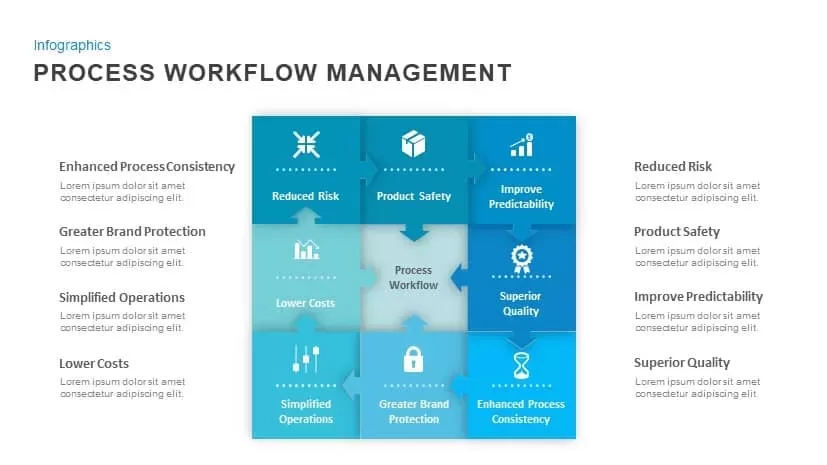
Process Workflow Management template for PowerPoint & Google Slides
Process
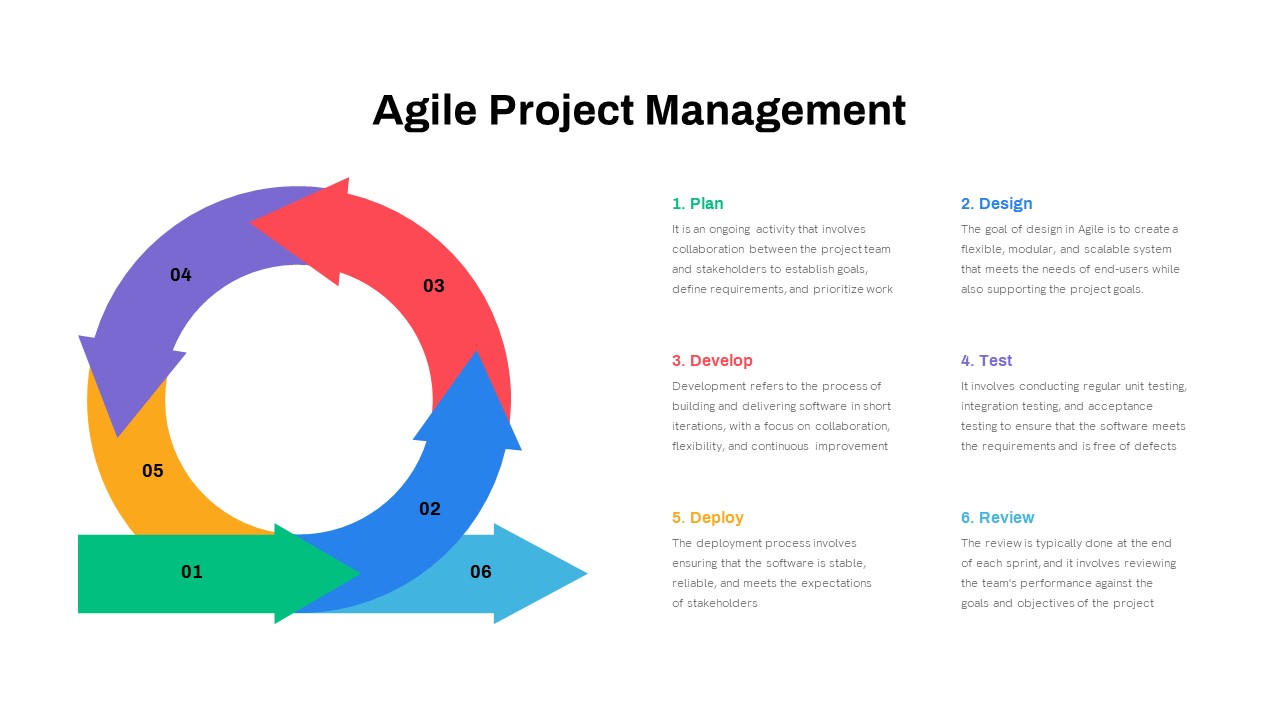
Comprehensive Agile Project Management Template for PowerPoint & Google Slides
Scrum
Supply Chain Management Logistics Cover Template for PowerPoint & Google Slides
Pitch Deck
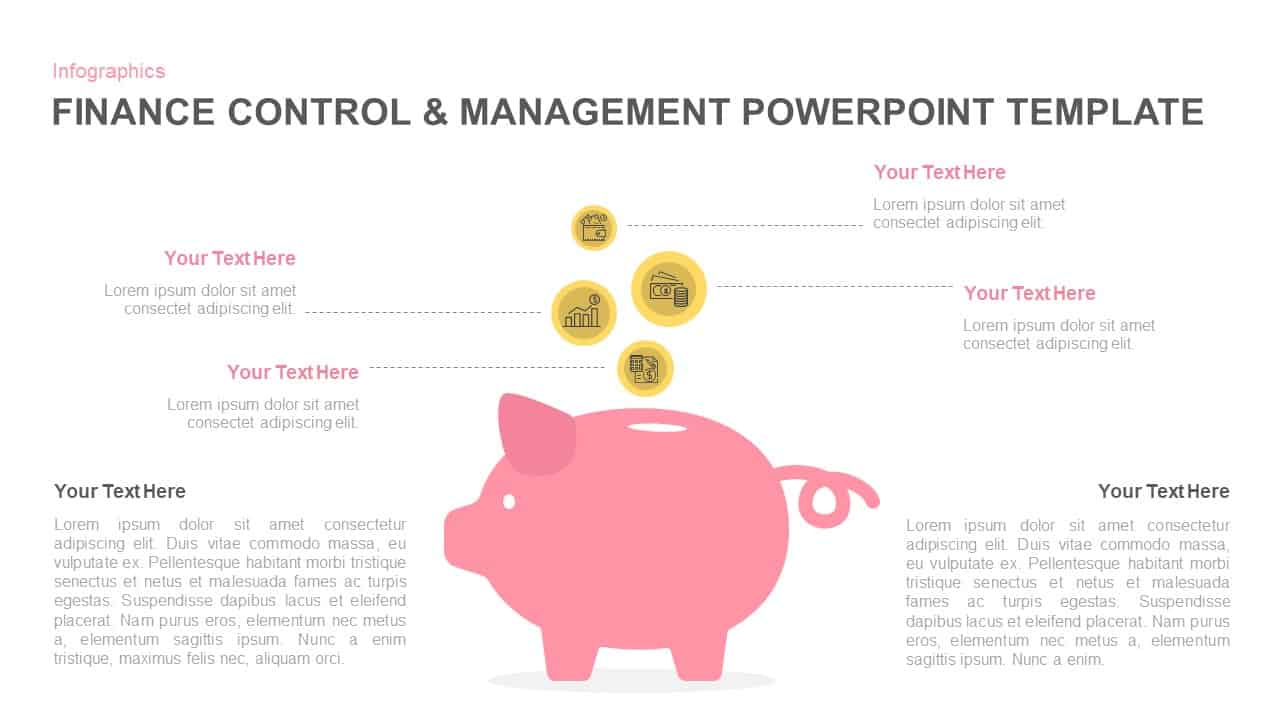
Finance Control & Management Piggy Bank Template for PowerPoint & Google Slides
Finance
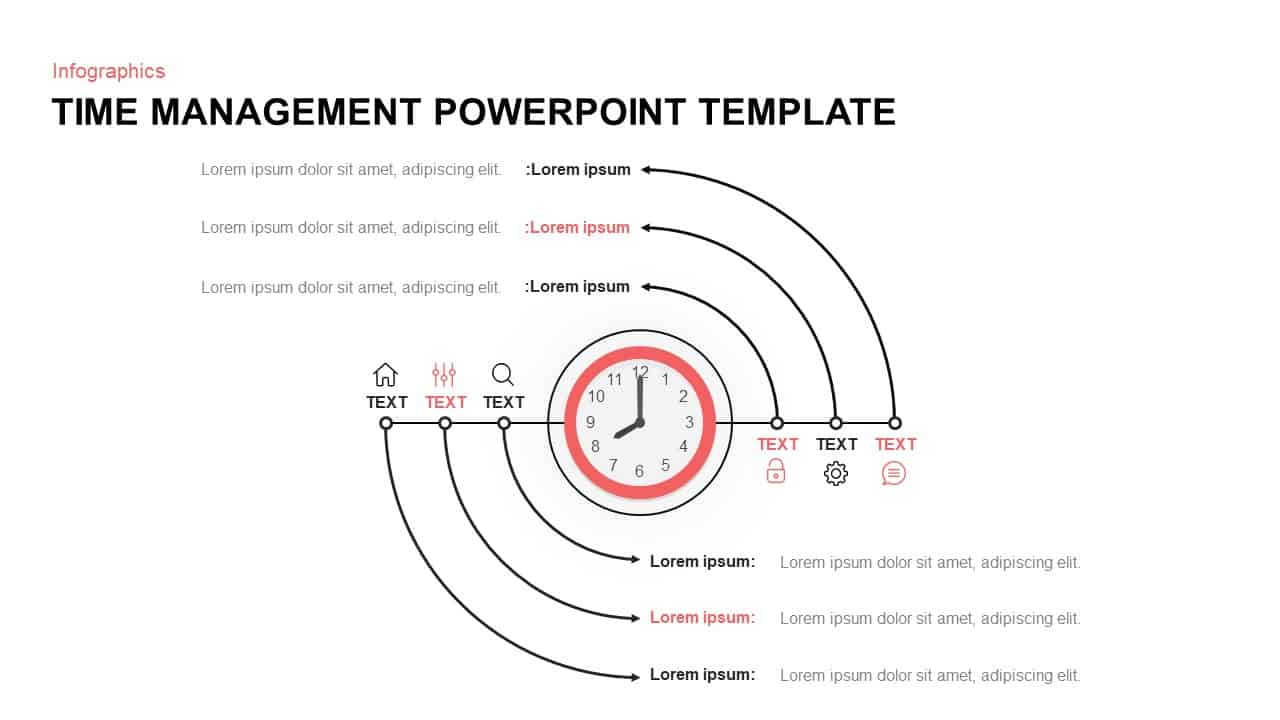
Time Management Clock Infographic Template for PowerPoint & Google Slides
Circular
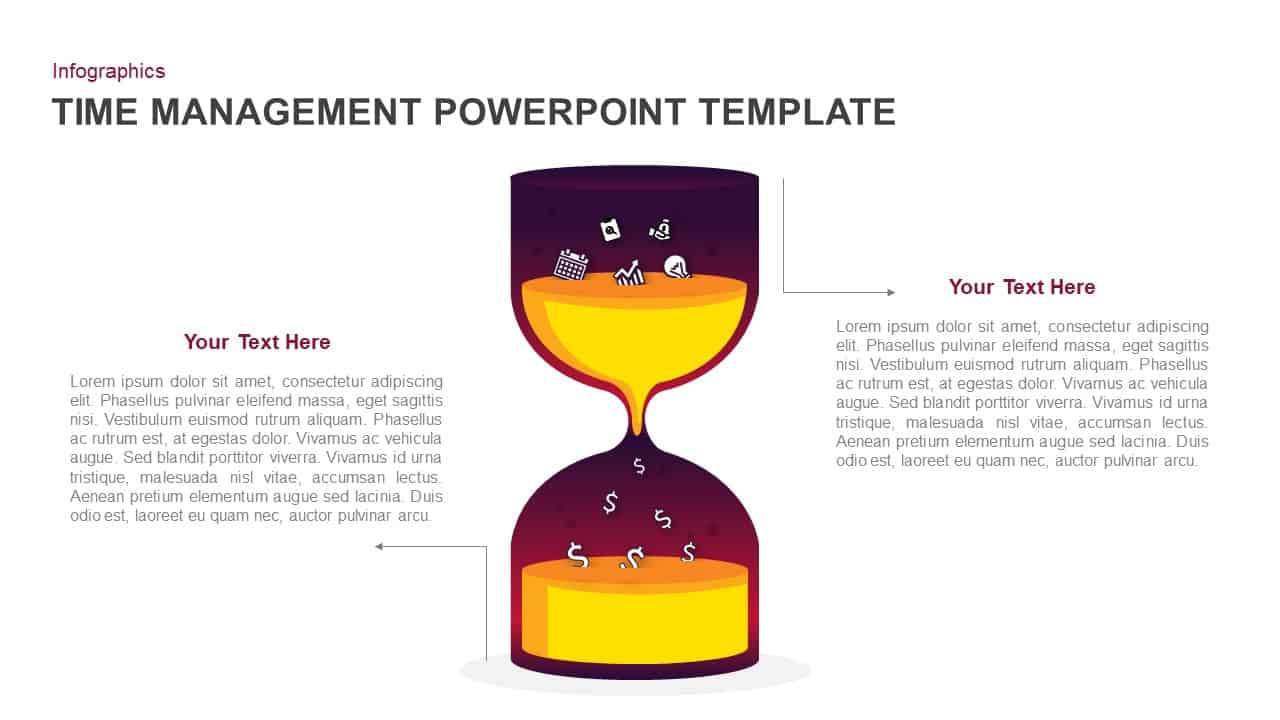
Time Management Hourglass Infographic Template for PowerPoint & Google Slides
Business
Hub and Spoke Time Management Process Template for PowerPoint & Google Slides
Process
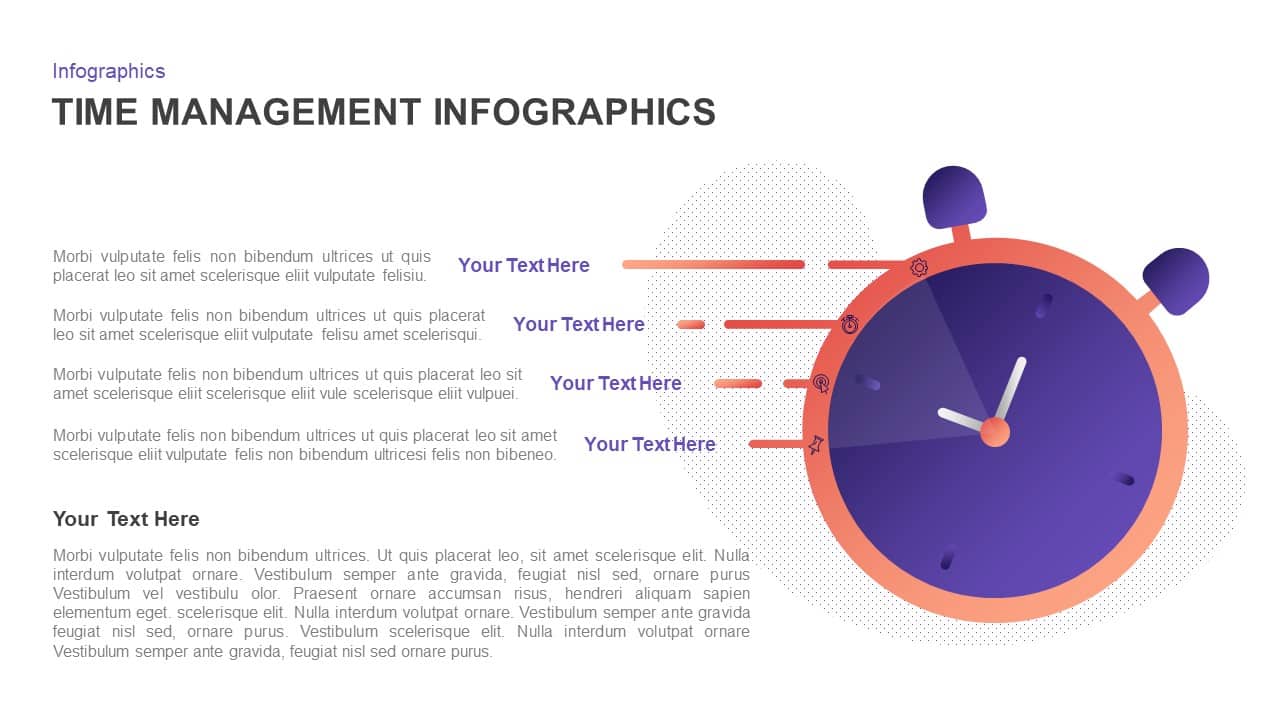
Time Management Stopwatch Infographic Template for PowerPoint & Google Slides
Process
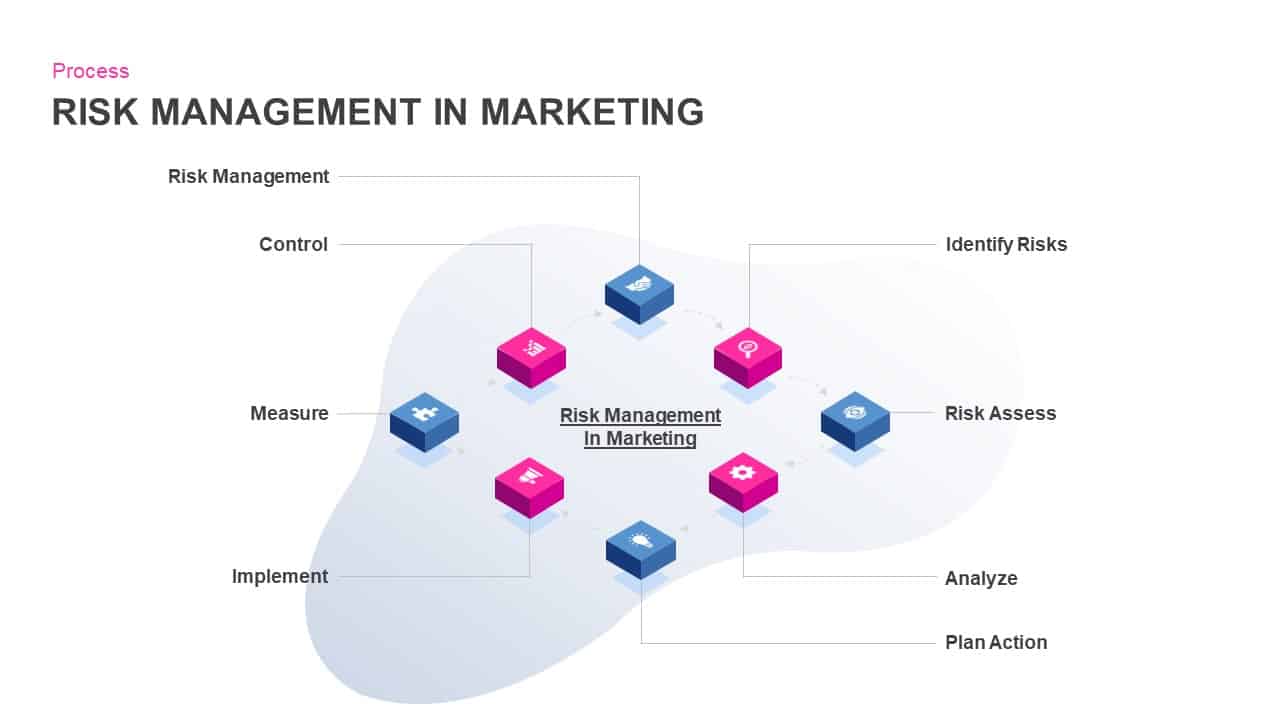
Risk Management in Marketing Process Template for PowerPoint & Google Slides
Risk Management
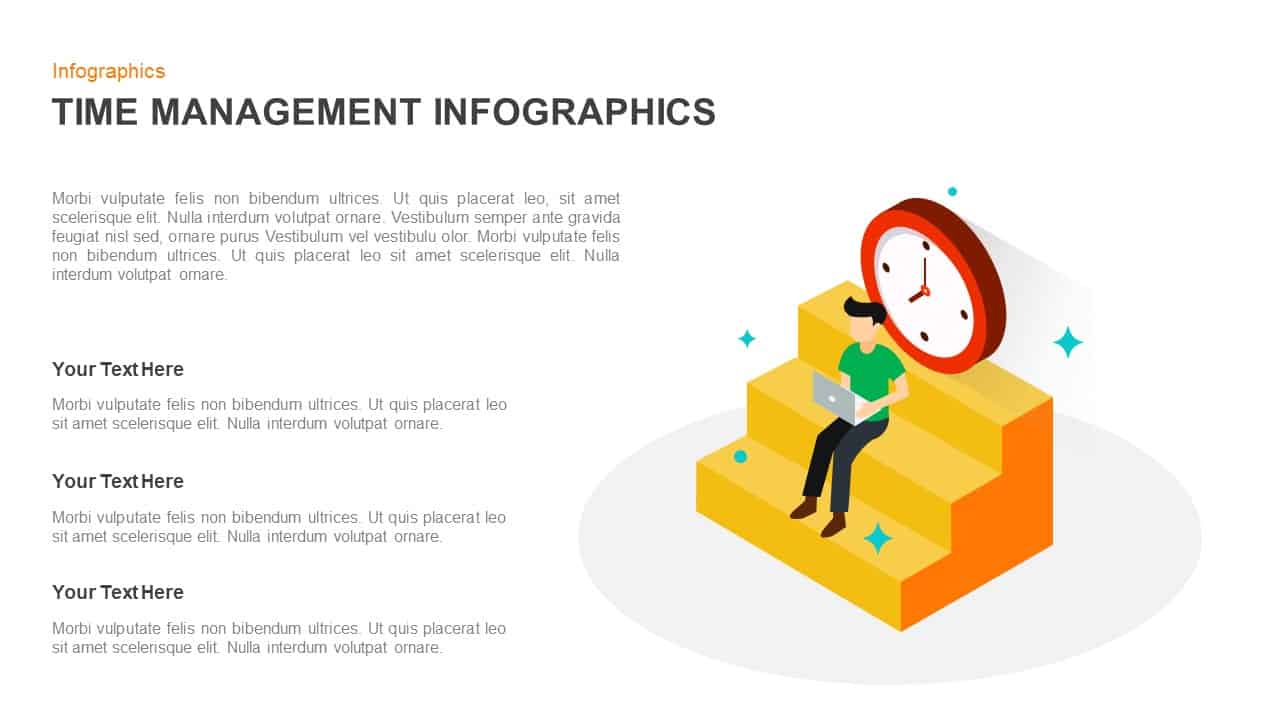
Isometric Time Management Infographic Template for PowerPoint & Google Slides
Process
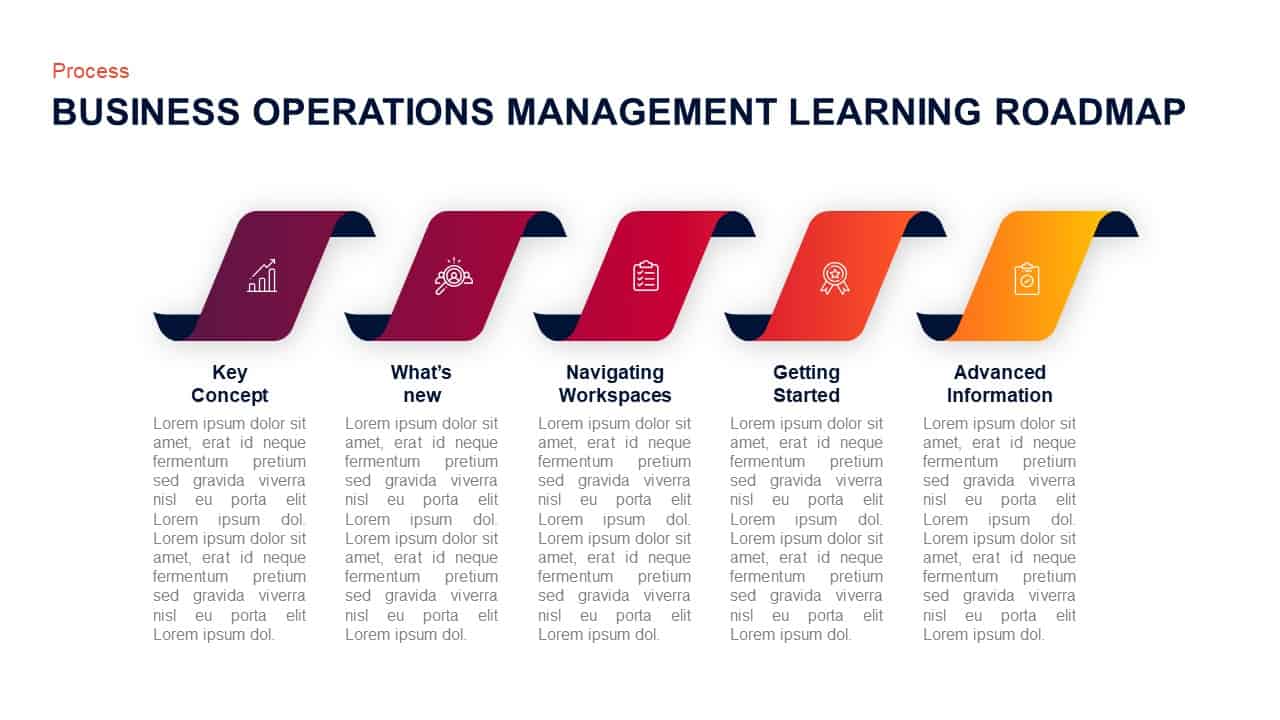
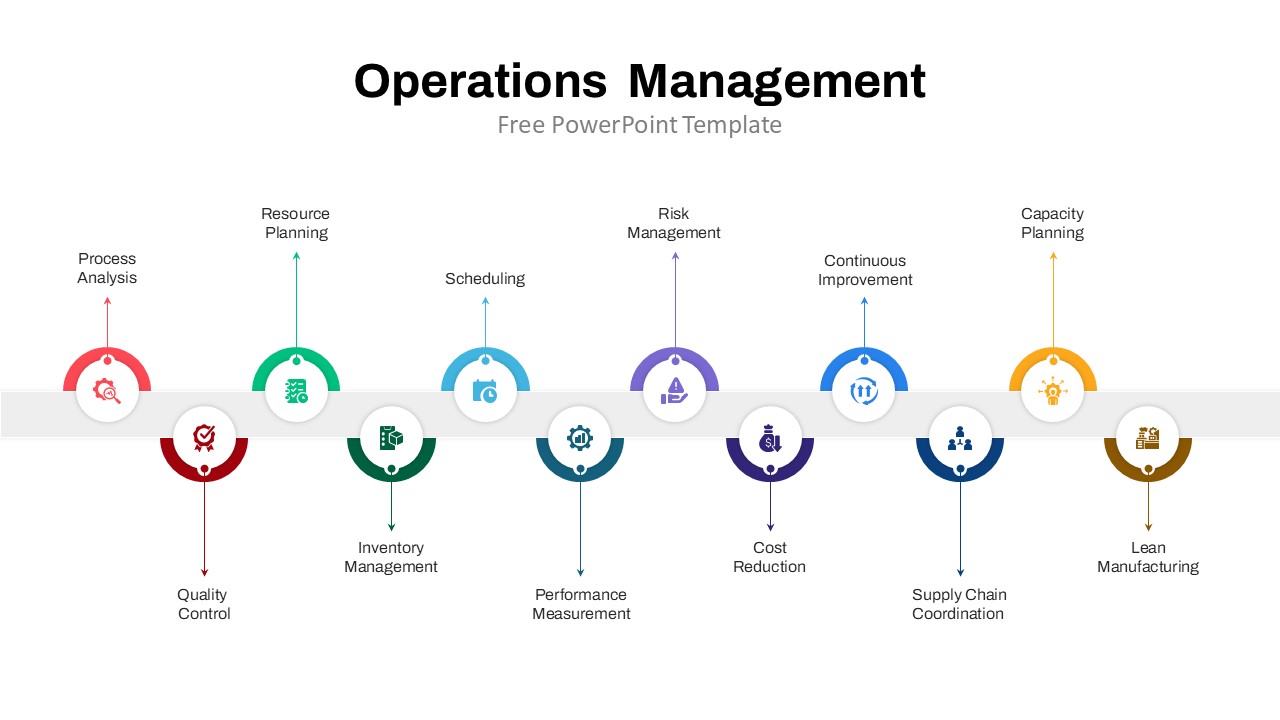
Operations Management Learning Roadmap Template for PowerPoint & Google Slides
Roadmap
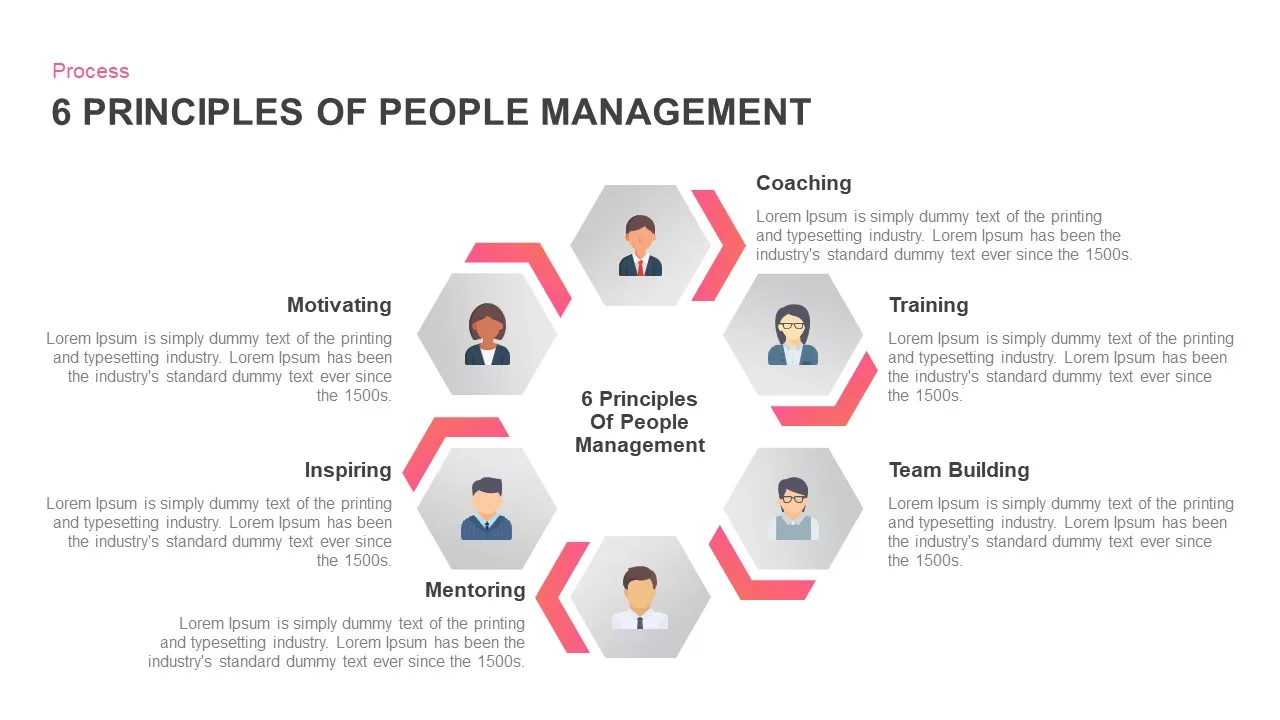
Six Principles of People Management Template for PowerPoint & Google Slides
HR
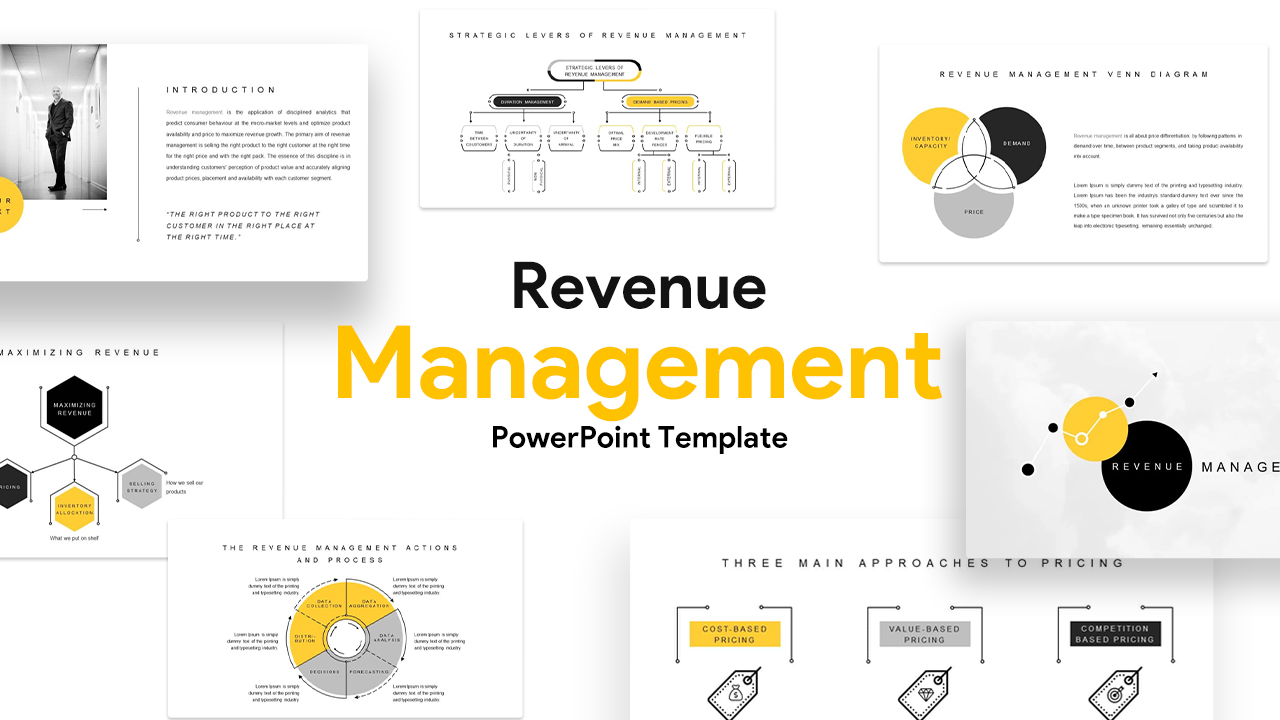
Revenue Management Business Strategy Template for PowerPoint & Google Slides
Revenue
Performance Review Progress Management Template for PowerPoint & Google Slides
Process
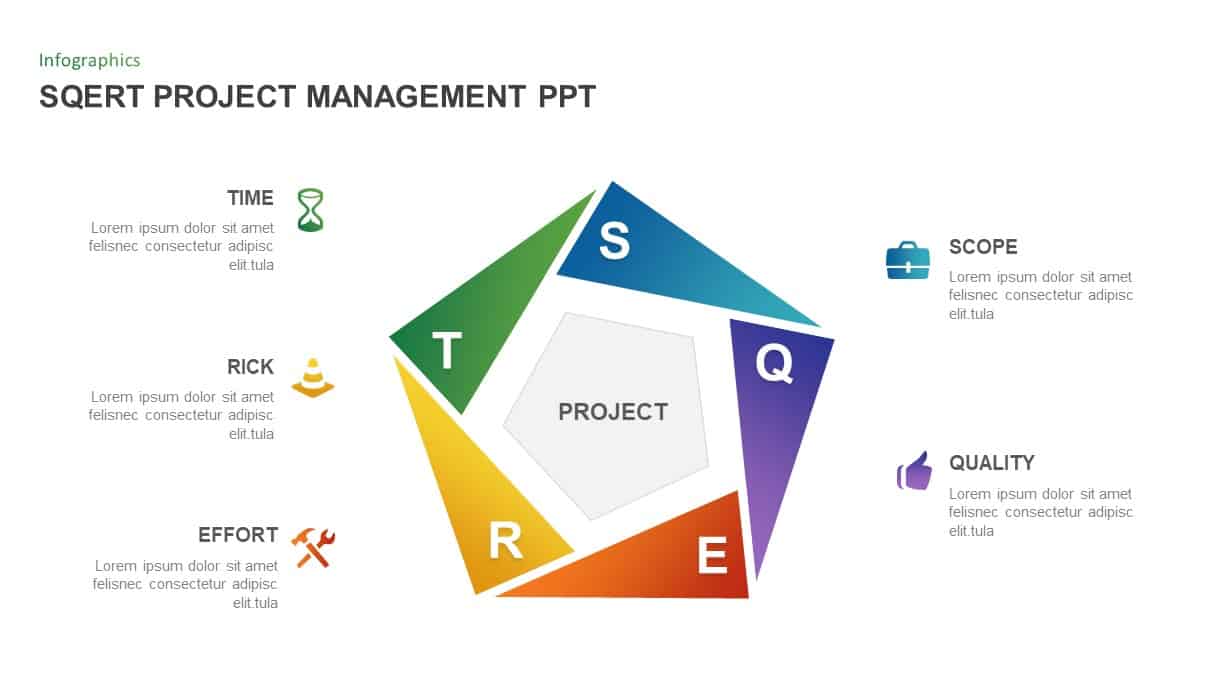
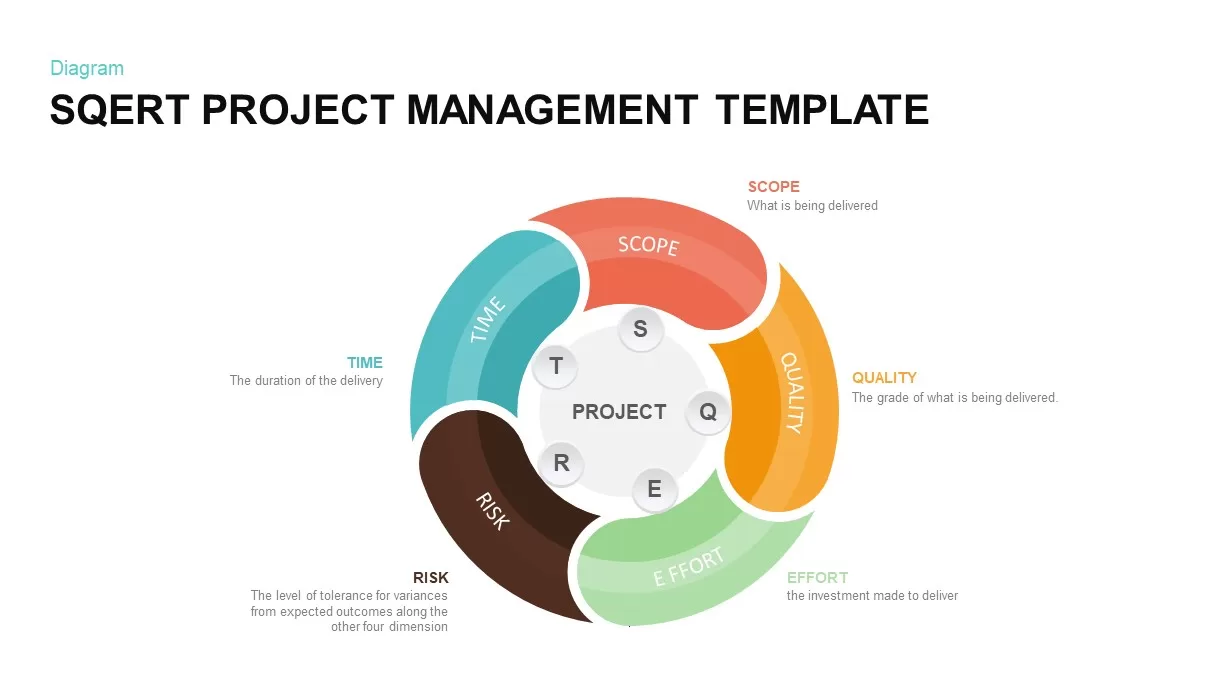
SQERT Project Management Infographic Template for PowerPoint & Google Slides
Process
SQERT Project Management Infographic Template for PowerPoint & Google Slides
Process
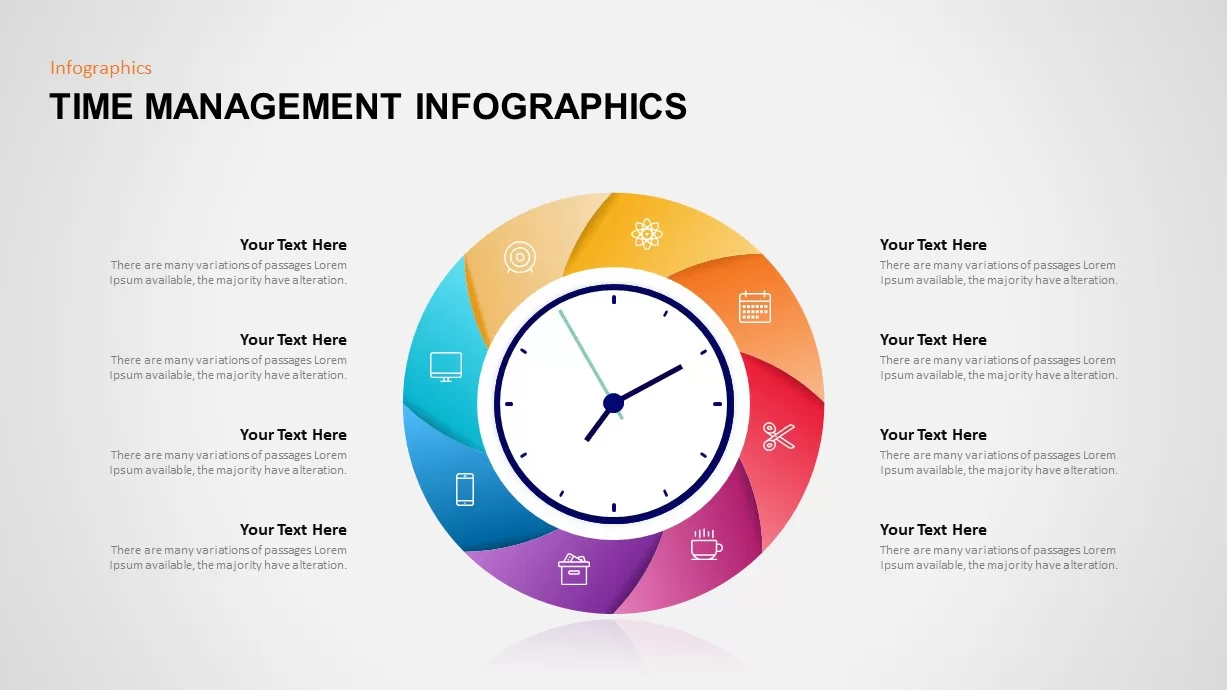
Time Management Infographics Template for PowerPoint & Google Slides
Process
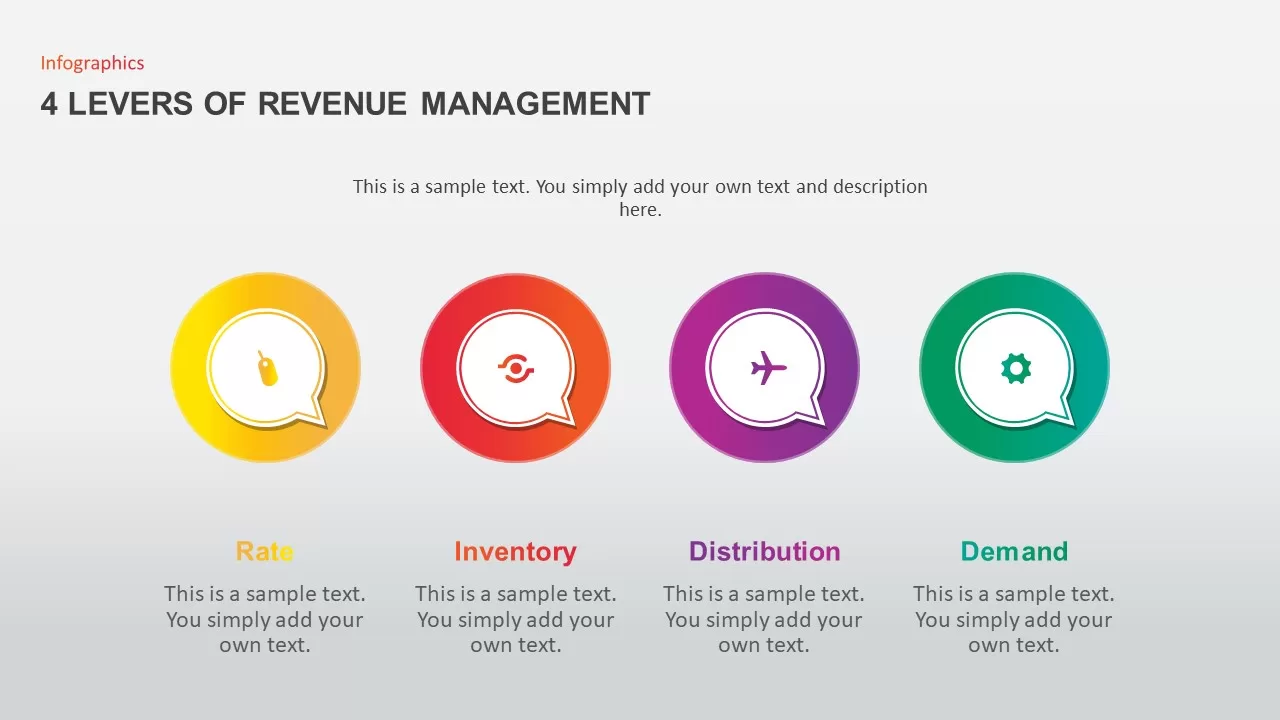
4 Levers of Revenue Management Infographic Template for PowerPoint & Google Slides
Infographics
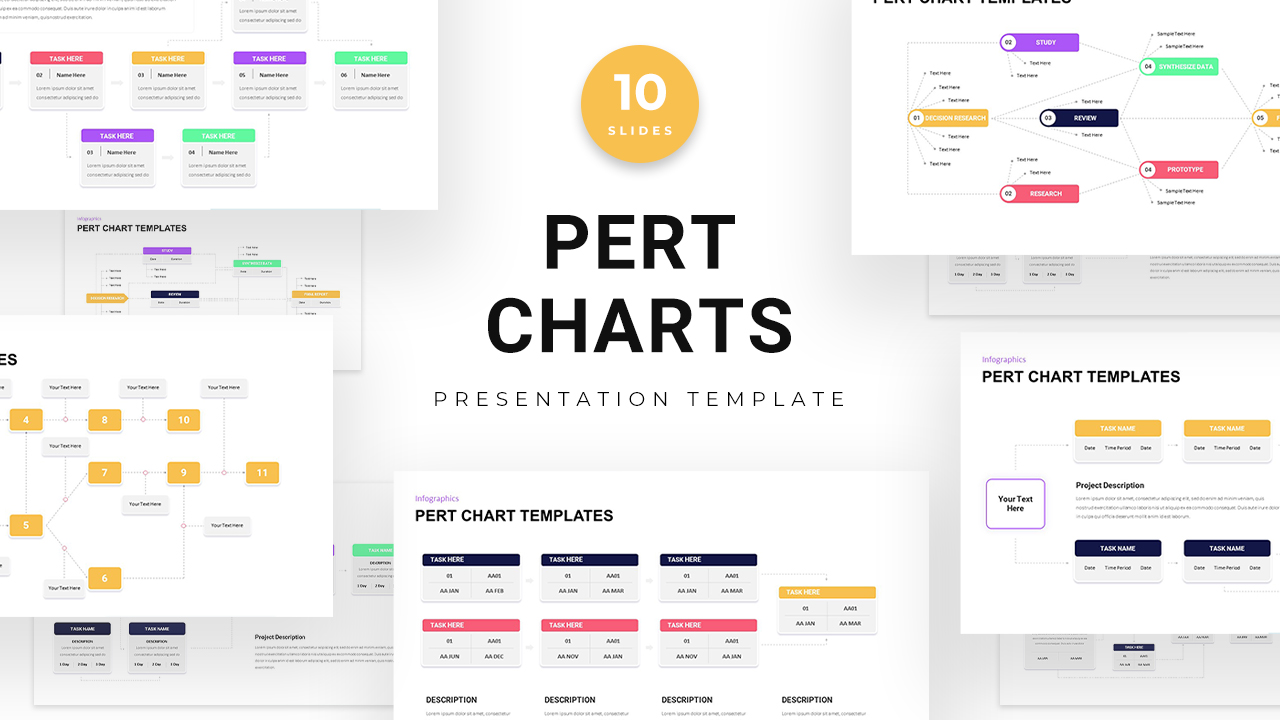
PERT Chart Project Management template for PowerPoint & Google Slides
Project Status
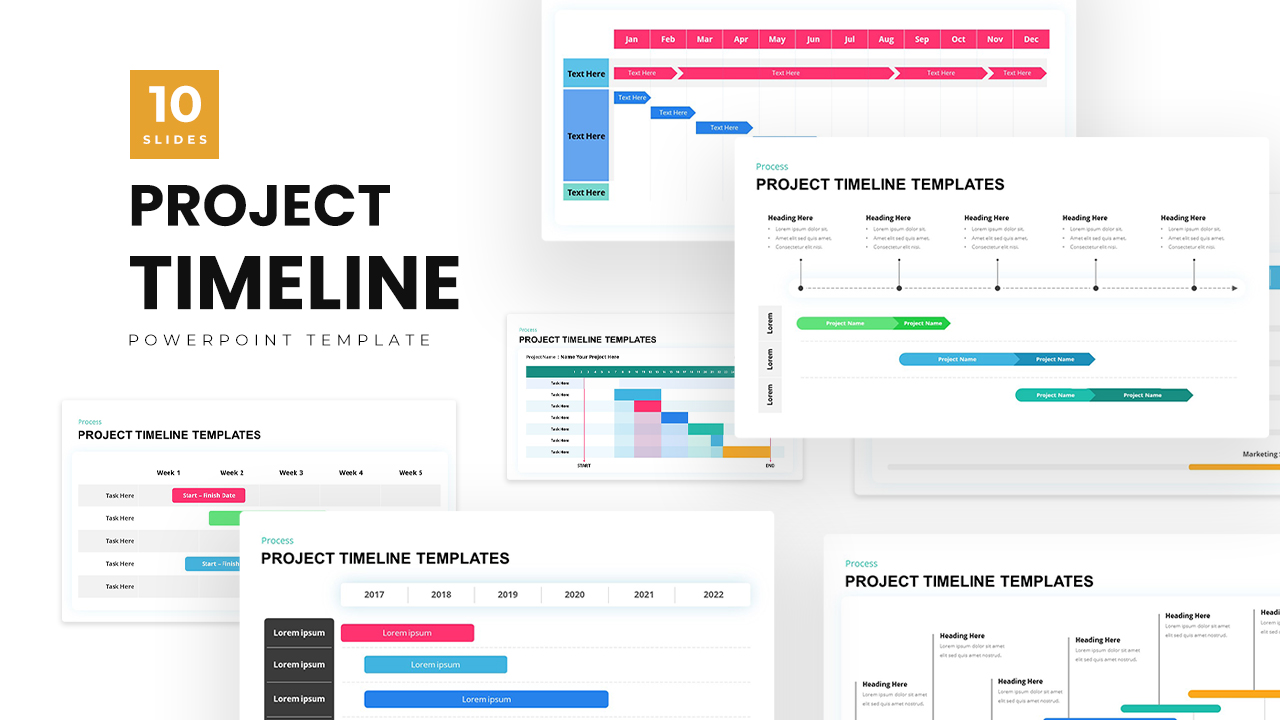
Project Timeline Management template for PowerPoint & Google Slides
Infographics
Corporate Performance Management Template for PowerPoint & Google Slides
Pitch Deck
Disaster Management Template for PowerPoint & Google Slides
Decks

Change Management Infographic Deck Template for PowerPoint & Google Slides
Business Strategy
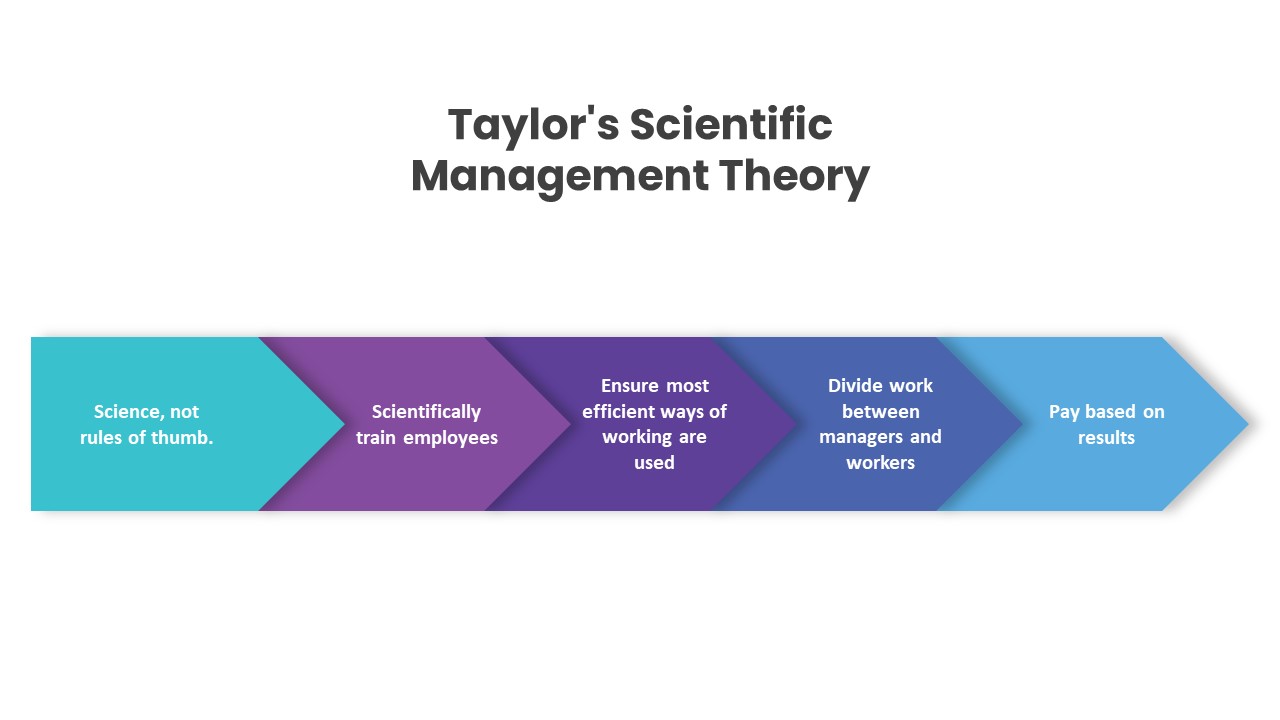
Taylor’s Scientific Management Theory Template for PowerPoint & Google Slides
Process
Event Management Presentation Template for PowerPoint & Google Slides
Decks
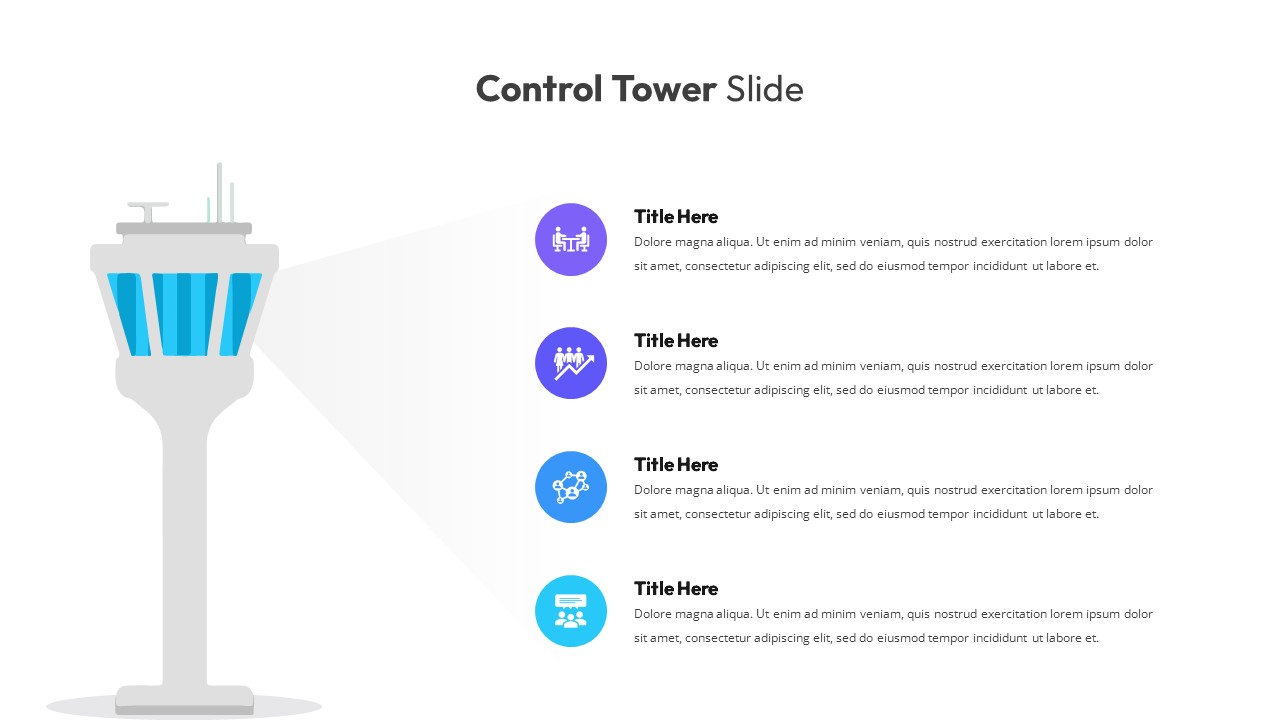
Control Tower Management template for PowerPoint & Google Slides
Infographics
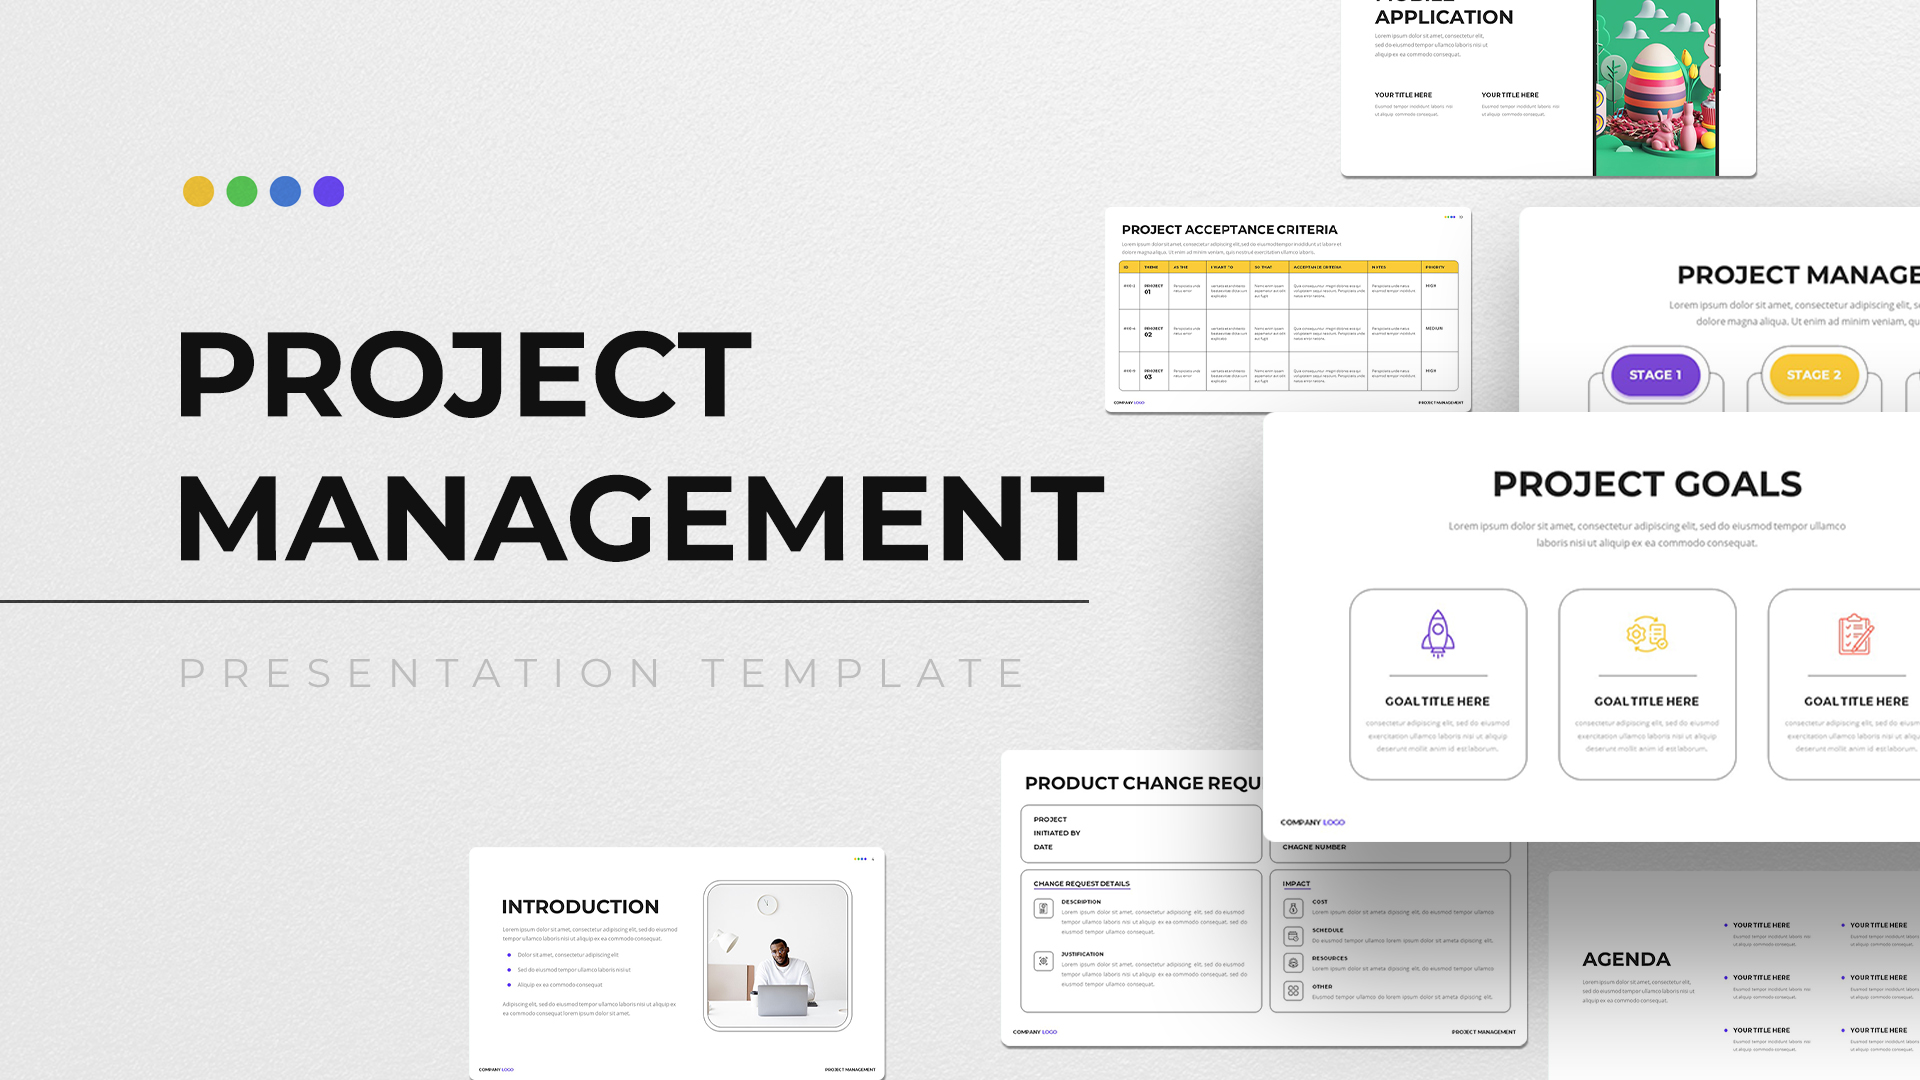
Project Management Deck template for PowerPoint & Google Slides
Project
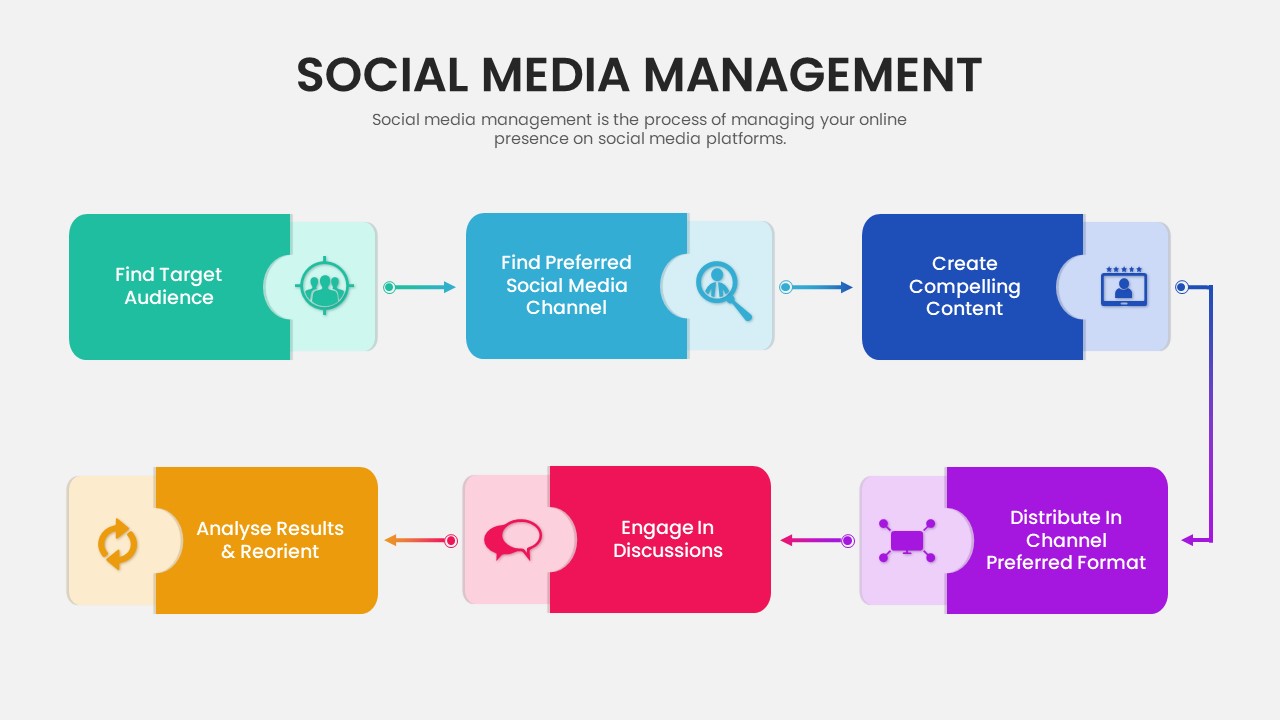
Six-Step Social Media Management Process Template for PowerPoint & Google Slides
Process
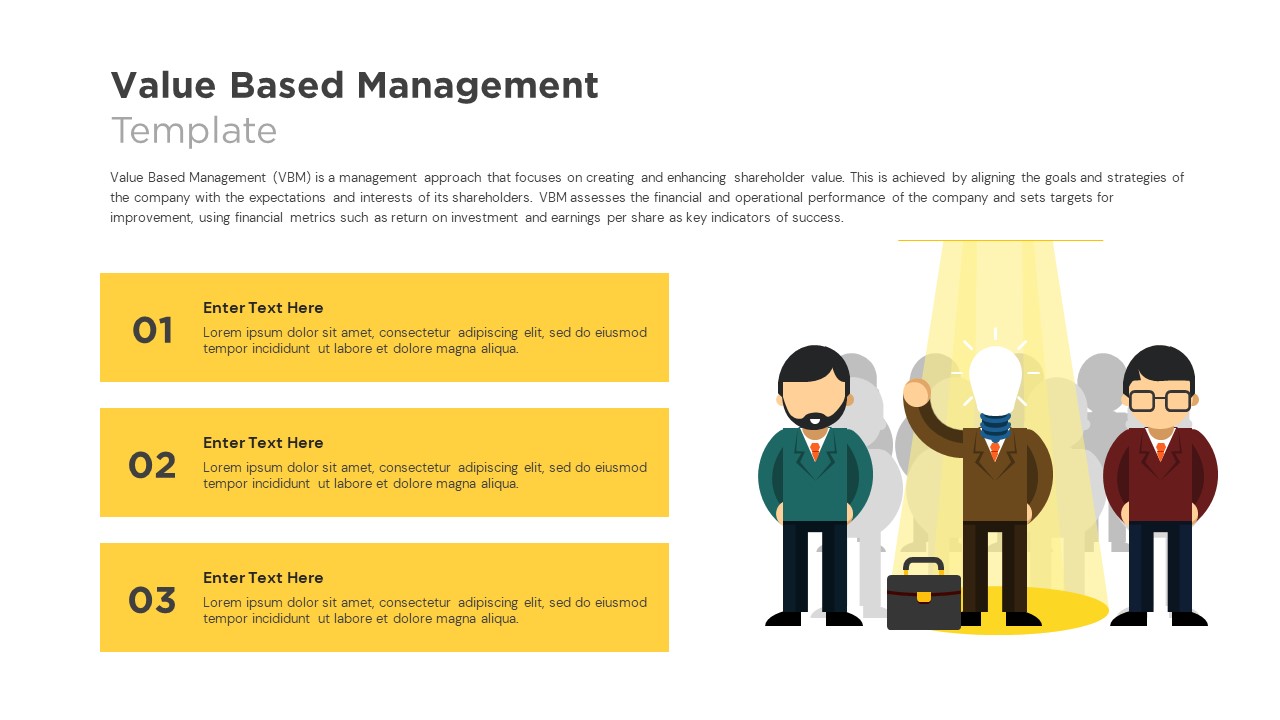
Value Based Management Step-by-Step Template for PowerPoint & Google Slides
Business Strategy
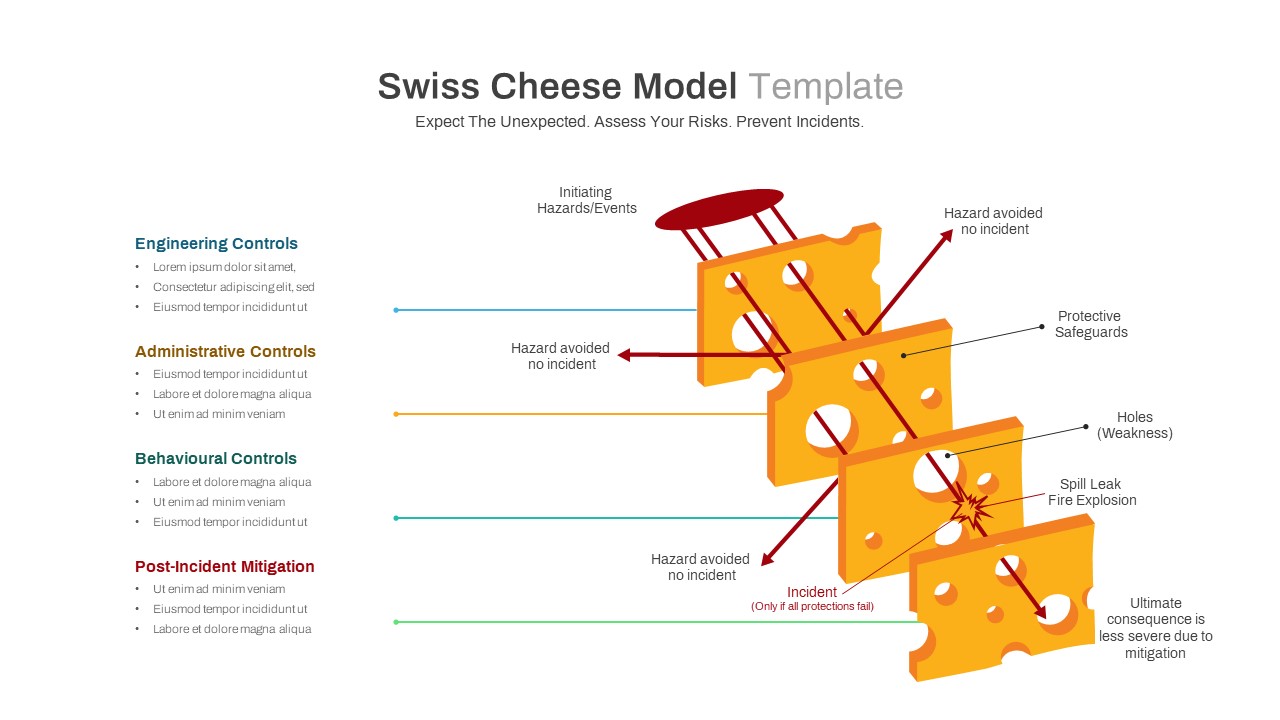
Swiss Cheese Risk Management Model Template for PowerPoint & Google Slides
Risk Management
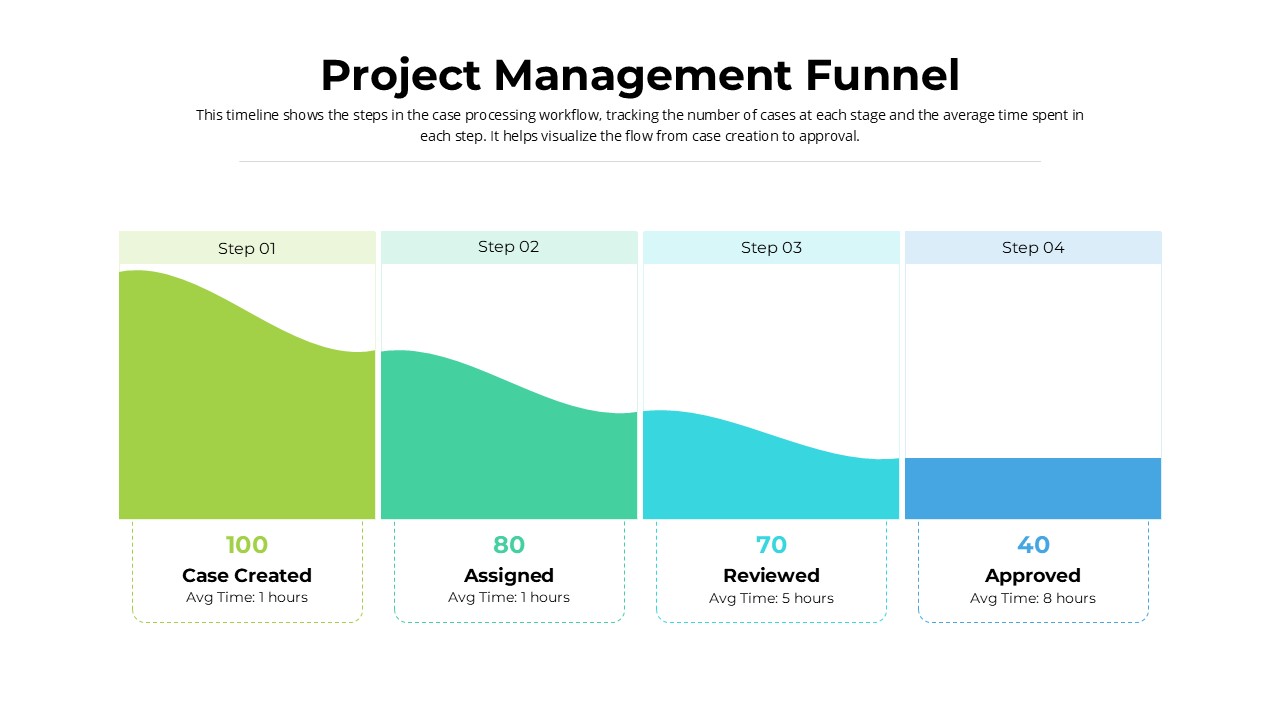
Project Management Funnel template for PowerPoint & Google Slides
Project
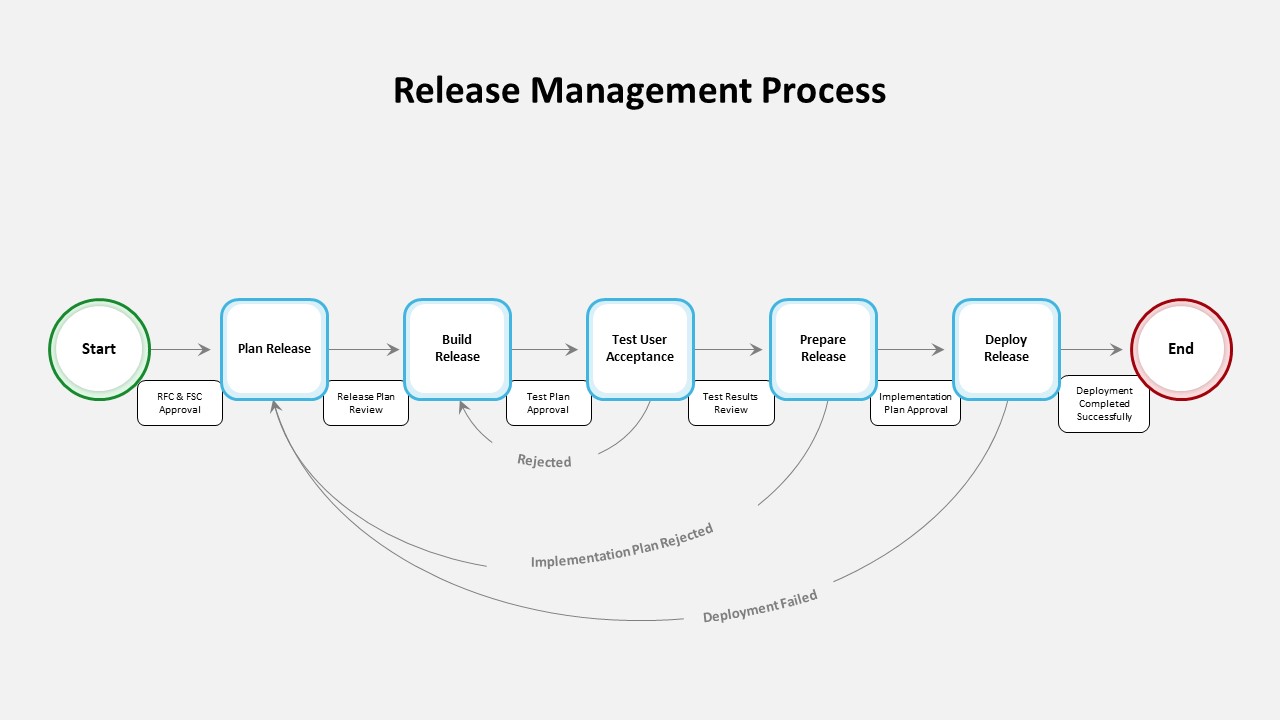
IT Agile Release Management Process Template for PowerPoint & Google Slides
Software Development
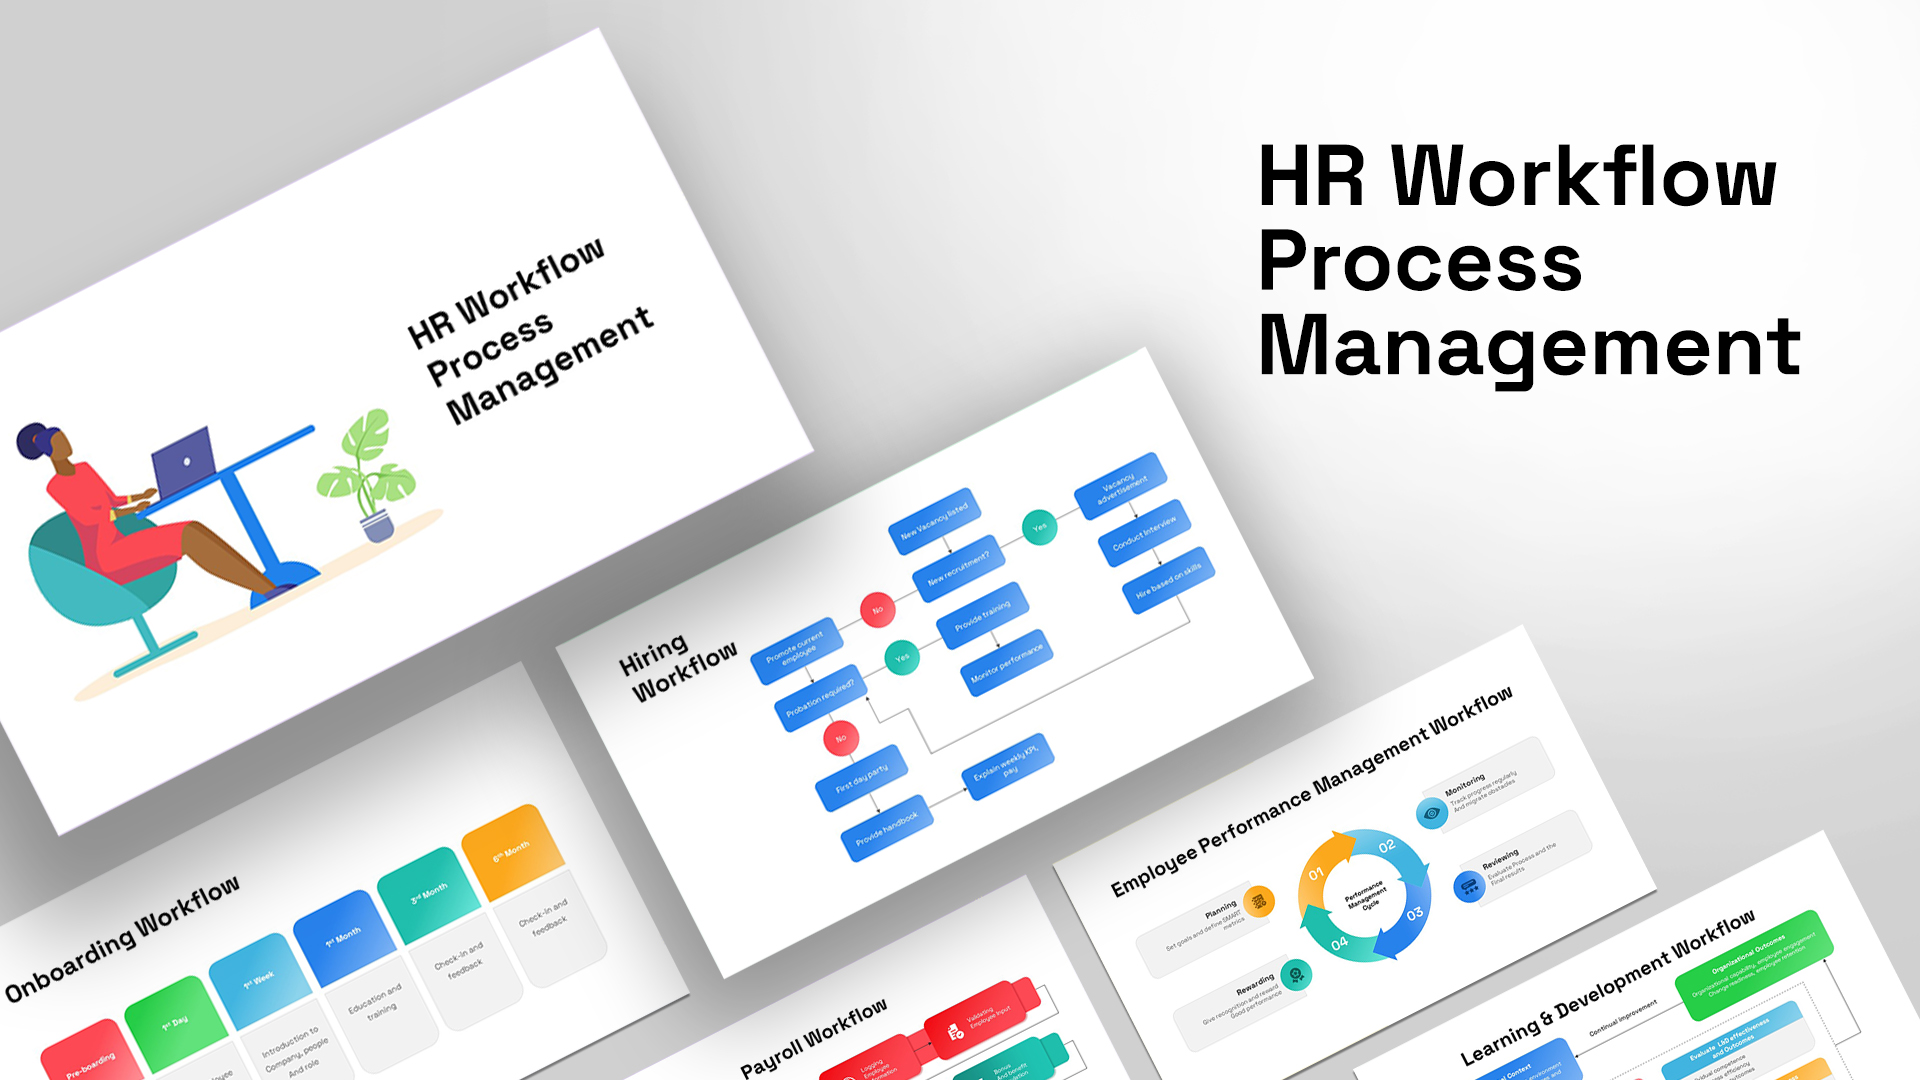
HR Workflow Process Management Template for PowerPoint & Google Slides
HR
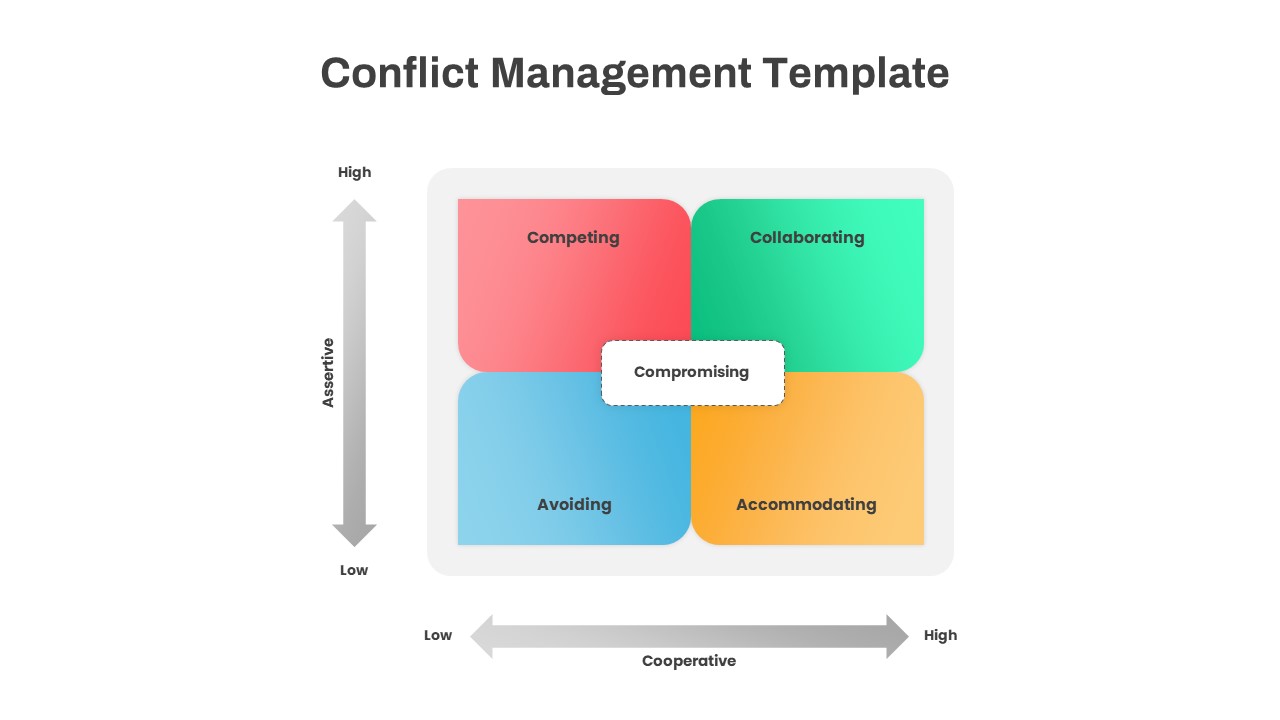
Conflict Management Matrix Template for PowerPoint & Google Slides
Leadership
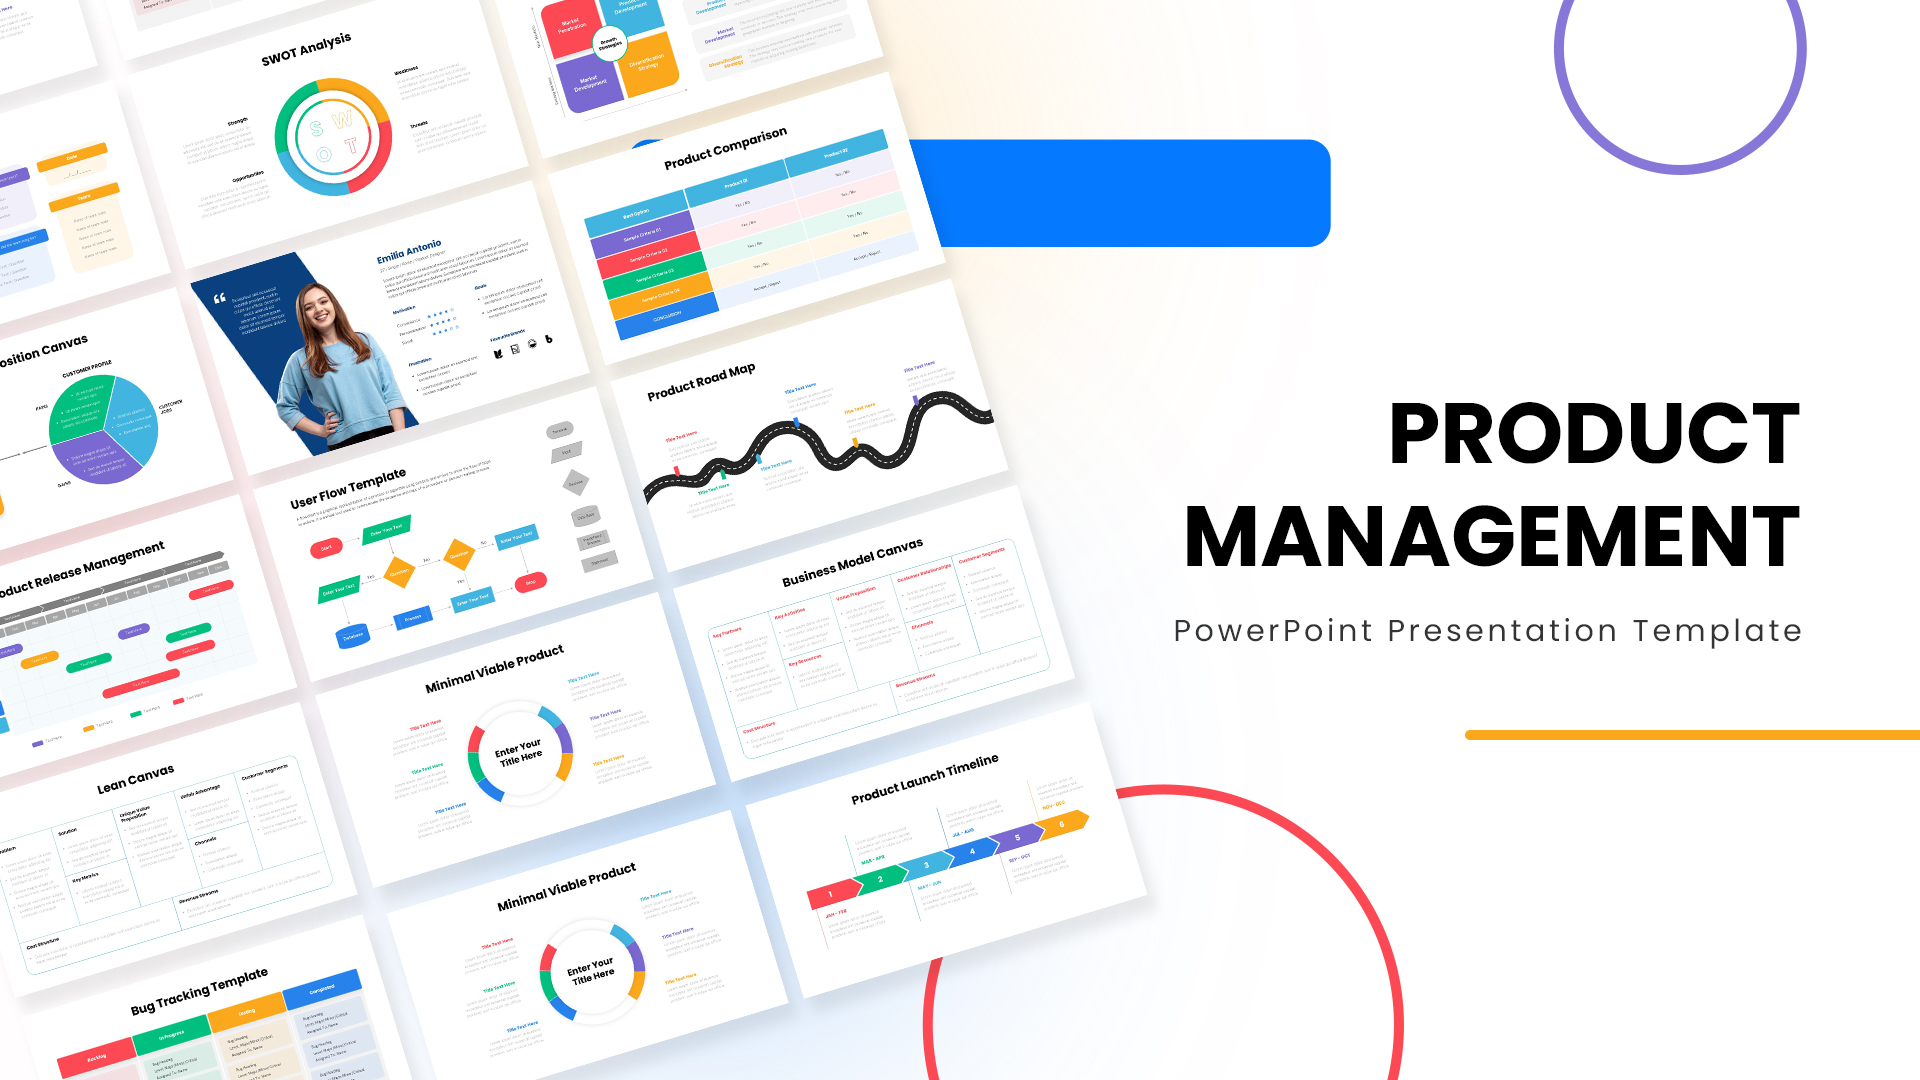
Product Management Presentation Template for PowerPoint & Google Slides
Project Status
Management Consulting Toolkit Template for PowerPoint & Google Slides
Decks
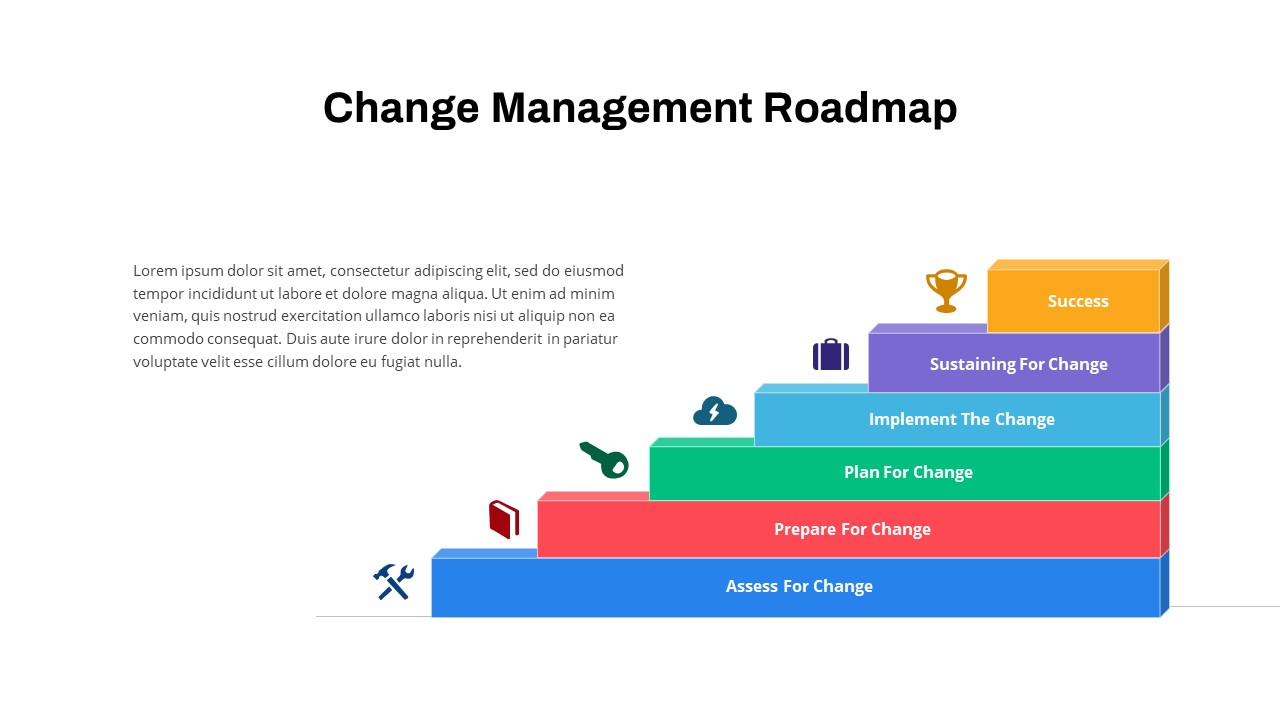
Colorful Change Management Roadmap Template for PowerPoint & Google Slides
Roadmap
Free Comprehensive Management Strategy Deck Template for PowerPoint & Google Slides
Pitch Deck
Free
Operations Management Free Timeline Template for PowerPoint & Google Slides
Process
Free
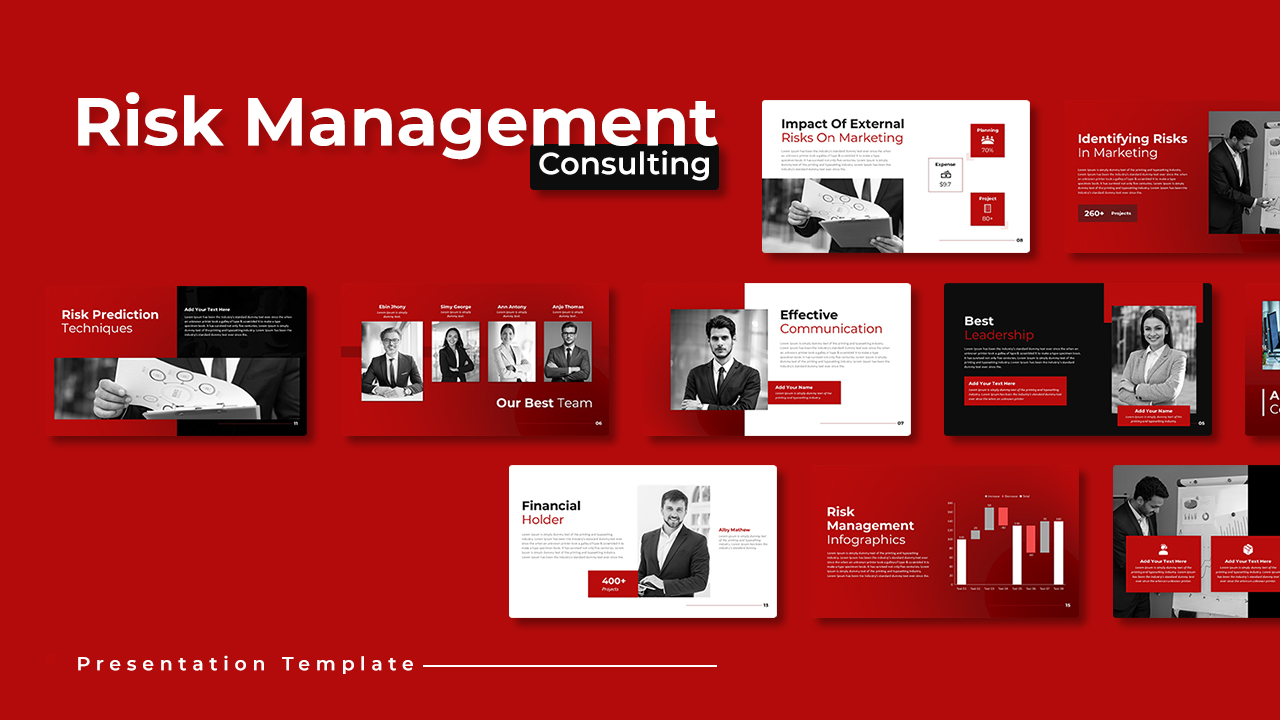
Risk Management Consulting Deck Template for PowerPoint & Google Slides
Risk Management
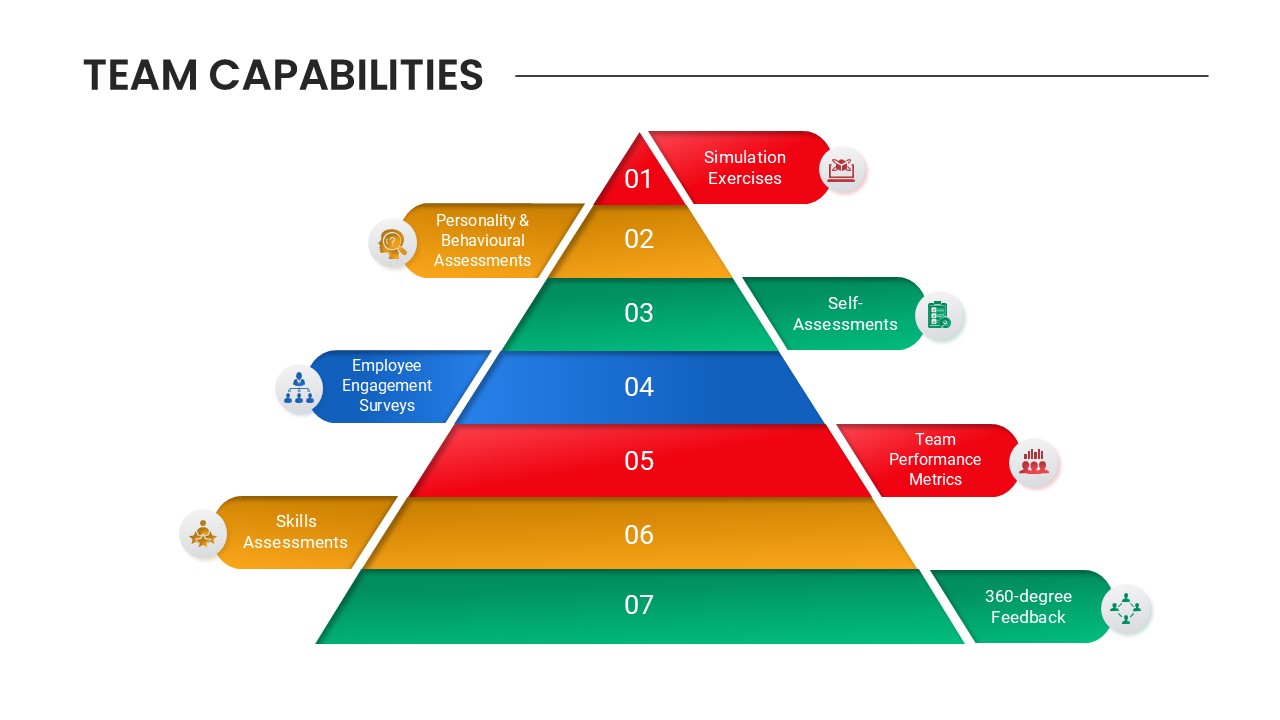
Team Capabilities and Management Template for PowerPoint & Google Slides
Our Team
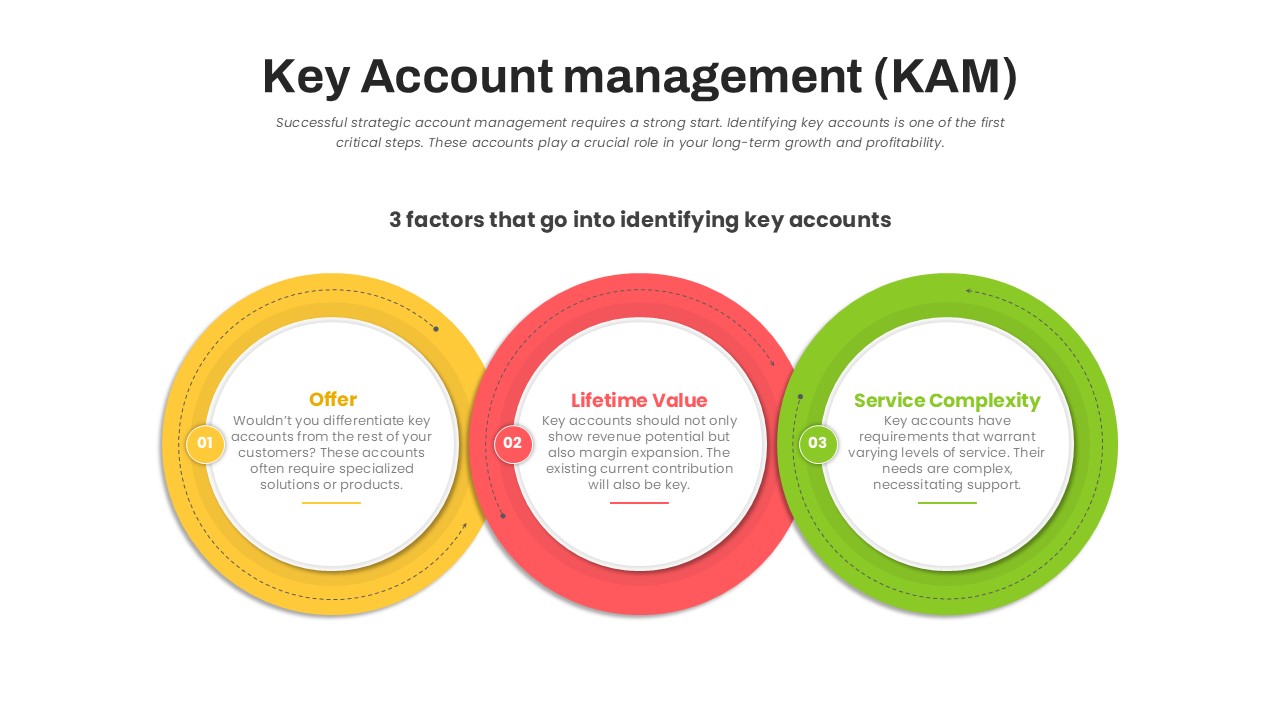
Key Account Management Circular Factors Template for PowerPoint & Google Slides
Circular
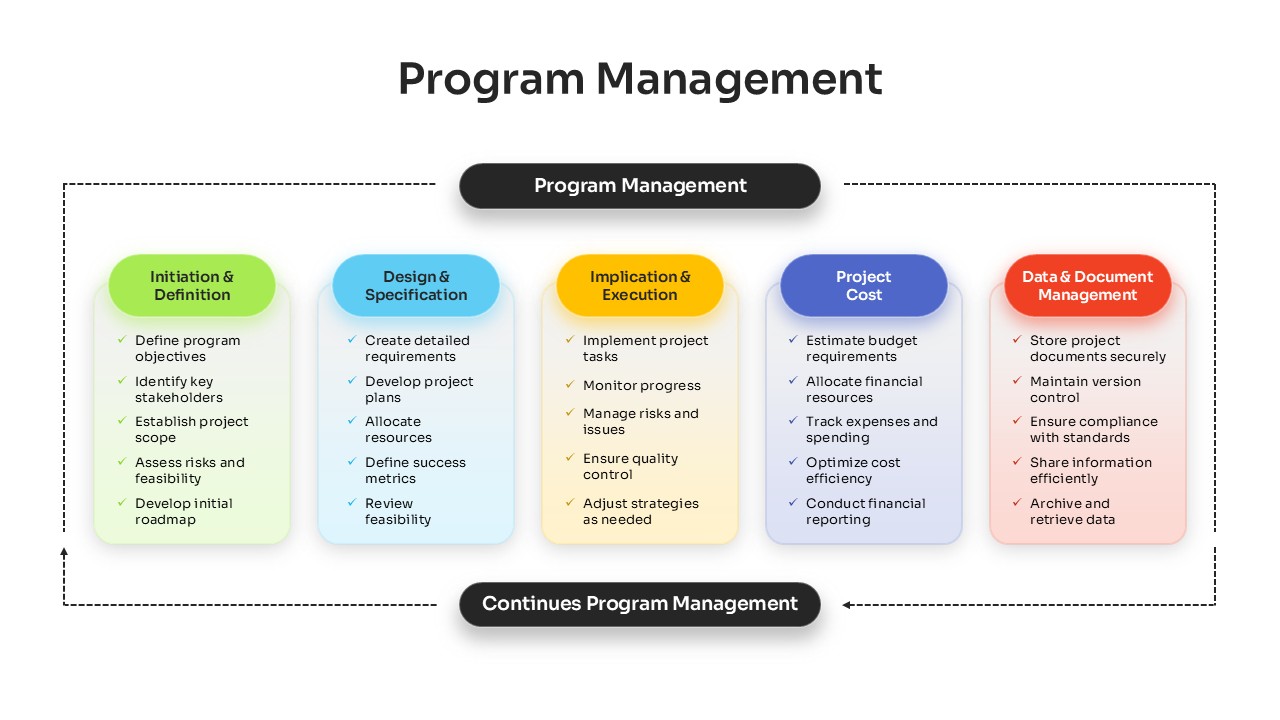
Comprehensive Program Management Process Template for PowerPoint & Google Slides
Process
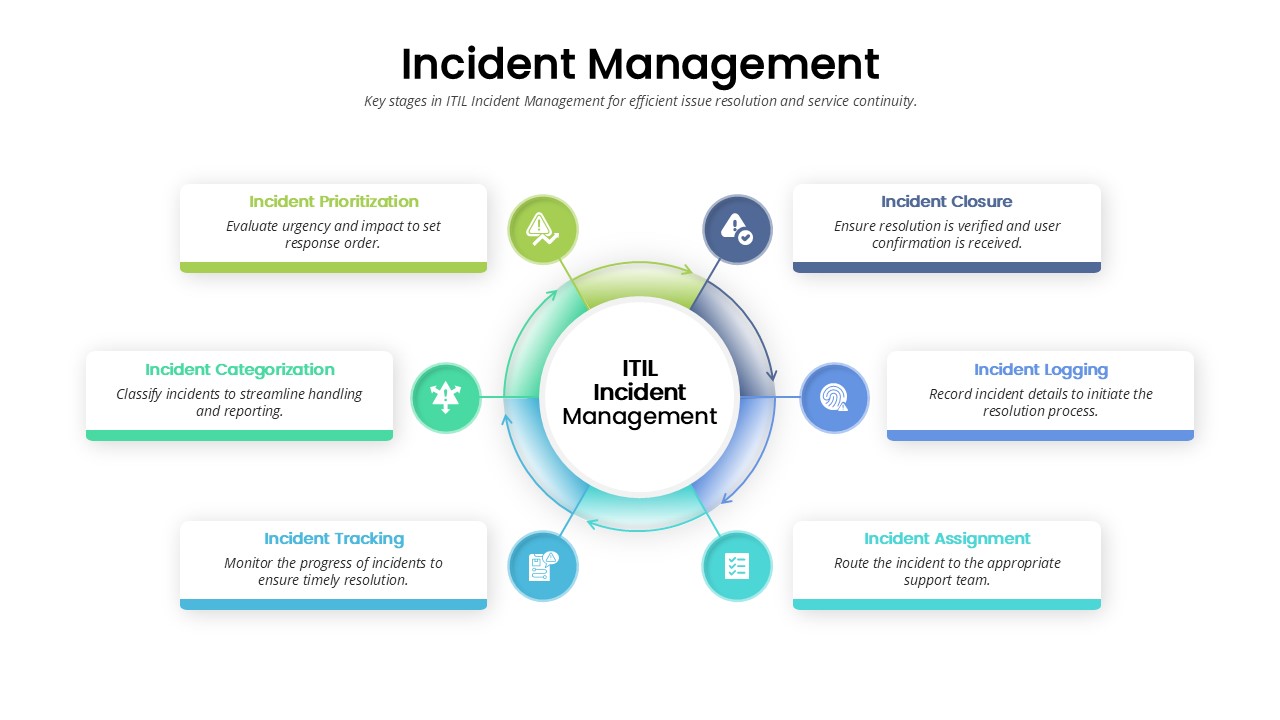
Incident Management Process template for PowerPoint & Google Slides
Process
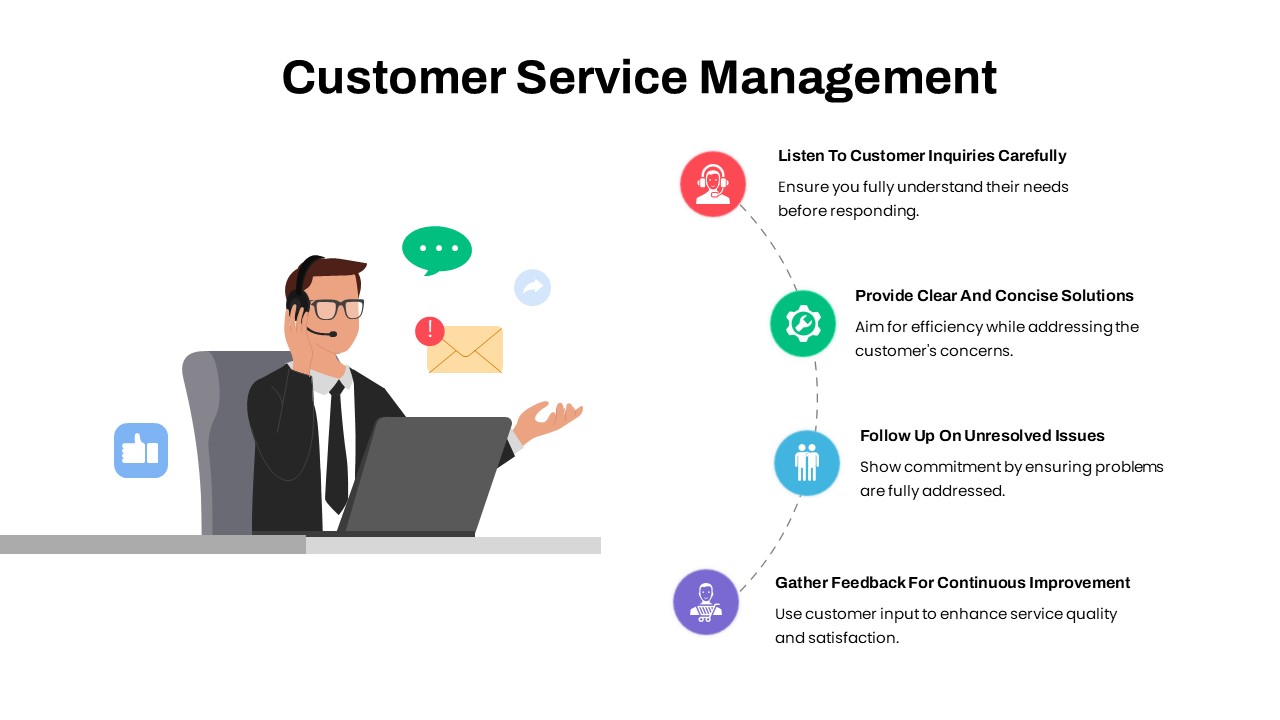
Customer Service Management Process Template for PowerPoint & Google Slides
Process

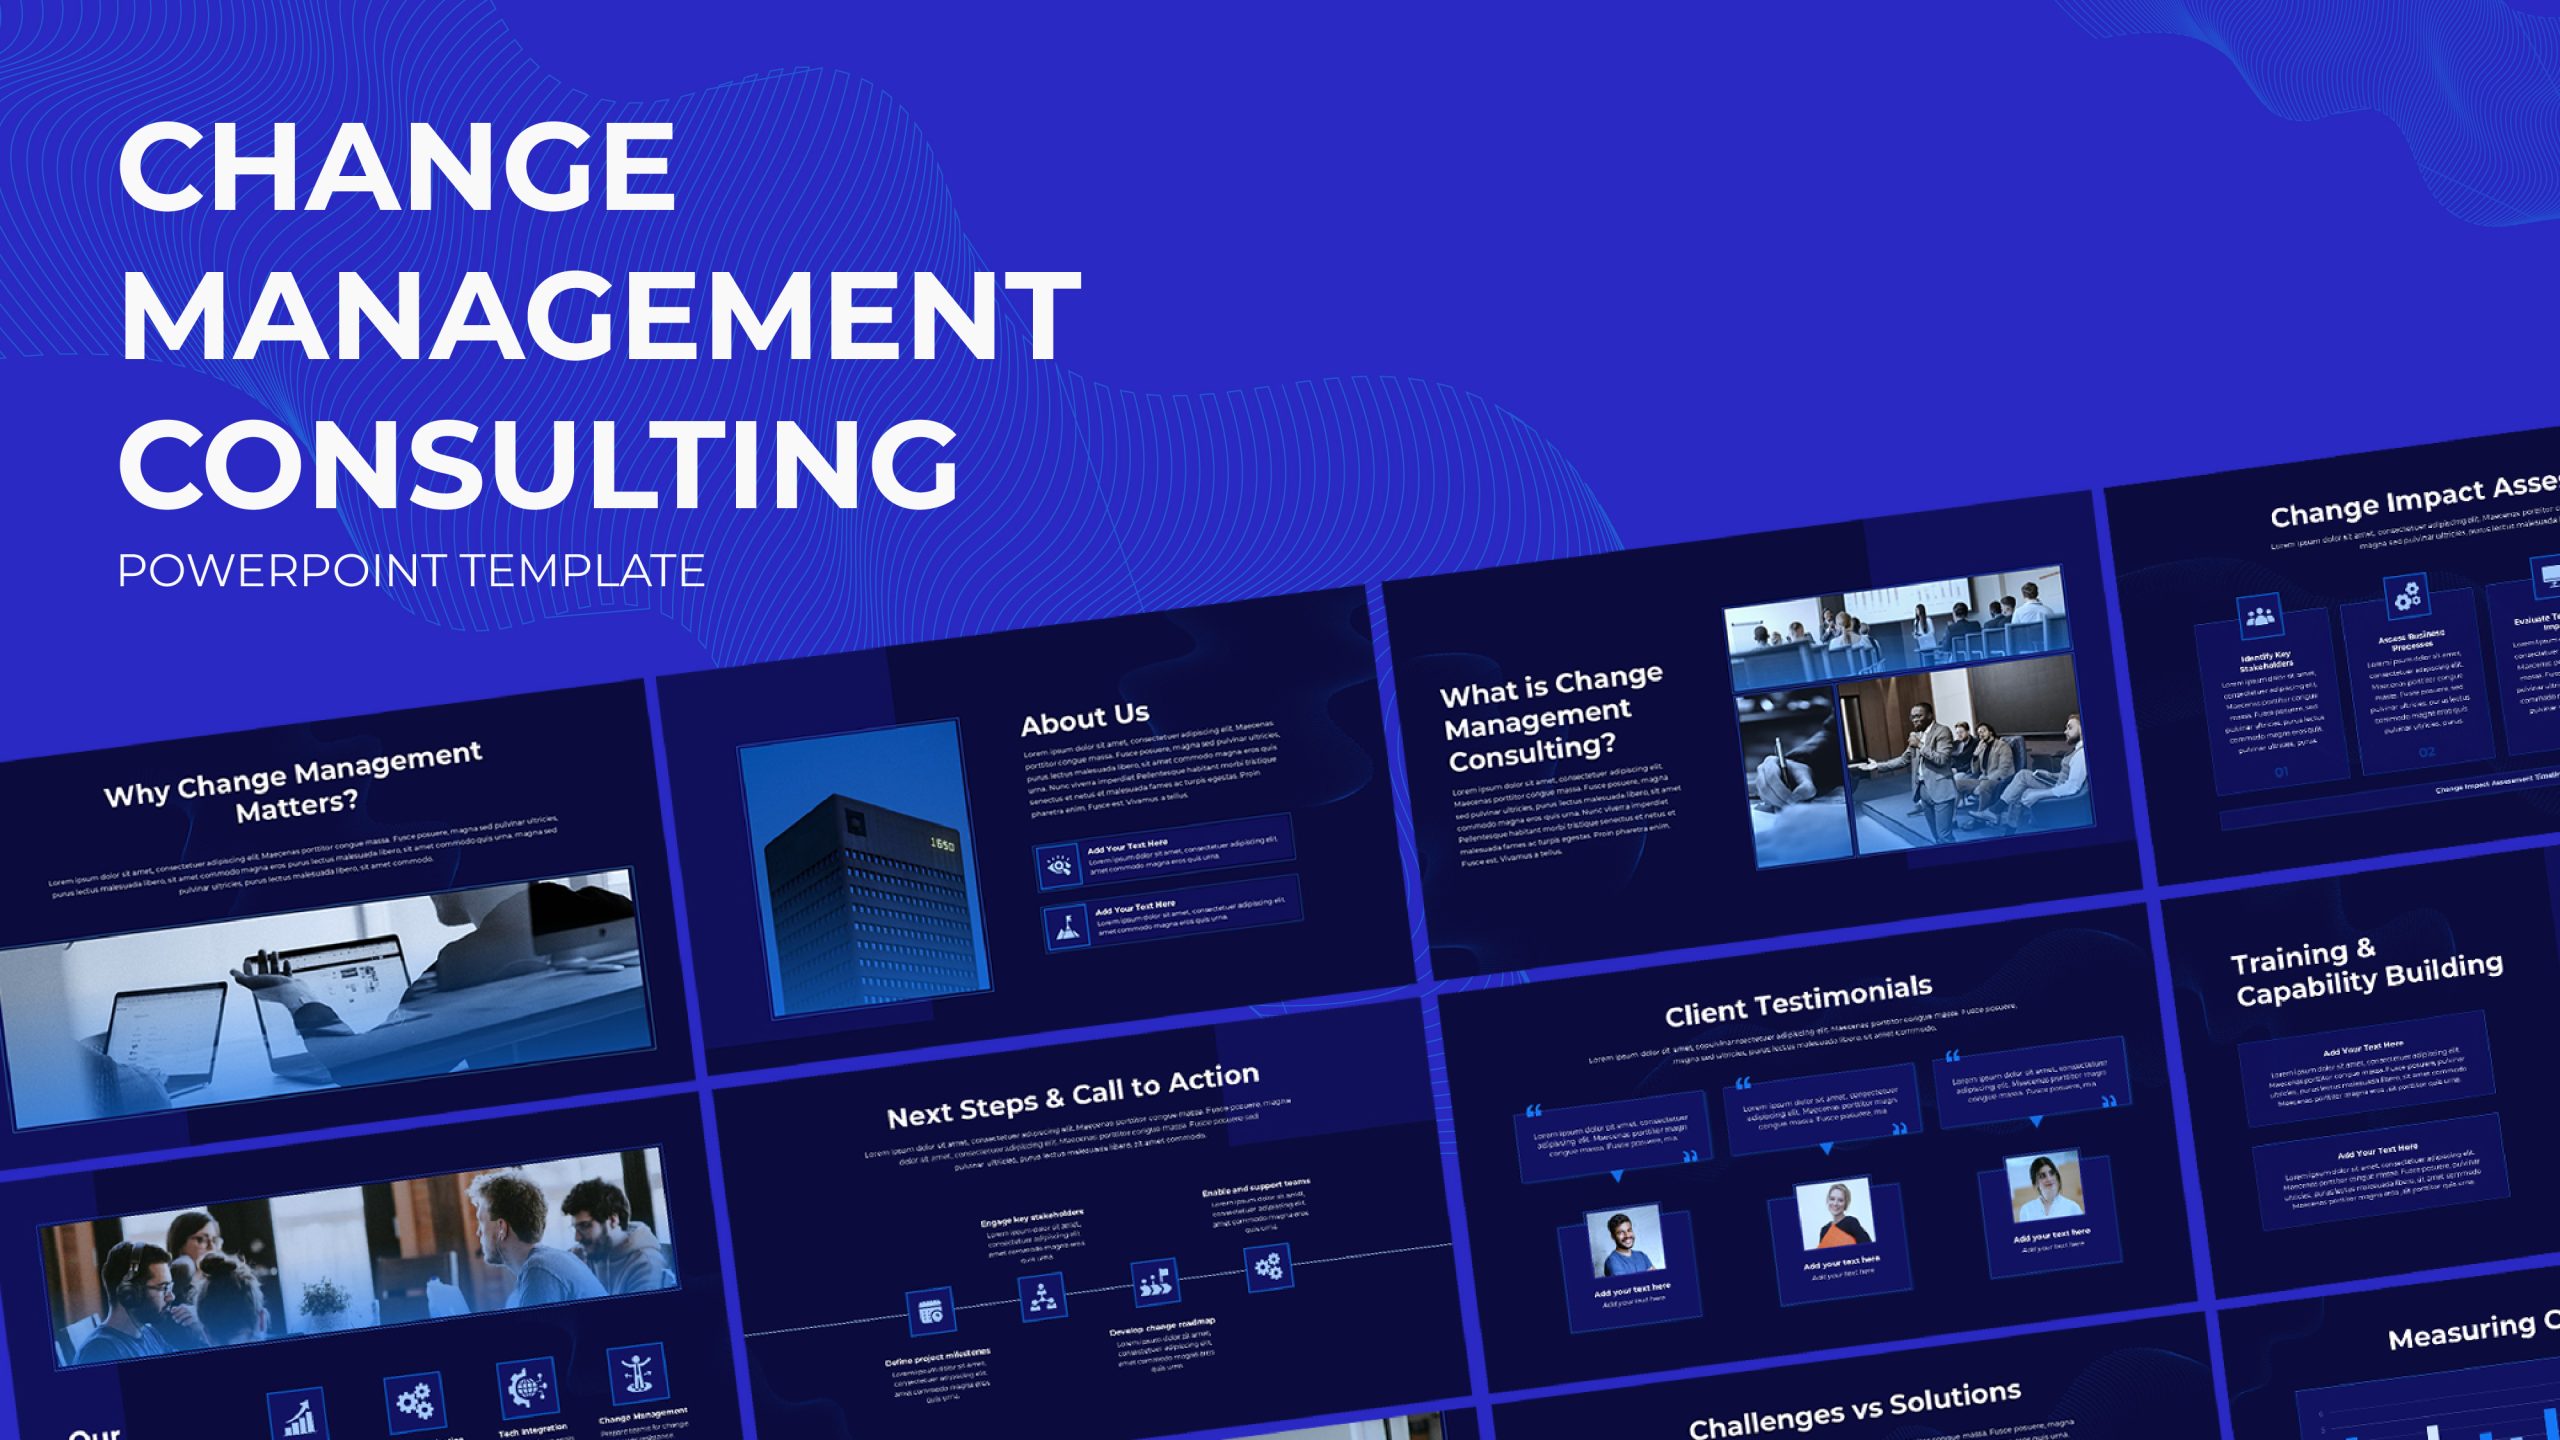
Change Management Consulting template for PowerPoint & Google Slides
Company Profile
Action Items Management Dashboard Table Template for PowerPoint & Google Slides
Project Status
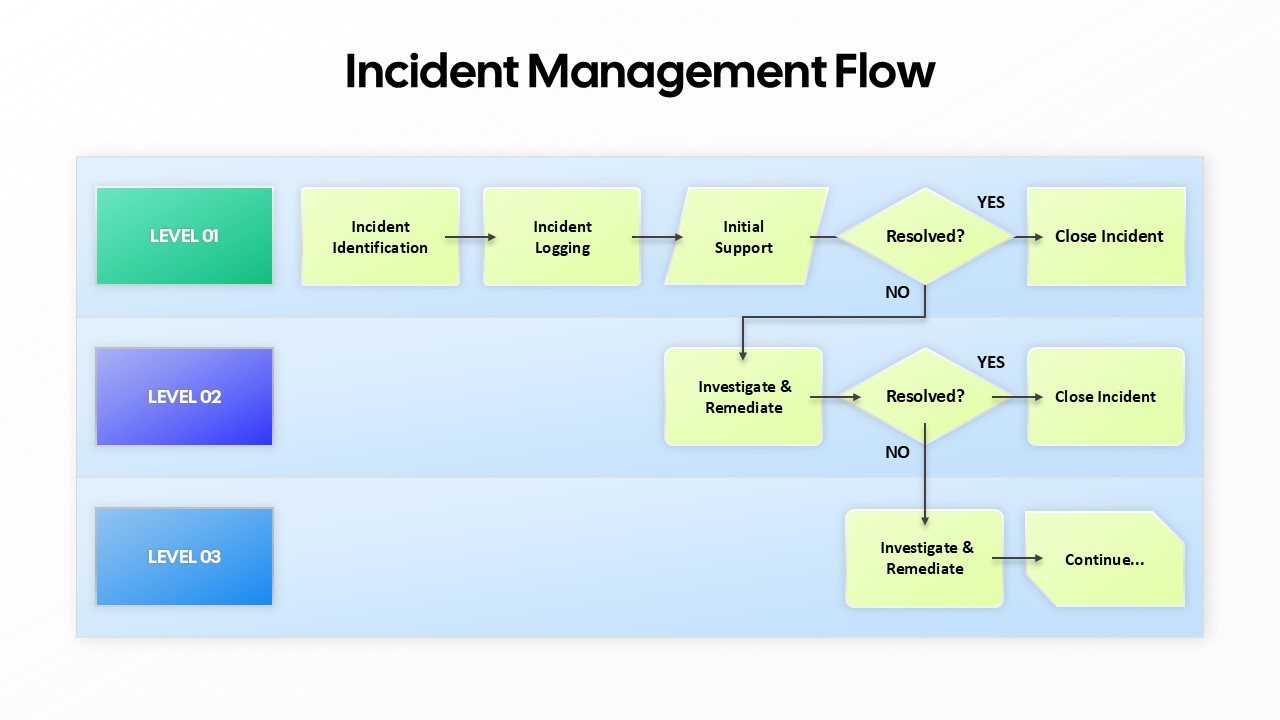
Incident Management Flow Process template for PowerPoint & Google Slides
Flow Charts
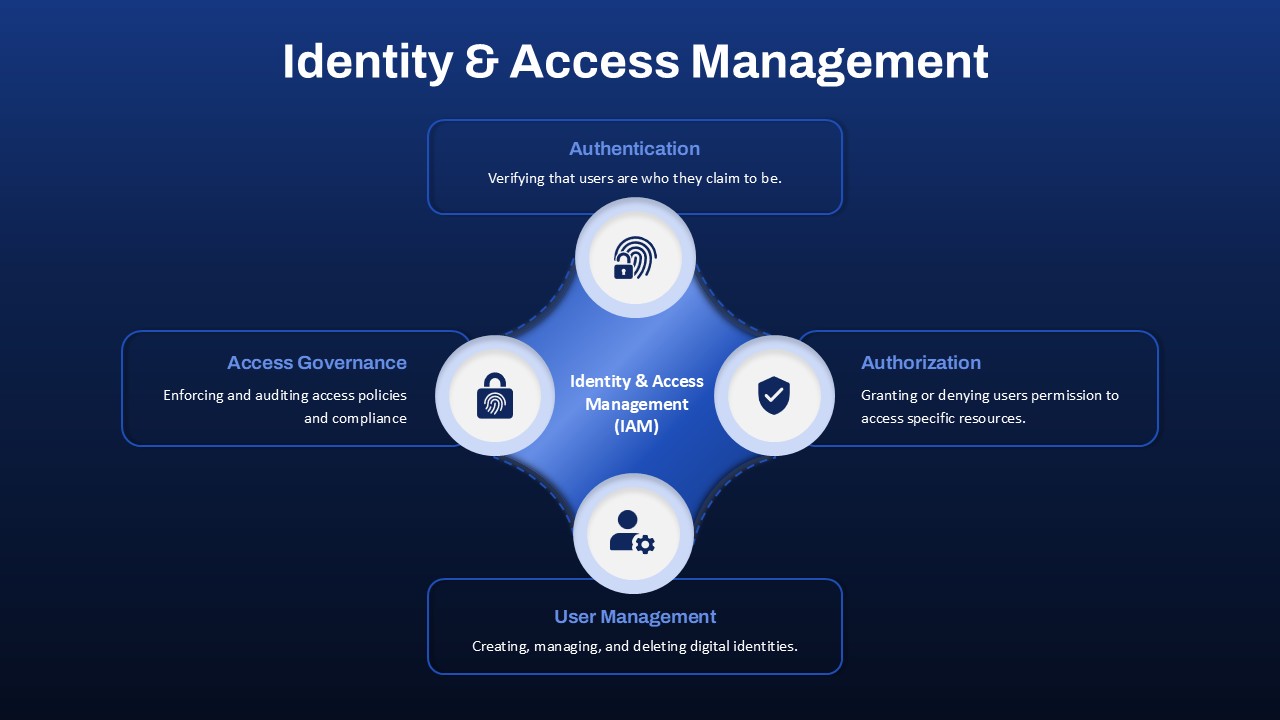
Identity & Access Management template for PowerPoint & Google Slides
Information Technology
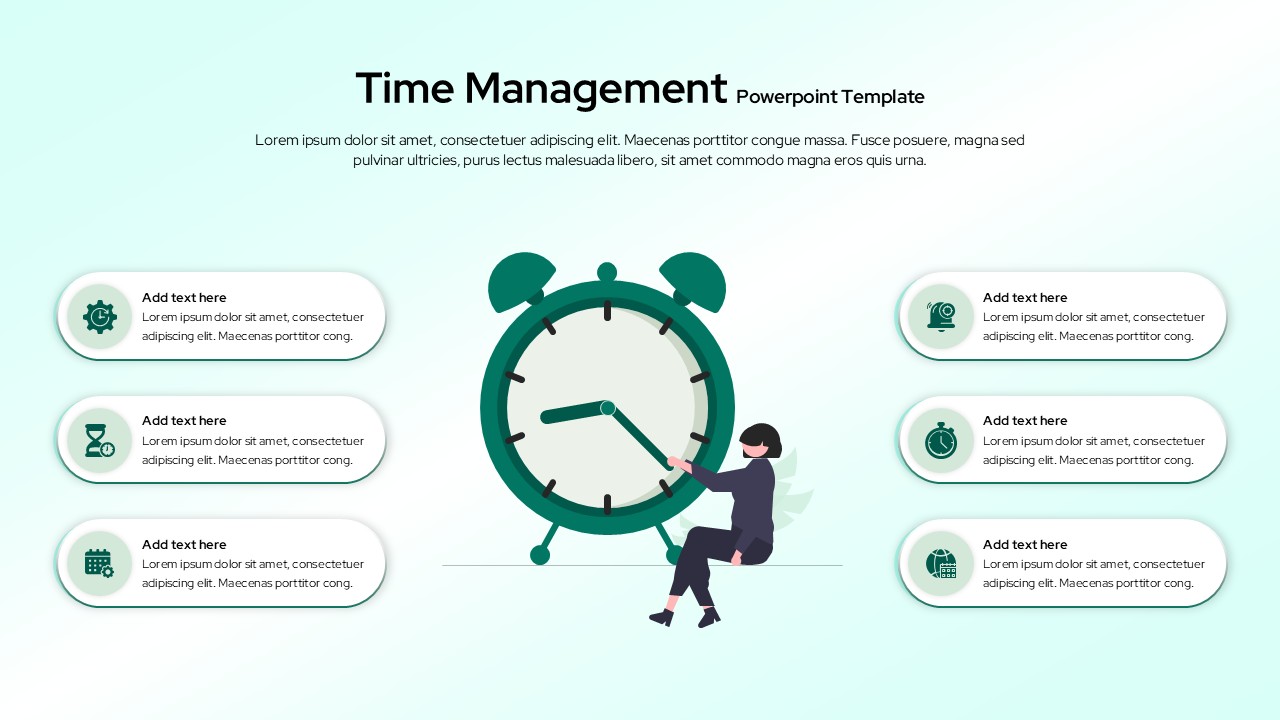
Time Management template for PowerPoint & Google Slides
Business
Project Management Funnel Template for PowerPoint & Google Slides
Funnel
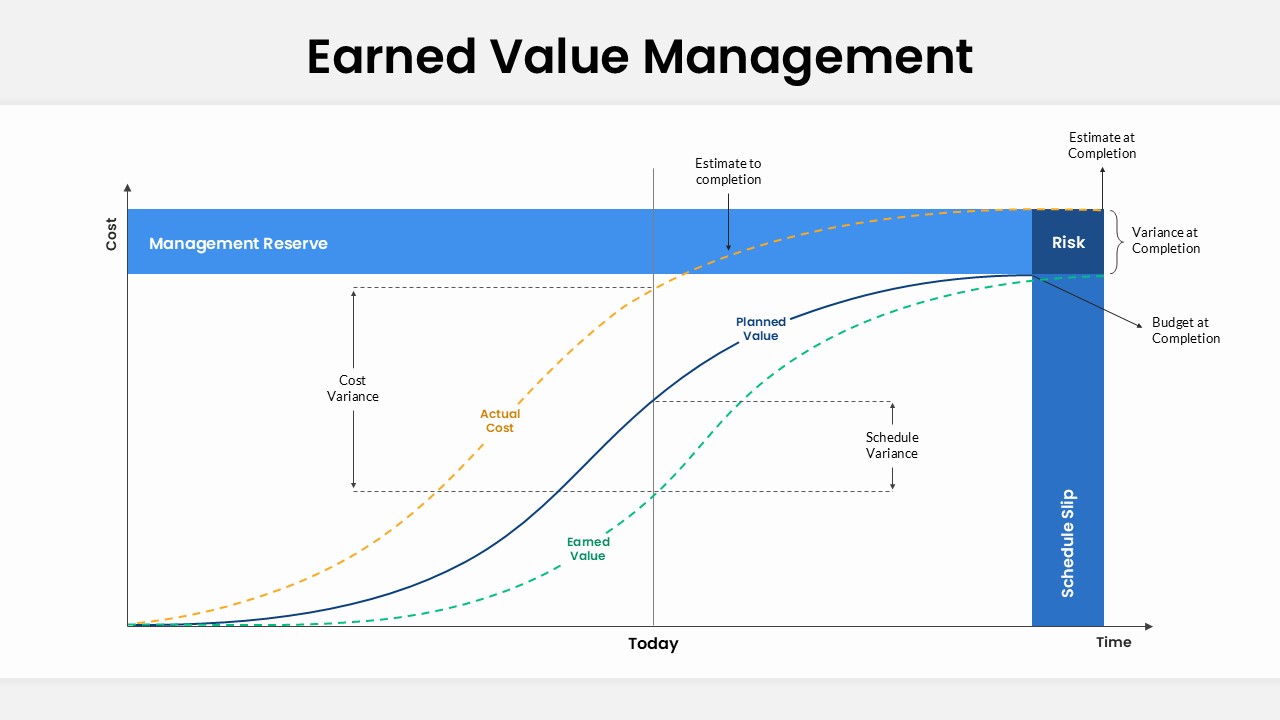
Earned Value Management (EVM) Slide Template for PowerPoint & Google Slides
Charts
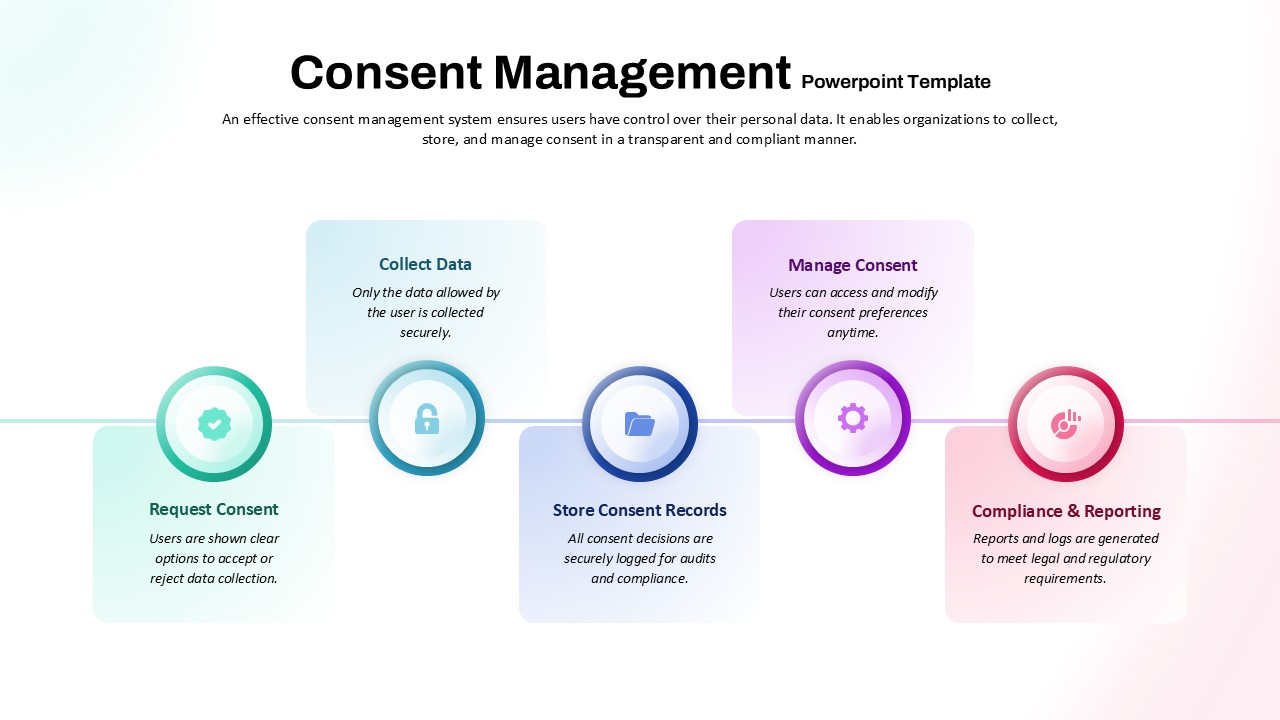
Consent Management System Process Flow Template for PowerPoint & Google Slides
Process
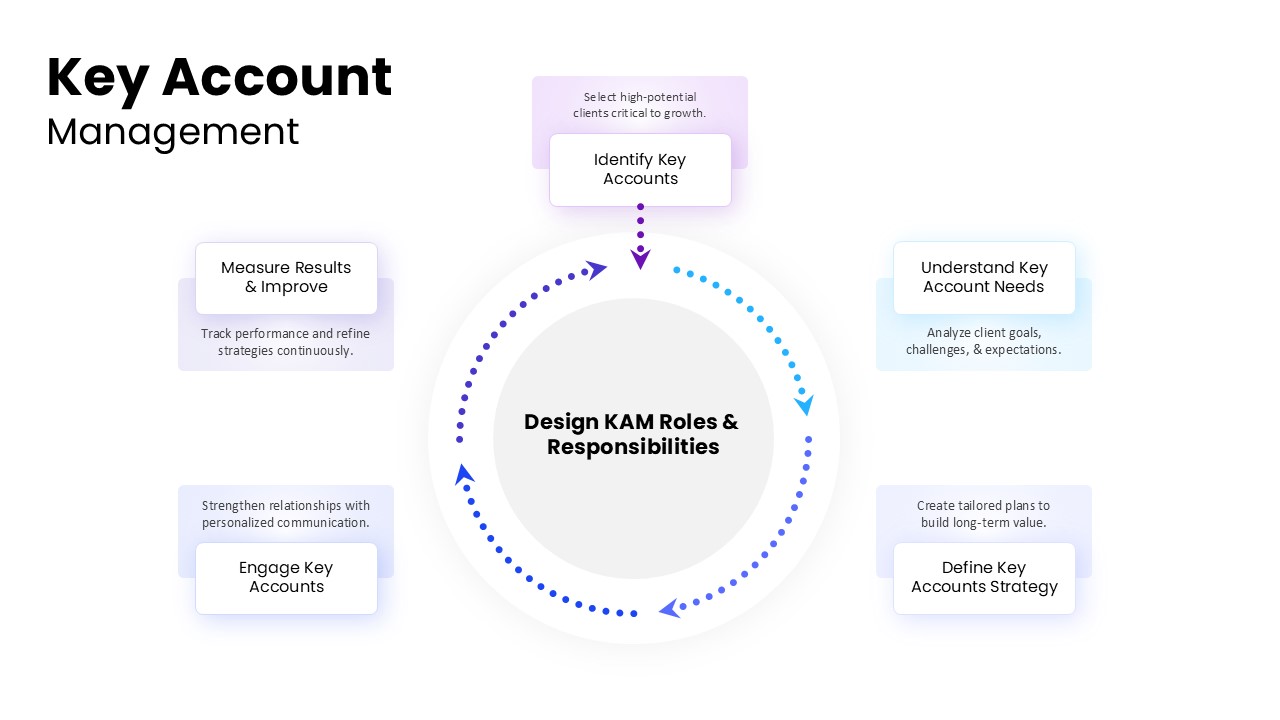
Comprehensive Key Account Management Template for PowerPoint & Google Slides
Process
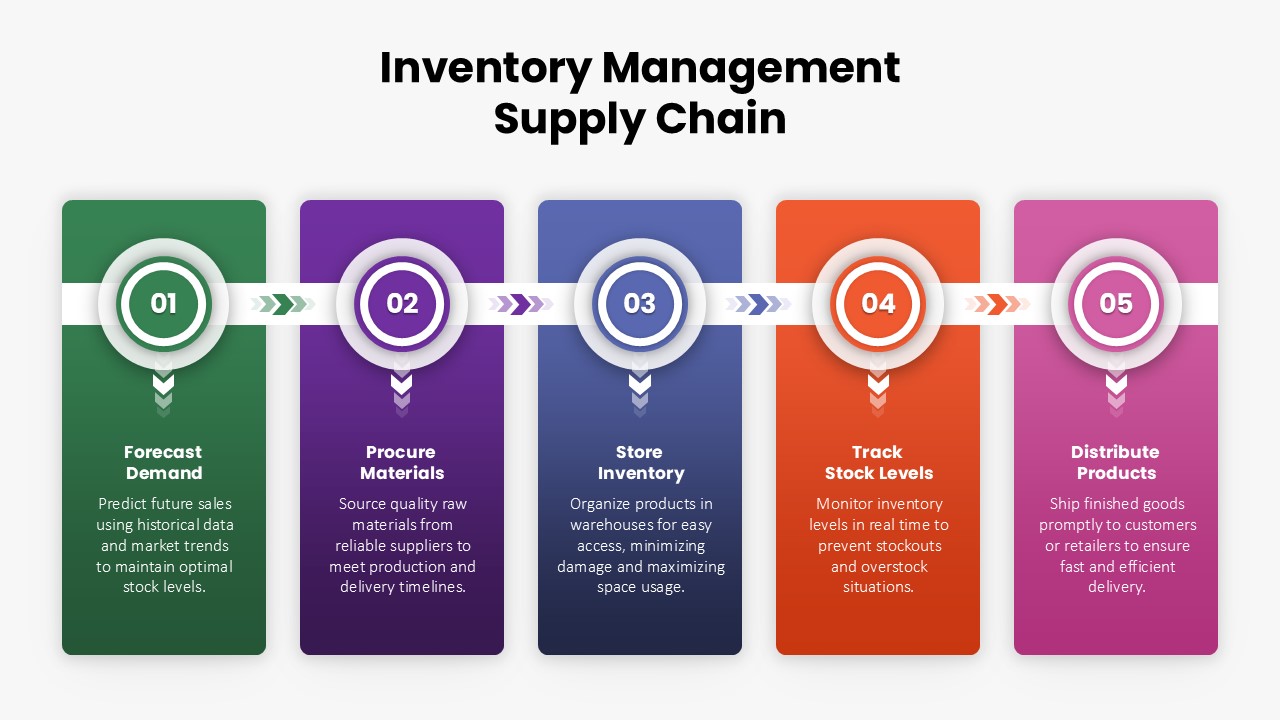
Inventory Management Supply Chain Template for PowerPoint & Google Slides
Process
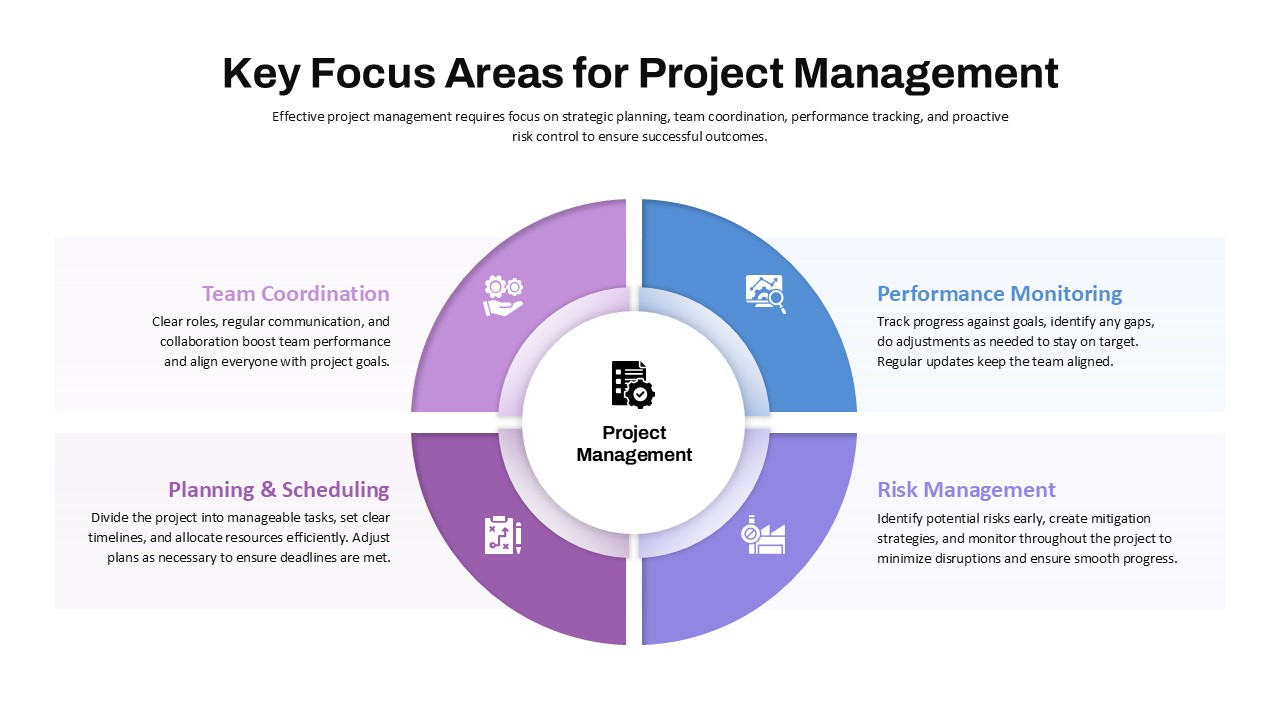
Key Focus Areas for Project Management Template for PowerPoint & Google Slides
Business
Machine Learning Model Management Template for PowerPoint & Google Slides
Machine Learning
Fund Management Business Strategy Template for PowerPoint & Google Slides
Finance
Product Information Management System Template for PowerPoint & Google Slides
Information Technology