DevOps KPI Dashboard Performance Metrics Template for PowerPoint & Google Slides

Description
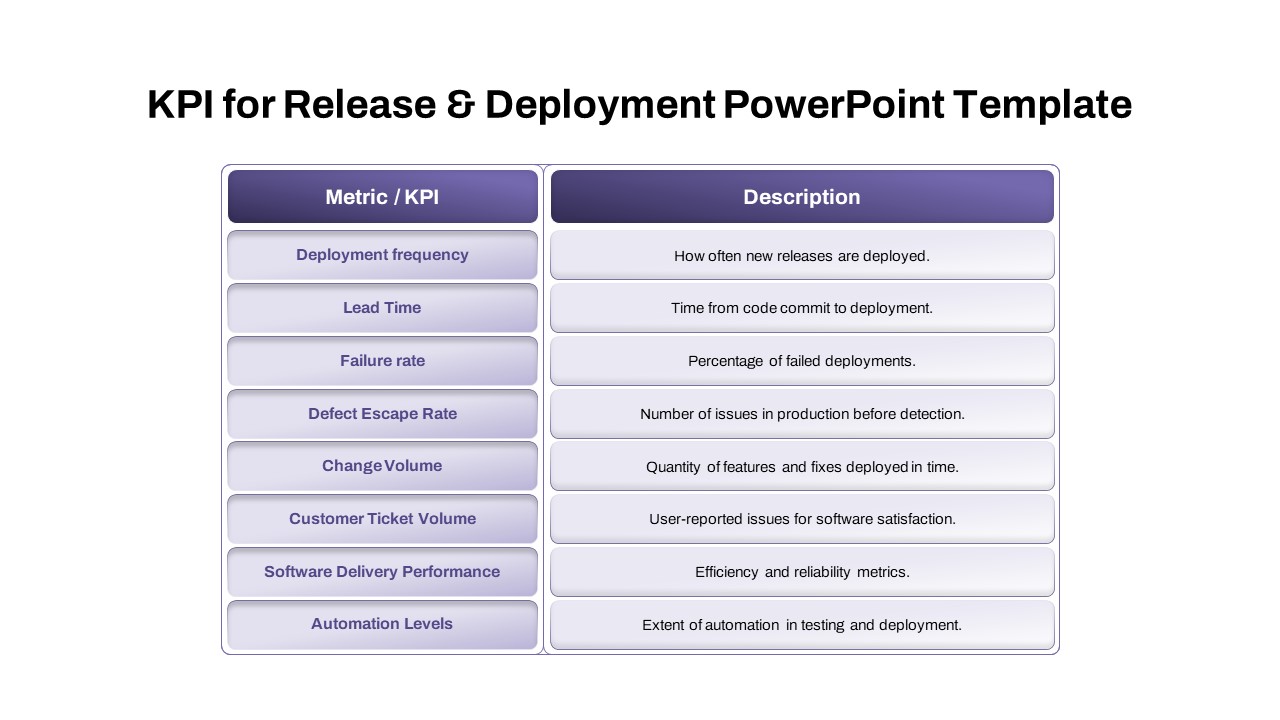
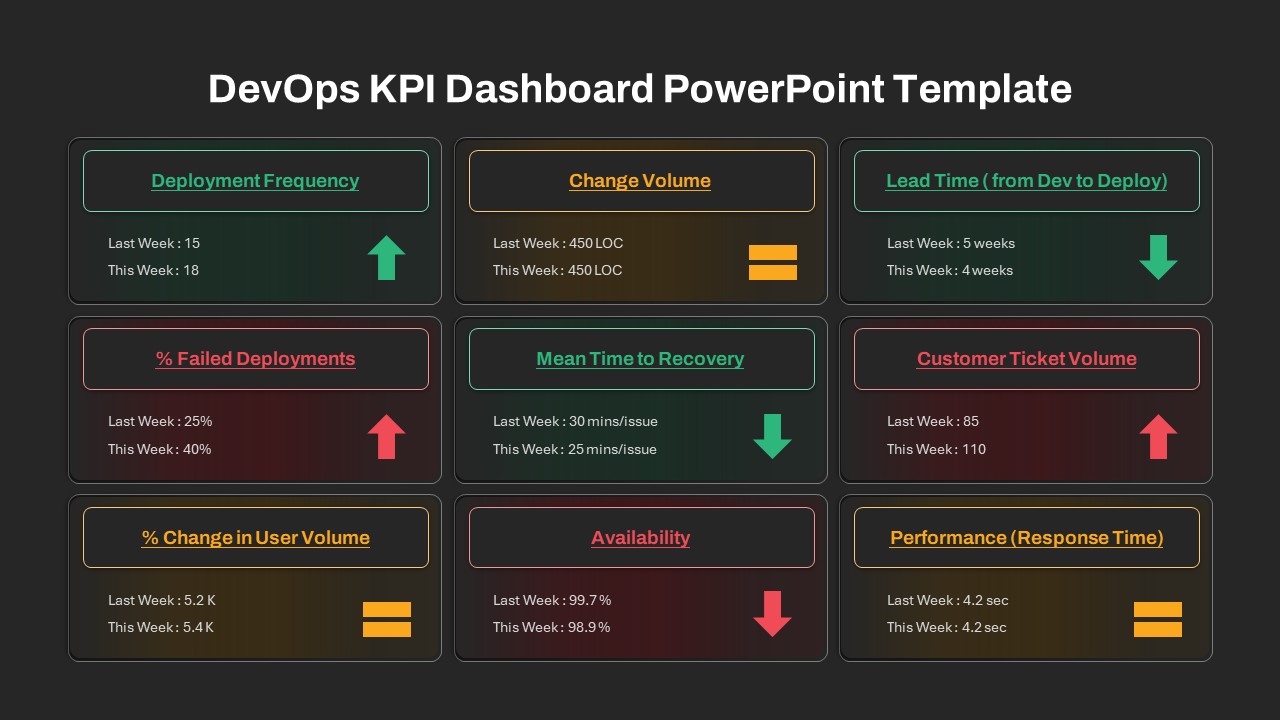
This DevOps KPI Dashboard slide template displays nine critical performance indicators in a clean, color-coded card grid. Each card features a header with the metric name, last-week vs this-week values, and intuitive trend icons—Deployment Frequency, Change Volume, Lead Time (Dev to Deploy), % Failed Deployments, Mean Time to Recovery (MTTR), Customer Ticket Volume, % Change in User Volume, Availability, and Performance (Response Time). The layout applies soft gradients, thin outline borders, and uniform typography for optimal readability and visual hierarchy. Vector icons in headers and minimalist arrows and equal signs visually depict performance trends. Master slide integration, editable placeholders, and drag-and-drop frames enable rapid customization of color schemes, icons, and data fields.
Built for PowerPoint and Google Slides, this template preserves aspect ratios and color accuracy across platforms. Use built-in theme palettes to align with corporate branding or shift to monochrome for internal reports. Alternate variations include portrait grids, full-width infographic bars, and map overlays to contextualize regional performance. Preconfigured animation triggers and data placeholders ensure your presentation flows smoothly in stakeholder meetings or online webinars. Interactive charts and dynamic data-linking options further enhance real-time analysis.
Whether you are presenting to development teams, IT leadership, or executive boards, this KPI dashboard slide simplifies the communication of operational performance metrics. Update metrics on the fly, duplicate cards to add new indicators, or resize components for larger screens. With this flexible design, you can streamline DevOps reporting, track continuous improvement, and drive data-driven decision-making with maximum clarity and minimal effort.
Who is it for
IT managers, DevOps engineers, CTOs, and operations analysts will benefit from this dashboard to report on system health and deployment performance. Project managers, scrum masters, and technical consultants can leverage the slide to align teams on service reliability metrics and continuous improvement goals.
Other Uses
Beyond DevOps reporting, repurpose this nine-card layout for sales performance tracking, marketing campaign KPIs, HR metrics dashboards, or financial overview slides. Use the editable cards to compare product features, customer satisfaction scores, or risk assessments across departments.
Login to download this file

Item ID
SB04326
Related Templates

Purchasing KPI Metrics Dashboard Template for PowerPoint & Google Slides
Business Report
Procurement KPI Dashboard & Metrics Template for PowerPoint & Google Slides
Business Report
Employee Performance Metrics Dashboard Template for PowerPoint & Google Slides
Employee Performance
Performance KPI Dashboard Slide Template for PowerPoint & Google Slides
Business Report
Asia Map with KPI Metrics and Legend Template for PowerPoint & Google Slides
World Maps
Circular Image Gallery & KPI Metrics Template for PowerPoint & Google Slides
Pie/Donut
Project Status Dashboard with Metrics Template for PowerPoint & Google Slides
Project Status
Mastodon Metrics Infographic Dashboard Template for PowerPoint & Google Slides
Business Report
Free KPI Dashboard PowerPoint Template for PowerPoint & Google Slides
Charts
Free

Efficiency KPI Dashboard Metaphor Template for PowerPoint & Google Slides
Infographics
Sales Growth Dashboard: KPI Gauge & Line Template for PowerPoint & Google Slides
Revenue
KPI Dashboard template for PowerPoint & Google Slides
Business Report
KPI Dashboard Overview template for PowerPoint & Google Slides
Finance
KPI Dashboard Data Visualization Template for PowerPoint & Google Slides
Bar/Column
KPI Dashboard Data Overview Slide Template for PowerPoint & Google Slides
Bar/Column
Customer Satisfaction KPI Dashboard Template for PowerPoint & Google Slides
Customer Experience
Michigan County Map with KPI Dashboard Template for PowerPoint & Google Slides
World Maps
4DX Scoreboard KPI Gauge Dashboard Template for PowerPoint & Google Slides
Business Strategy
Patient-Satisfaction KPI Dashboard for PowerPoint & Google Slides
Business

Website Performance Dashboard template for PowerPoint & Google Slides
Charts
Sales Performance Dashboard template for PowerPoint & Google Slides
Business Report
Social Media Performance Dashboard Template for PowerPoint & Google Slides
Bar/Column
Website Performance Monitoring Dashboard Template for PowerPoint & Google Slides
Business Report
Monthly Sales Performance Dashboard Template for PowerPoint & Google Slides
Charts
DevOps Infinity Loop Process Diagram Template for PowerPoint & Google Slides
Process
Winding DevOps Roadmap Process Template for PowerPoint & Google Slides
Software Development

DevOps Infographics & Process Flow Template for PowerPoint & Google Slides
Information Technology
iPad App Mockup with Progress Metrics Template for PowerPoint & Google Slides
Bar/Column
Bubble Head Metrics Infographic Template for PowerPoint & Google Slides
Circular
Circle Segment Sales Metrics Infographic Template for PowerPoint & Google Slides
Circular
Social Media Metrics template for PowerPoint & Google Slides
Comparison Chart
Mobile Usage Metrics template for PowerPoint & Google Slides
Comparison Chart
Scale Metaphor Metrics Comparison Template for PowerPoint & Google Slides
Charts
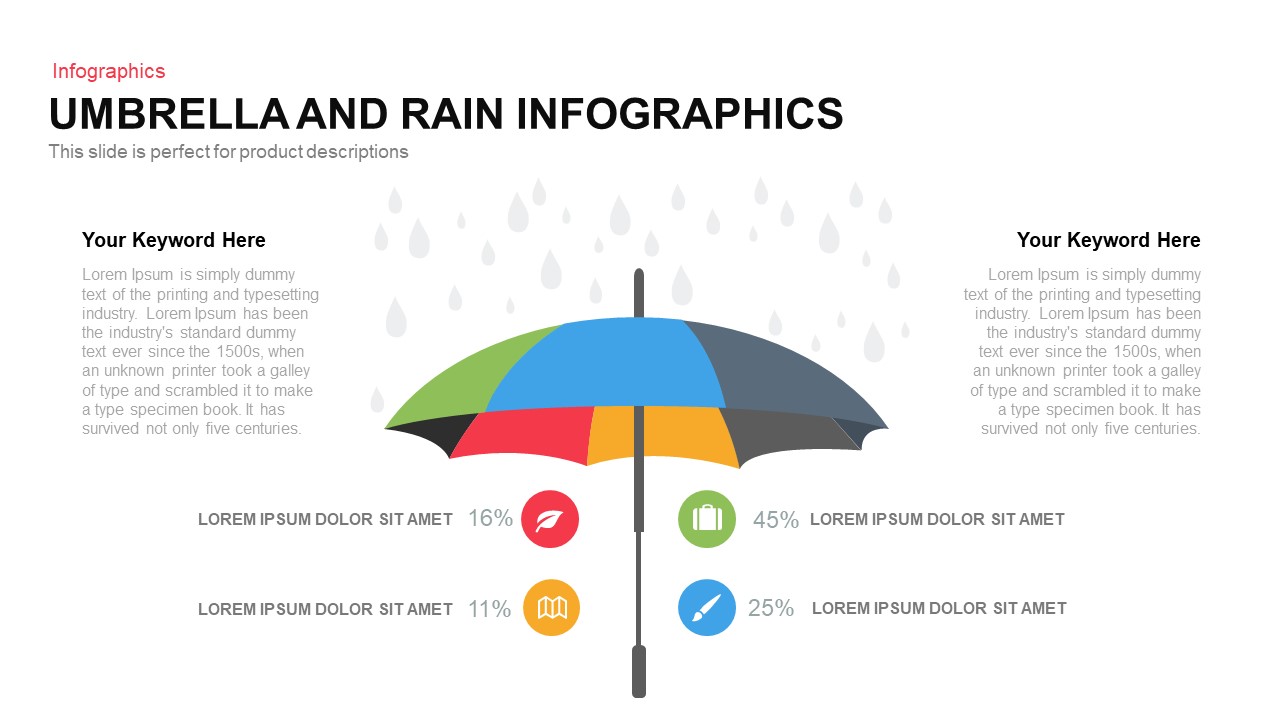
Umbrella and Rain Infographic Metrics Template for PowerPoint & Google Slides
Comparison
Comprehensive Recruitment Metrics Report Template for PowerPoint & Google Slides
Recruitment
Colorful Block Infographic Metrics Slide Template for PowerPoint & Google Slides
Infographics
Benchmarking Metrics Comparison Slide Template for PowerPoint & Google Slides
Pie/Donut
Statistics & Global Metrics Infographic Template for PowerPoint & Google Slides
Bar/Column
Agriculture Infographics Slide with Progress Rings & Metrics Template for PowerPoint & Google Slides
Pie/Donut
Annual Recurring Revenue Metrics Template for PowerPoint & Google Slides
Bar/Column
Social Media Analysis Metrics Slide Deck Template for PowerPoint & Google Slides
Digital Marketing
LinkedIn Metrics Infographic Slide Template for PowerPoint & Google Slides
Digital Marketing
Facebook Social Metrics Infographic Template for PowerPoint & Google Slides
Graphics
Instagram Infographic Metrics Slide Template for PowerPoint & Google Slides
Marketing
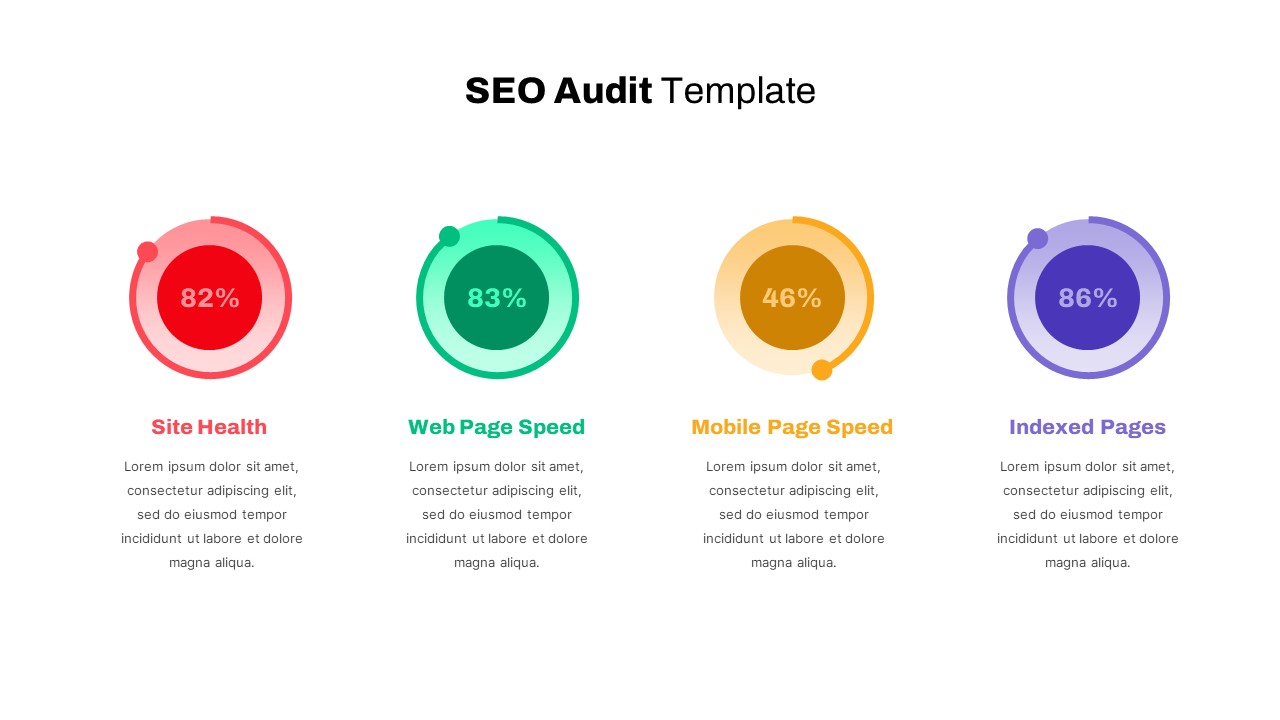
Detailed SEO Audit Metrics Overview Template for PowerPoint & Google Slides
Circular
Free Editable U.S. Map with Regional Metrics Template for PowerPoint & Google Slides
World Maps
Free
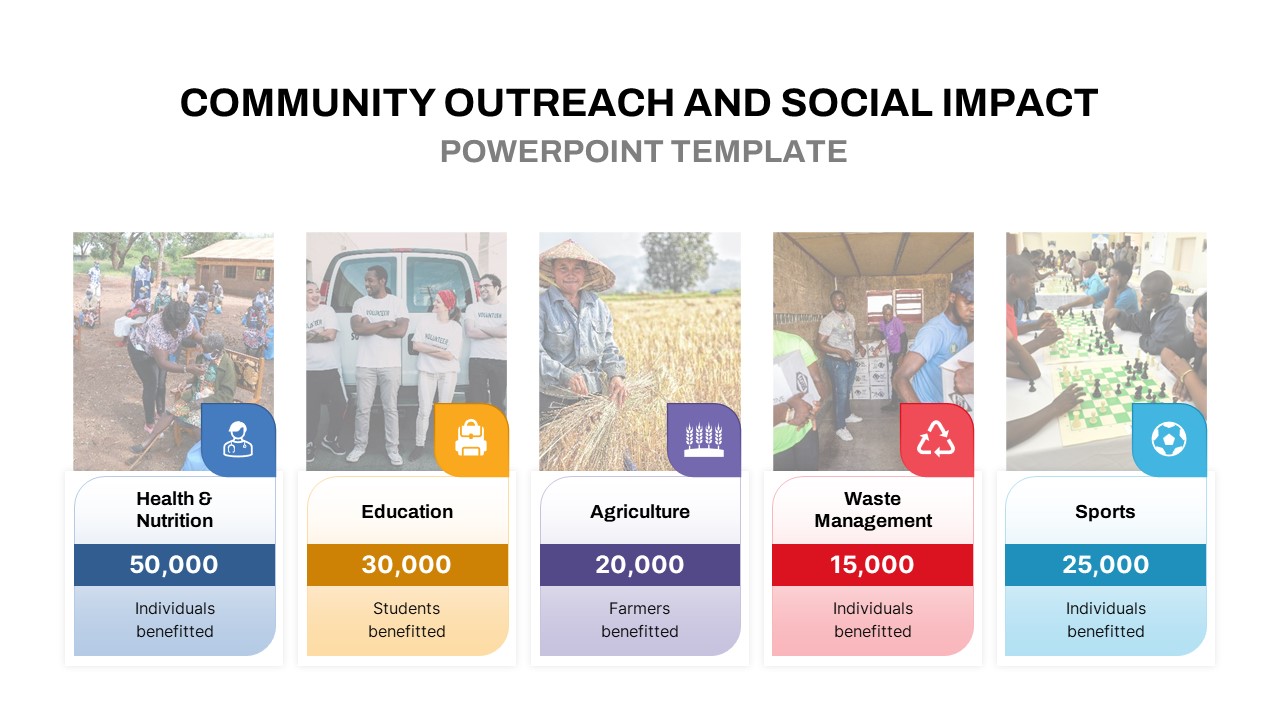
Community Outreach Impact Metrics Template for PowerPoint & Google Slides
Accomplishment
Financial Snapshot & Metrics Overview Template for PowerPoint & Google Slides
Finance
Market Validation Metrics Overview Template for PowerPoint & Google Slides
Business
Pirate Metrics AARRR Funnel Framework Template for PowerPoint & Google Slides
Funnel
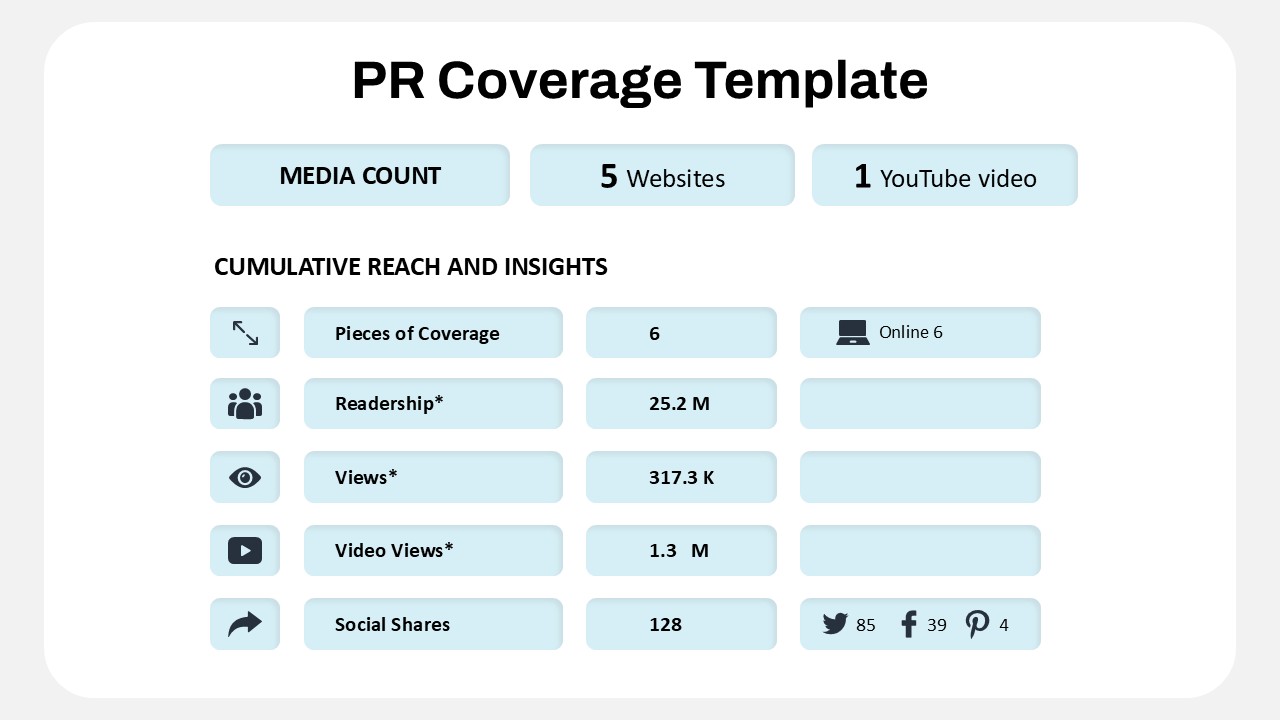
Public Relations Coverage Metrics Template for PowerPoint & Google Slides
Business Report
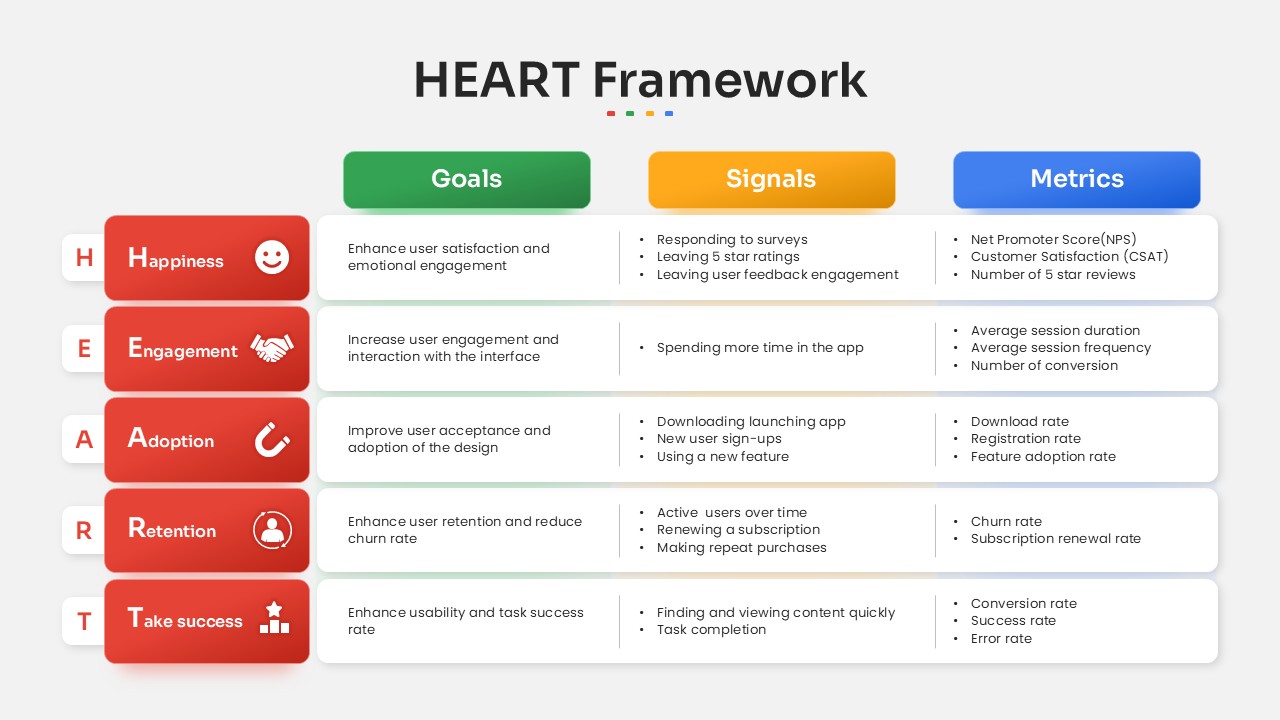
HEART Framework Goals, Signals & Metrics Template for PowerPoint & Google Slides
Process

Application Revenue Line Chart KPI Template for PowerPoint & Google Slides
Revenue
Professional Team Collage & KPI Slide Template for PowerPoint & Google Slides
Business
Statistics Infographic & KPI Bar Chart Template for PowerPoint & Google Slides
Bar/Column
Monthly Recurring Revenue KPI Bar Chart Template for PowerPoint & Google Slides
Bar/Column
Free Balanced Scorecard Quadrant KPI Layout Template for PowerPoint & Google Slides
Employee Performance
Free
Comprehensive Release & Deployment KPI Template for PowerPoint & Google Slides
Software Development
Three Segment Donut Chart KPI Infographic Template for PowerPoint & Google Slides
Pie/Donut
Year in Review KPI Highlights Slide for PowerPoint & Google Slides
Business Report
Google Ads Optimization & Performance Infographic Template for PowerPoint & Google Slides
Digital Marketing
Profit Performance Trend Chart Template for PowerPoint & Google Slides
Finance
Sales vs Budget Performance Chart Template for PowerPoint & Google Slides
Bar/Column
Performance Review Process Management Cycle template for PowerPoint & Google Slides
Employee Performance
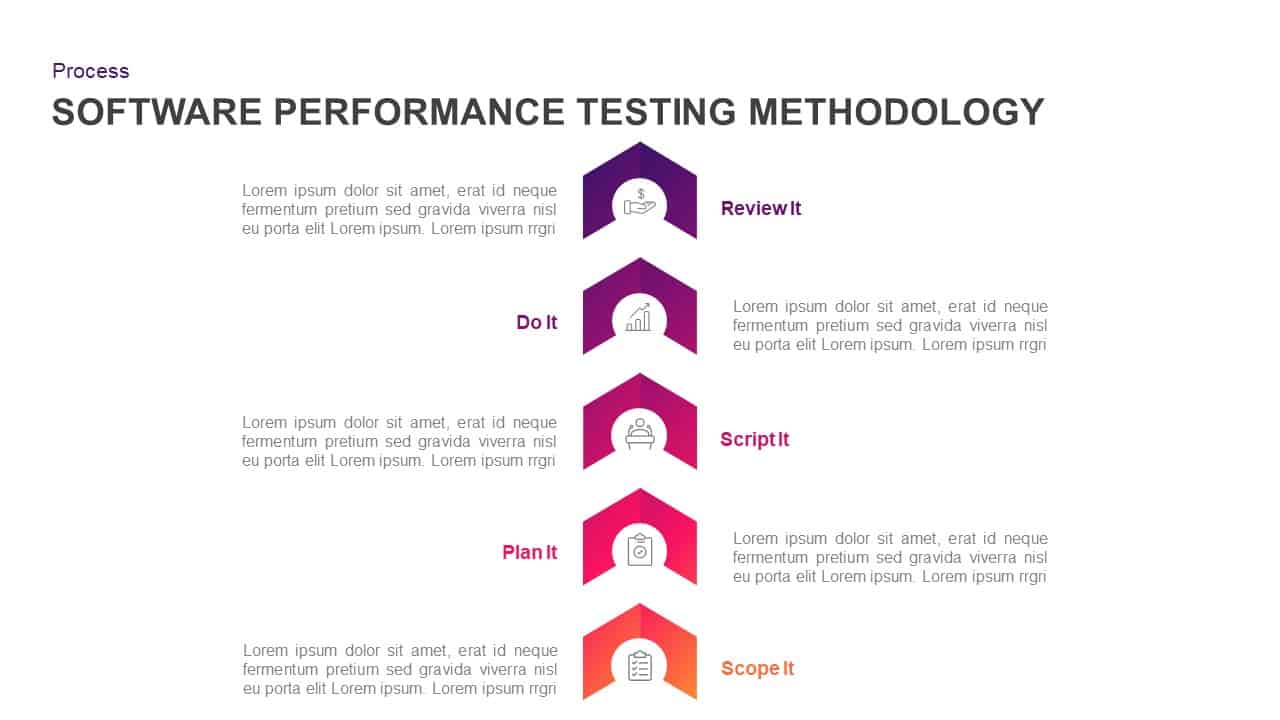
Software Performance Testing Methodology Template for PowerPoint & Google Slides
Process
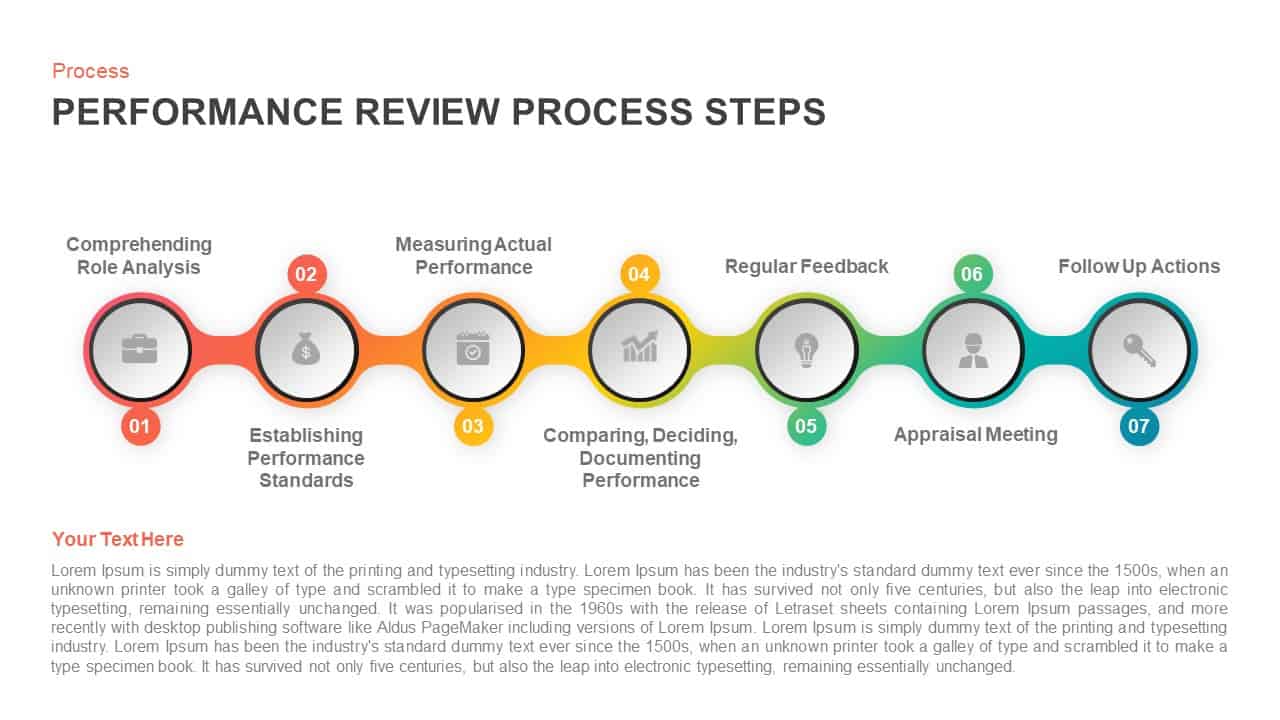
Performance Review Process Steps Template for PowerPoint & Google Slides
Employee Performance
Professional Sales Performance Report Template for PowerPoint & Google Slides
Business Report
Performance Review Progress Management Template for PowerPoint & Google Slides
Process
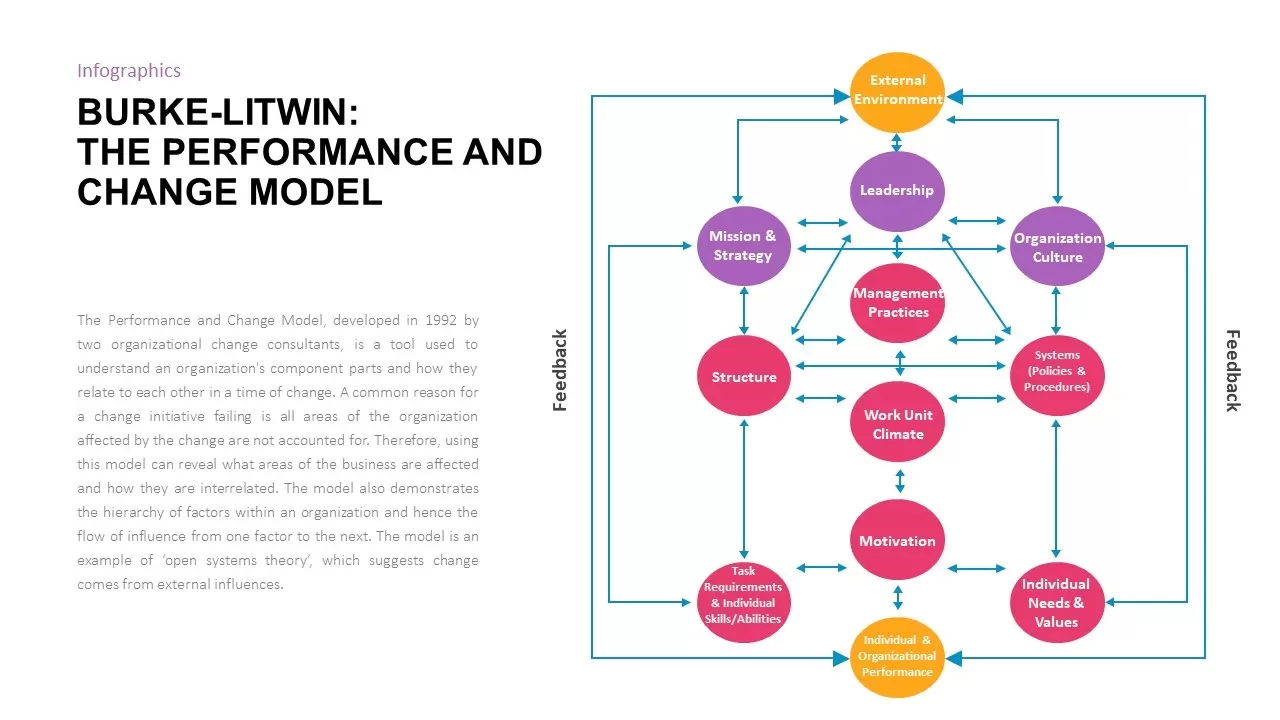
Burke-Litwin Performance and Change Model template for PowerPoint & Google Slides
Infographics
Corporate Performance Management Template for PowerPoint & Google Slides
Pitch Deck
Free Stock Market Performance Overview template for PowerPoint & Google Slides
Finance
Free
9-Box Matrix for Performance & Potential Template for PowerPoint & Google Slides
Employee Performance
Benchmarking Performance Score Template for PowerPoint & Google Slides
Comparison Chart
AMO Performance Model Feedback Diagram Template for PowerPoint & Google Slides
Employee Performance
Hits and Misses Performance Comparison Template for PowerPoint & Google Slides
Comparison
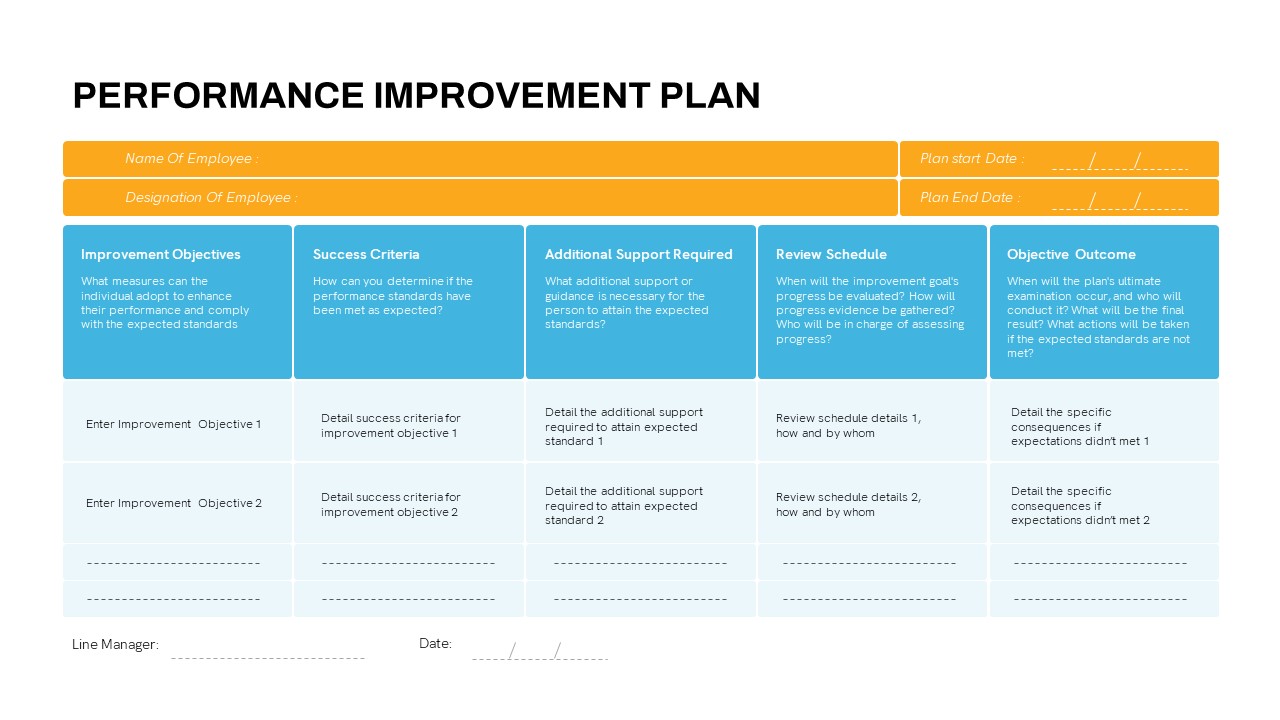
Detailed Performance Improvement Plan Template for PowerPoint & Google Slides
Employee Performance
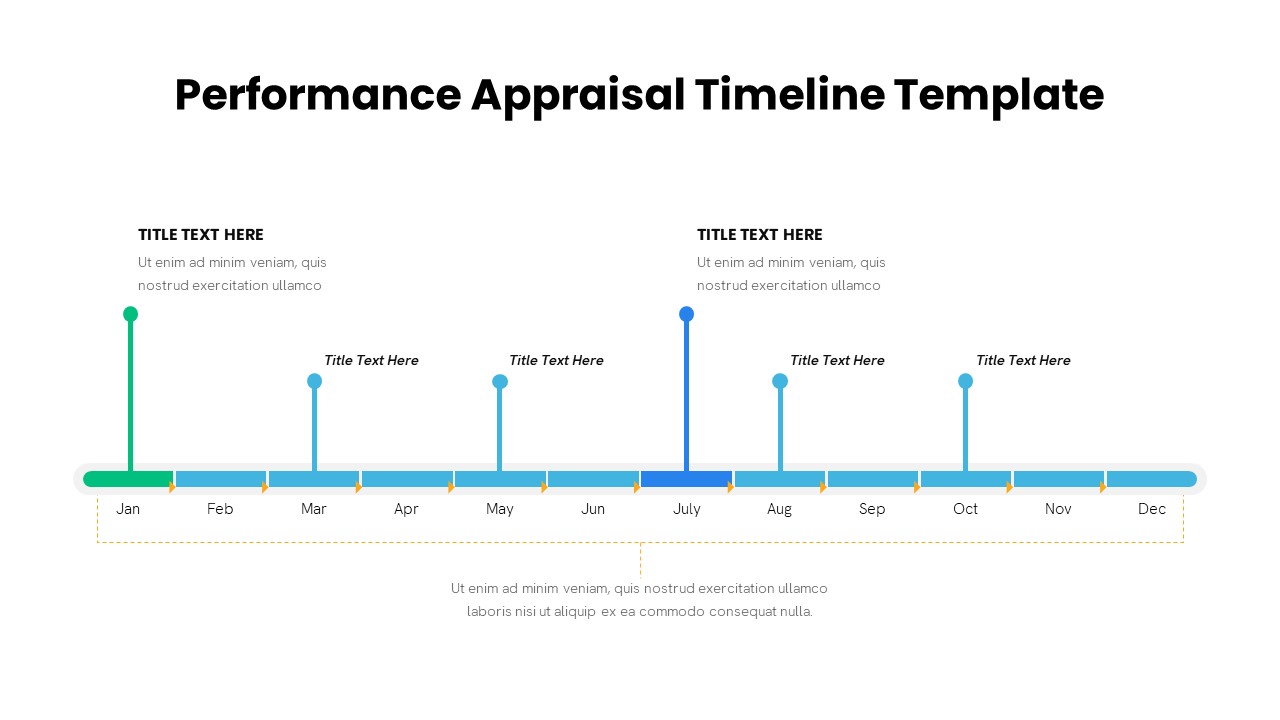
Performance Appraisal Timeline Diagram Template for PowerPoint & Google Slides
Timeline
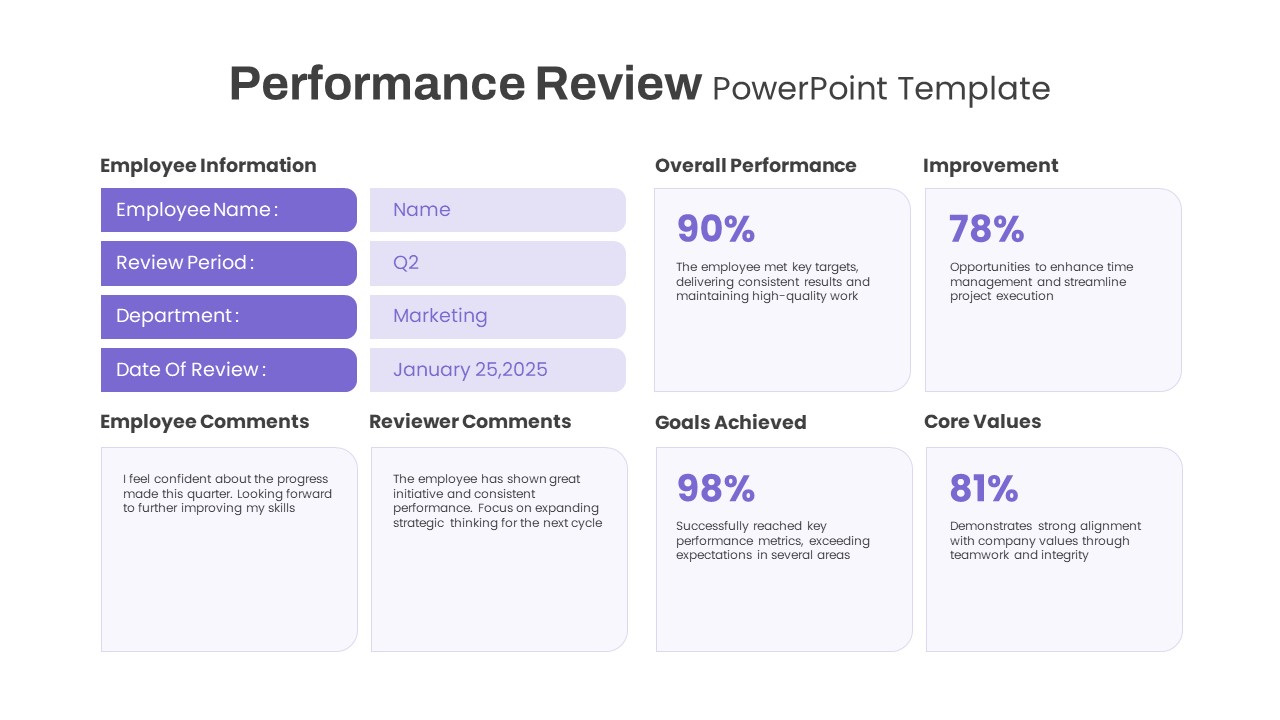
Performance Review template for PowerPoint & Google Slides
Employee Performance
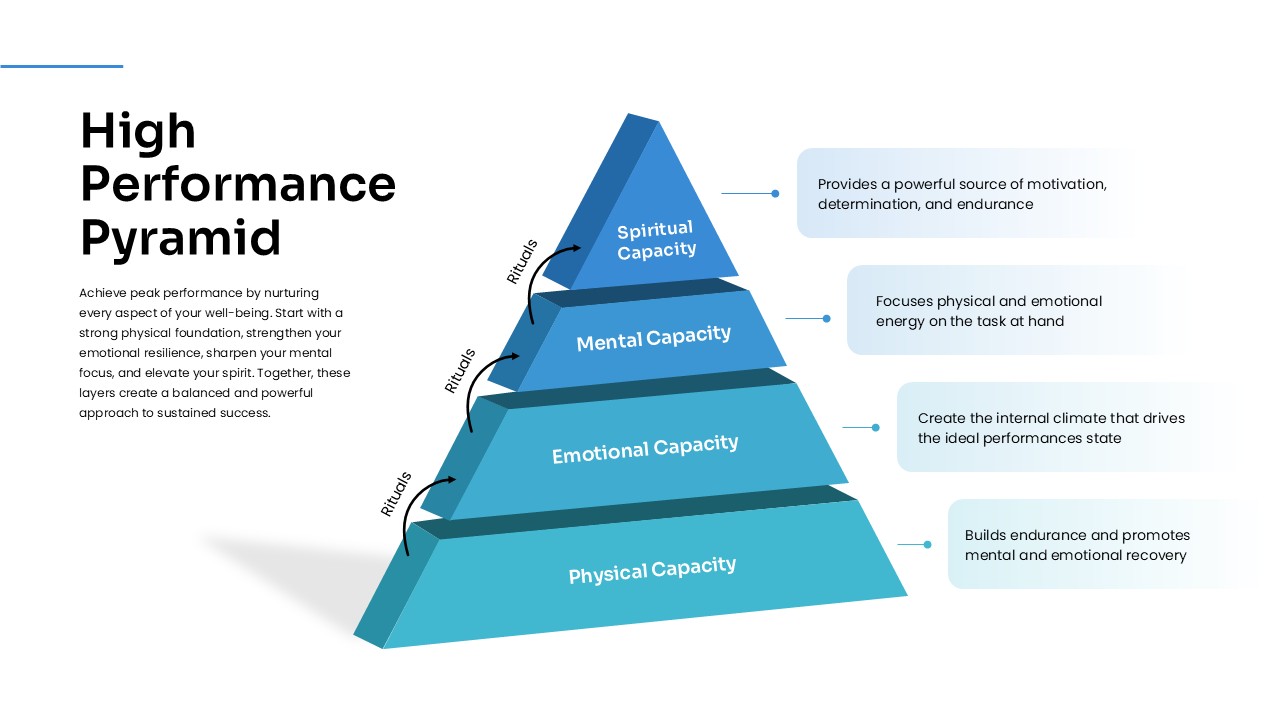
High Performance Pyramid Diagram Template for PowerPoint & Google Slides
Pyramid
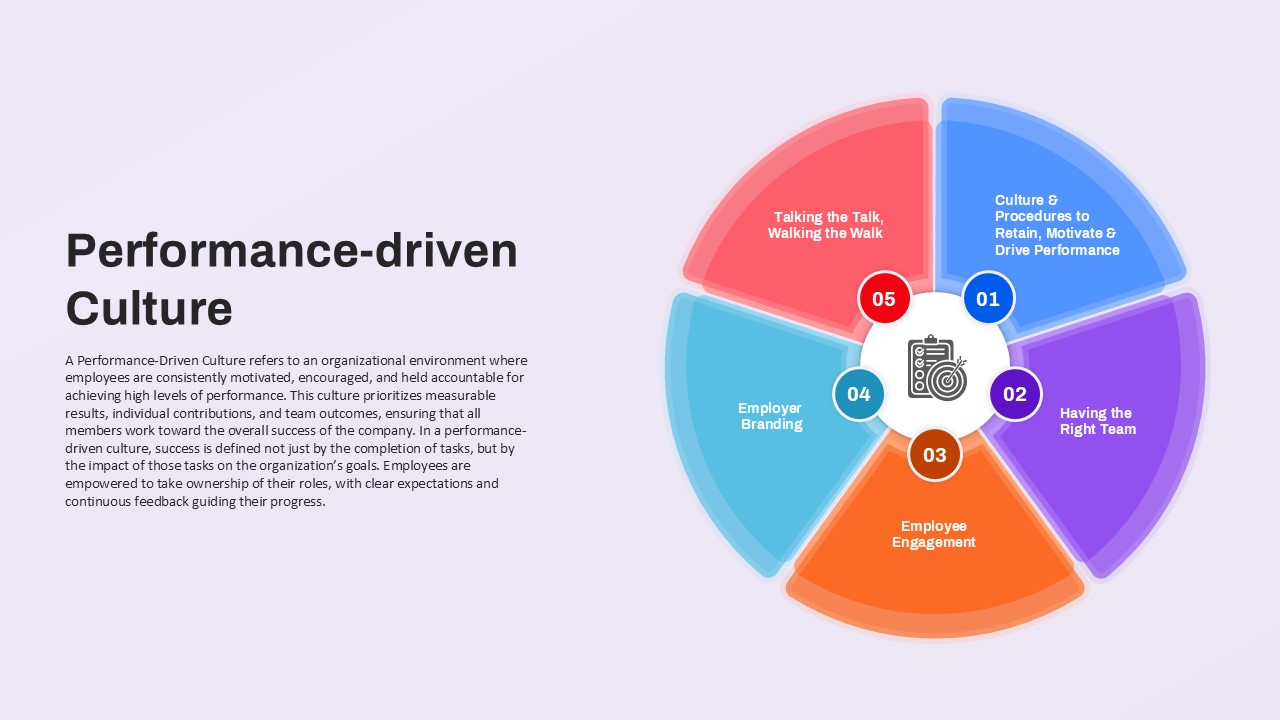
Performance-driven Culture framework template for PowerPoint & Google Slides
Leadership
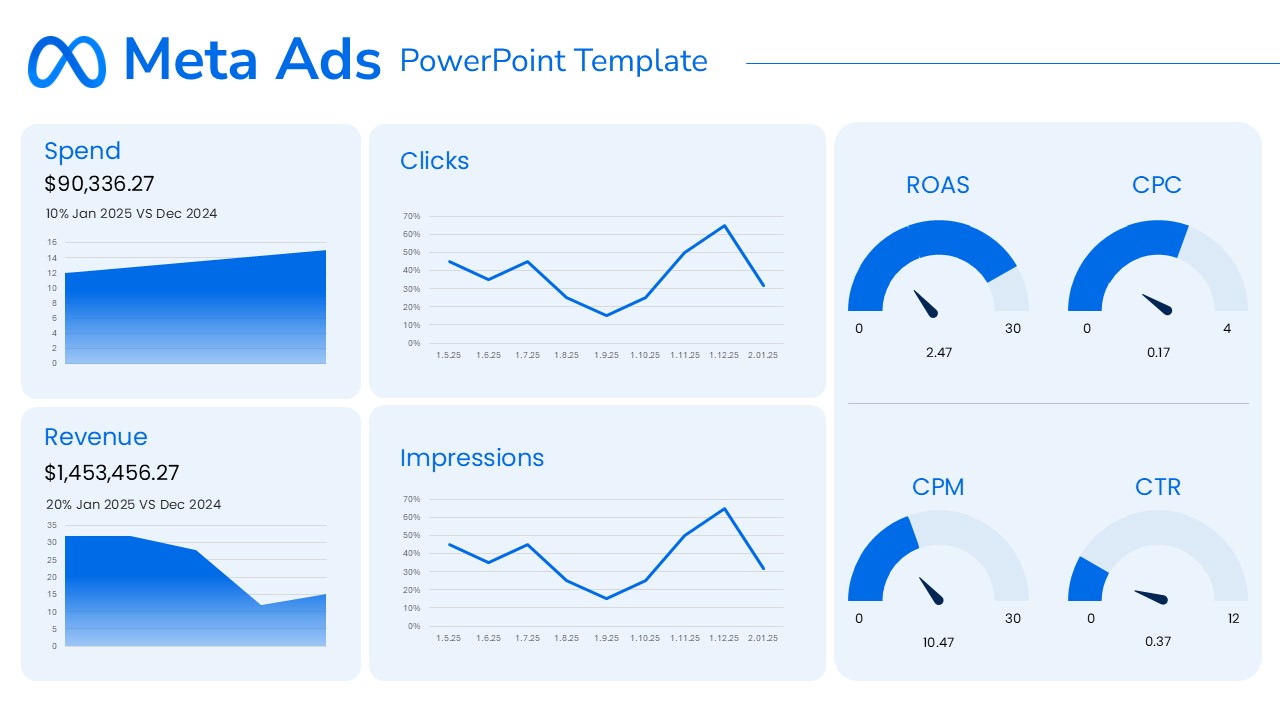
Meta Ads Performance Overview template for PowerPoint & Google Slides
Advertising
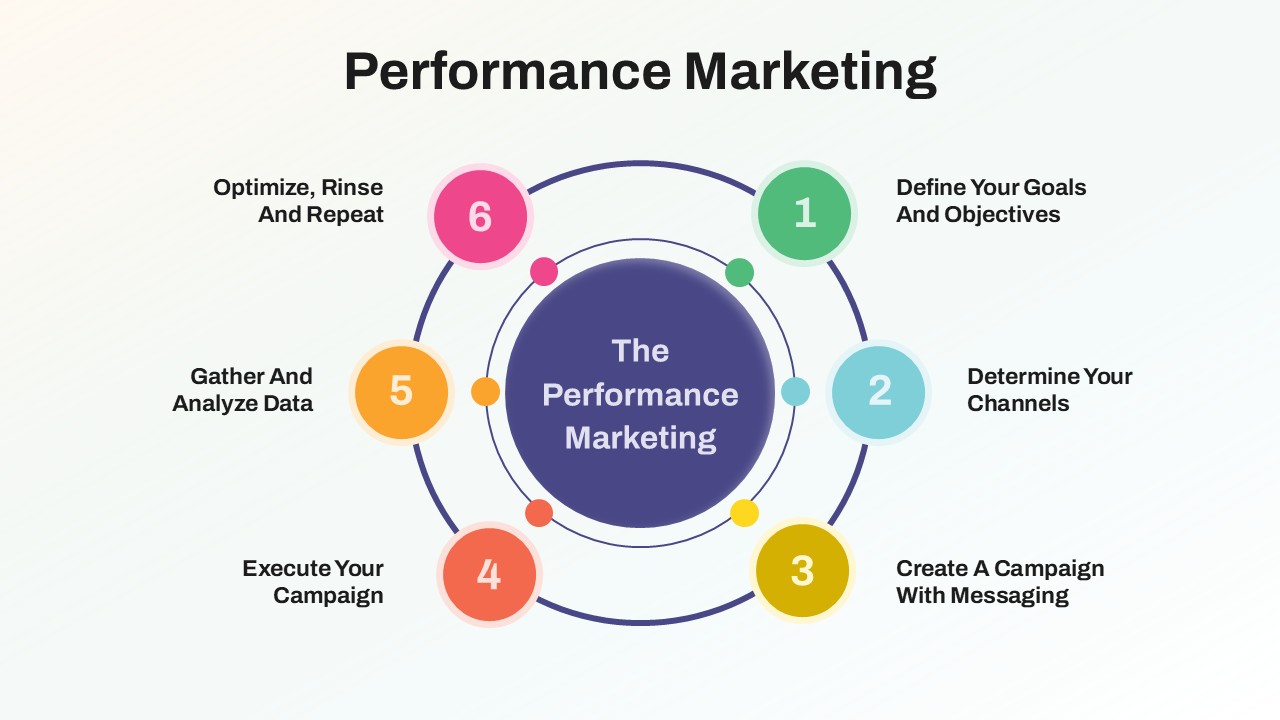
Performance Marketing Strategy template for PowerPoint & Google Slides
Digital Marketing
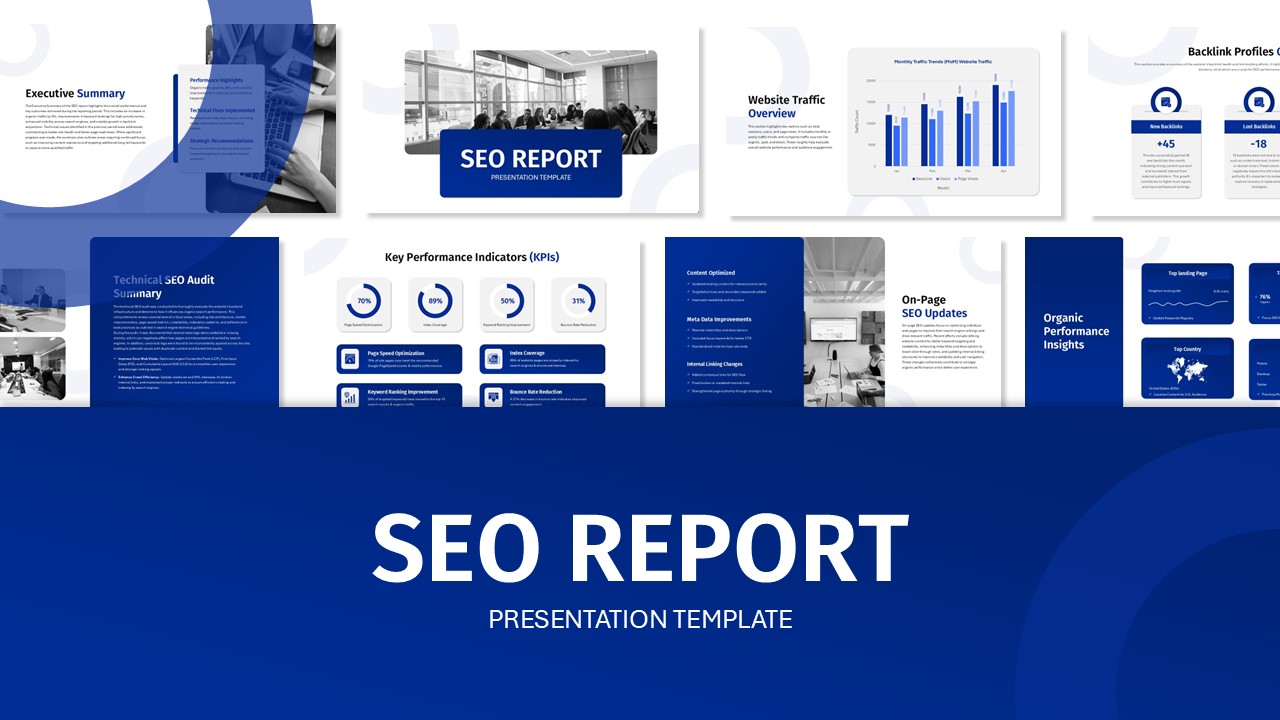
SEO Performance Report Overview template for PowerPoint & Google Slides
Digital Marketing
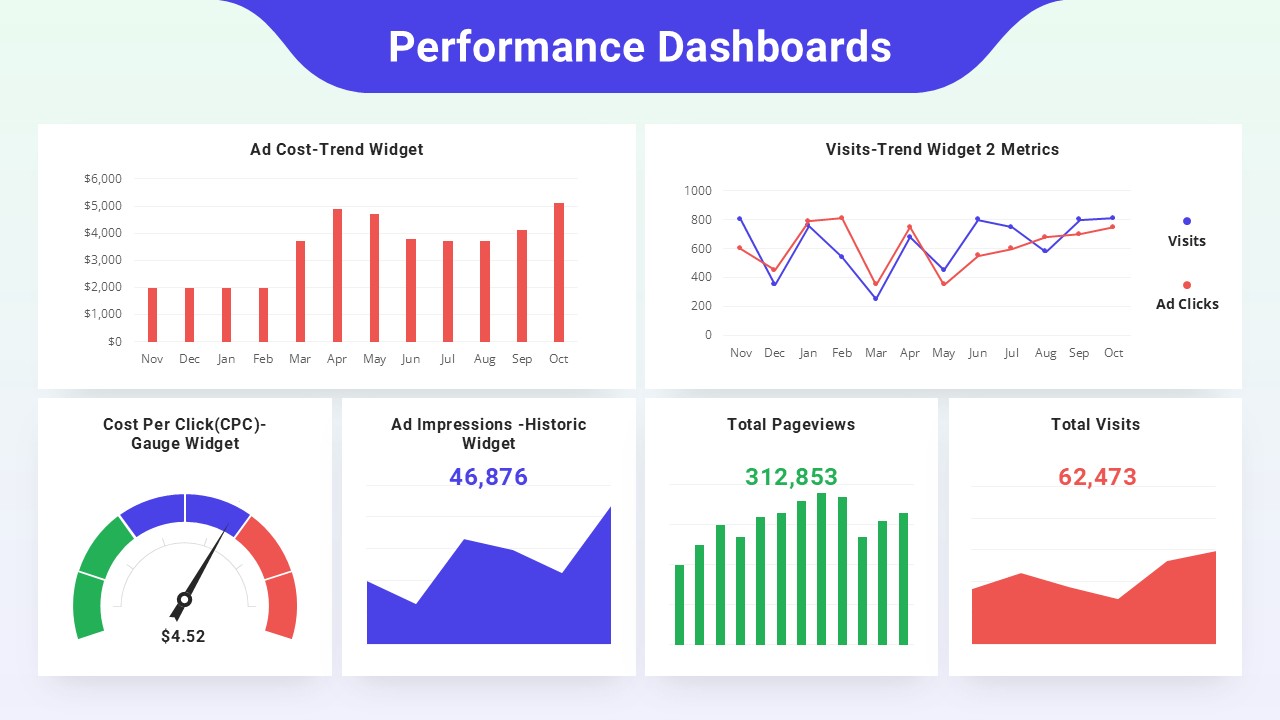
Performance Dashboards Overview Template for PowerPoint & Google Slides
Business Report
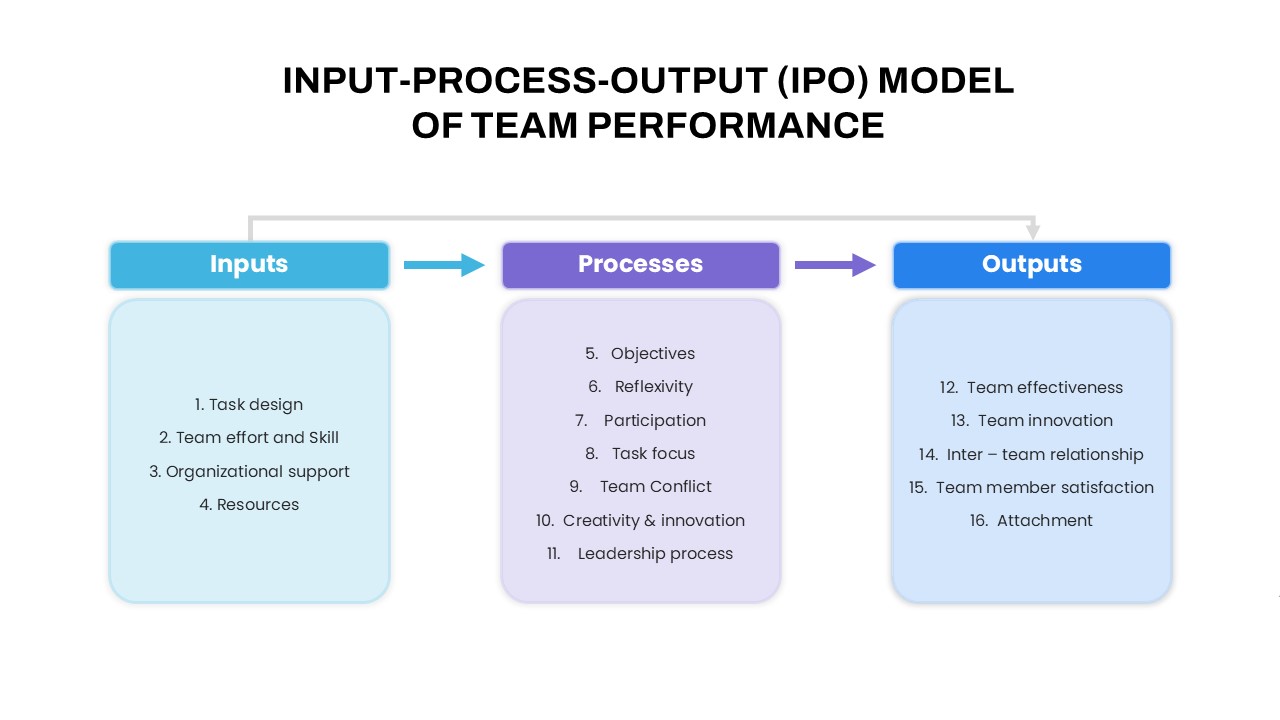
IPO Model of Team Performance for PowerPoint & Google Slides
Process
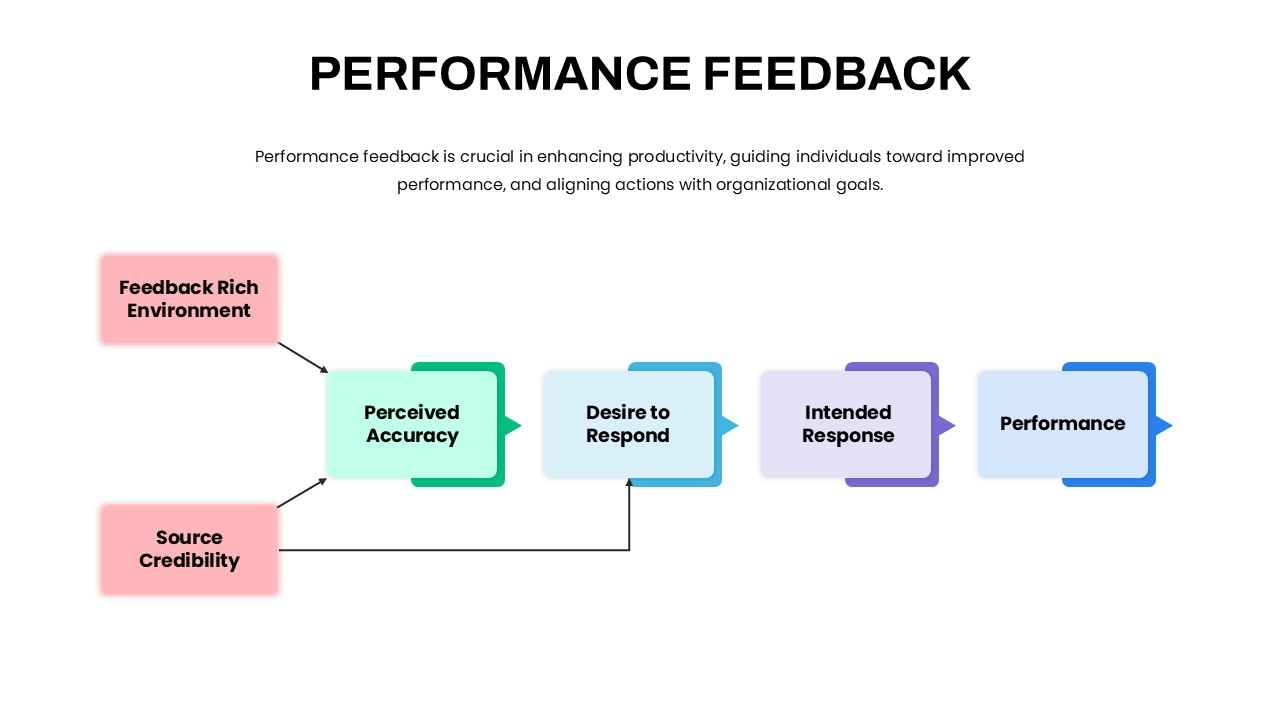
Performance Feedback Model for PowerPoint & Google Slides
Employee Performance
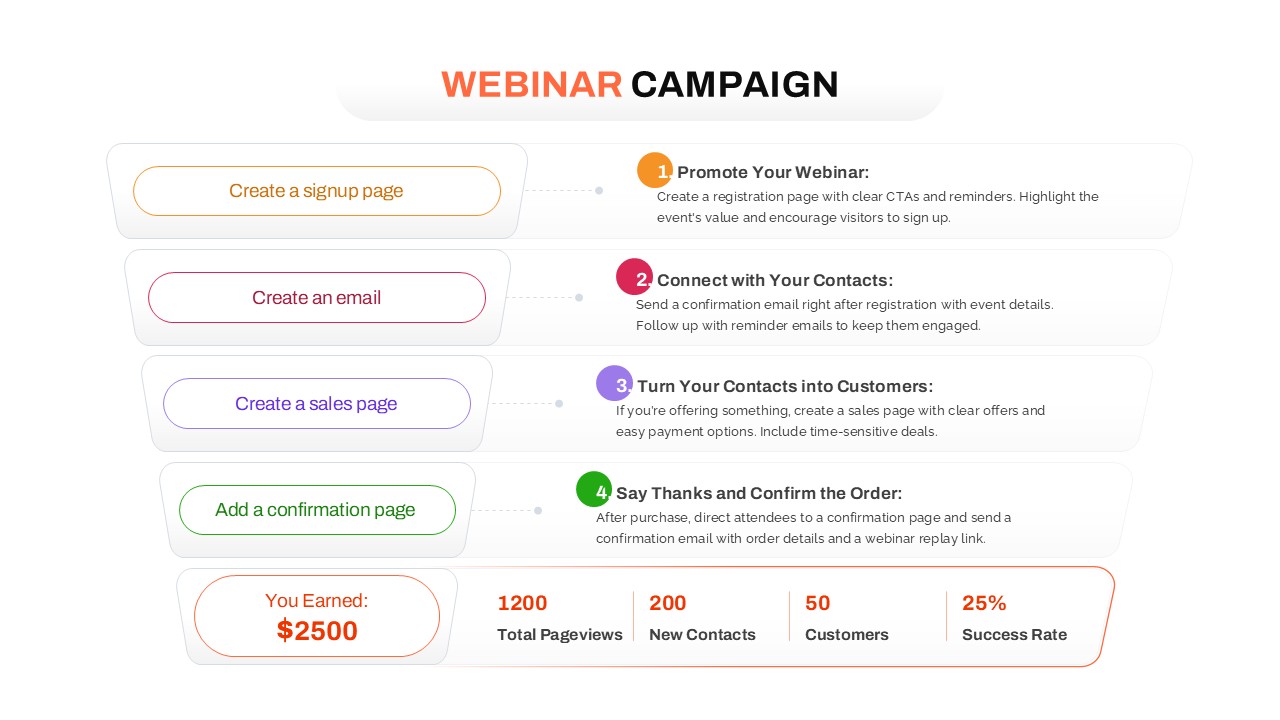
Webinar Campaign Steps and Performance for PowerPoint & Google Slides
Advertising
E-commerce Analytics Dashboard Template for PowerPoint & Google Slides
Bar/Column
Immigration Data Dashboard Template for PowerPoint & Google Slides
Bar/Column
Modern Project Status Report Dashboard Template for PowerPoint & Google Slides
Project Status
Project Status Dashboard Table Template for PowerPoint & Google Slides
Project Status
One Pager Project Status Dashboard Template for PowerPoint & Google Slides
Project Status
Quarterly Business Review Dashboard Template for PowerPoint & Google Slides
Pitch Deck
Monthly Business Review Dashboard Deck Template for PowerPoint & Google Slides
Business Report
Budget Forecast Dashboard & Donut Charts Template for PowerPoint & Google Slides
Pie/Donut
Risk Level Gauge Comparison Dashboard Template for PowerPoint & Google Slides
Comparison
Project Tracking Dashboard Table Template for PowerPoint & Google Slides
Project Status
Electronic Health Records Dashboard template for PowerPoint & Google Slides
Health
Project Status Dashboard Report Template for PowerPoint & Google Slides
Project Status
Project Status Template Dashboard with Gauge for PowerPoint & Google Slides
Project Status