Depreciation Methods Circular Diagram Template for PowerPoint & Google Slides
Description
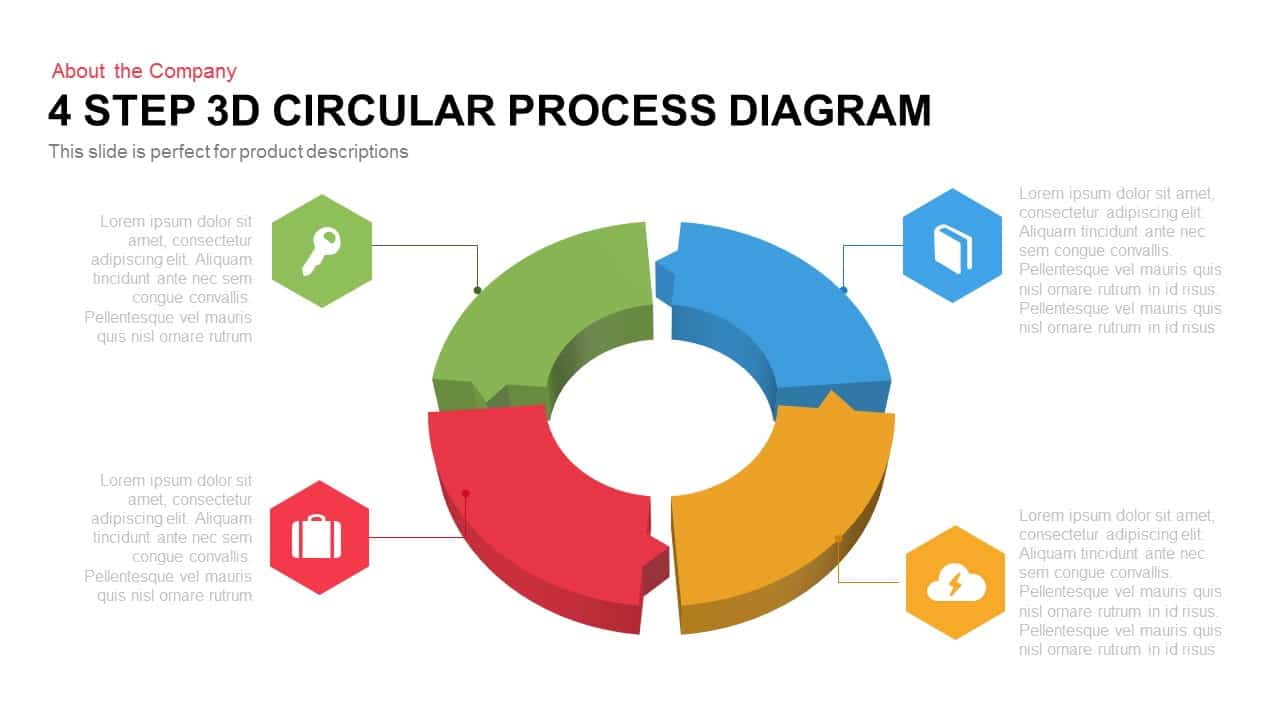
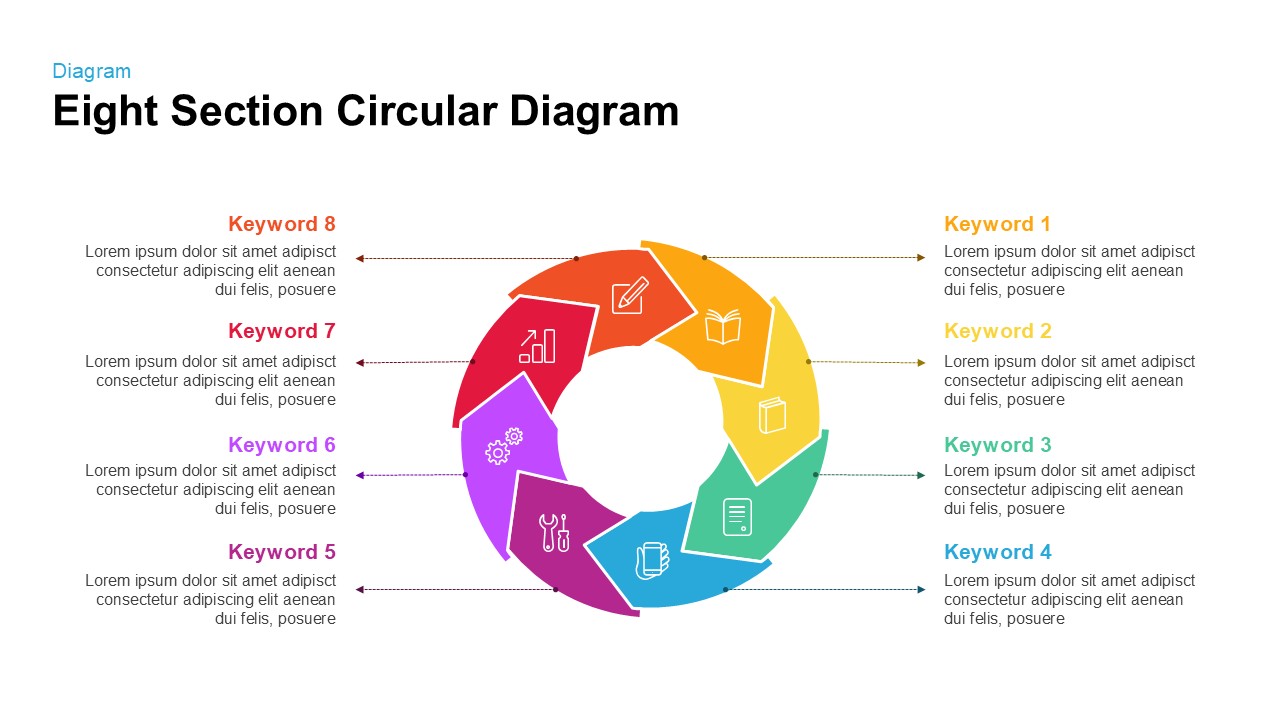
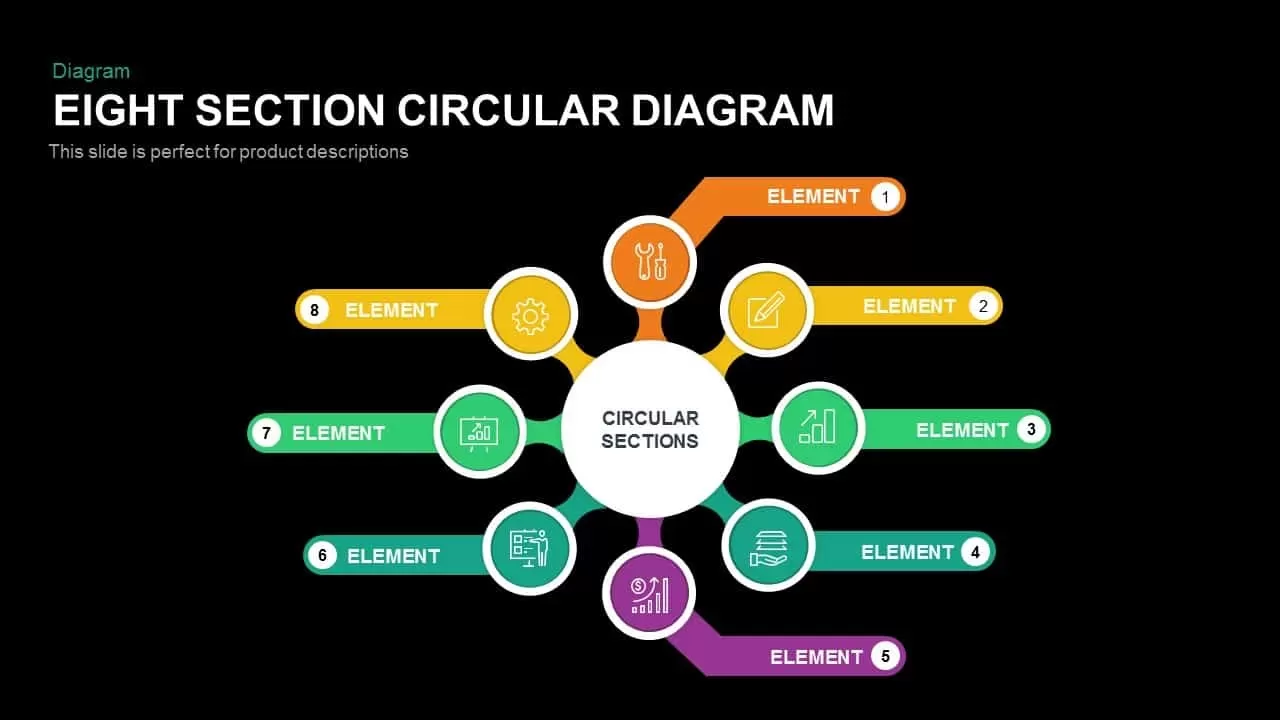
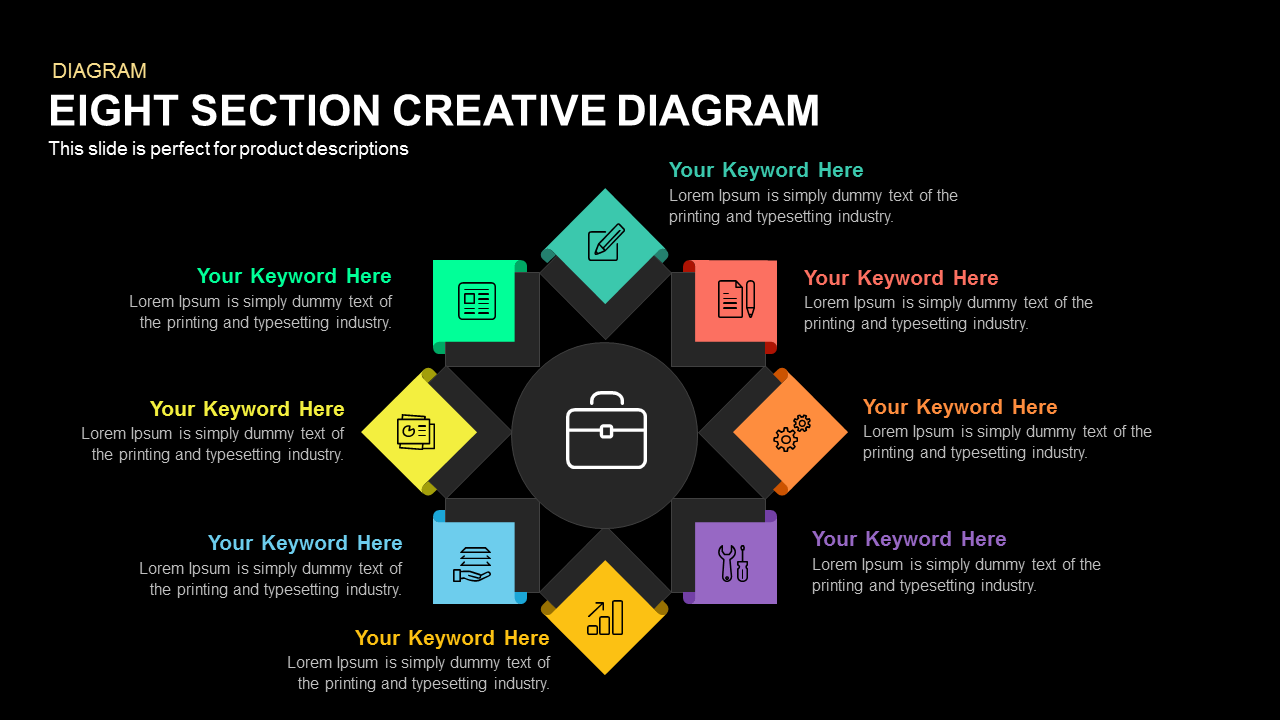
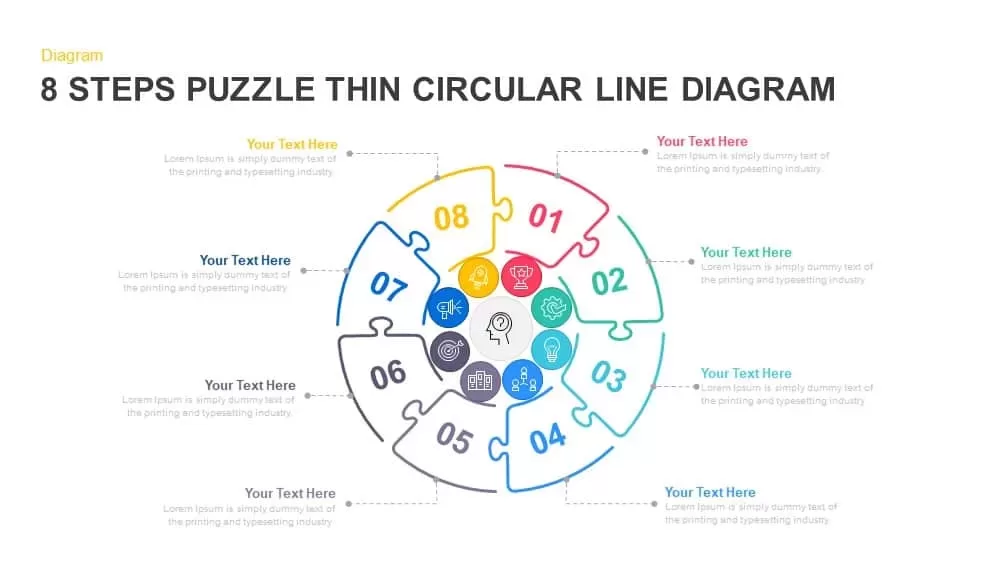
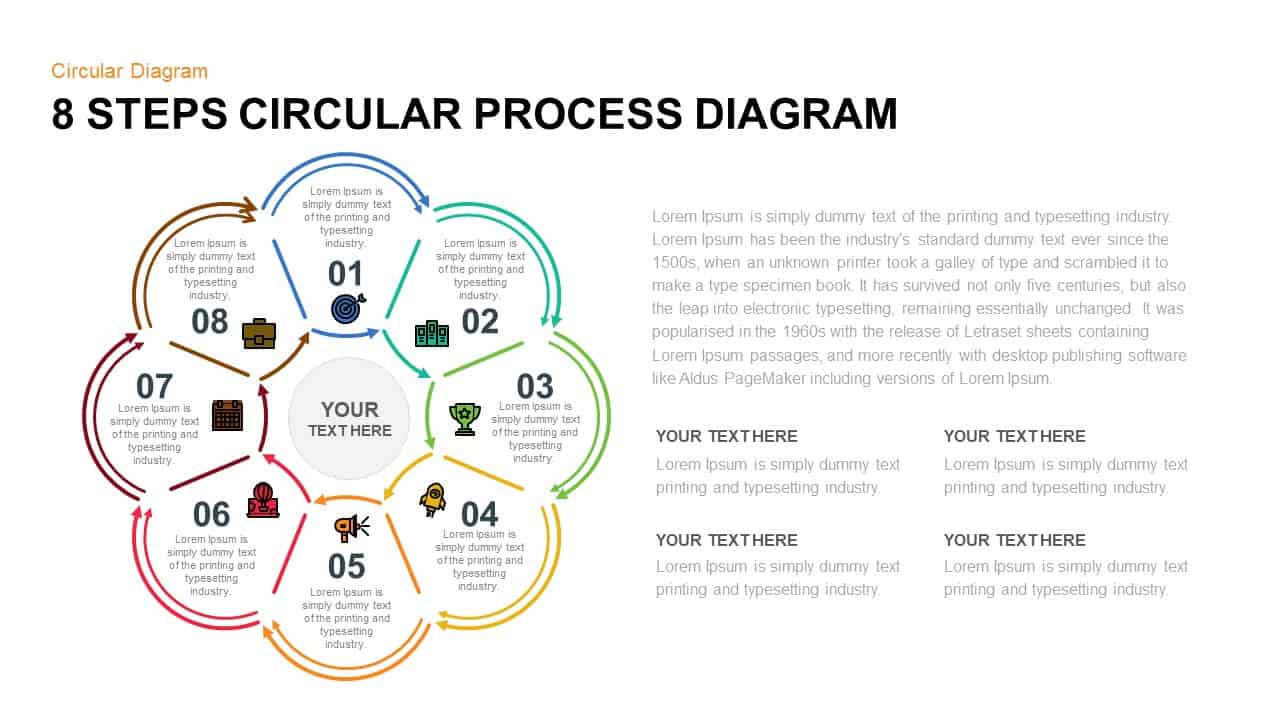
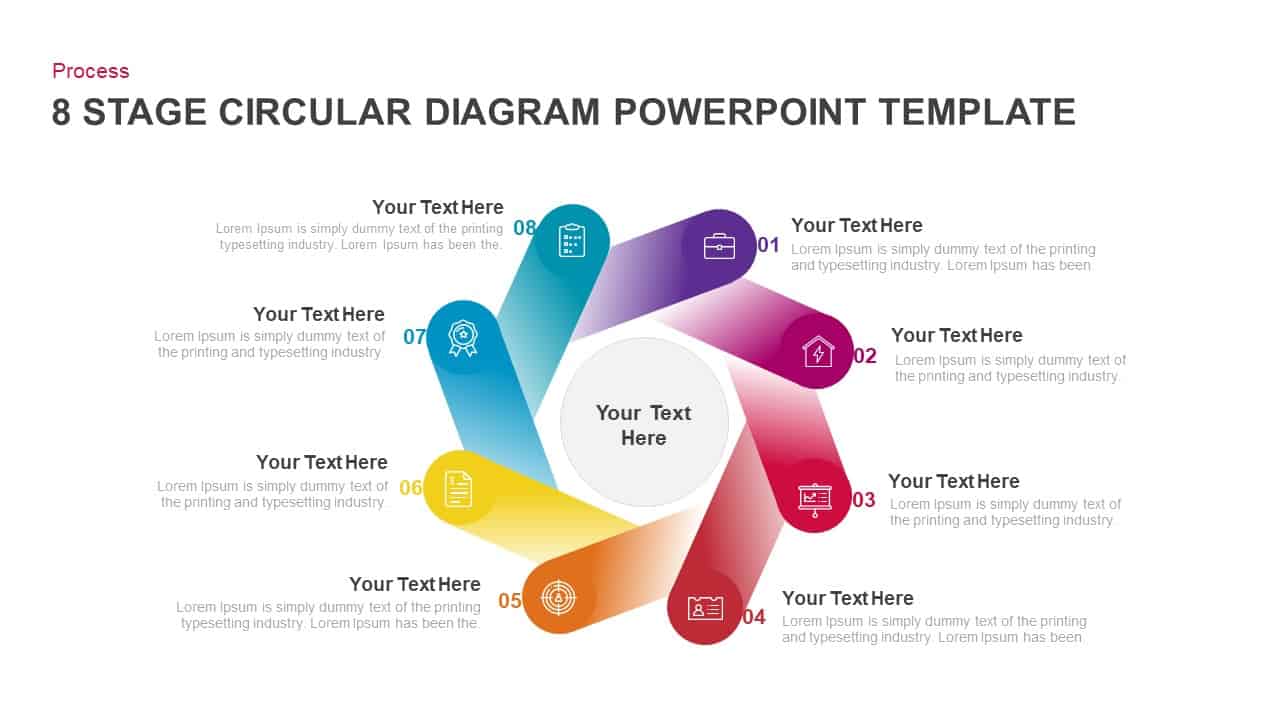
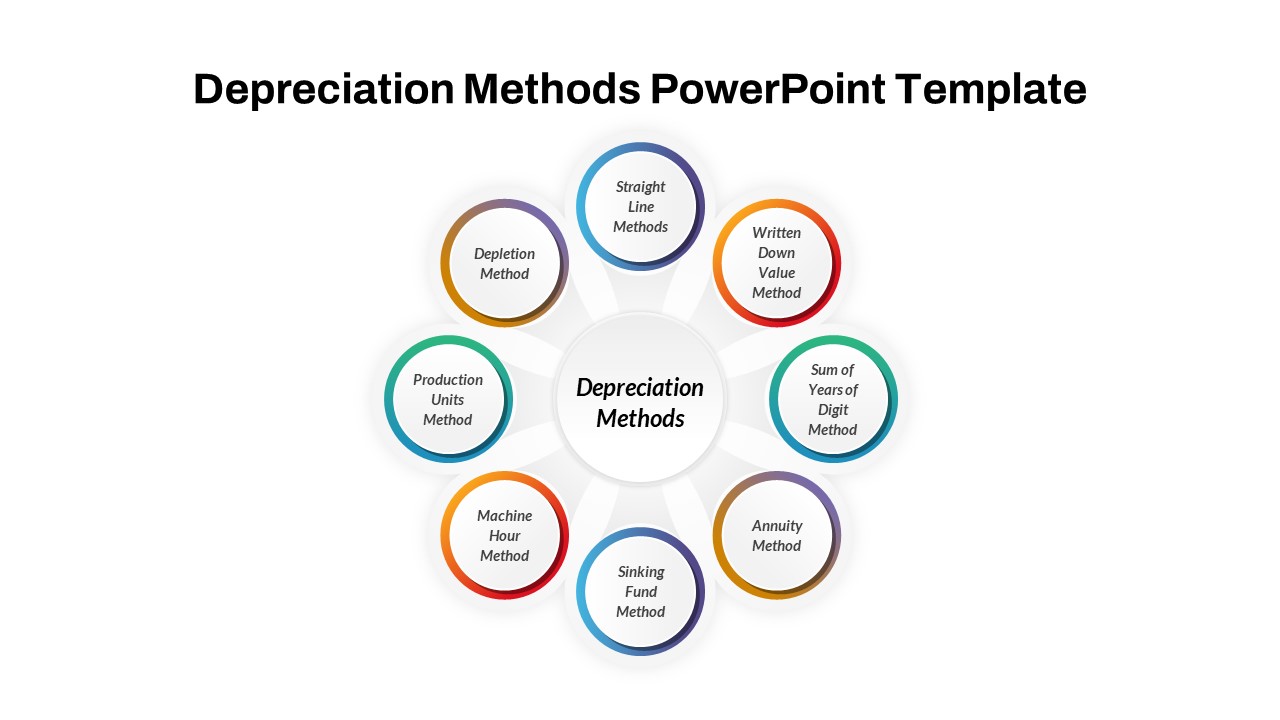
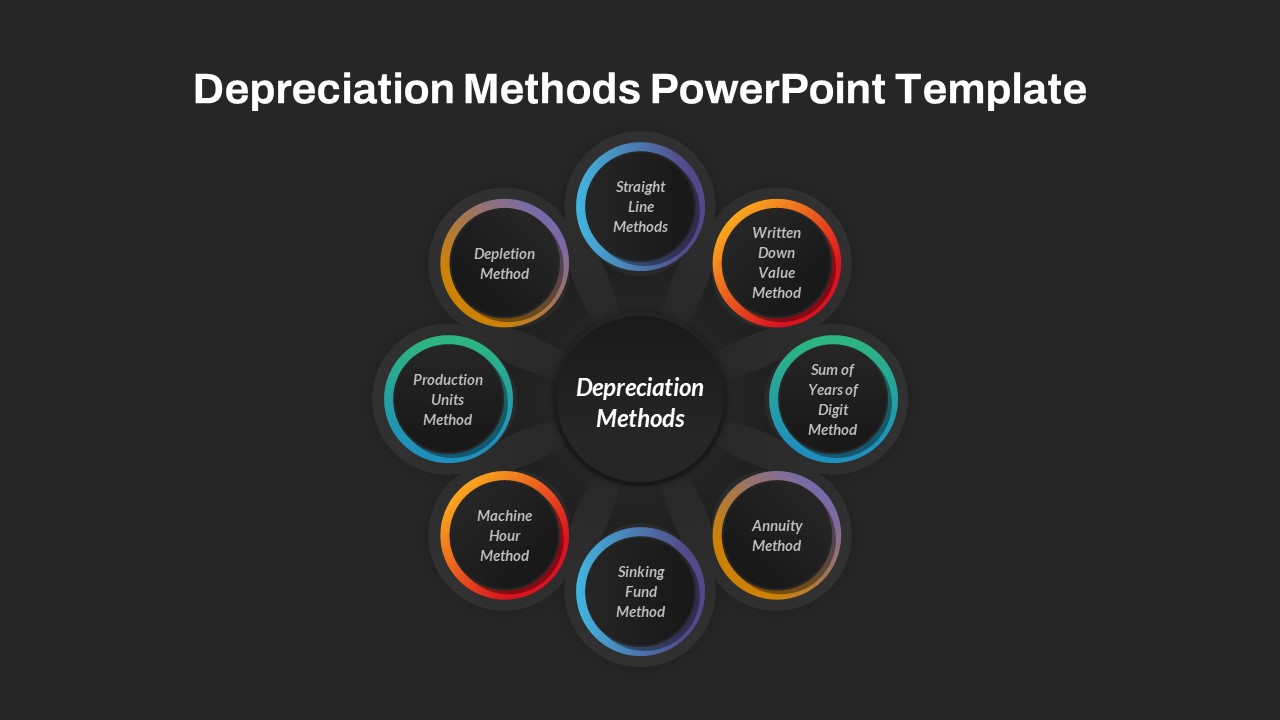
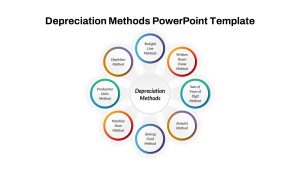
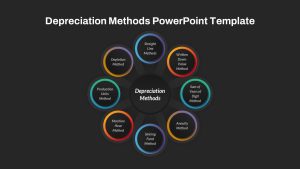
Leverage this Depreciation Methods slide to illustrate various depreciation calculation techniques within a streamlined, eight-segment circular framework. The slide features eight distinct segments—Straight Line Method, Written Down Value Method, Sum of Years of Digit Method, Annuity Method, Sinking Fund Method, Machine Hour Method, Production Units Method, and Depletion Method—each represented by a bold circle, vibrant gradient outline, and intuitive icon. Customizable text placeholders allow you to define formulas, assumptions, and application scenarios for each method. The central white hub anchors the model, emphasizing how these techniques interrelate to optimize asset valuation and financial reporting.
Designed with a modern flat aesthetic and clear typography, this template delivers a polished, professional look that seamlessly integrates with corporate branding guidelines. Built on editable master slides, it empowers users to swap icons, adjust segment order, refine color palettes, or update labels in seconds. The circular arrangement guides audiences through the progression of depreciation strategies, fostering clarity and engagement. Optimized for PowerPoint and Google Slides, the slide maintains full-resolution clarity across devices, ensuring consistent presentation quality and eliminating formatting headaches.
The template supports collaborative workflows, enabling real-time coauthoring and version control for finance teams, accountants, and auditors. Integrated color guides and typography presets ensure brand consistency and compliance with accessibility standards. Use the prebuilt callouts to highlight key formulas, compliance requirements, or case study examples that reinforce each method’s strategic application.
Whether you’re preparing CFO briefings, conducting accounting workshops, or presenting audit findings, this Depreciation Methods circular diagram slide will captivate stakeholders and simplify complex financial concepts. Simply duplicate, reorder, or recolor segments to tailor the framework to lease accounting, intangible asset amortization, or environmental cost depletion scenarios.
Who is it for
CFOs, financial analysts, accounting managers, controllers, and auditors will find this slide invaluable for comparing depreciation methods, standardizing reporting, and training finance teams.
Other Uses
Repurpose this diagram for fixed-asset management workflows, cost recovery calculations, amortization schedules, asset lifecycle analysis, or process-mapping exercises by relabeling segments and updating icons.
Login to download this file

Item ID
SB04408
Related Templates

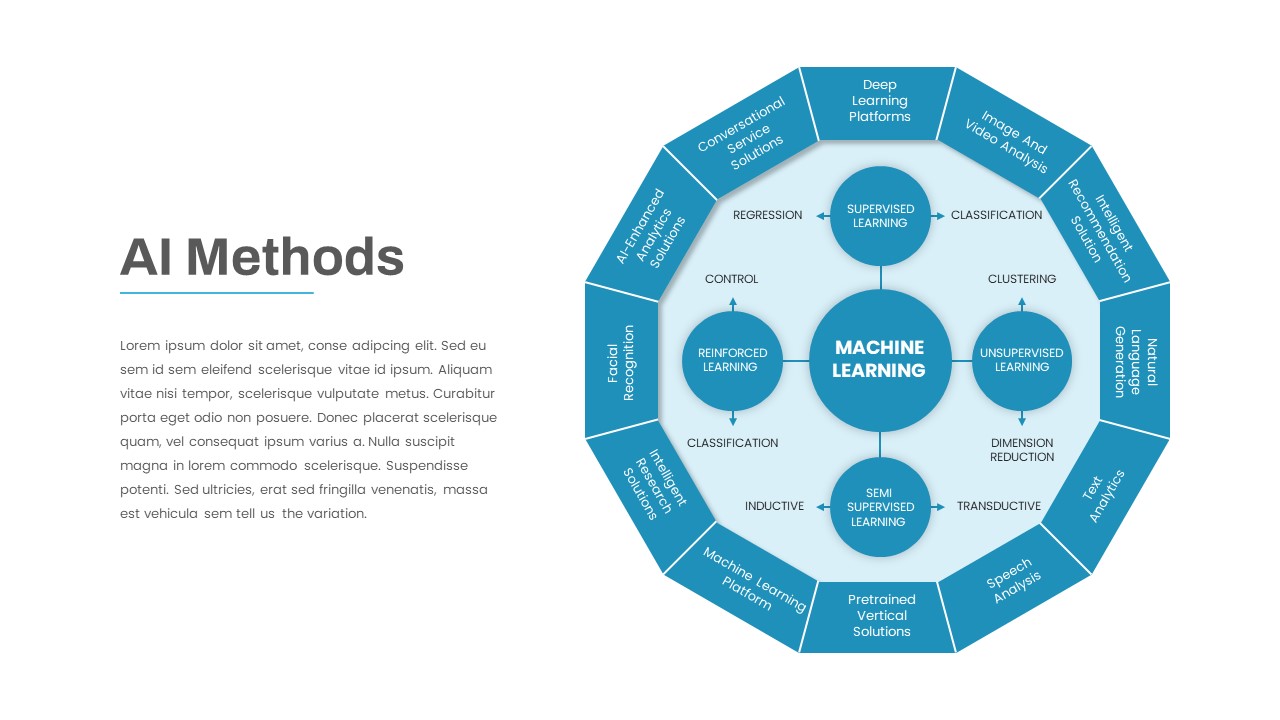
AI Methods Circular Diagram Slide Template for PowerPoint & Google Slides
AI
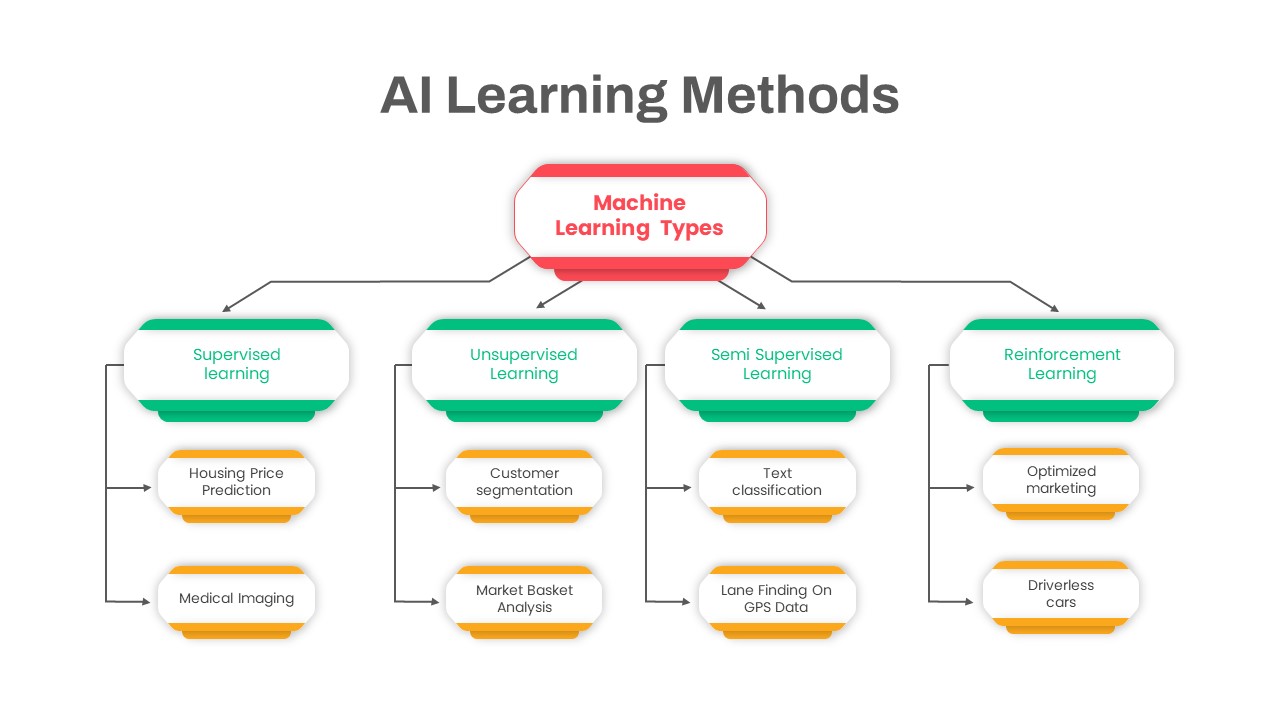
AI Learning Methods Flowchart Diagram Template for PowerPoint & Google Slides
Flow Charts
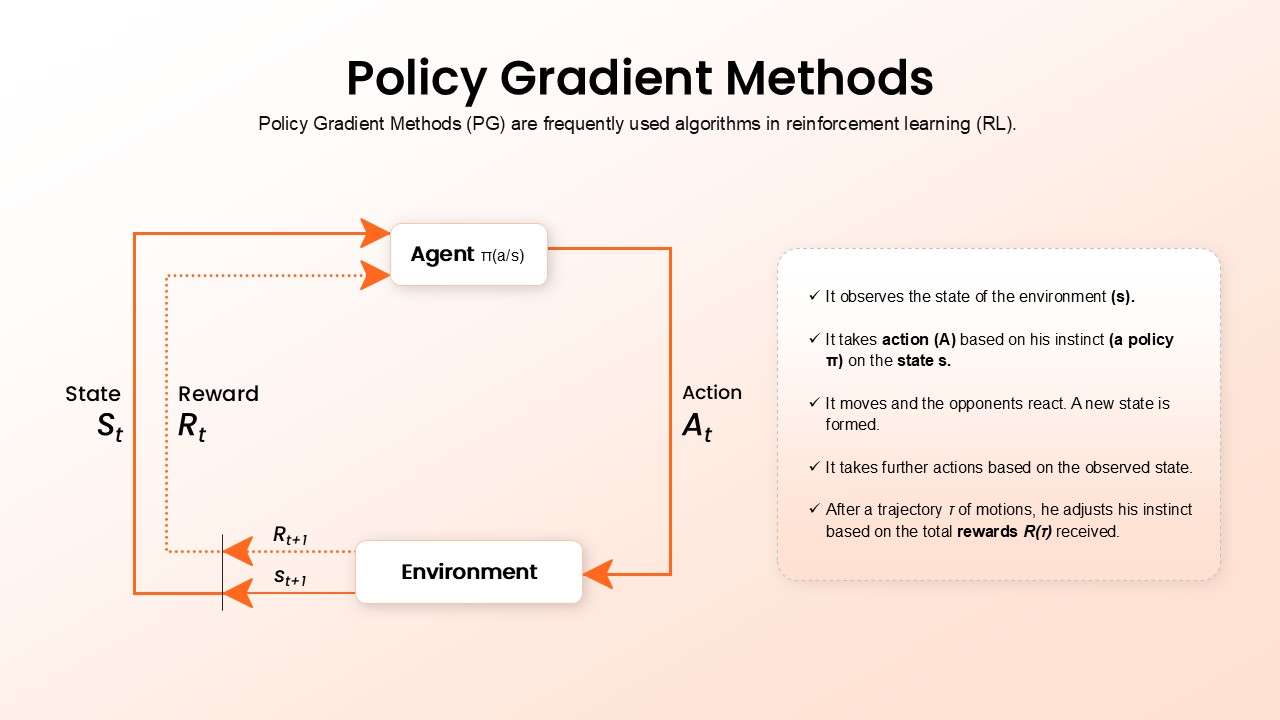
Policy Gradient Methods Flow Diagram Template for PowerPoint & Google Slides
AI

Popular Teaching Methods Educational Template for PowerPoint & Google Slides
Decks

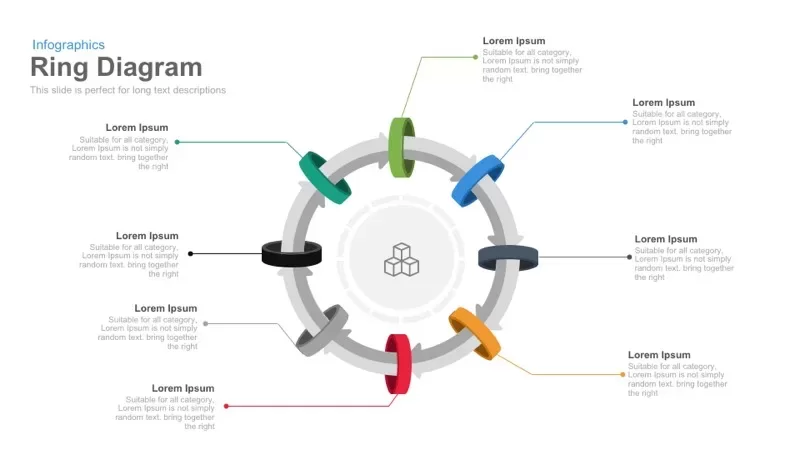
8 Circular Ring Diagram template for PowerPoint & Google Slides
Infographics
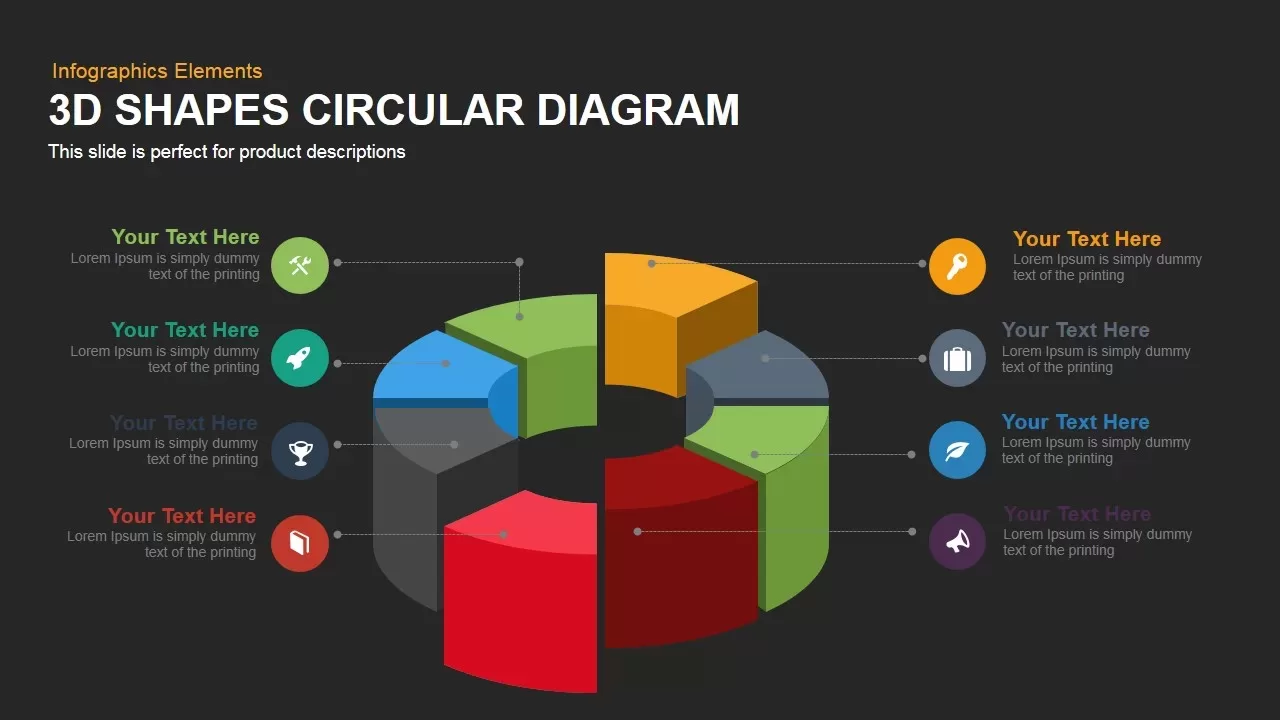
3D Circular Diagram template for PowerPoint & Google Slides
Circular
Circular Flow Diagram Template for PowerPoint & Google Slides
Infographics
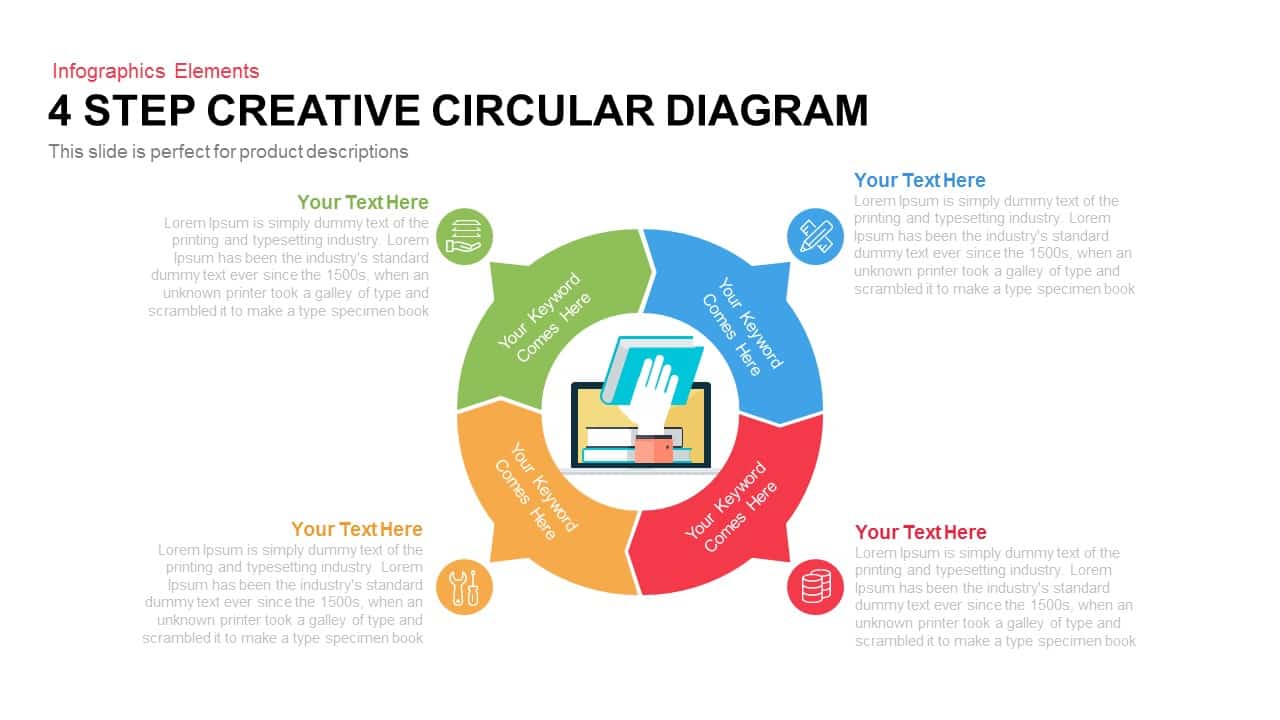
4 Step Creative Circular Diagram Template for PowerPoint & Google Slides
Infographics
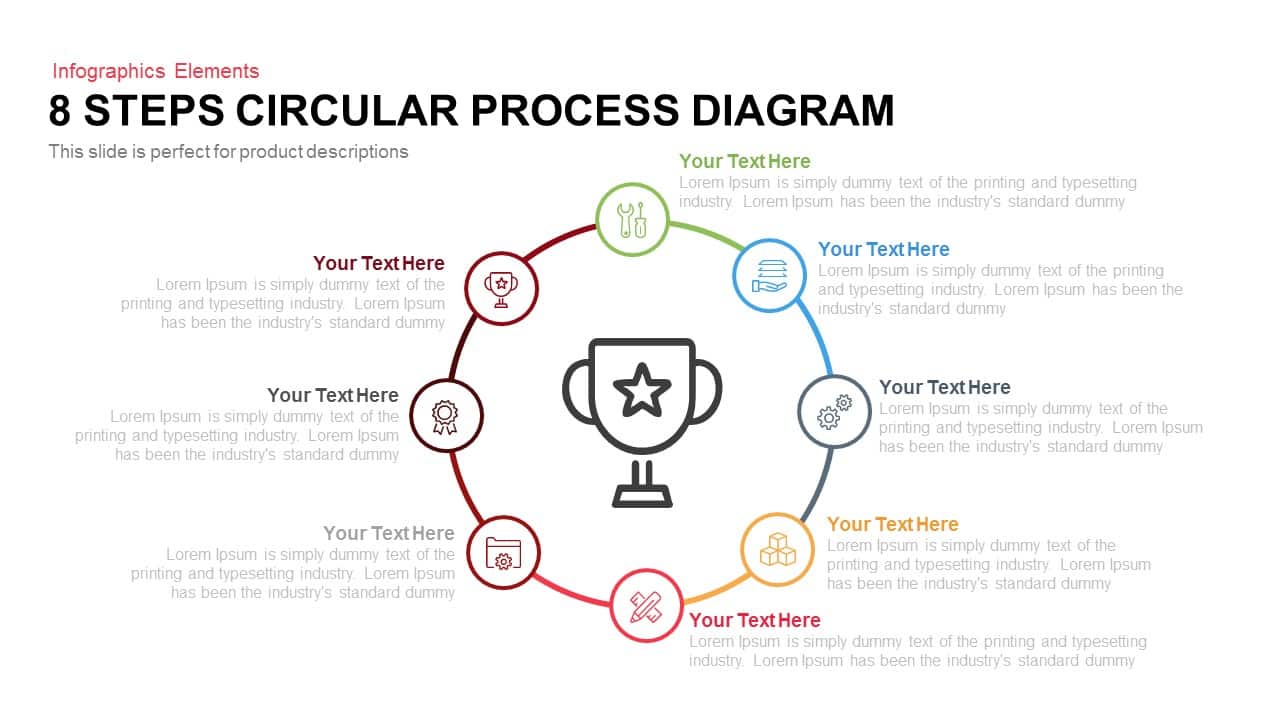
8 Steps Circular Process Diagram Template for PowerPoint & Google Slides
Process
Six Step Creative Circular Diagram Template for PowerPoint & Google Slides
Circular
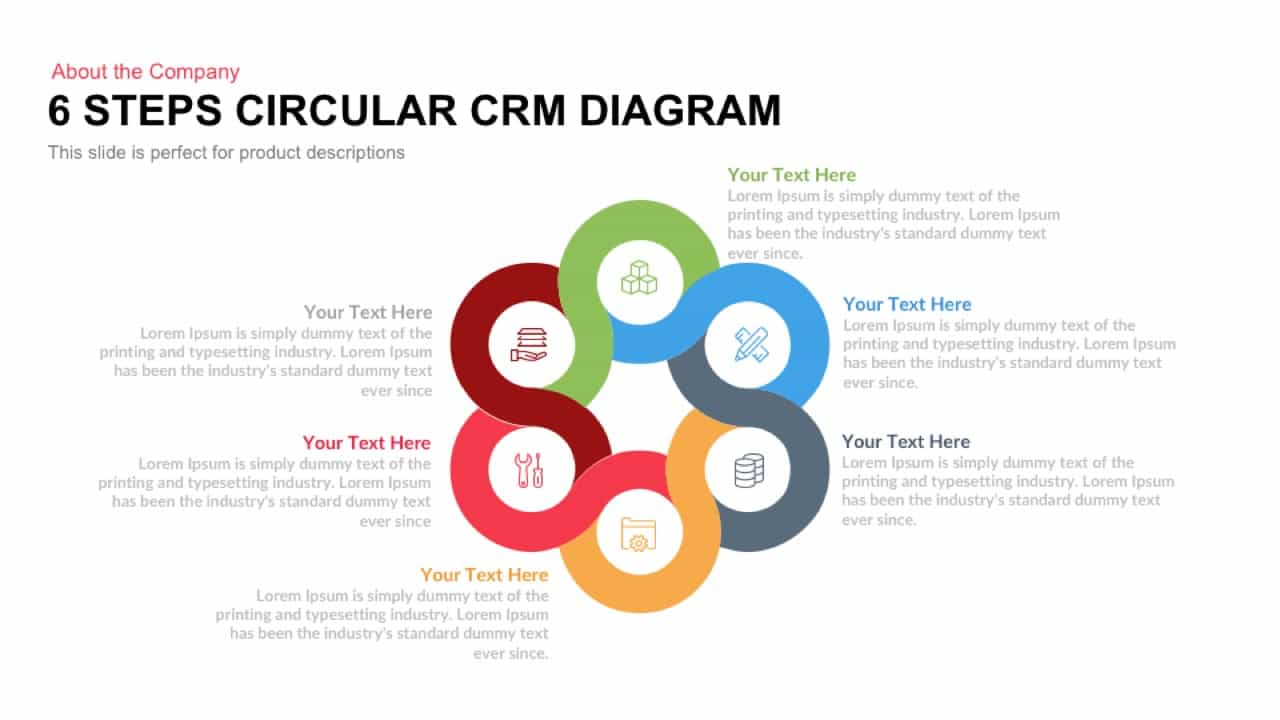
Six Steps Circular CRM Diagram Template for PowerPoint & Google Slides
Customer Journey
4 Step 3D Circular Process Diagram template for PowerPoint & Google Slides
Process
Eight Section Circular Diagram Template for PowerPoint & Google Slides
Circular
Eight Section Circular Diagram Template for PowerPoint & Google Slides
Circular
Six Section Circular Infographic Diagram Template for PowerPoint & Google Slides
Circular
Eight-Section Circular Diagram template for PowerPoint & Google Slides
Circular

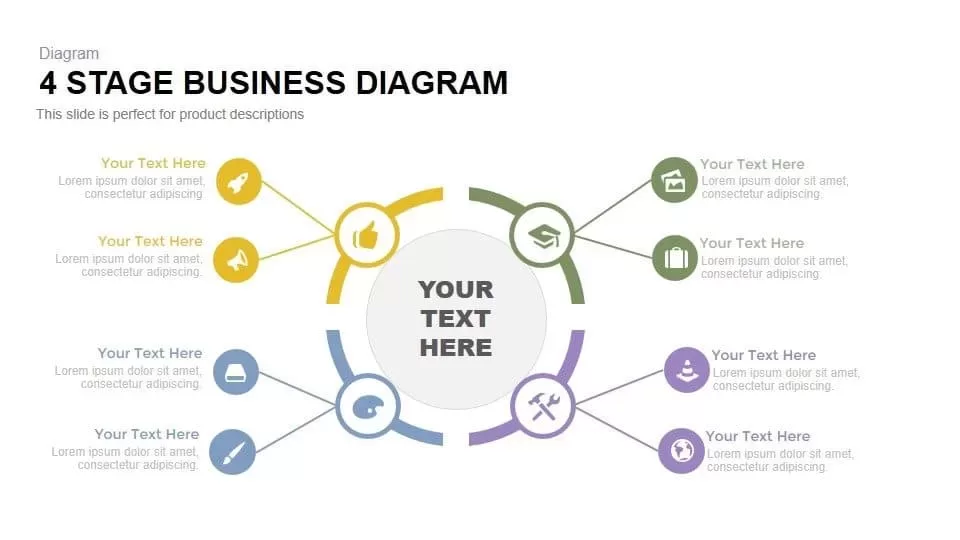
Four-Stage Business Circular Diagram Template for PowerPoint & Google Slides
Process

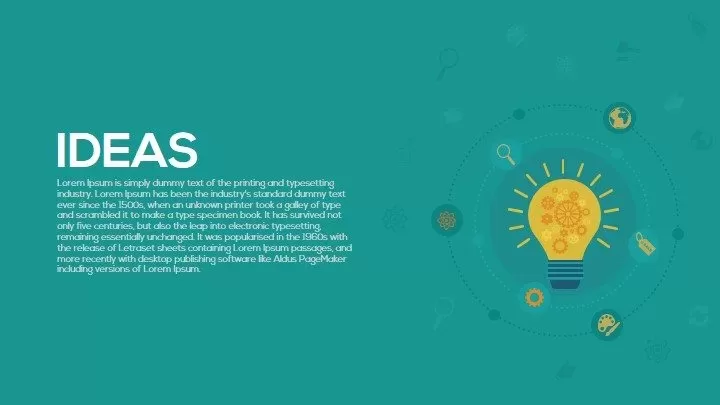
Light Bulb Idea Circular Diagram Template for PowerPoint & Google Slides
Infographics
Five-Section Circular Arrow Diagram Template for PowerPoint & Google Slides
Circular
Six-Stage Circular Cycle Diagram Template for PowerPoint & Google Slides
Process
Seven-Segment Circular Arrow Diagram Template for PowerPoint & Google Slides
Arrow

8-Step Circular Arrow Diagram Template for PowerPoint & Google Slides
Arrow
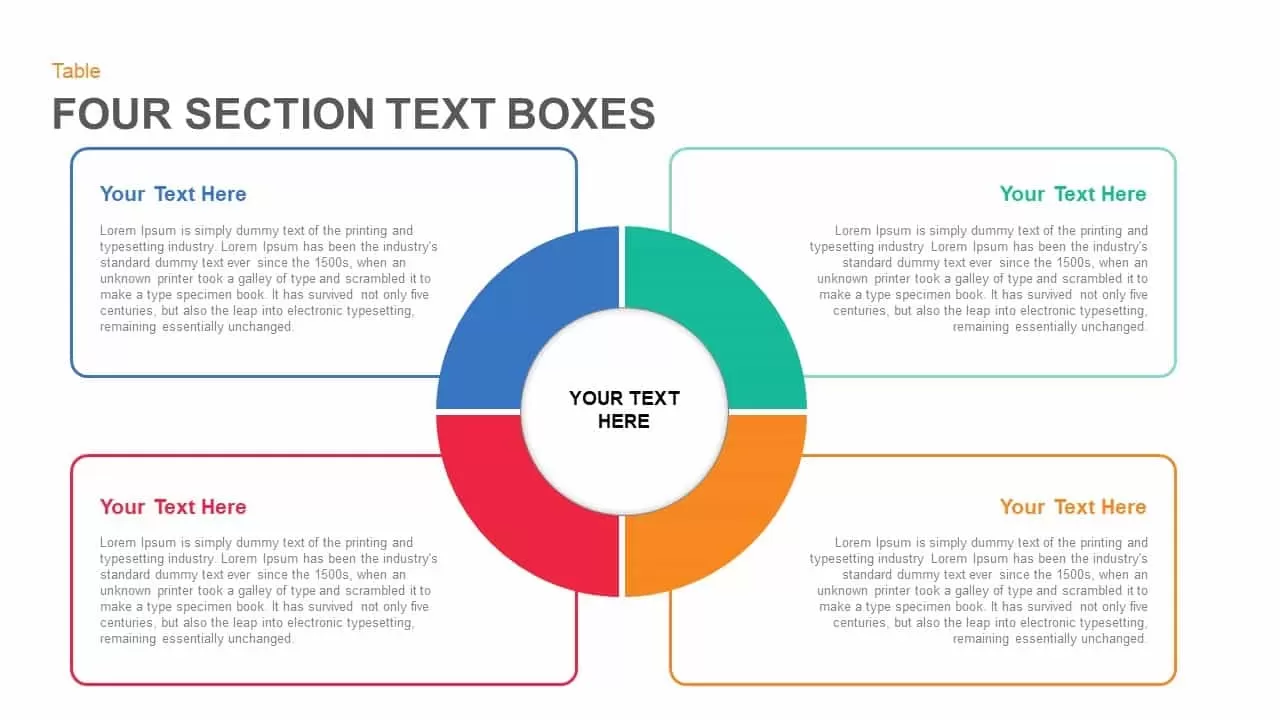
Four Section Circular Text Boxes Diagram Template for PowerPoint & Google Slides
Circular

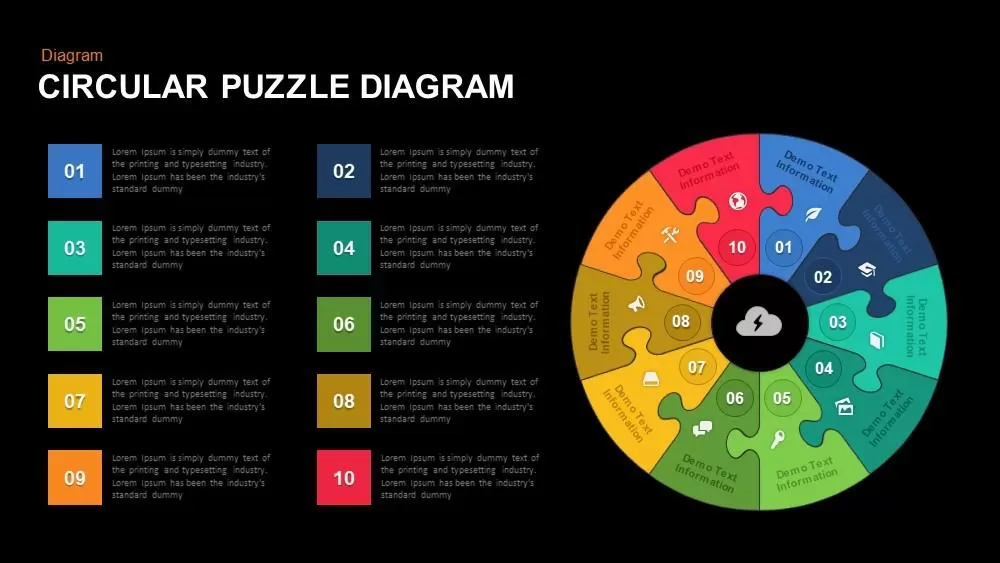
Ten-Piece Circular Puzzle Diagram Template for PowerPoint & Google Slides
Circular
Eight-Step Circular Diagram Infographic Template for PowerPoint & Google Slides
Circular
8-Step Puzzle Circular Diagram Template for PowerPoint & Google Slides
Circular
PEST Analysis Circular Diagram Template for PowerPoint & Google Slides
PEST
Six Stage Circular Diagram with Icons Template for PowerPoint & Google Slides
Circular
Six Segment Hexagon Circular Diagram Template for PowerPoint & Google Slides
Circular
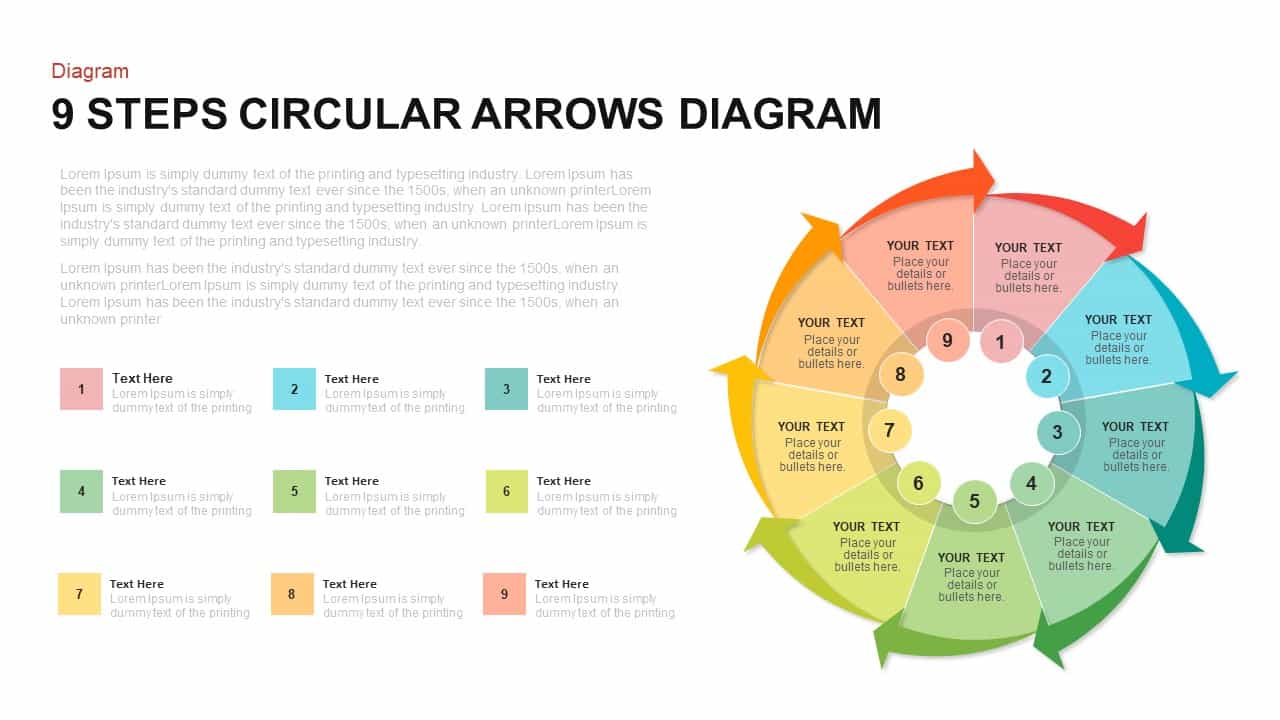
9-Step Circular Arrows Process Diagram Template for PowerPoint & Google Slides
Process
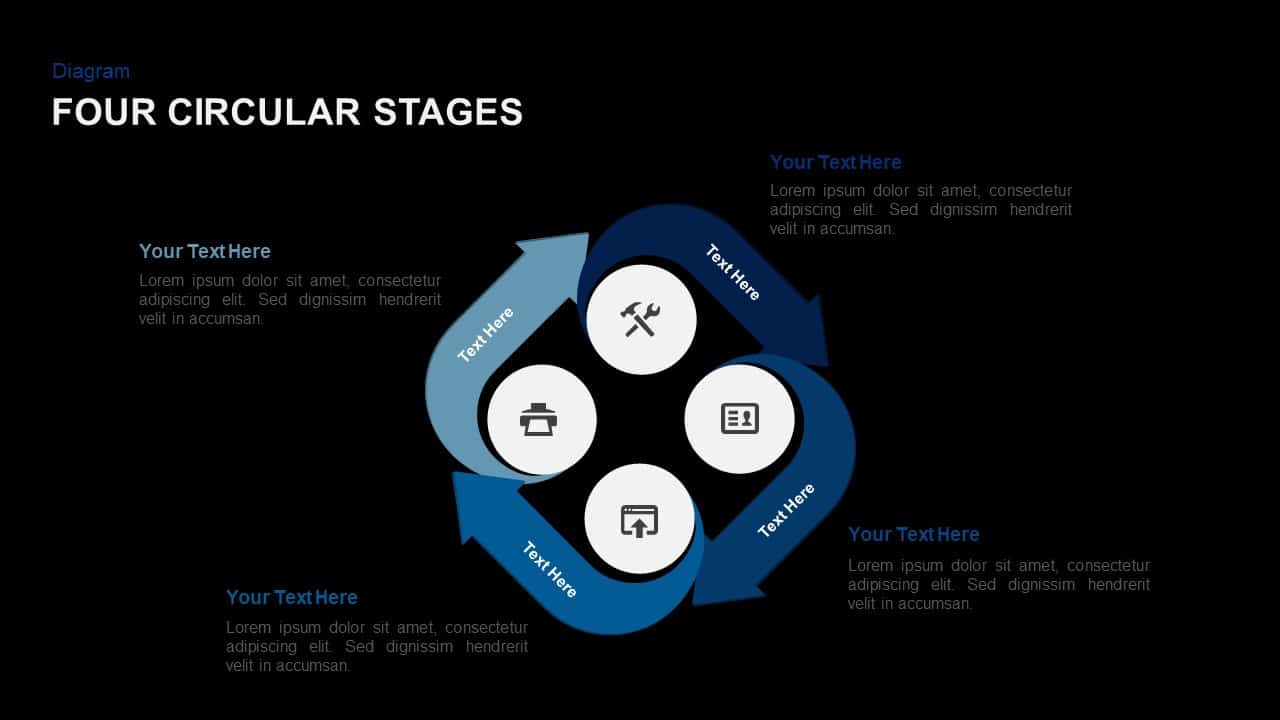
4 Staged Circular Business Process Diagram template for PowerPoint & Google Slides
Process
3, 4 & 5 Circular Stages Cycle Diagram Deck Template for PowerPoint & Google Slides
Circular
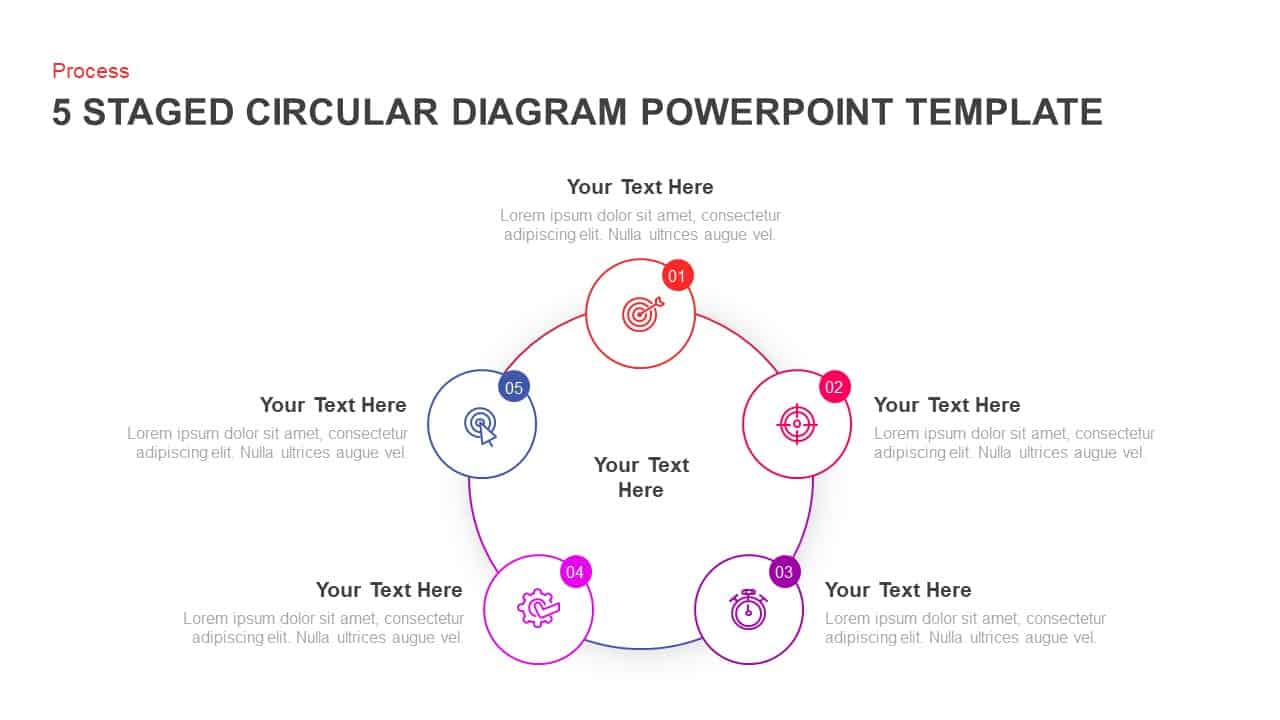
Five-Stage Circular Infographic Diagram Template for PowerPoint & Google Slides
Process
Six-Stage Circular Diagram Process Template for PowerPoint & Google Slides
Circular
Five-Stage Circular Process Diagram Template for PowerPoint & Google Slides
Circular
Five Layer Circular Ring Diagram Template for PowerPoint & Google Slides
Circular
8 Steps Circular Process Diagram Template for PowerPoint & Google Slides
Circular
Five Stage Circular Arrow Diagram Template for PowerPoint & Google Slides
Process
Five-Stage Circular Process Flow Diagram Template for PowerPoint & Google Slides
Circular
Five-Step Circular Process Diagram Template for PowerPoint & Google Slides
Circular
Five-Stage Circular Flow Diagram Template for PowerPoint & Google Slides
Circular
4 Ps of Management Circular Diagram Template for PowerPoint & Google Slides
Circular
Six-Stage Clockwise Circular Diagram Template for PowerPoint & Google Slides
Circular
4 Factors Circular Diagram Infographic Template for PowerPoint & Google Slides
Circular
Circular Three-Step Infographic Diagram Template for PowerPoint & Google Slides
Circular
8 Step Circular Process Flow Diagram Template for PowerPoint & Google Slides
Process
HR Evaluation Strategy Circular Diagram Template for PowerPoint & Google Slides
Circular
6-Step Circular Process Flow Diagram Template for PowerPoint & Google Slides
Process
Value Chain Circular Process Diagram Template for PowerPoint & Google Slides
Business Models
Six-Stage Circular Flow Diagram Template for PowerPoint & Google Slides
Circular
8-Stage Chevron Circular Diagram Template for PowerPoint & Google Slides
Process
Colorful Circular Puzzle Diagram Template for PowerPoint & Google Slides
Circular
Eight Step Circular Diagram Template for PowerPoint & Google Slides
Circular
6-Part Circular Gear Infographic Diagram Template for PowerPoint & Google Slides
Process

Agile Lifecycle Circular Diagram Template for PowerPoint & Google Slides
Circular
2-8 Step Circular Diagram Template for PowerPoint & Google Slides
Infographics
Circular CRM Process Infographic Diagram Template for PowerPoint & Google Slides
Circular
5S Lean Methodology Circular Diagram Template for PowerPoint & Google Slides
Process
5-Step Circular Puzzle Diagram Template for PowerPoint & Google Slides
Circular
4MAT Learning Cycle Circular Diagram Template for PowerPoint & Google Slides
Circular
Multi-Color Enneagram Circular Diagram Template for PowerPoint & Google Slides
Circular
Four-Item Circular Diagram Concept Template for PowerPoint & Google Slides
Circular
ITIL Service Lifecycle Circular Diagram Template for PowerPoint & Google Slides
Circular
8-Step Circular Diagram Infographics Template for PowerPoint & Google Slides
Circular
Circular 3D Cube Six-Segment Diagram Template for PowerPoint & Google Slides
Infographics
Circular Business Ecosystem Diagram Template for PowerPoint & Google Slides
Business Strategy
Capacity Planning Circular Diagram Template for PowerPoint & Google Slides
Circular
Free Circular Multi-Step Flow Chart Diagram Template for PowerPoint & Google Slides
Flow Charts
Free
Concentric Circular Arrow Cycle Diagram Template for PowerPoint & Google Slides
Process
Circular Arrow Process Diagram Template for PowerPoint & Google Slides
Circular
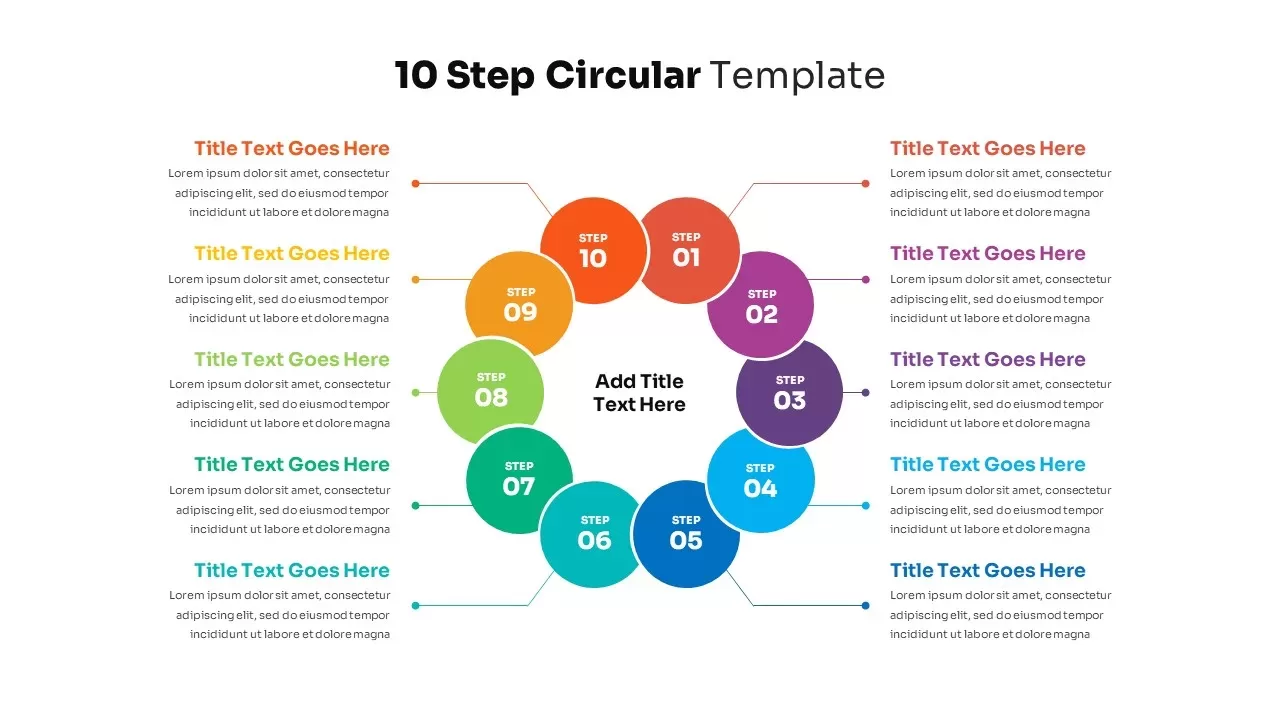
10-Step Circular Process Diagram Template for PowerPoint & Google Slides
Process
10-Step Circular Process Diagram Template for PowerPoint & Google Slides
Process
10 Step Circular Process Diagram Template for PowerPoint & Google Slides
Circular
10-Step Circular Diagram Template for PowerPoint & Google Slides
Circular
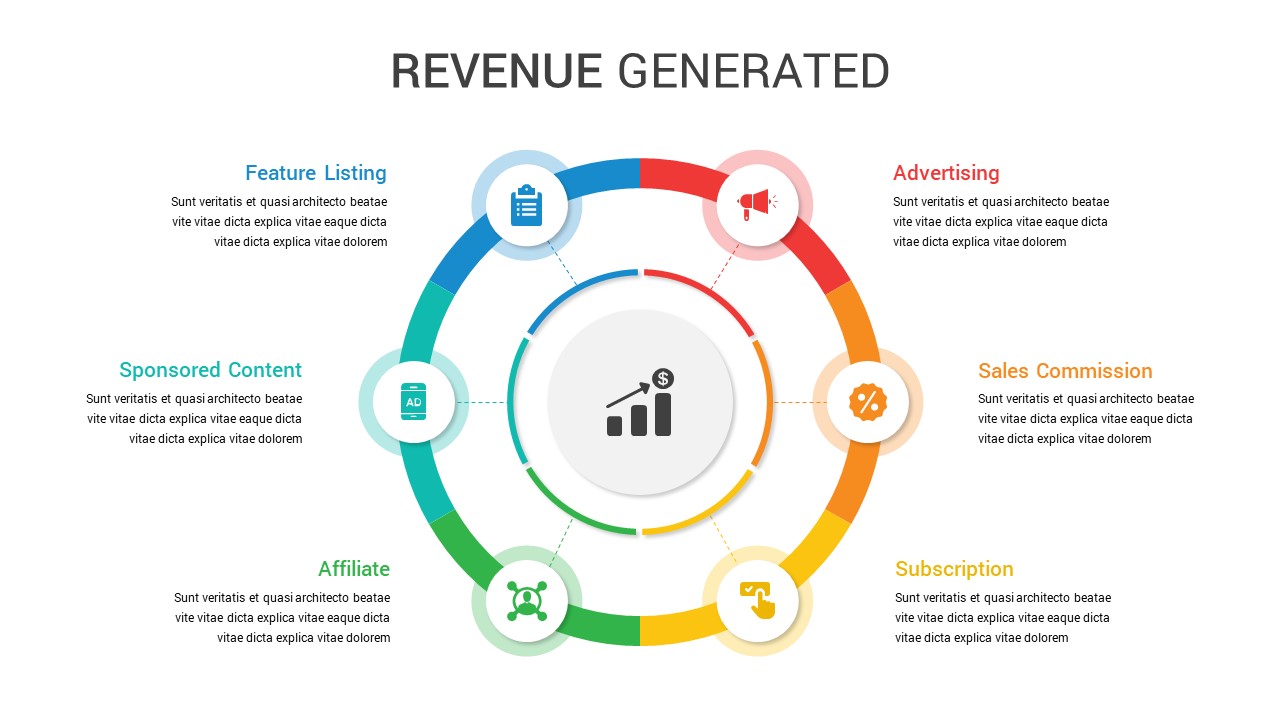
Circular Revenue Generation Diagram Template for PowerPoint & Google Slides
Revenue
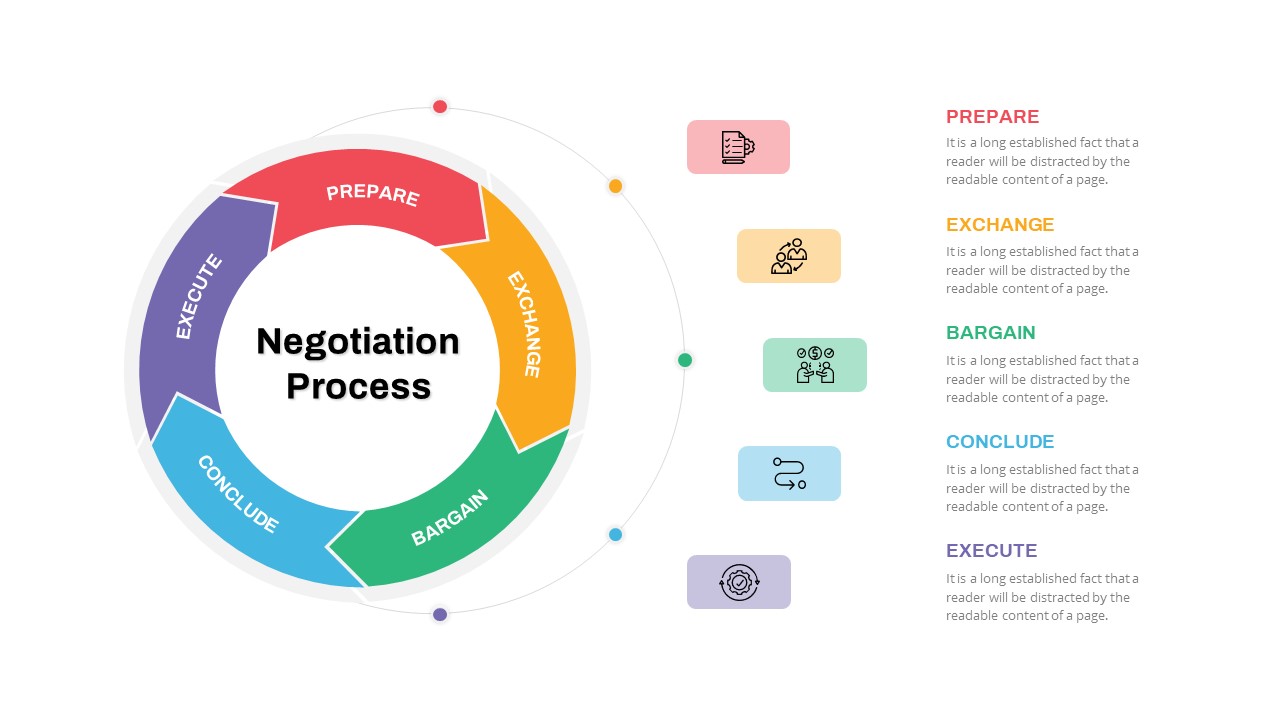
Negotiation Process Circular Diagram Template for PowerPoint & Google Slides
Circular
Release Management Cycle Circular Diagram Template for PowerPoint & Google Slides
Software Development
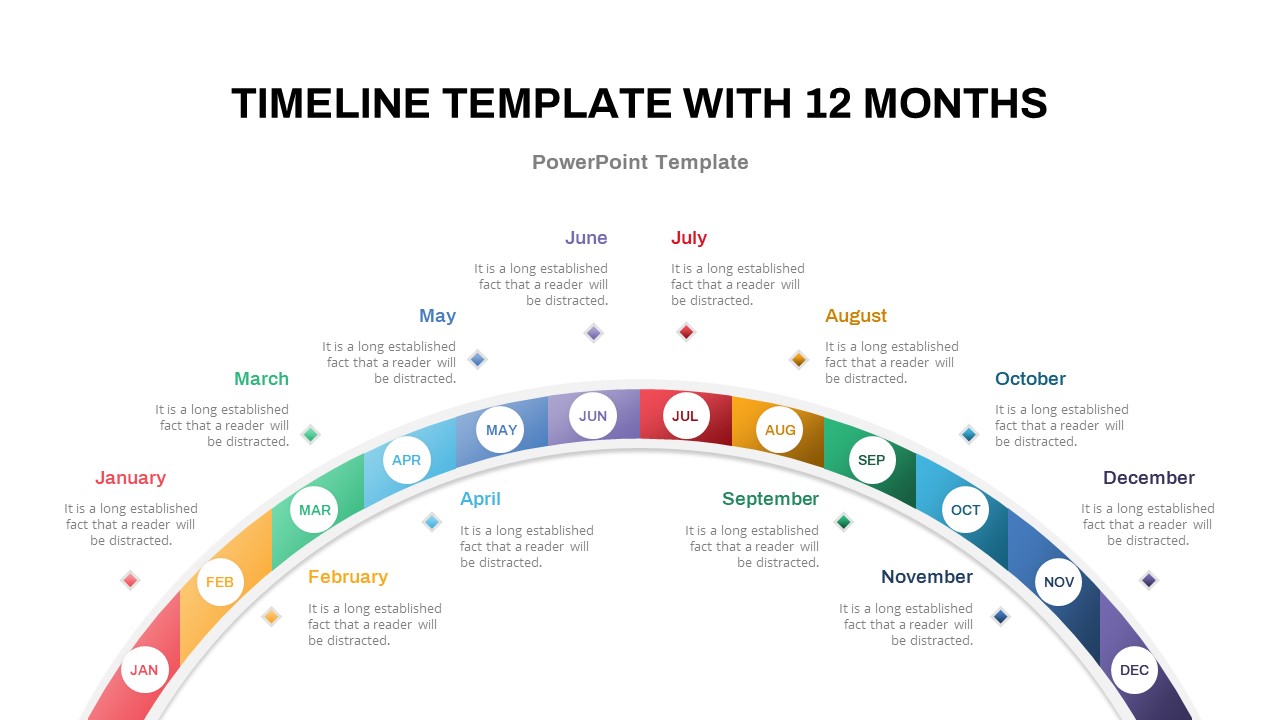
12-Month Semi-Circular Timeline Diagram Template for PowerPoint & Google Slides
Timeline
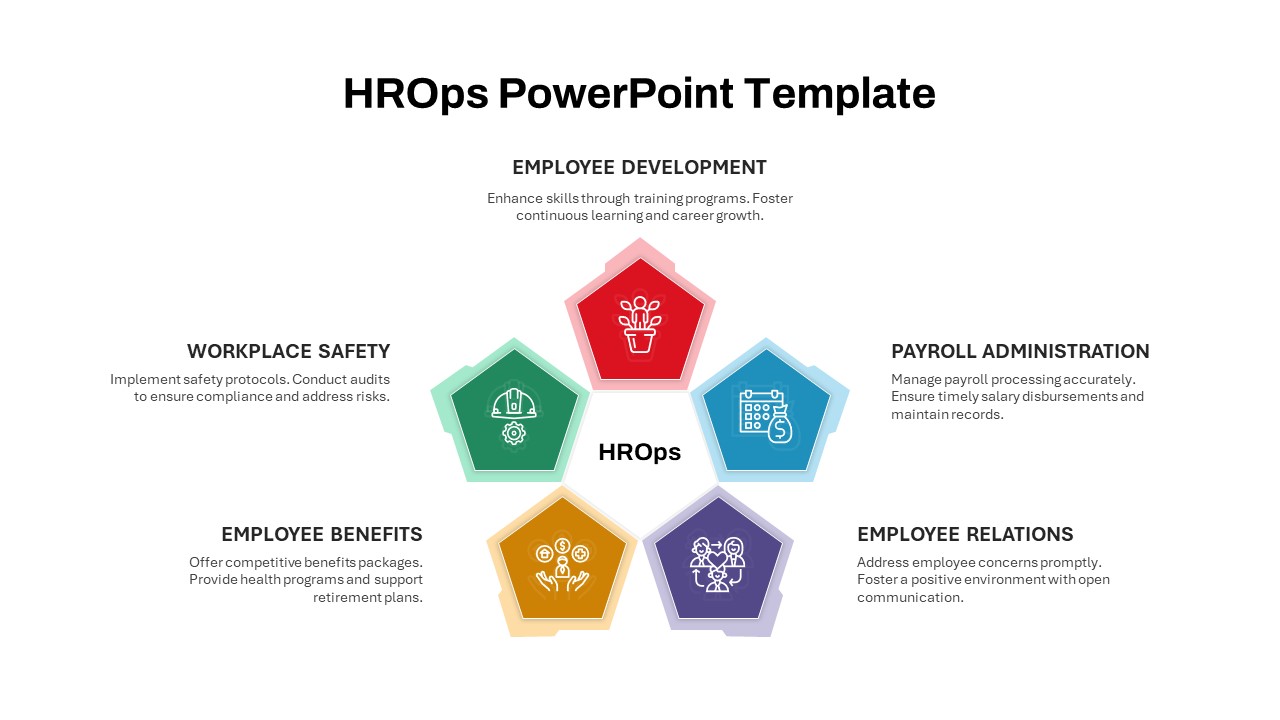
HROps Hub and Spoke Circular Diagram Template for PowerPoint & Google Slides
Circular
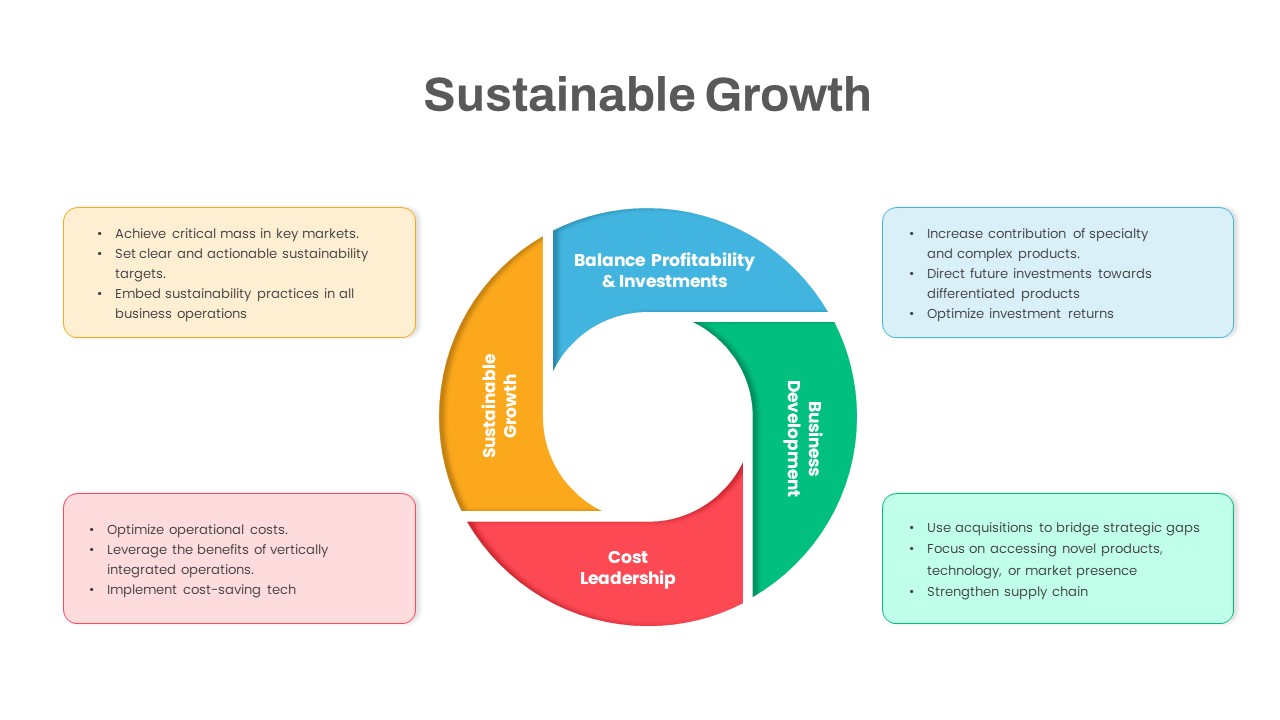
Sustainable Growth Circular Diagram Template for PowerPoint & Google Slides
Circular
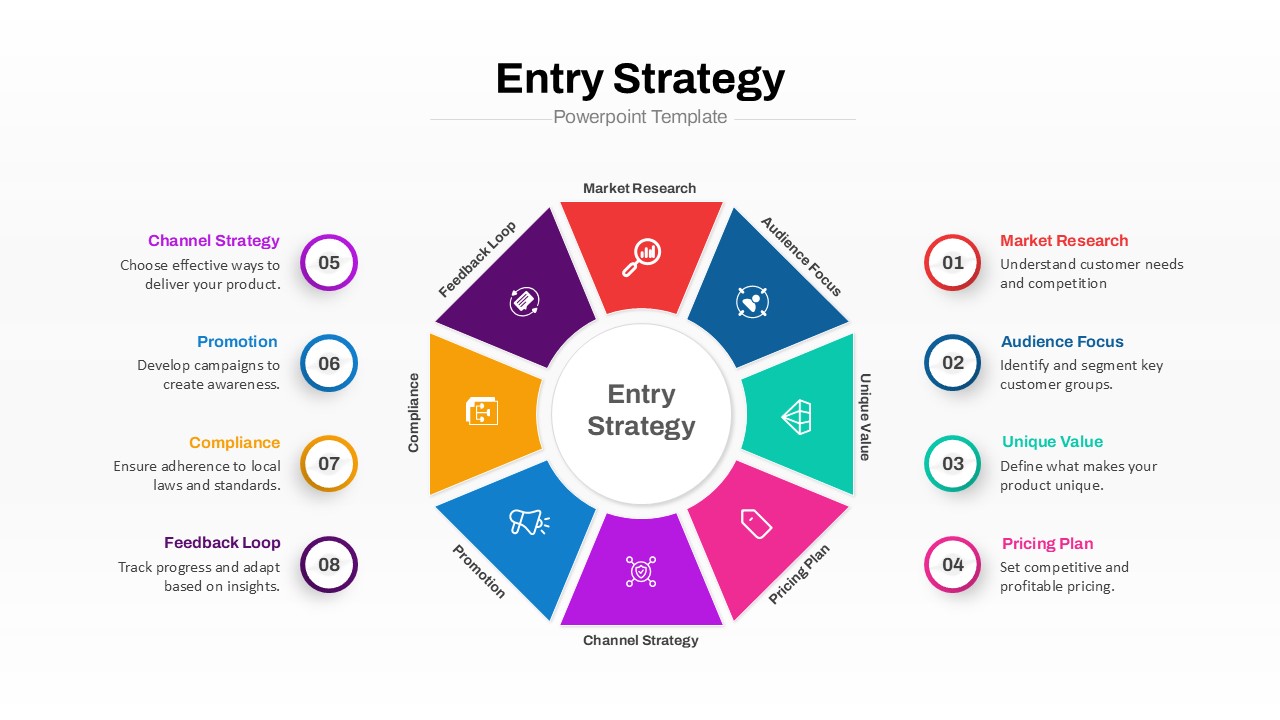
Entry Strategy Circular Diagram Template for PowerPoint & Google Slides
Circular
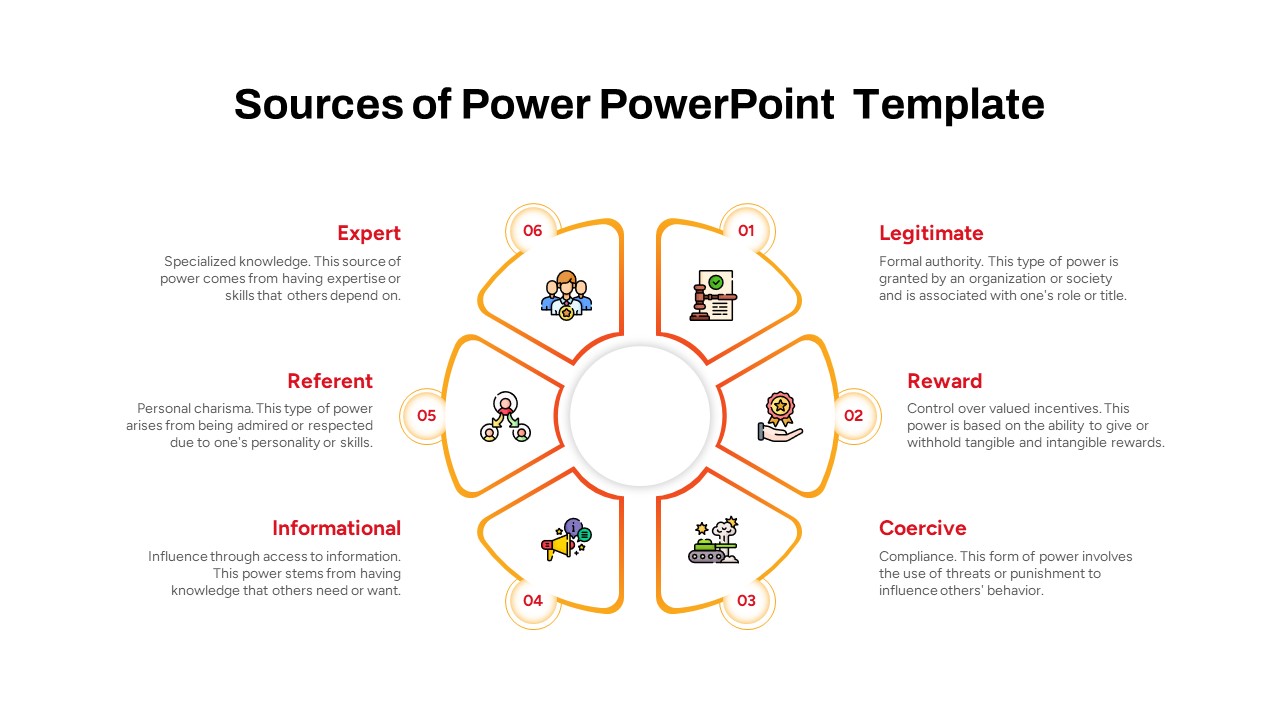
Sources of Power Circular Diagram Template for PowerPoint & Google Slides
Circular
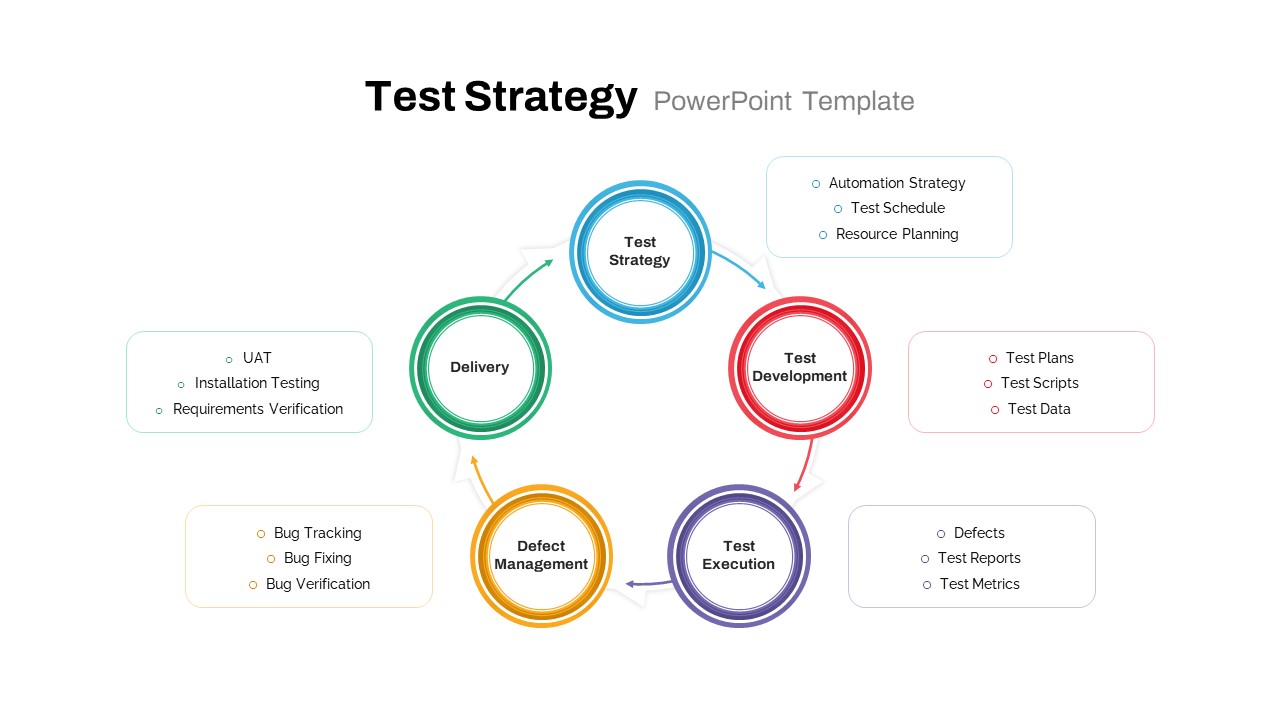
Test Strategy Circular Diagram Template for PowerPoint & Google Slides
Circular
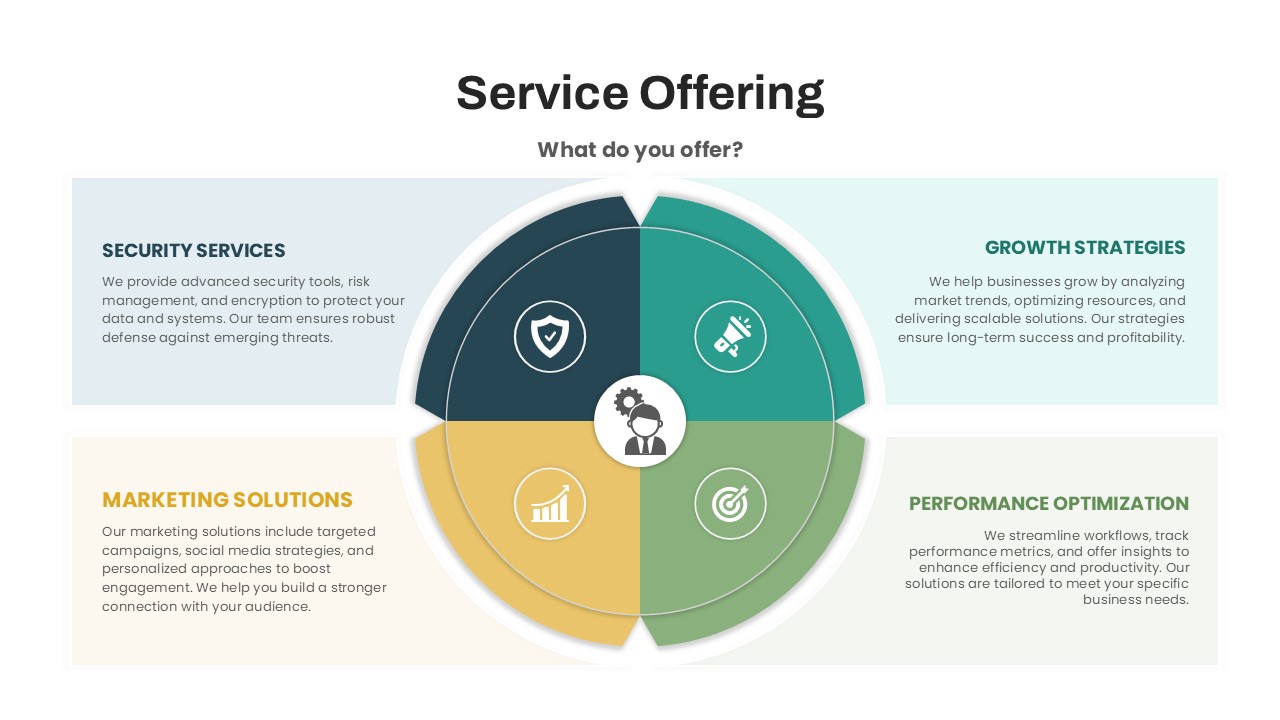
Circular Service Offering Diagram Template for PowerPoint & Google Slides
Circular
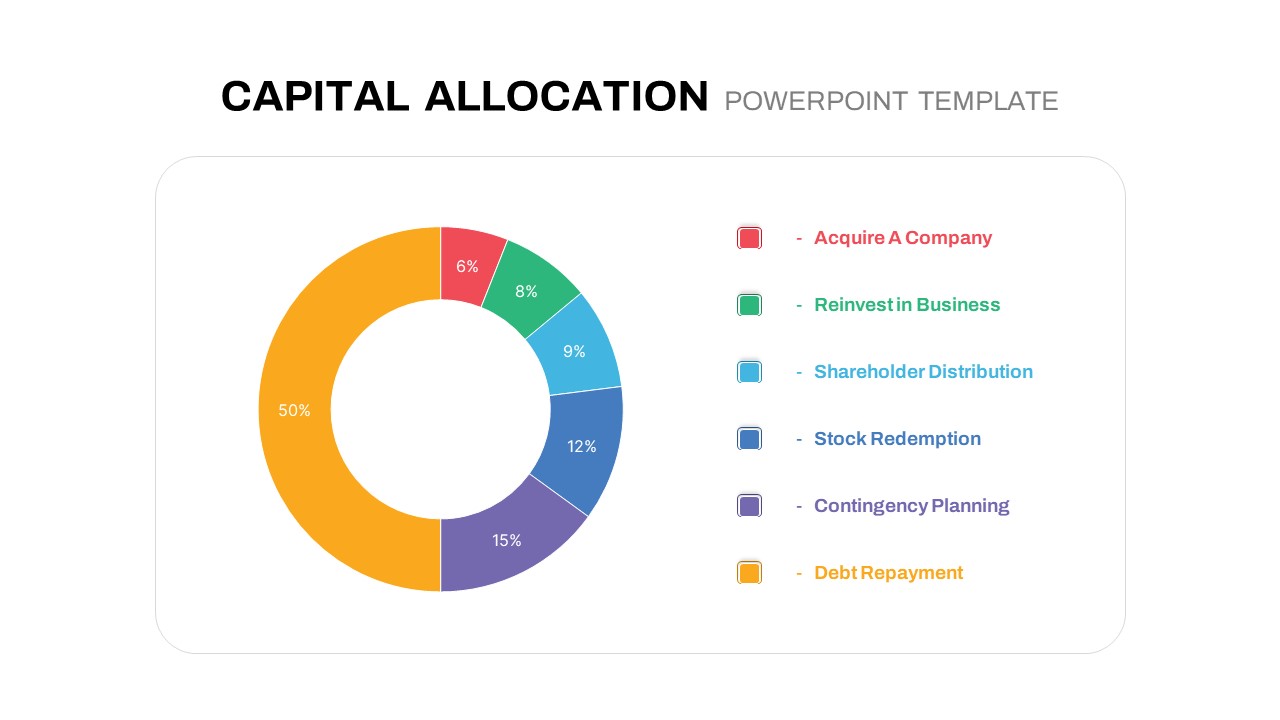
Circular Capital Allocation Diagram Template for PowerPoint & Google Slides
Business Models
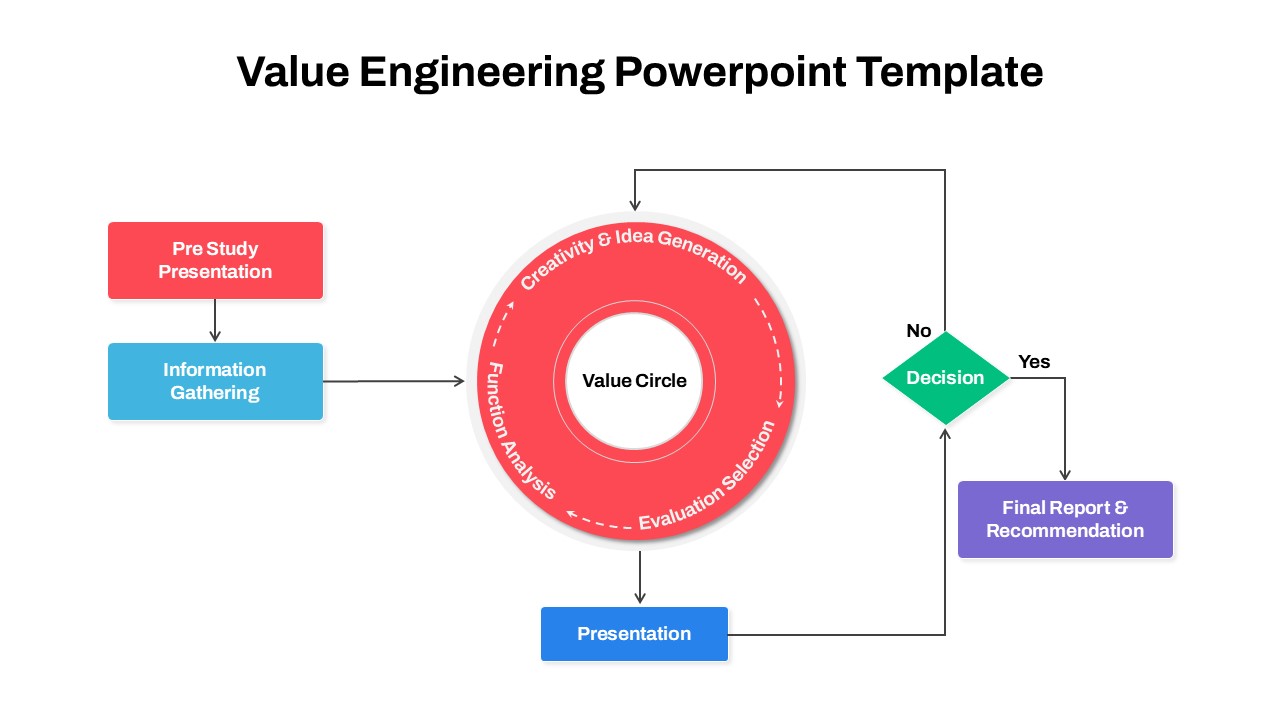
Circular Value Engineering Diagram Template for PowerPoint & Google Slides
Process
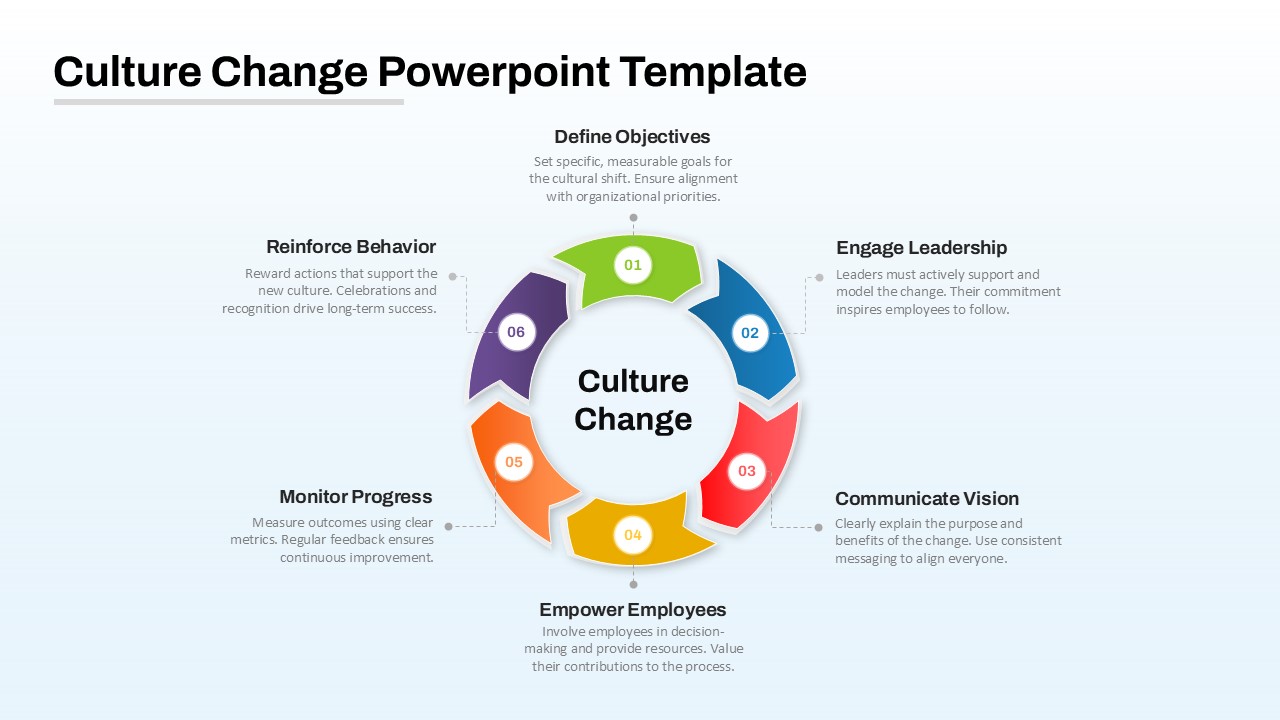
Culture Change Circular Process Diagram Template for PowerPoint & Google Slides
Process
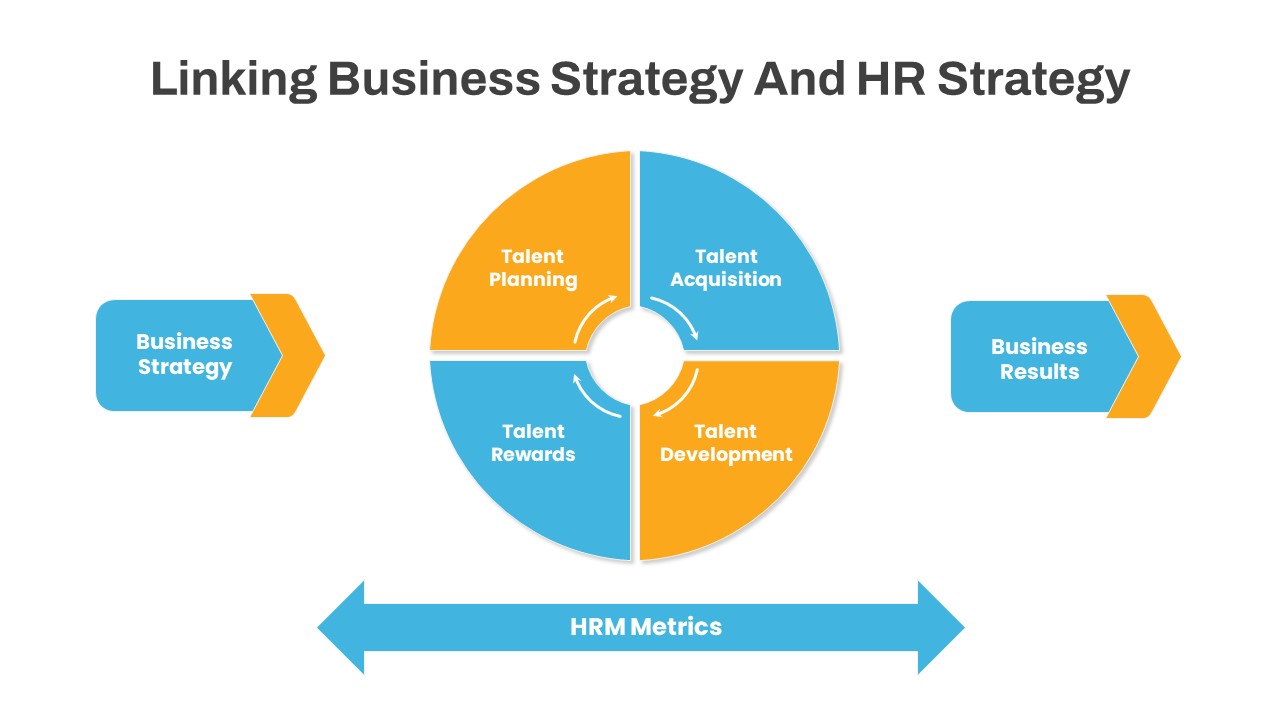
Linking Business HR Strategy Circular Diagram Template for PowerPoint & Google Slides
Business Strategy
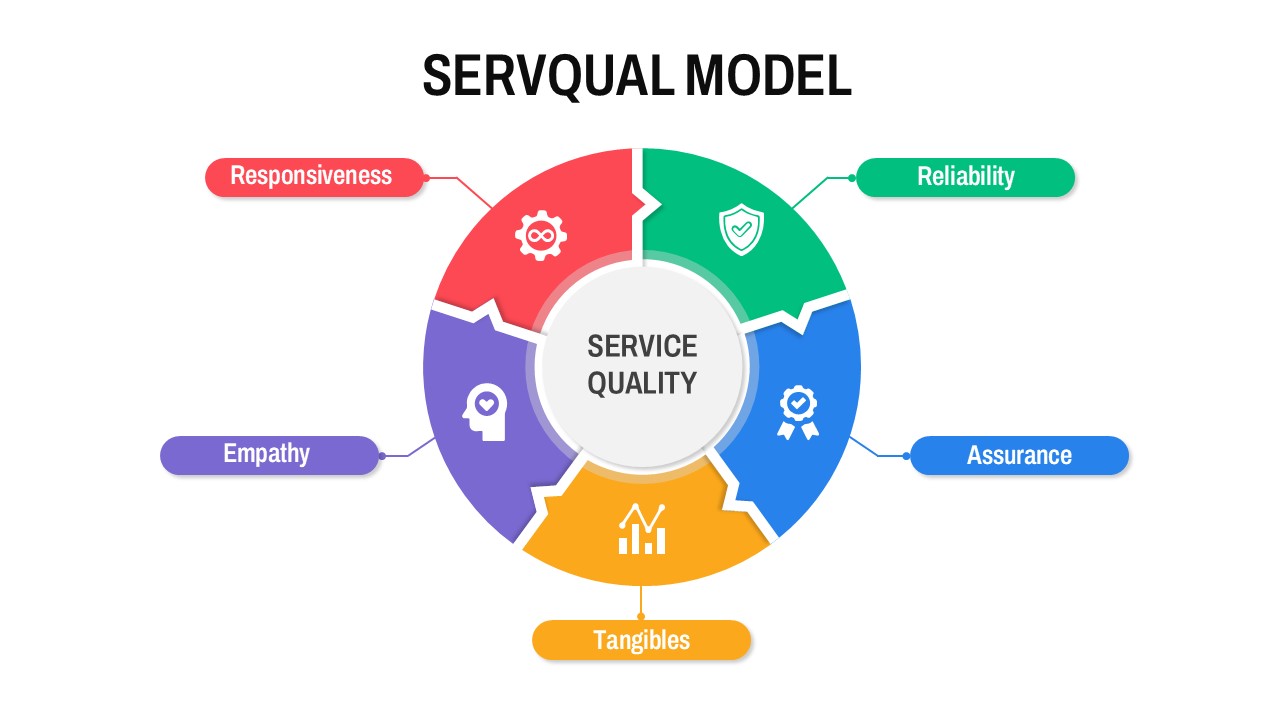
Circular SERVQUAL Model Diagram Template for PowerPoint & Google Slides
Business Strategy
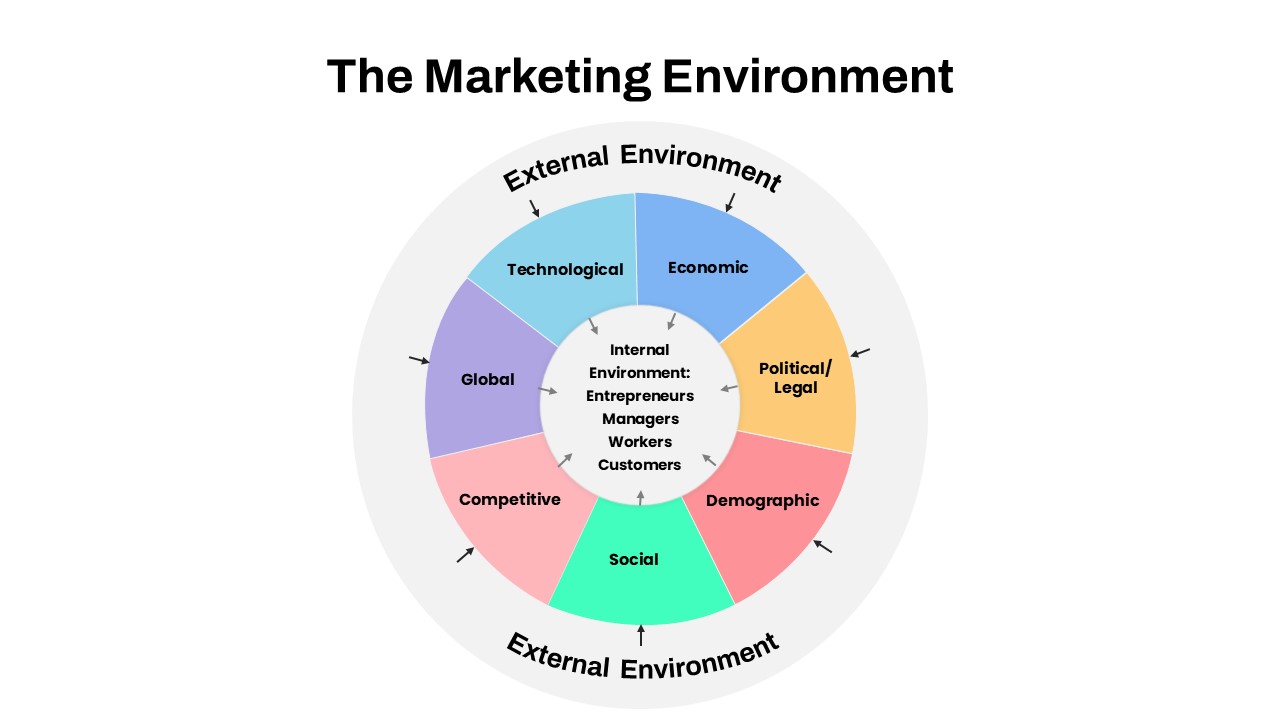
Marketing Environment Circular Diagram template for PowerPoint & Google Slides
Marketing
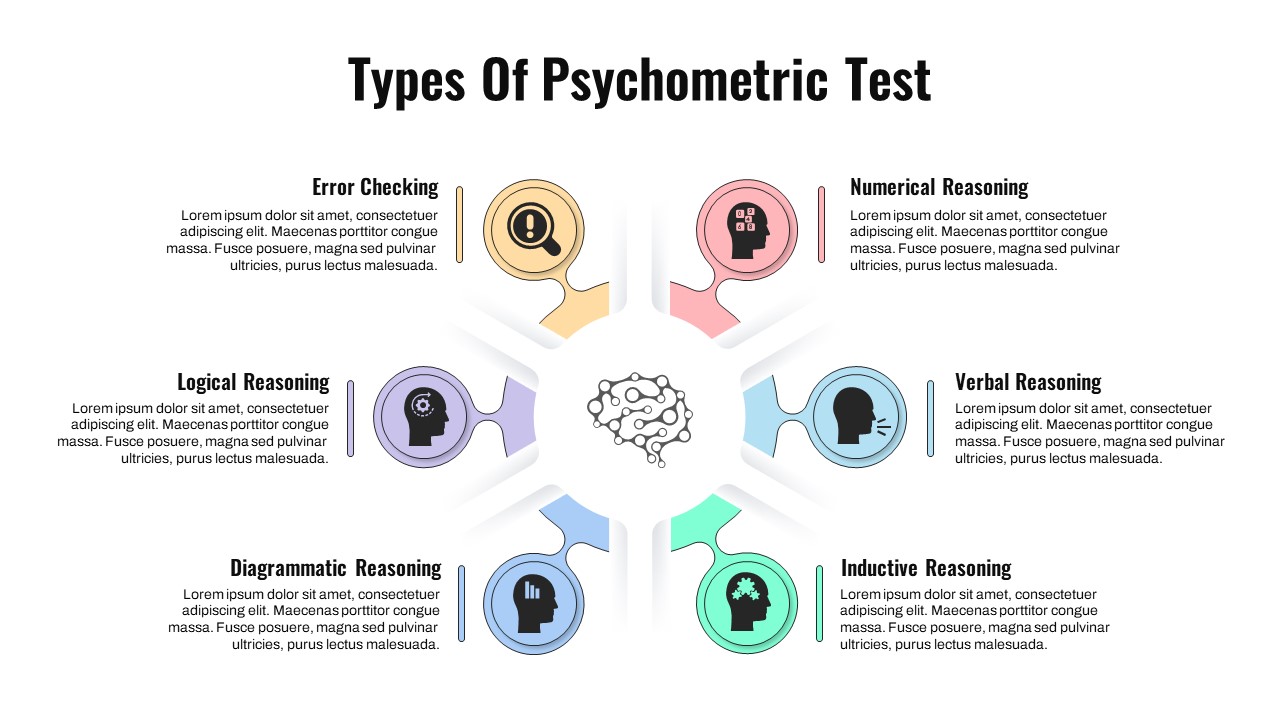
Psychometric Test Types Circular Diagram Template for PowerPoint & Google Slides
Circular
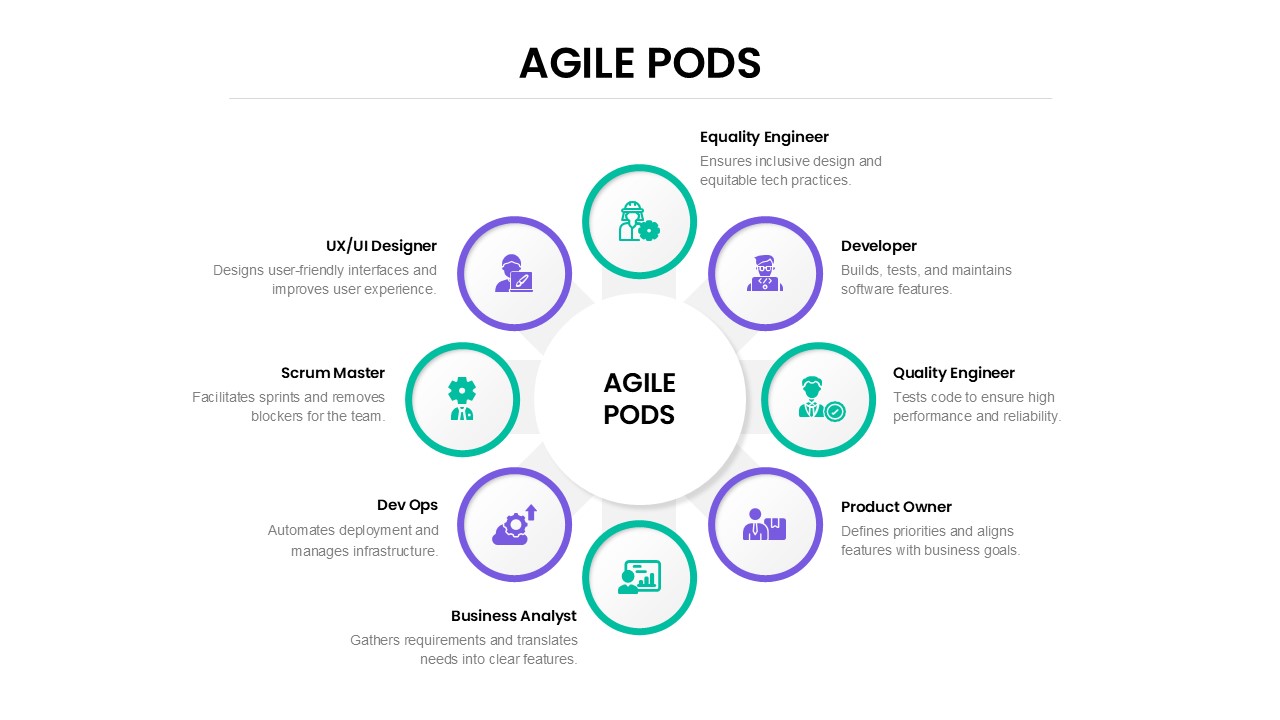
Agile Pods Team Roles Circular Diagram Template for PowerPoint & Google Slides
Circular
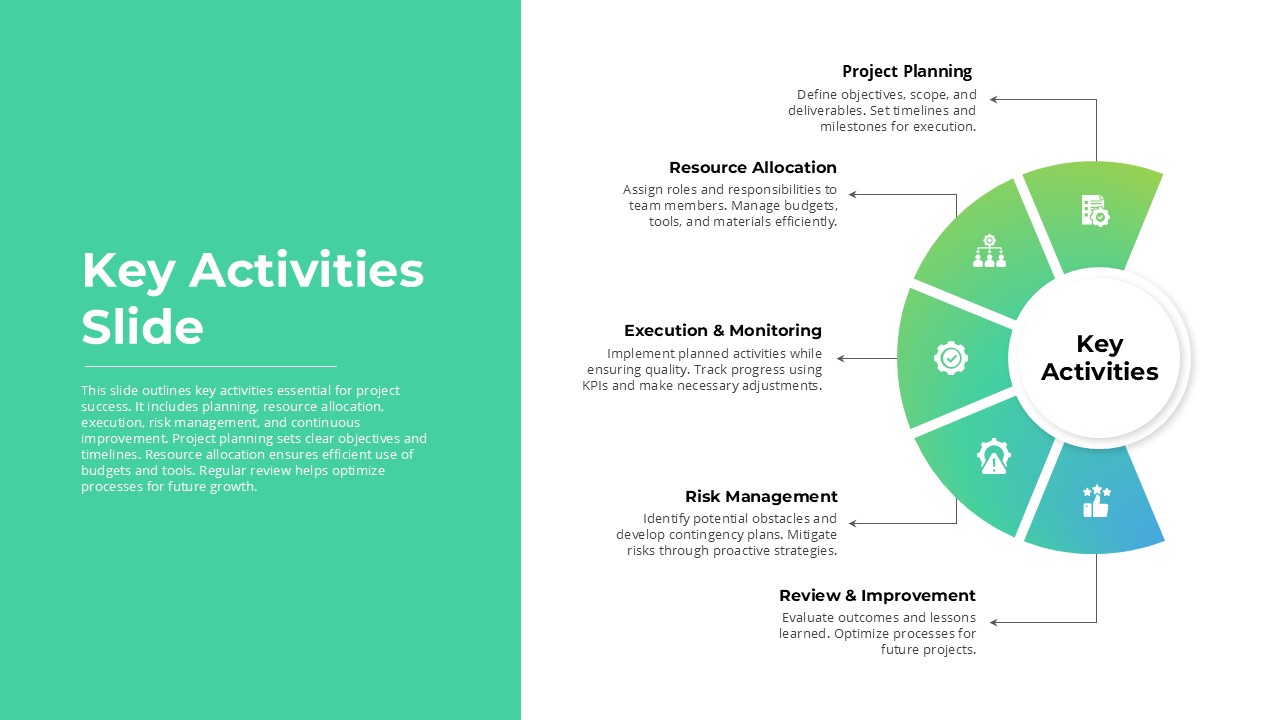
Project Key Activities Circular Diagram Template for PowerPoint & Google Slides
Process
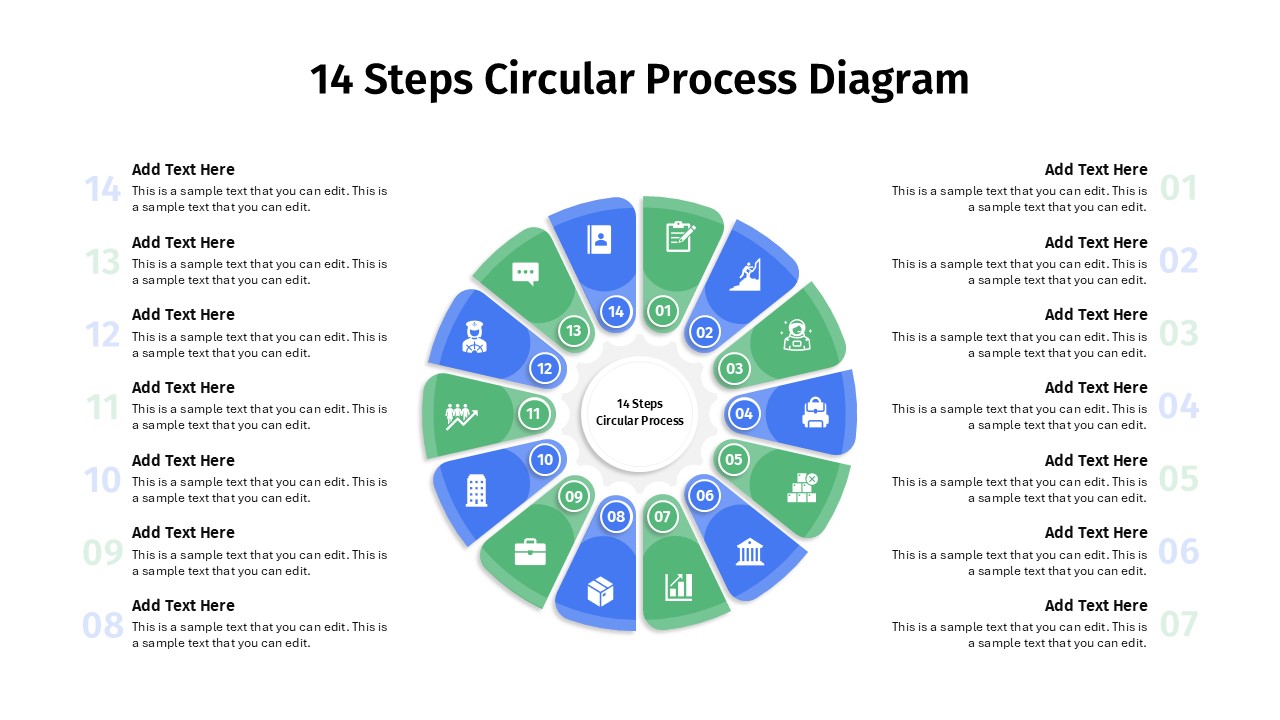
14 Steps Circular Process Diagram Template for PowerPoint & Google Slides
Circular
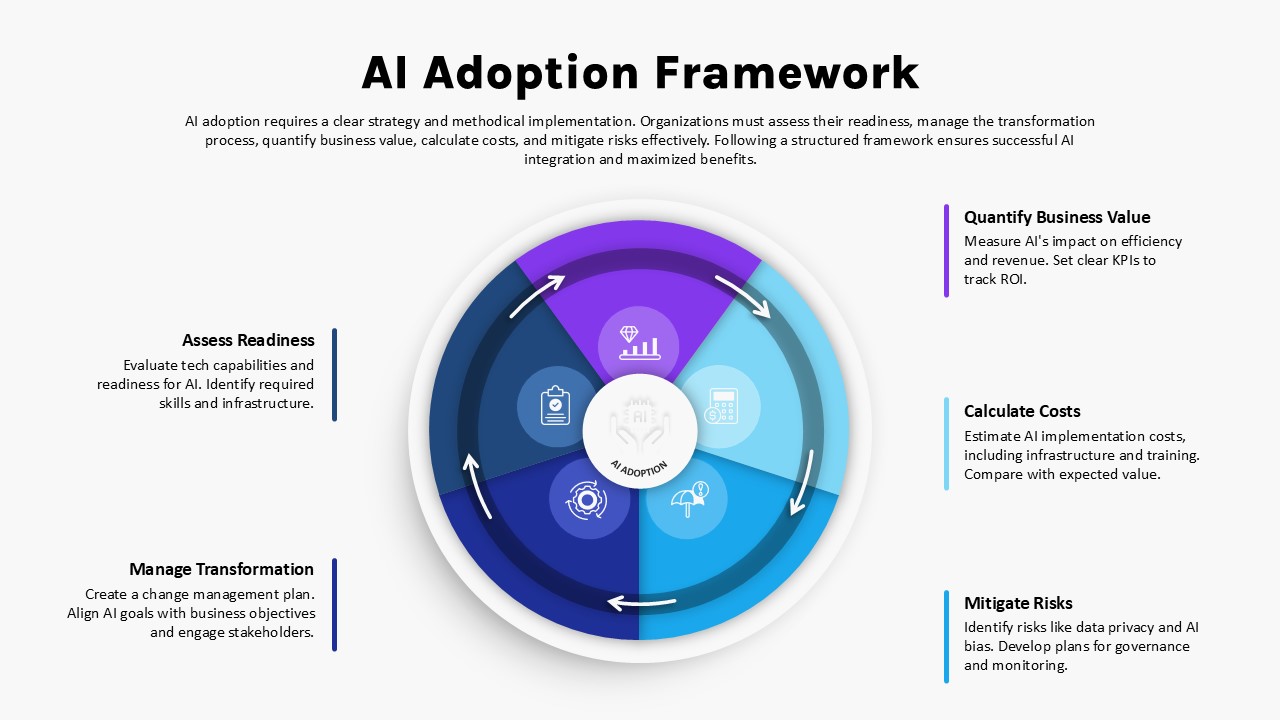
AI Adoption Framework Circular Diagram Template for PowerPoint & Google Slides
AI
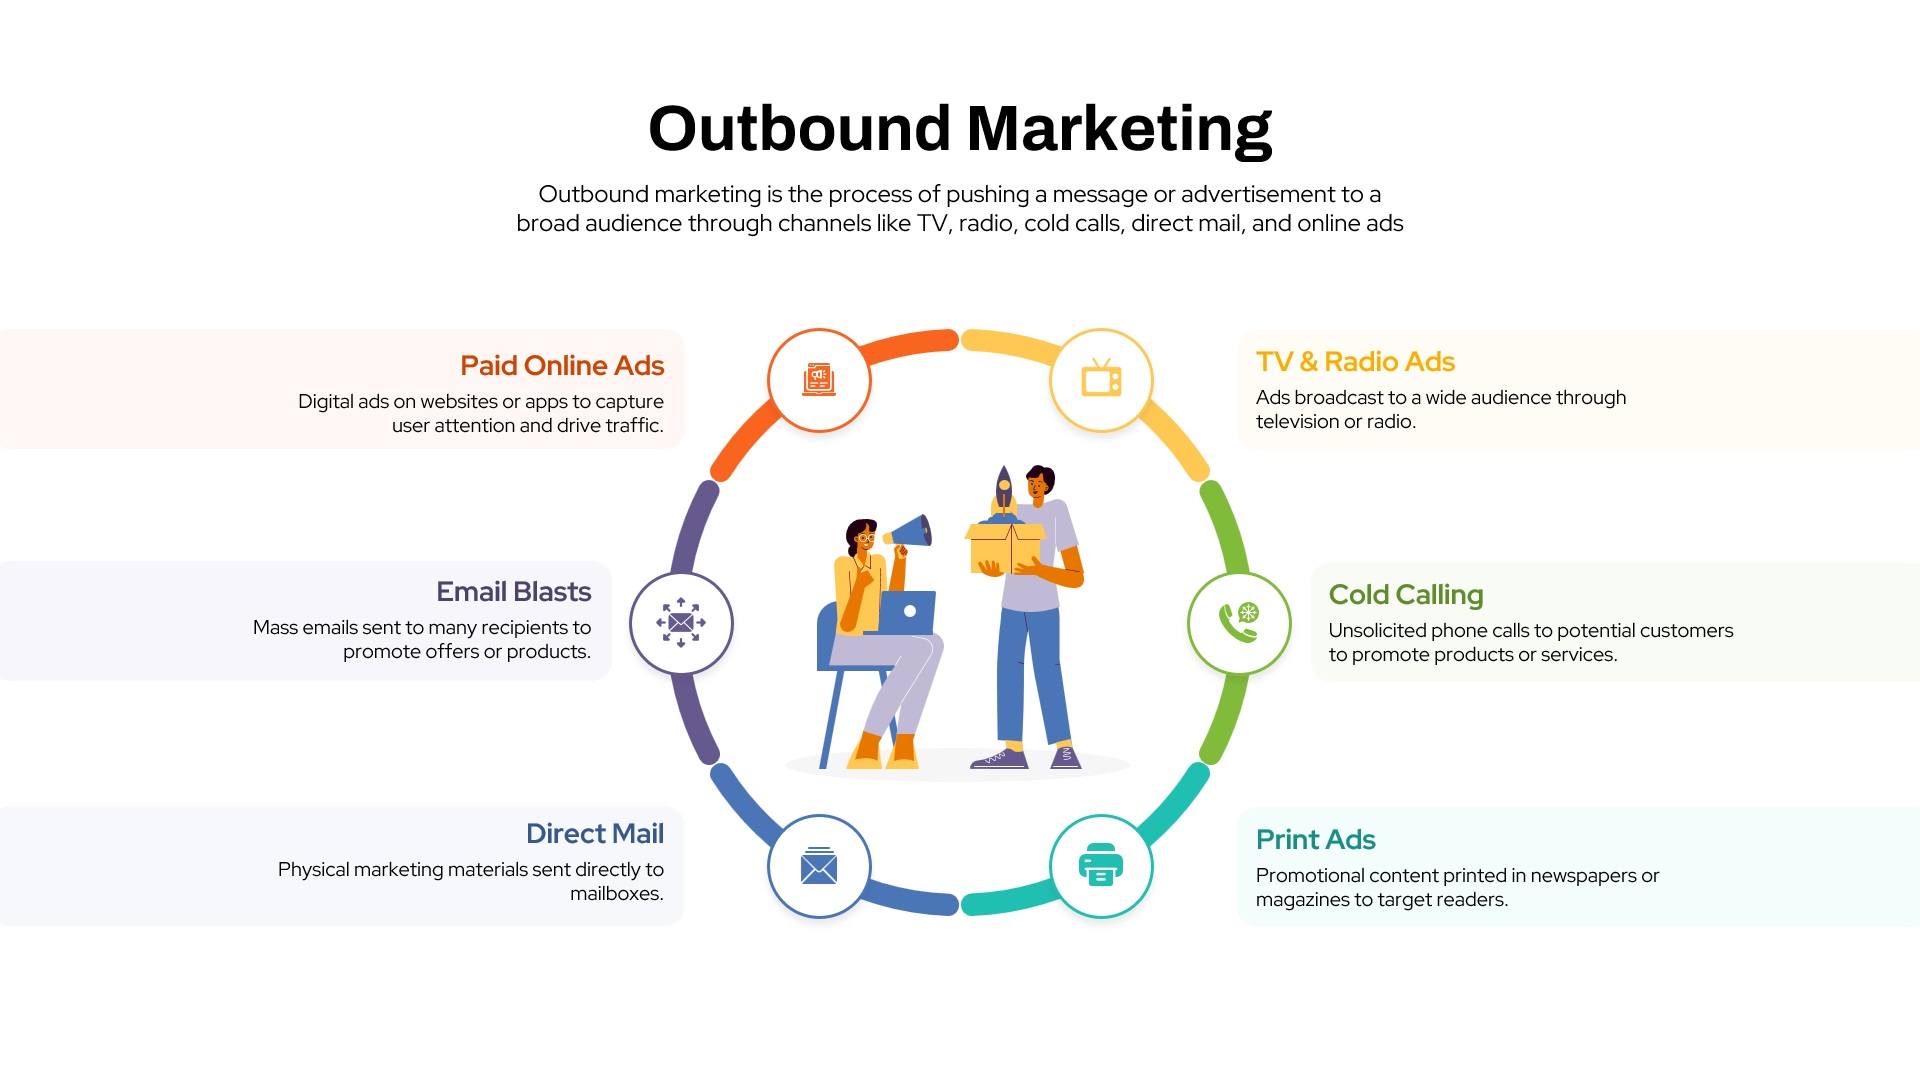
Outbound Marketing Circular Diagram Template for PowerPoint & Google Slides
Advertising
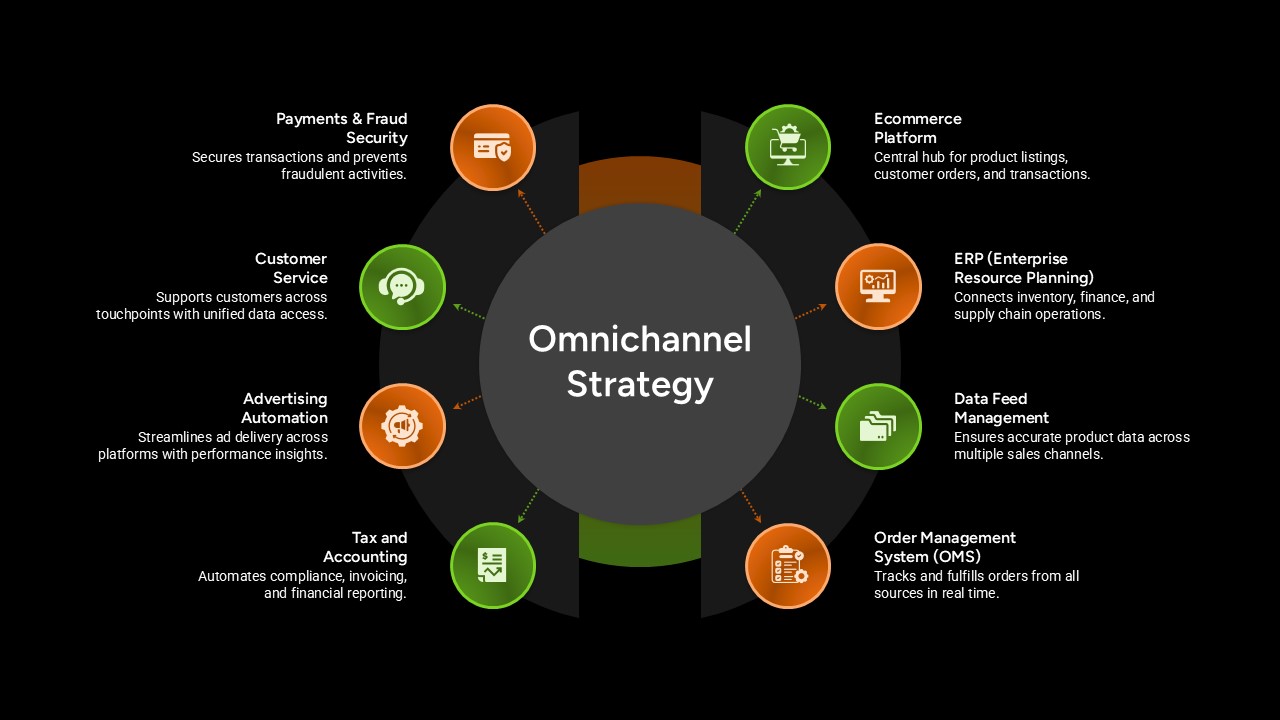
Omnichannel Strategy Circular Diagram Template for PowerPoint & Google Slides
Digital Marketing
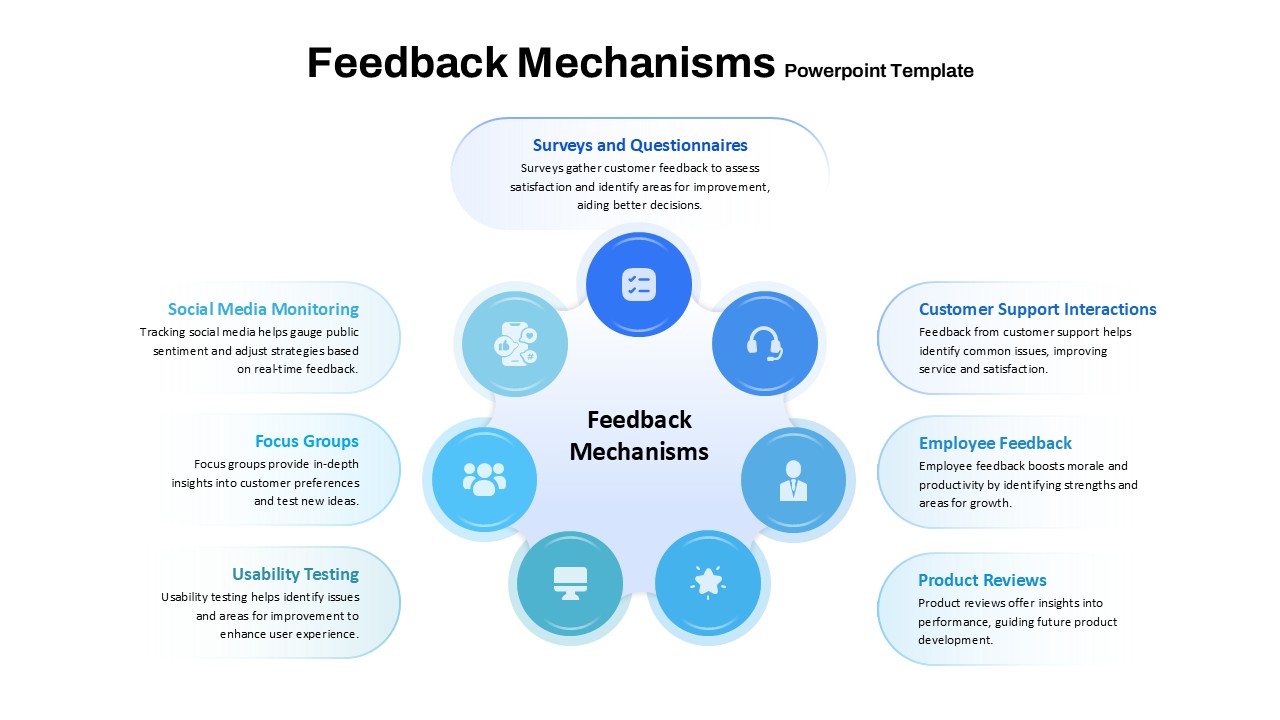
Feedback Mechanisms Circular Diagram Template for PowerPoint & Google Slides
Circular
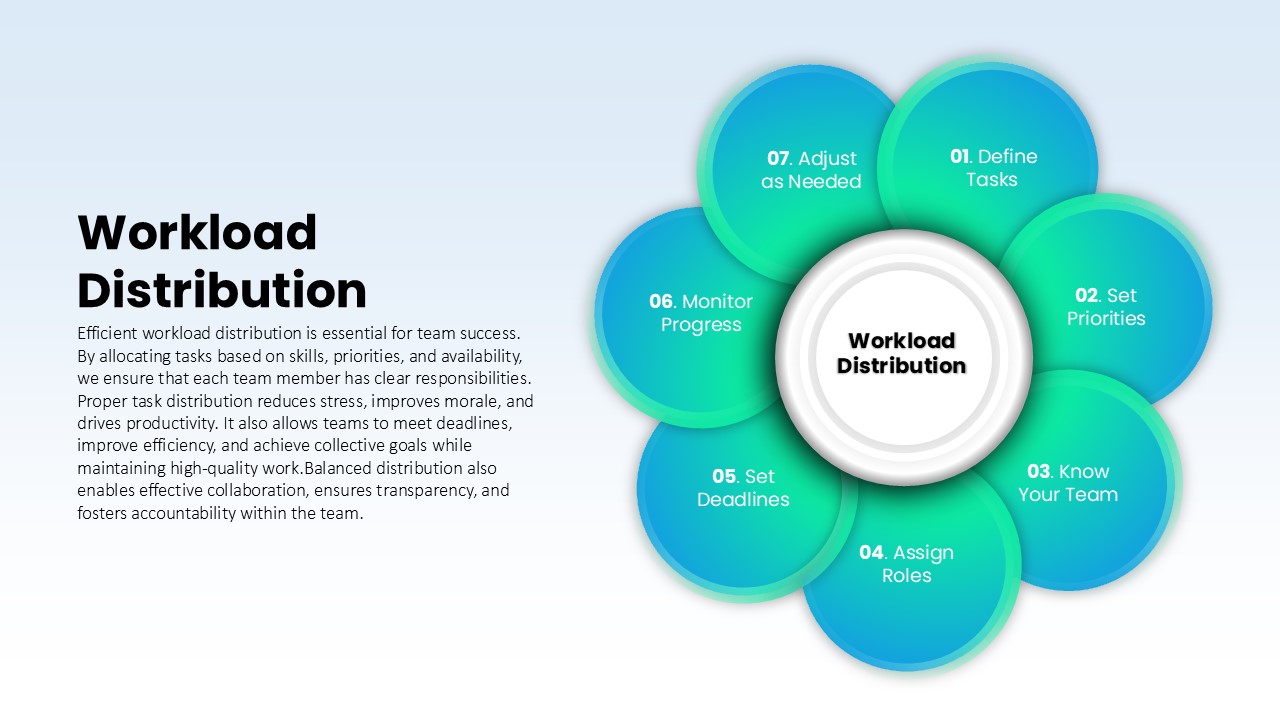
Workload Distribution Circular Diagram Template for PowerPoint & Google Slides
Circular
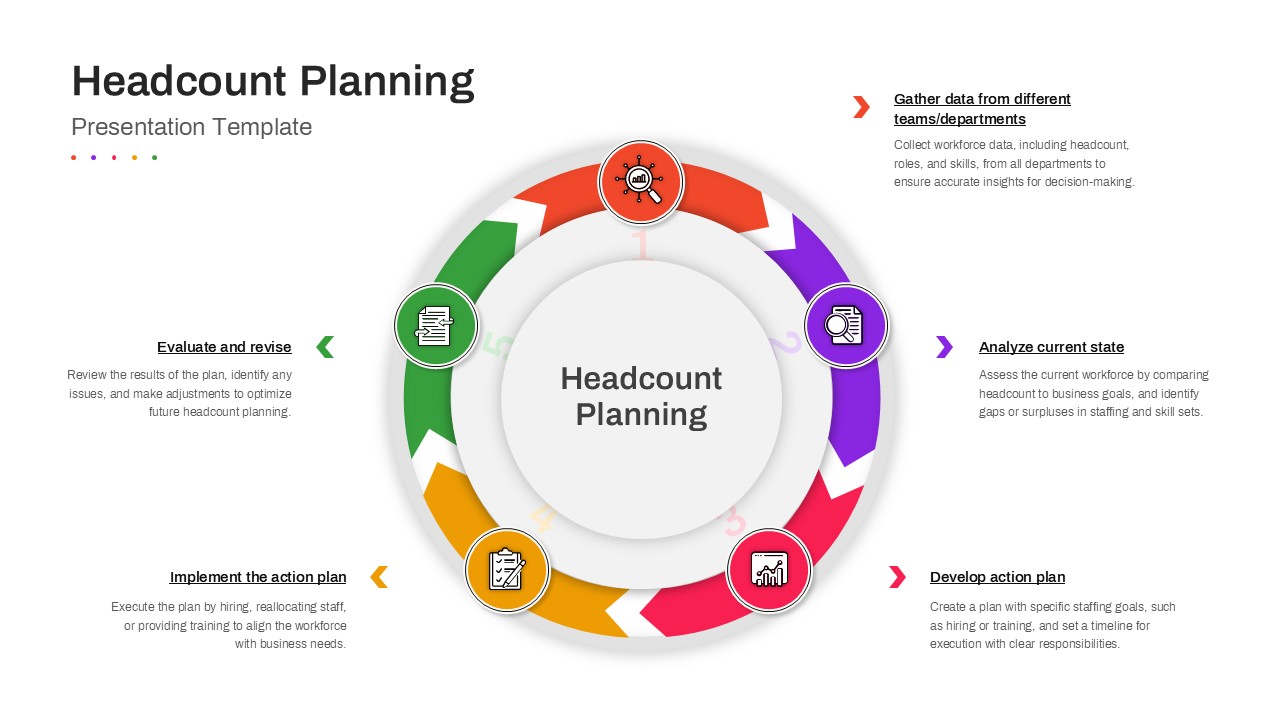
Headcount Planning Circular Process Diagram Template for PowerPoint & Google Slides
HR