Demand Generation Funnel Process Diagram Template for PowerPoint & Google Slides

Description
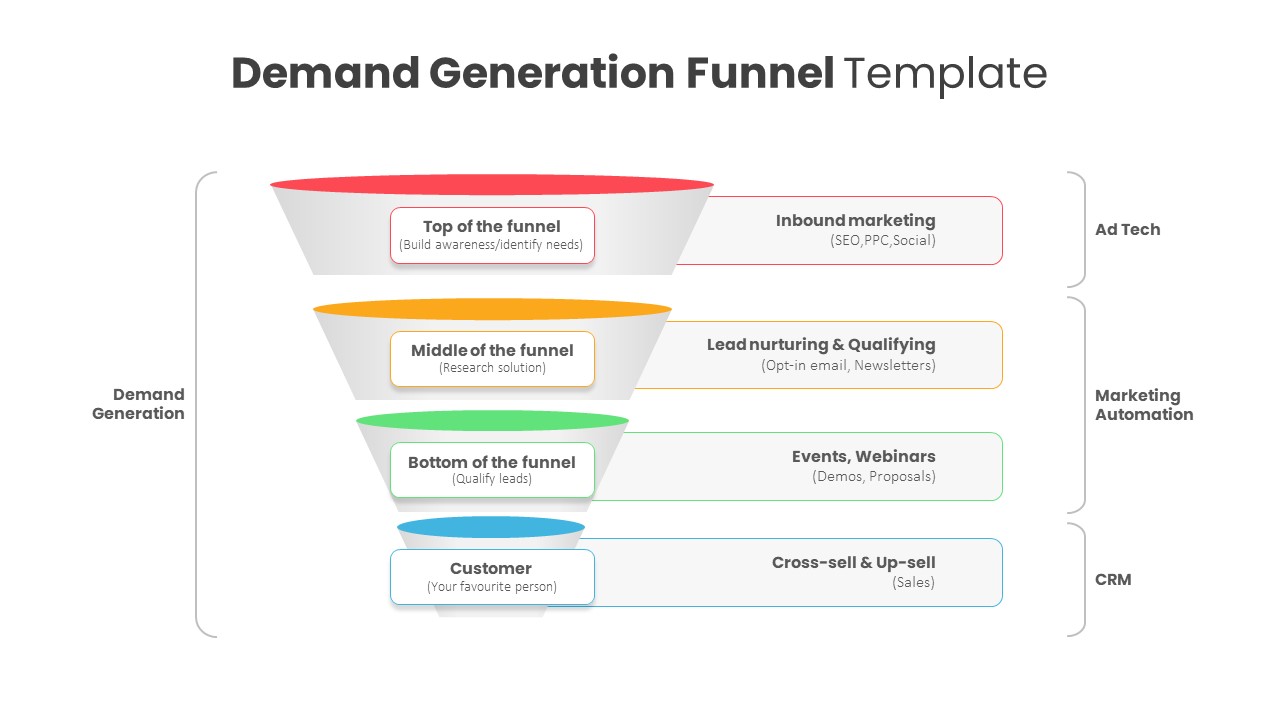
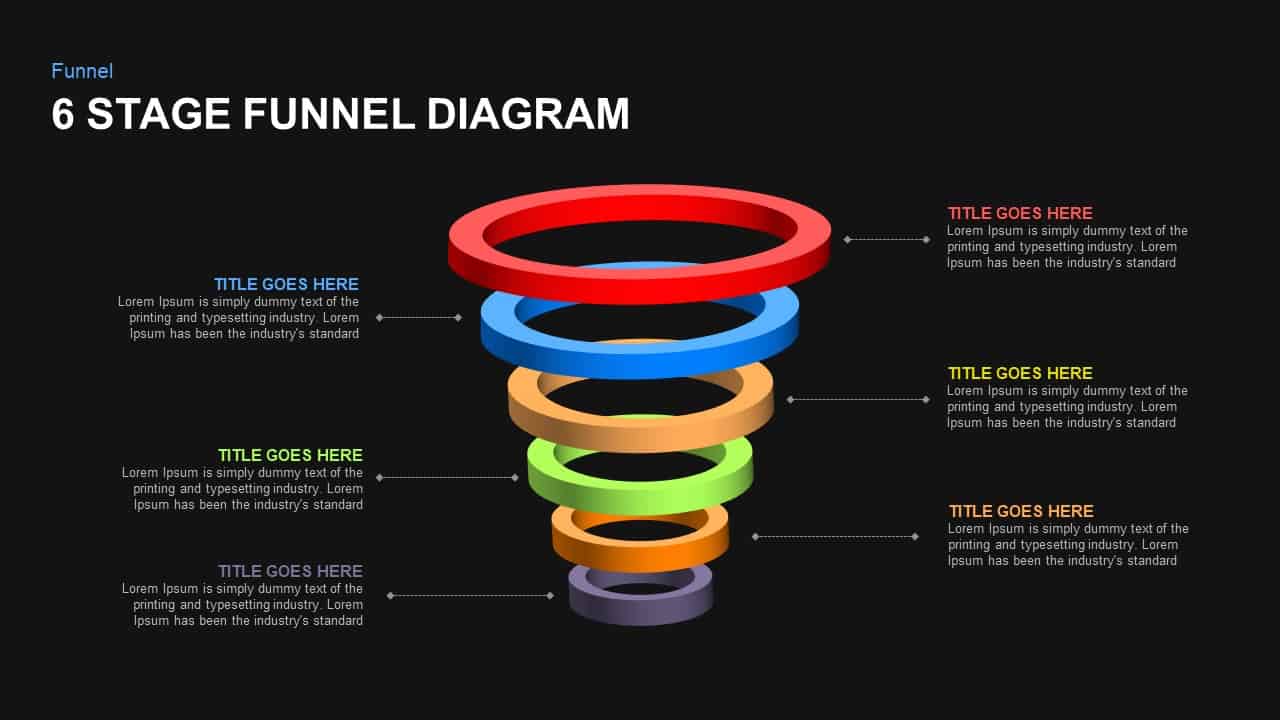
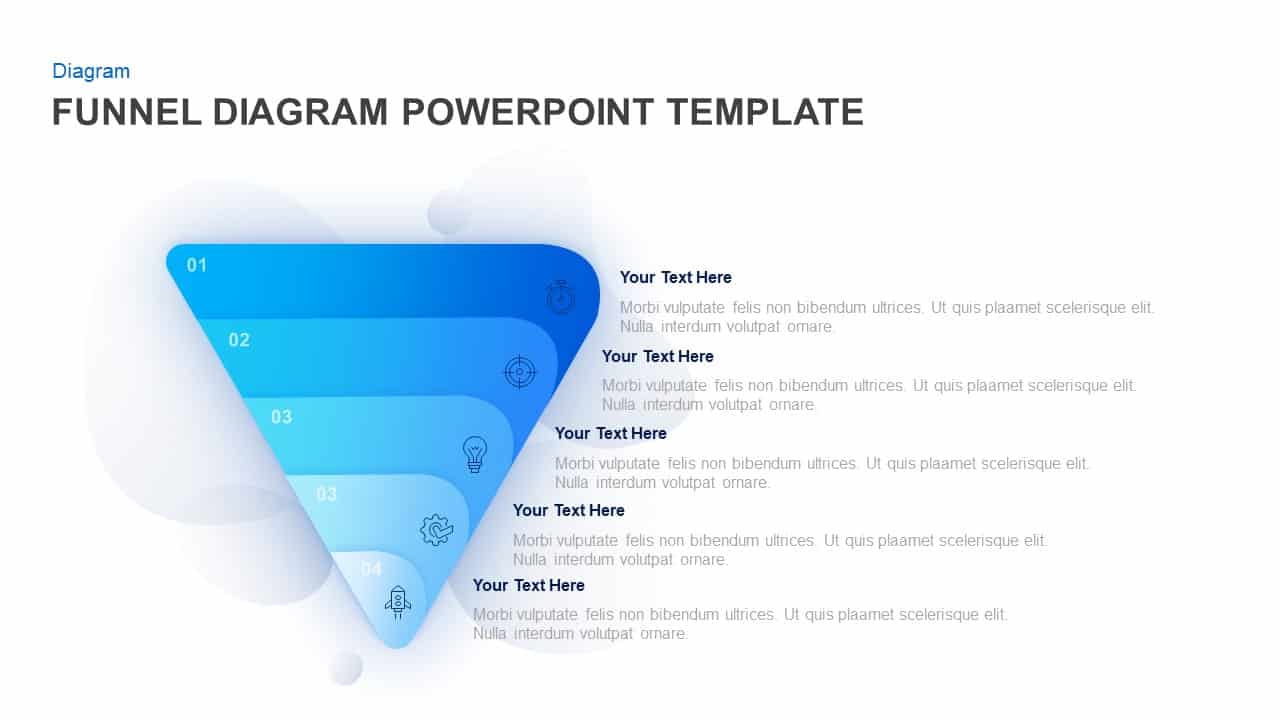
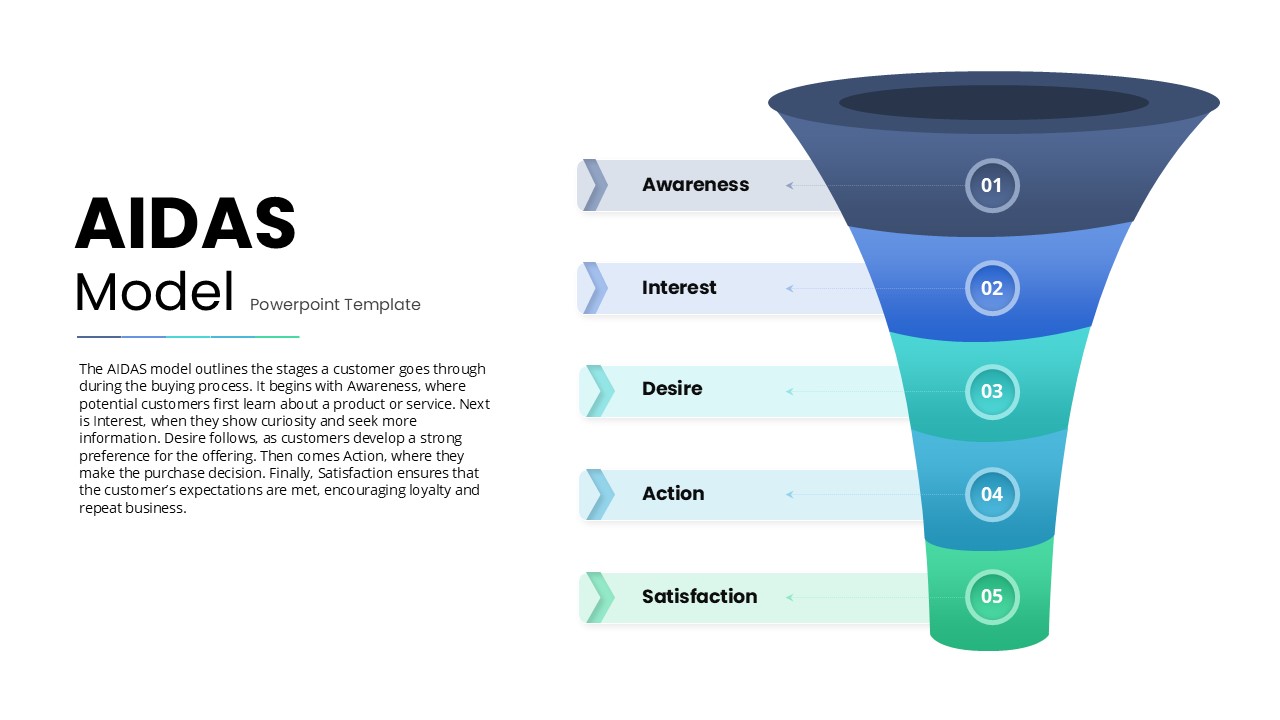
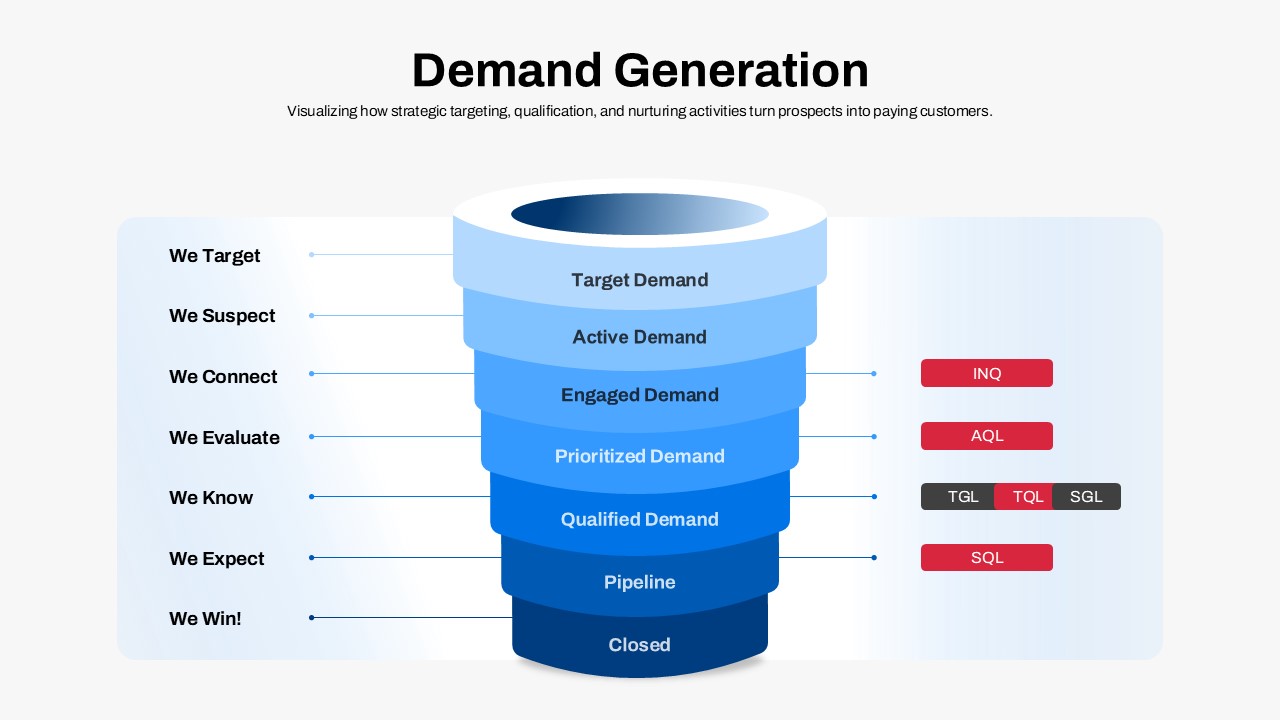
Elevate your demand generation presentations with this dynamic funnel process infographic template. It segments prospects into Target Demand, Active Demand, Engaged Demand, Prioritized Demand, Qualified Demand, Pipeline, and Closed stages using seven gradient-shaded layers. Each section displays a numbered ring, minimalist icon, and clear label, guiding viewers through strategic targeting, qualification, and nurturing activities. A subtle horizontal arrow reinforces the downward flow from initial outreach to deal closure, while the modern flat design with rounded edges, layered shadows, and legible typography ensures visual appeal and clarity on any screen.
Built on editable master slides, this template uses scalable vector shapes and intuitive placeholders for swift customization. Change gradient hues to align with your brand, swap icons to reflect unique touchpoints, or adjust stage titles to fit your sales cycle. Linked data placeholders enable real-time integration with Excel or Google Sheets, so you can display live metrics such as inquiry rates, acceptance quotas, and sales pipeline values. Smart guides and snap-to-grid layouts maintain alignment while speeding up deck creation and minimizing formatting errors.
By leveraging editable text boxes and color-coded segments, presenters can emphasize specific stages such as inquiry qualification, acceptance quotas, and SQL conversion rates. The slide’s modular design supports addition or removal of layers, enabling you to adapt the funnel to shorter or extended buyer journeys. Whether illustrating marketing automation workflows, lead nurturing sequences, or sales enablement strategies, this versatile asset accelerates audience understanding and fosters data-driven decision-making.
Optimized for both PowerPoint and Google Slides, the slide maintains full-resolution clarity on desktops, projectors, and mobile devices. Collaboration features like shared masters and version histories facilitate seamless team editing. Use this visual asset in demand generation briefings, marketing strategy sessions, pipeline reviews, or executive updates to simplify complex funnel analytics and drive strategic discussions.
Who is it for
Marketing leaders, demand generation specialists, sales operations managers, and revenue teams will find this slide invaluable for mapping prospect journeys, tracking funnel metrics, and presenting pipeline health.
Other Uses
Repurpose this seven-step funnel design for lead scoring models, customer journey mapping, campaign performance reviews, conversion rate analysis, or executive KPI dashboards.
Login to download this file

Item ID
SB04915
Related Templates

Demand Generation Funnel Diagram Template for PowerPoint & Google Slides
Funnel

Demand Generation and Lead Nurturing Process Template for PowerPoint & Google Slides
Process
Demand Generation Process Template for PowerPoint & Google Slides
Customer Journey
Demand Generation Process Overview Template for PowerPoint & Google Slides
Marketing
Marketing Lead Generation Process Funnel PowerPoint Template for PowerPoint & Google Slides
Funnel
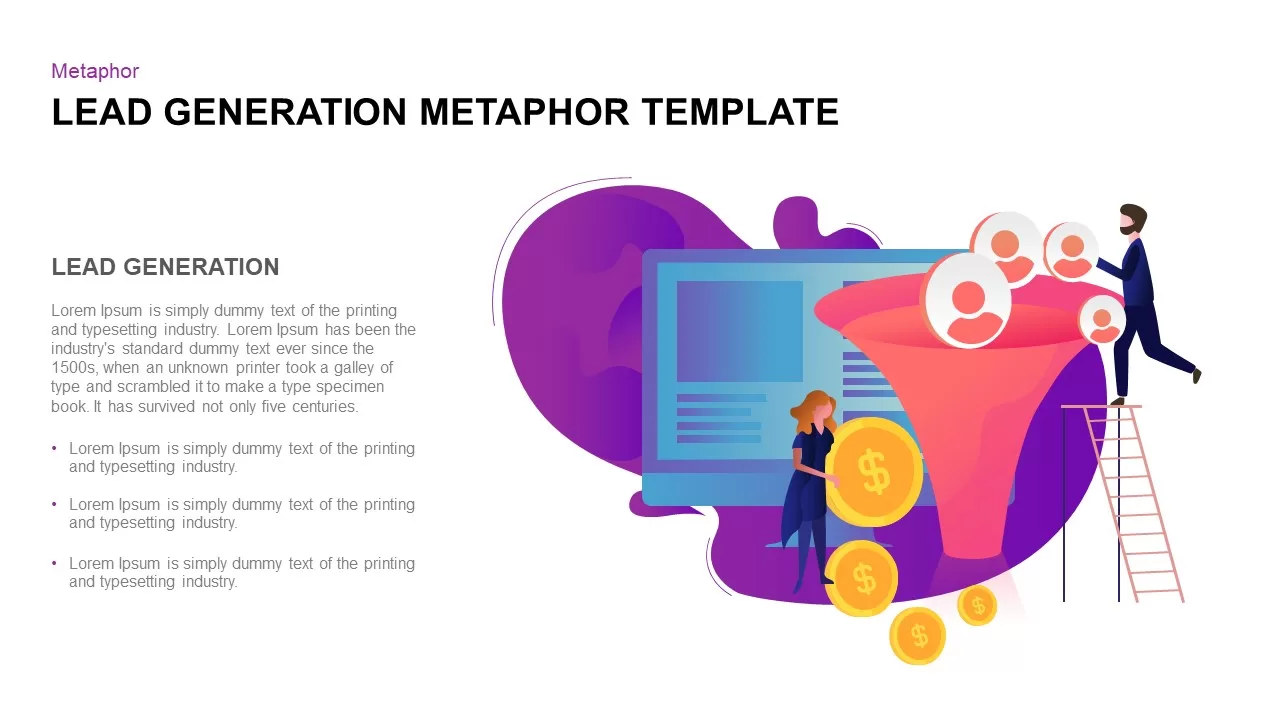
Lead Generation Funnel Metaphor Template for PowerPoint & Google Slides
Marketing Funnel
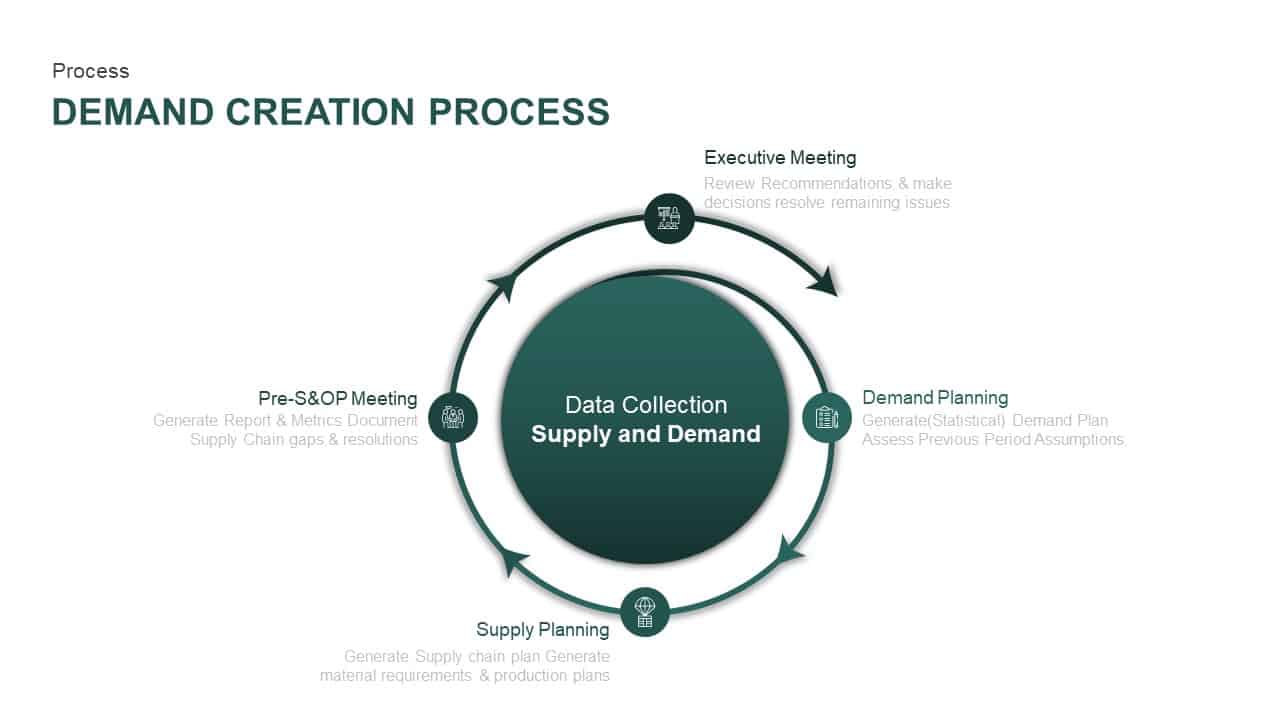
Supply and Demand Creation Cycle Diagram Template for PowerPoint & Google Slides
Process

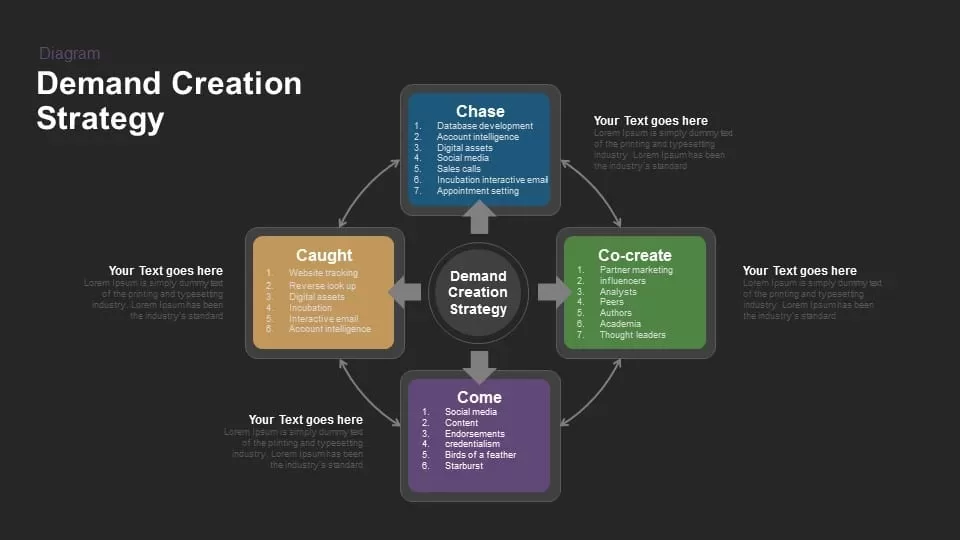
Demand Creation Strategy Diagram for PowerPoint & Google Slides
Business Strategy
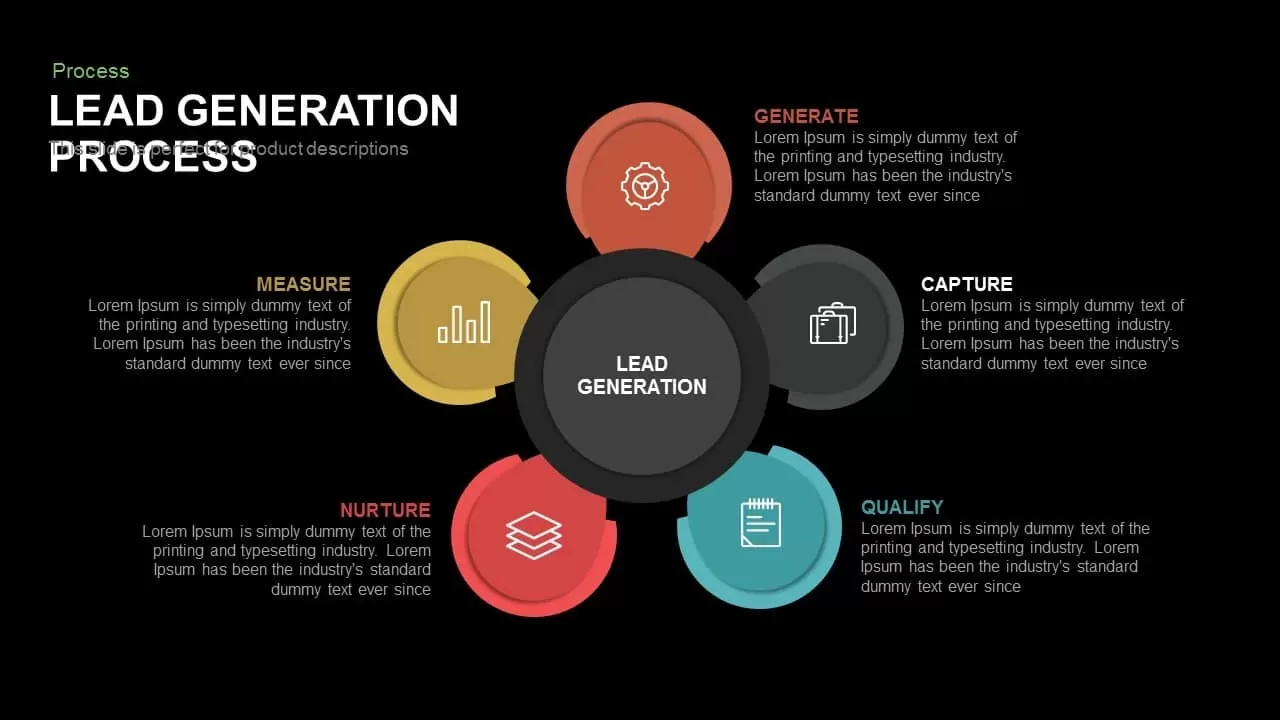
Lead Generation Process for PowerPoint & Google Slides
Business Plan
Circular Revenue Generation Diagram Template for PowerPoint & Google Slides
Revenue
Idea Generation for PowerPoint & Google Slides
Graphics
Sales Process Workflow Funnel Diagram PowerPoint Template for PowerPoint & Google Slides
Funnel
Hourglass Funnel Diagram Process Template for PowerPoint & Google Slides
Funnel
Nine-Stage 3D Funnel Process Diagram Template for PowerPoint & Google Slides
Funnel
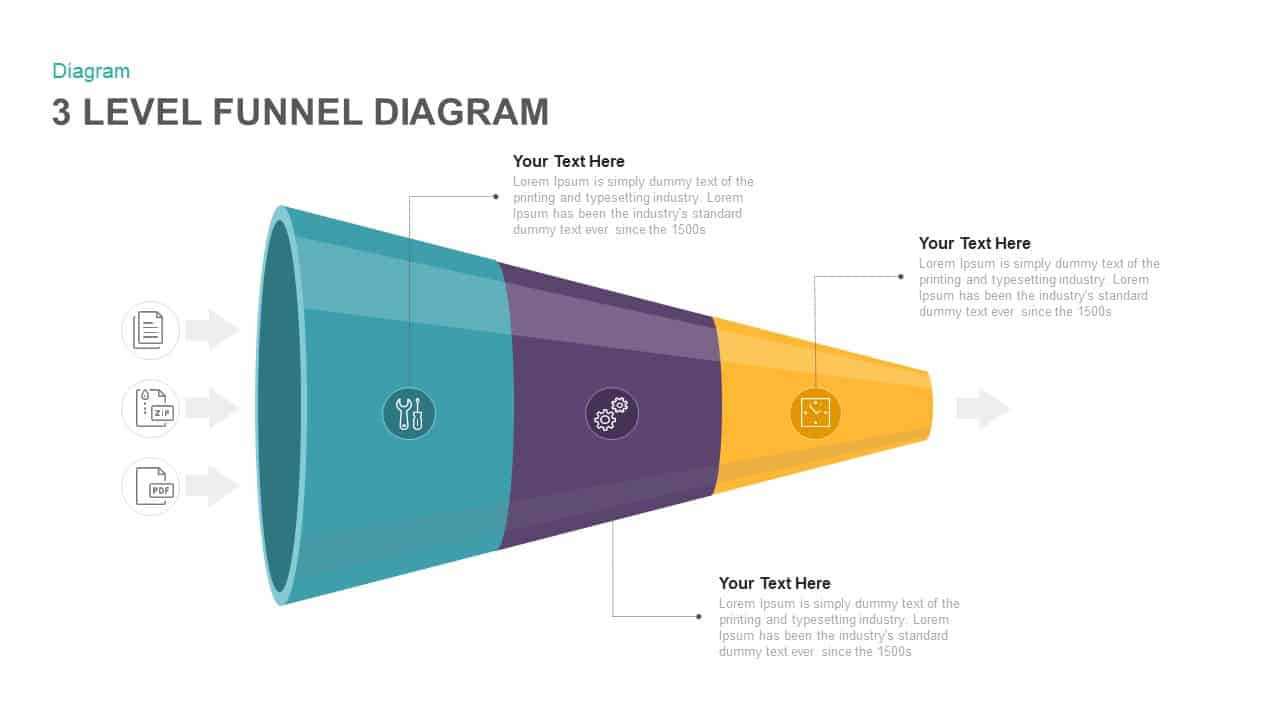
Three Level Funnel Process Diagram Template for PowerPoint & Google Slides
Funnel
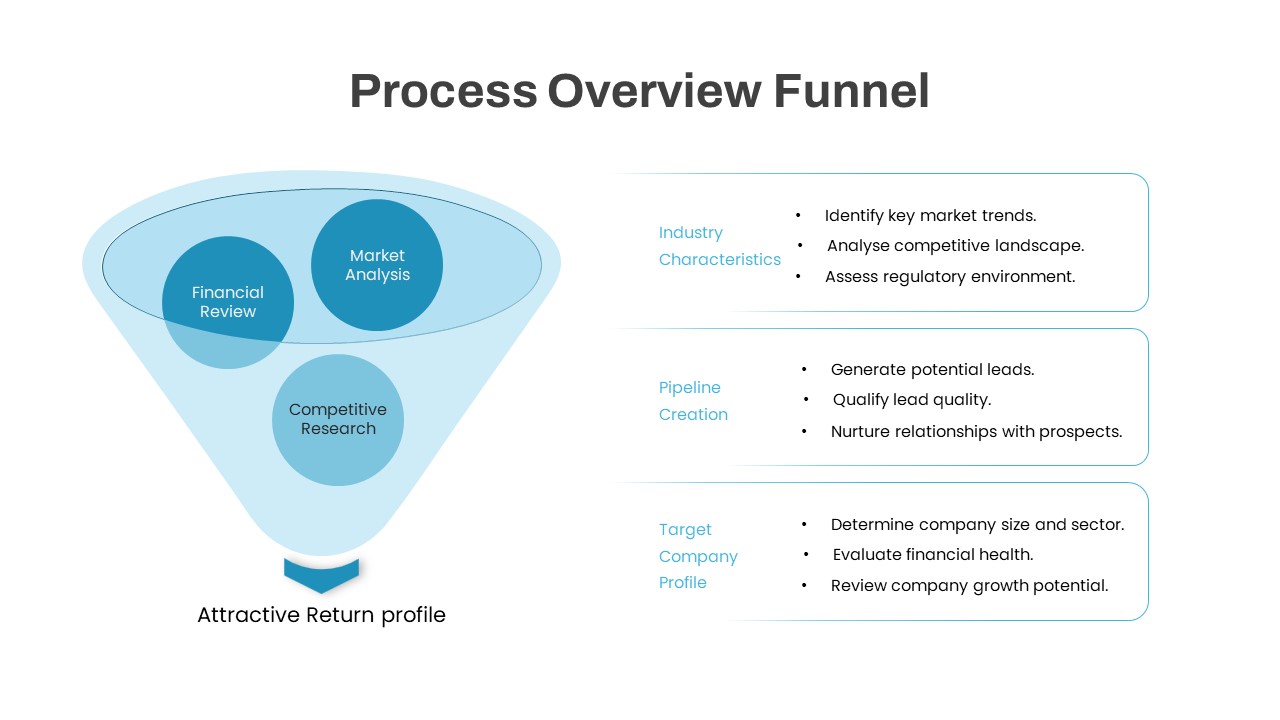
Process Overview Funnel Diagram Template for PowerPoint & Google Slides
Funnel
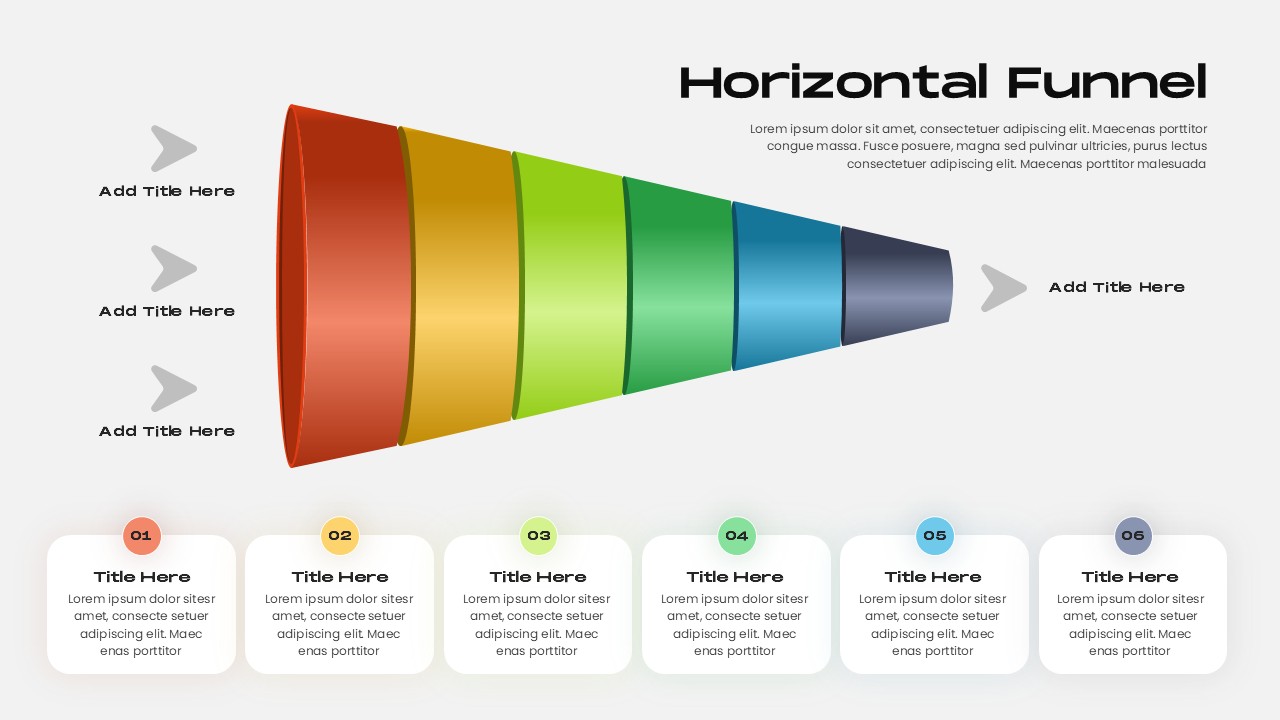
Horizontal Funnel Diagram Process Template for PowerPoint & Google Slides
Funnel
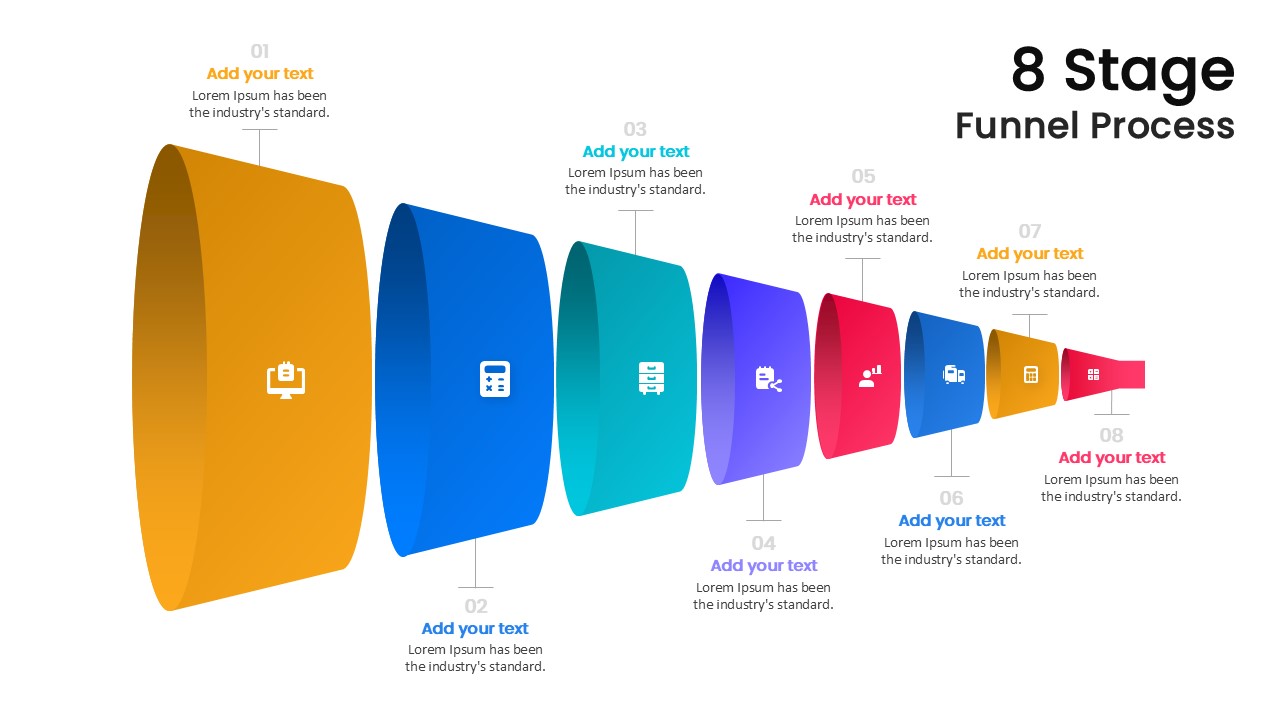
Modern 8-Stage Funnel Process Diagram Template for PowerPoint & Google Slides
Funnel
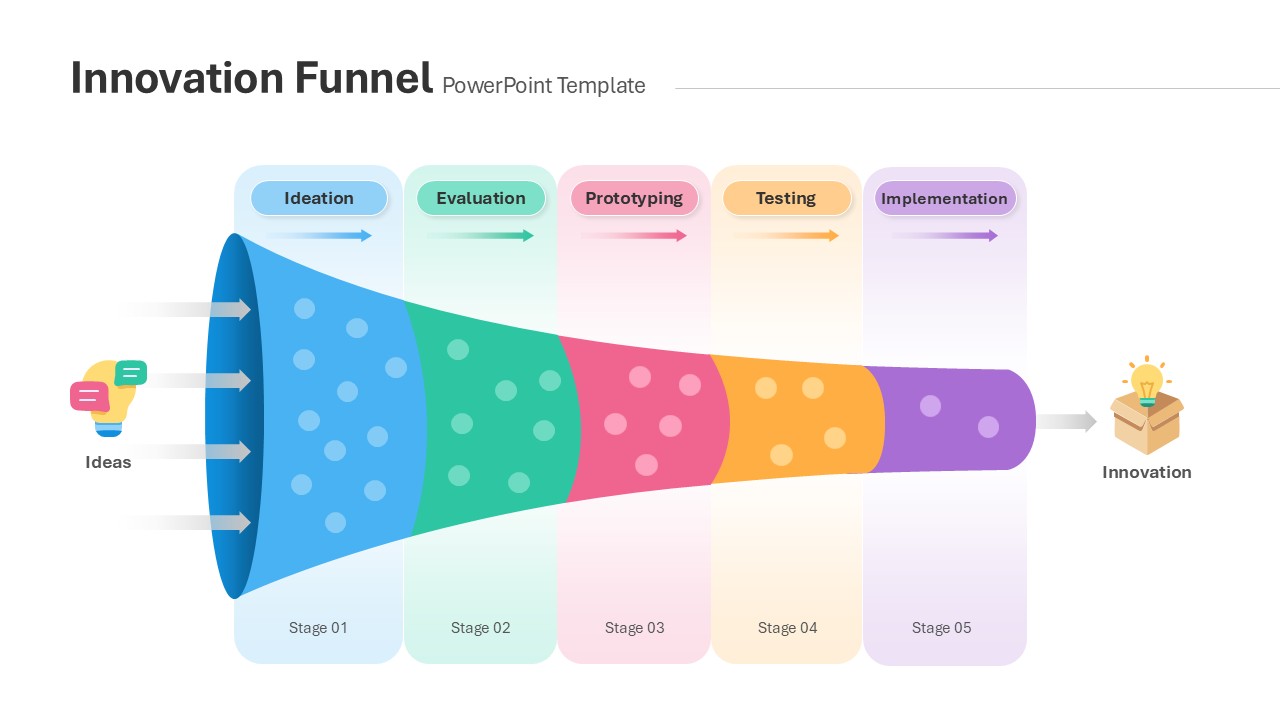
Innovation Funnel Process Diagram Template for PowerPoint & Google Slides
Funnel
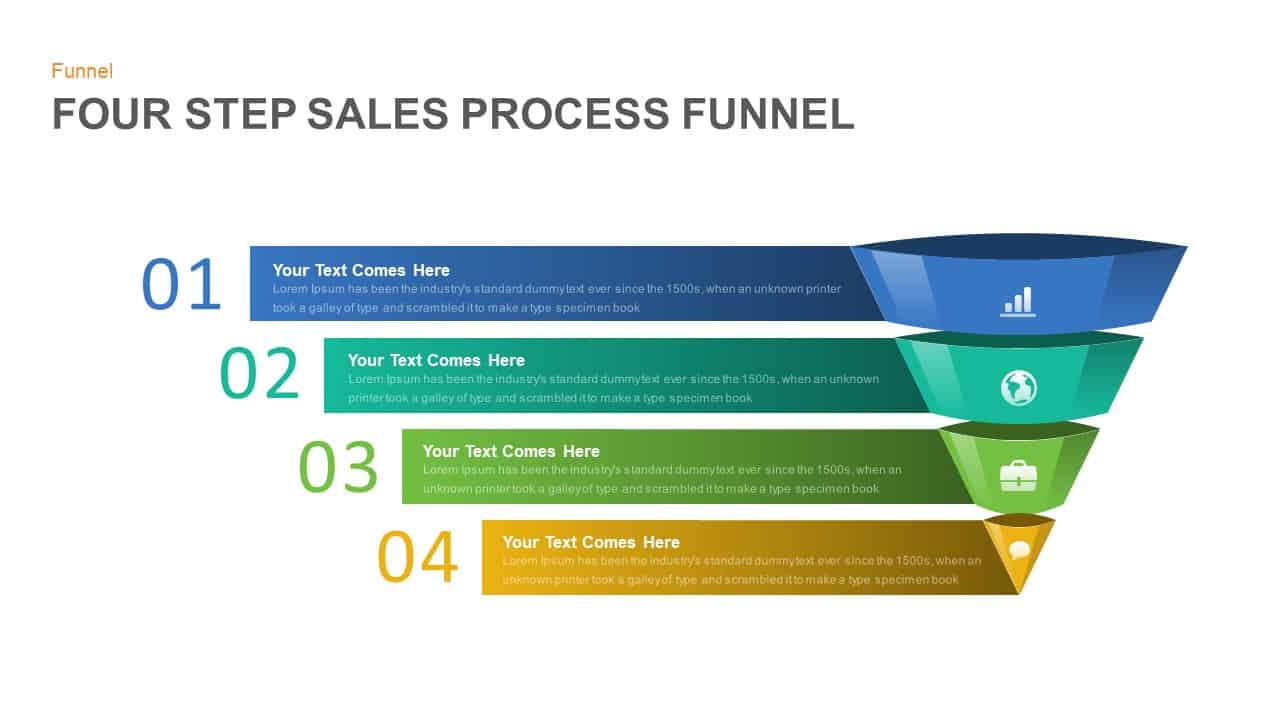
Four Step Sales Process Funnel Template for PowerPoint & Google Slides
Funnel
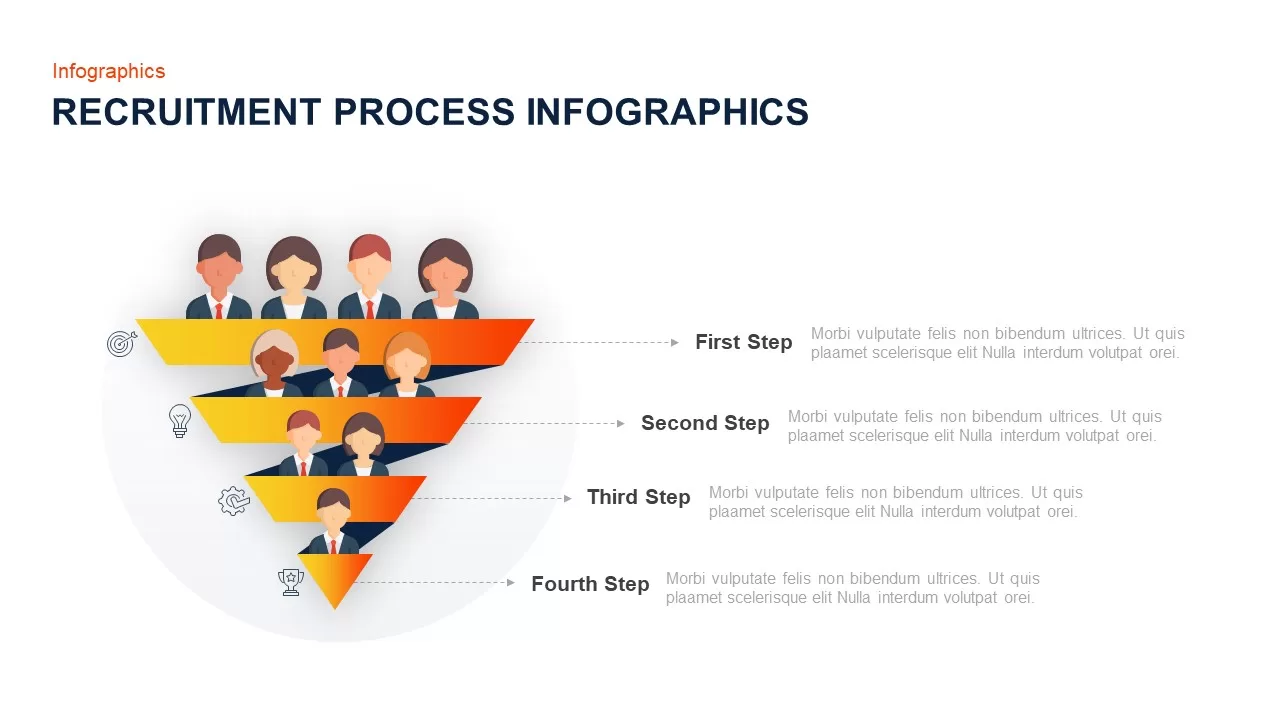
Recruitment Process Funnel Infographics Template for PowerPoint & Google Slides
Recruitment
8 Stage Funnel Process template for PowerPoint & Google Slides
Funnel
Business Funnel Diagram template for PowerPoint & Google Slides
Funnel
AARRR Funnel Diagram template for PowerPoint & Google Slides
Funnel
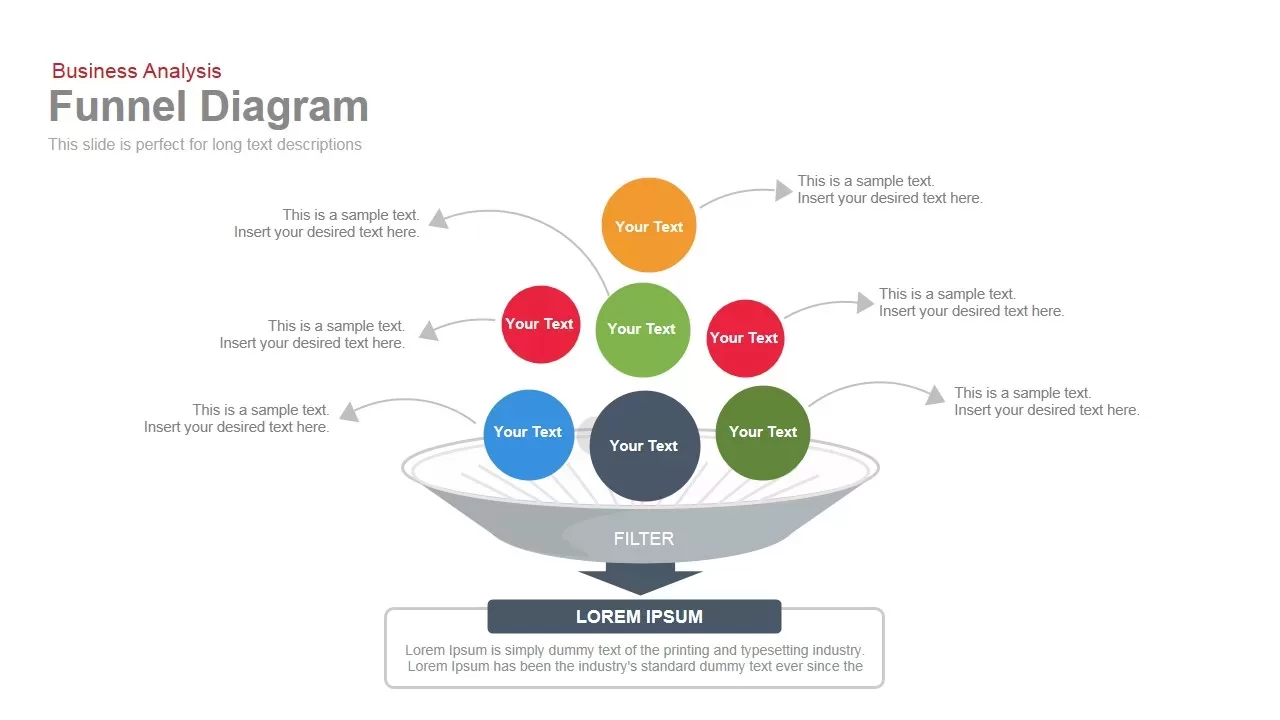
Funnel Diagram Template for PowerPoint & Google Slides
Infographics
4 Level Funnel Diagram Template for PowerPoint & Google Slides
Funnel
Funnel Diagram template for PowerPoint & Google Slides
Funnel
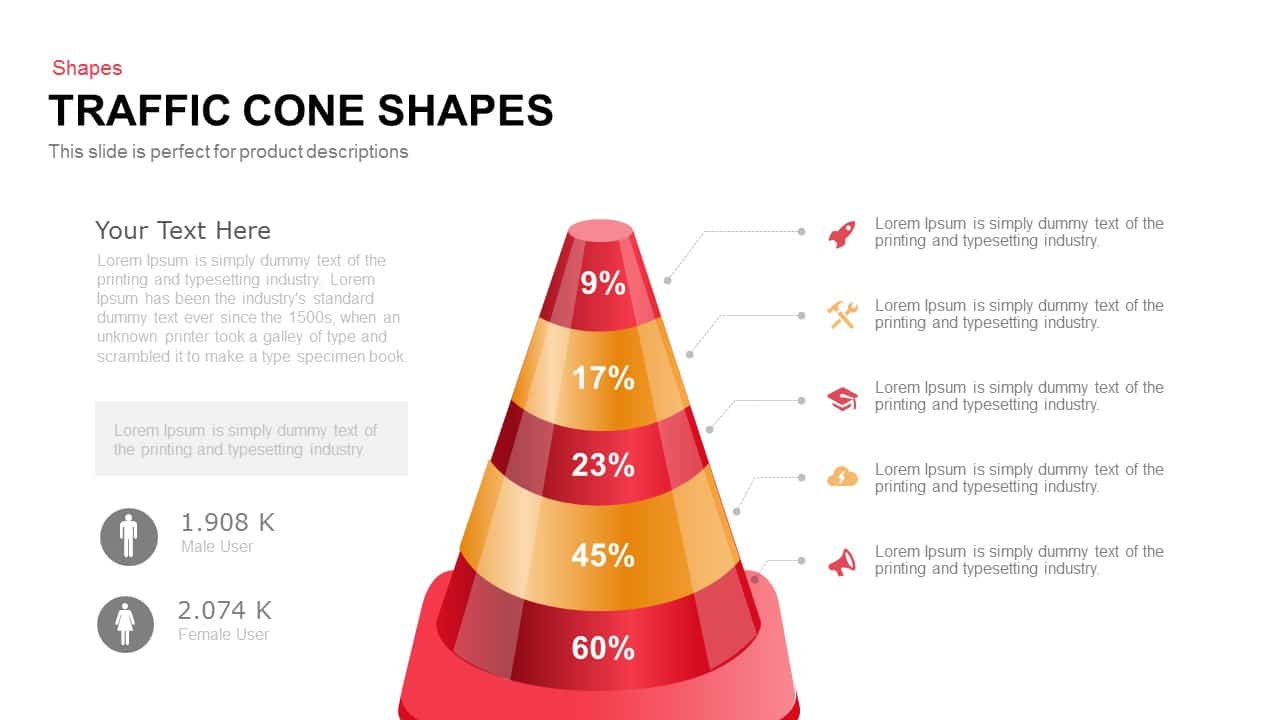
Traffic Cone Funnel Diagram Slide Template for PowerPoint & Google Slides
Funnel
Professional Four-Stage Funnel Diagram Template for PowerPoint & Google Slides
Funnel
Four and Five-Stage Funnel Diagram Template for PowerPoint & Google Slides
Funnel
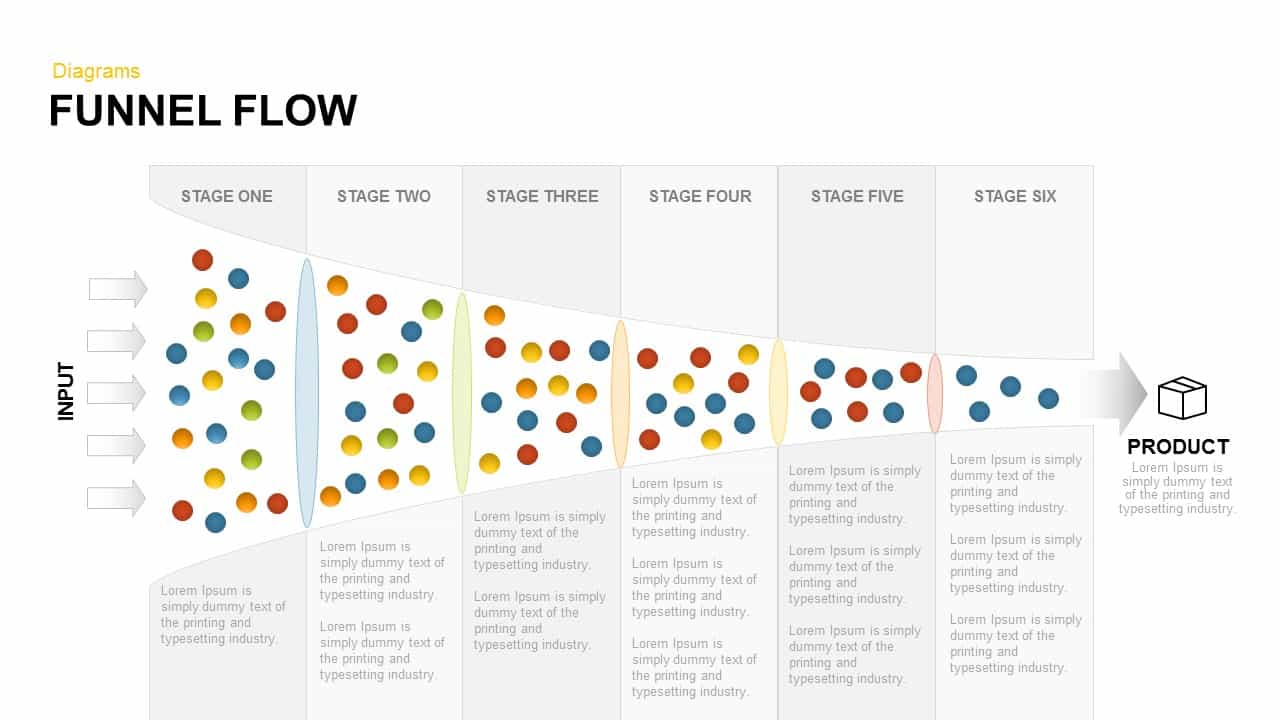
Funnel Flow Diagram template for PowerPoint & Google Slides
Funnel

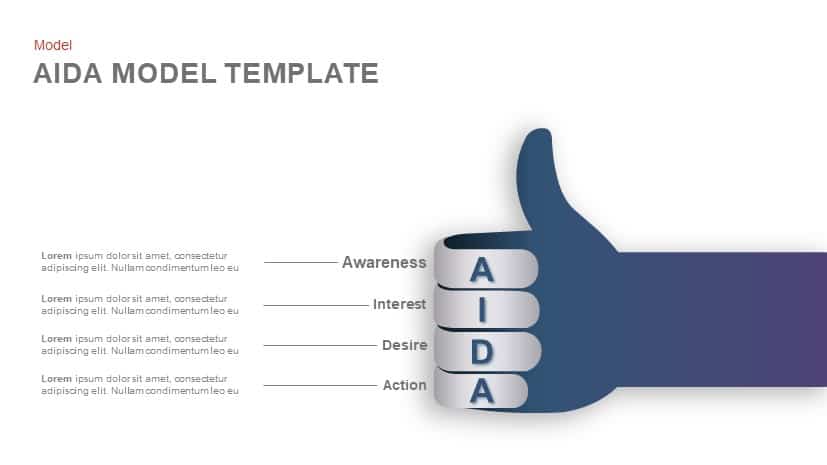
AIDA Model Funnel Thumb Diagram Template for PowerPoint & Google Slides
Process
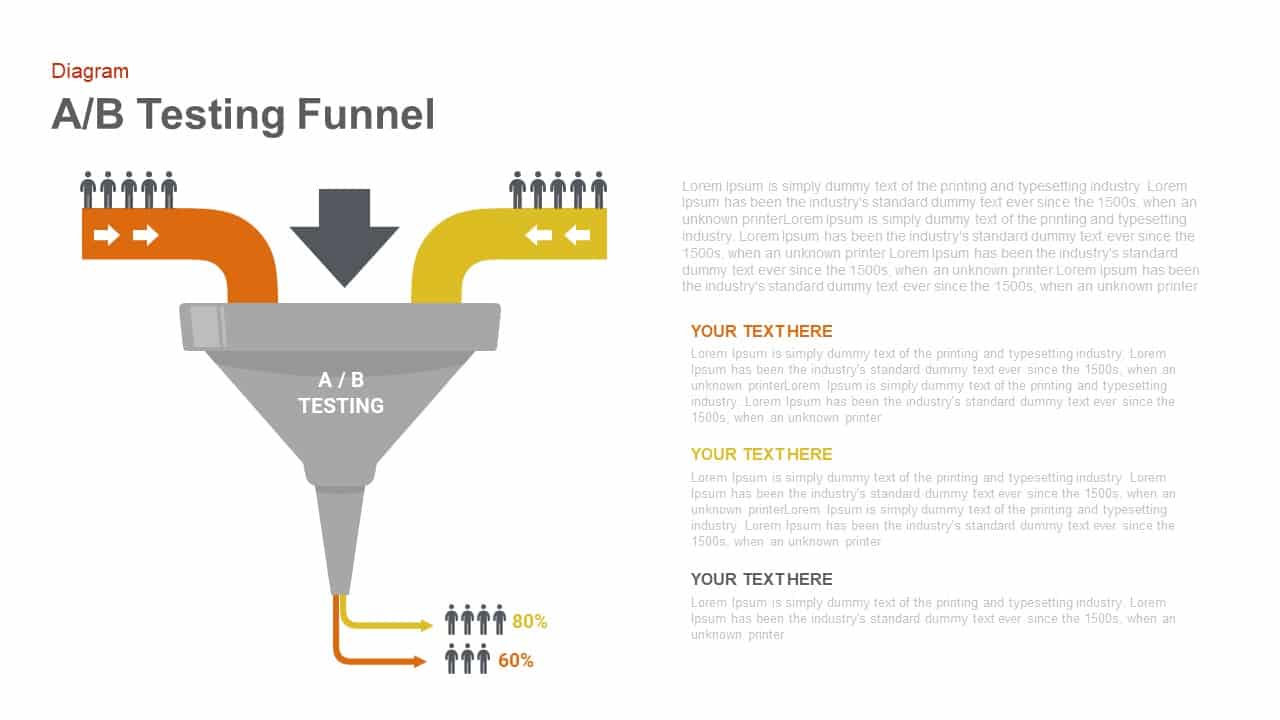
A/B Testing Funnel Diagram Template for PowerPoint & Google Slides
Digital Marketing
6-Stage Funnel Diagram Infographic Template for PowerPoint & Google Slides
Funnel
3D Conversion Funnel Diagram Infographic Template for PowerPoint & Google Slides
Funnel
Animated Recruiting Funnel Diagram Template for PowerPoint & Google Slides
Funnel
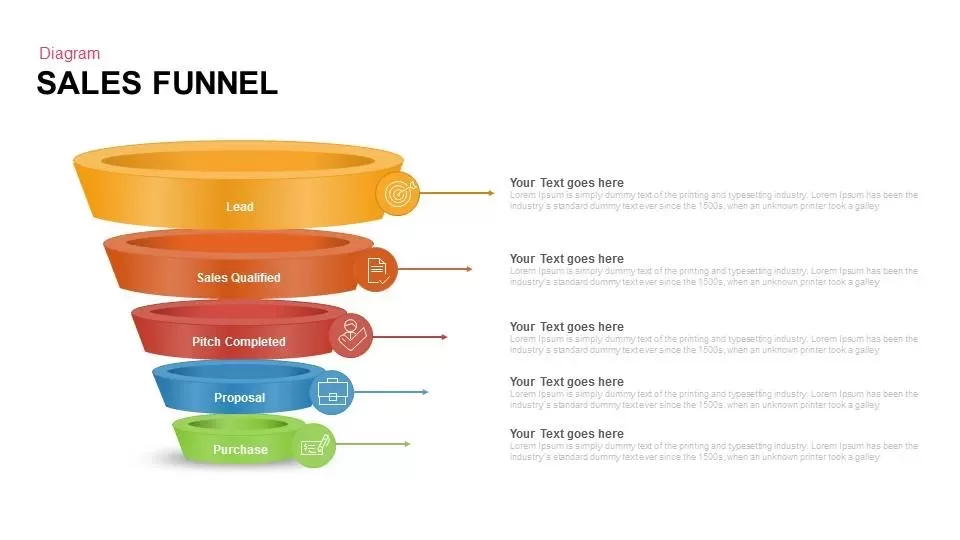
Professional Sales Funnel Diagram Template for PowerPoint & Google Slides
Funnel
Five-Step Gradient Blue Funnel Diagram Template for PowerPoint & Google Slides
Funnel
Four-Stage Funnel Diagram Infographic Template for PowerPoint & Google Slides
Funnel
Four-Step Spiral Funnel Diagram Template for PowerPoint & Google Slides
Funnel
5-Step Colorful Funnel Diagram Template for PowerPoint & Google Slides
Funnel
Four-Stage Funnel Diagram Infographic Template for PowerPoint & Google Slides
Funnel
Sales Funnel Infographic Diagram Template for PowerPoint & Google Slides
Funnel
Free 4-Step 3D Funnel Diagram Template for PowerPoint & Google Slides
Funnel
Free
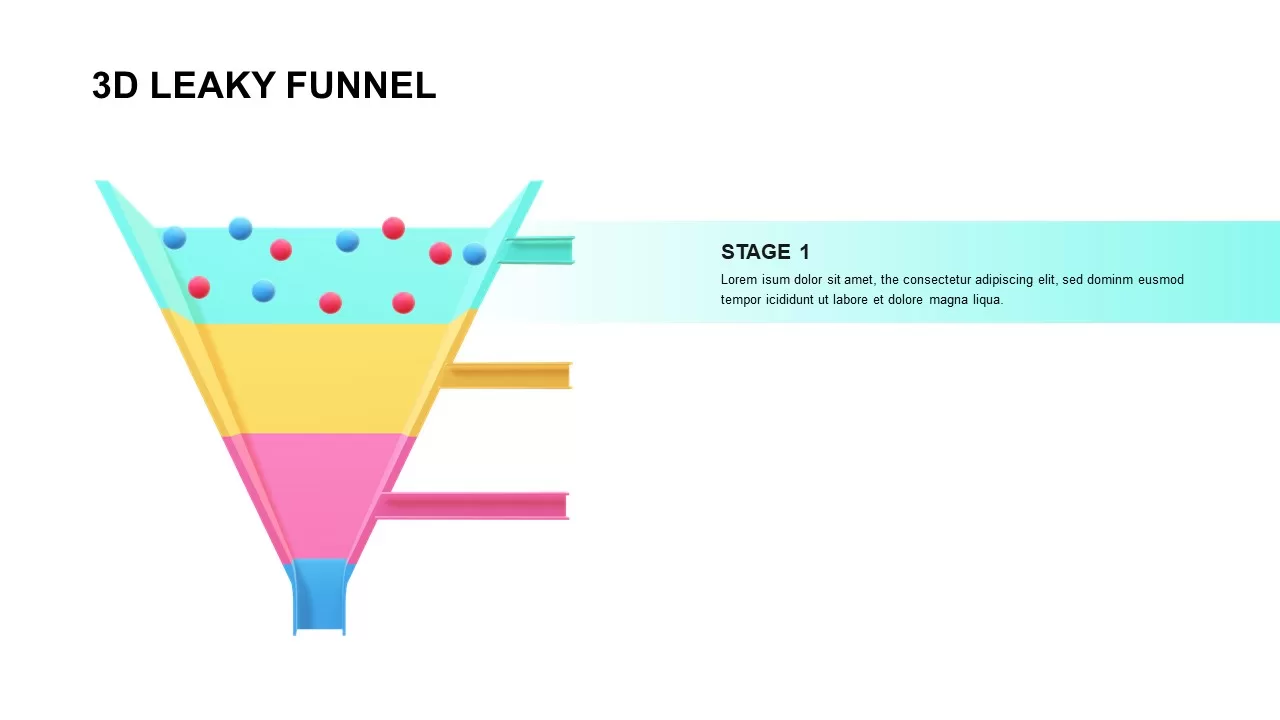
3D Leaky Funnel Diagram template for PowerPoint & Google Slides
Funnel
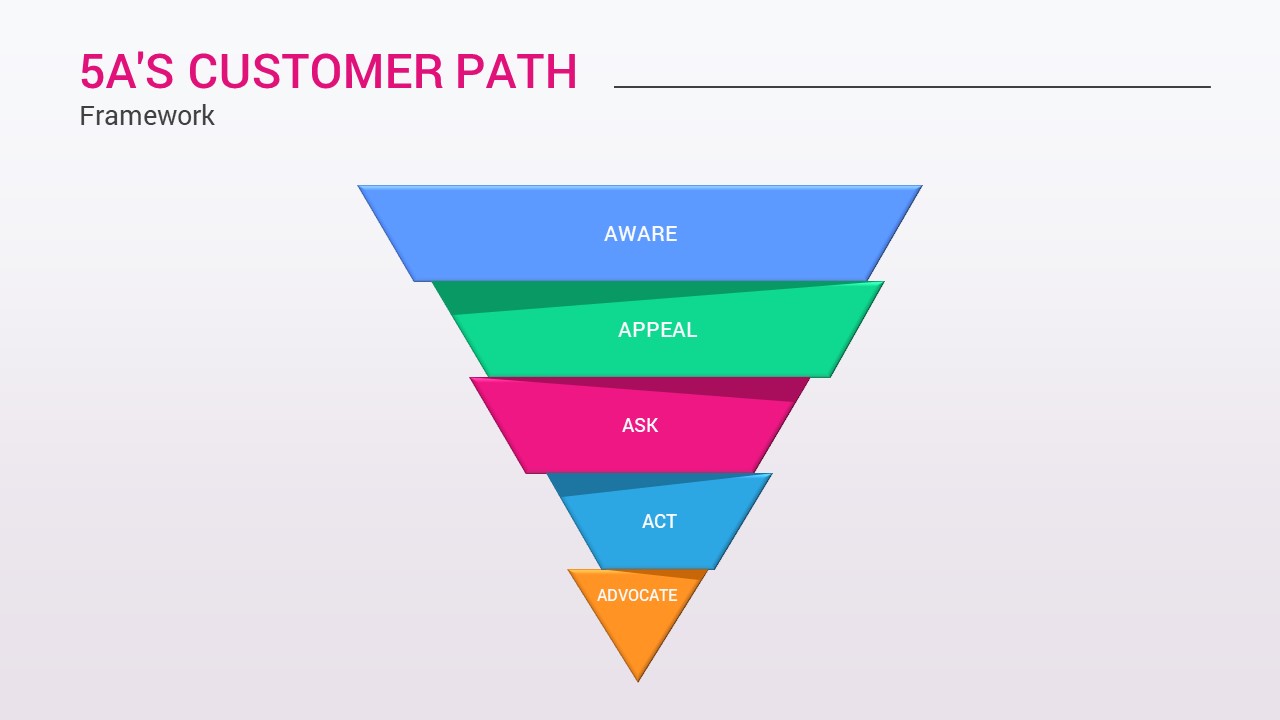
5A’s Customer Path Funnel Diagram Template for PowerPoint & Google Slides
Funnel
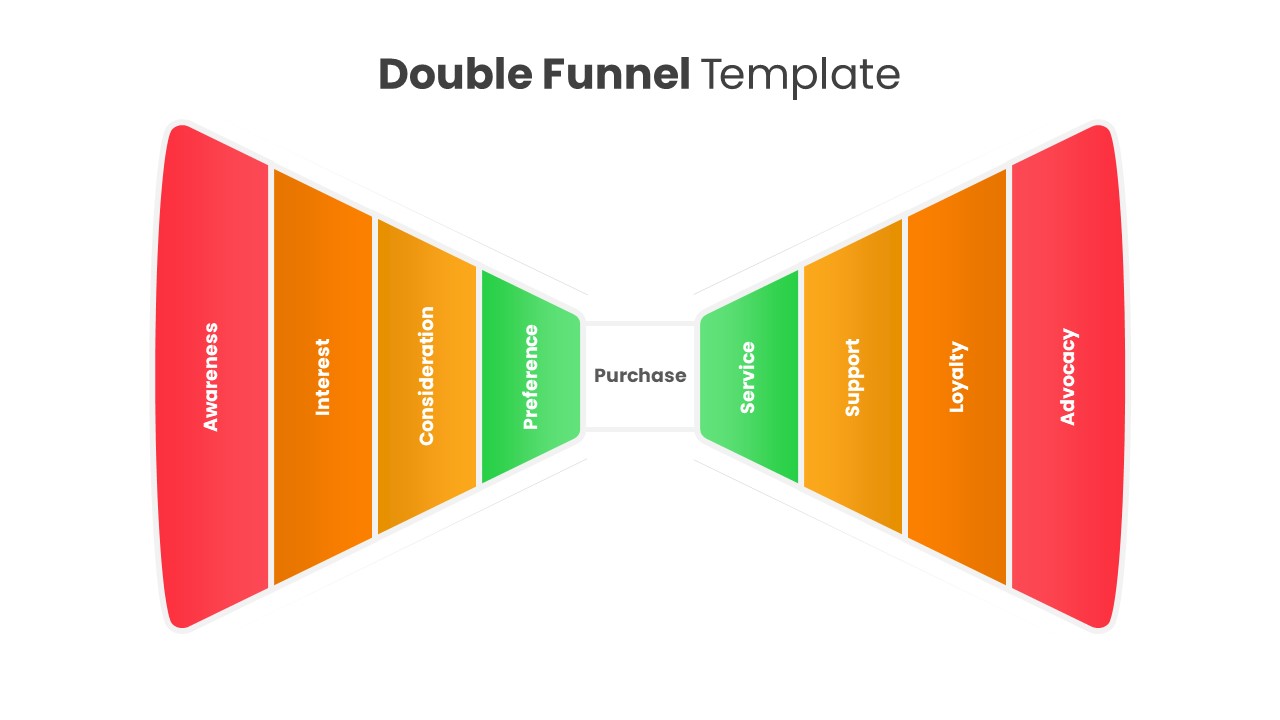
Double Funnel Lifecycle Diagram Template for PowerPoint & Google Slides
Funnel
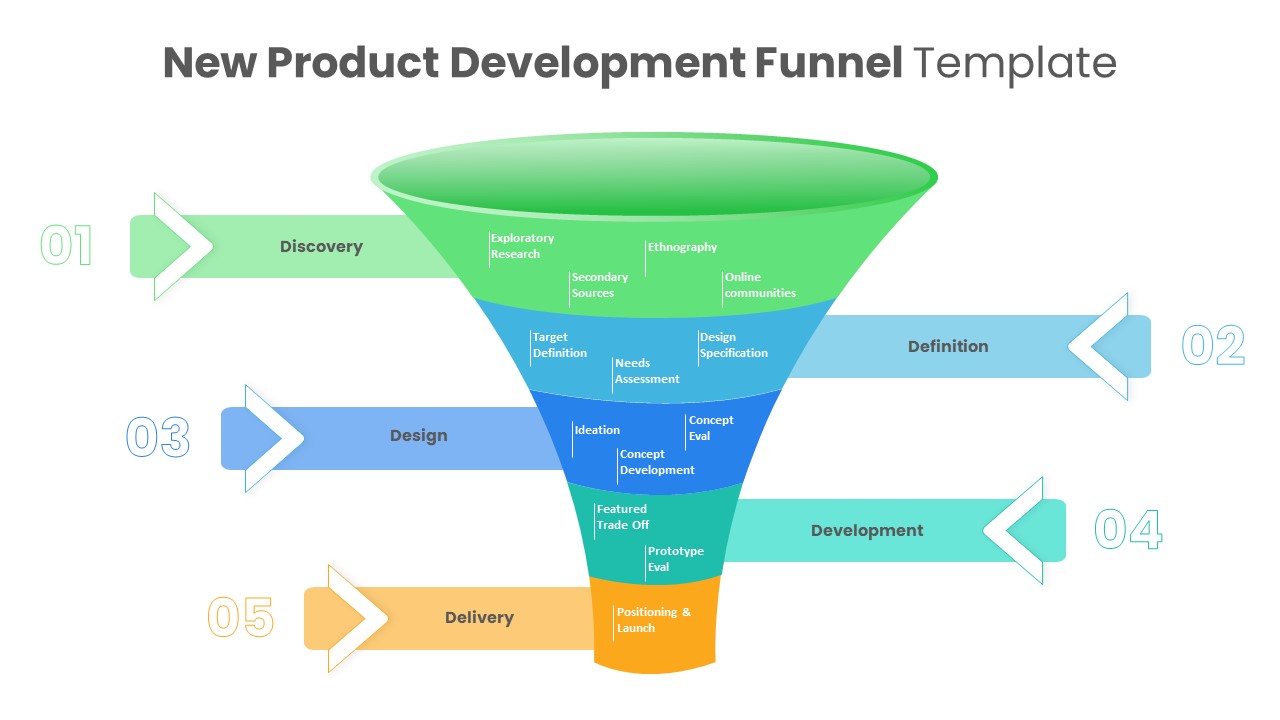
New Product Development Funnel Diagram Template for PowerPoint & Google Slides
Funnel
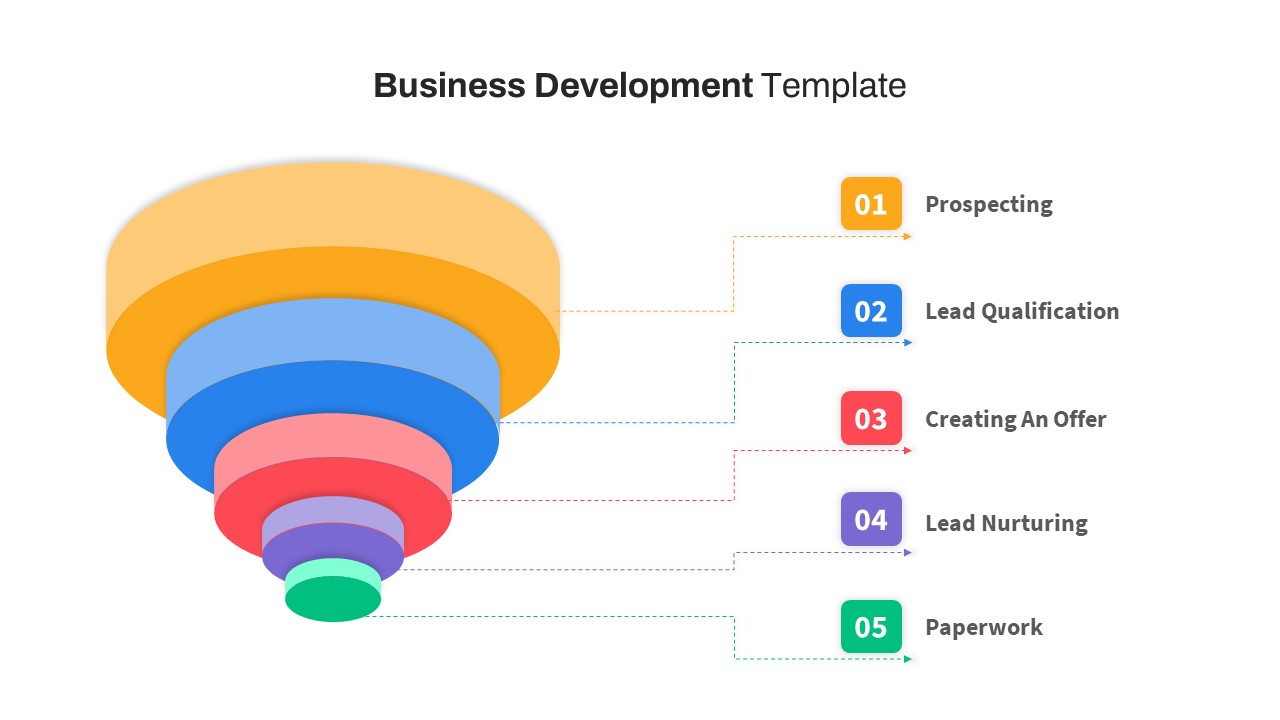
Free Business Development Funnel Diagram Template for PowerPoint & Google Slides
Marketing Funnel
Free
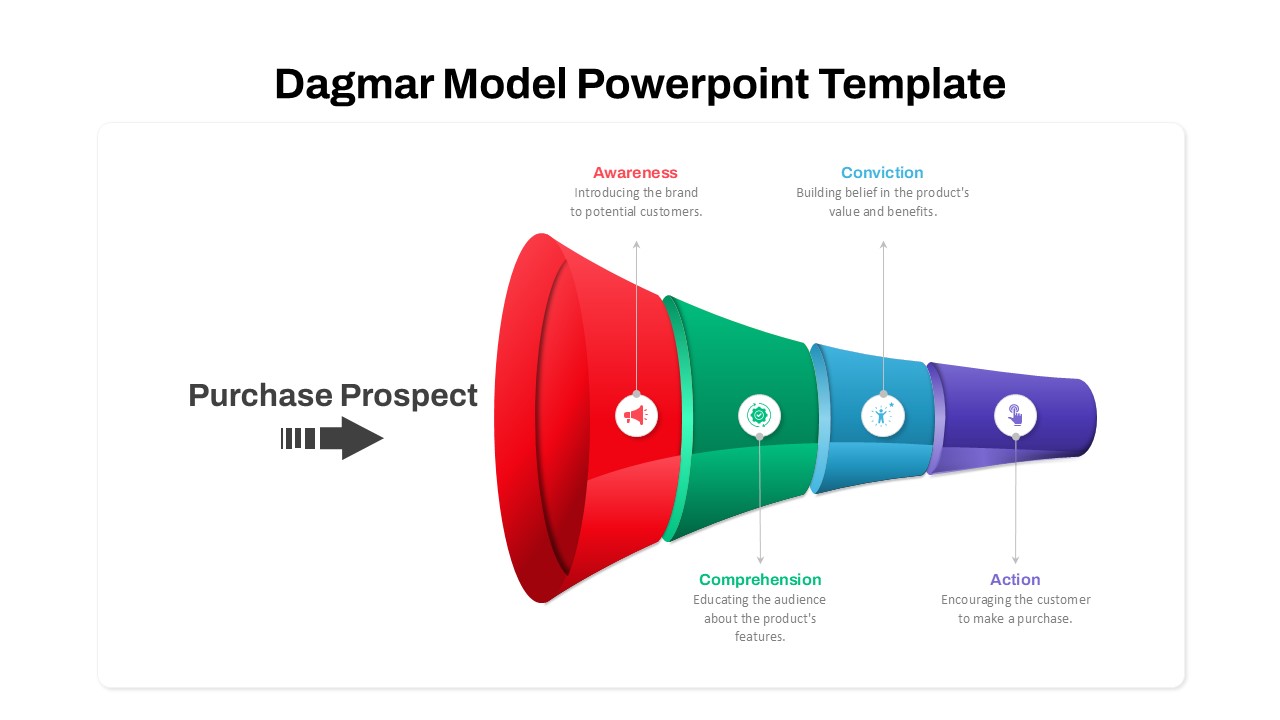
Dagmar Model Marketing Funnel Diagram Template for PowerPoint & Google Slides
Funnel
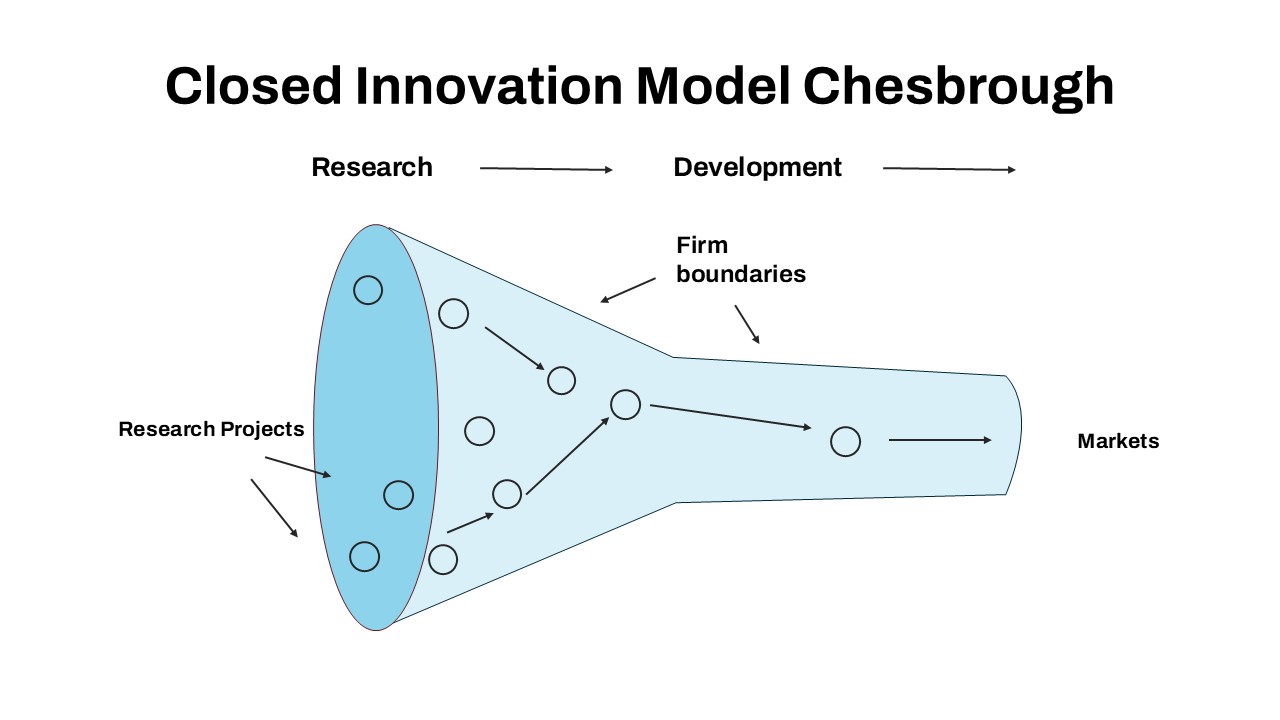
Closed Innovation Model Funnel Diagram Template for PowerPoint & Google Slides
Funnel
AIDAS Customer Journey Funnel Diagram Template for PowerPoint & Google Slides
Marketing Funnel
Five-Step Modern Funnel Diagram Template for PowerPoint & Google Slides
Funnel
Four-Stage Marketing Funnel Diagram Template for PowerPoint & Google Slides
Marketing Funnel
5 Stage Sales Funnel Diagram Template for PowerPoint & Google Slides
Funnel
Sales Funnel Diagram for PowerPoint & Google Slides
Marketing Funnel
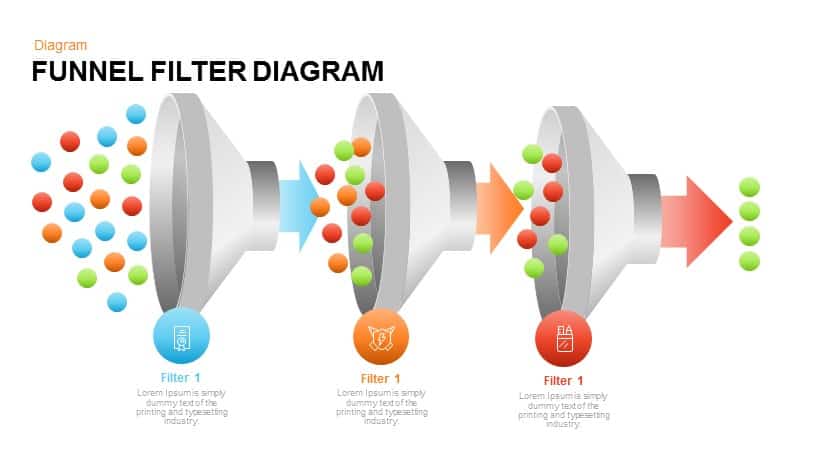
Funnel Filter Diagram for PowerPoint & Google Slides
Funnel
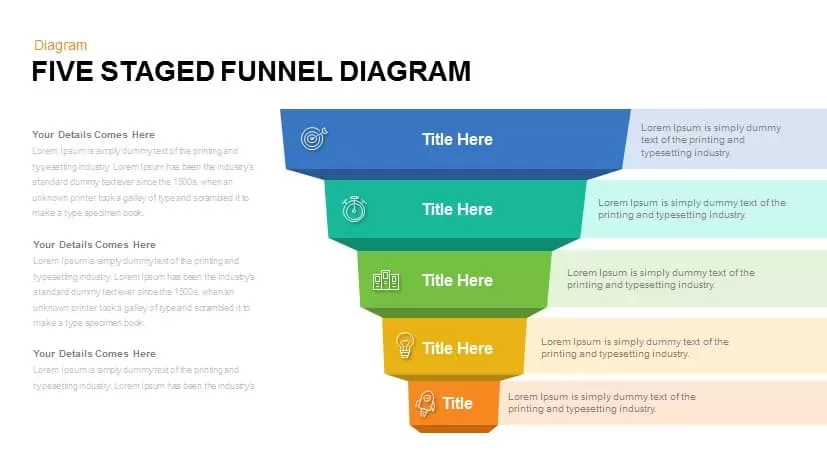
Five Staged Funnel Diagram for PowerPoint & Google Slides
Funnel
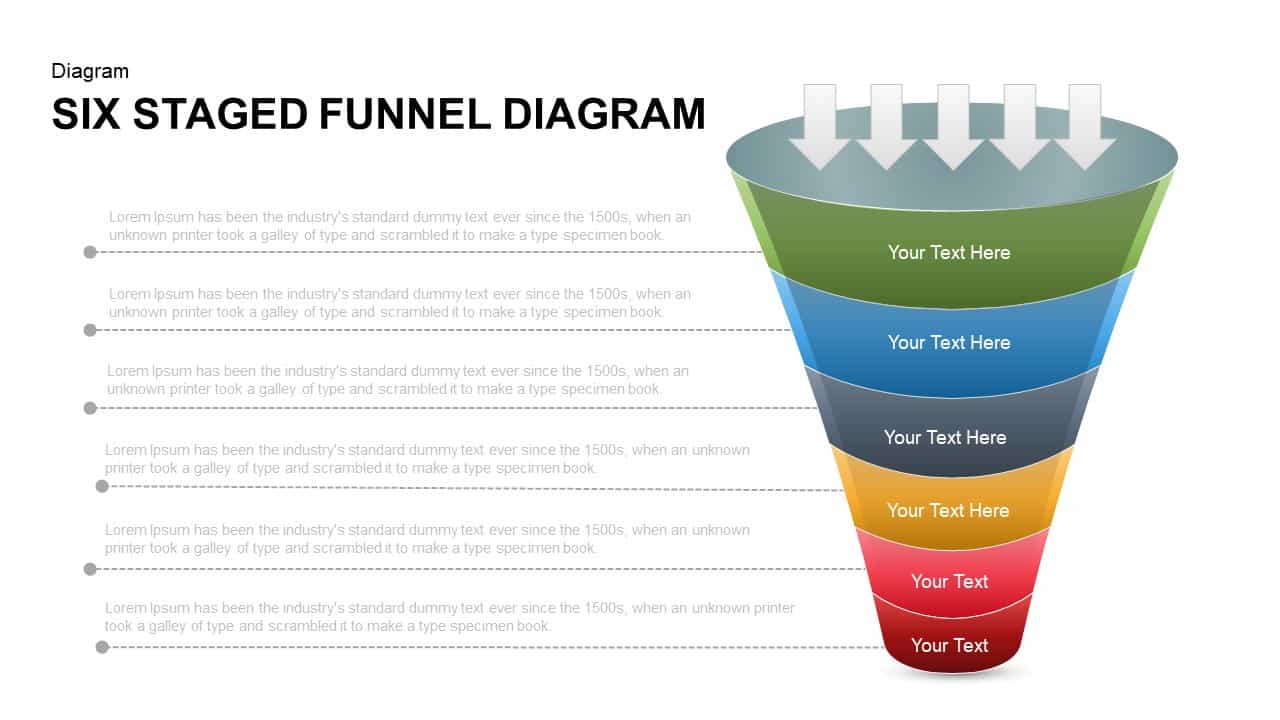
Six Staged Funnel Diagram for PowerPoint & Google Slides
Funnel
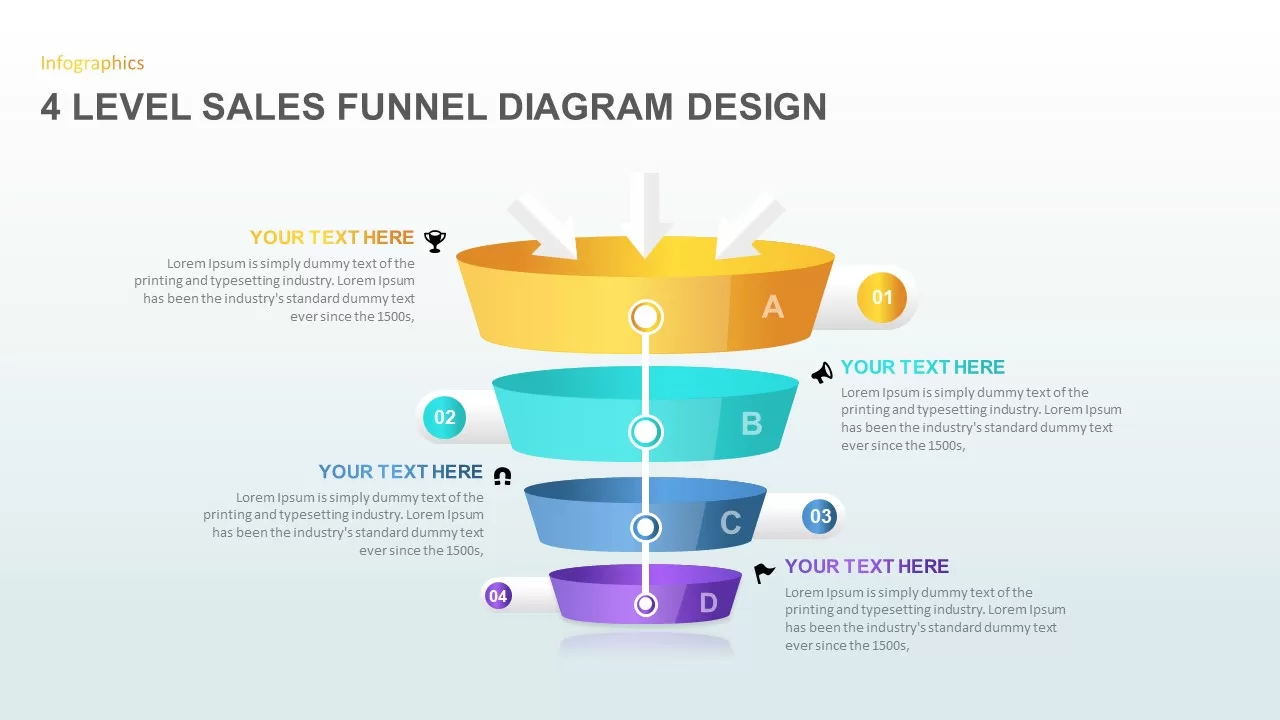
4 Level Sales Funnel Diagram Design for PowerPoint & Google Slides
Marketing Funnel
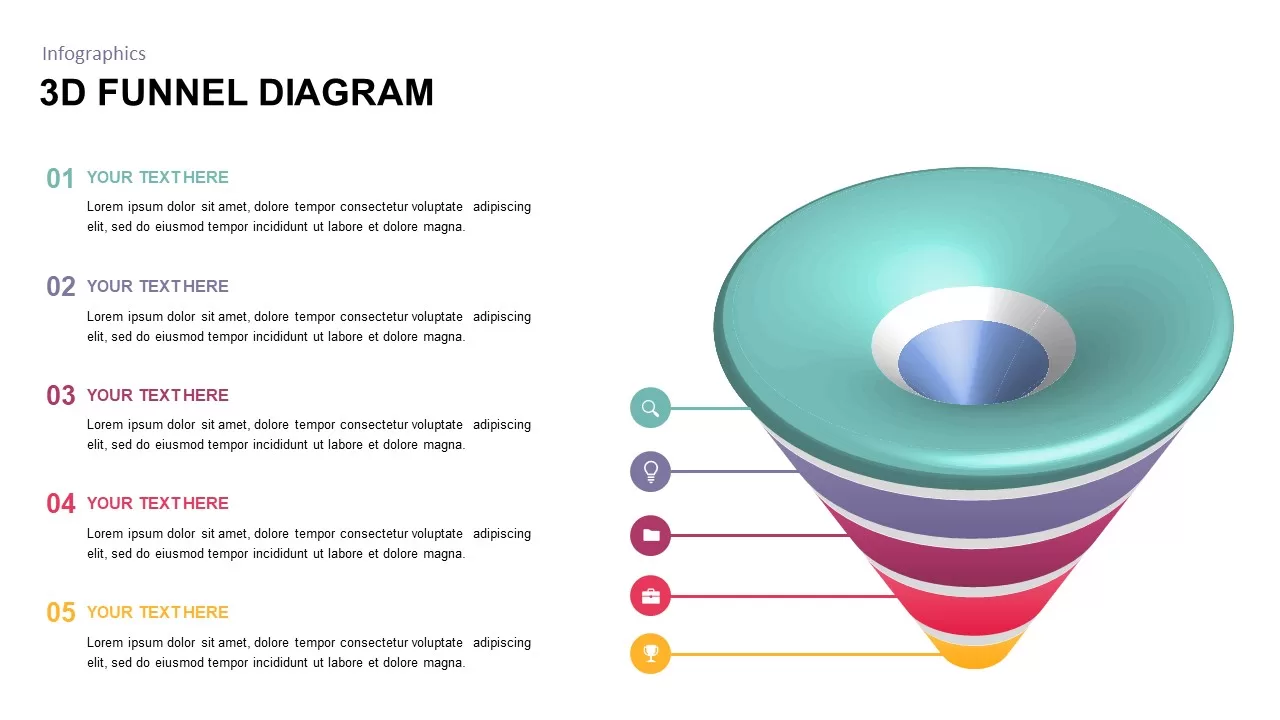
3D Funnel Diagram Infographics for PowerPoint & Google Slides
Funnel
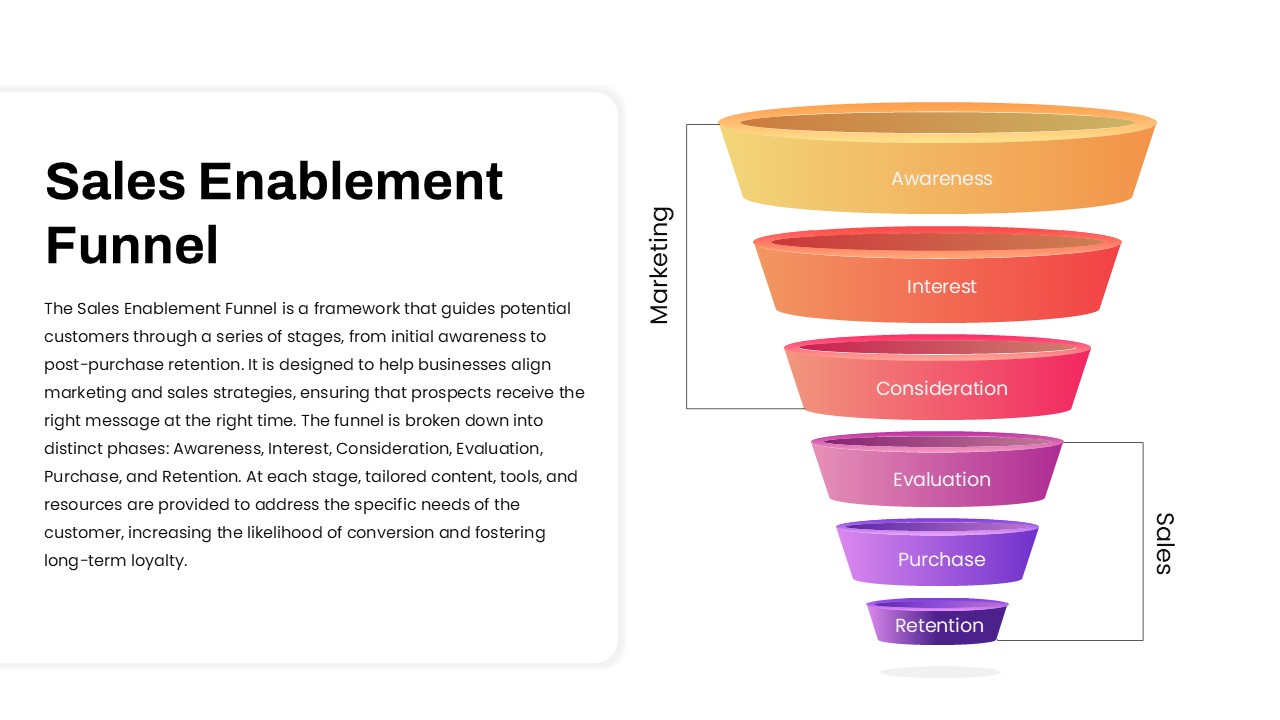
Sales Enablement Funnel diagram for PowerPoint & Google Slides
Funnel
Innovation Ambition Matrix & Funnel Strategy Slides for PowerPoint & Google Slides
Process
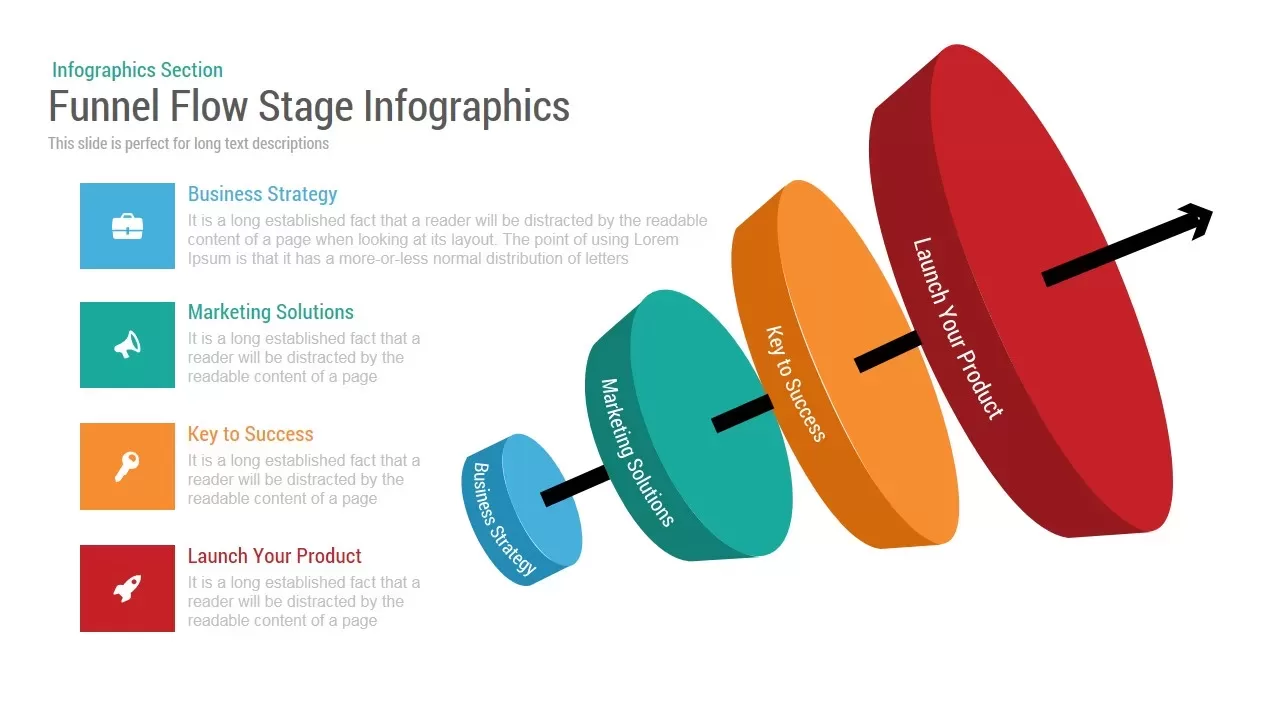
Funnel Flow Stage Infographics template for PowerPoint & Google Slides
Funnel
Professional 3D Funnel Infographic Template for PowerPoint & Google Slides
Funnel
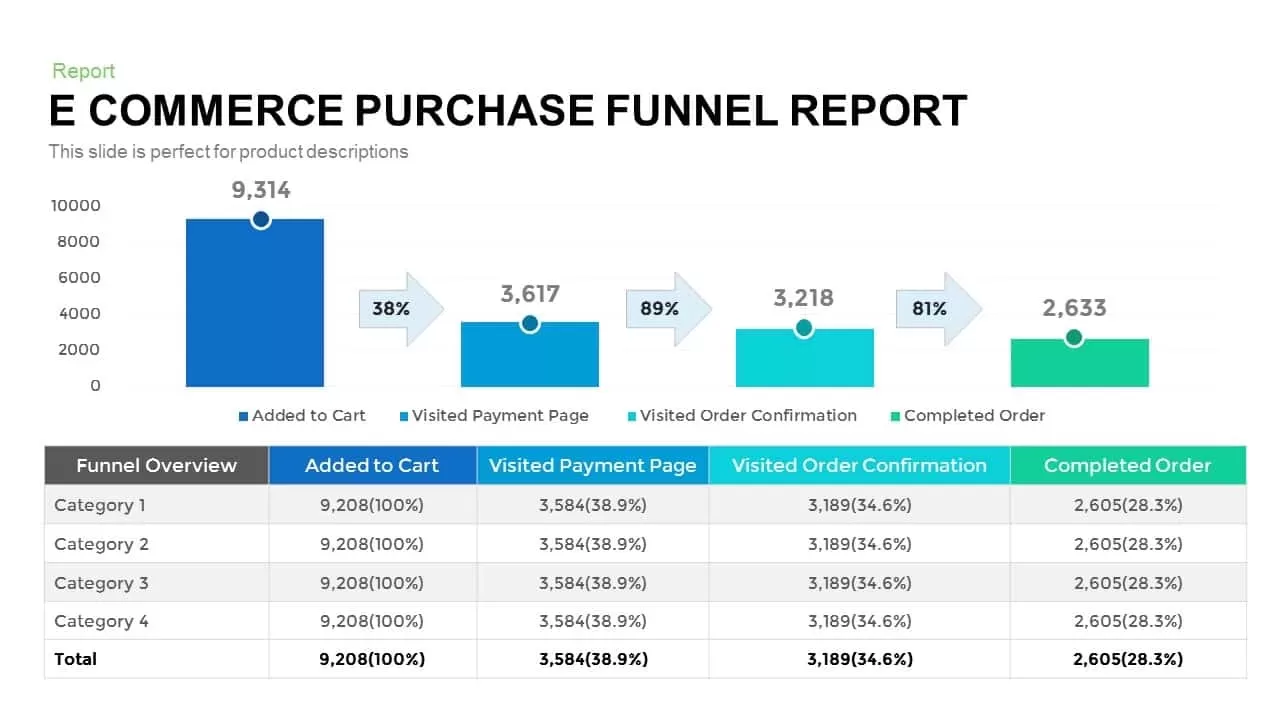
E-commerce Purchase Funnel Report template for PowerPoint & Google Slides
Funnel
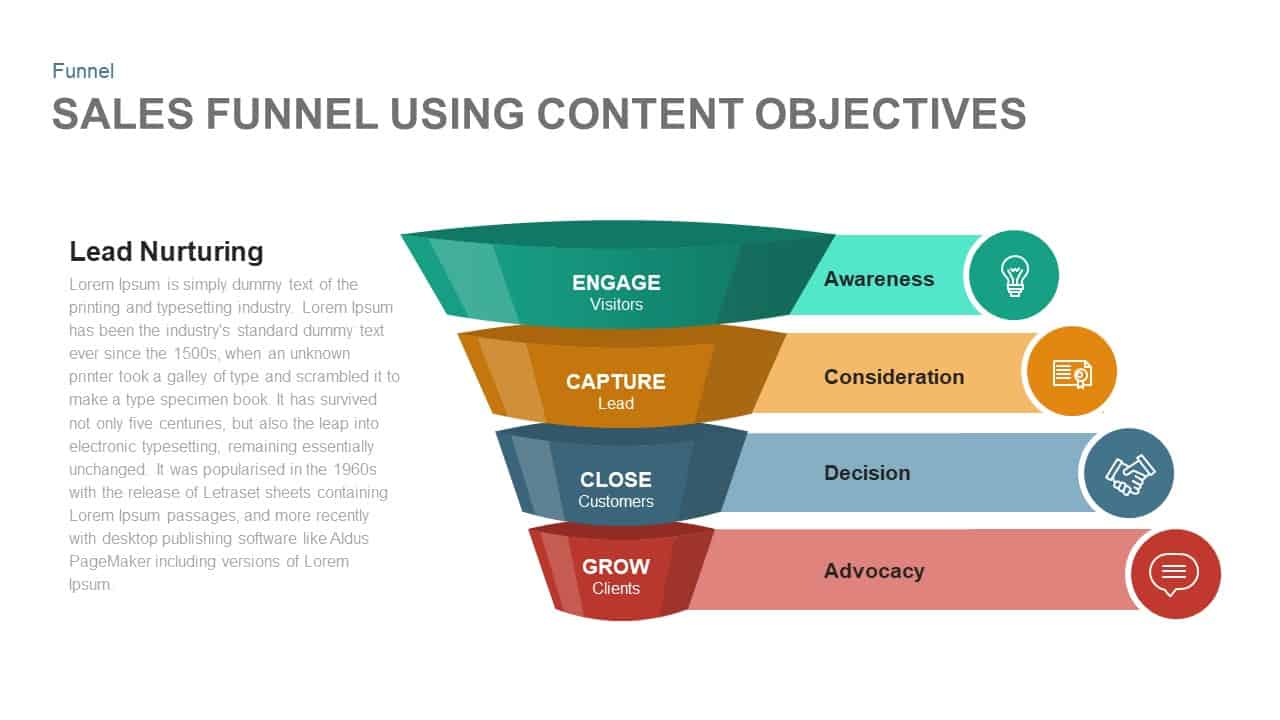
Sales Funnel Using Content Objectives Template for PowerPoint & Google Slides
Funnel
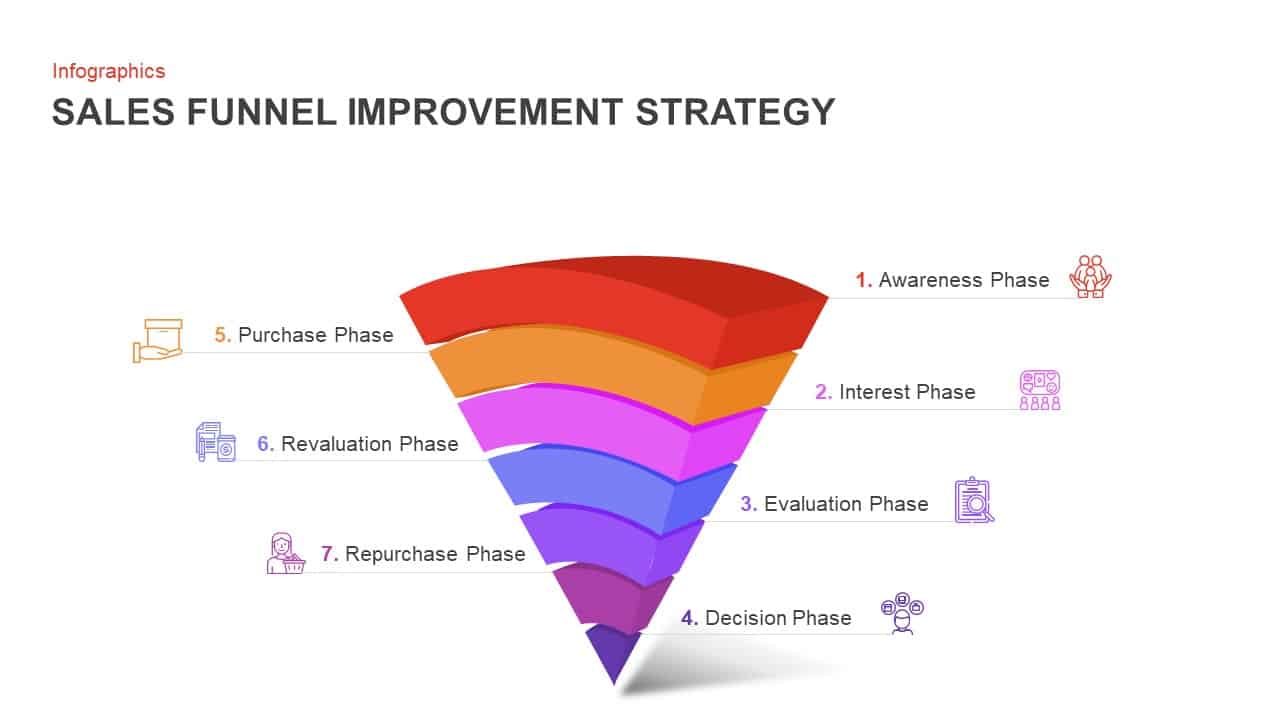
7-Step Sales Funnel Improvement Strategy Template for PowerPoint & Google Slides
Infographics
AIDA Marketing Funnel Model Template for PowerPoint & Google Slides
Marketing
Gradient 5-Stage Funnel Infographic Template for PowerPoint & Google Slides
Funnel
Five-Stage Marketing Funnel Infographic Template for PowerPoint & Google Slides
Funnel
Four-Step Funnel Infographic Pack Template for PowerPoint & Google Slides
Funnel
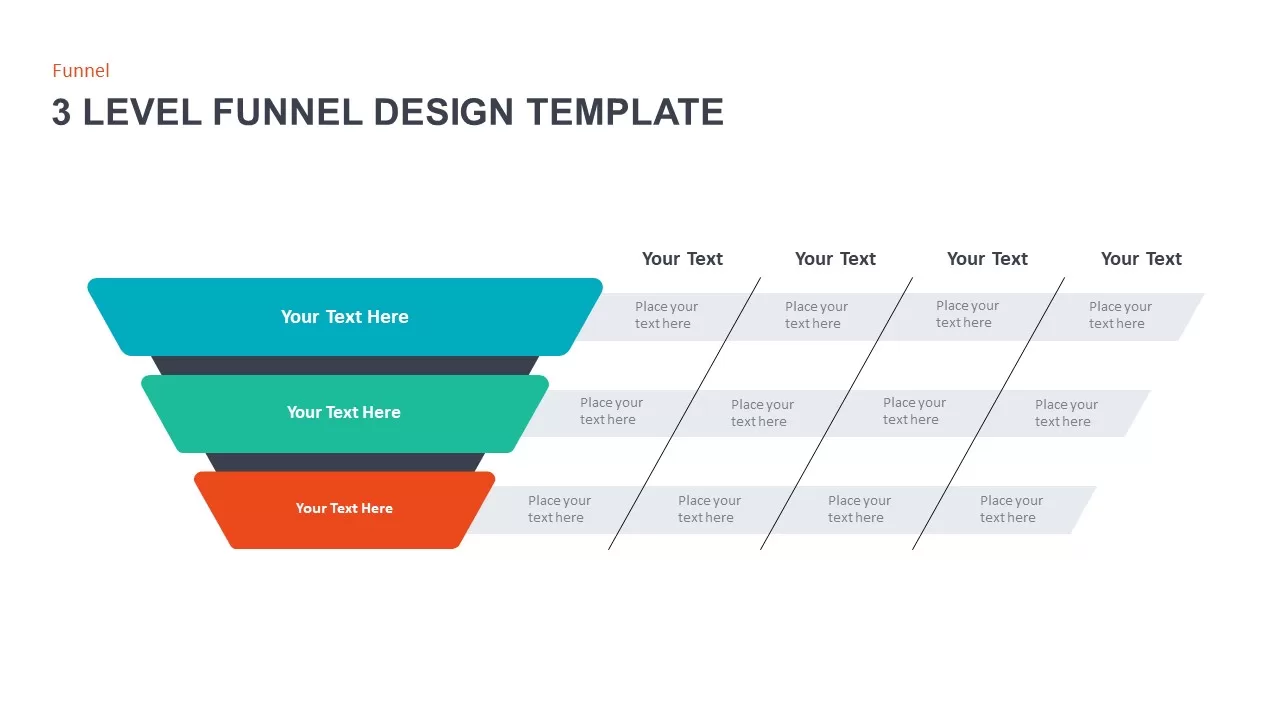
3 Level Funnel Design Visualization Template for PowerPoint & Google Slides
Funnel
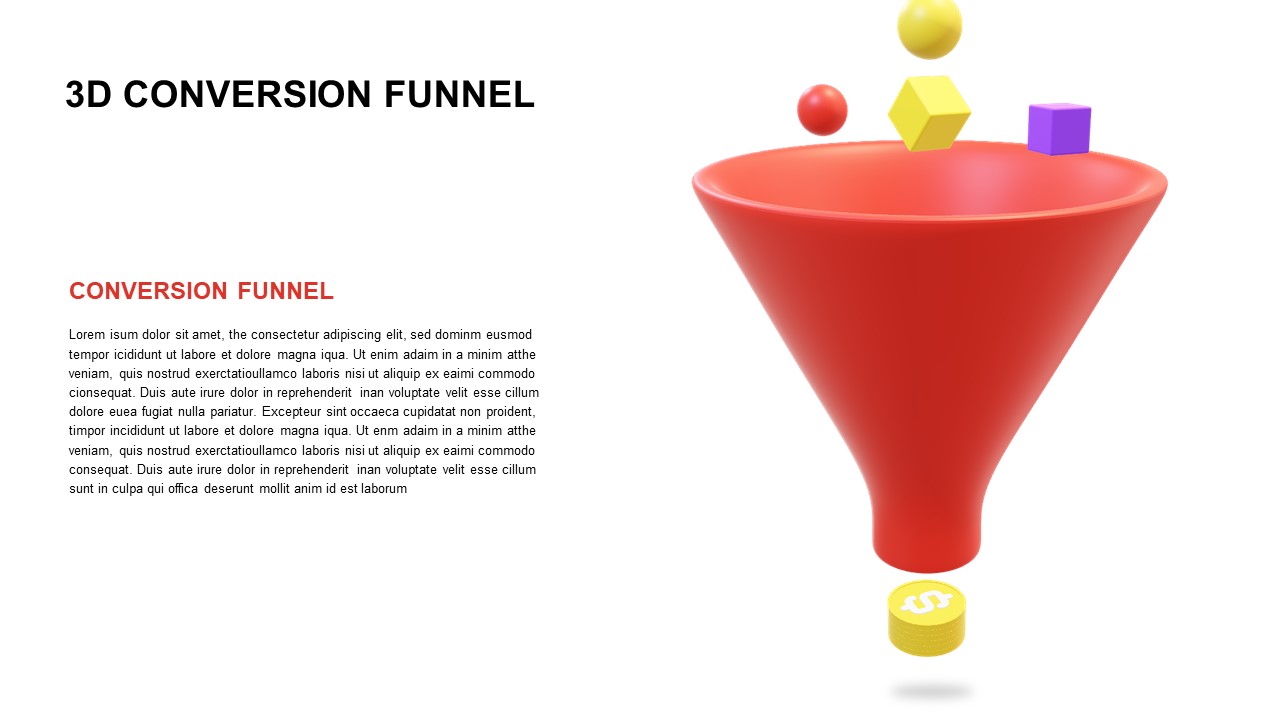
Free 3D Conversion Funnel Overview template for PowerPoint & Google Slides
Funnel
Free
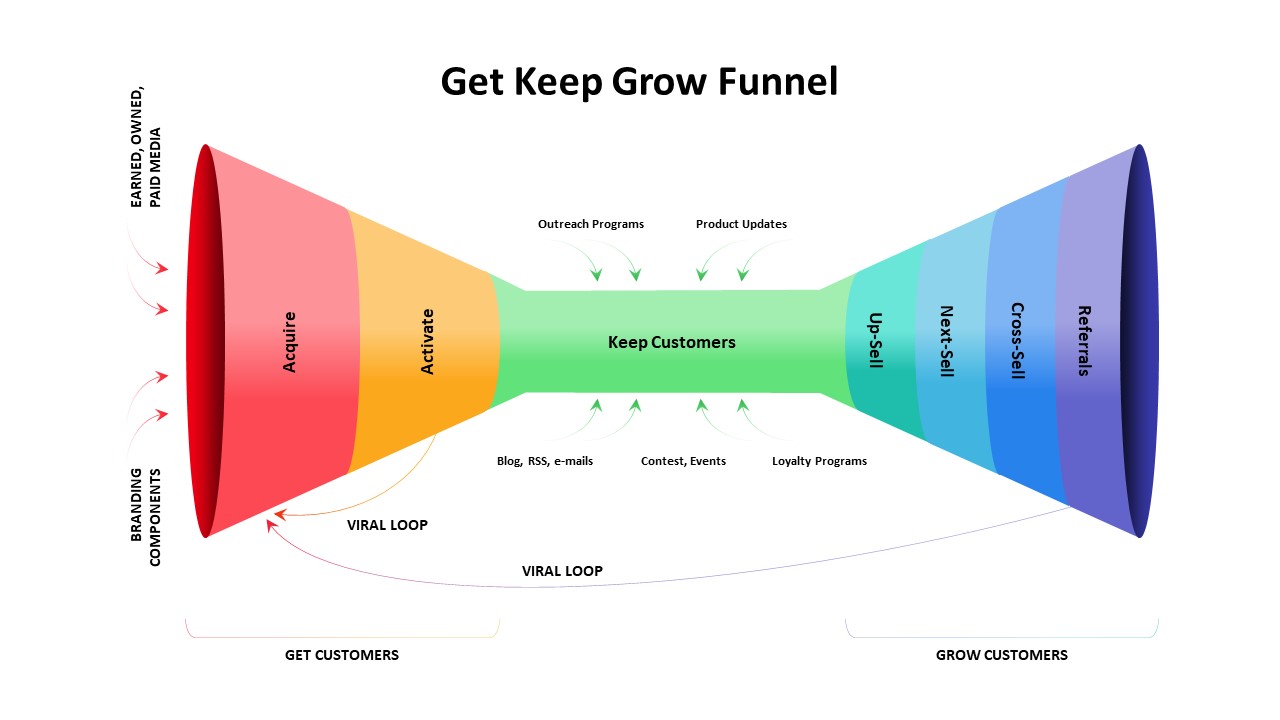
Get Keep Grow Customer Funnel Lifecycle Template for PowerPoint & Google Slides
Funnel
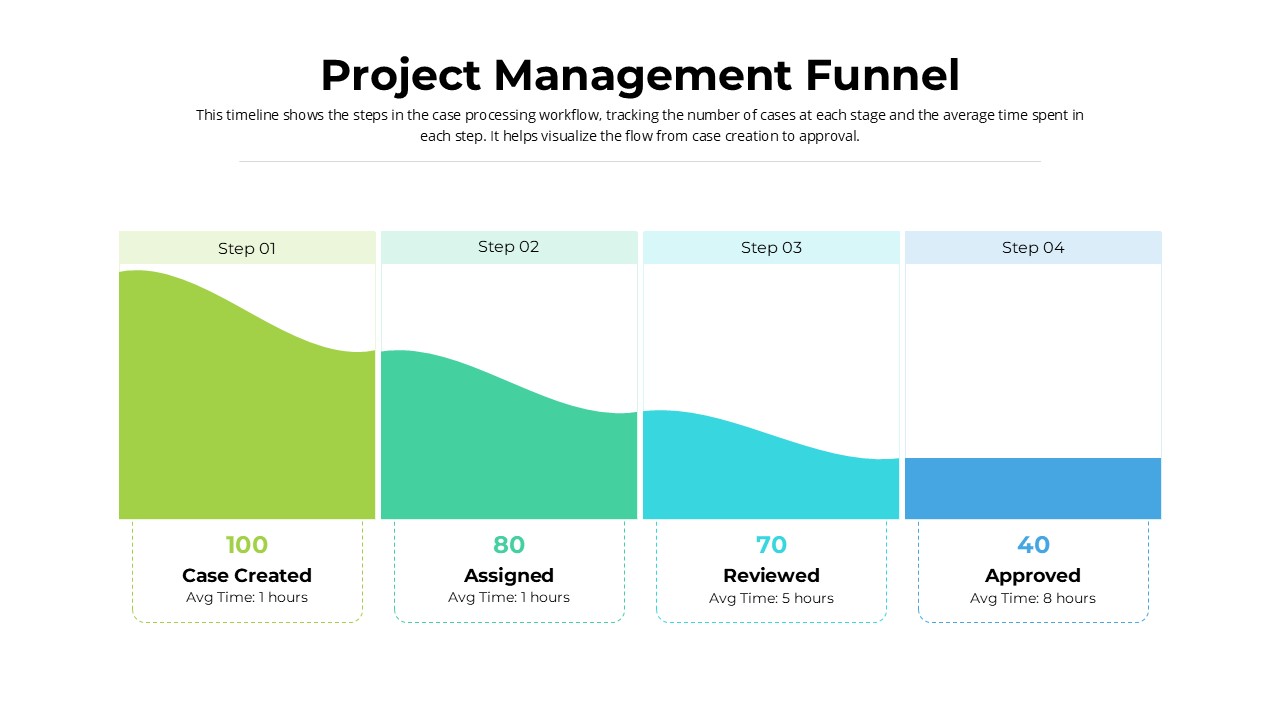
Project Management Funnel template for PowerPoint & Google Slides
Project
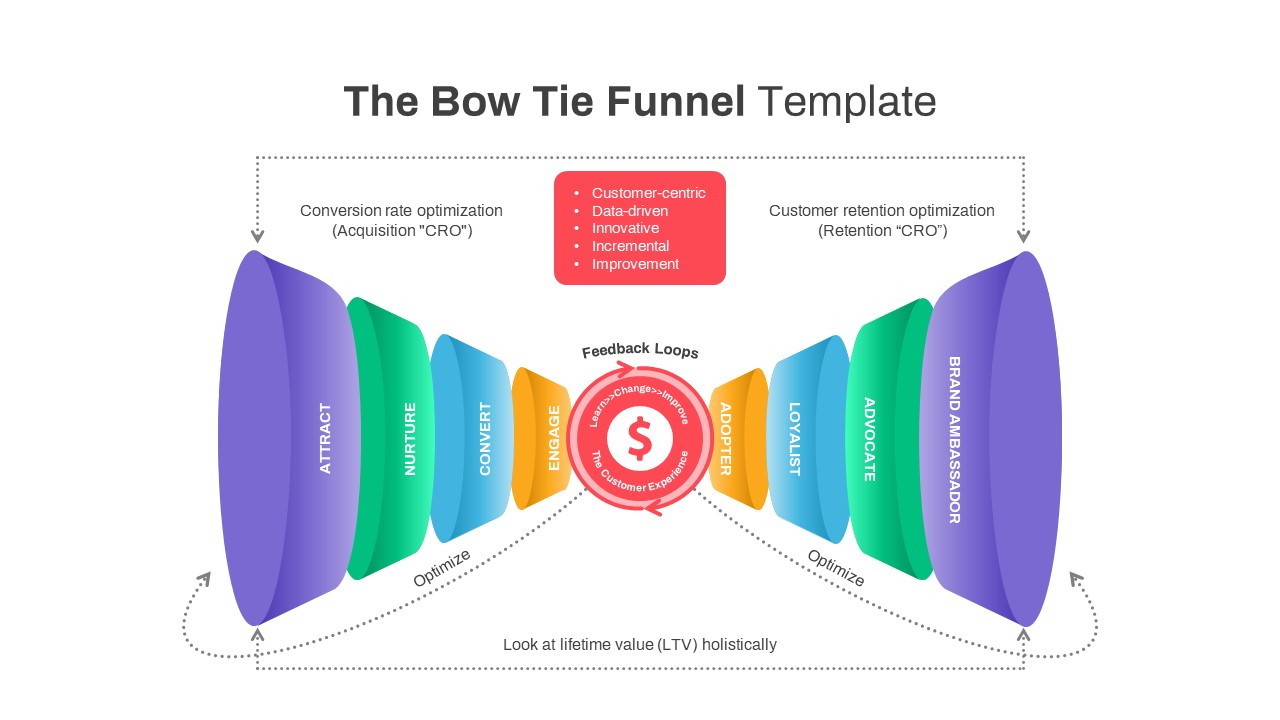
Bow Tie Customer Funnel Presentation Template for PowerPoint & Google Slides
Funnel
Free Multi-Step Funnel Infographic Slide Pack Template for PowerPoint & Google Slides
Funnel
Free
Inverted Sales Funnel Marketing Stages Template for PowerPoint & Google Slides
Marketing Funnel
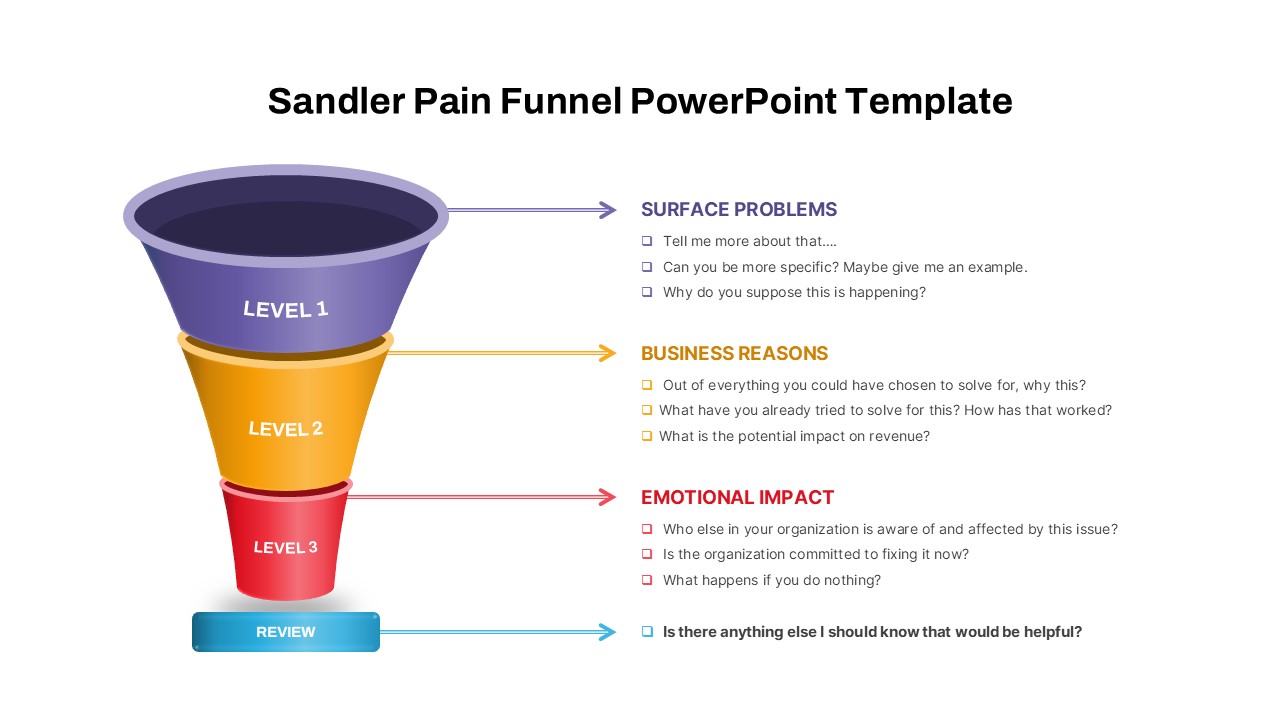
Sandler Pain Funnel Sales Qualification Template for PowerPoint & Google Slides
Funnel
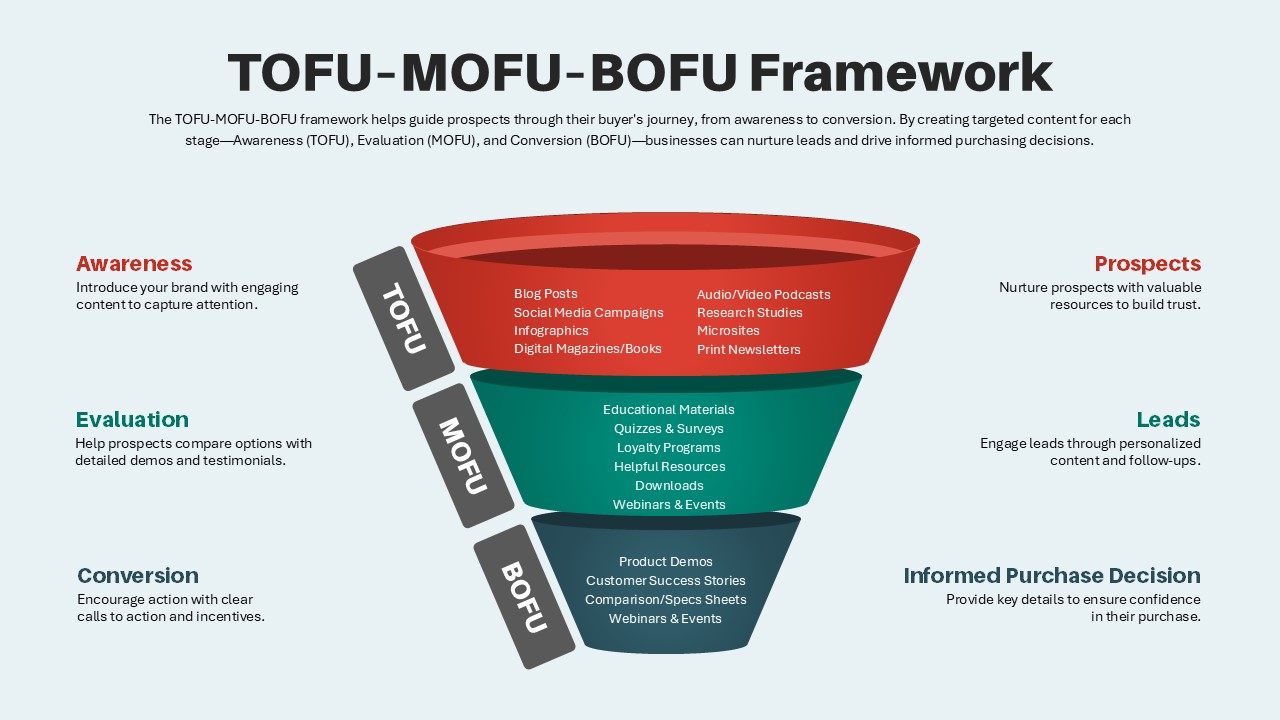
TOFU-MOFU-BOFU Marketing Funnel Template for PowerPoint & Google Slides
Funnel
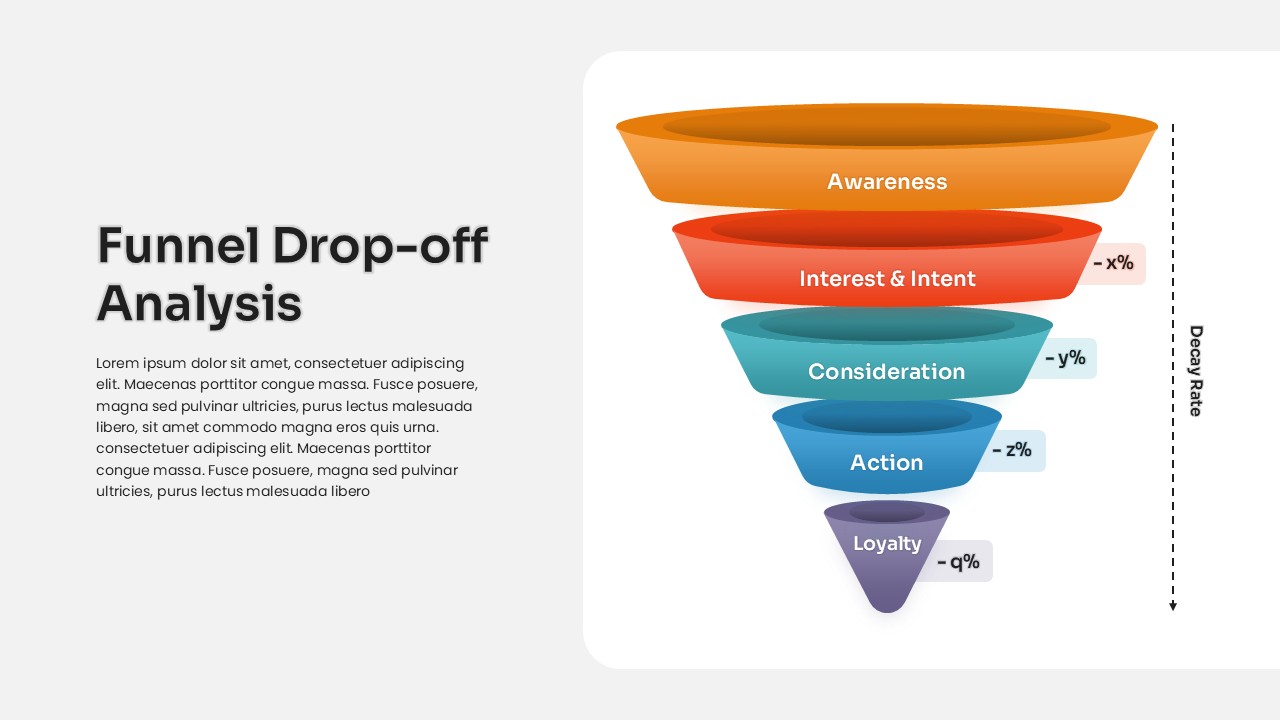
Funnel Drop-off Analysis template for PowerPoint & Google Slides
Business
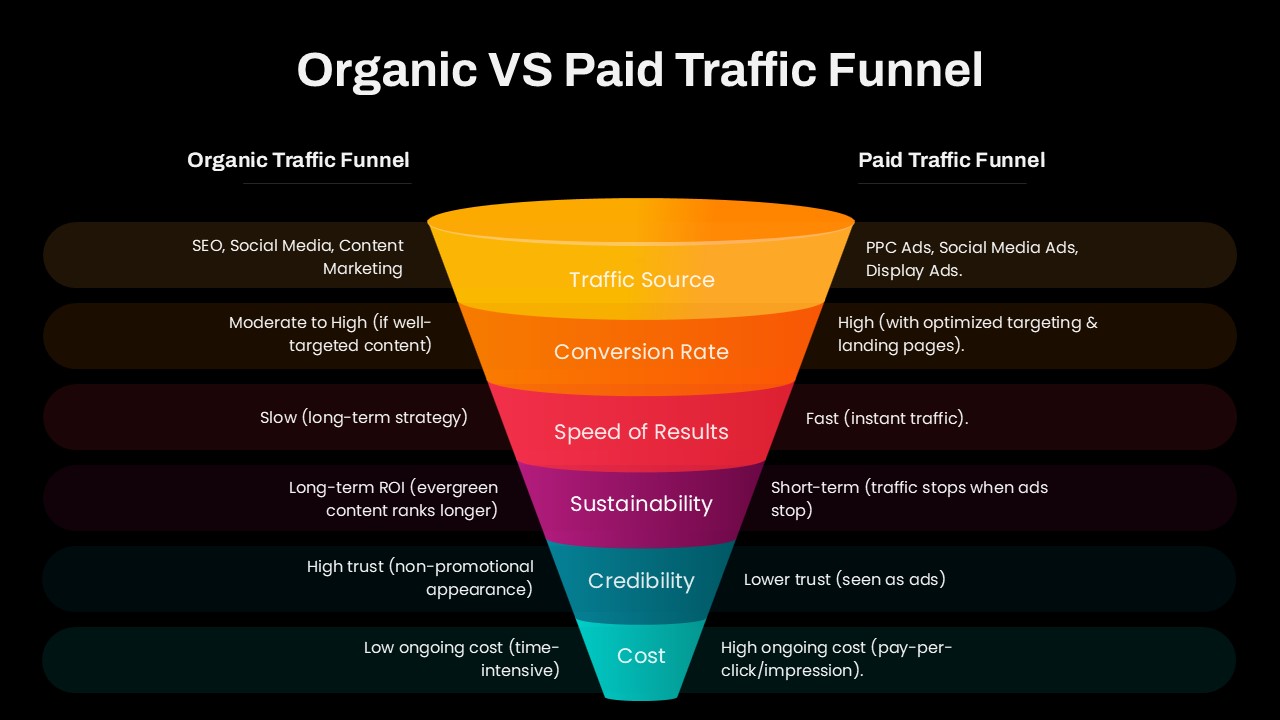
Organic vs Paid Traffic Funnel Template for PowerPoint & Google Slides
Marketing Funnel

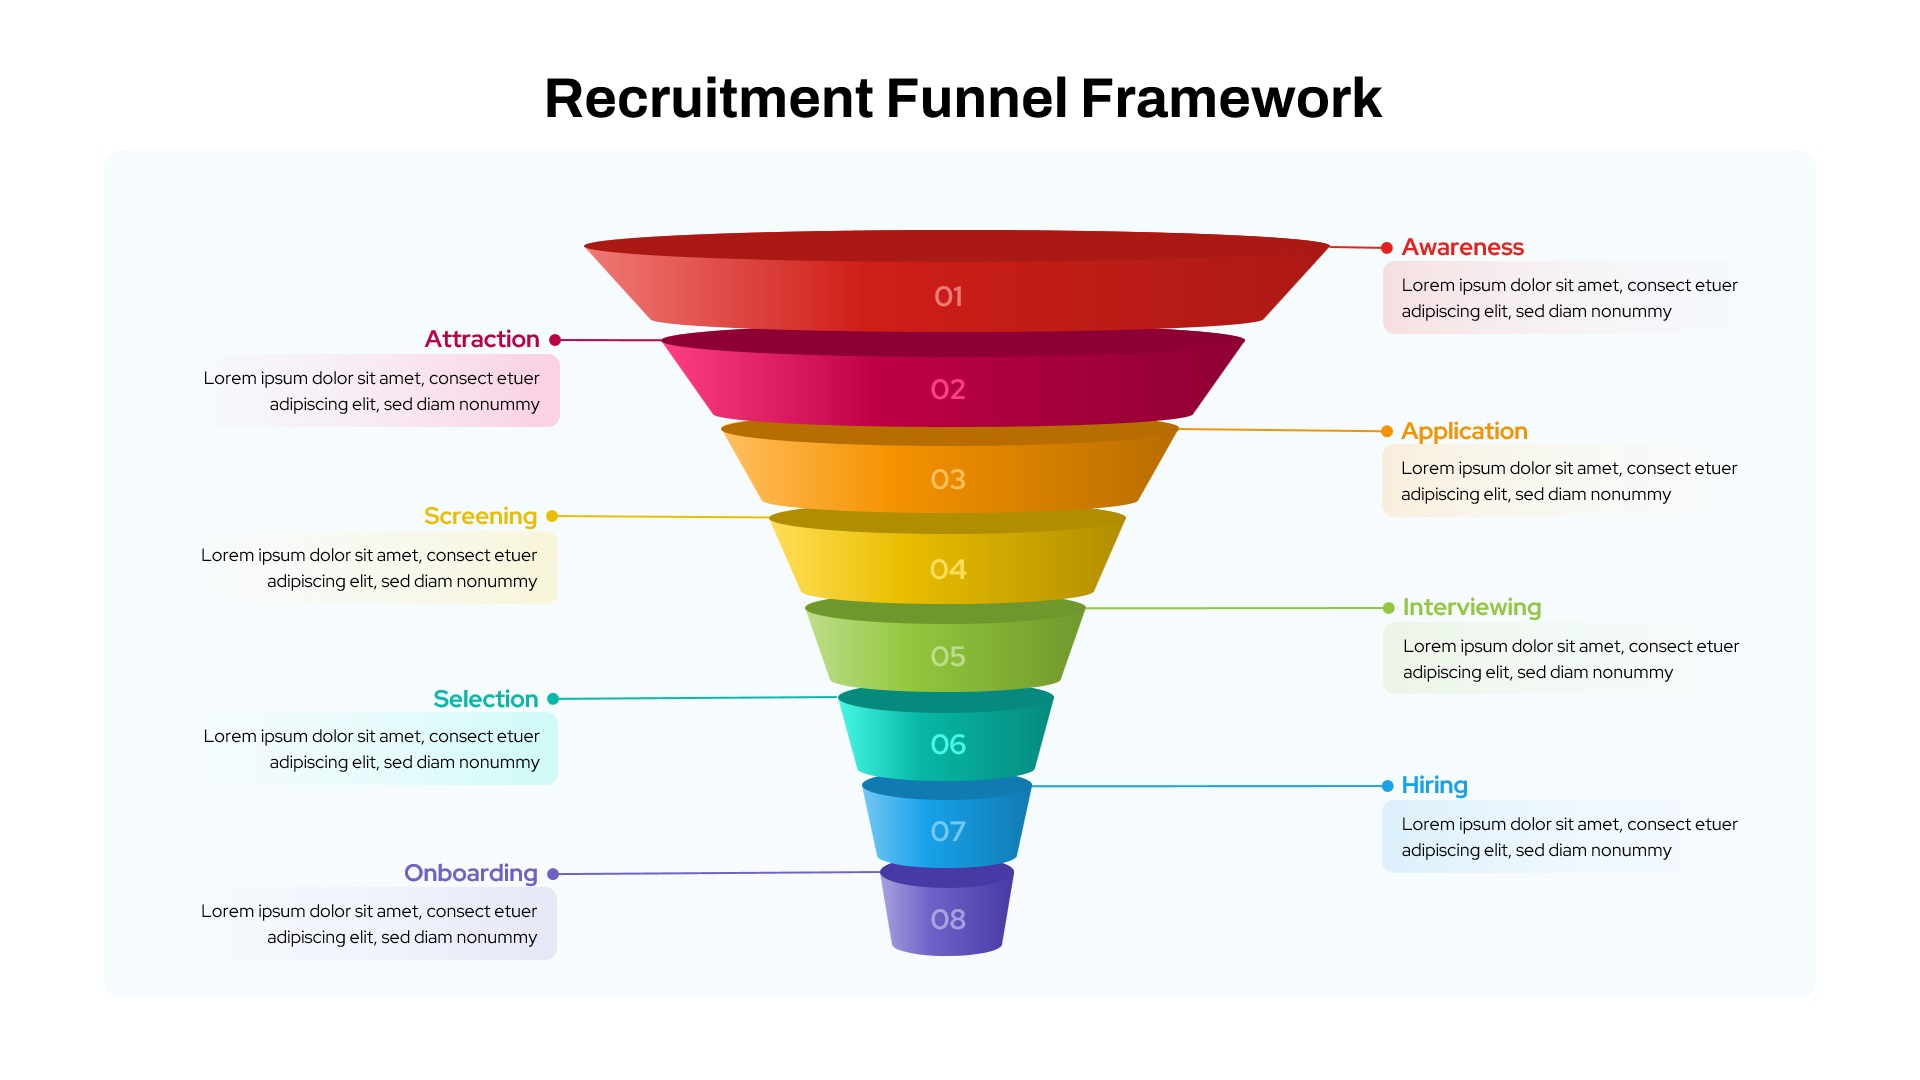
Recruitment Funnel Framework template for PowerPoint & Google Slides
Recruitment
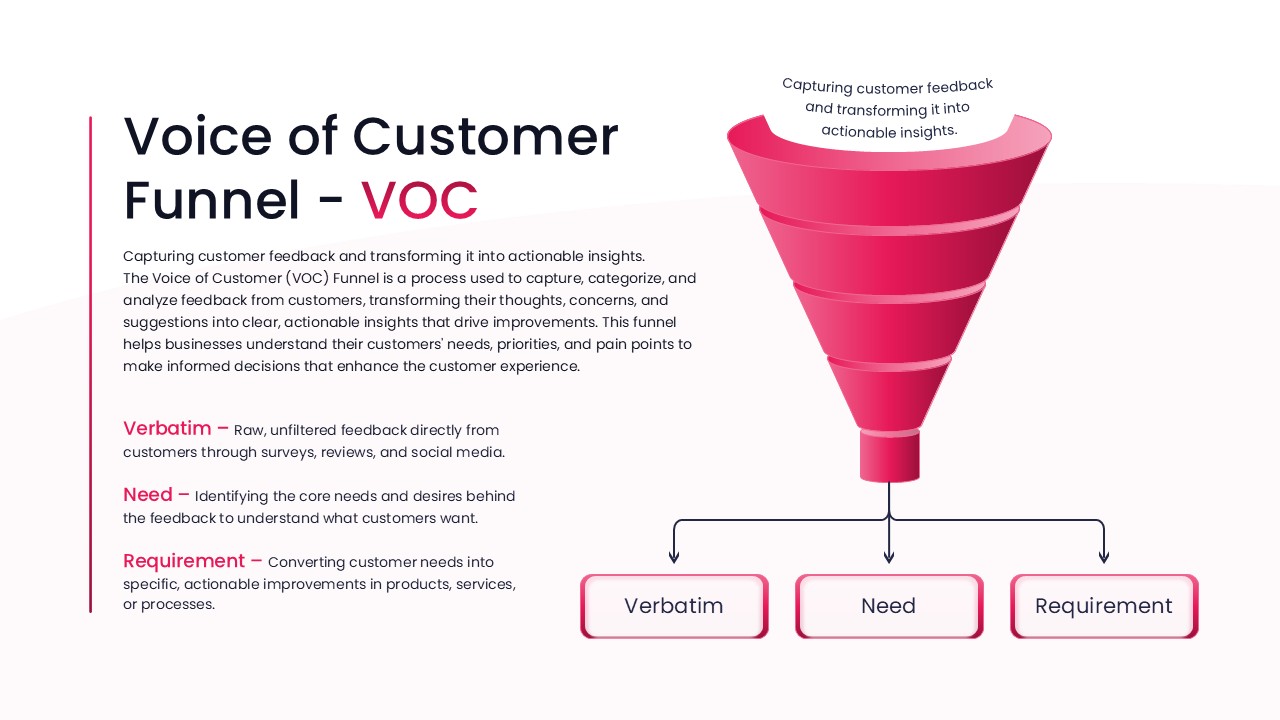
Voice of Customer Funnel (VOC) template for PowerPoint & Google Slides
Marketing
Pirate Metrics AARRR Funnel Framework Template for PowerPoint & Google Slides
Funnel
Funnel and Flywheel Thinking Comparison template for PowerPoint & Google Slides
Infographics
Project Management Funnel Template for PowerPoint & Google Slides
Funnel
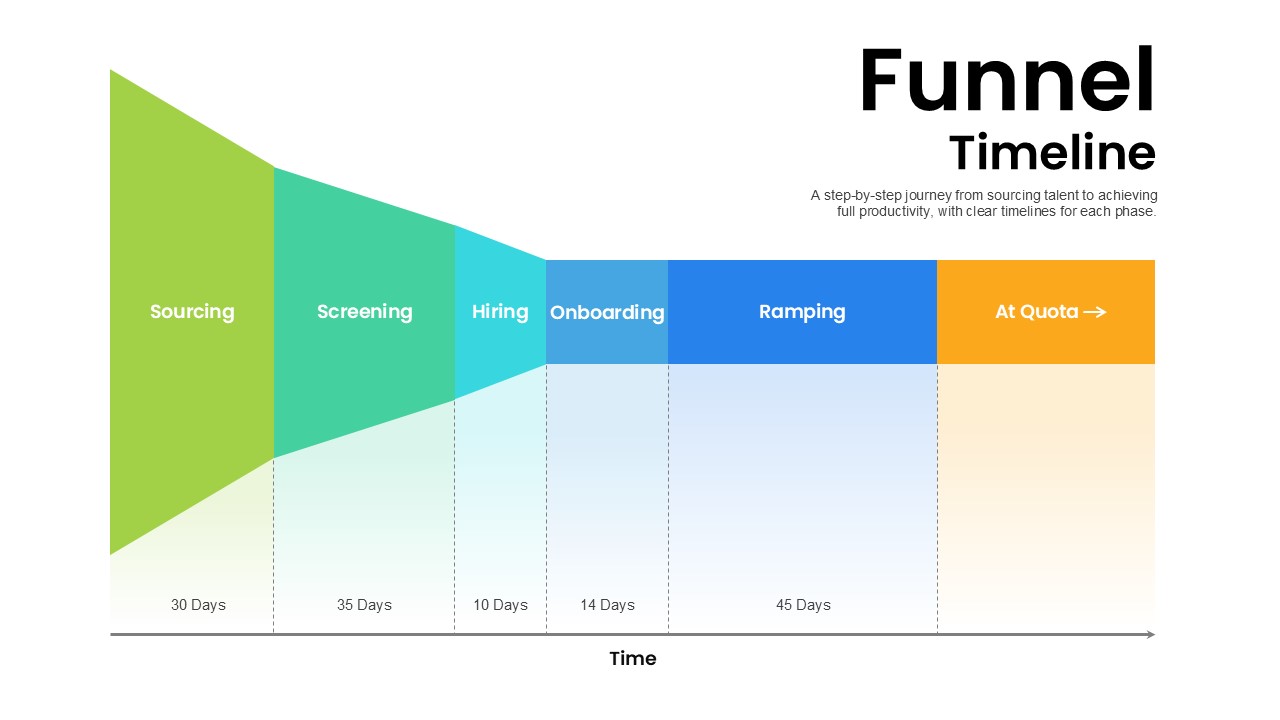
Hiring Funnel Timeline with Six Phases Template for PowerPoint & Google Slides
Recruitment
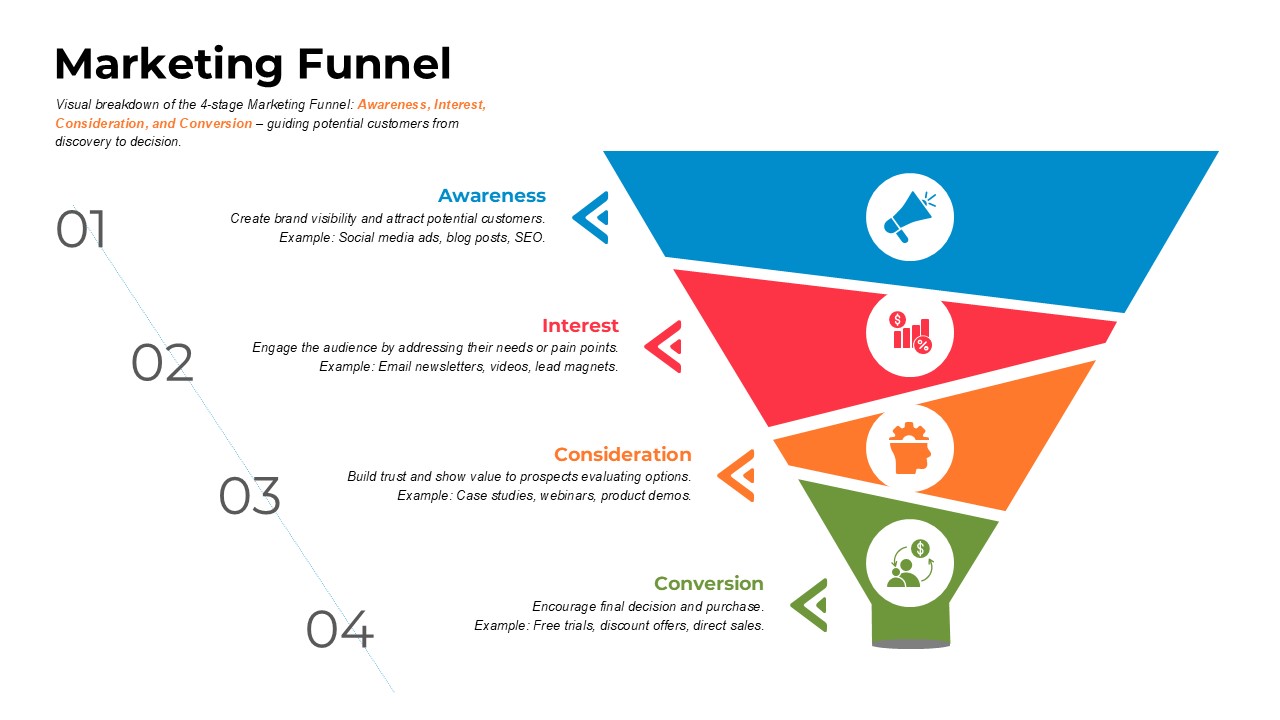
Four-Stage Marketing Funnel Template for PowerPoint & Google Slides
Marketing Funnel
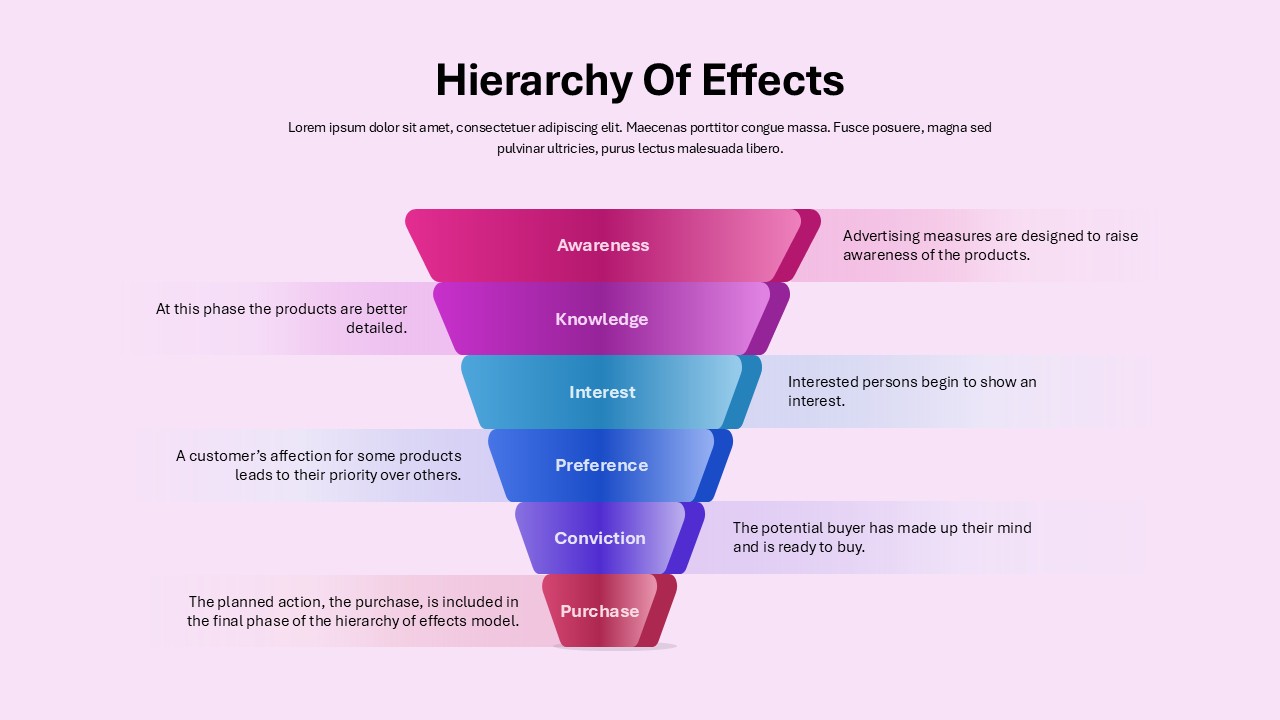
Marketing Funnel Hierarchy of Effects Template for PowerPoint & Google Slides
Marketing Funnel
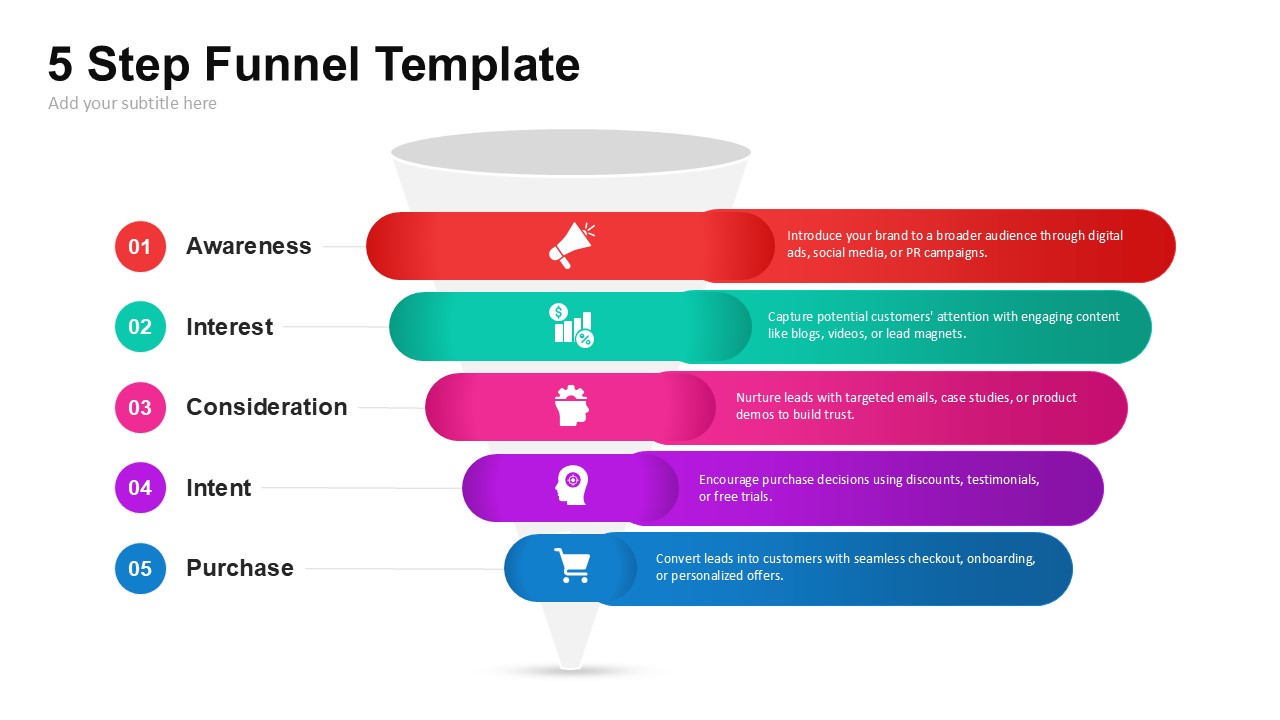
5-Step Marketing Funnel Template for PowerPoint & Google Slides
Marketing Funnel
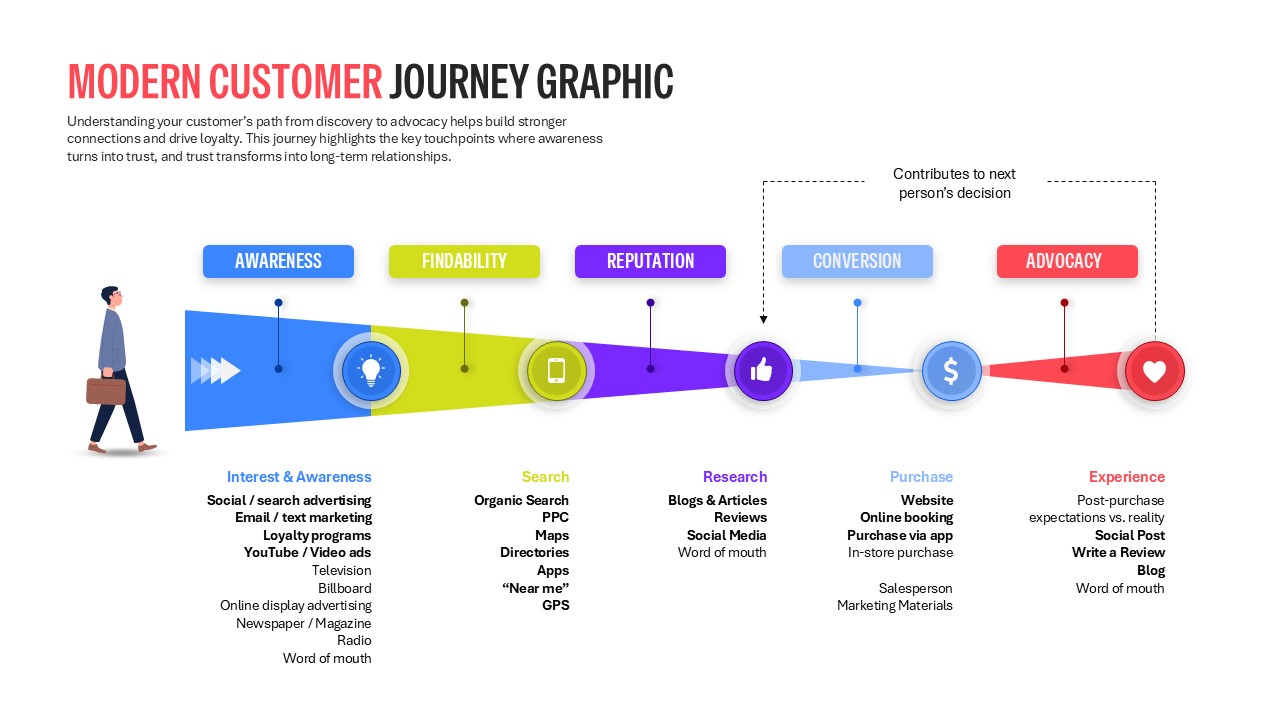
Modern Customer Journey Graphic Funnel Template for PowerPoint & Google Slides
Customer Journey
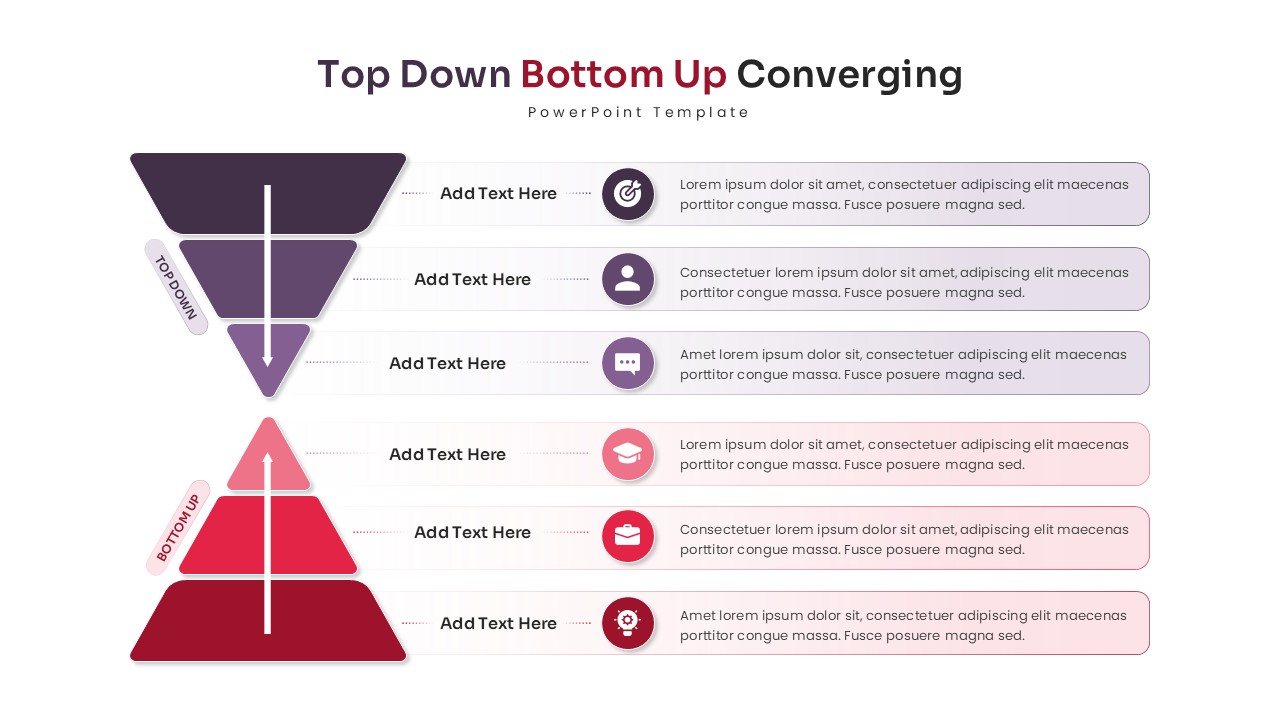
Top Down Bottom Up Converging Funnel for PowerPoint & Google Slides
Funnel
Gear Process Diagram PowerPoint Template for PowerPoint & Google Slides
Process
Six Hexagon Stages Process Flow Diagram Template for PowerPoint & Google Slides
Process
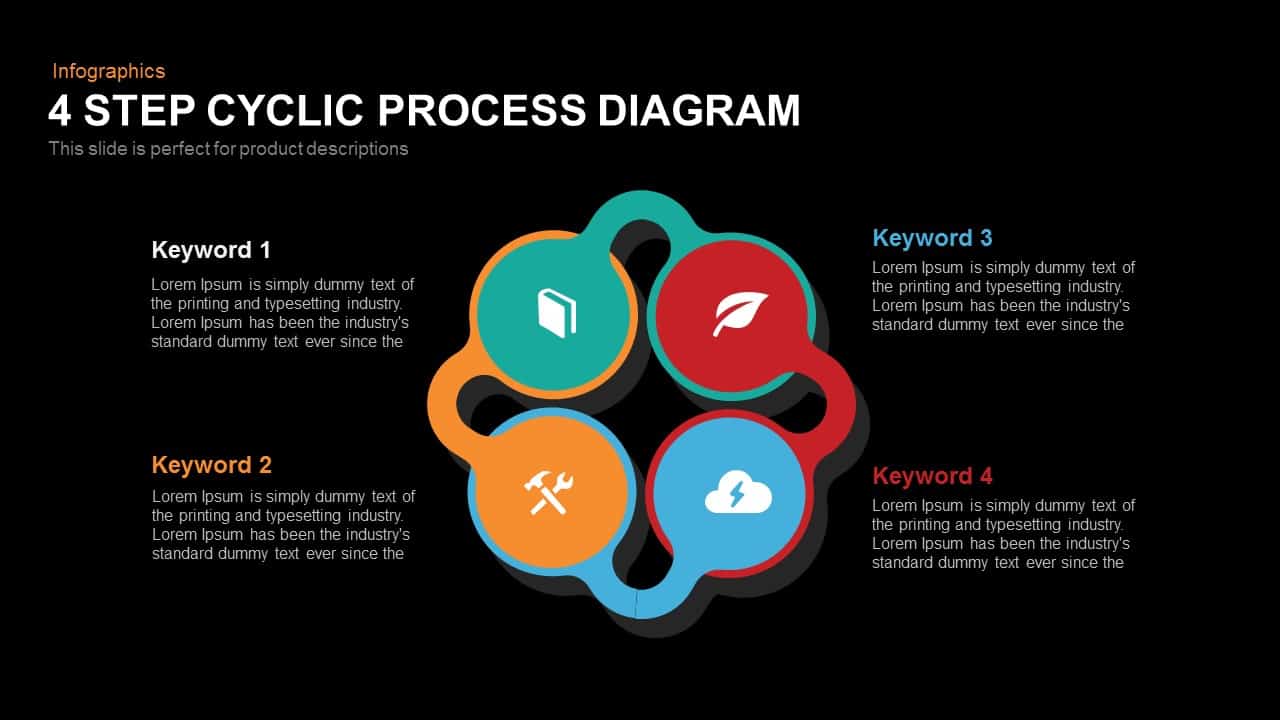
Modern 4-Step Cyclic Process Diagram Template for PowerPoint & Google Slides
Circular
Pie Segment Diagram Four-Step Process Template for PowerPoint & Google Slides
Pie/Donut
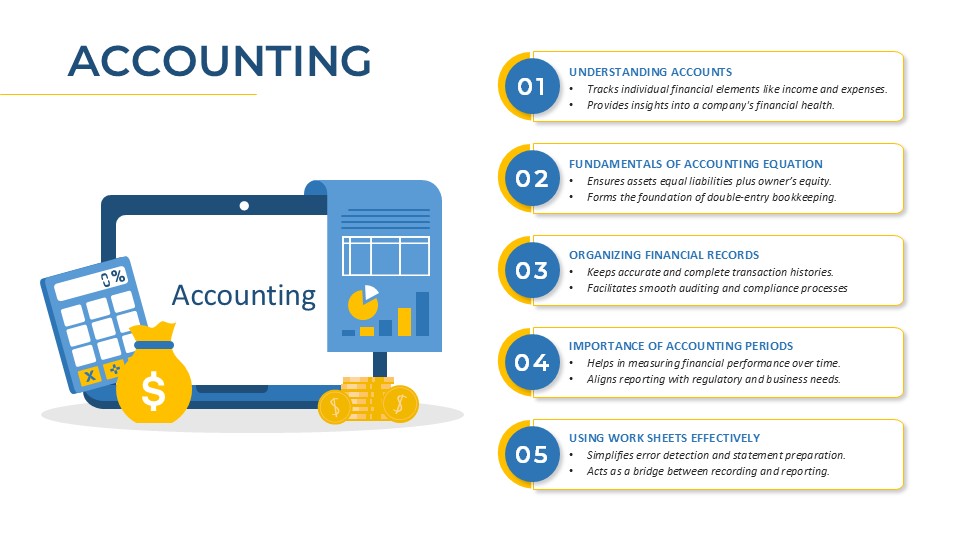
Accounting Process Metaphor Diagram Template for PowerPoint & Google Slides
Accounting
E-Waste Management Process Flow Diagram Template for PowerPoint & Google Slides
Process