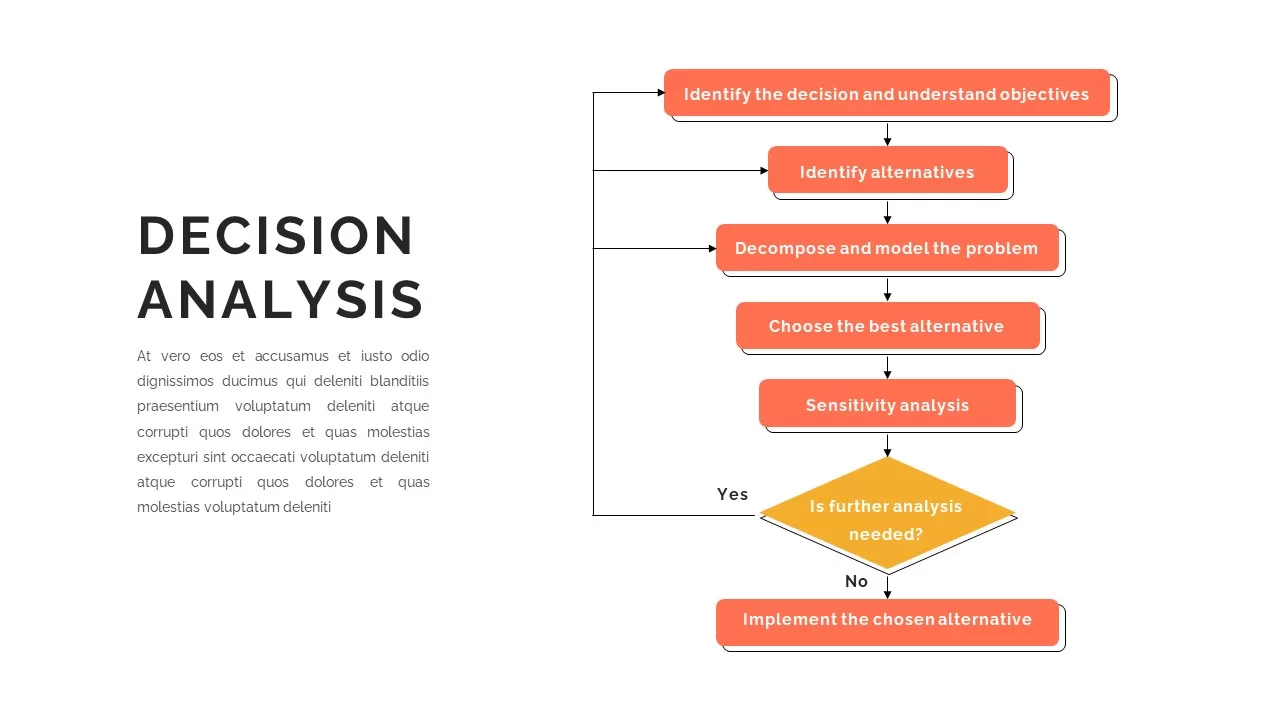
Decision Analysis Process Flowchart Template for PowerPoint & Google Slides
Description
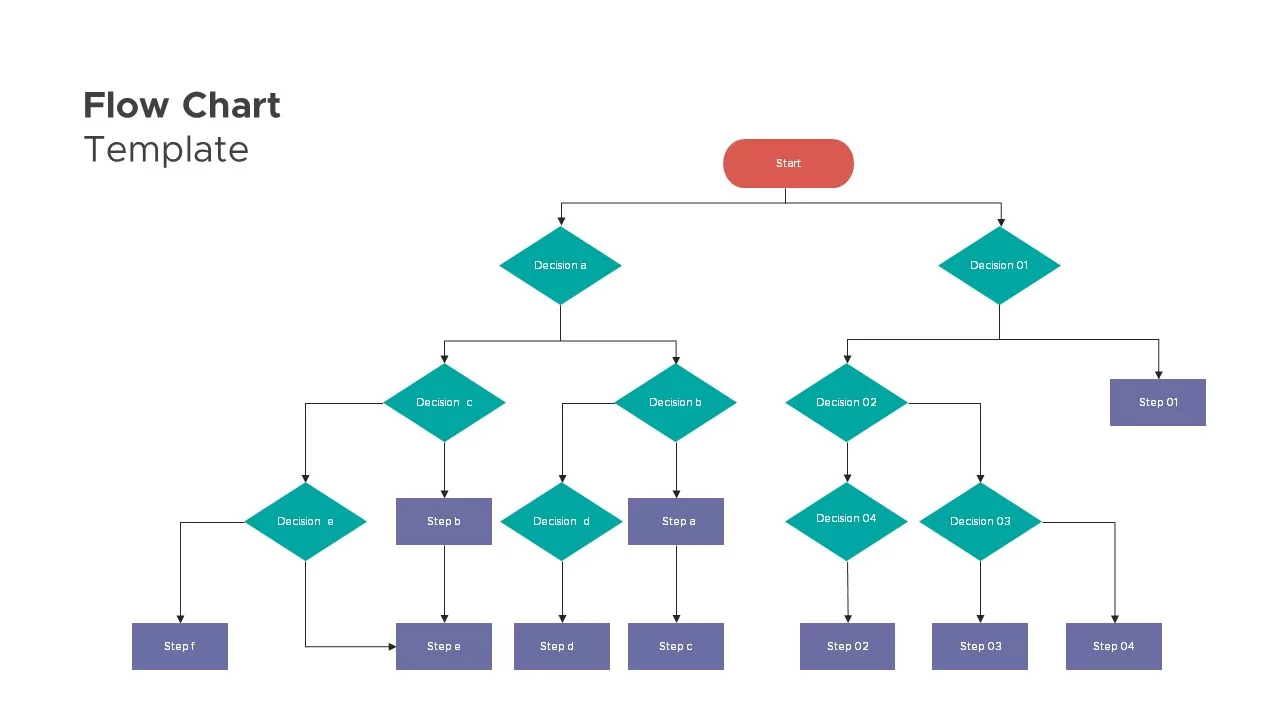
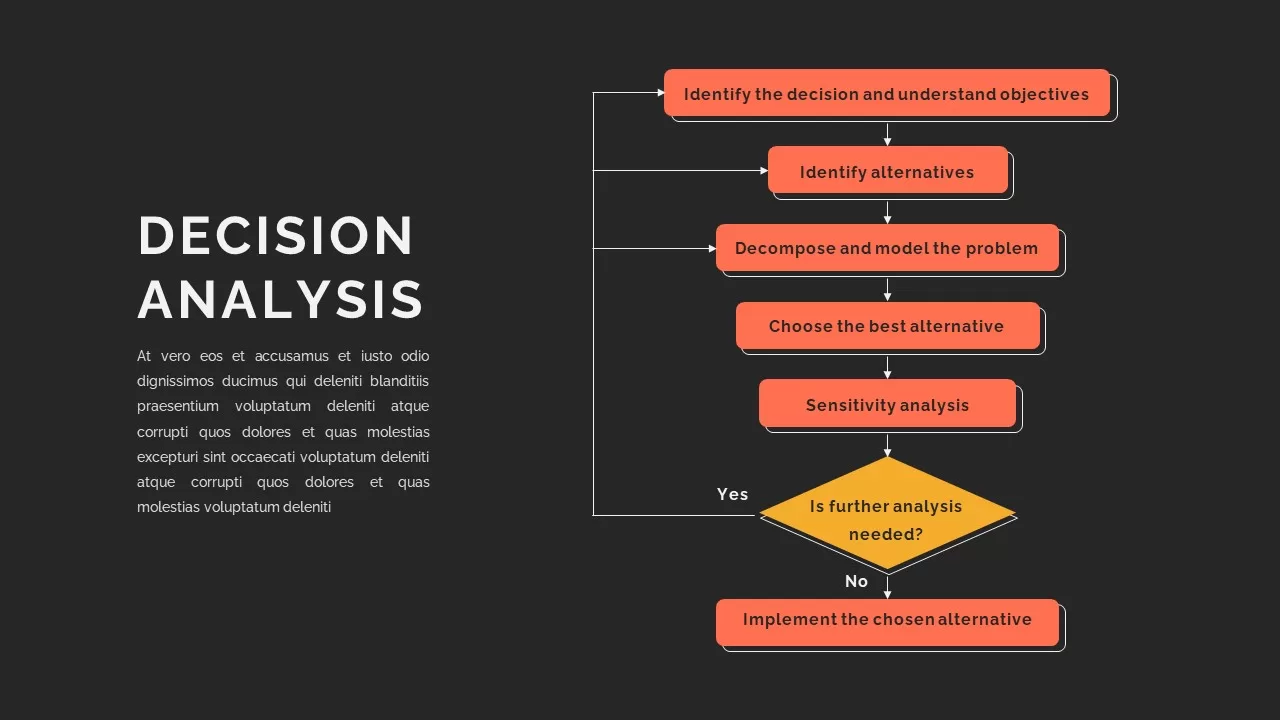
Visually dissect complex decision-making processes with this decision analysis flowchart template, designed to guide audiences through structured problem solving and evaluation steps with clarity and precision. A balanced layout features a bold left-hand title area, accompanying descriptive text, and a right-hand flowchart consisting of six coral-orange rounded rectangles and a vibrant yellow decision diamond linked by clean black arrows. The flow begins at “Identify the decision and understand objectives,” moves through “Identify alternatives,” “Decompose and model the problem,” “Choose the best alternative,” and “Sensitivity analysis,” before branching at the decision diamond to either loop back for further analysis or proceed to “Implement the chosen alternative.” Subtle drop shadows and minimal white-space usage ensure visual hierarchy and focus.
Built on fully editable master slides, this template empowers rapid customization: change shape colors to fit your corporate palette, update step titles and descriptive text in-line, or swap connector styles with drag-and-drop ease. Utilize auto-align guides and grouping features to maintain consistent spacing and alignments, even when reordering steps or adding new evaluation phases. Apply built-in animations to reveal each box sequentially, reinforcing narrative flow and audience engagement.
Optimized for both PowerPoint and Google Slides, this slide preserves formatting, alignment, and animation presets across platforms, eliminating cross-application compatibility issues. High-resolution vector assets ensure crisp display on projectors, large-format displays, and remote-call screens. Whether you’re training team members on analytical frameworks, presenting cost-benefit analyses, or facilitating strategic decision workshops, this flowchart adapts seamlessly to diverse contexts.
Enhance stakeholder understanding, accelerate consensus building, and streamline communication of critical choices. Leverage this decision analysis flowchart to illustrate structured problem solving, risk assessment loops, and implementation roadmaps, making complex methodologies accessible and actionable for executives, project managers, consultants, and academic audiences.
Who is it for
Corporate strategists, management consultants, and project managers will find this flowchart ideal for mapping analytical frameworks, facilitating decision workshops, and presenting structured evaluation steps. Business analysts, academic instructors, and training facilitators can also leverage this slide to teach problem-solving methodologies or model risk-assessment processes.
Other Uses
Repurpose this layout to illustrate quality-assurance workflows, project-approval processes, or root-cause analysis steps. Use the decision diamond to represent go/no-go checkpoints in product development, risk management, or compliance reviews. The modular design lets you expand or simplify the flow to suit any analytical scenario.
Login to download this file

Item ID
SB02297
Related Templates

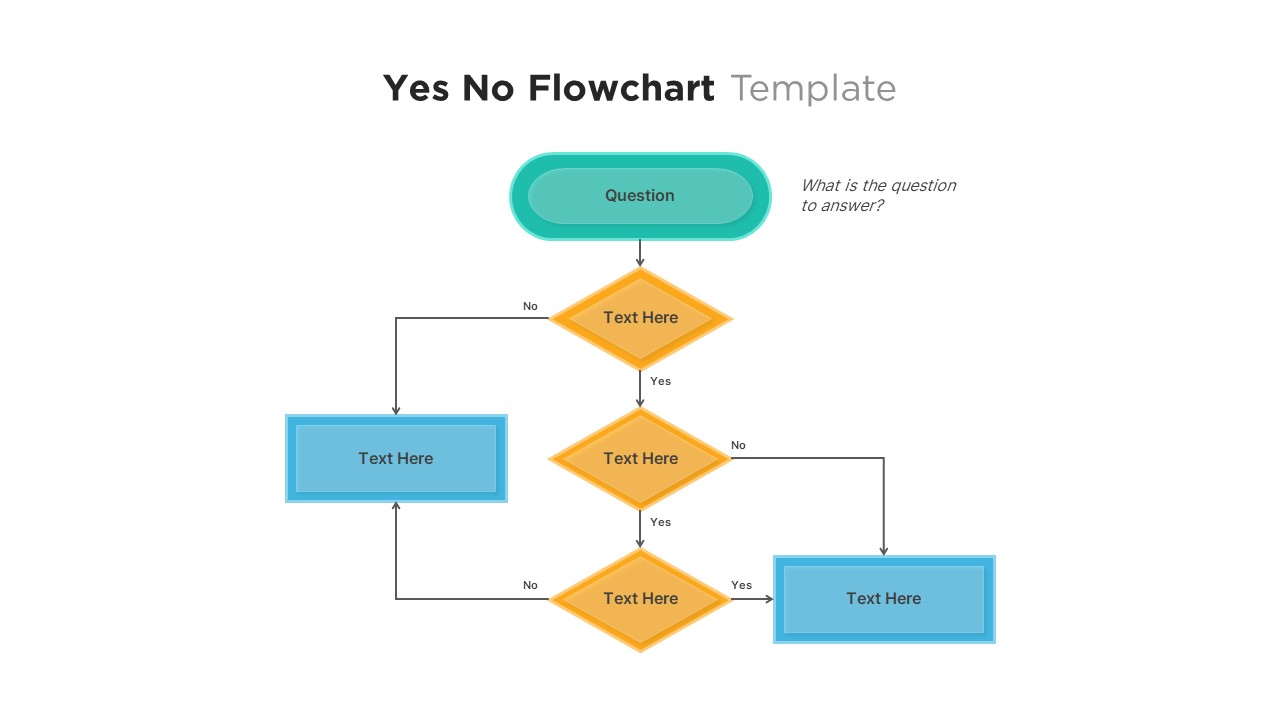
Professional Yes No Decision Flowchart Template for PowerPoint & Google Slides
Flow Charts
Three-Step Flowchart Process Diagram Template for PowerPoint & Google Slides
Flow Charts
Simple Flowchart Process Diagram Template for PowerPoint & Google Slides
Flow Charts
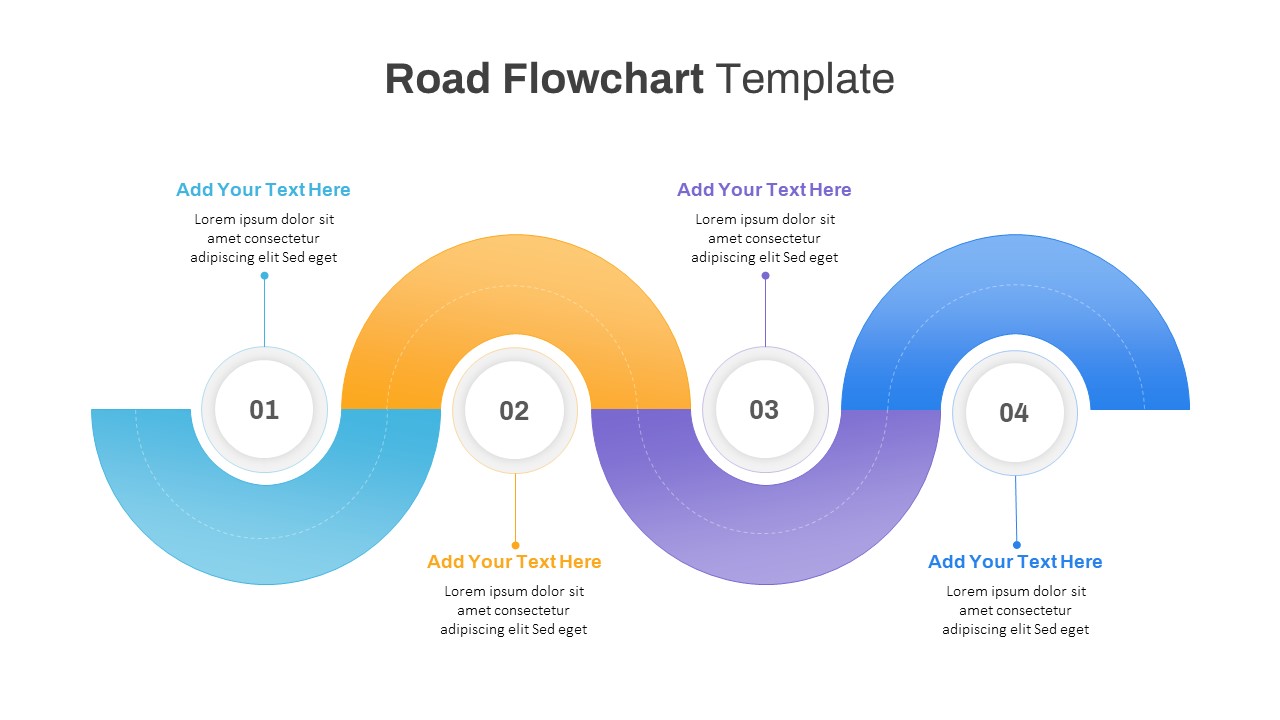
Road Flowchart Process with Four Steps Template for PowerPoint & Google Slides
Flow Charts
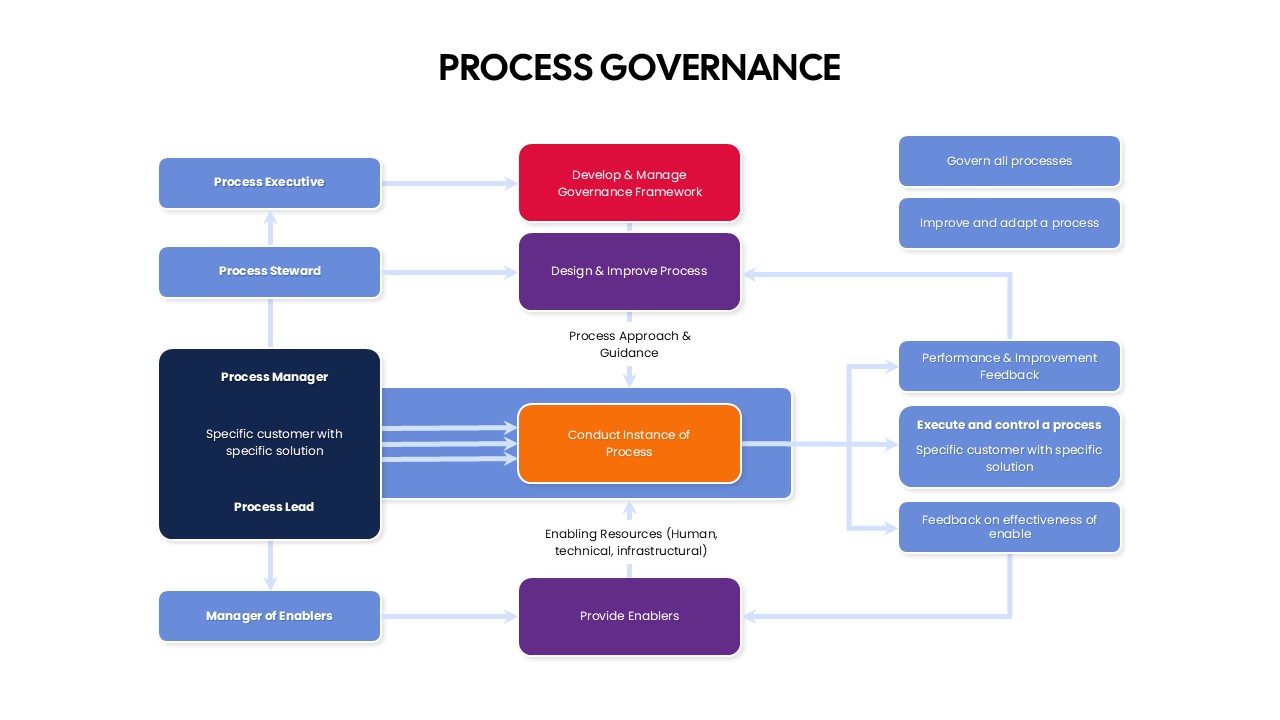
Process Governance Framework Flowchart Template for PowerPoint & Google Slides
Flow Charts
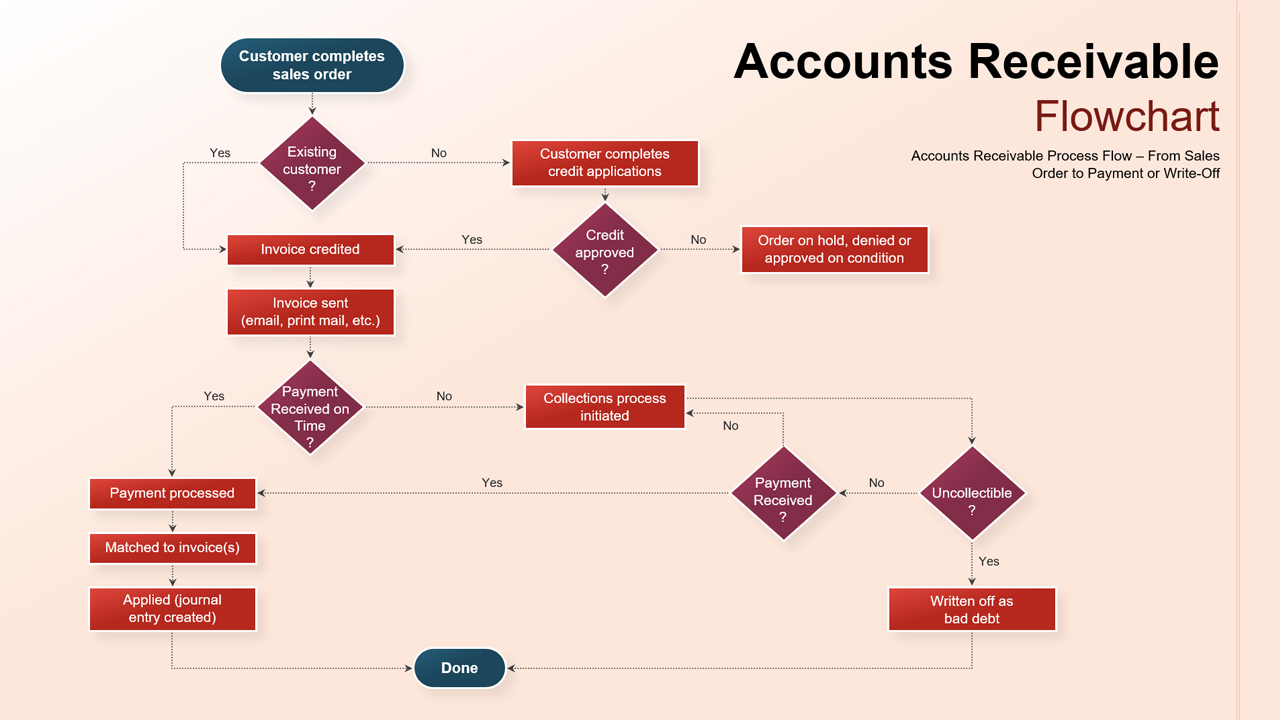
Accounts Receivable Process Flowchart Template for PowerPoint & Google Slides
Flow Charts
Three-Way Decision Process Arrow Diagram Template for PowerPoint & Google Slides
Arrow
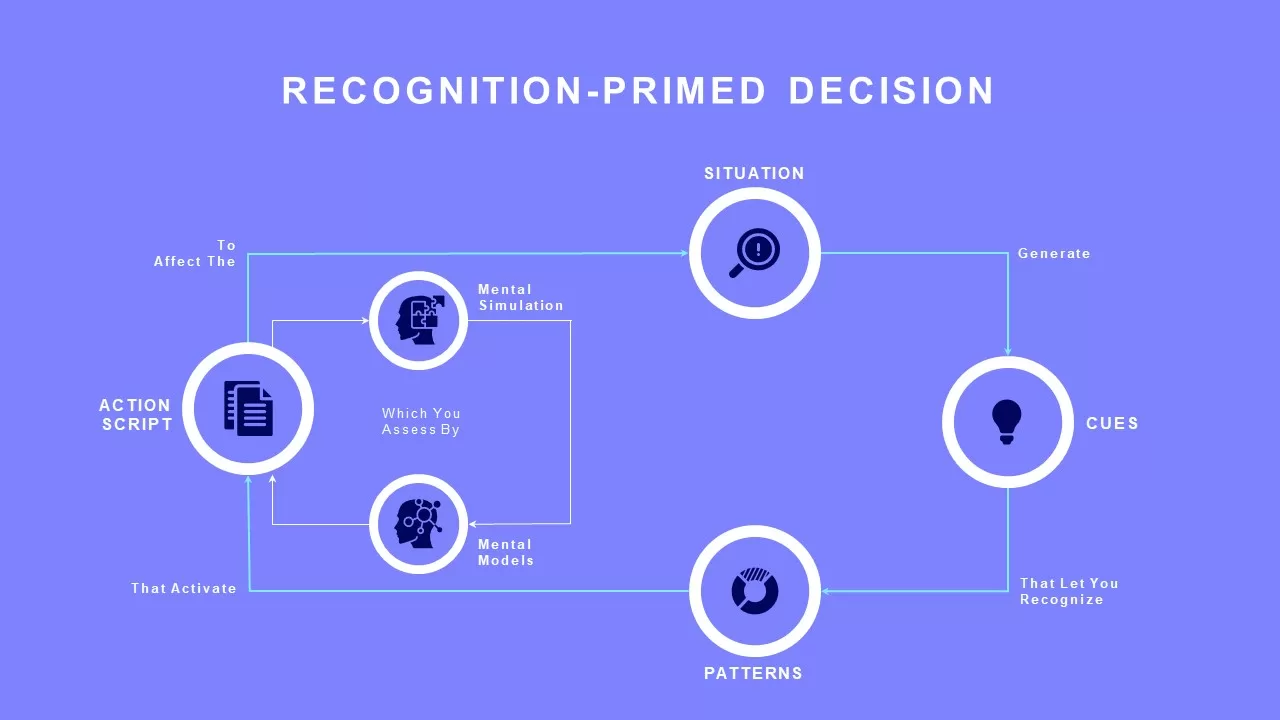
Recognition-Primed Decision Process Flow Template for PowerPoint & Google Slides
Flow Charts
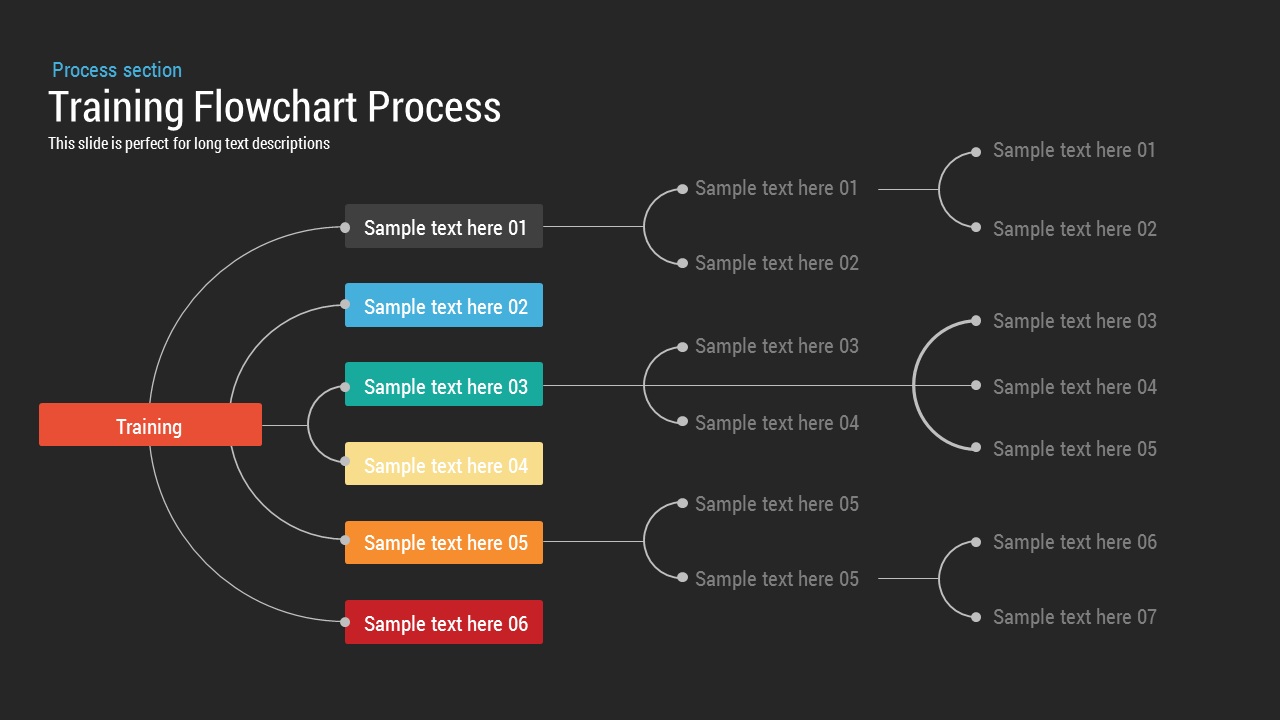
Training Flowchart template for PowerPoint & Google Slides
Flow Charts
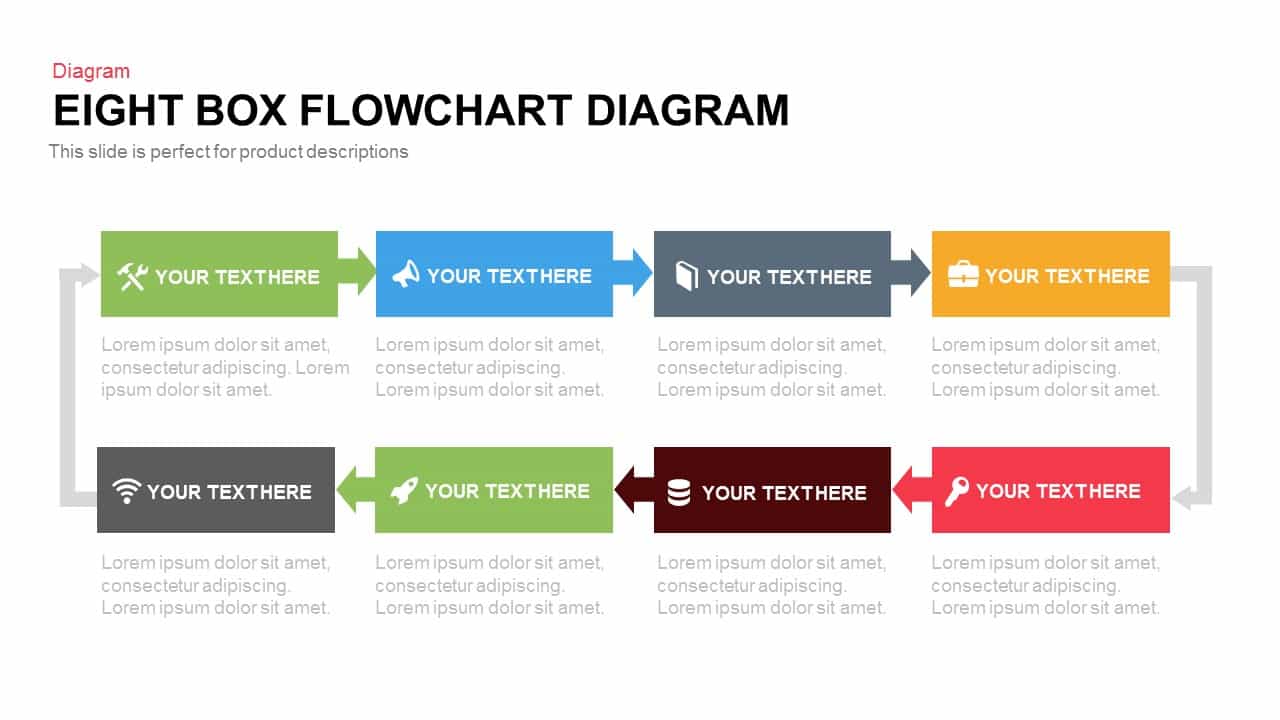
Eight Box Flowchart template for PowerPoint & Google Slides
Flow Charts

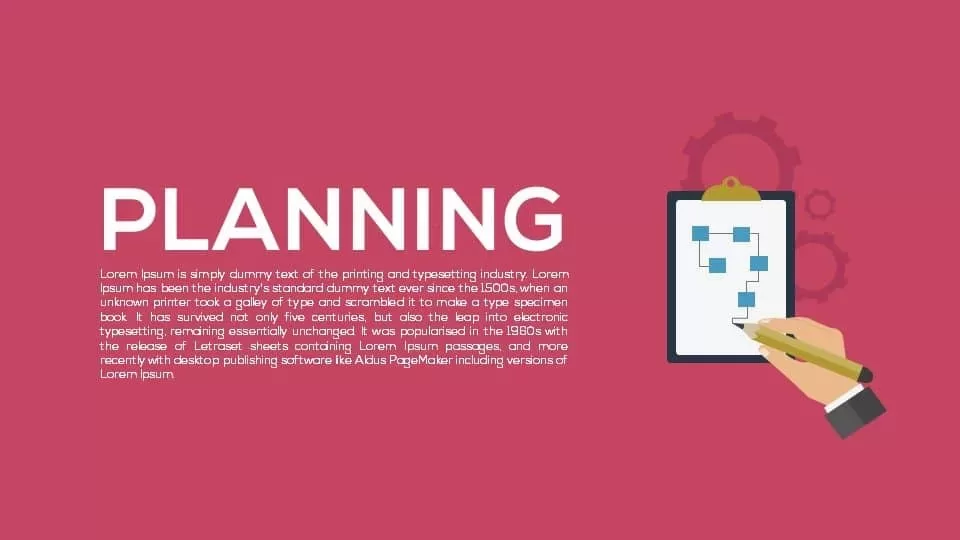
Planning Metaphor Flowchart Slide Template for PowerPoint & Google Slides
Process
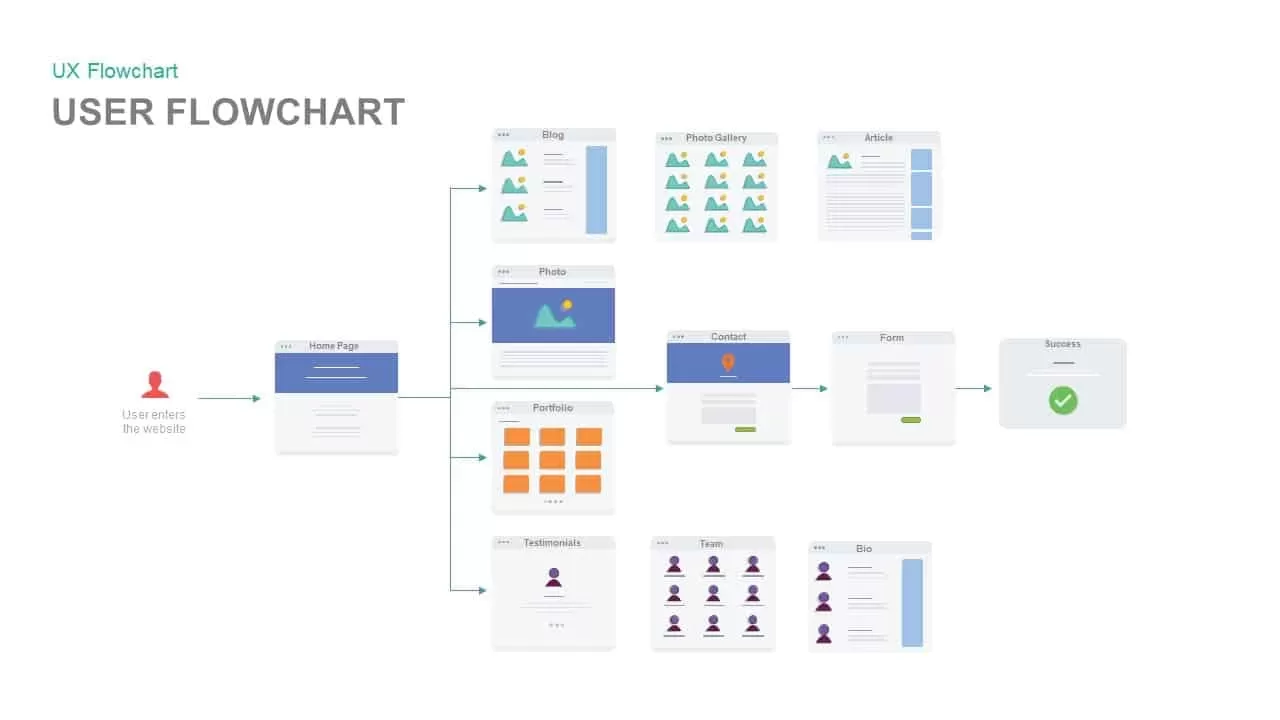
Website User Flowchart Diagram Template for PowerPoint & Google Slides
Process

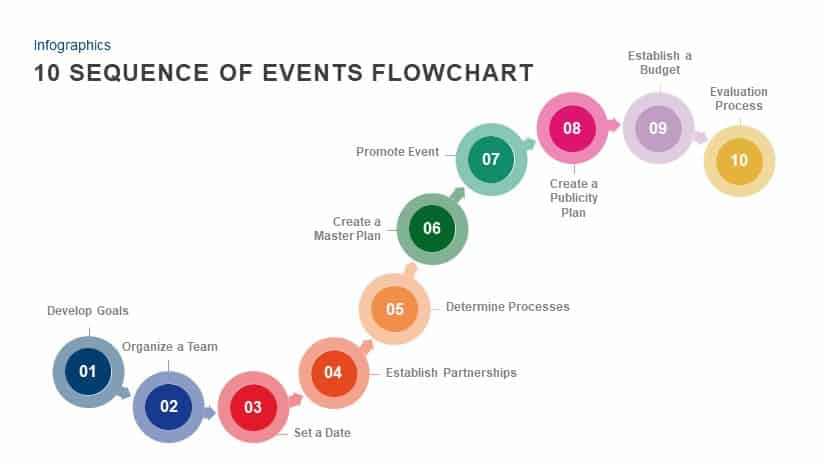
10 Sequence of Events Flowchart template for PowerPoint & Google Slides
Flow Charts
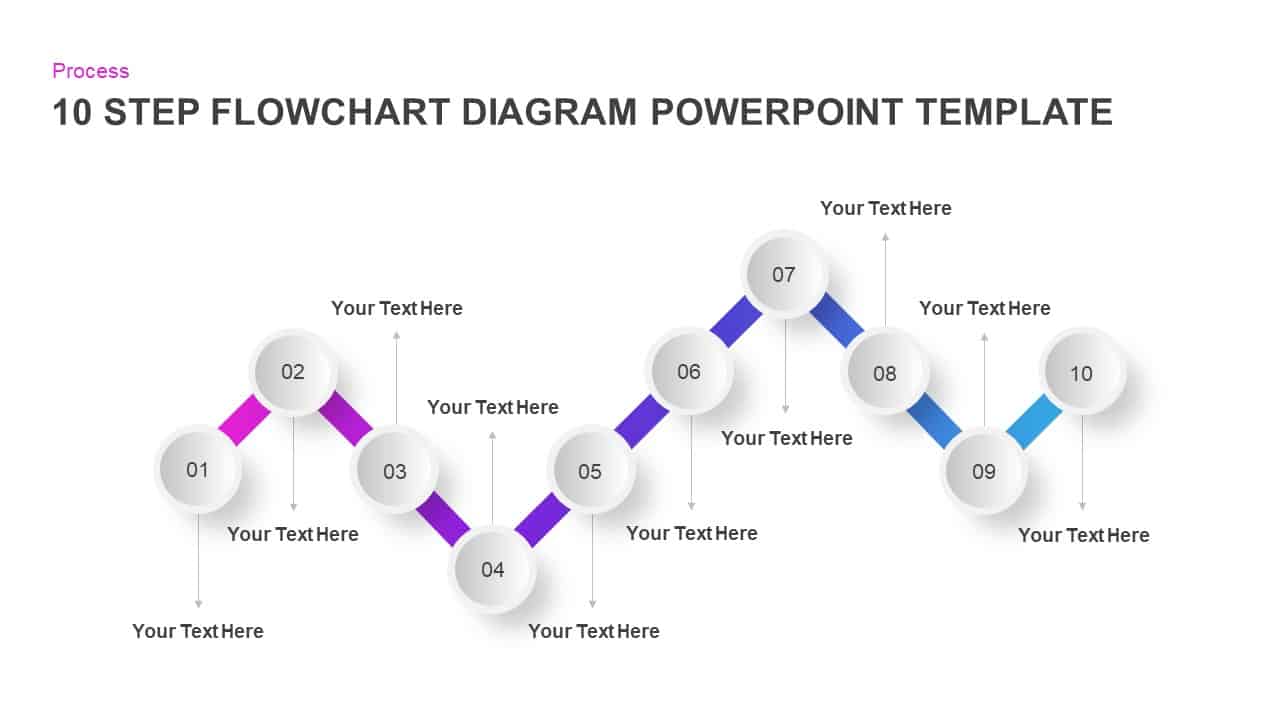
Gradient Ten-Step Flowchart Diagram Template for PowerPoint & Google Slides
Process
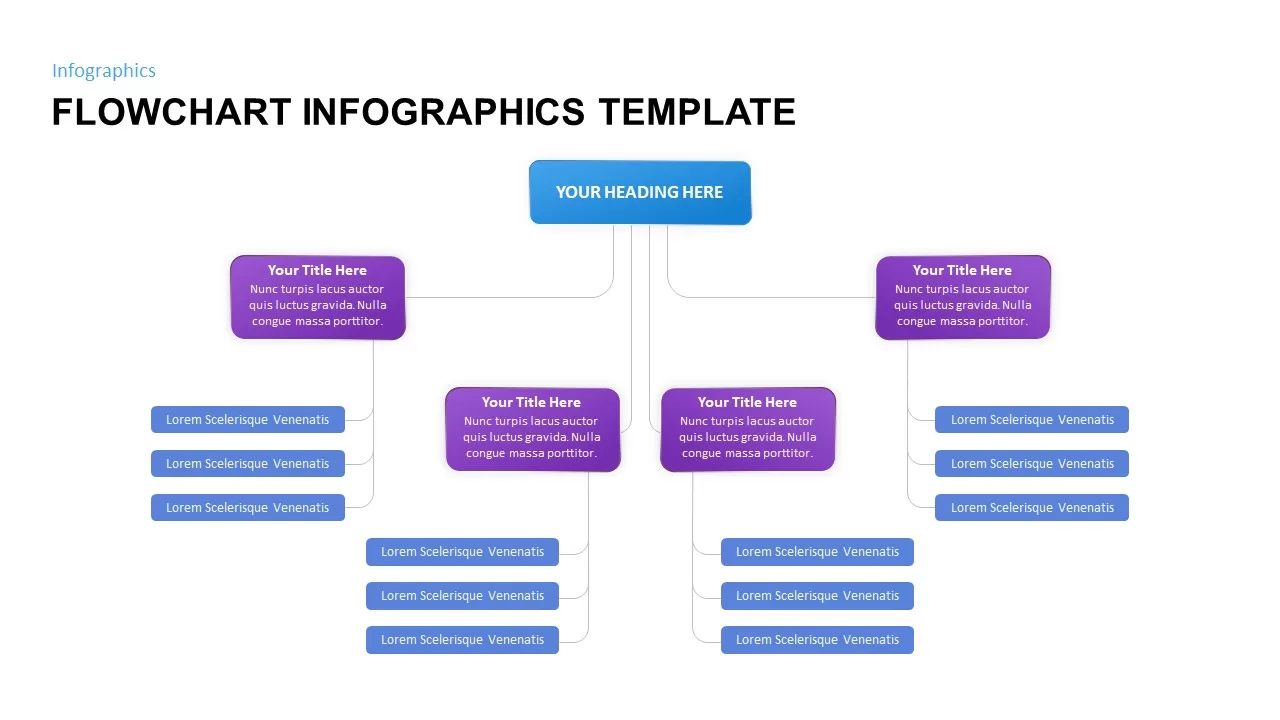
Flowchart Infographics Template for PowerPoint & Google Slides
Infographics
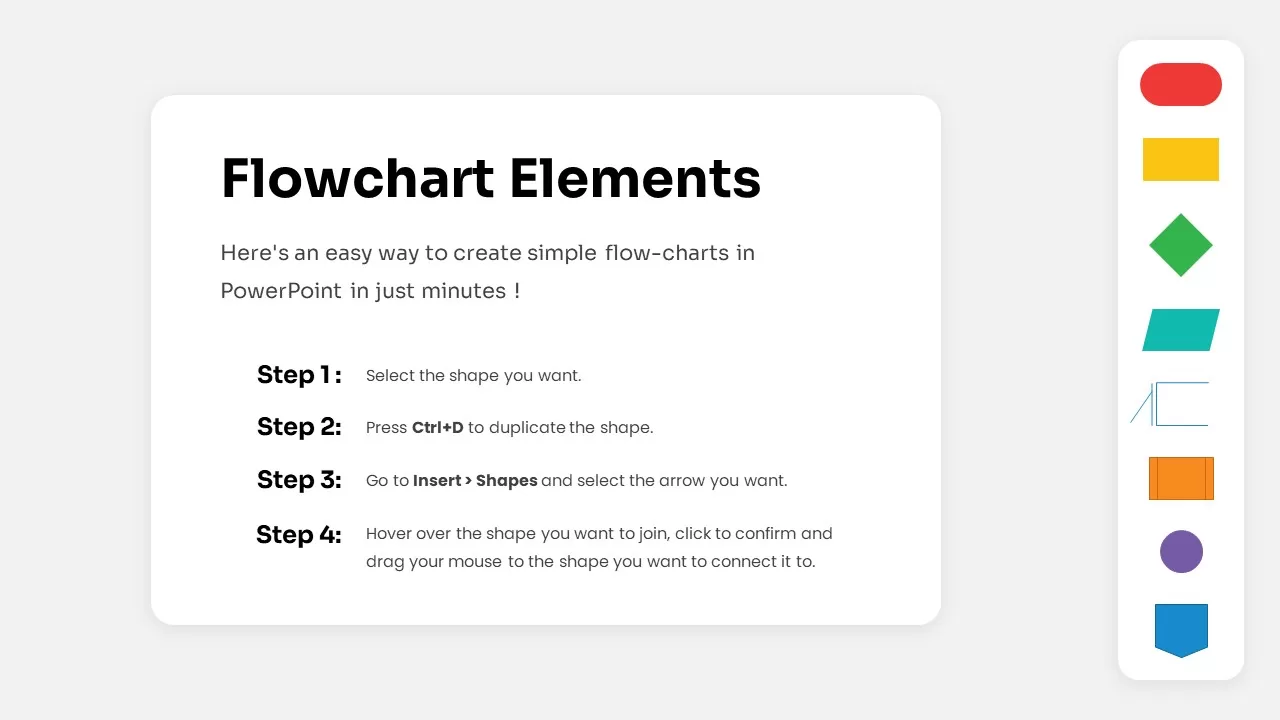
Free Flowchart Elements Tutorial Slide Template for PowerPoint & Google Slides
Flow Charts
Free
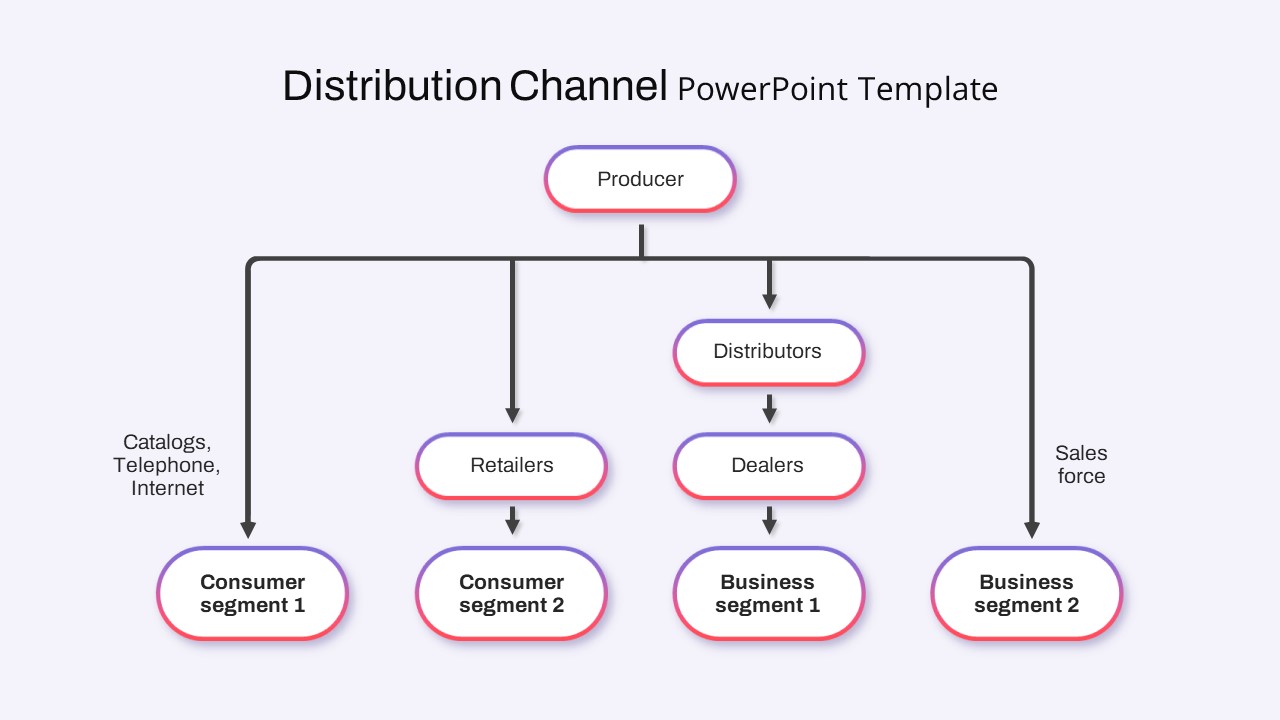
Distribution Channel Flowchart Template for PowerPoint & Google Slides
Business Models
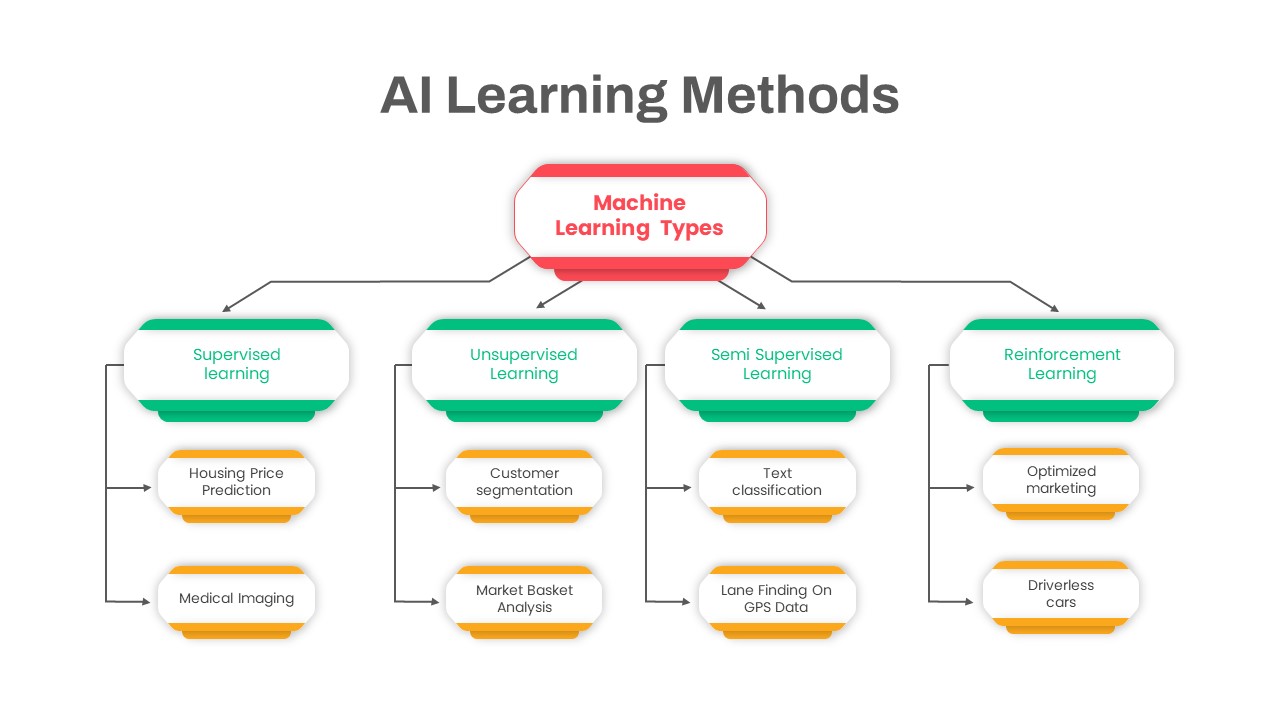
AI Learning Methods Flowchart Diagram Template for PowerPoint & Google Slides
Flow Charts
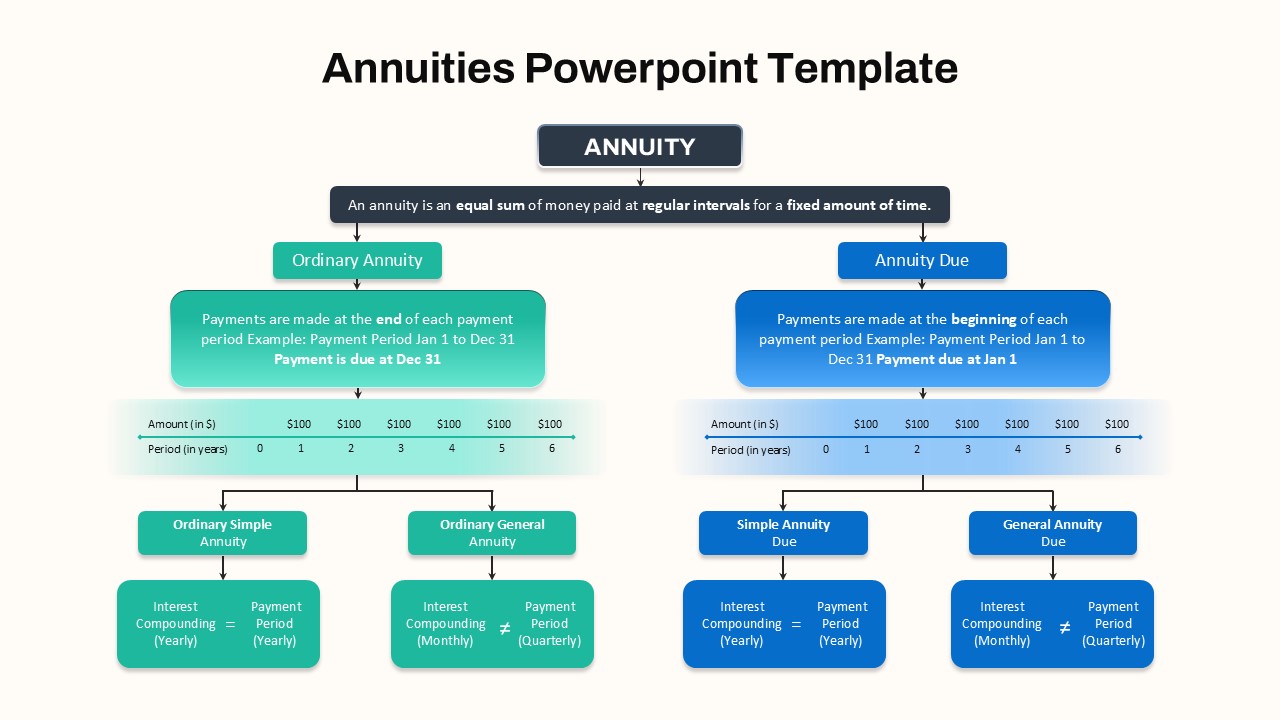
Hierarchical Annuity Comparison Flowchart Template for PowerPoint & Google Slides
Business Report
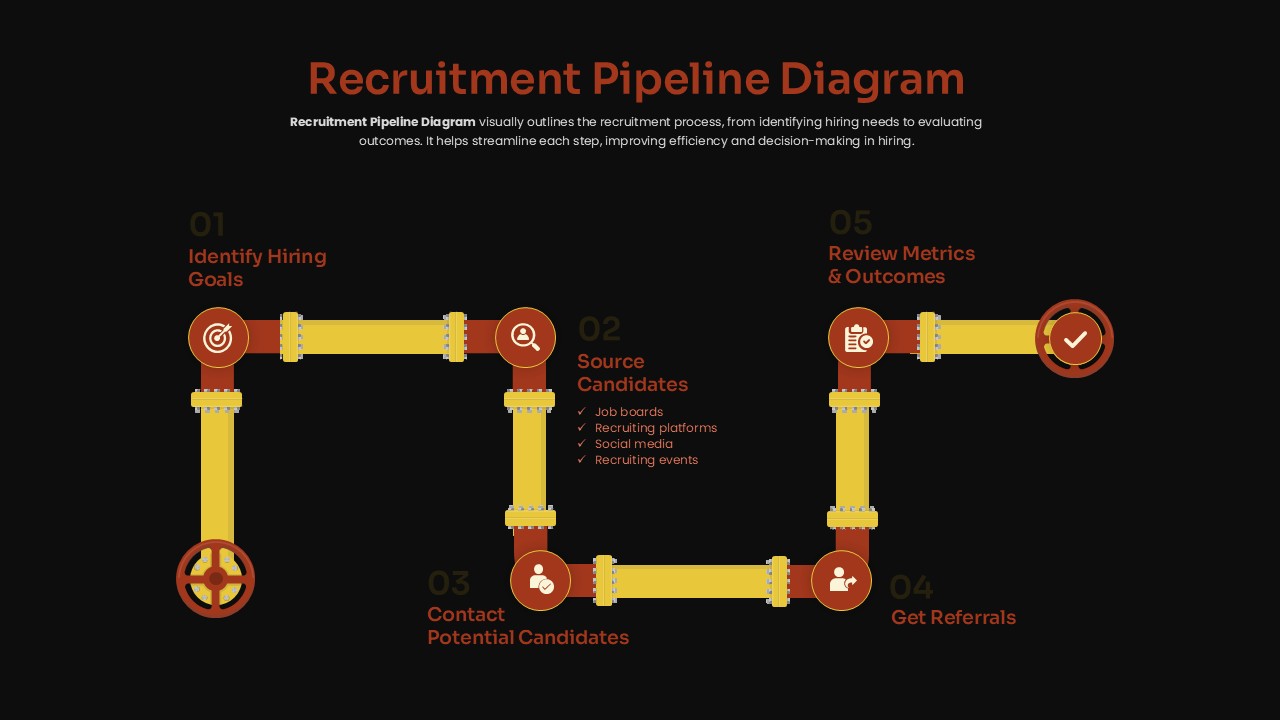
Recruitment Pipeline Flowchart Diagram Template for PowerPoint & Google Slides
Process
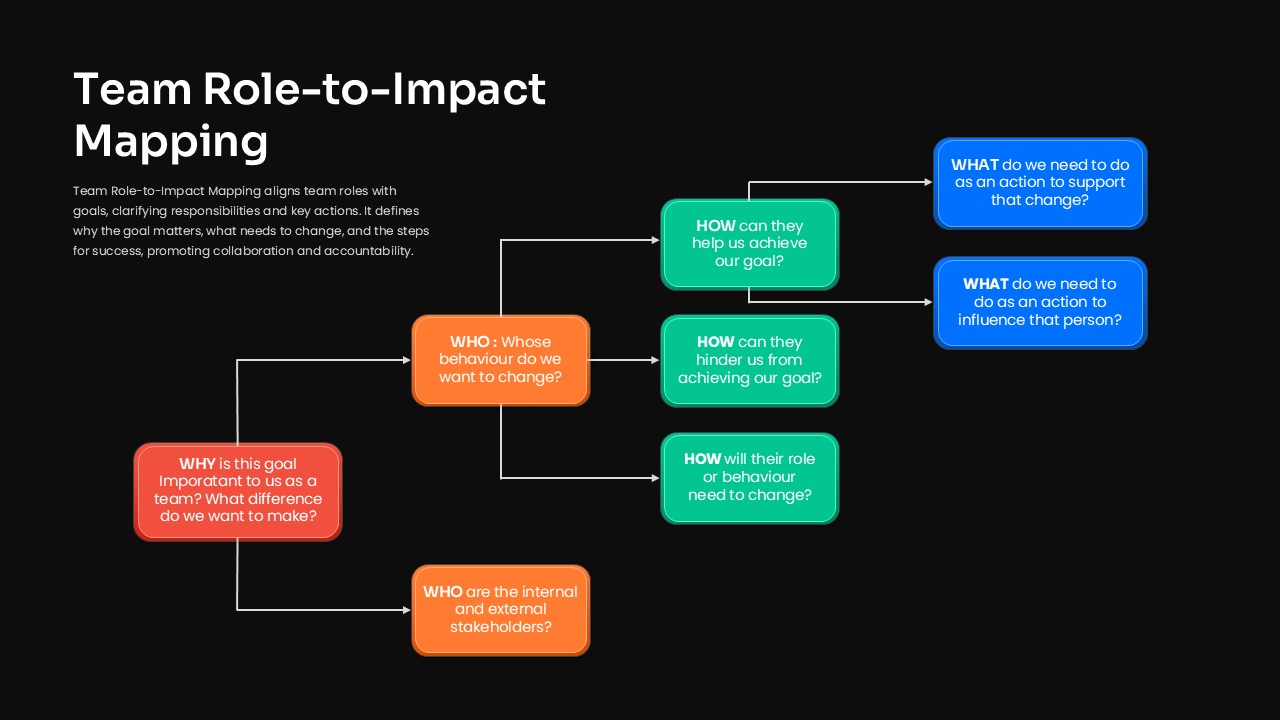
Team Role-to-Impact Mapping Flowchart Template for PowerPoint & Google Slides
Process
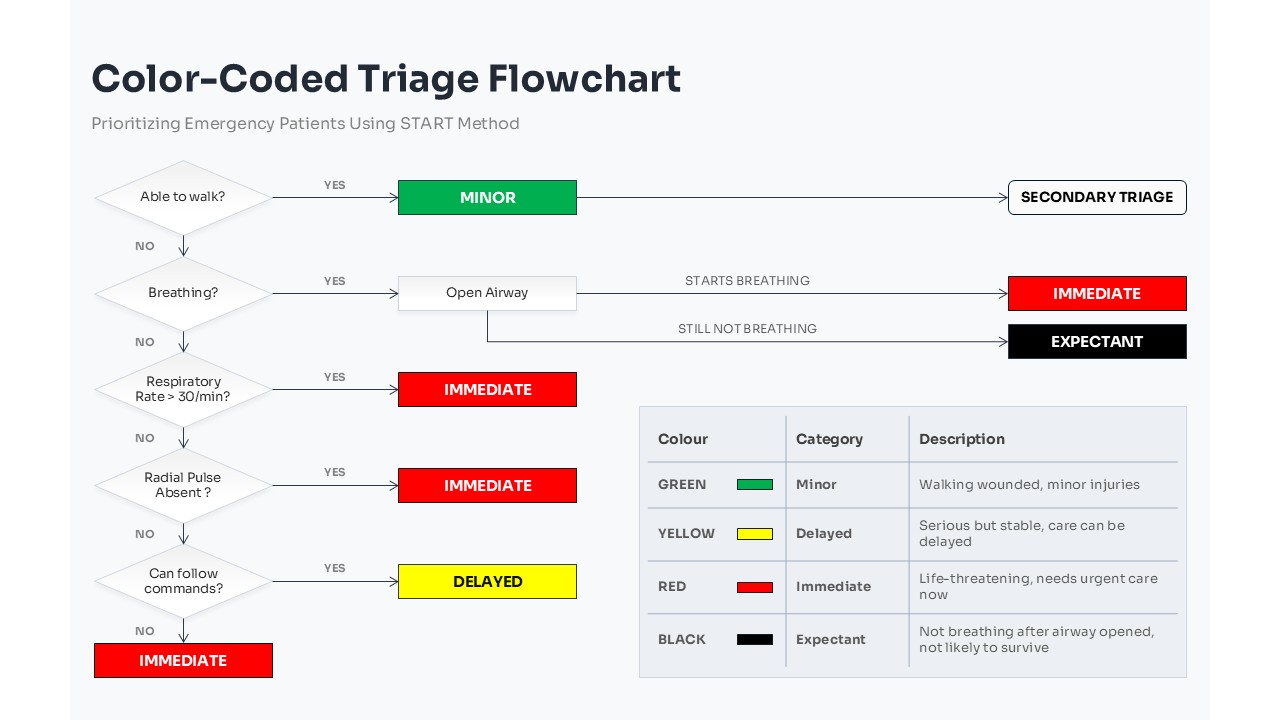
Color-Coded Medical Triage Flowchart Template for PowerPoint & Google Slides
Flow Charts
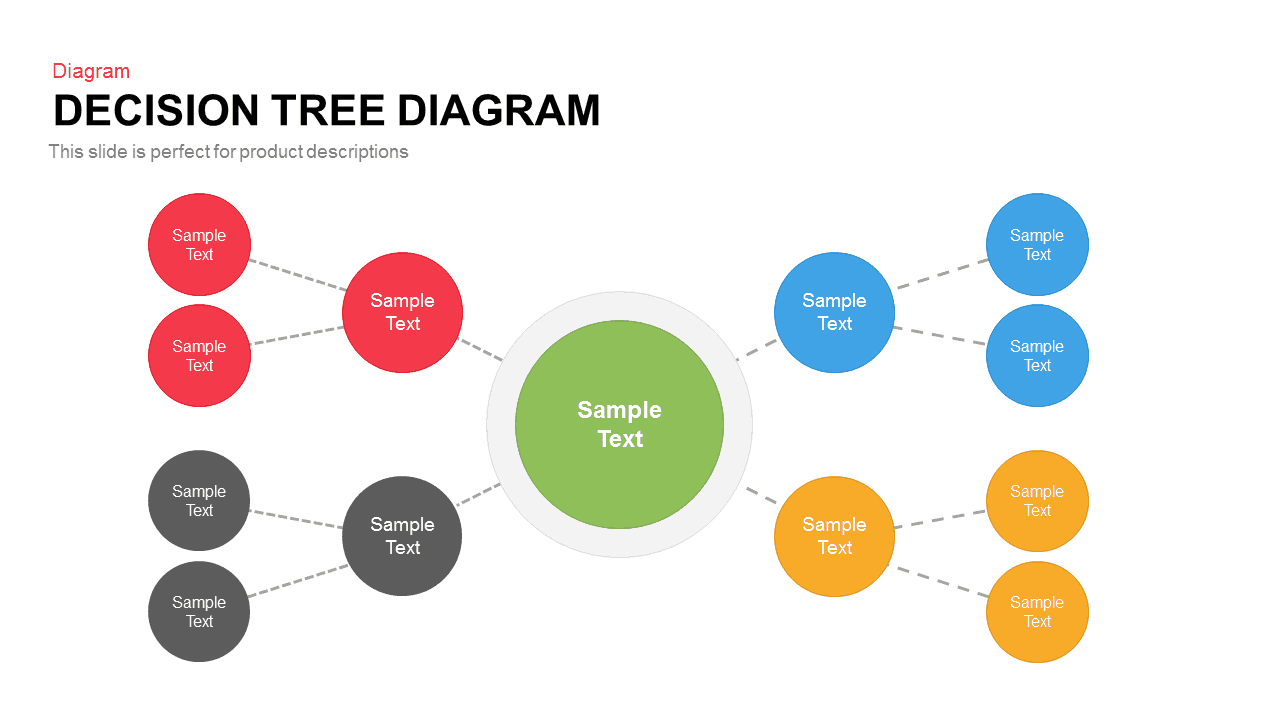
Colorful Decision Tree Diagram template for PowerPoint & Google Slides
Decision Tree
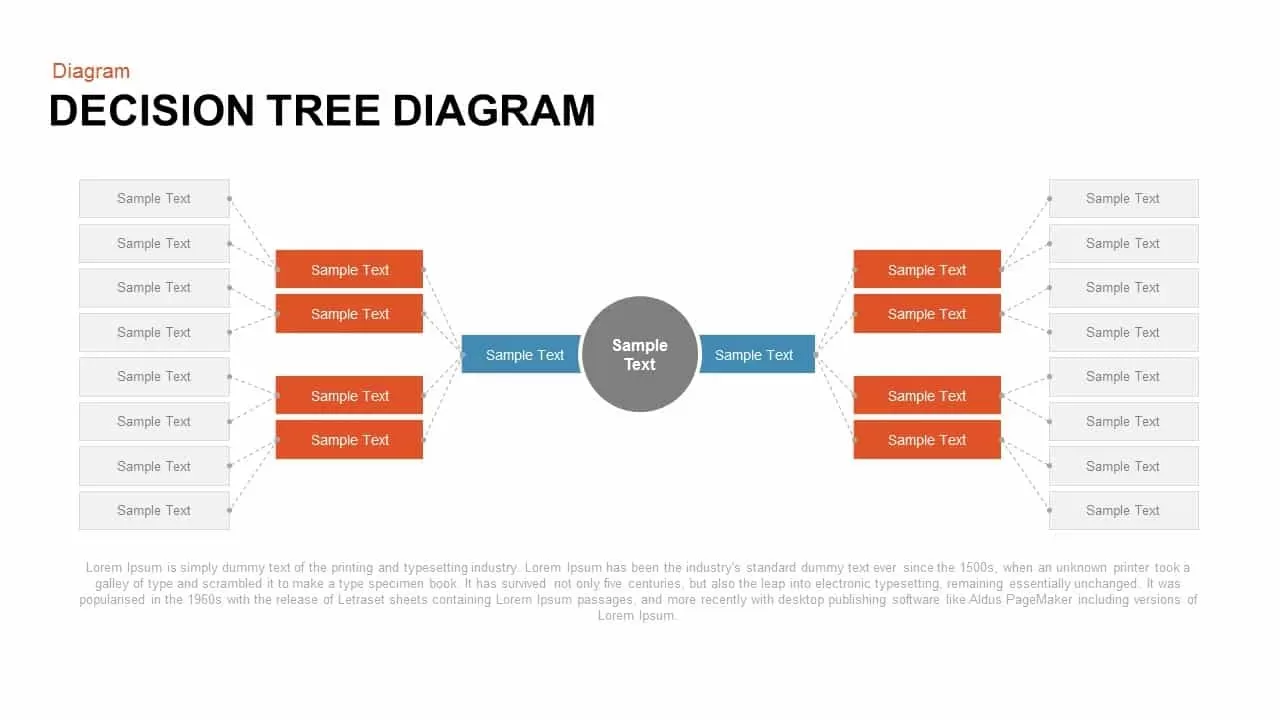
Decision Tree Diagram template for PowerPoint & Google Slides
Decision Tree
Business Decision-Making Metaphor Template for PowerPoint & Google Slides
Leadership
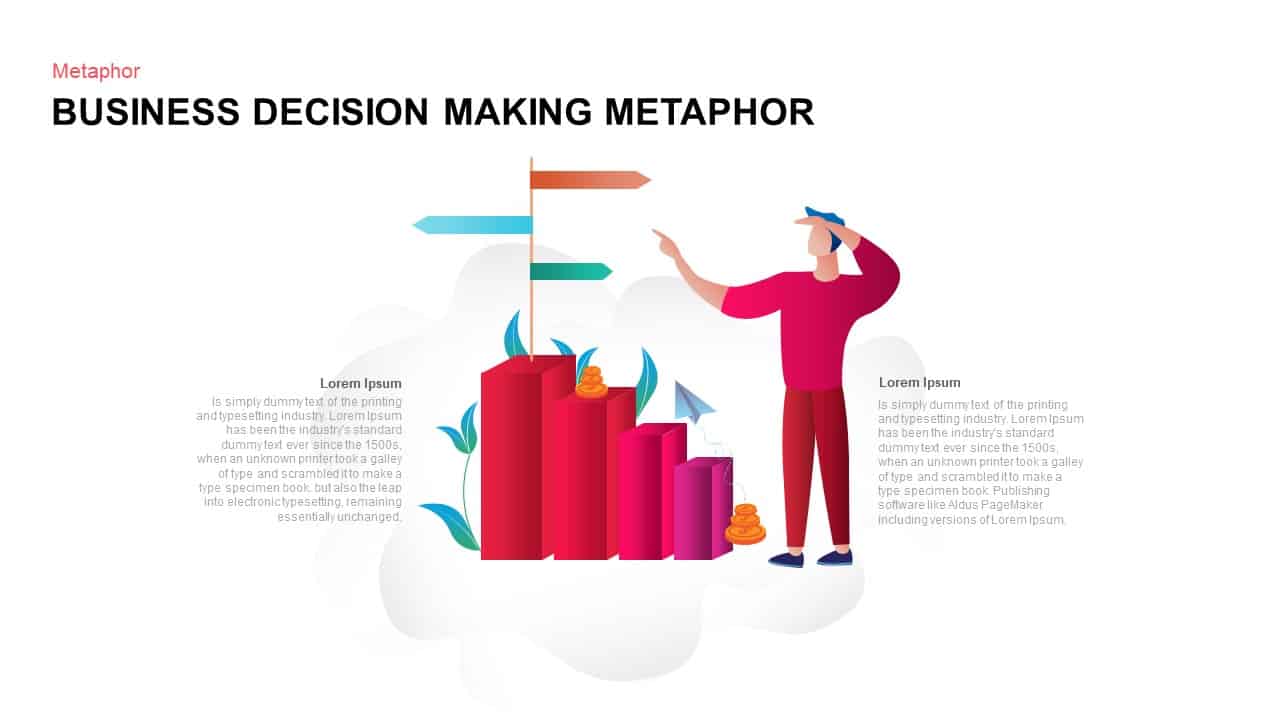
Business Decision Making Metaphor Template for PowerPoint & Google Slides
Arrow
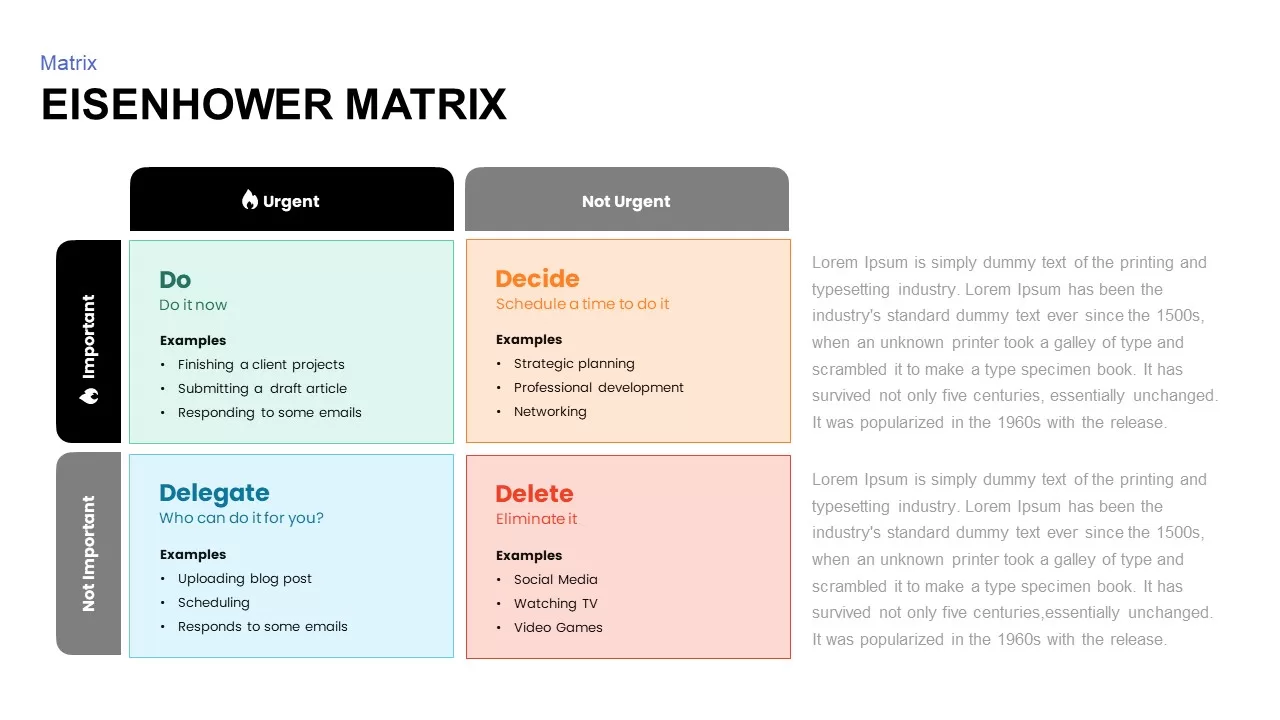
Eisenhower Matrix Decision-Making template for PowerPoint & Google Slides
Infographics
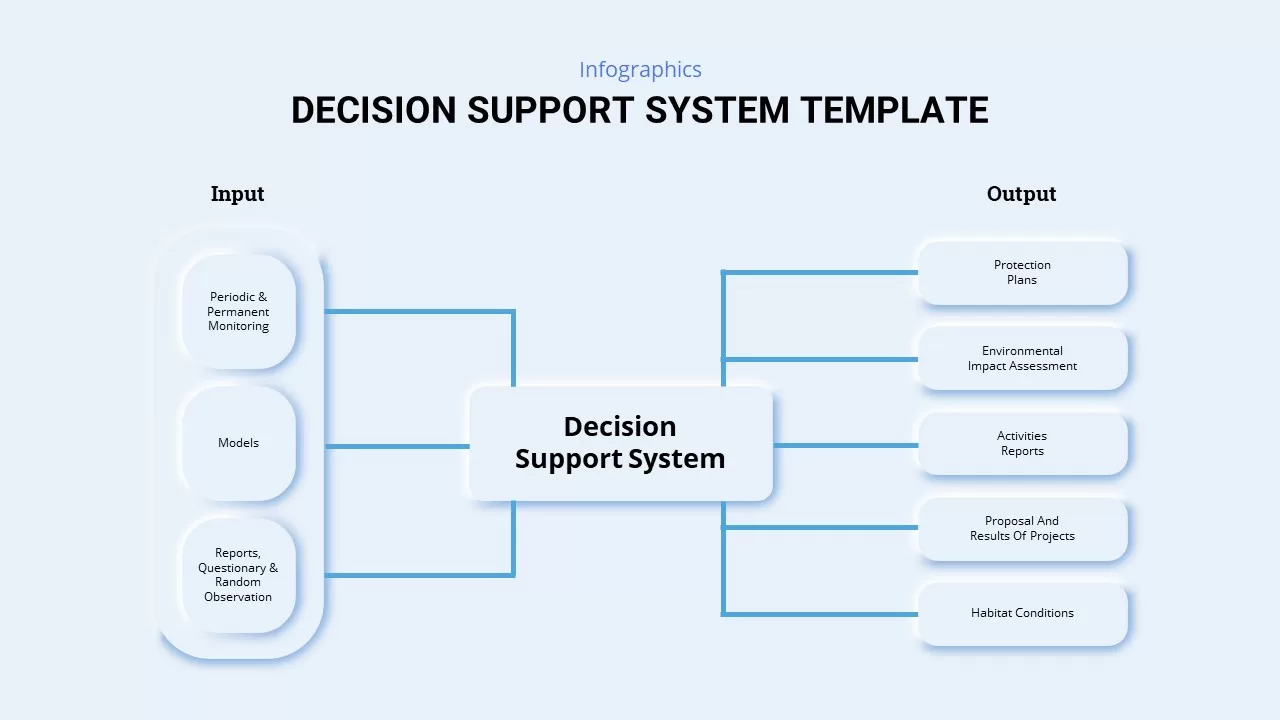
Decision Support System Diagram Template for PowerPoint & Google Slides
Process
Decision Making Unit template for PowerPoint & Google Slides
Business
Pugh Matrix Decision Comparison Chart Template for PowerPoint & Google Slides
Comparison Chart
Go No Go Decision Infographic Template for PowerPoint & Google Slides
Comparison
Flow Chart Decision Tree Template for PowerPoint & Google Slides
Flow Charts
Project Go No-Go Decision Slide Template for PowerPoint & Google Slides
Process
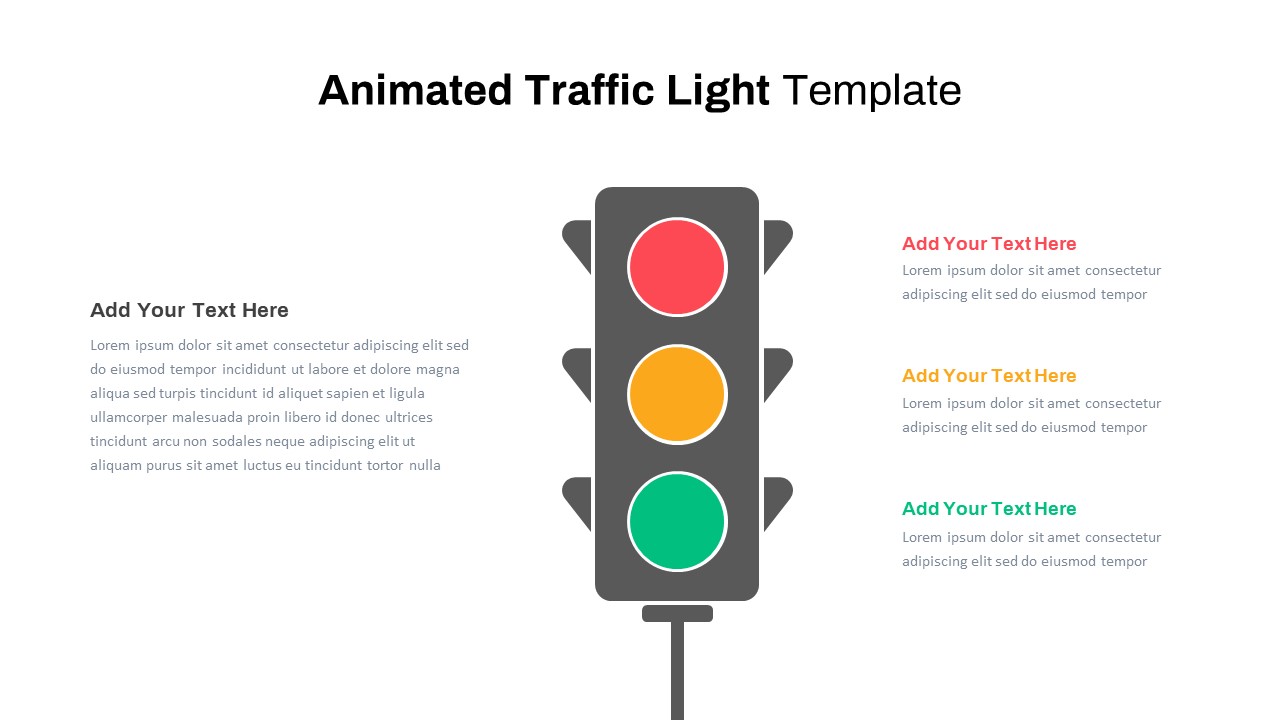
Animated Traffic Light Decision Diagram Template for PowerPoint & Google Slides
Process
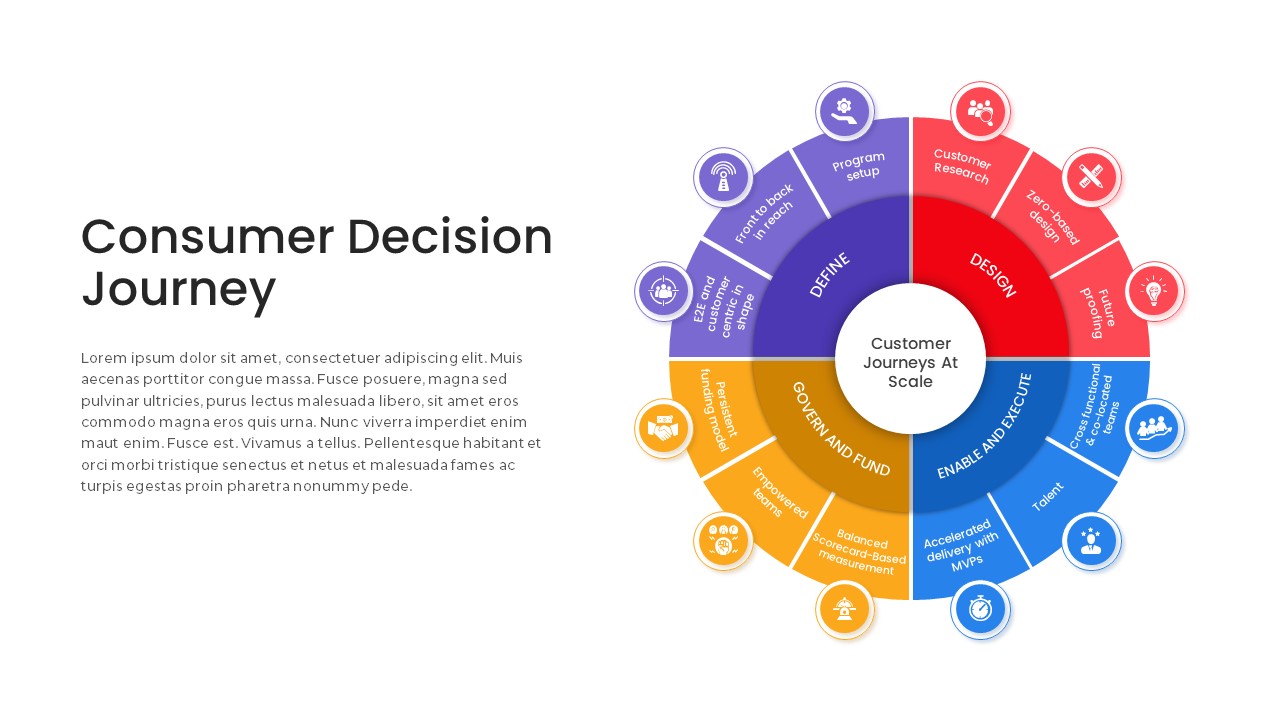
Consumer Decision Journey Radial Diagram Template for PowerPoint & Google Slides
Circular
Decision Matrix & Prioritization Chart Template for PowerPoint & Google Slides
Comparison Chart
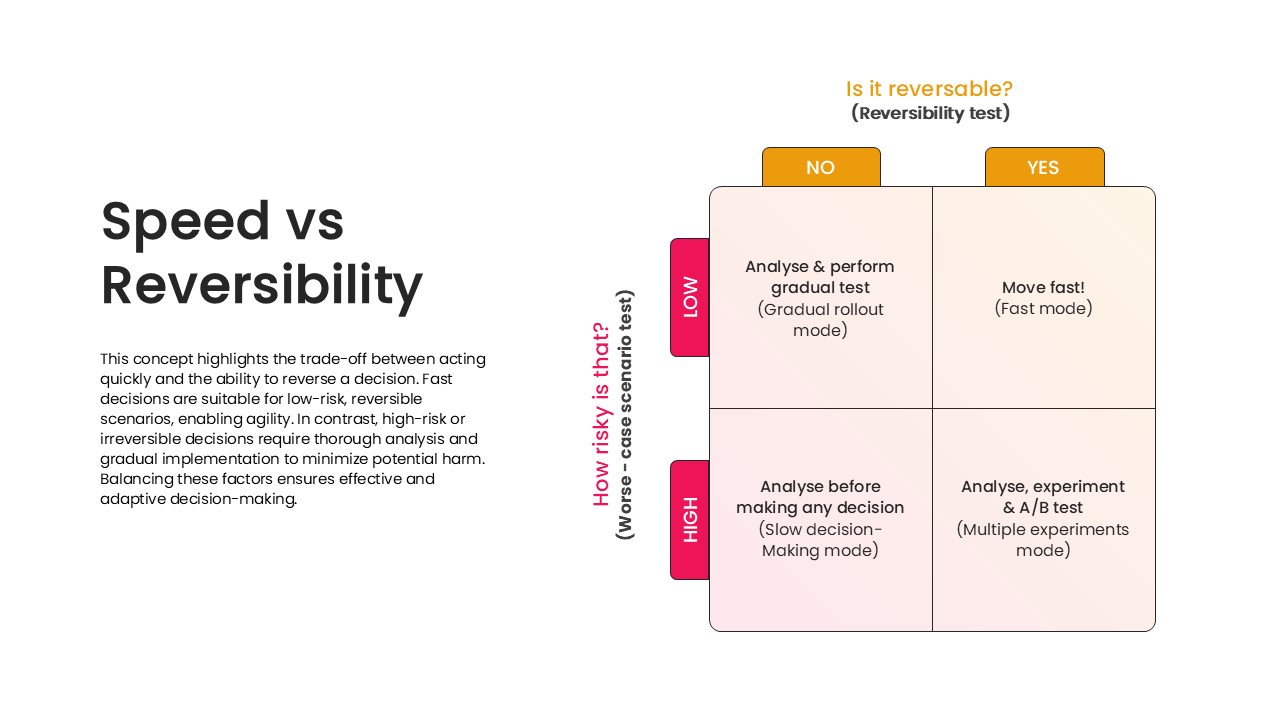
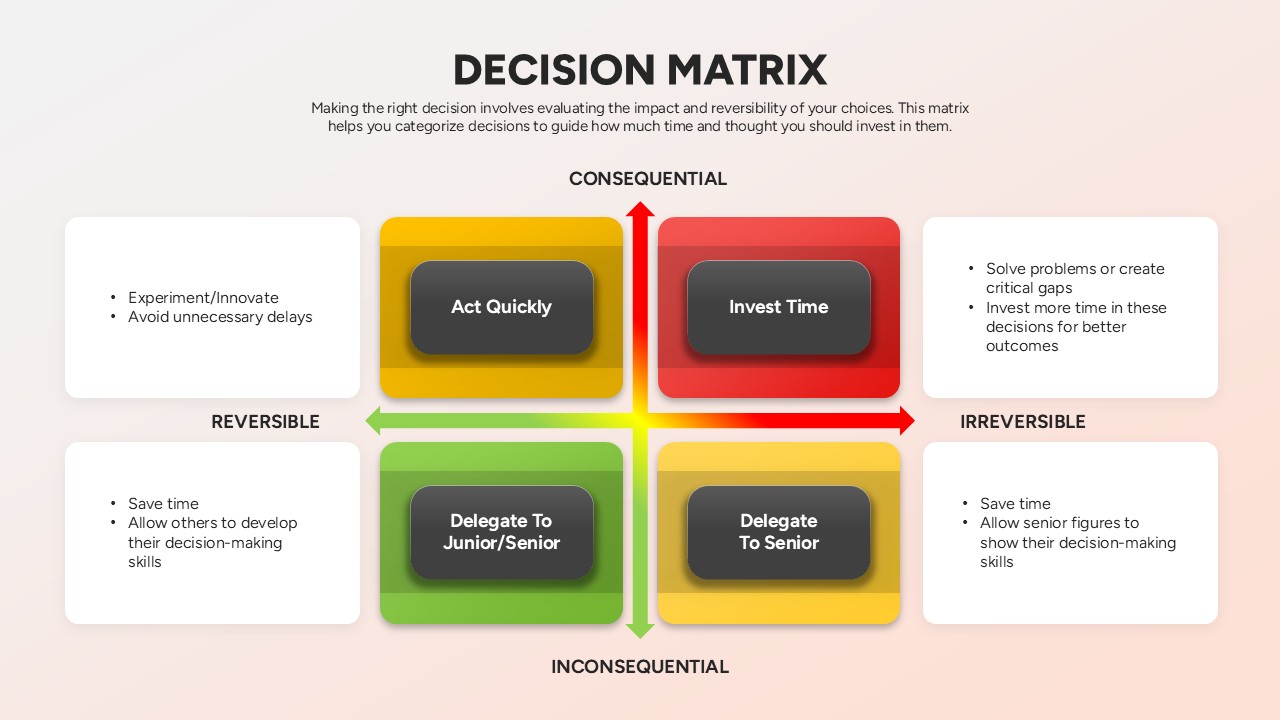
Speed vs Reversibility Decision Matrix Template for PowerPoint & Google Slides
Comparison
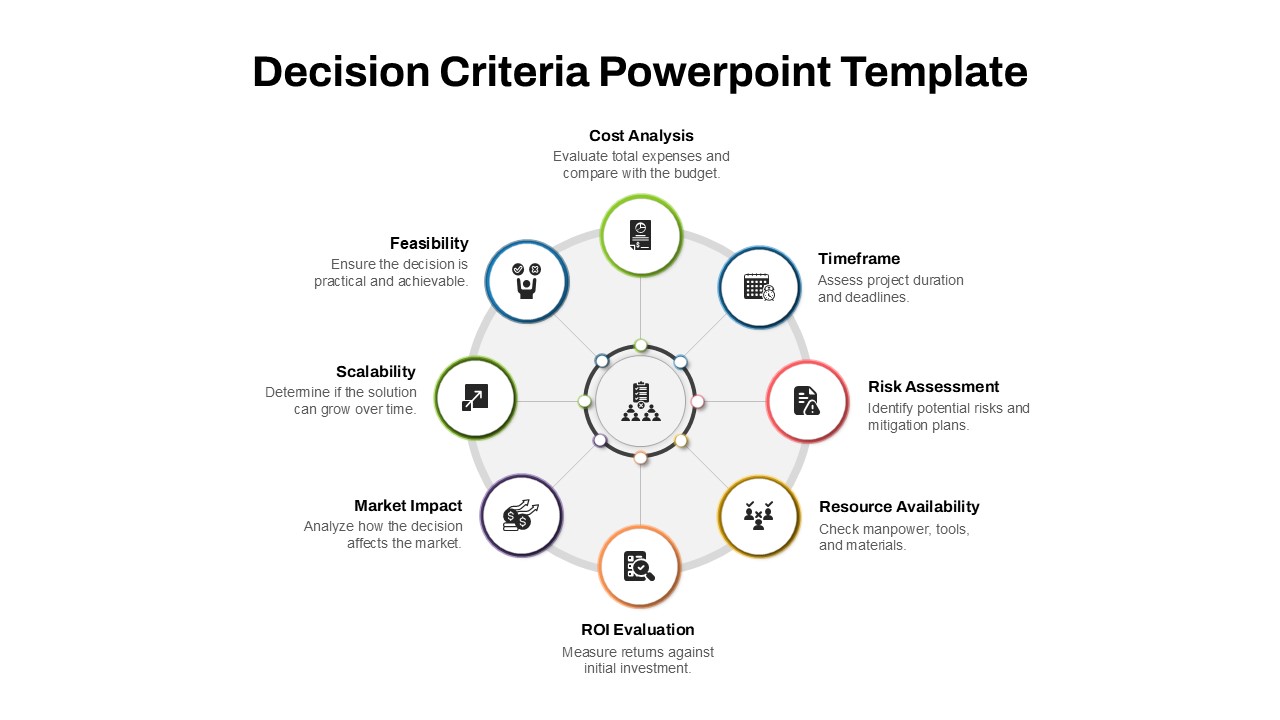
Decision Criteria Template for PowerPoint & Google Slides
Infographics
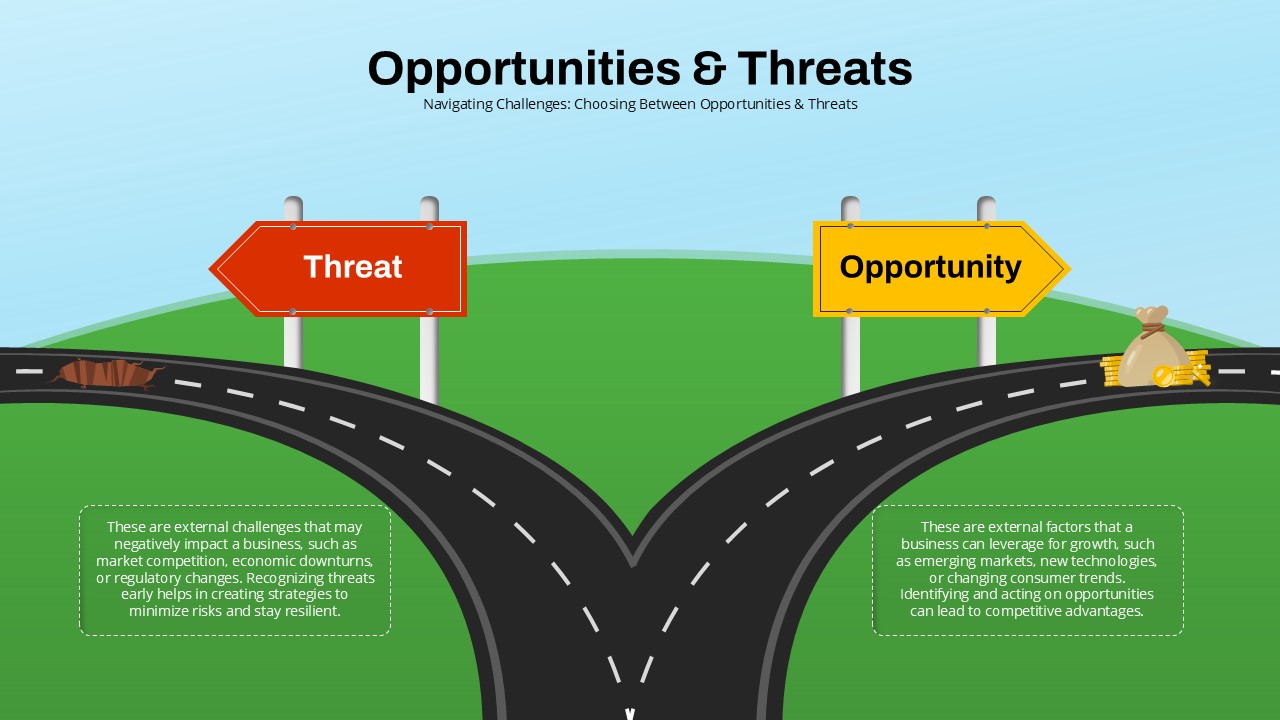
Opportunities & Threats Decision Roadmap Template for PowerPoint & Google Slides
Comparison
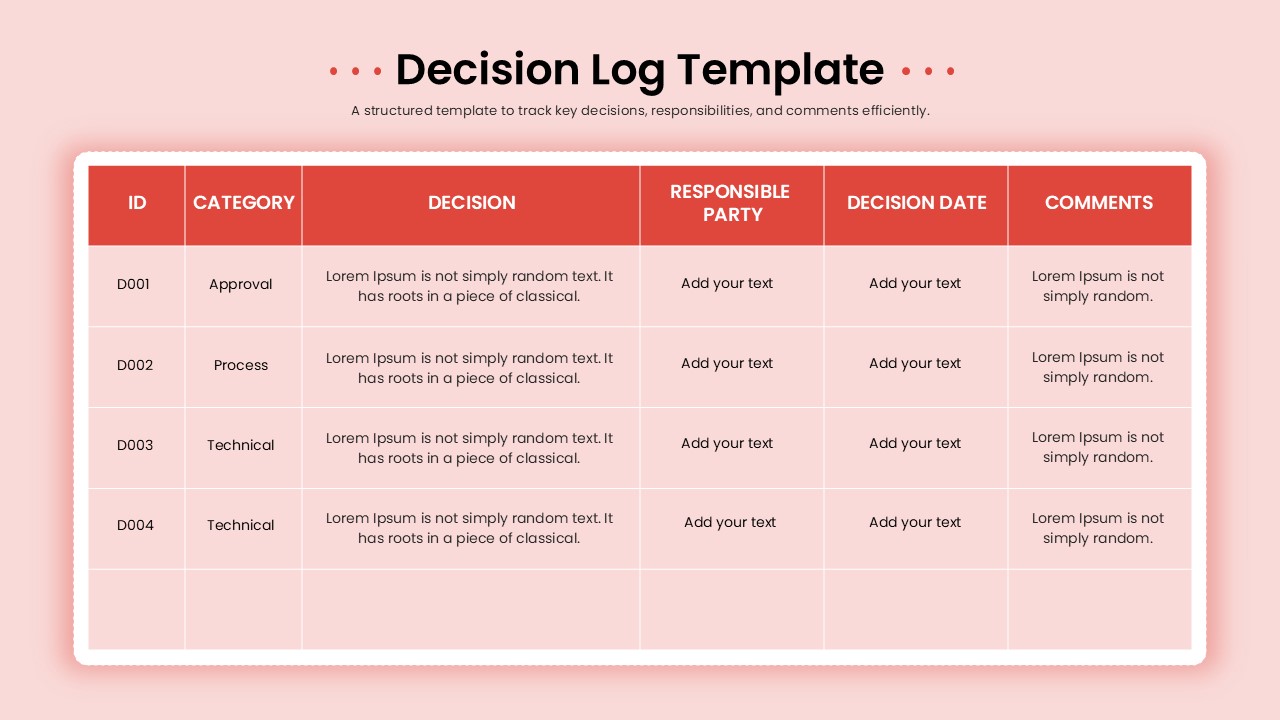
Decision Log Template for PowerPoint & Google Slides
Business
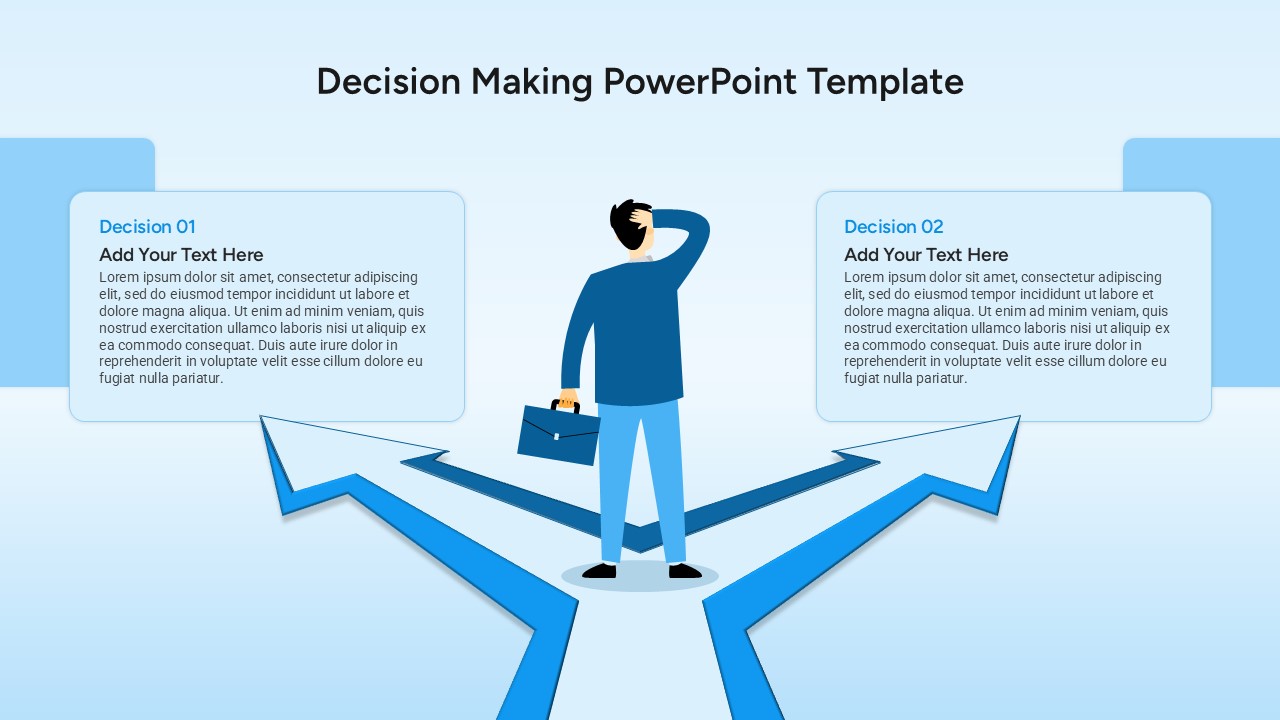
Decision Making Template for PowerPoint & Google Slides
Decision Tree
Data-Driven Decision Making overview template for PowerPoint & Google Slides
Business
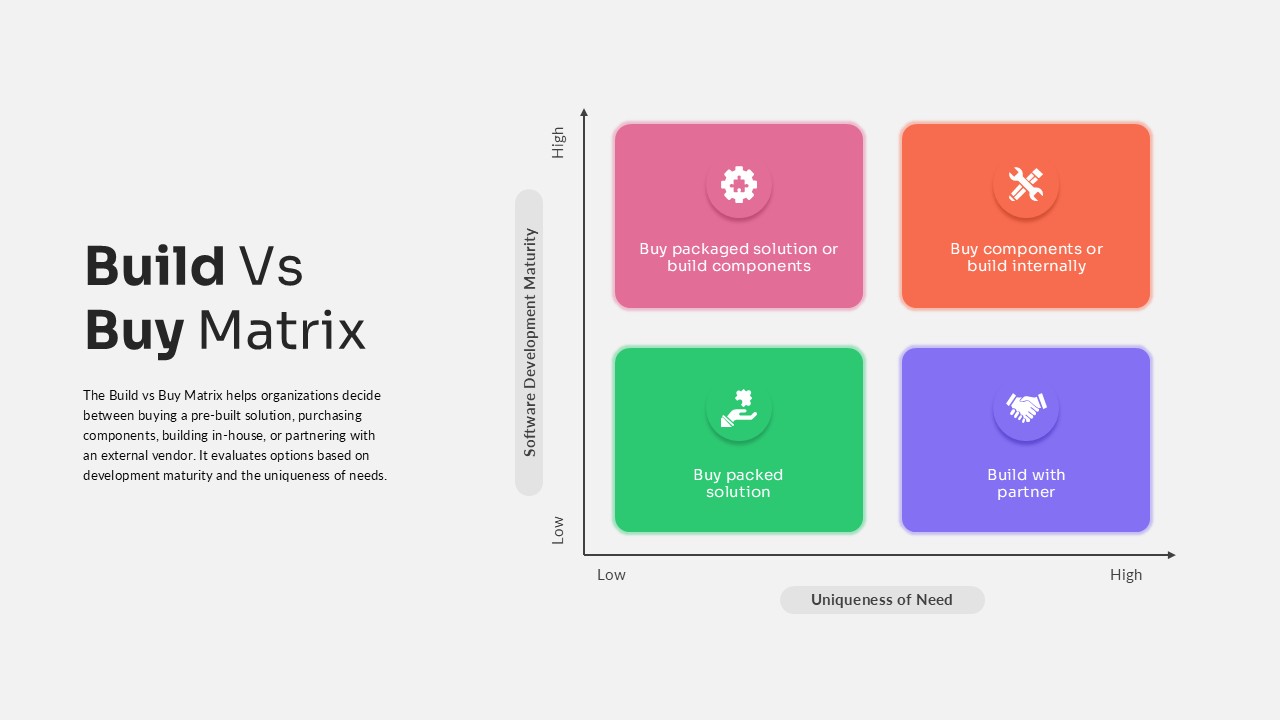
Build vs Buy Matrix Decision Framework template for PowerPoint & Google Slides
Business Strategy
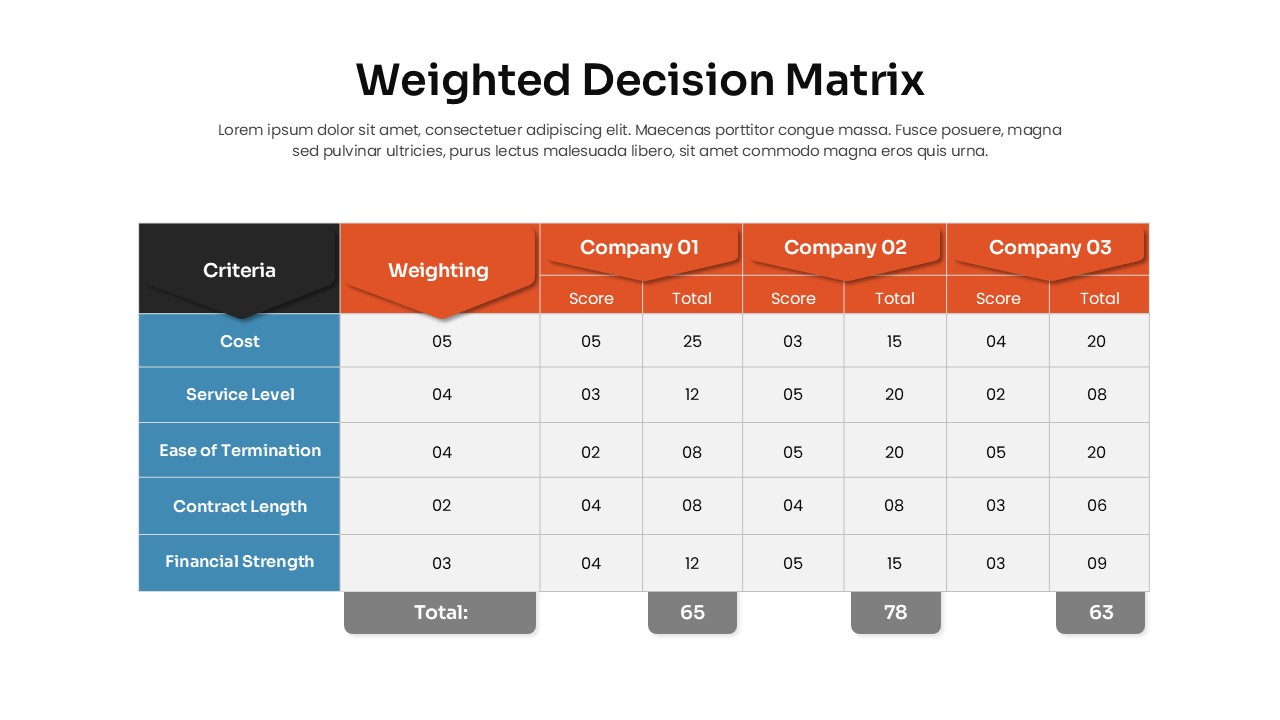
Weighted Decision Matrix template for PowerPoint & Google Slides
Business Models
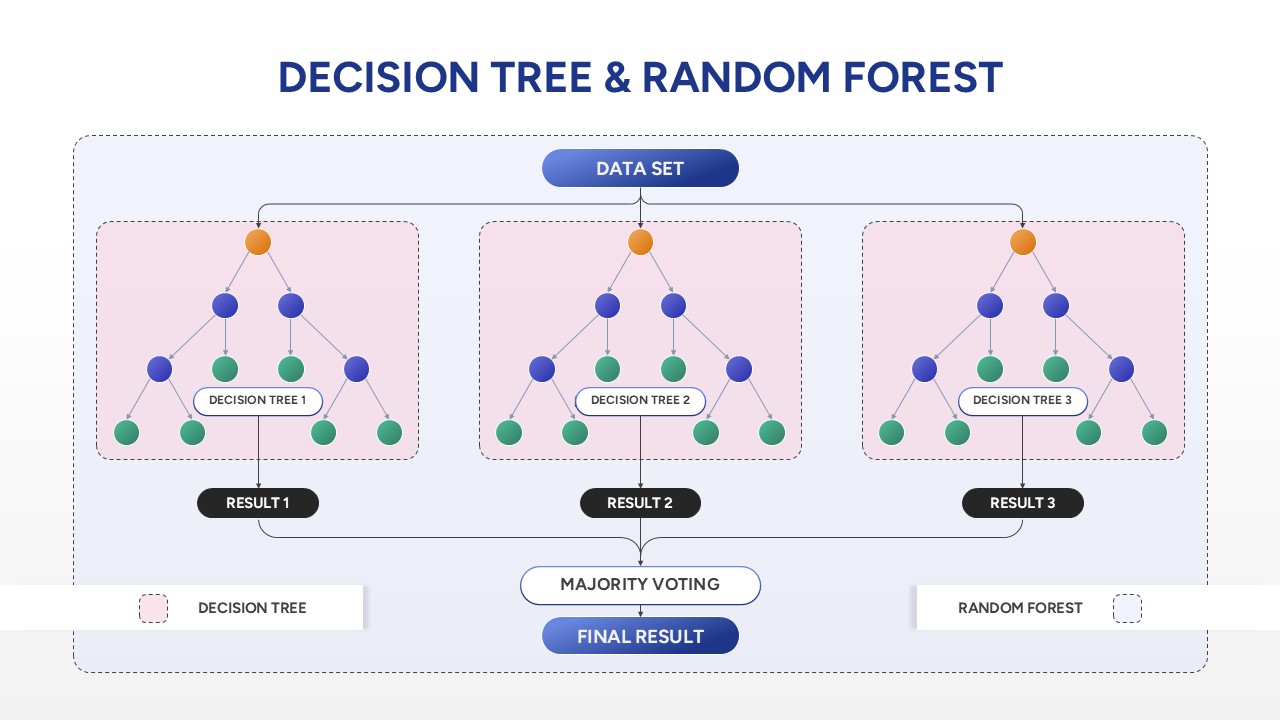
Decision Tree & Random Forest template for PowerPoint & Google Slides
Technology
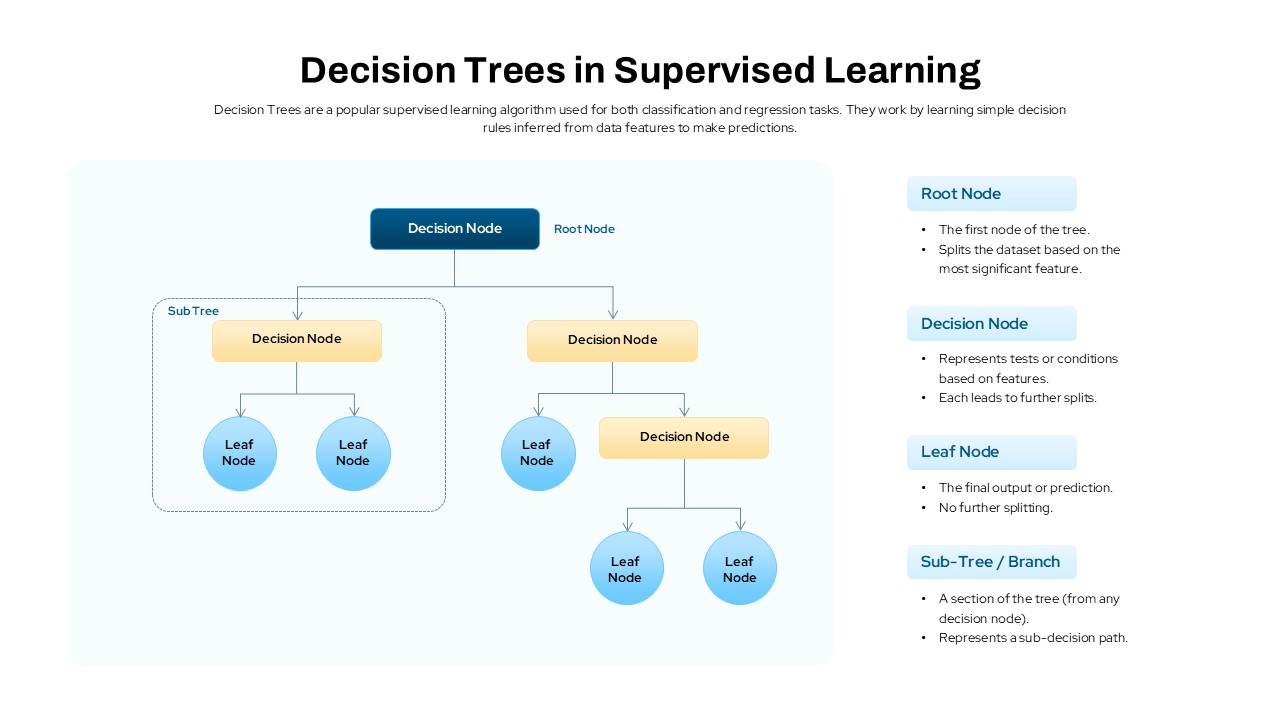
Decision Trees in Supervised Learning Template for PowerPoint & Google Slides
Machine Learning
Decision Matrix Evaluation Framework Slide Template for PowerPoint & Google Slides
Leadership
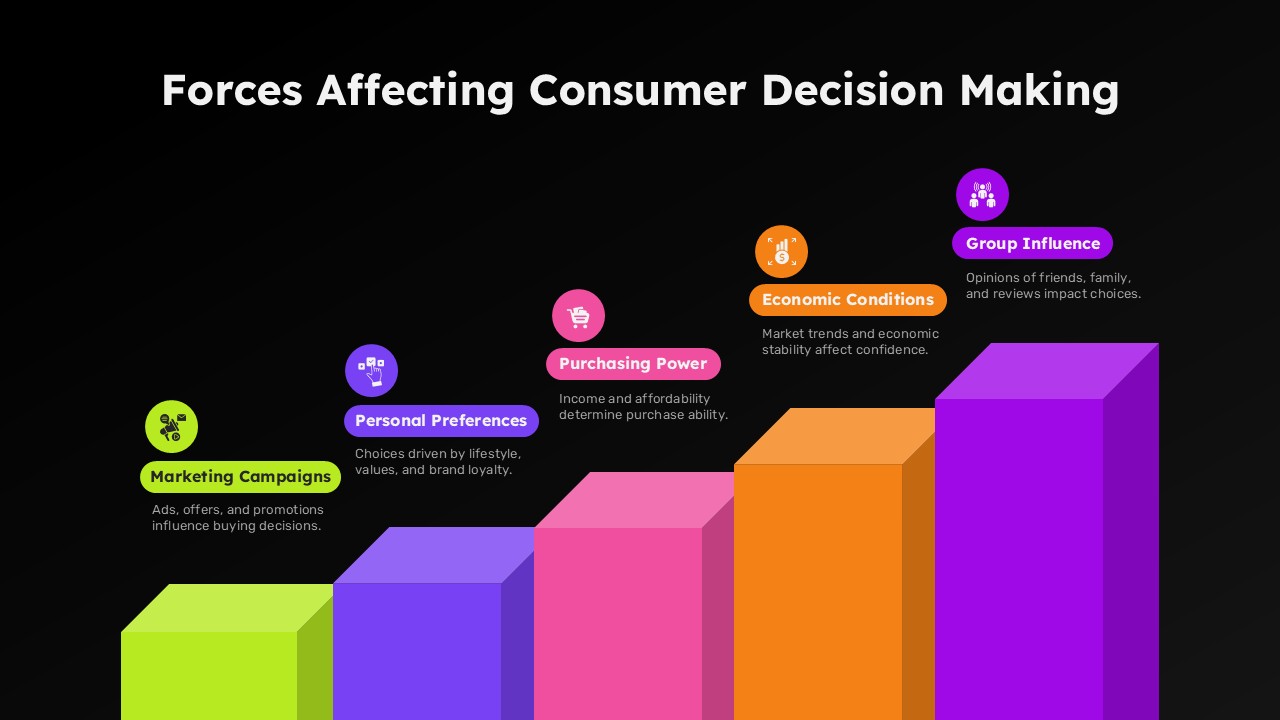
Forces Affecting Consumer Decision Making Template for PowerPoint & Google Slides
Marketing
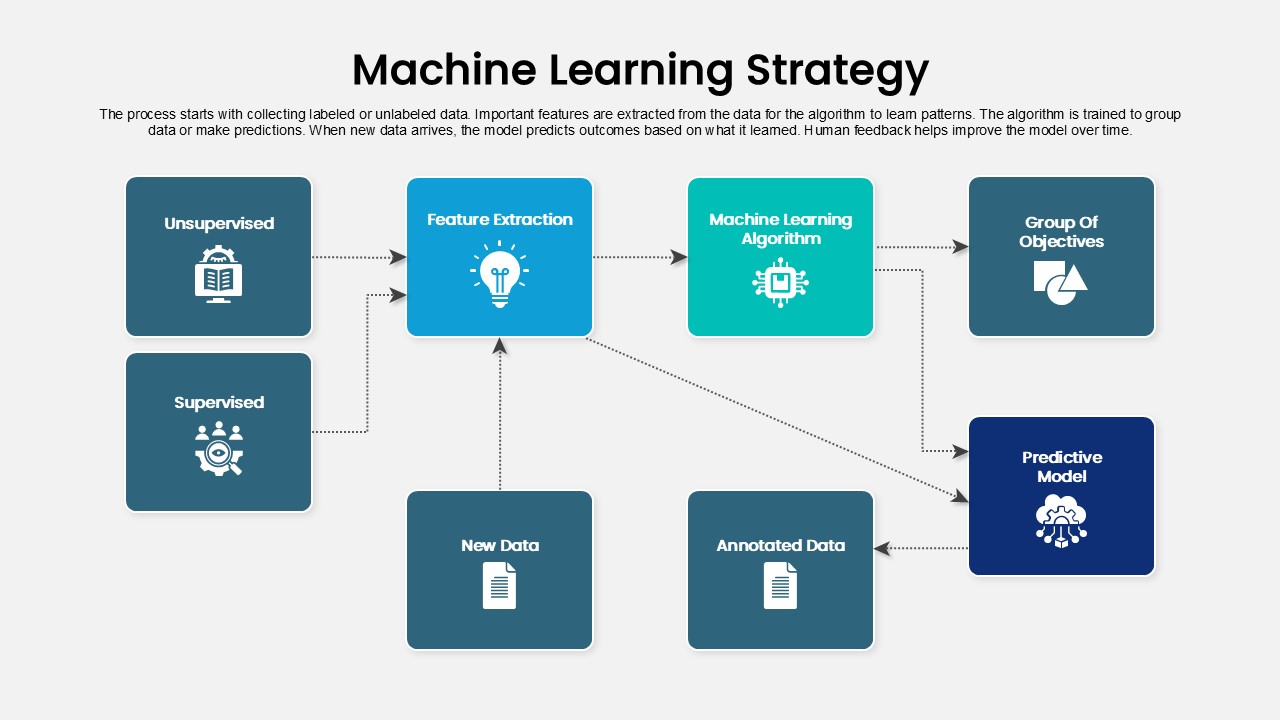
Machine Learning Strategy Flowchart
Machine Learning
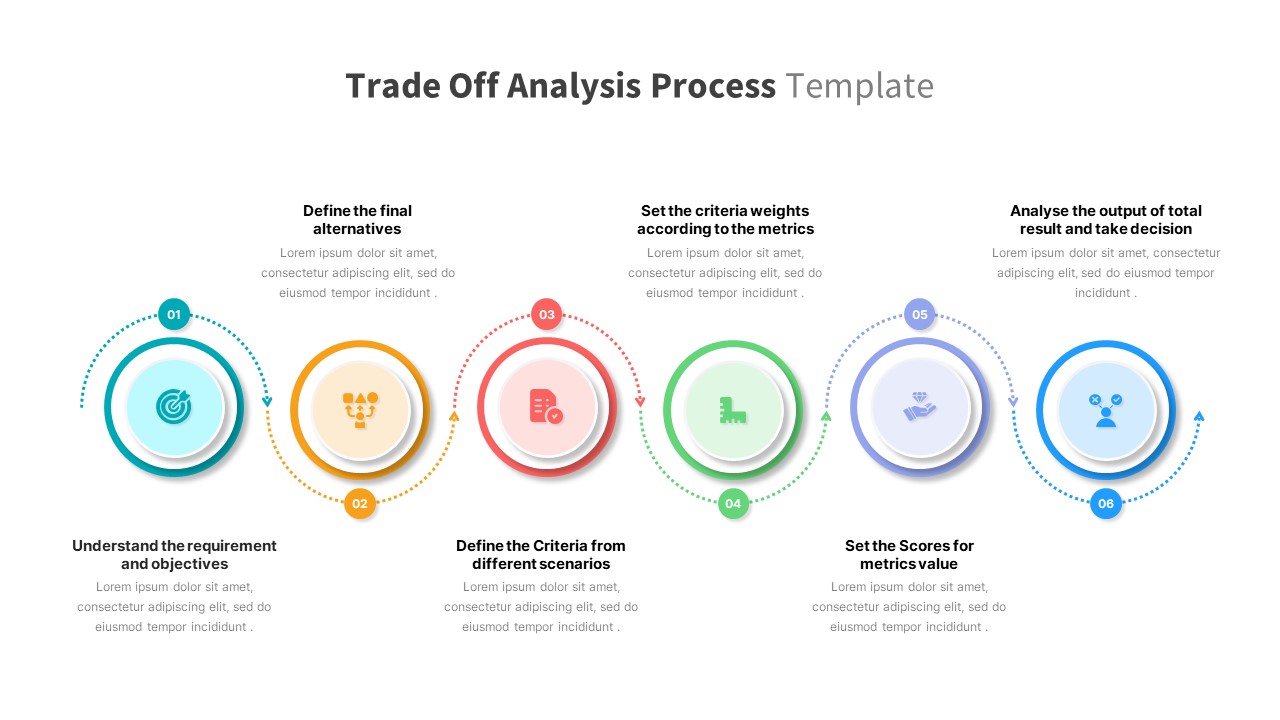
Trade Off Analysis Process template for PowerPoint & Google Slides
Process
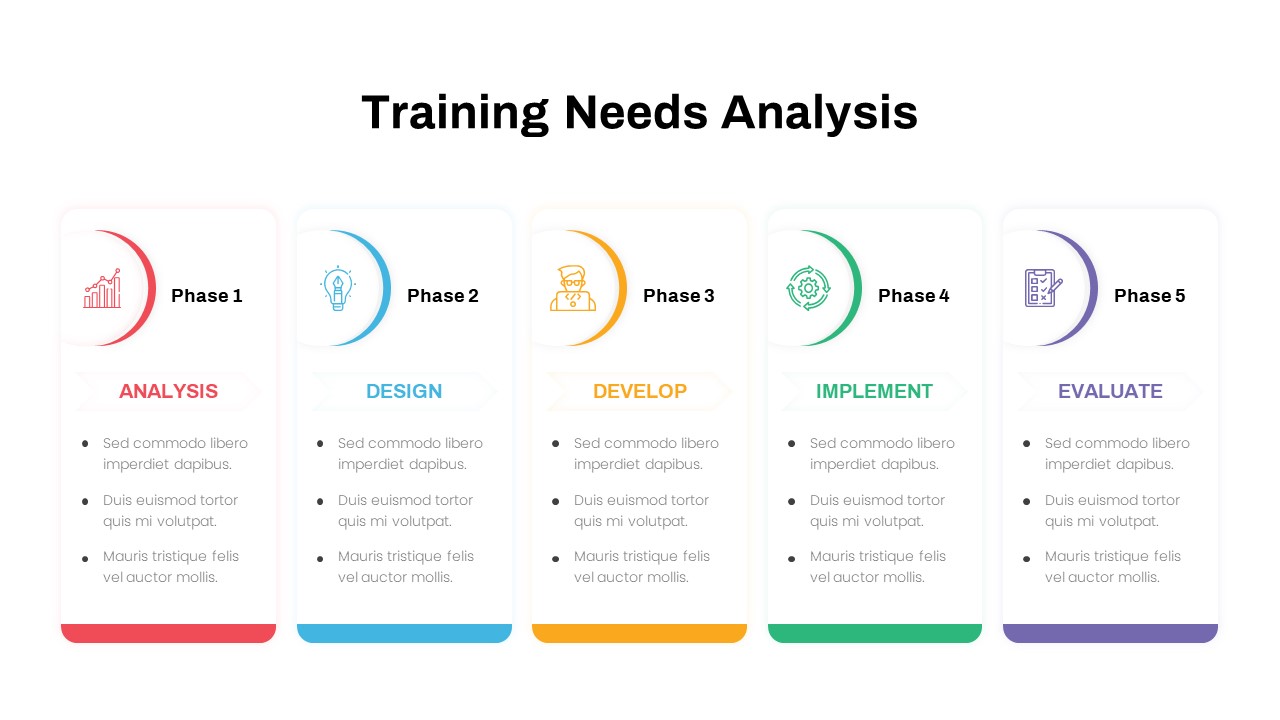
Training Needs Analysis Process Template for PowerPoint & Google Slides
Employee Performance
Business Process Analysis Cycle Diagram Template for PowerPoint & Google Slides
Business Strategy
Bottleneck Process Analysis Diagram Template for PowerPoint & Google Slides
Process
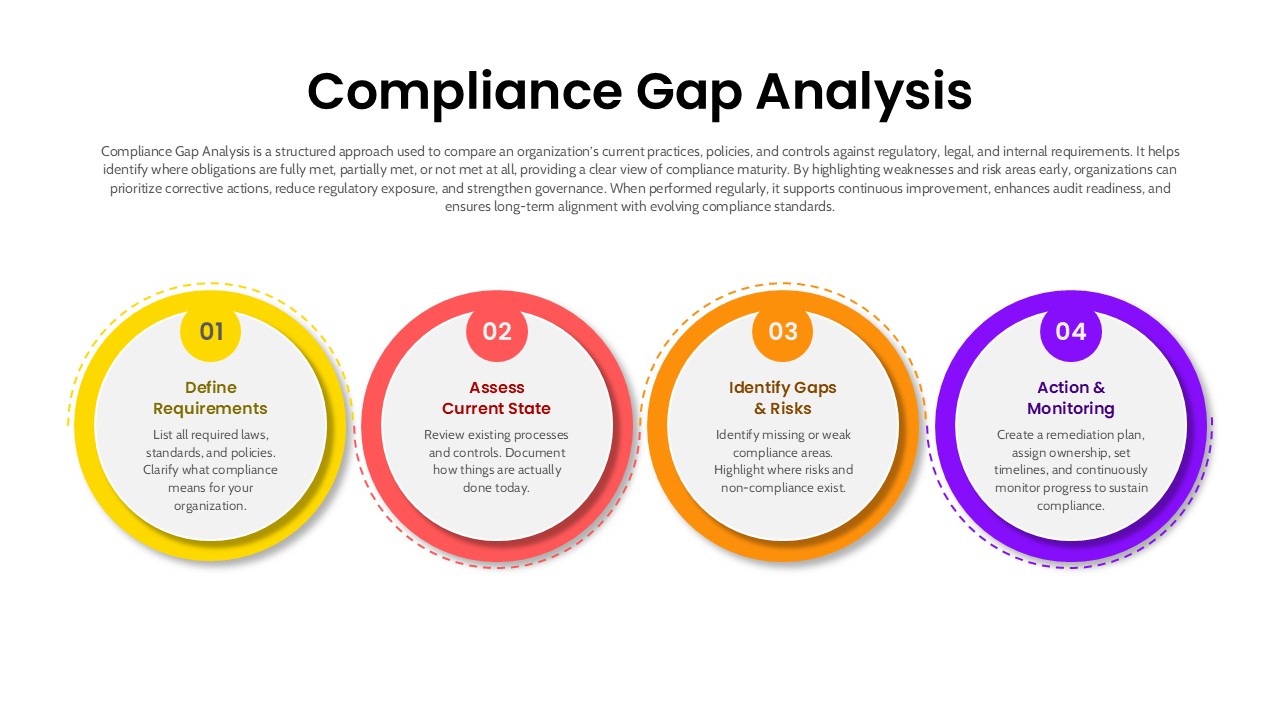
4 Step Compliance Gap Analysis Process Template for PowerPoint & Google Slides
Risk Management
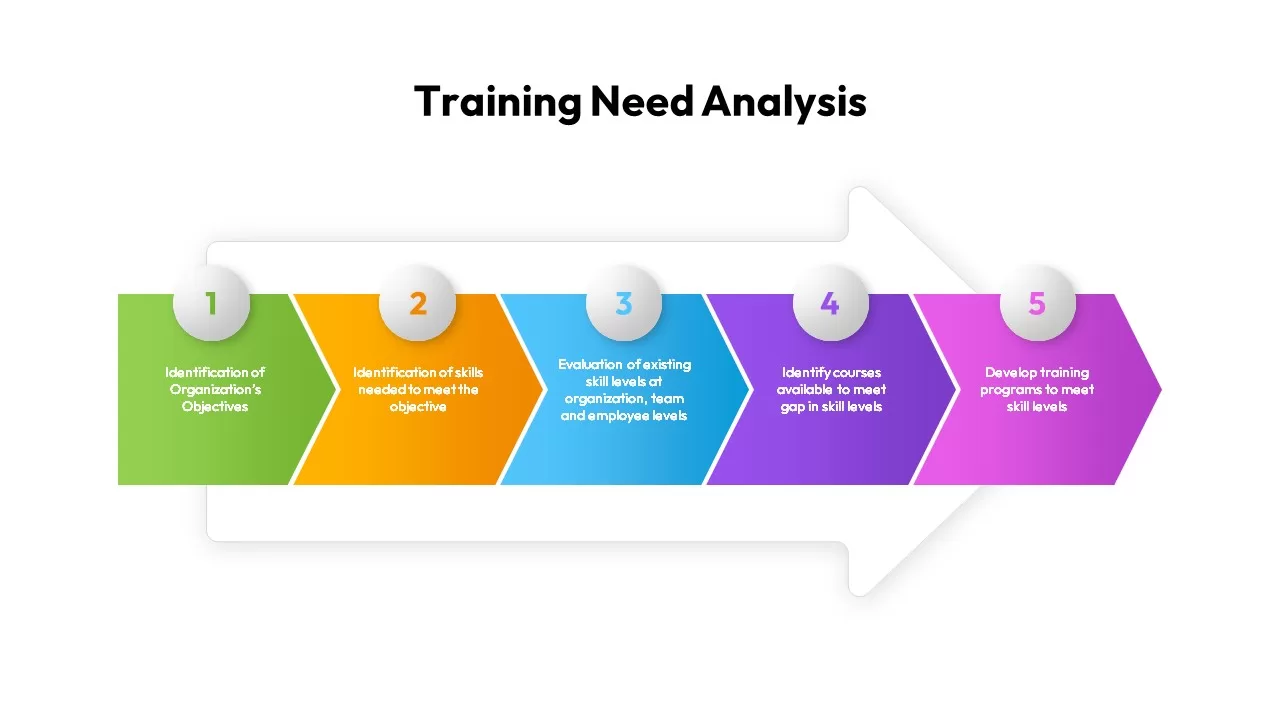
Training Need Analysis Process infographic for PowerPoint & Google Slides
Employee Performance
4 Step Process PowerPoint & Google Slides Template for PowerPoint & Google Slides
Process
PEST Analysis PowerPoint Template for PowerPoint & Google Slides
Business Strategy
Mobile Data Analysis Chart template for PowerPoint & Google Slides
Charts
Line Graph Analysis template for PowerPoint & Google Slides
Charts
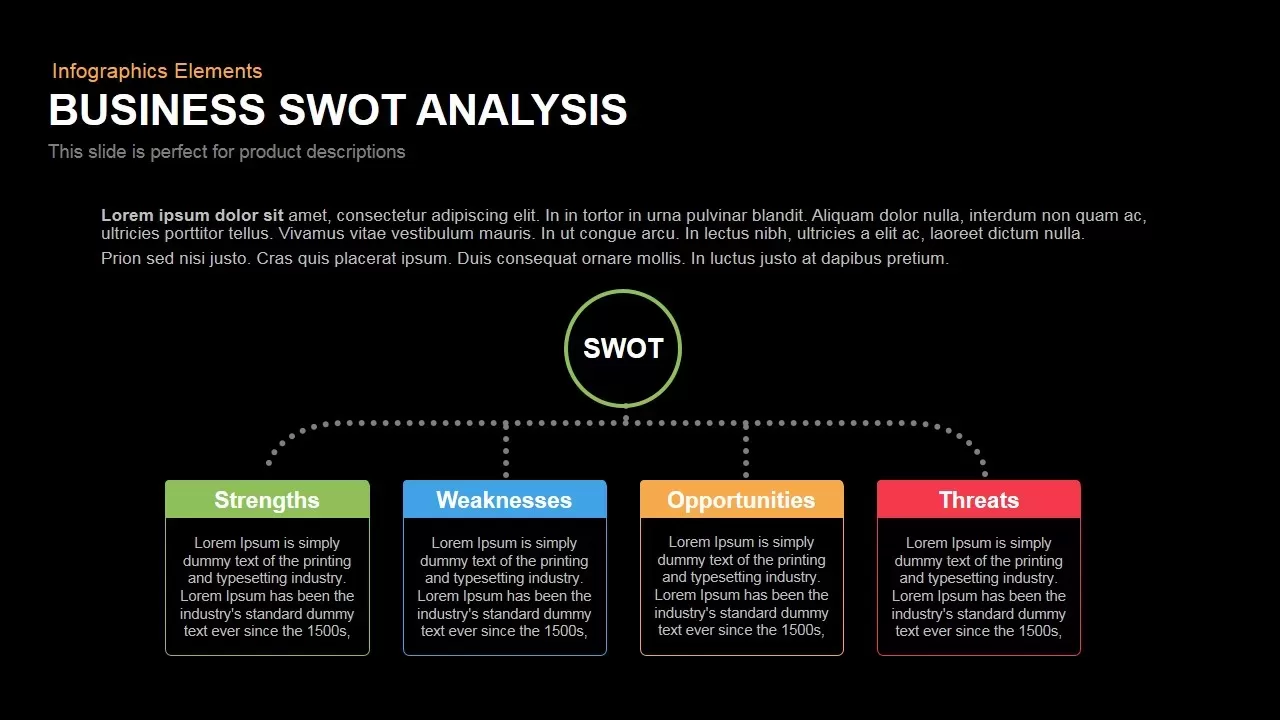
Box Business SWOT Analysis Template for PowerPoint & Google Slides
SWOT
Modern Circle SWOT Analysis Diagram Template for PowerPoint & Google Slides
SWOT

Professional PESTEL Analysis Diagram Template for PowerPoint & Google Slides
PEST

Interactive Gap Analysis Puzzle Diagram Template for PowerPoint & Google Slides
Gap
Fishbone Diagram Analysis Template for PowerPoint & Google Slides
Flow Charts
Employee Skill Analysis Dashboard Template for PowerPoint & Google Slides
Employee Performance
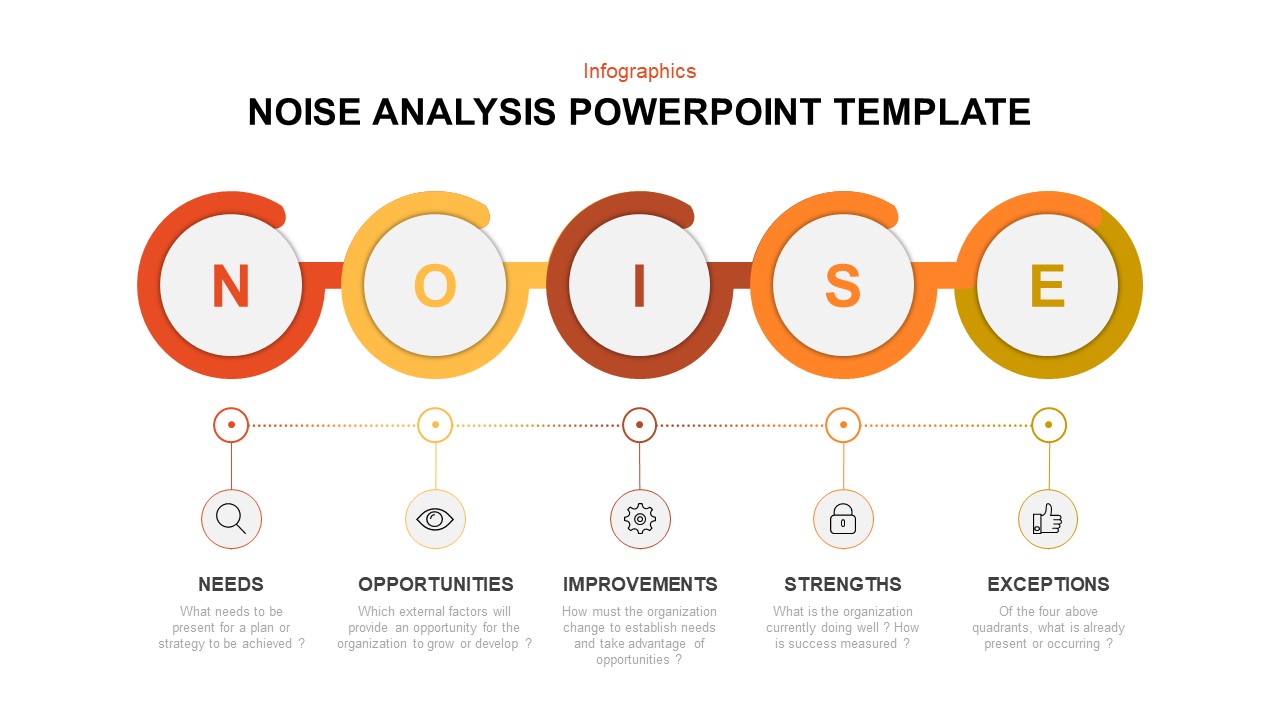
Modern Noise Analysis Infographic Template for PowerPoint & Google Slides
Process
Four-Quadrant SWOT Analysis Diagram Template for PowerPoint & Google Slides
SWOT
Interactive 3D Puzzle SWOT Analysis Slide Template for PowerPoint & Google Slides
SWOT
Team Building Hub-and-Spoke Analysis Template for PowerPoint & Google Slides
Process
Illustrated Business SWOT Analysis Template for PowerPoint & Google Slides
SWOT
VRIO Analysis Infographic Template for PowerPoint & Google Slides
Business Strategy
VRIO Analysis Framework template for PowerPoint & Google Slides
Business Strategy
SWOT Analysis Grid Infographic Template for PowerPoint & Google Slides
SWOT
Circular SWOT Analysis Infographic Template for PowerPoint & Google Slides
SWOT
CAGE Distance Analysis Framework Template for PowerPoint & Google Slides
Competitor Analysis
Colorful SWOT Analysis Quadrant Template for PowerPoint & Google Slides
SWOT
SWOT Analysis Overview template for PowerPoint & Google Slides
Business
SWOT Analysis Quadrant template for PowerPoint & Google Slides
Business Strategy
SWOT Analysis Blocks template for PowerPoint & Google Slides
Business Strategy
SWOT Analysis Template for PowerPoint & Google Slides
Business Strategy
SWOT Analysis template for PowerPoint & Google Slides
SWOT
Current vs Future State Analysis template for PowerPoint & Google Slides
Comparison
Cost Benefit Analysis Comparison Template for PowerPoint & Google Slides
Comparison
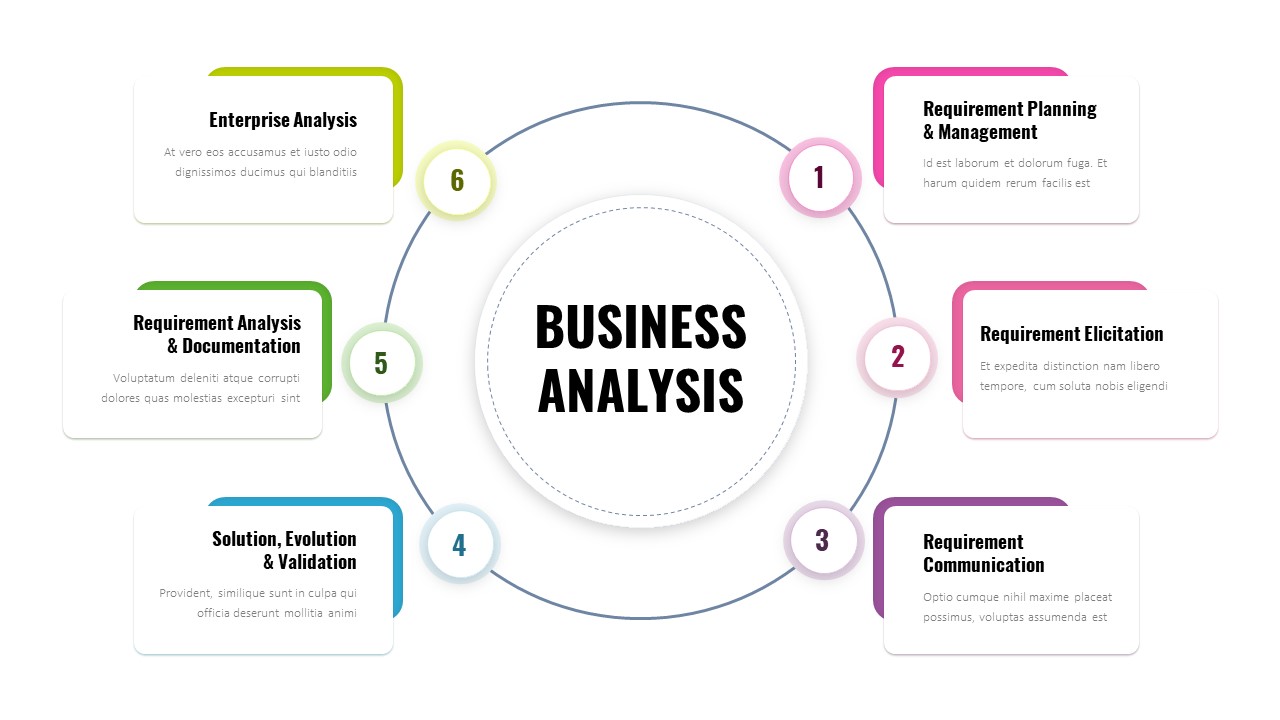
Six-Step Business Analysis Template for PowerPoint & Google Slides
Process
Simple Scatter Chart Analysis Template for PowerPoint & Google Slides
Comparison Chart
Simple Area Chart Data Trends Analysis Template for PowerPoint & Google Slides
Comparison Chart
Free Root Cause Analysis Fishbone Diagram Template for PowerPoint & Google Slides
Process
Free
Cost-Volume-Profit Analysis Diagram Template for PowerPoint & Google Slides
Finance
Expanding Margins Analysis Bar Chart Template for PowerPoint & Google Slides
Charts
Dynamic Financial Analysis Line Chart Template for PowerPoint & Google Slides
Finance
DESTEP Marketing Analysis Diagram Template for PowerPoint & Google Slides
Circular
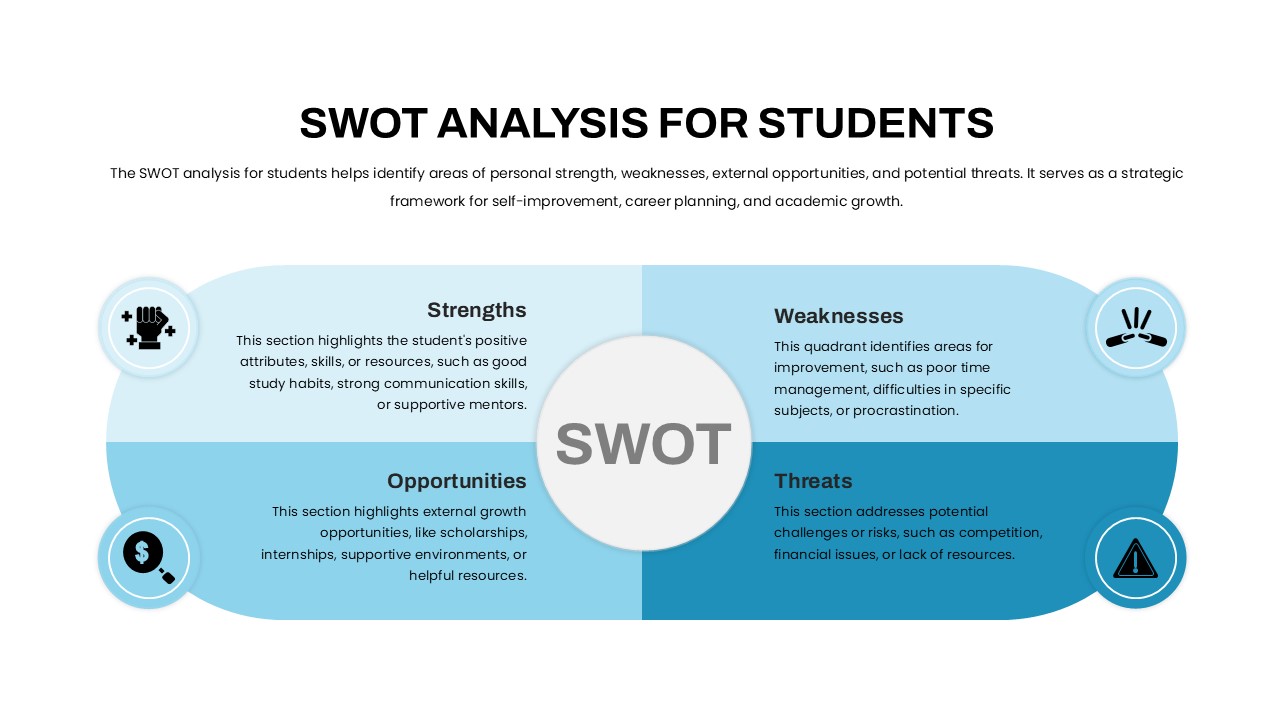
Student SWOT Analysis Framework Template for PowerPoint & Google Slides
SWOT
Quantitative Risk Analysis Matrix template for PowerPoint & Google Slides
Risk Management
SWOT Analysis Infographic with Circular Icons Template for PowerPoint & Google Slides
SWOT
Multi Color SWOT Analysis Quadrant Template for PowerPoint & Google Slides
SWOT
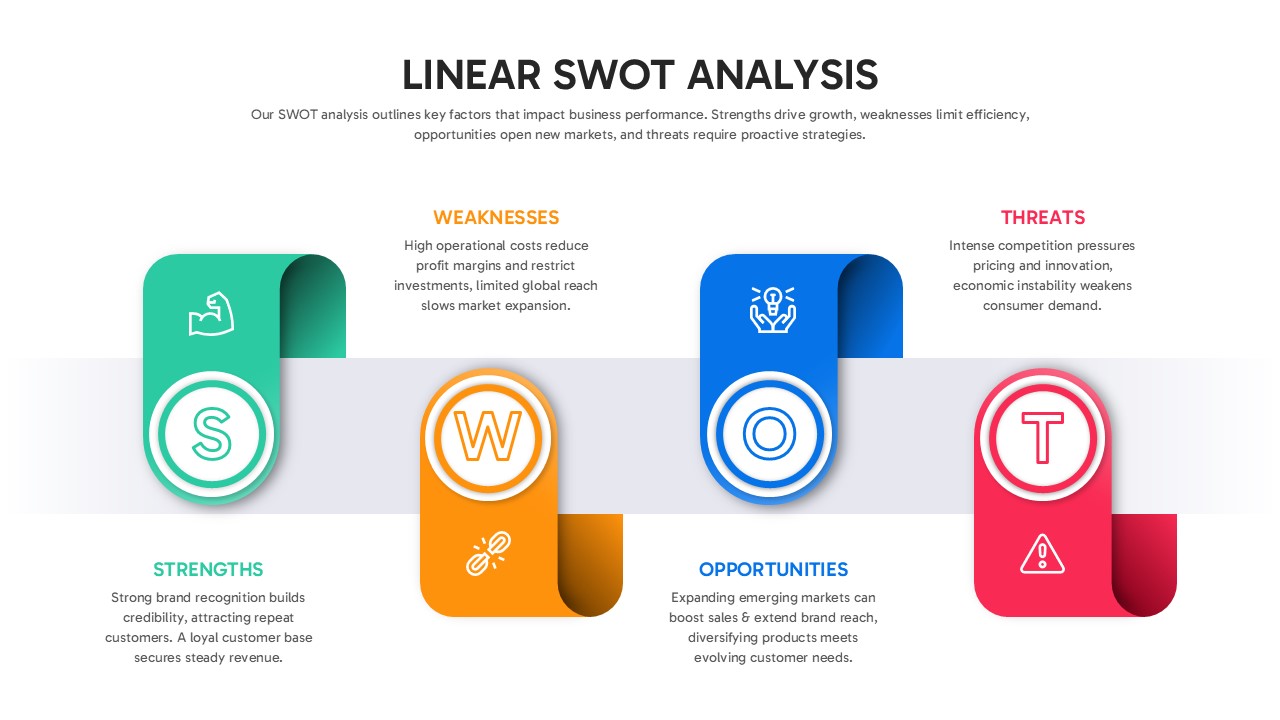
Linear SWOT Analysis Slide Template for PowerPoint & Google Slides
SWOT
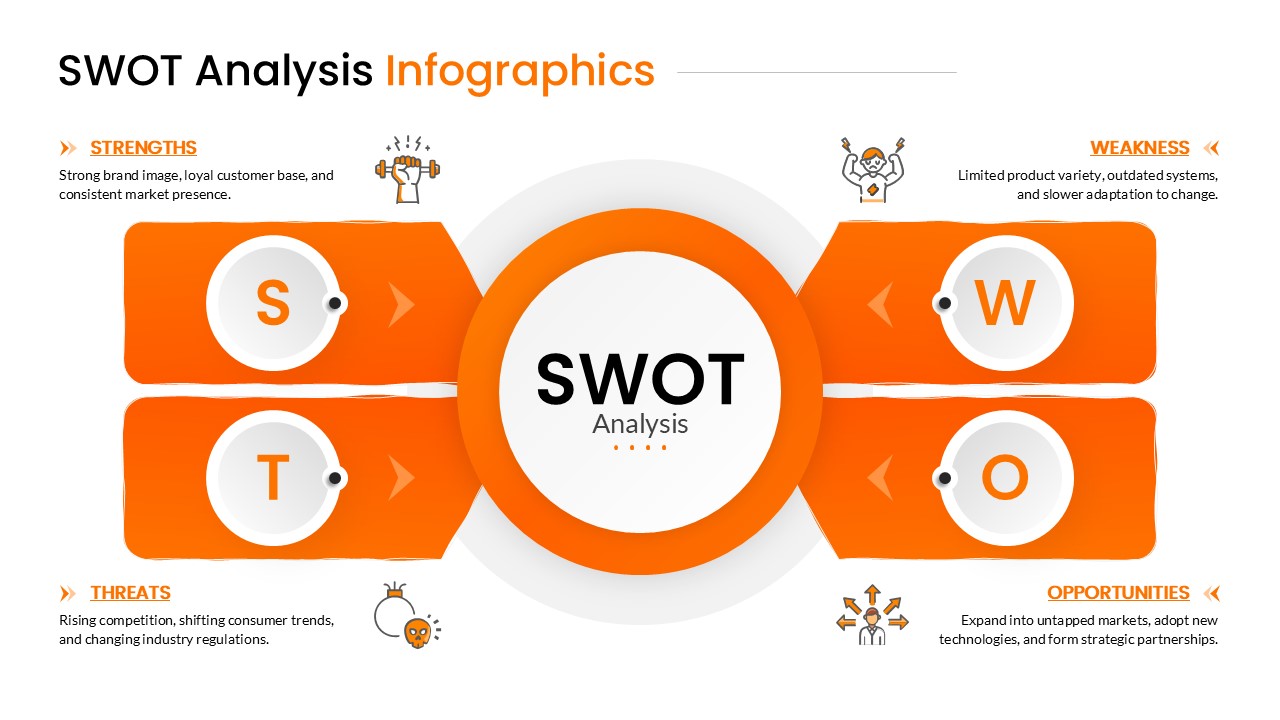
Orange SWOT Analysis Infographic Template for PowerPoint & Google Slides
SWOT
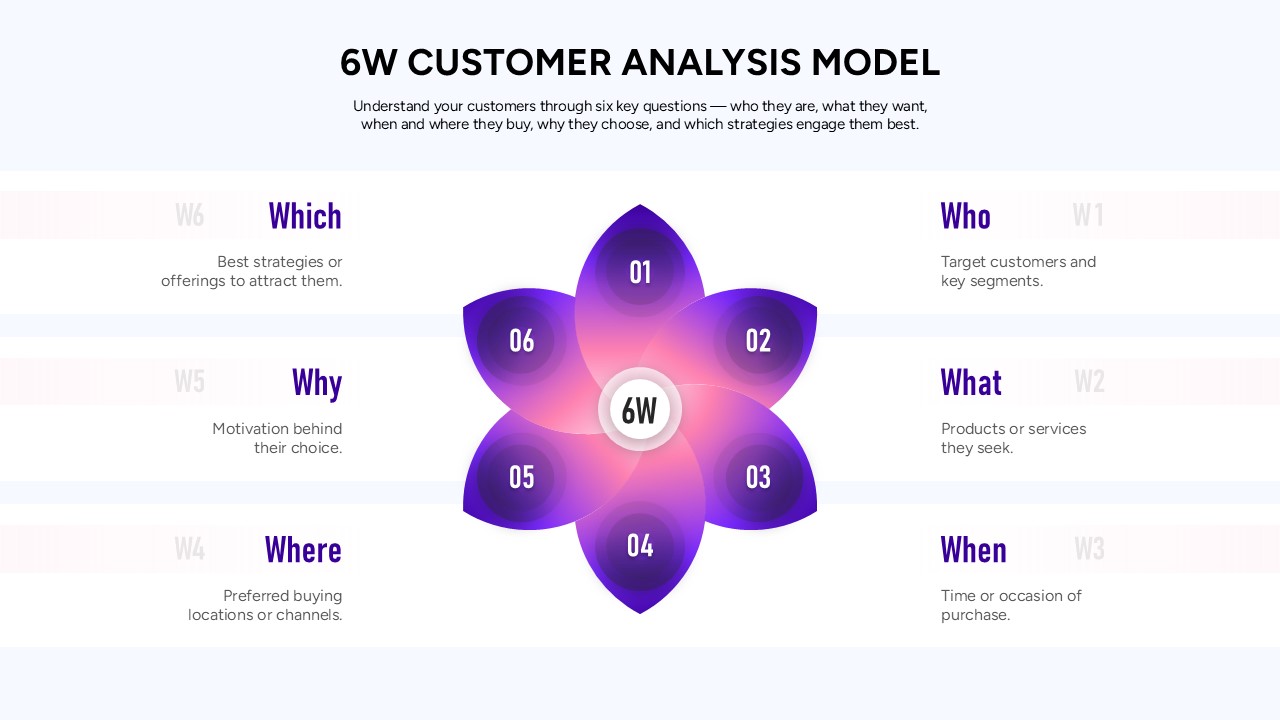
6W Customer Analysis Model Template for PowerPoint & Google Slides
Customer Experience
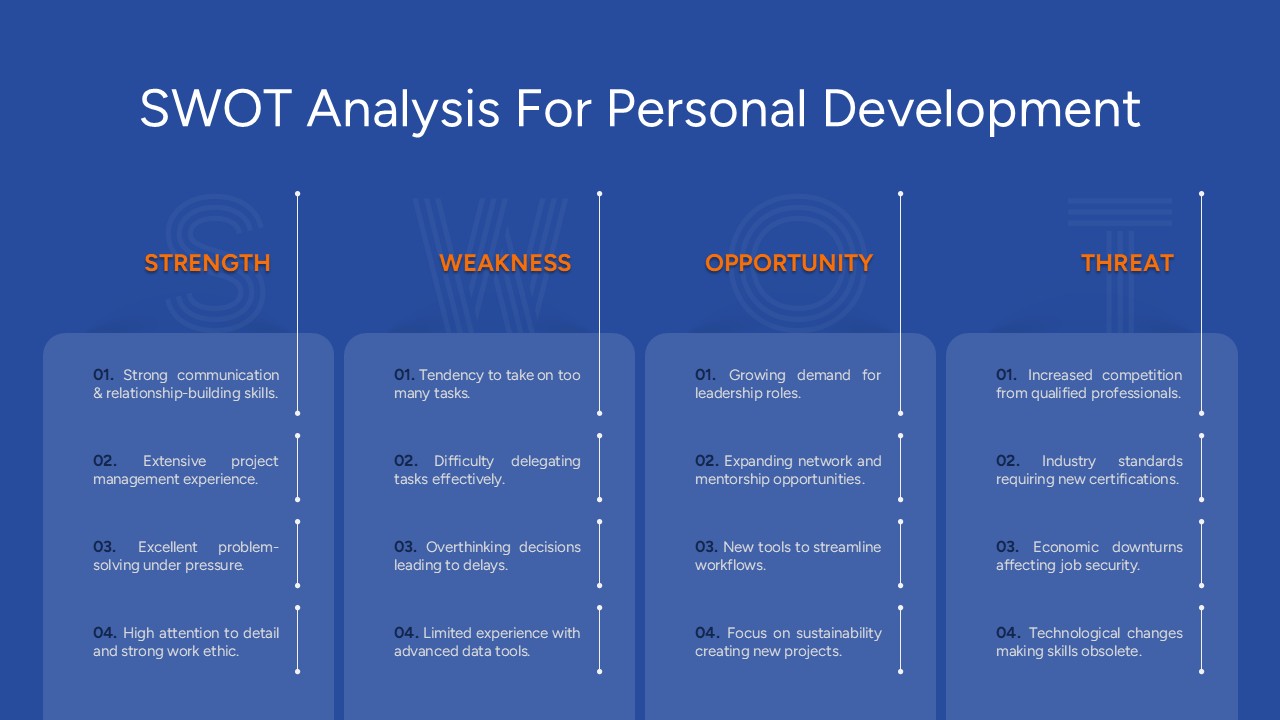
Free SWOT Analysis for Personal Development Template for PowerPoint & Google Slides
SWOT
Free
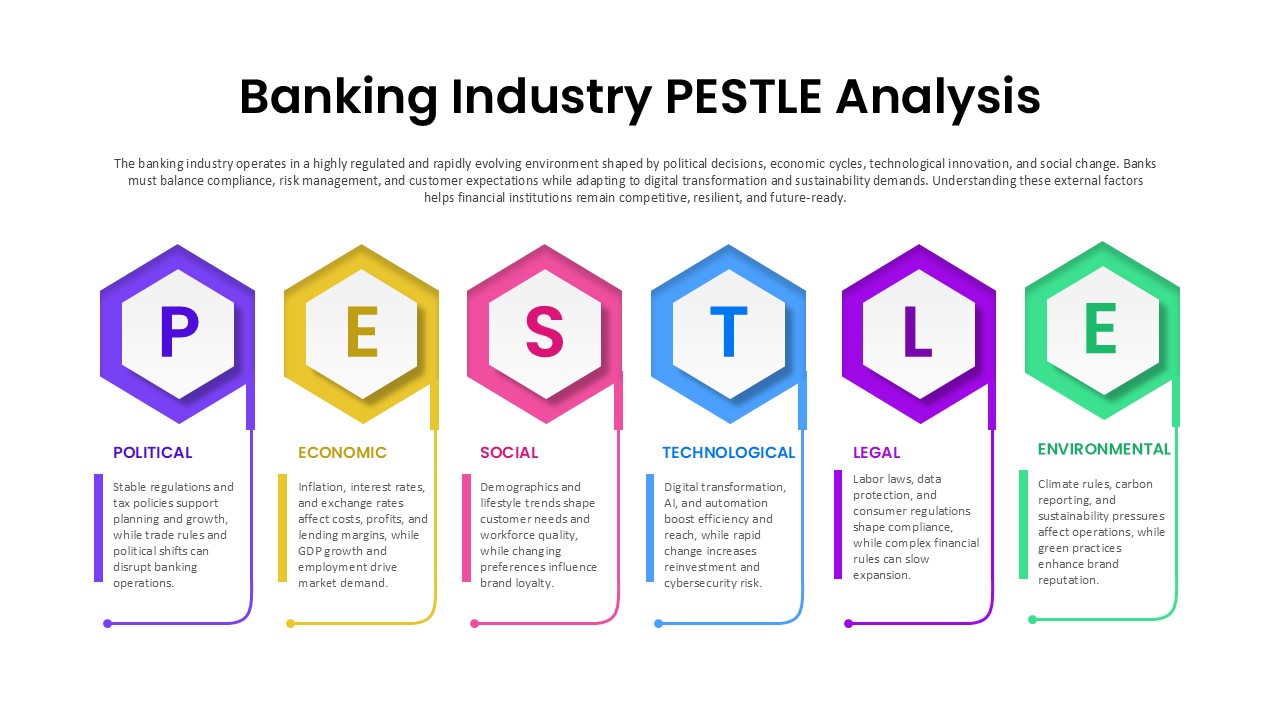
Banking Industry PESTLE Analysis Diagram Template for PowerPoint & Google Slides
PEST