Cycle Chart Template for PowerPoint & Google Slides


Description
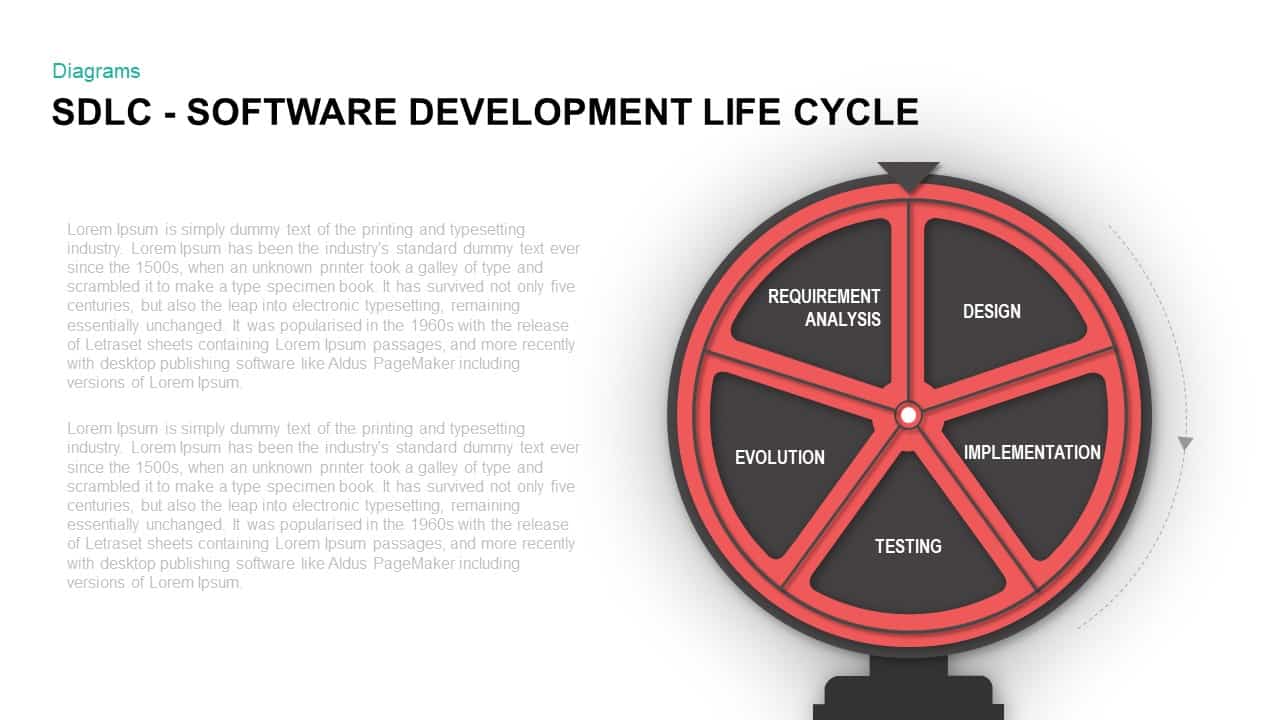
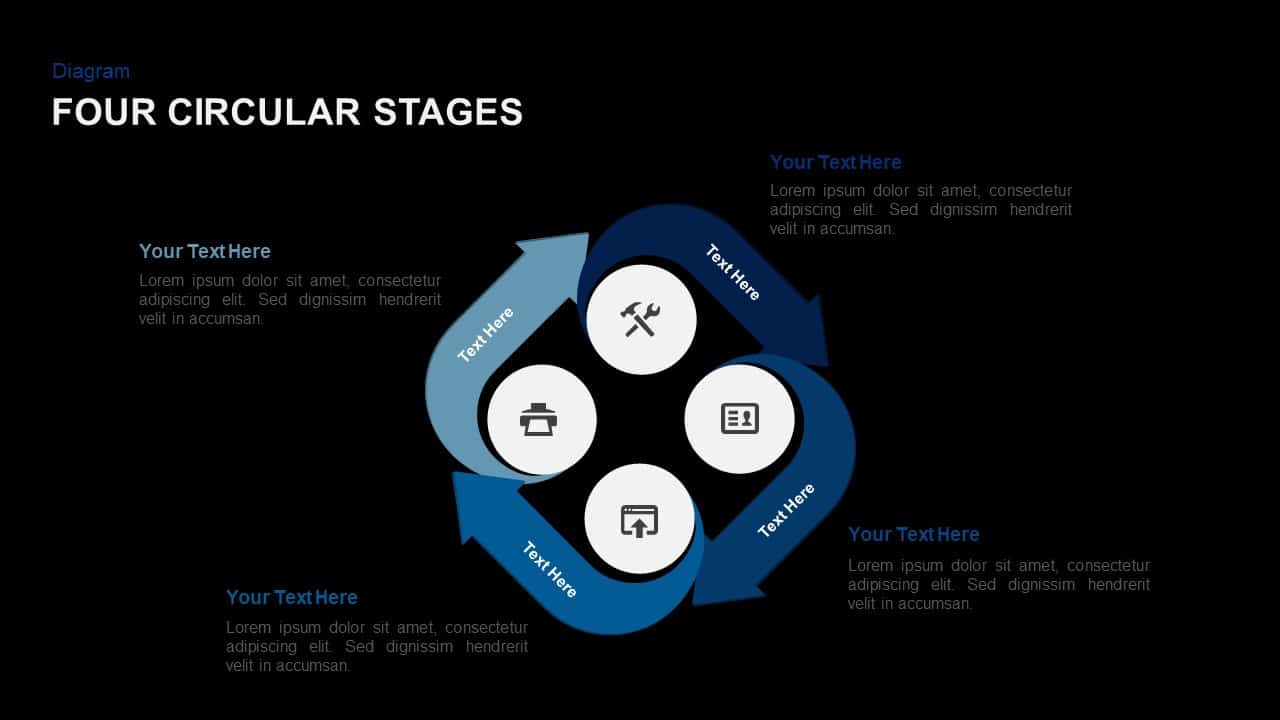
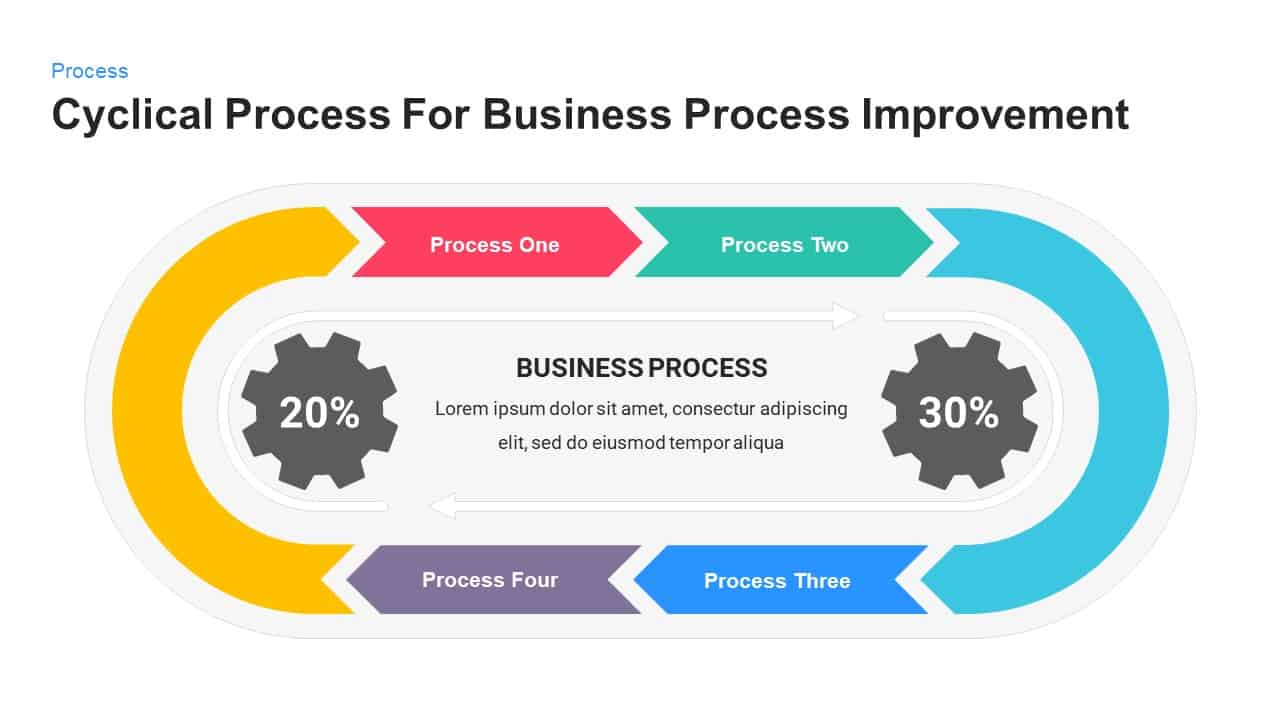
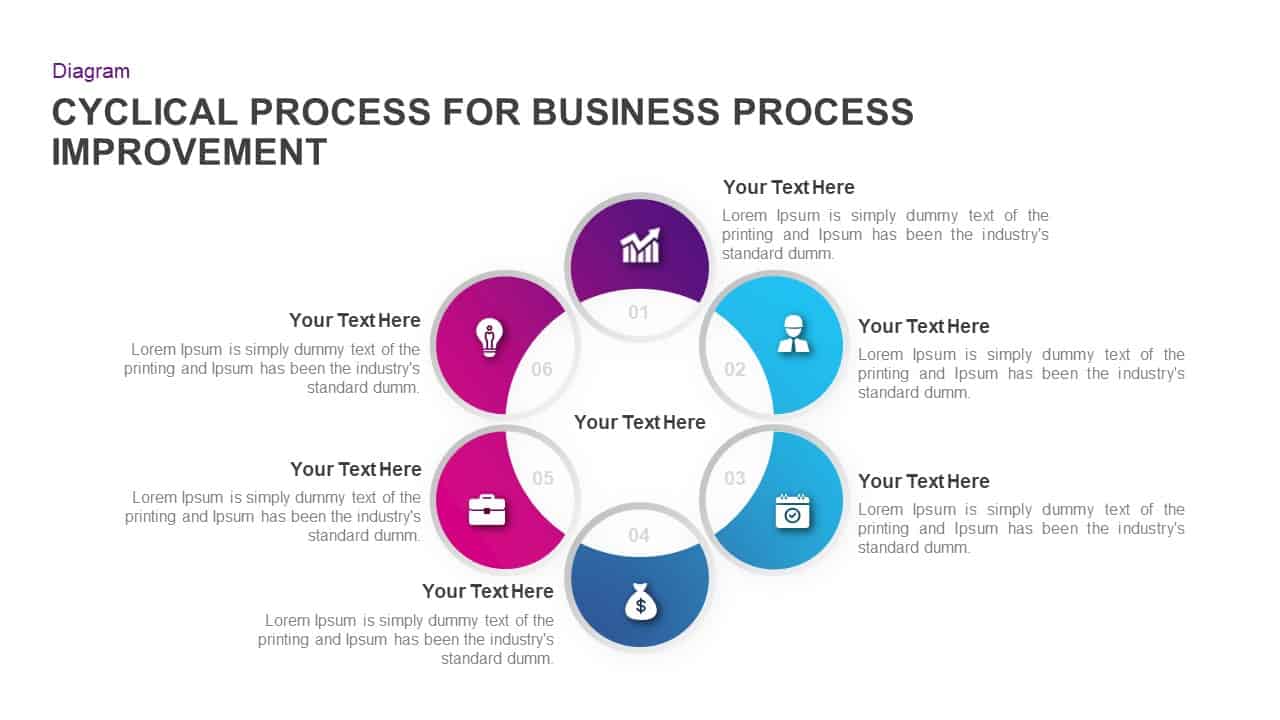
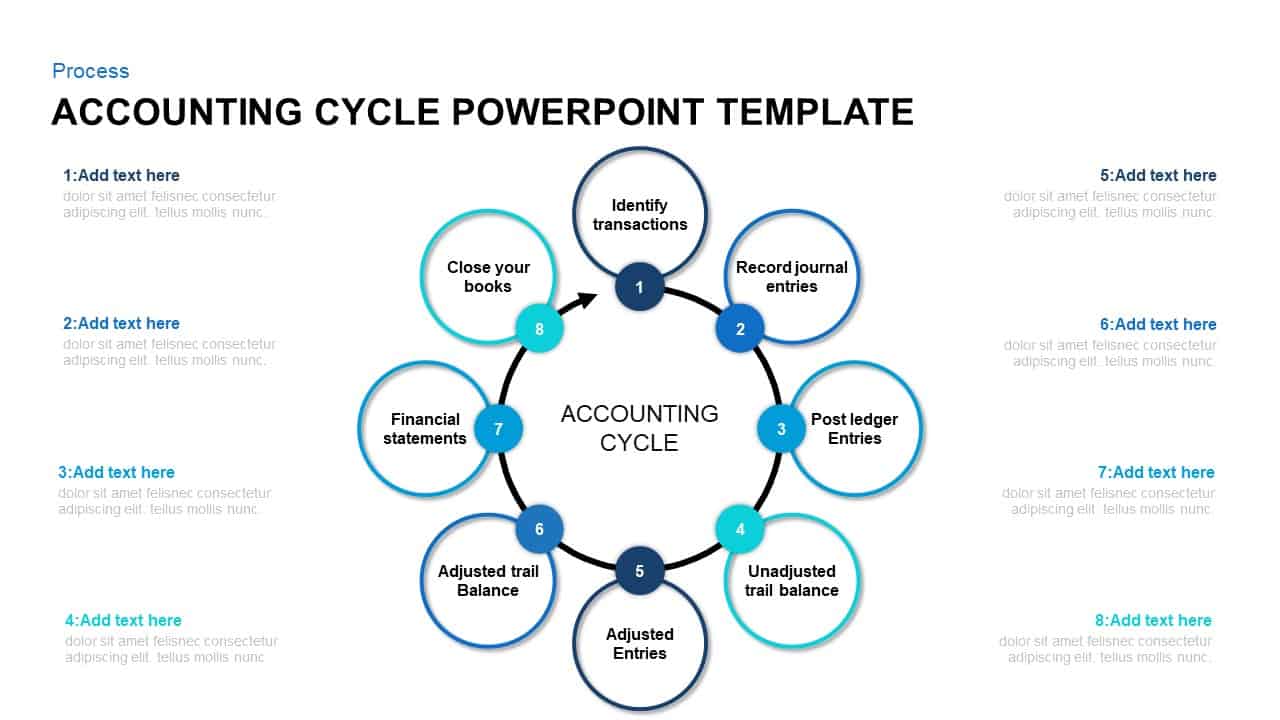
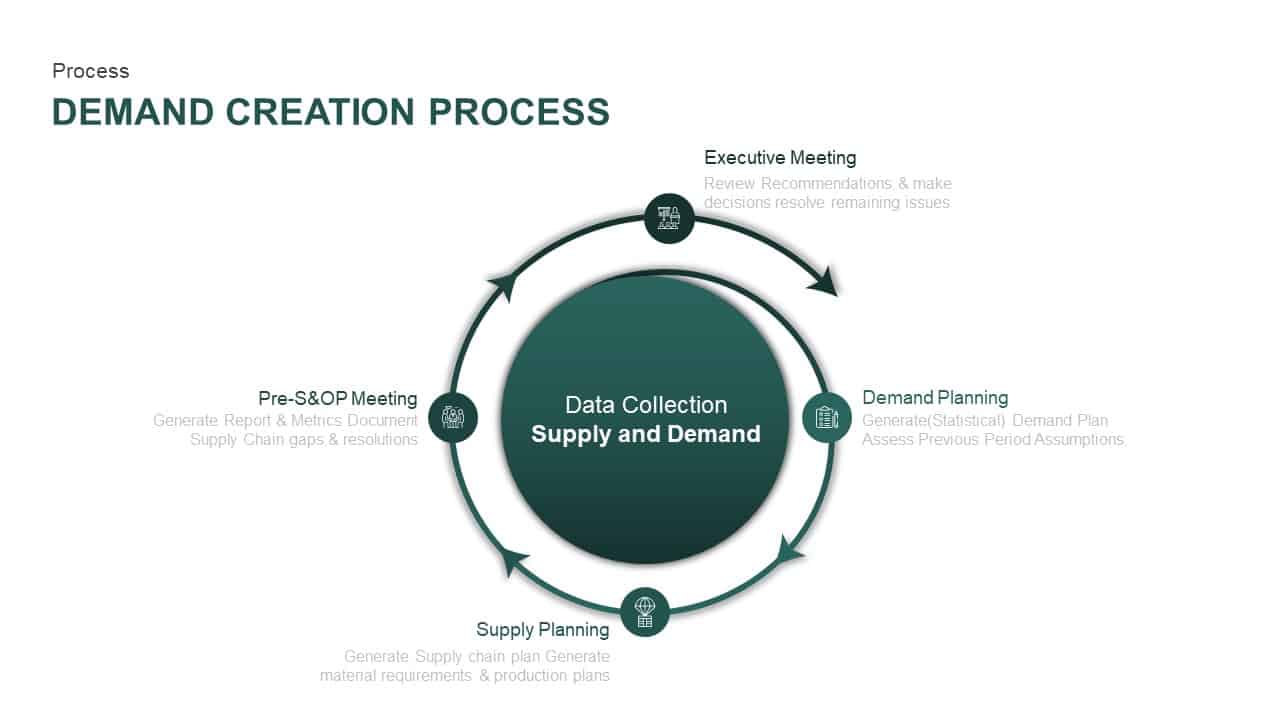
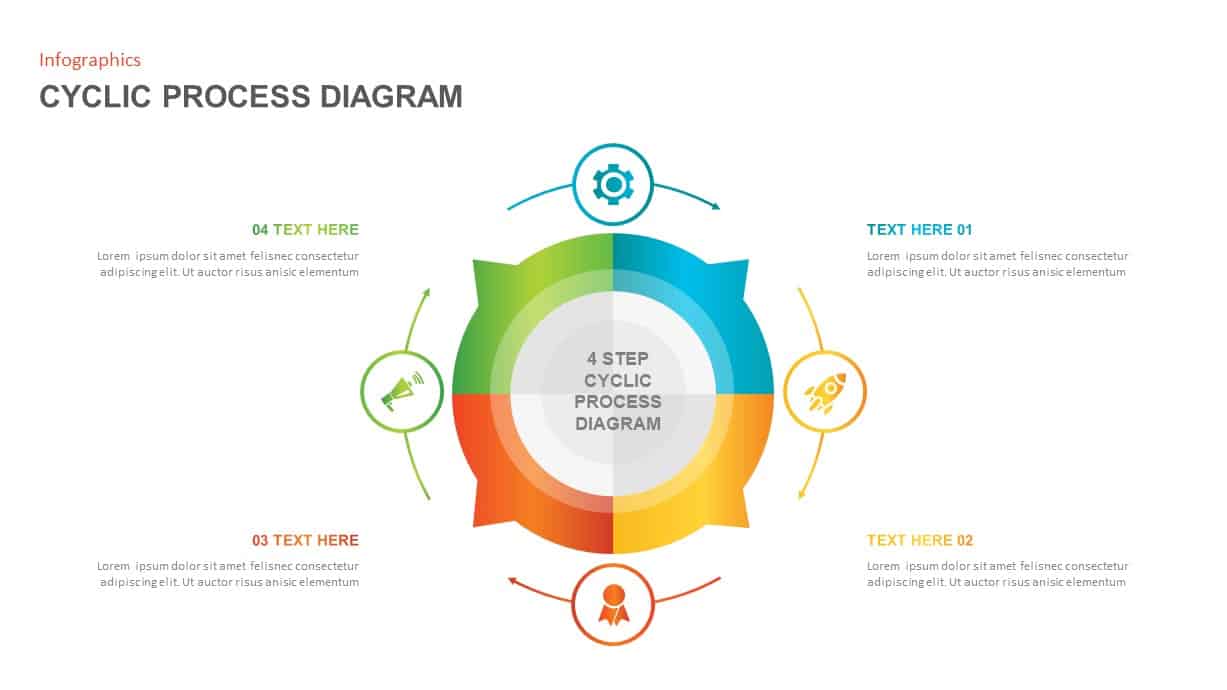
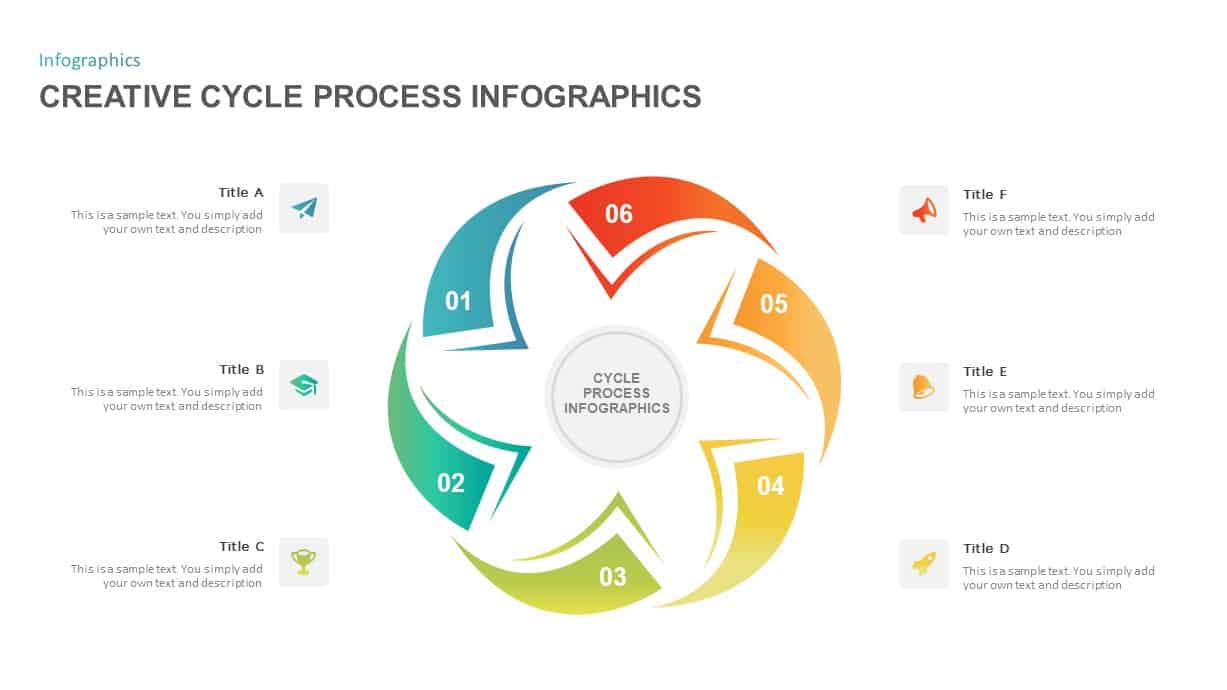
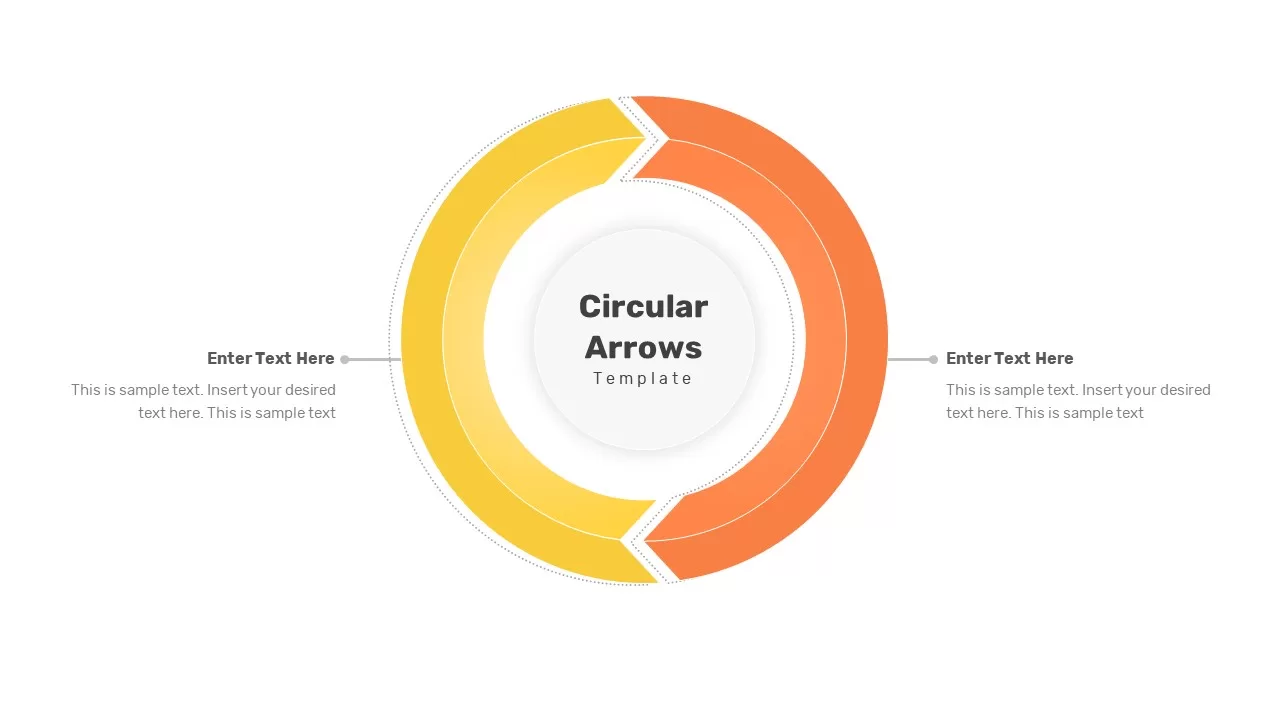
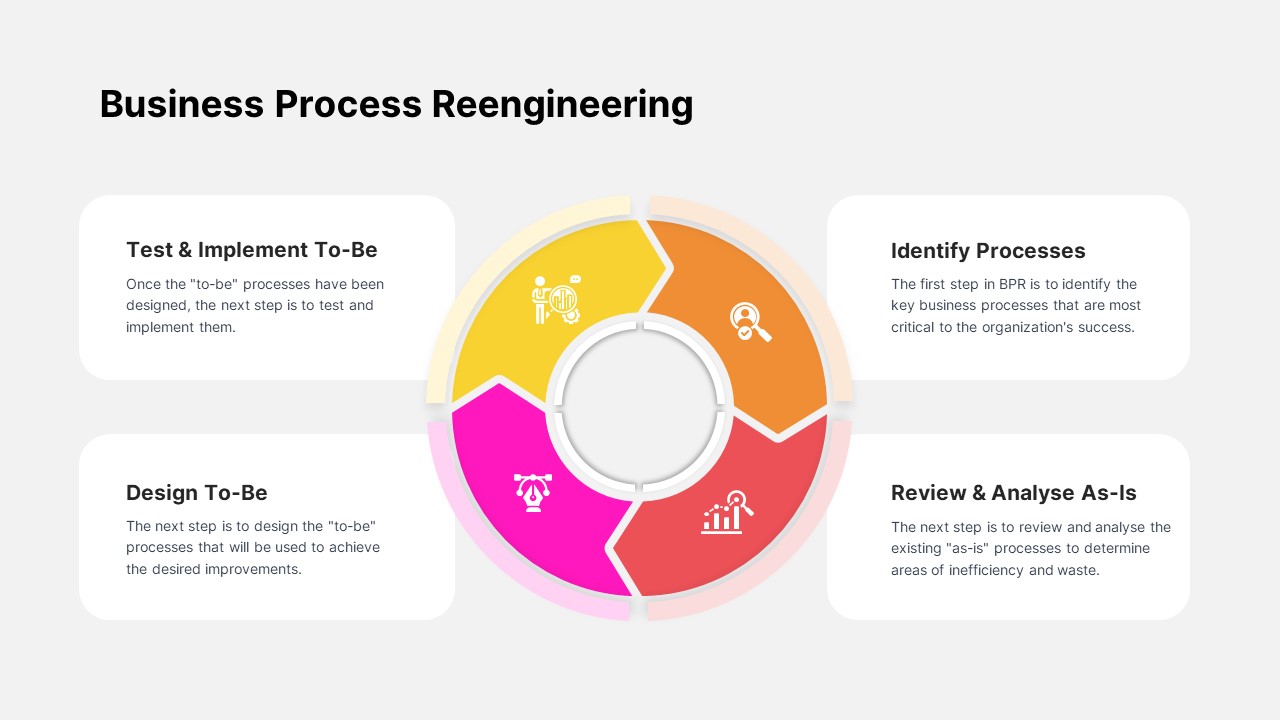
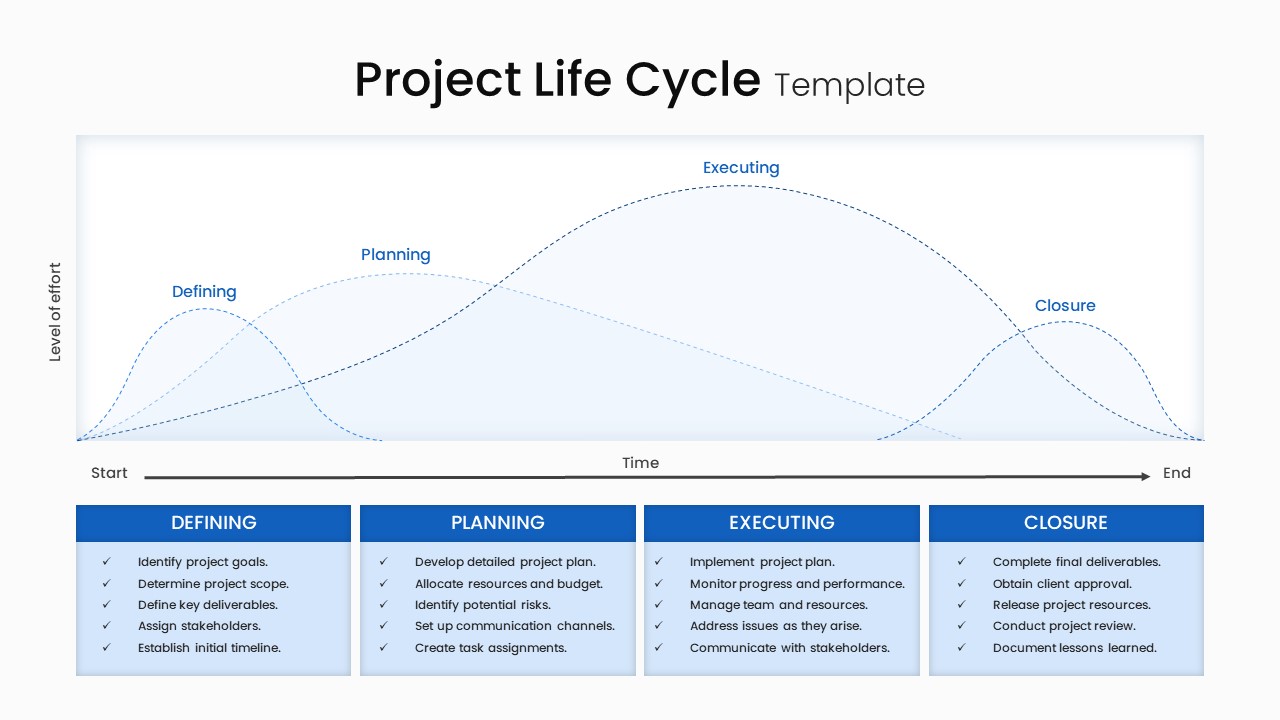
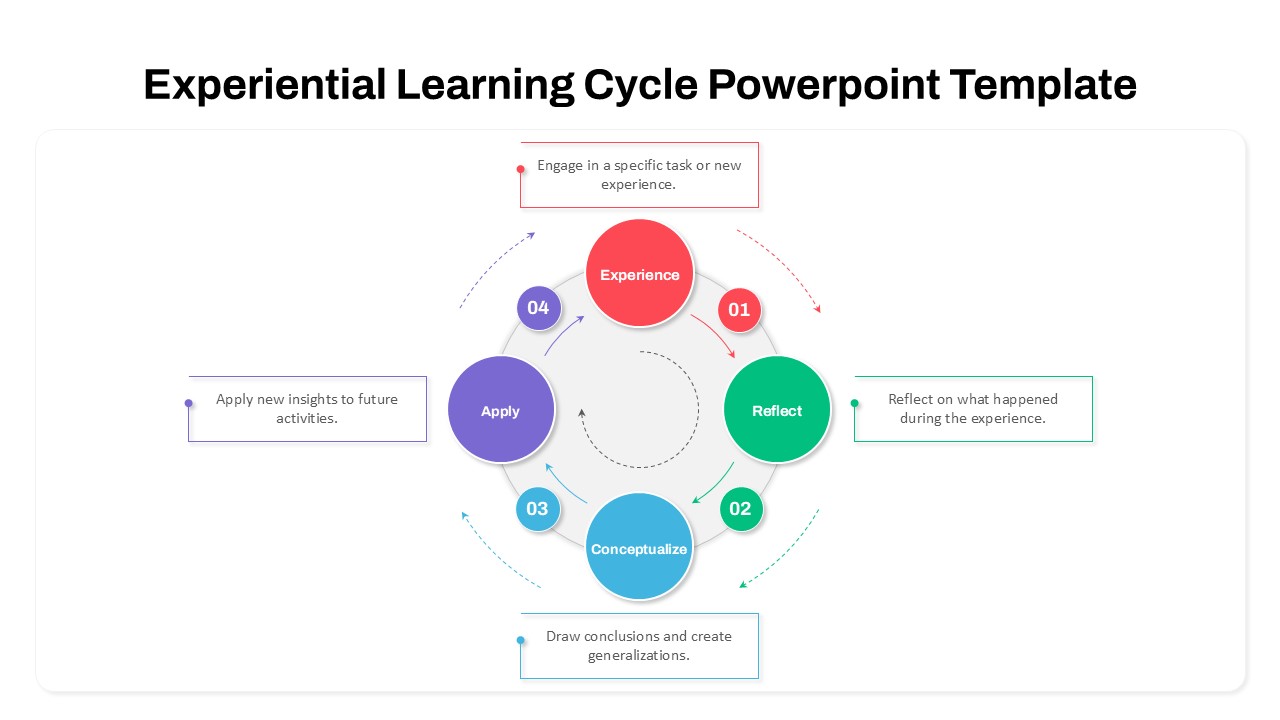
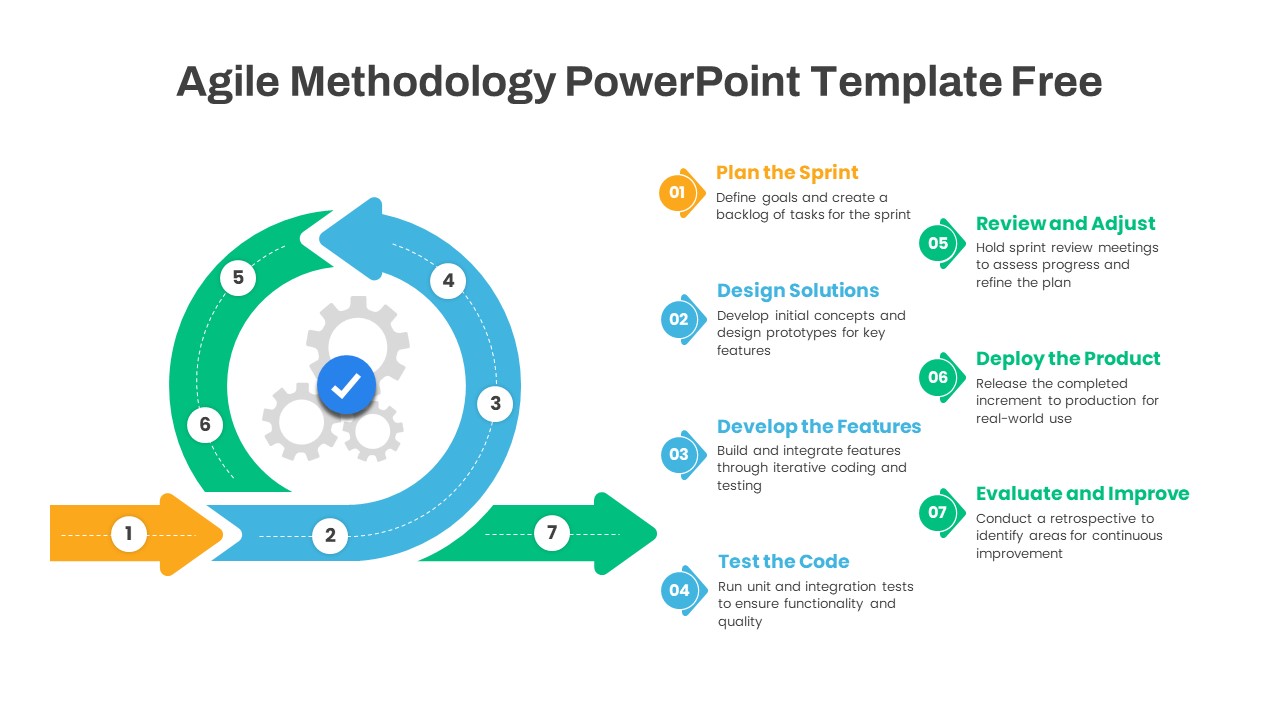
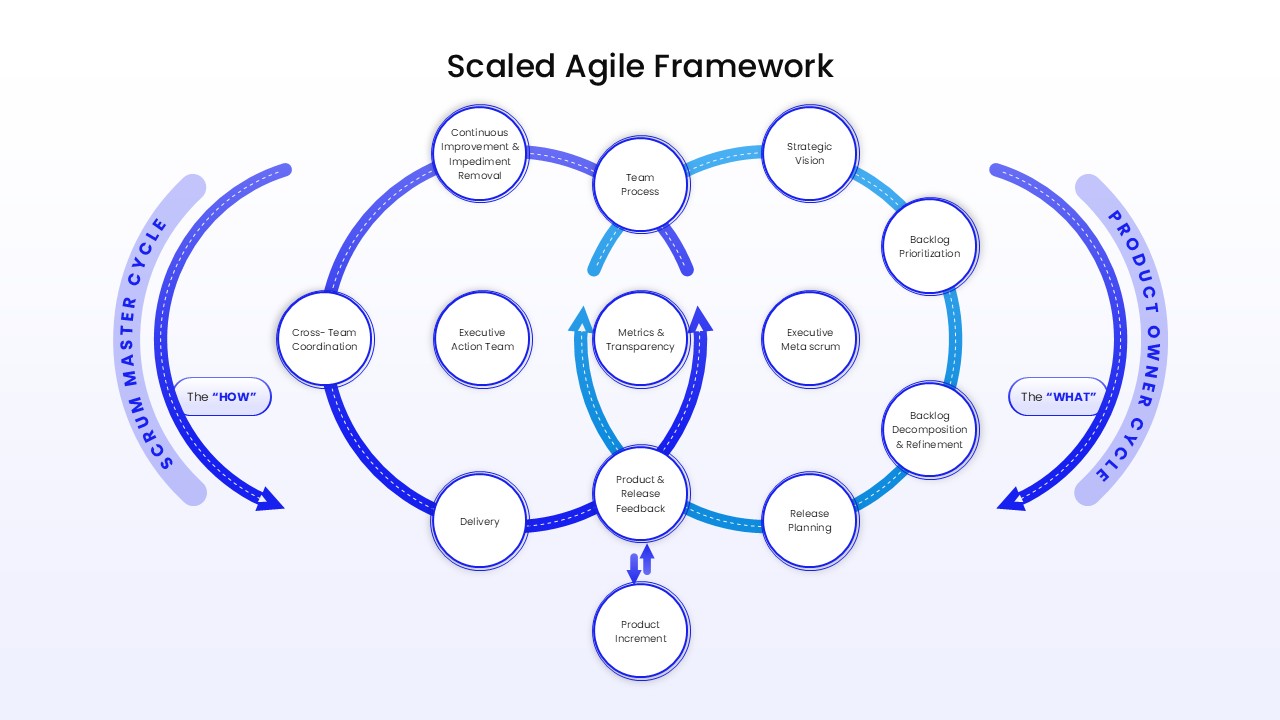
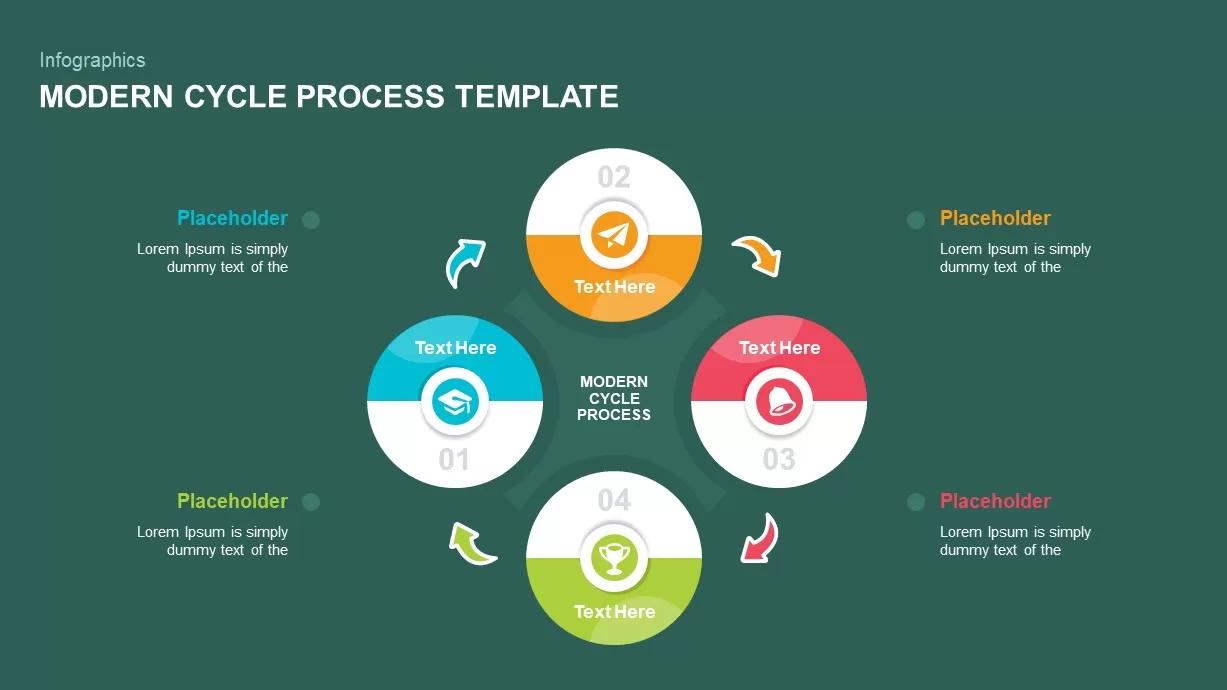
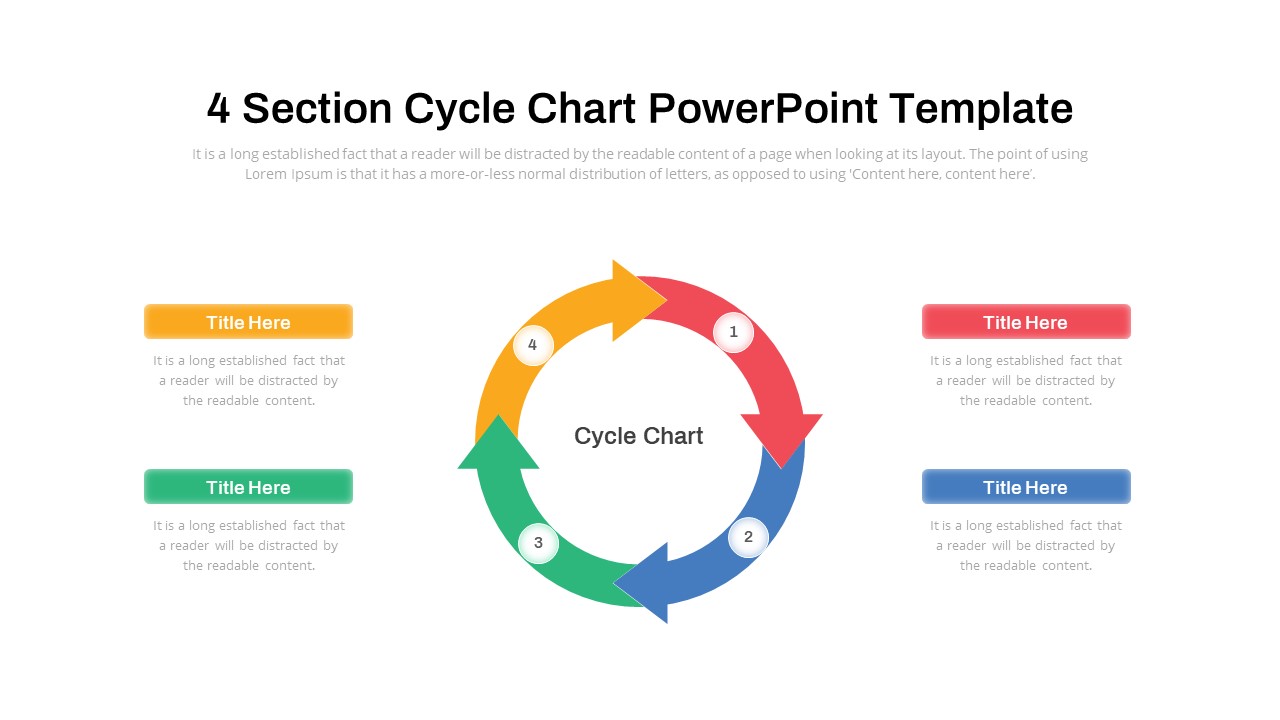
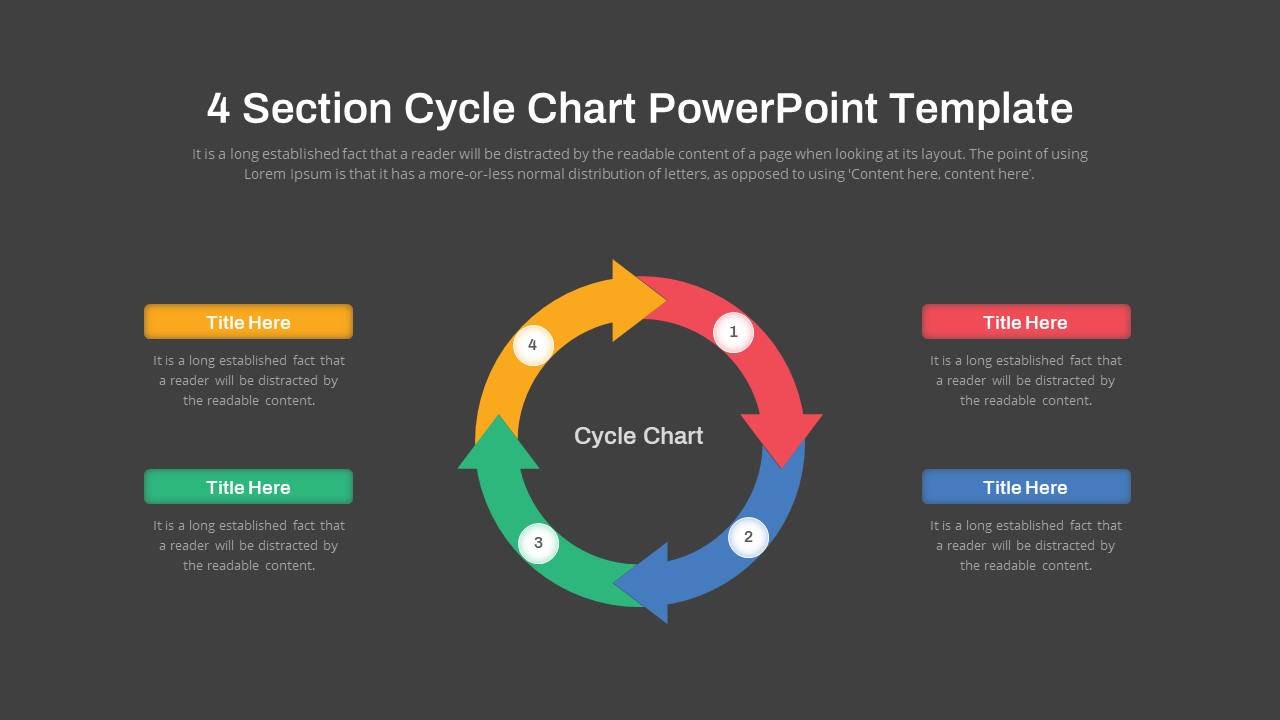
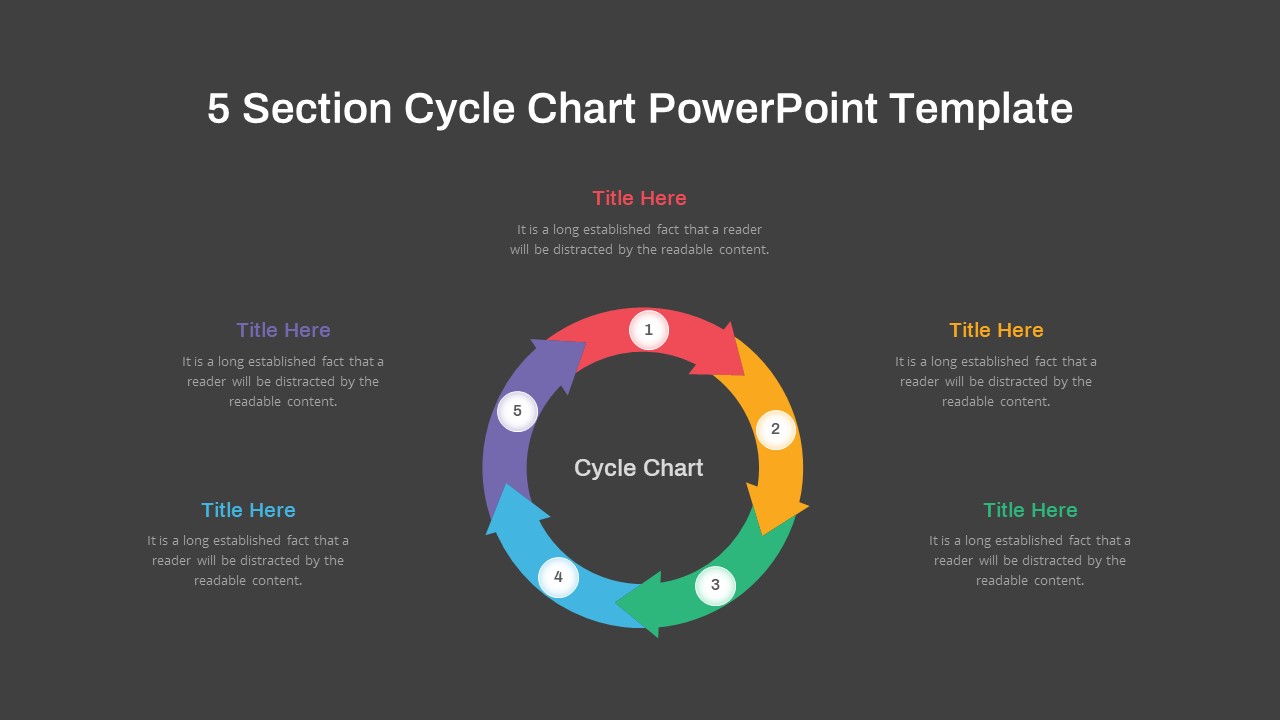
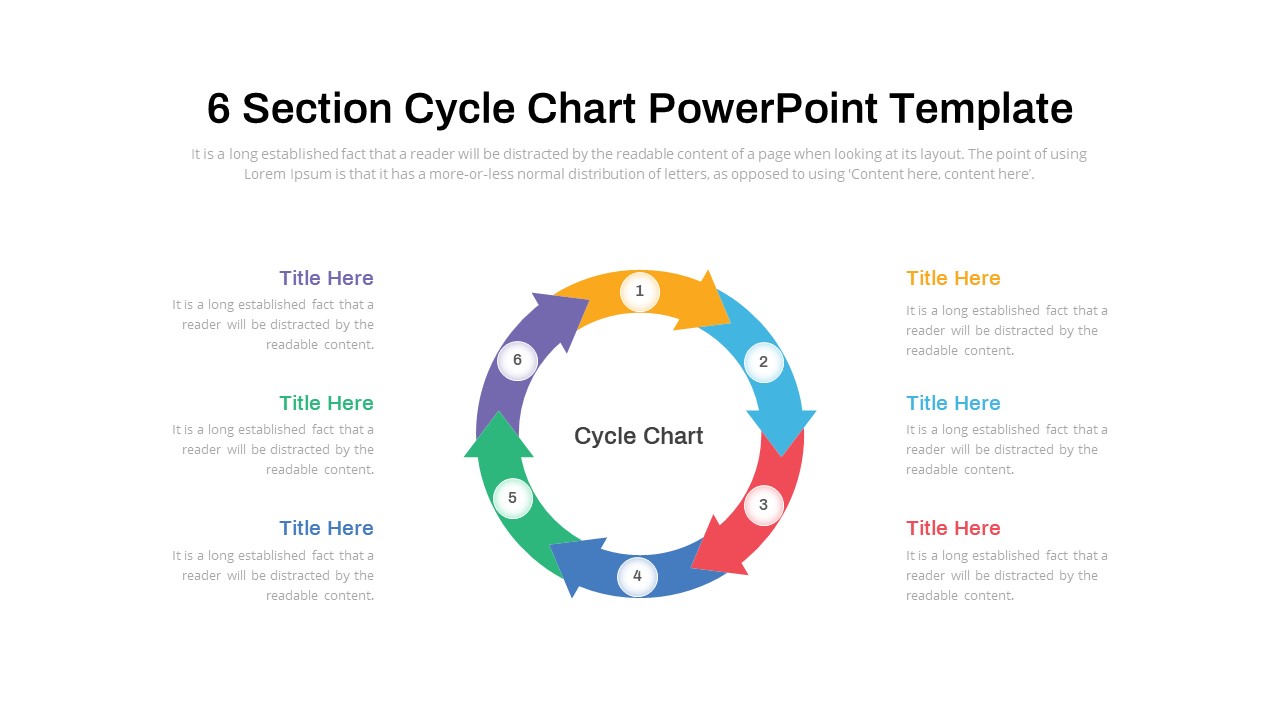
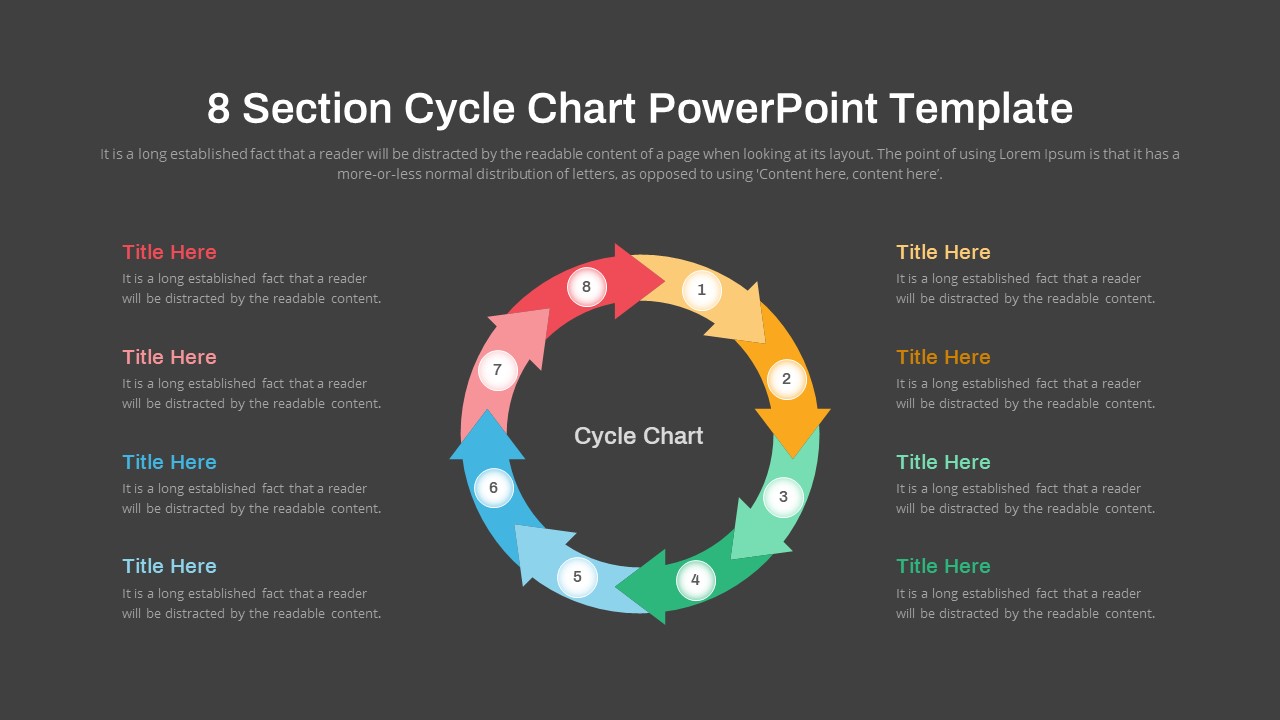
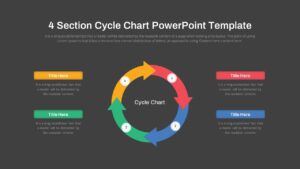
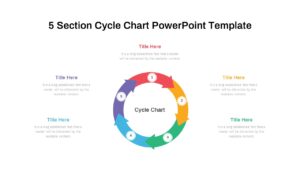
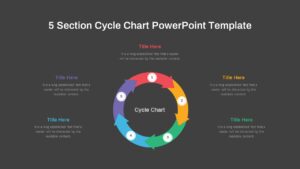
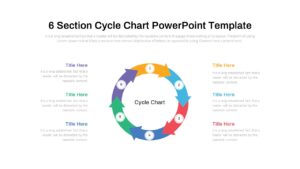
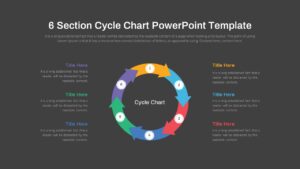
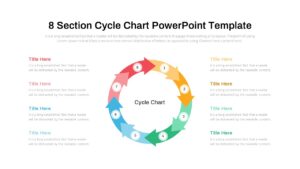
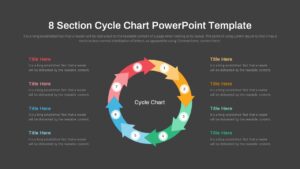
Leverage this versatile cycle chart template to illustrate recurring processes and workflows across 4, 5, 6, or 8 phases with clarity and visual impact. Each variation features directional arrows arranged in a continuous loop, complete with numbered circular markers that guide audience focus through every step in the cycle. The balanced layout positions editable callout panels around the circle, providing dedicated space for concise titles, descriptive text, or key performance indicators without overwhelming the slide. Default color palettes assign red, blue, green, and orange for four-phase charts, while five, six, and eight-section variations introduce yellow and purple accents for distinct differentiation.
A clean white background, subtle drop shadows, and modern sans-serif typography ensure an uncluttered, professional aesthetic that adapts seamlessly to corporate or creative branding. Built on master slides in both PowerPoint and Google Slides, the template supports rapid customization: change arrow colors, swap icons, adjust fonts, or resize shapes in moments. Vector-based graphics maintain pixel-perfect clarity at any scale, guaranteeing crisp visuals on large screens, printed reports, or virtual collaboration platforms. Integrated navigation arrows and smooth slide transitions help preserve design consistency across multi-page decks and guide audiences from one cycle variant to the next.
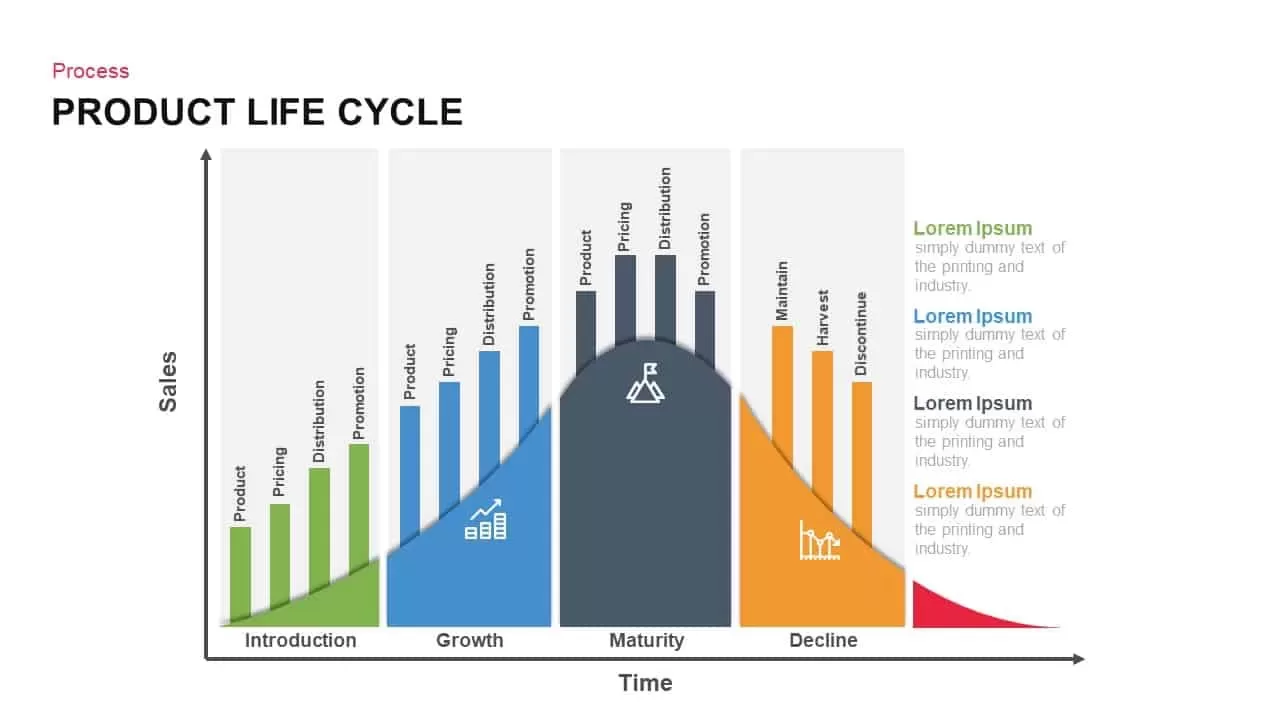
The numbered markers within each arrow improve comprehension, reduce interpretation errors, and reinforce sequential storytelling for strategic roadmaps, lifecycle stages, or feedback loops. Customizable data placeholders and intuitive layout controls accelerate slide creation, helping teams meet tight deadlines with polished deliverables. Whether you are mapping product development cycles, marketing initiatives, operational workflows, or continuous improvement processes, this template adapts to your objectives with minimal effort. This all-in-one cycle chart toolkit empowers presenters to communicate complex cyclical concepts clearly and persuasively.
Who is it for
Project managers, process engineers, product managers, marketing strategists, consultants, and educators will benefit from this cycle chart when illustrating iterative workflows, strategic roadmaps, lifecycle stages, or feedback loops.
Other Uses
Use this template for quality control loops, customer journey mapping, risk assessment cycles, employee onboarding, training sessions, budget review cycles, compliance audits, or sustainability frameworks. Duplicate and rearrange segments to visualize project milestones, resource allocation, performance dashboards, or team alignment exercises.
Login to download this file

Item ID
SB03770
Related Templates

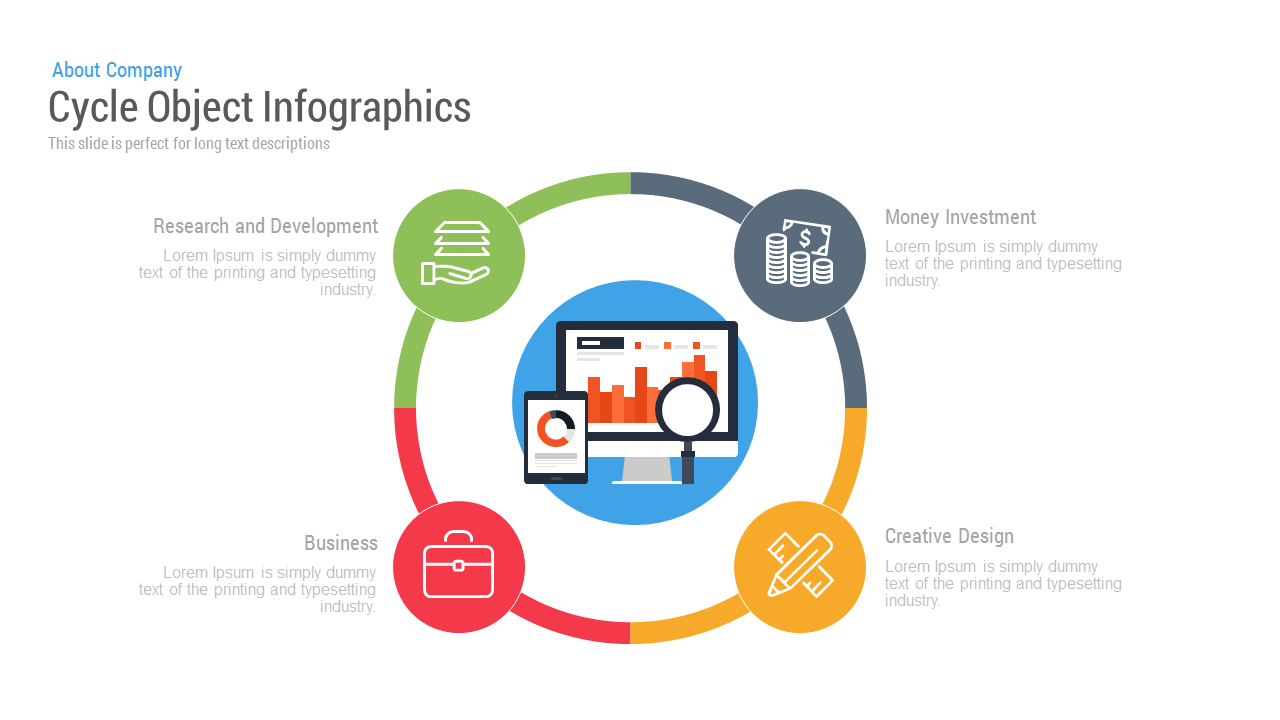
Free Cycle Object Infographics template for PowerPoint & Google Slides
Process
Free
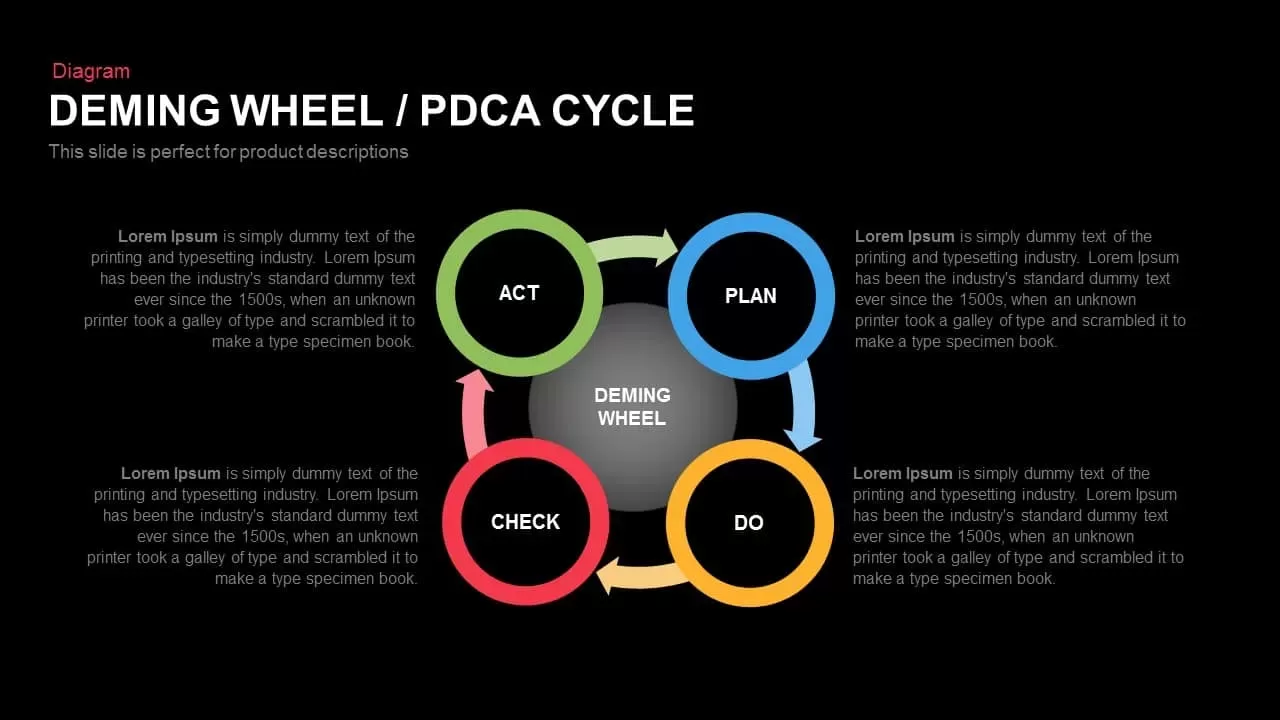
Deming Wheel PDCA Cycle Diagram Template for PowerPoint & Google Slides
Business Plan
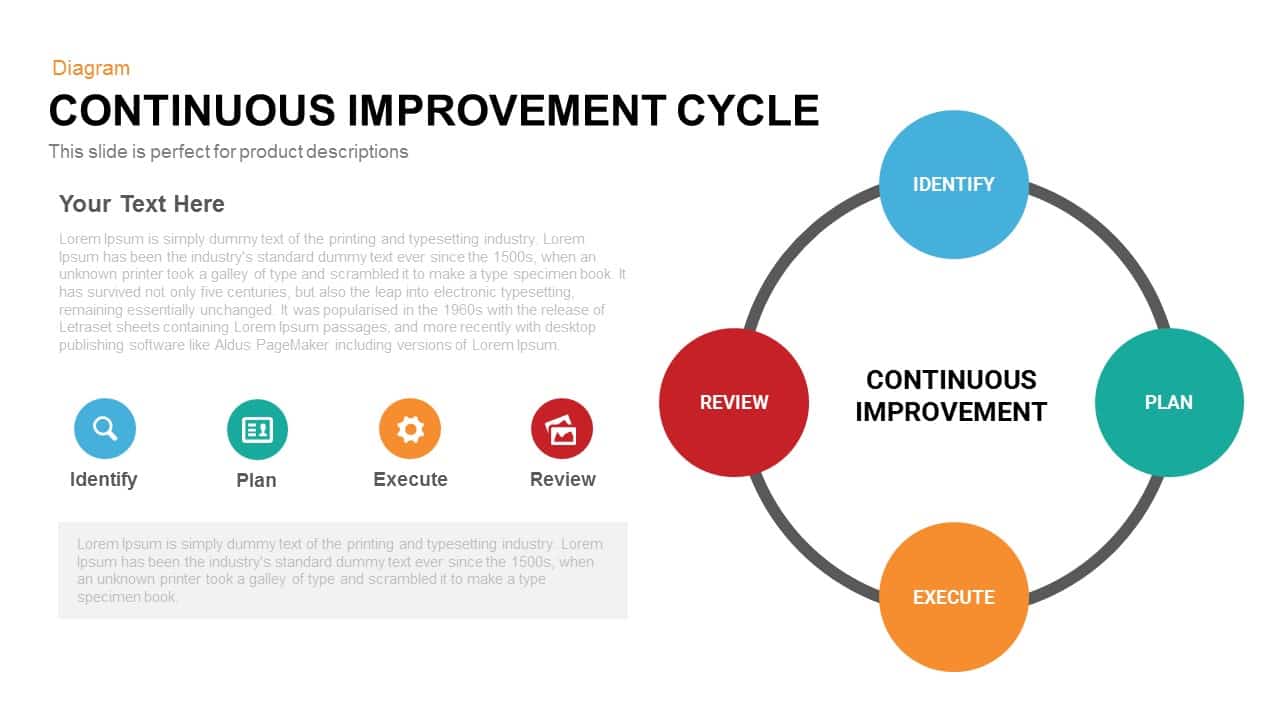
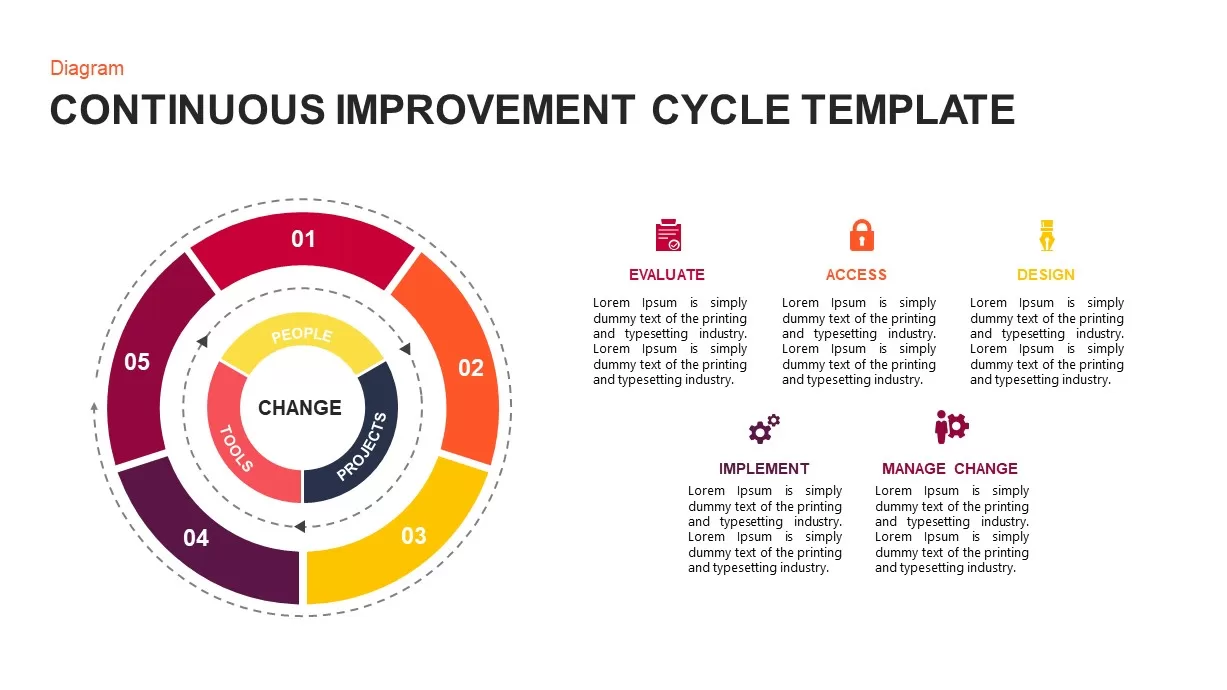
Continuous Improvement Cycle Diagram Template for PowerPoint & Google Slides
Circular
Modern Five-Stage Cycle Process Diagram Template for PowerPoint & Google Slides
Process
Six-Stage Circular Cycle Diagram Template for PowerPoint & Google Slides
Process
Four-Point Arrow Cycle Diagram Template for PowerPoint & Google Slides
Arrow

Data-Driven Marketing Cycle Diagram Template for PowerPoint & Google Slides
Customer Journey
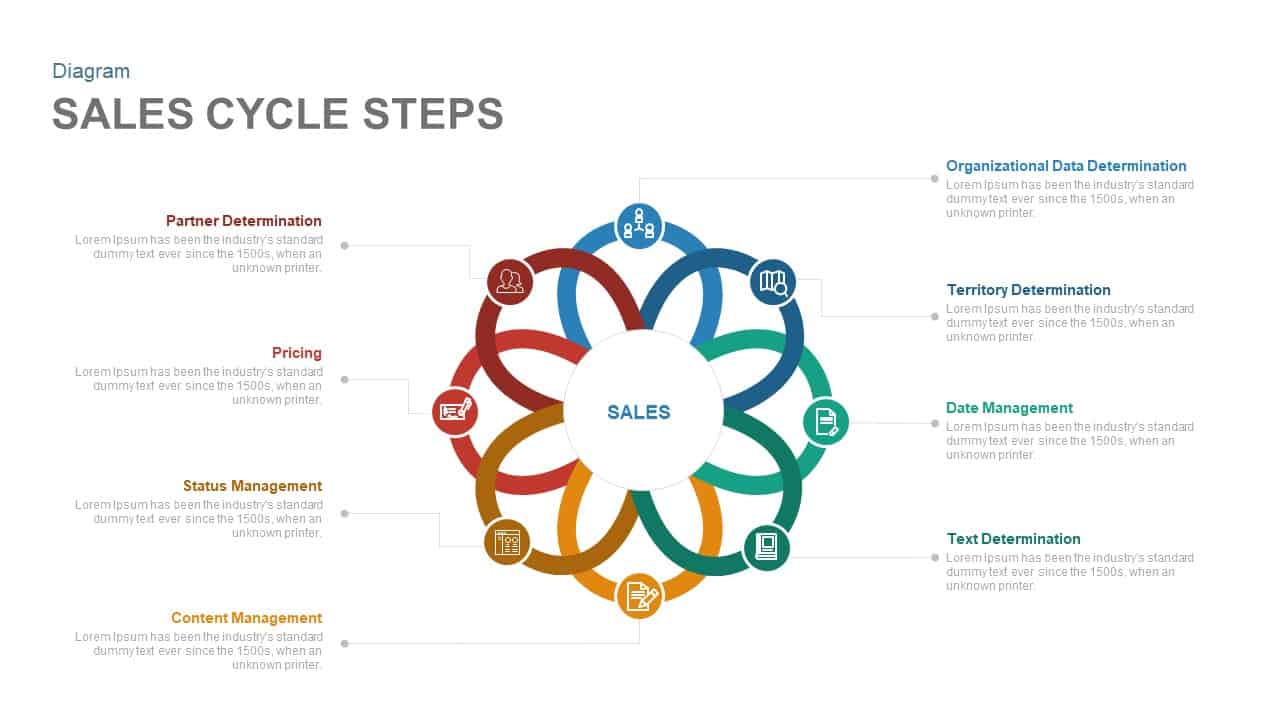
Eight-Step Sales Cycle Diagram Template for PowerPoint & Google Slides
Process
Software Development Life Cycle Diagram Template for PowerPoint & Google Slides
Circular
Performance Review Process Management Cycle template for PowerPoint & Google Slides
Employee Performance
3, 4 & 5 Circular Stages Cycle Diagram Deck Template for PowerPoint & Google Slides
Circular
Business Process Improvement Cycle Template for PowerPoint & Google Slides
Process
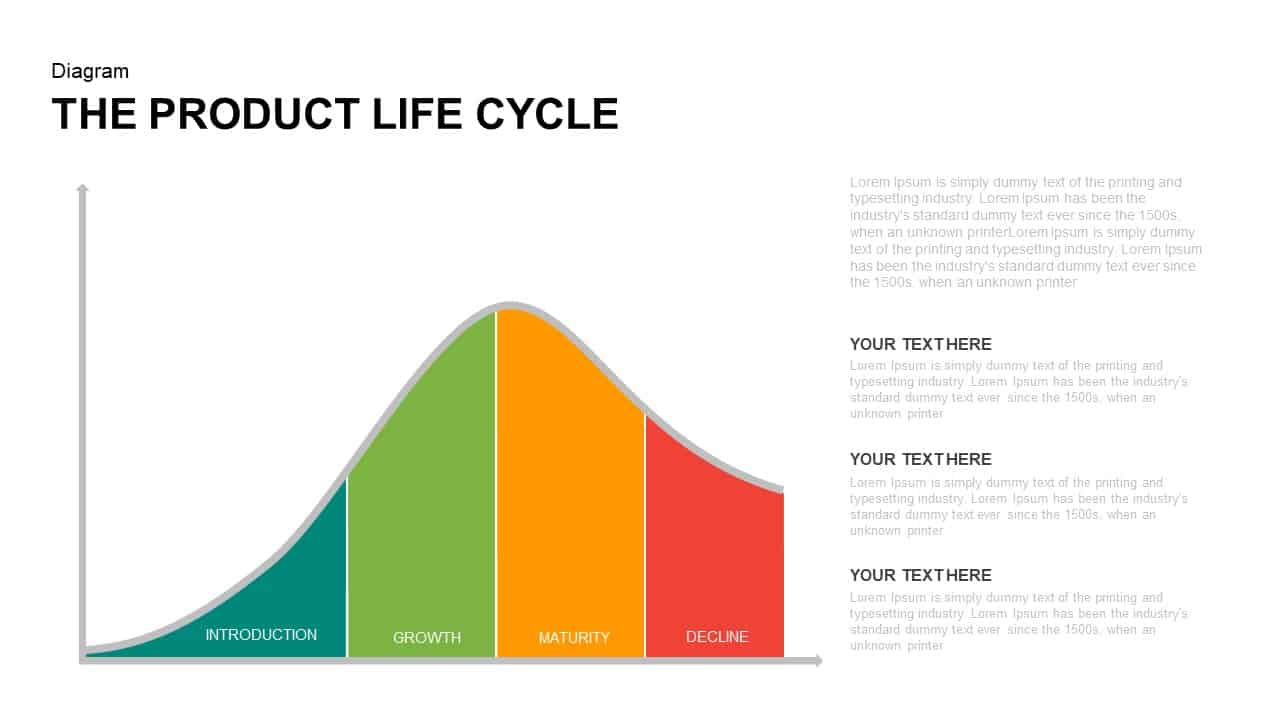
Product Life Cycle Infographics template for PowerPoint & Google Slides
Business
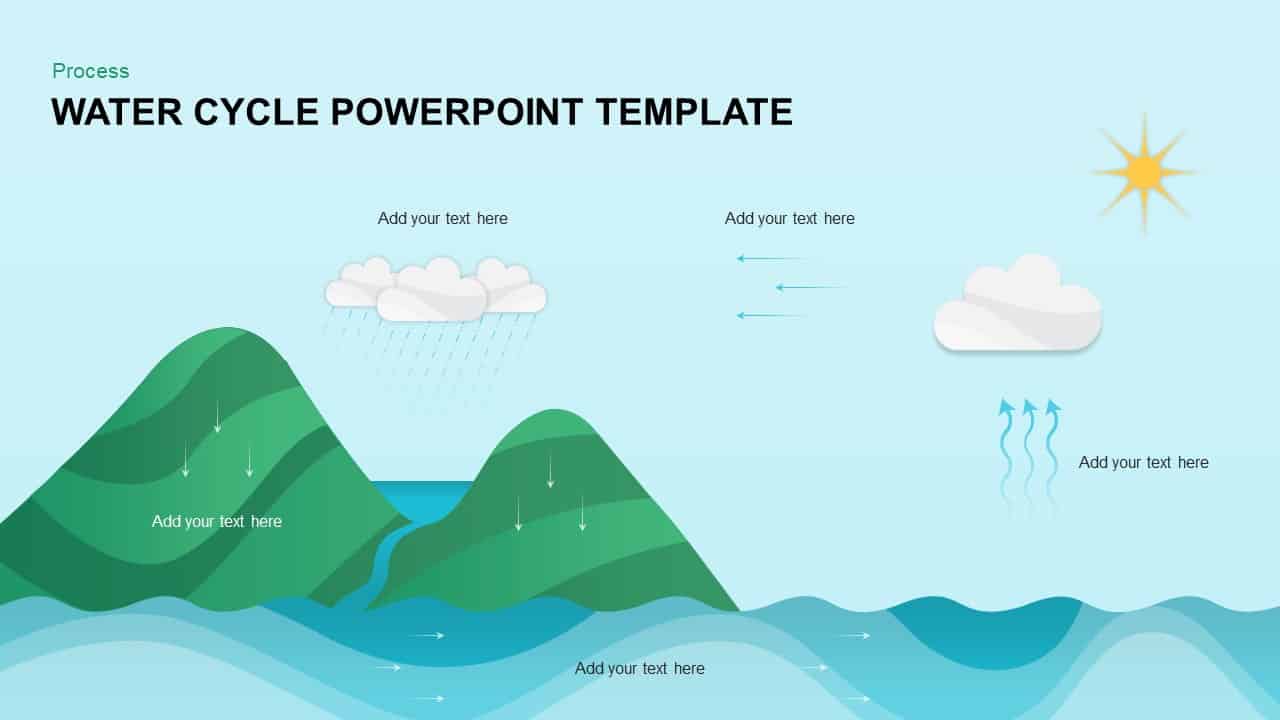
Water Cycle Process Infographic Template for PowerPoint & Google Slides
Process
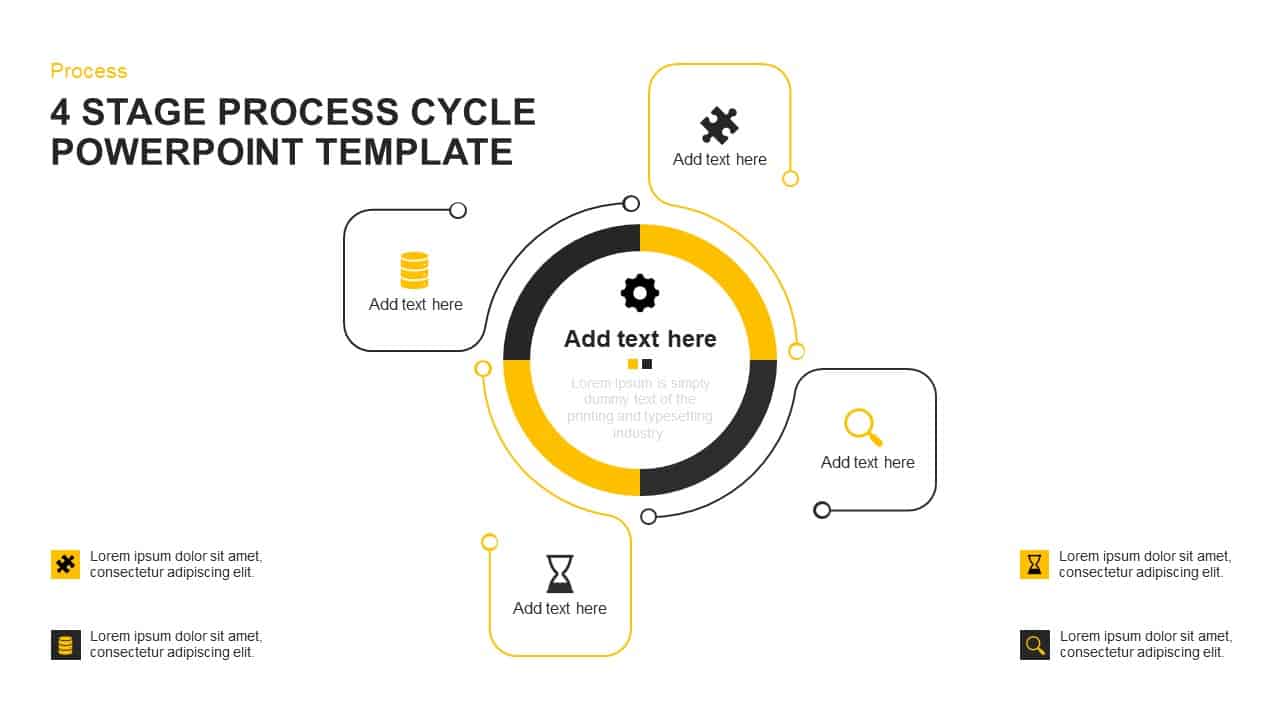
Four-Stage Cycle Process Diagram Template for PowerPoint & Google Slides
Process
Four-Stage Process Cycle Variations Pack Template for PowerPoint & Google Slides
Process
Data Migration Life Cycle Curved Diagram Template for PowerPoint & Google Slides
Process
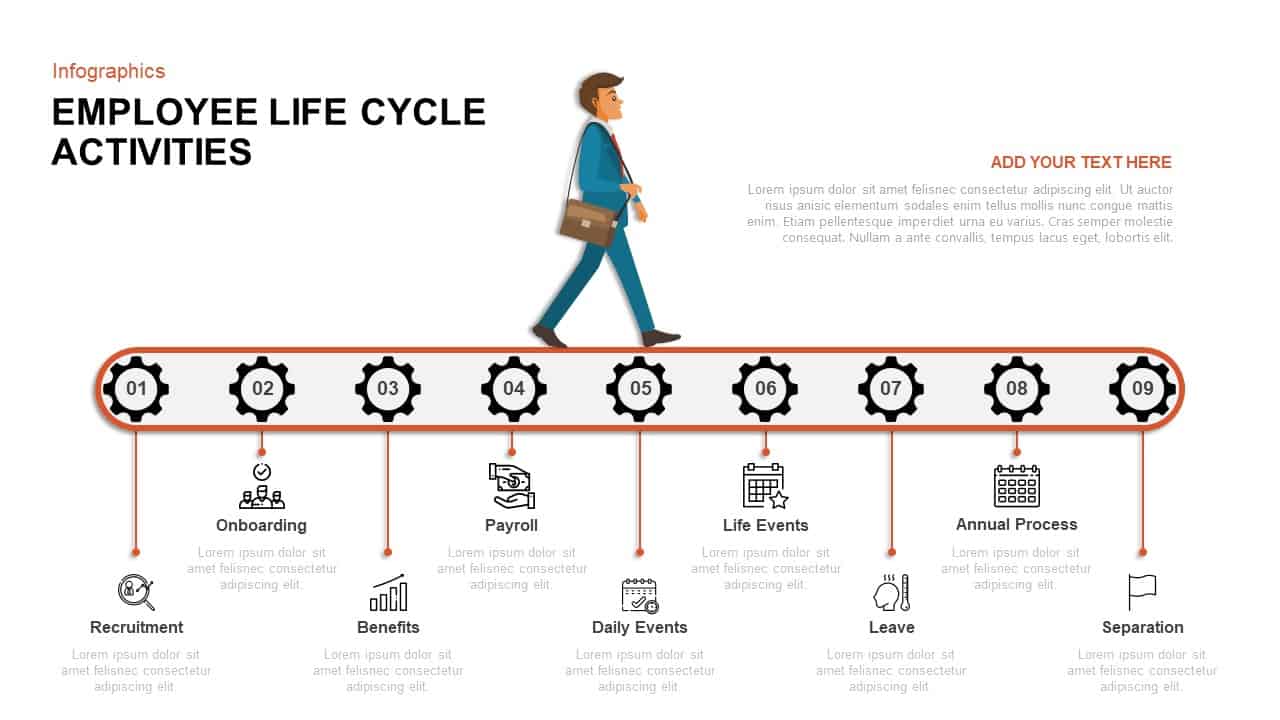
Employee Life Cycle Activities Template for PowerPoint & Google Slides
Timeline
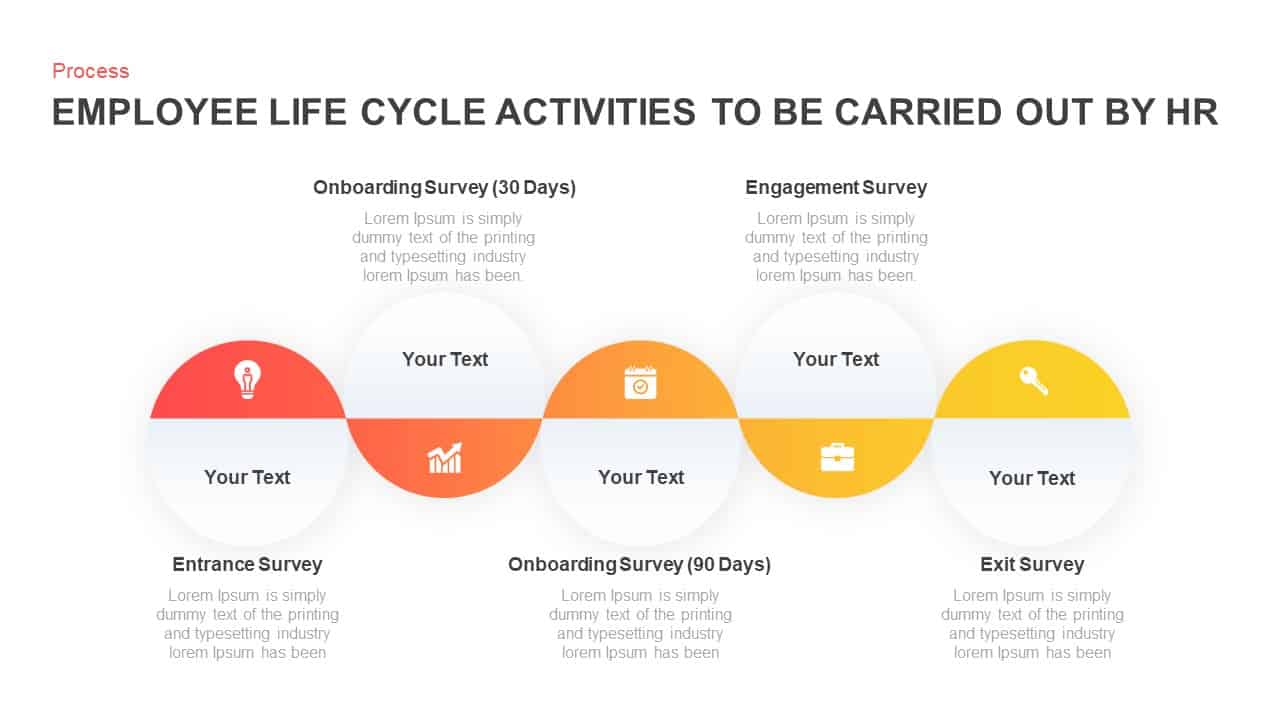
Employee Life Cycle Activities Process Template for PowerPoint & Google Slides
Employee Performance
Business Process Improvement Cycle Template for PowerPoint & Google Slides
Circular
8-Step Circular Accounting Cycle Diagram Template for PowerPoint & Google Slides
Accounting
Multi-Style Project Life Cycle Diagram Template for PowerPoint & Google Slides
Process
Supply and Demand Creation Cycle Diagram Template for PowerPoint & Google Slides
Process
Strategic ADL Matrix by Industry Life Cycle & Position Template for PowerPoint & Google Slides
Business Strategy

Modern 6-Step Cycle Diagram Slide Deck Template for PowerPoint & Google Slides
Process
Creative Cycle Process Infographics Template for PowerPoint & Google Slides
Process
Corporate Product Life Cycle Diagram Template for PowerPoint & Google Slides
Process
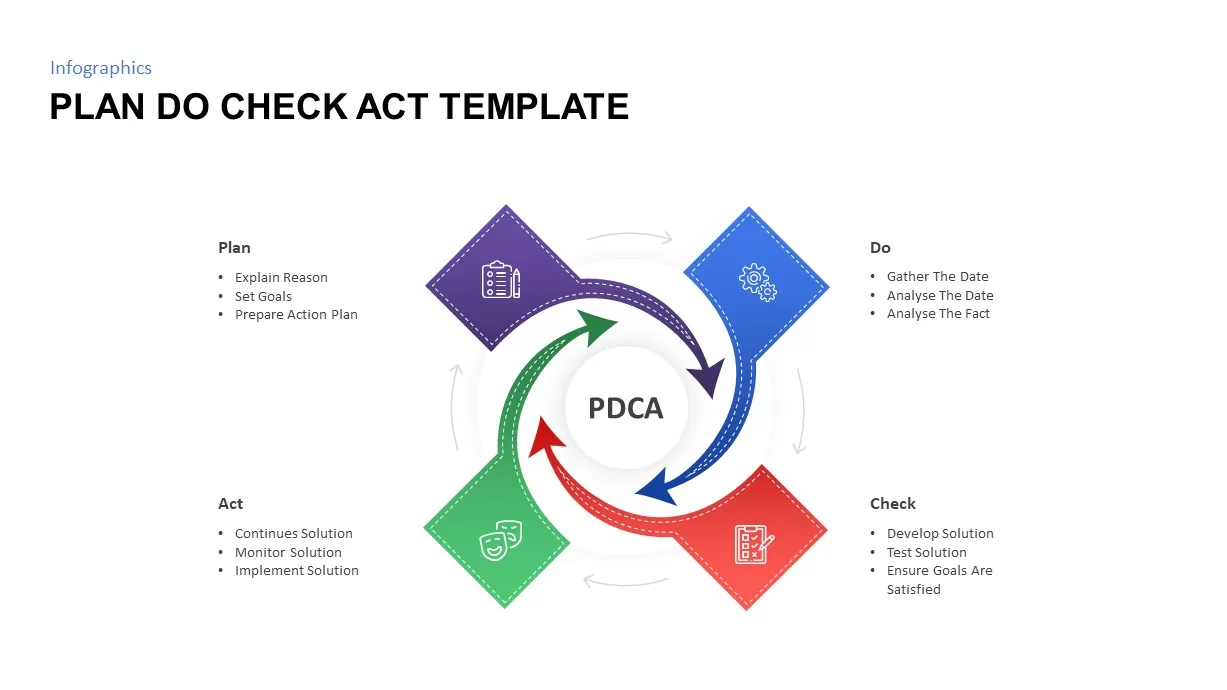
Plan Do Check Act PDCA Cycle Infographic Template for PowerPoint & Google Slides
Process
Enterprise Risk Management Cycle Diagram Template for PowerPoint & Google Slides
Process
4MAT Learning Cycle Circular Diagram Template for PowerPoint & Google Slides
Circular
4-Step Circular PDCA Cycle Diagram Template for PowerPoint & Google Slides
Process
Continuous Improvement Cycle Diagram Template for PowerPoint & Google Slides
Process
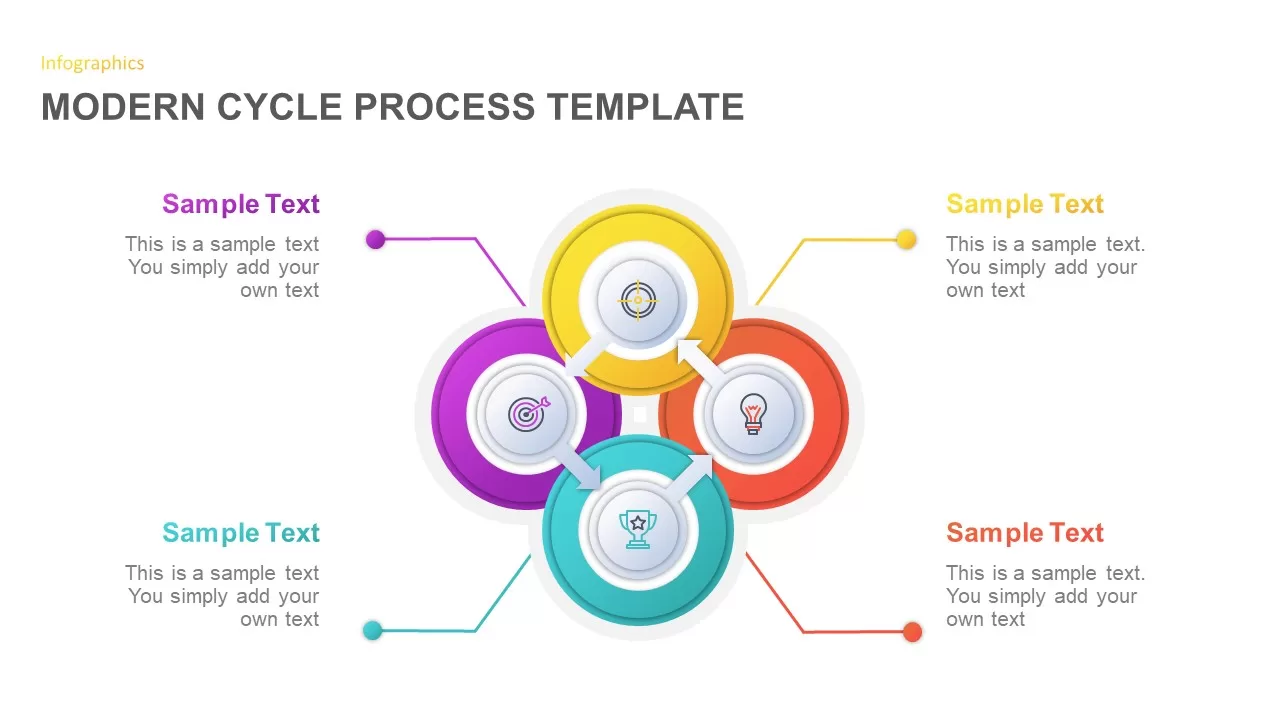
Modern Cycle Process Template for PowerPoint & Google Slides
Business Proposal
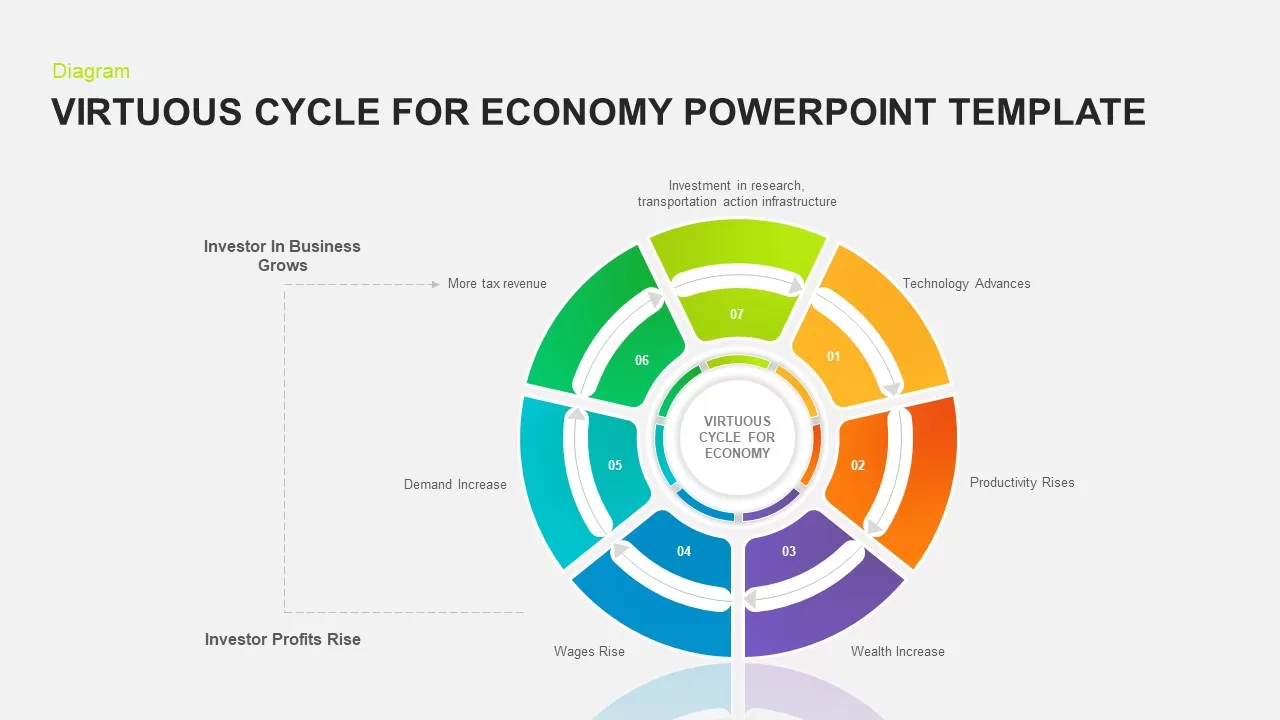
7-Step Virtuous Economy Cycle Diagram Template for PowerPoint & Google Slides
Process
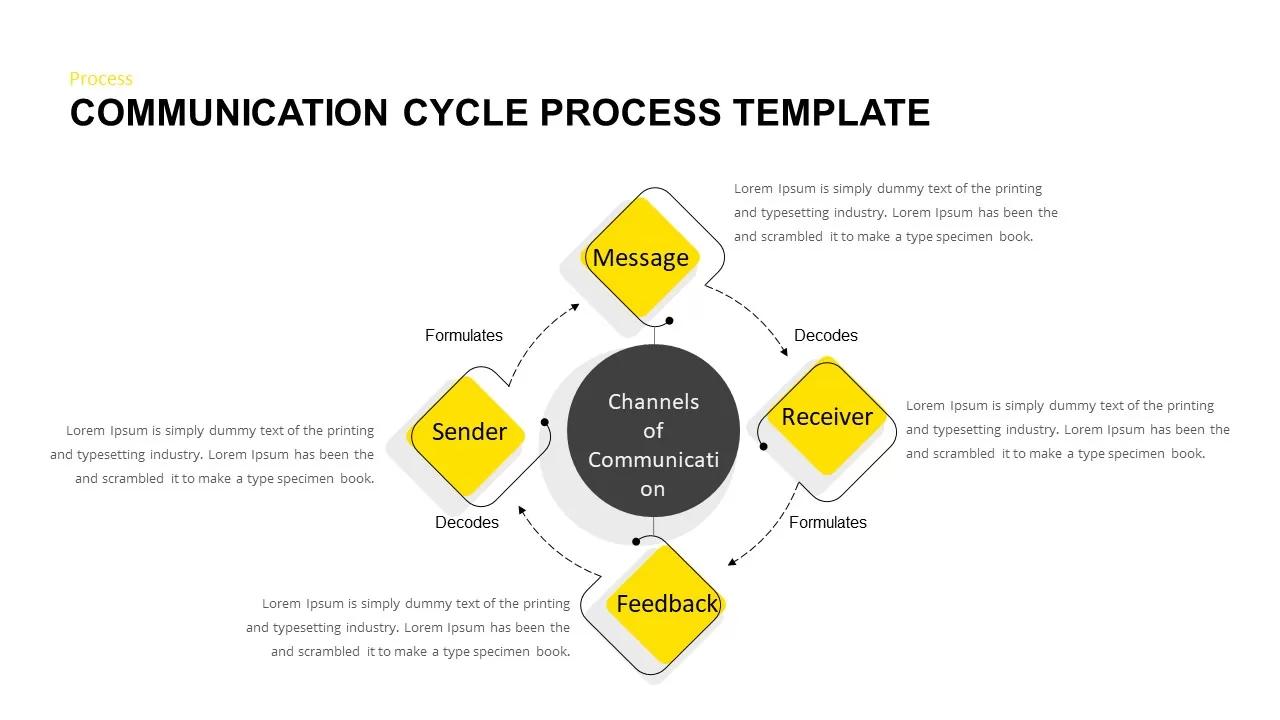
Communication Cycle Process Diagram template for PowerPoint & Google Slides
Business
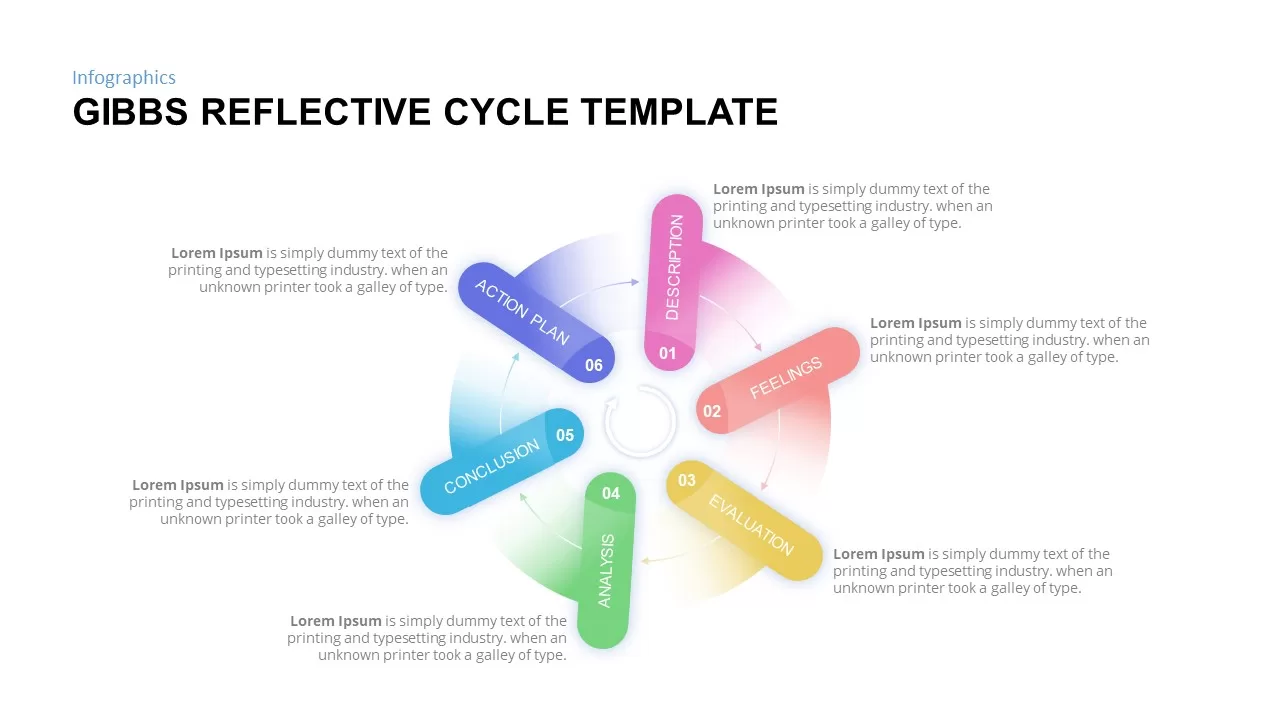
Gibbs Reflective Cycle Overview Template for PowerPoint & Google Slides
Process
Concentric Circular Arrow Cycle Diagram Template for PowerPoint & Google Slides
Process
Dual-Stage Circular Arrow Cycle Template for PowerPoint & Google Slides
Process
Three-Segment Circular Arrow Cycle Template for PowerPoint & Google Slides
Circular
Four-Segment Circular Arrow Cycle Template for PowerPoint & Google Slides
Circular
Six-Segment Circular Arrow Cycle Template for PowerPoint & Google Slides
Circular
PDCA Cycle Infographic with Four Stages Template for PowerPoint & Google Slides
Process
PDCA Plan Do Check Act Cycle Infographic Template for PowerPoint & Google Slides
Process
PDCA Four-Stage Cycle Infographic Template for PowerPoint & Google Slides
Process
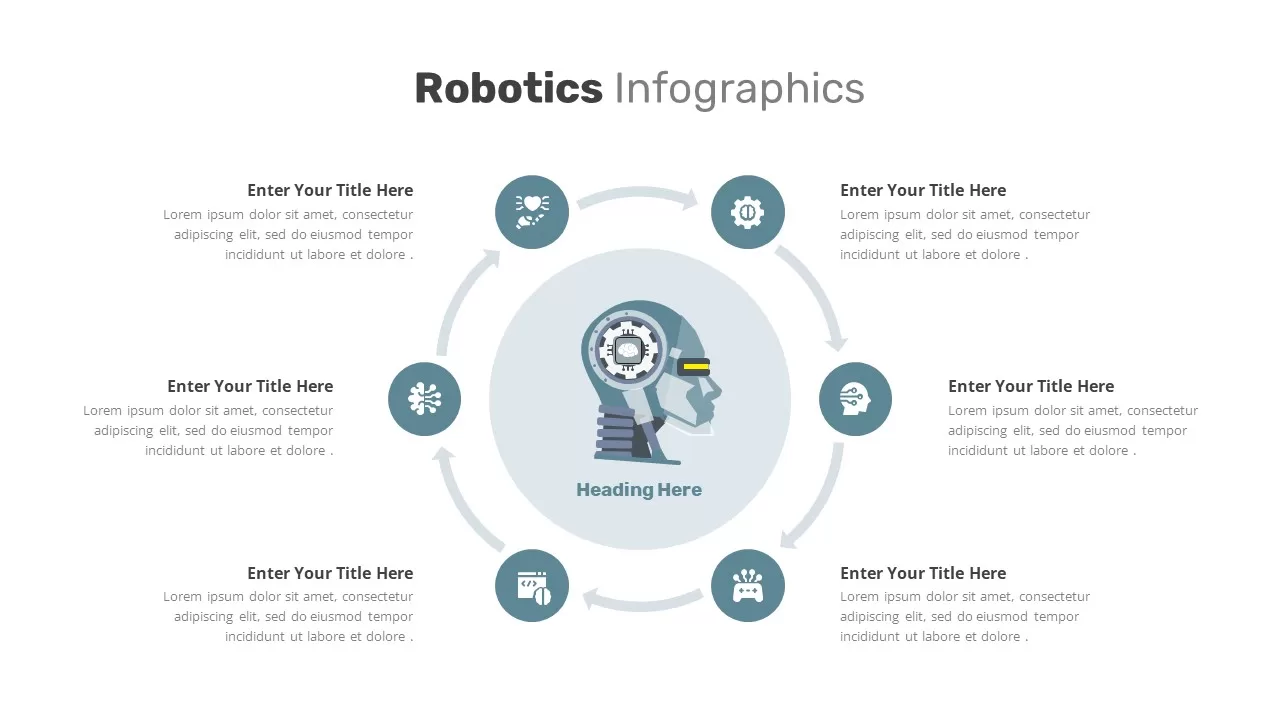
Robotics Process Cycle Infographic Template for PowerPoint & Google Slides
Process
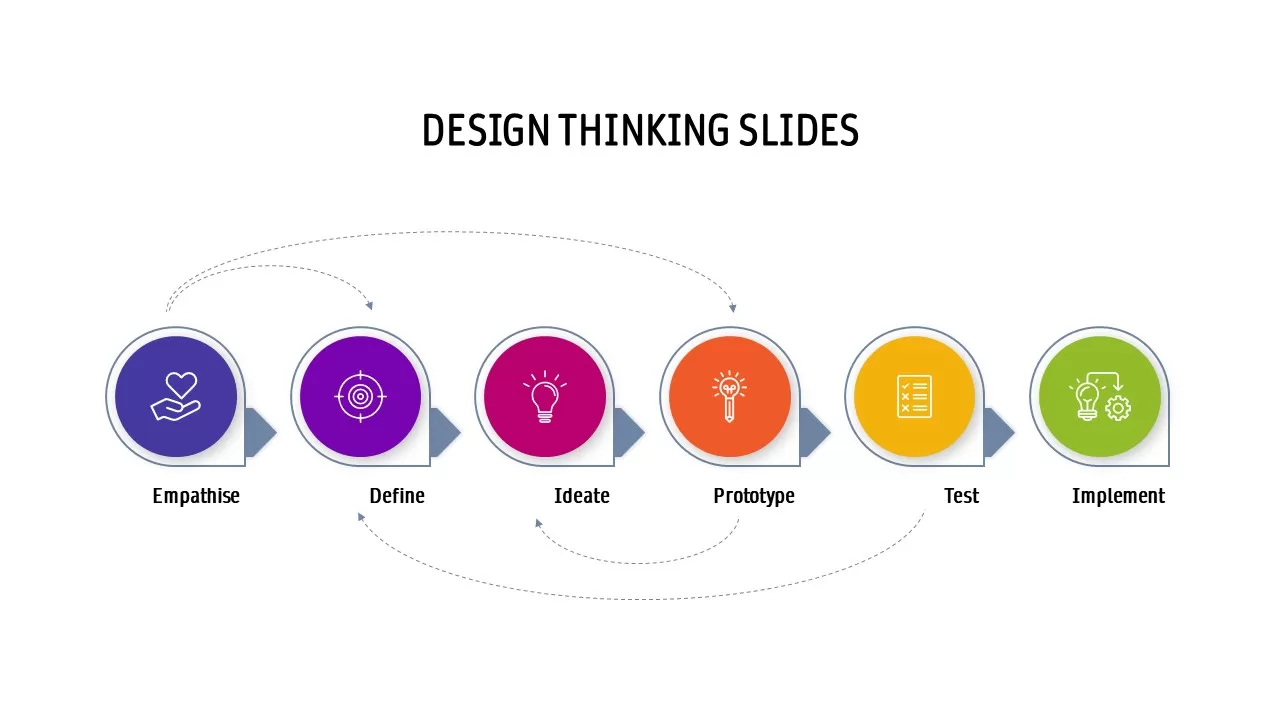
Design Thinking Process Cycle Slide Template for PowerPoint & Google Slides
Process
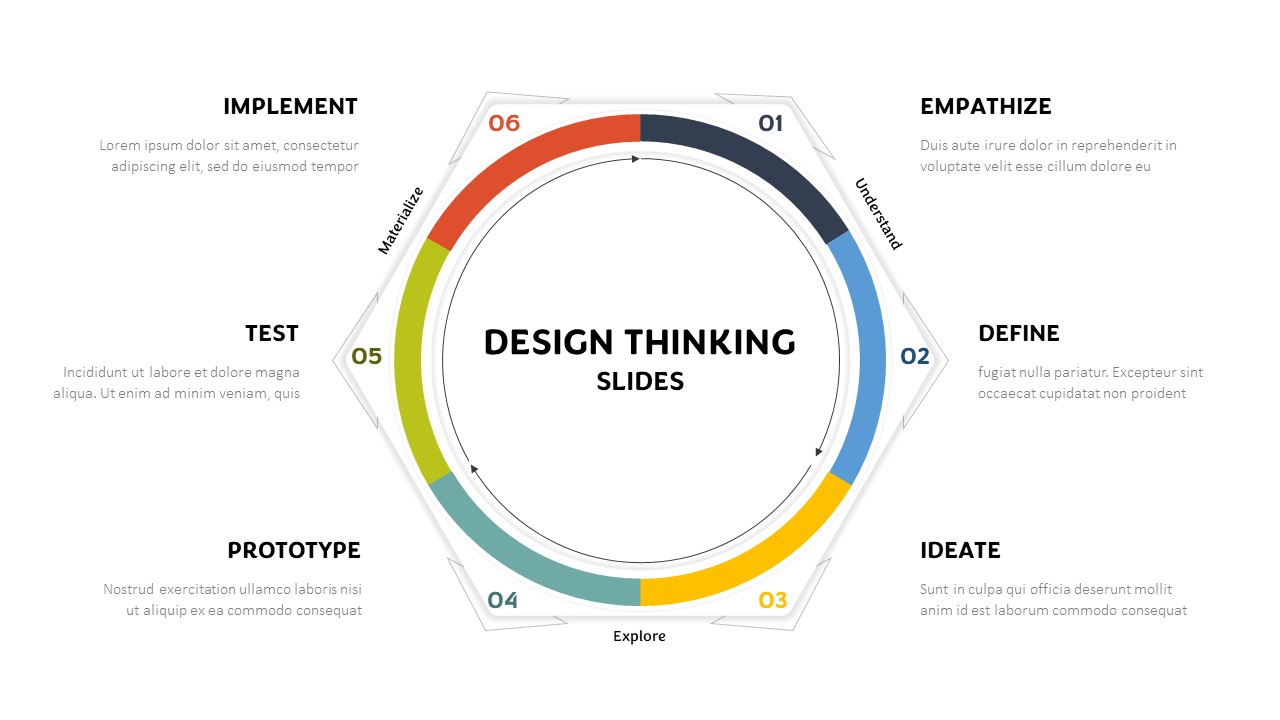
Hexagonal Design Thinking Cycle Template for PowerPoint & Google Slides
Process
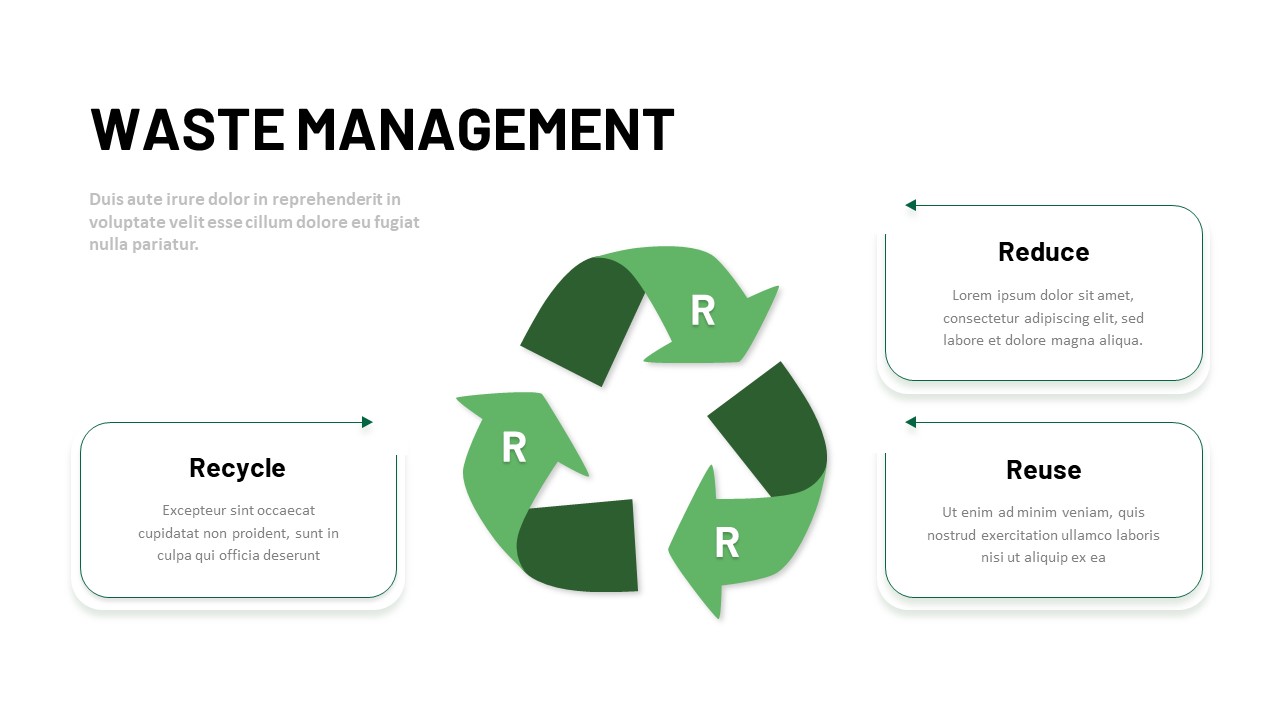
3R Waste Management Cycle Diagram Template for PowerPoint & Google Slides
Circular
Business Process Reengineering Cycle Template for PowerPoint & Google Slides
Circular
Strategic Dialogue Model Cycle Template for PowerPoint & Google Slides
Circular
3R Waste Management Cycle Overview template for PowerPoint & Google Slides
Process
Release Management Cycle Circular Diagram Template for PowerPoint & Google Slides
Software Development
Business Process Analysis Cycle Diagram Template for PowerPoint & Google Slides
Business Strategy
Iterative Strategic Planning Cycle Template for PowerPoint & Google Slides
Business Strategy
Free Time Management Clock Cycle Diagram Template for PowerPoint & Google Slides
Process
Free
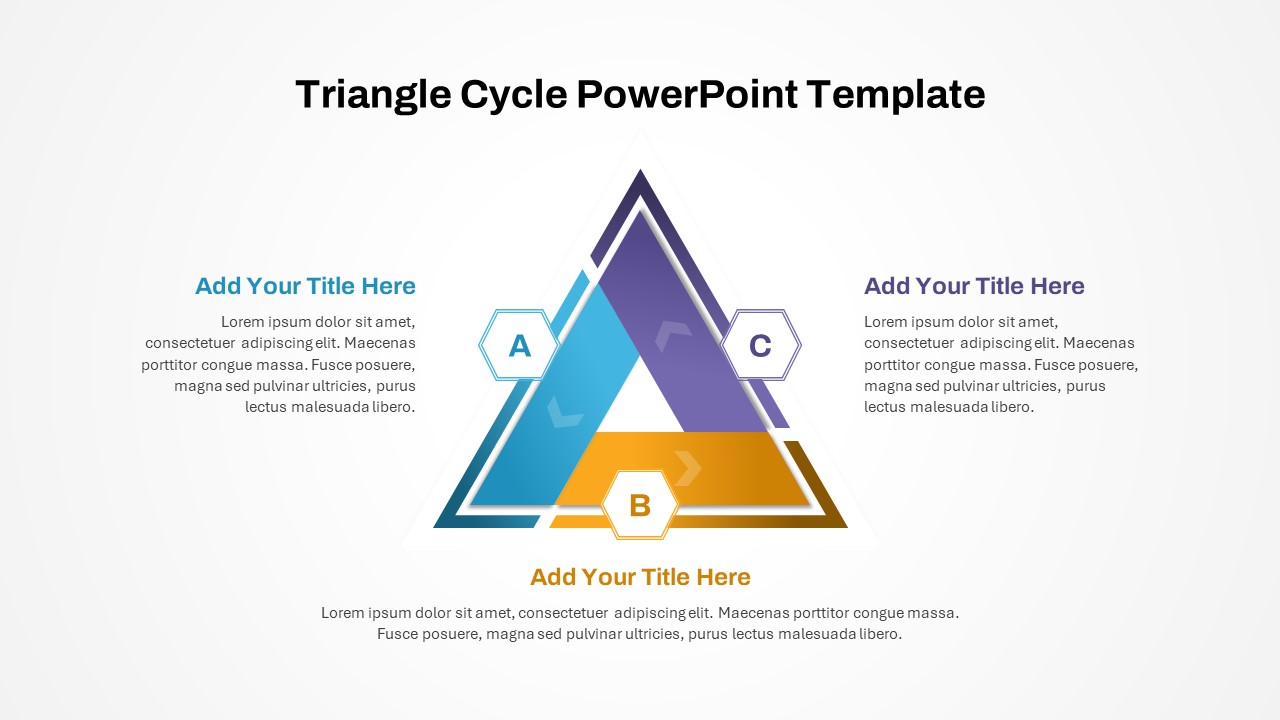
Three-Phase Triangle Cycle Diagram Template for PowerPoint & Google Slides
Infographics
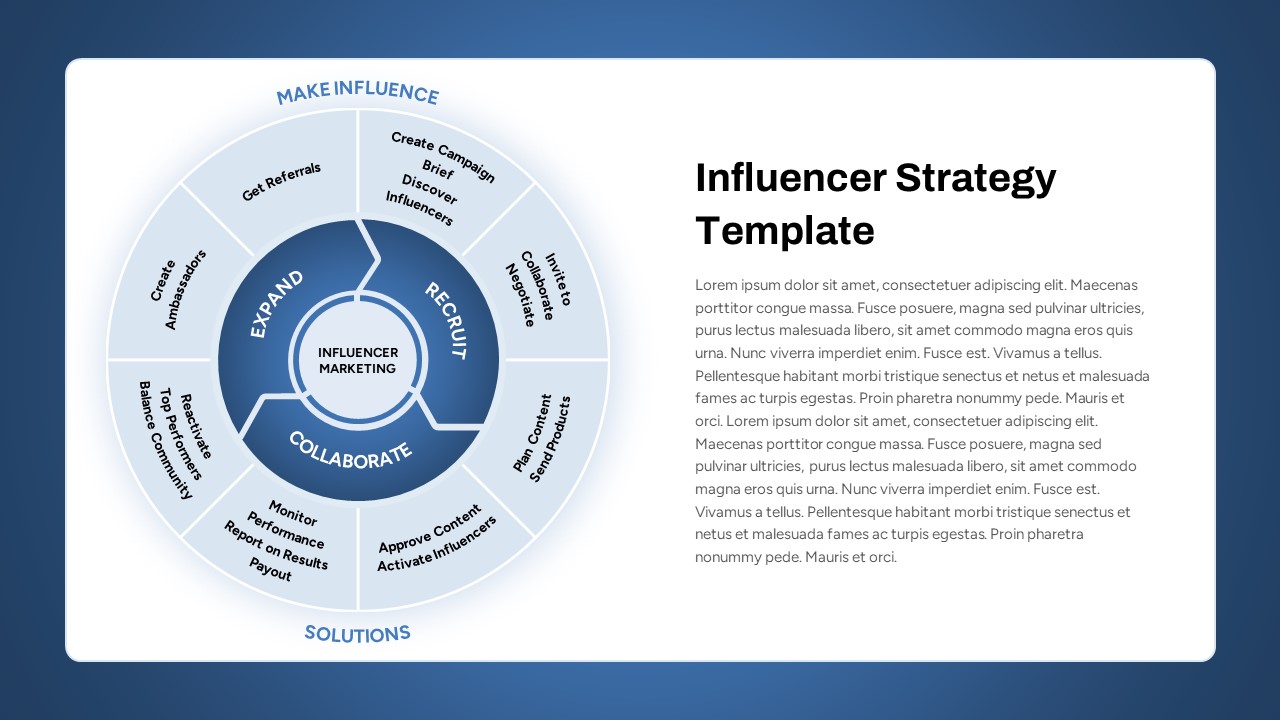
Influencer Marketing Cycle Strategy Template for PowerPoint & Google Slides
Circular
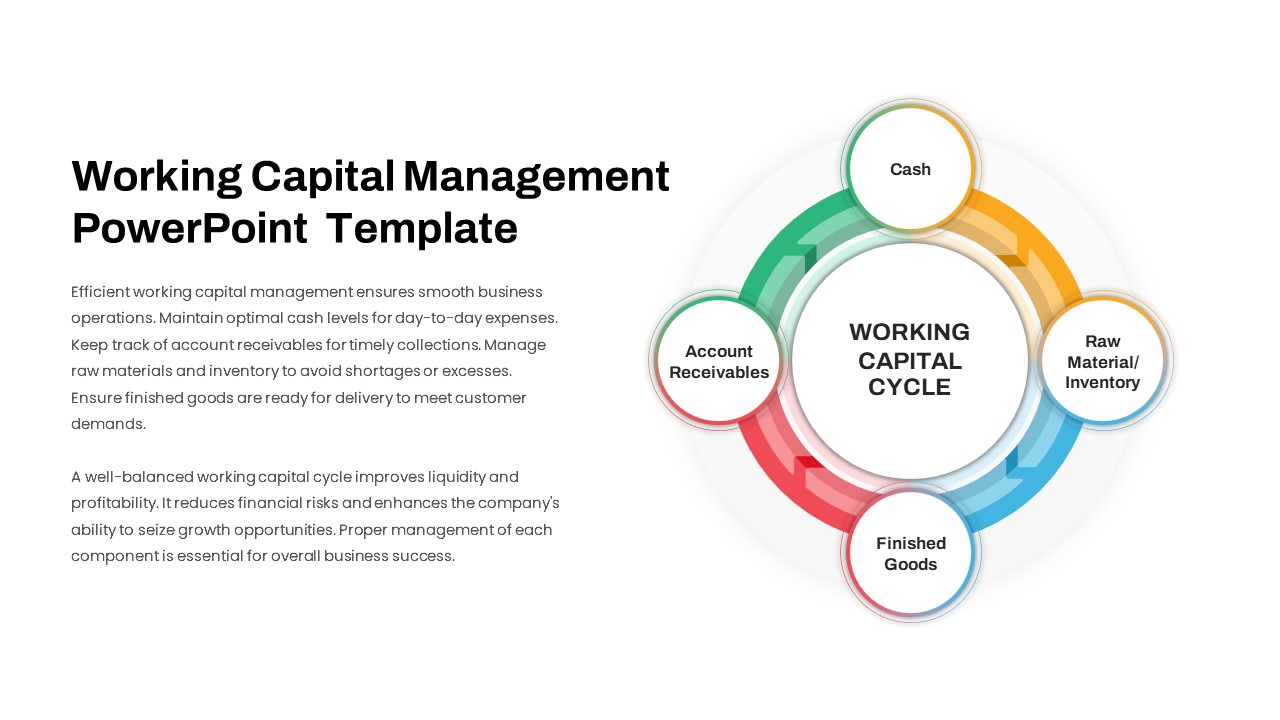
Working Capital Cycle Diagram Template for PowerPoint & Google Slides
Circular
Gartner Hype Cycle Adoption Curve Diagram Template for PowerPoint & Google Slides
Infographics
Colorful Startup Financing Cycle Diagram Template for PowerPoint & Google Slides
Finance
Seeds Growth Cycle Business Model Template for PowerPoint & Google Slides
Process
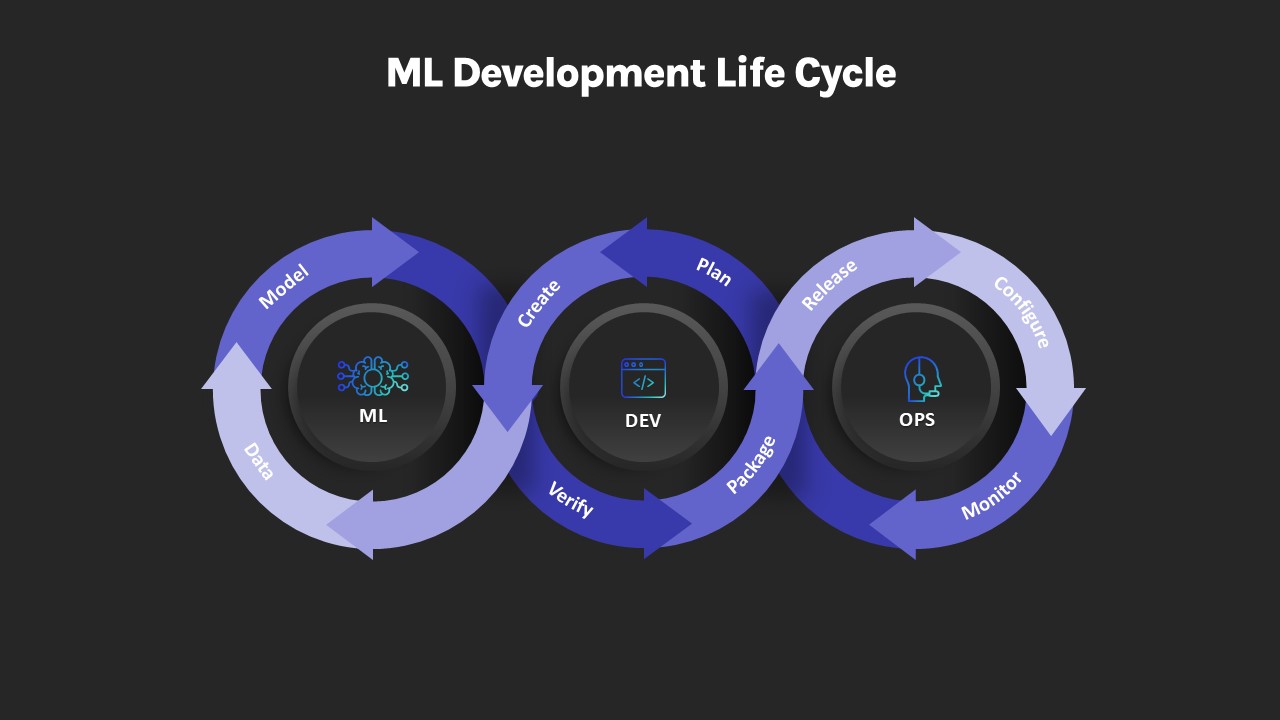
ML Development Life Cycle Diagram Template for PowerPoint & Google Slides
Machine Learning
Project Life Cycle Workflow Diagram Template for PowerPoint & Google Slides
Process
Experiential Learning Cycle Diagram Template for PowerPoint & Google Slides
Circular
Agile Methodology Cycle Diagram Template for PowerPoint & Google Slides
Project
Free
Change Management Process Cycle Diagram Template for PowerPoint & Google Slides
Process
Two-Cycle Scaled Agile Framework Template for PowerPoint & Google Slides
Scrum
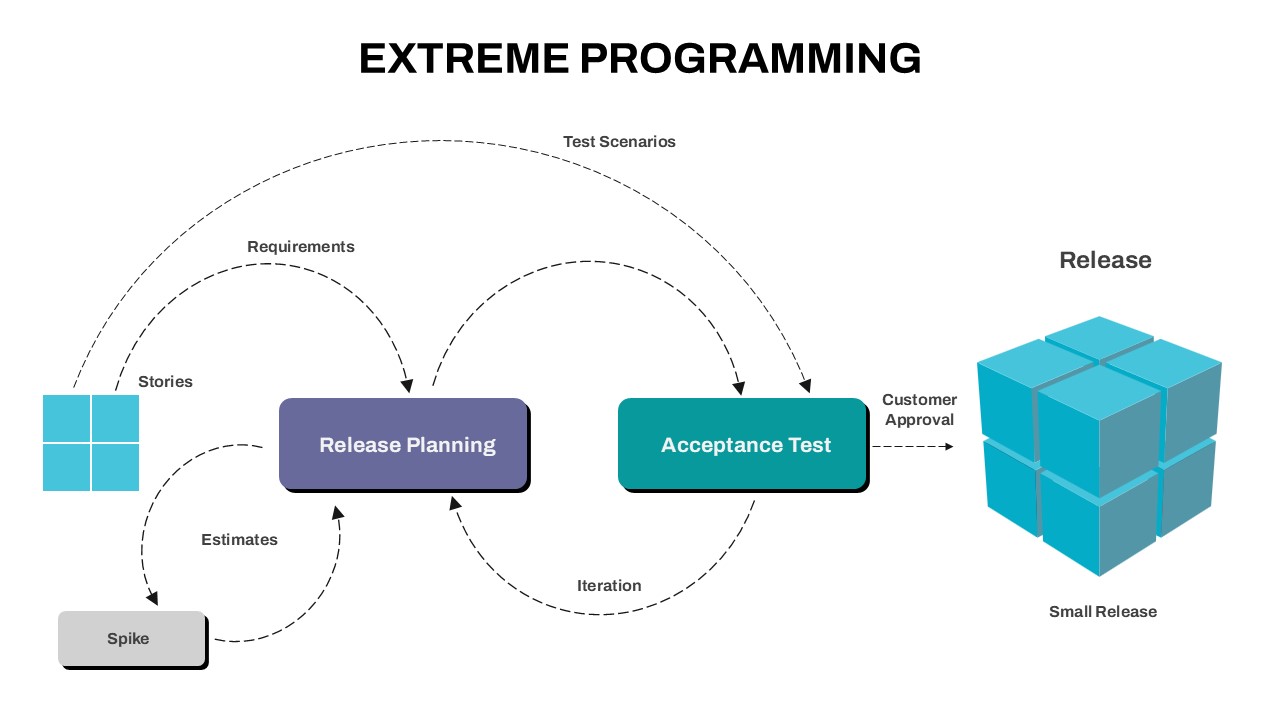
Extreme Programming Process Cycle Template for PowerPoint & Google Slides
Software Development
Flywheel Growth Cycle Diagram Template for PowerPoint & Google Slides
Circular
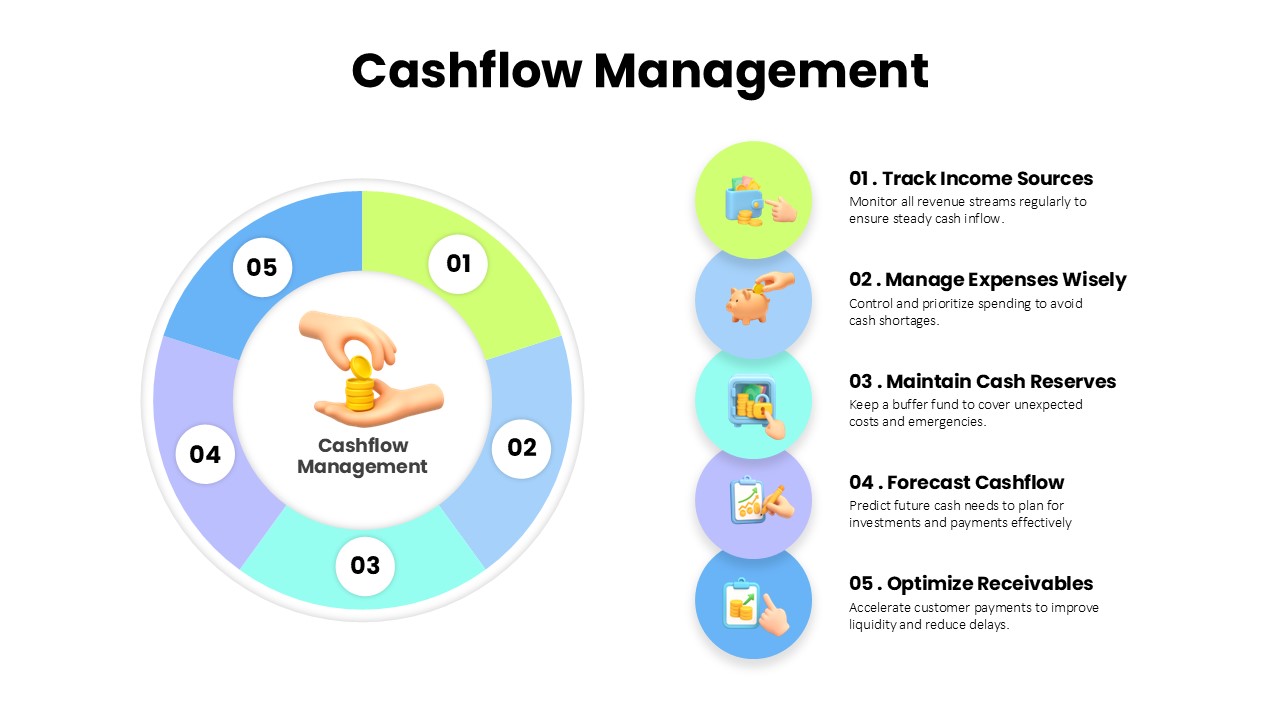
Cashflow Management Cycle Diagram Template for PowerPoint & Google Slides
Finance
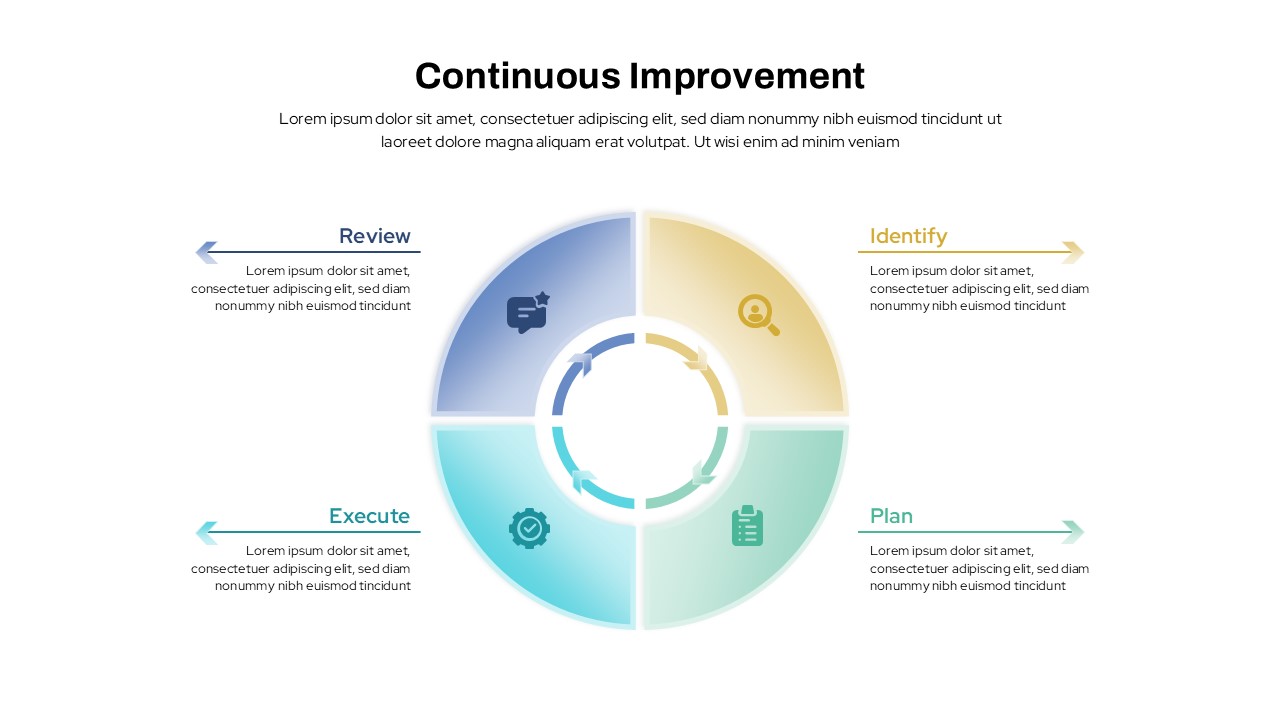
Continuous Improvement Cycle Diagram Template for PowerPoint & Google Slides
Process
Modern Cycle Process for PowerPoint & Google Slides
Infographics
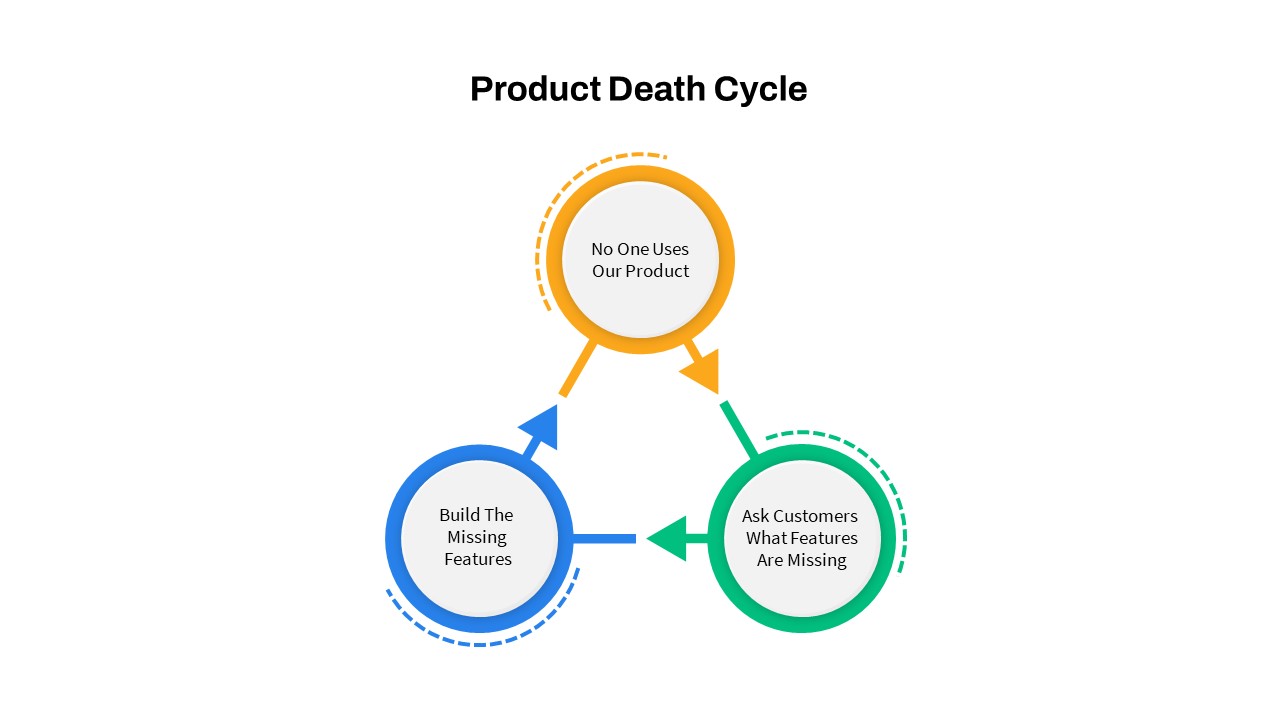
Product Death Cycle Diagram Slide for PowerPoint & Google Slides
Circular
Quad Chart Infographic Pack of 8 Slides Template for PowerPoint & Google Slides
Comparison Chart
Free Professional Gantt Chart Pack – 4 Slides Template for PowerPoint & Google Slides
Gantt Chart
Free
Creative data chart analytics template for PowerPoint & Google Slides
Charts
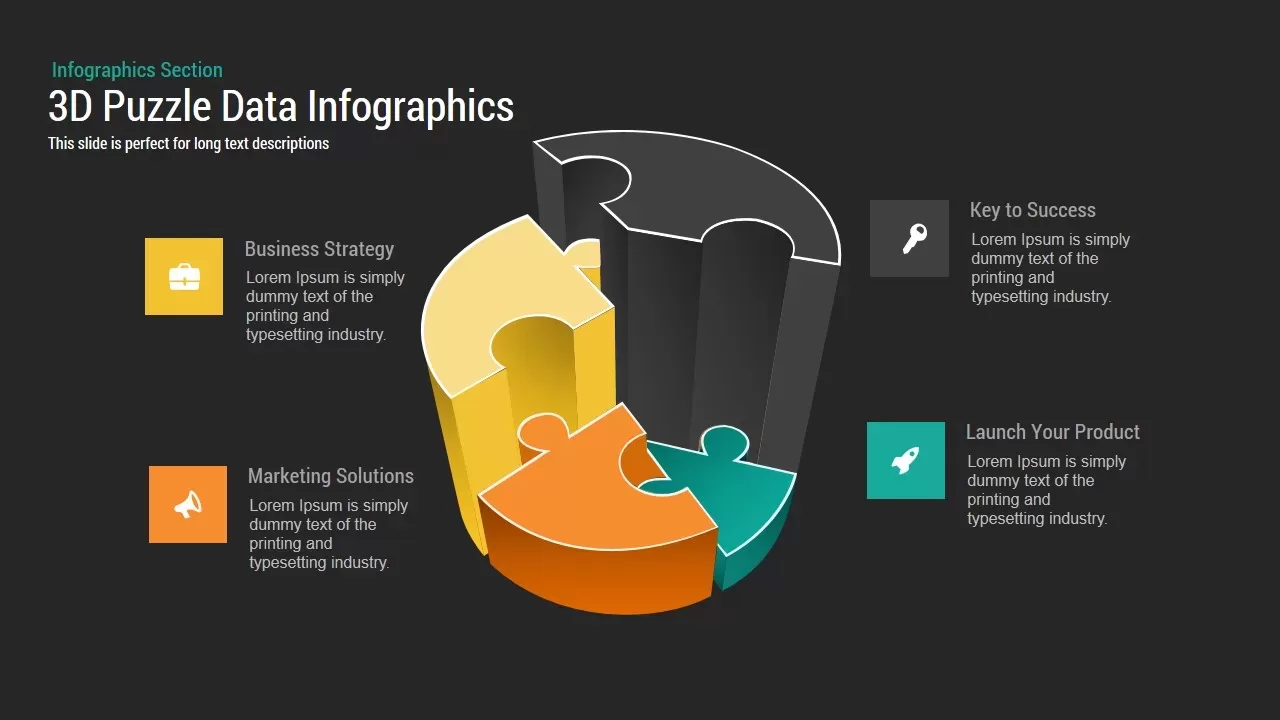
3D Puzzle Chart template for PowerPoint & Google Slides
Infographics

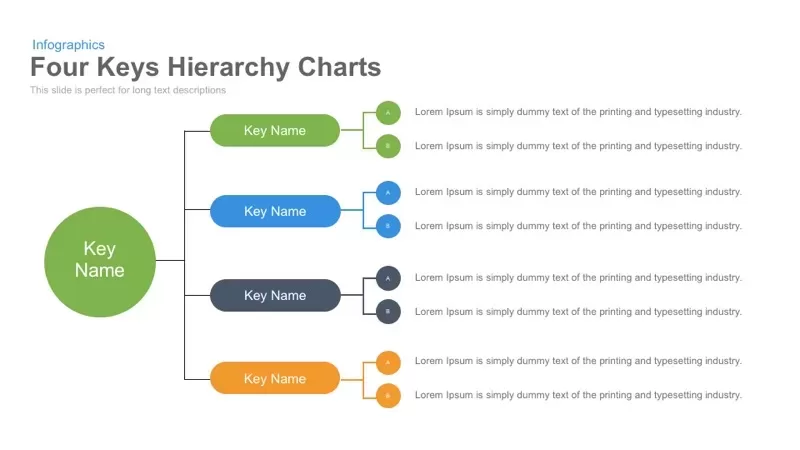
Four Keys Hierarchy Chart template for PowerPoint & Google Slides
Process
Profit Performance Trend Chart Template for PowerPoint & Google Slides
Finance
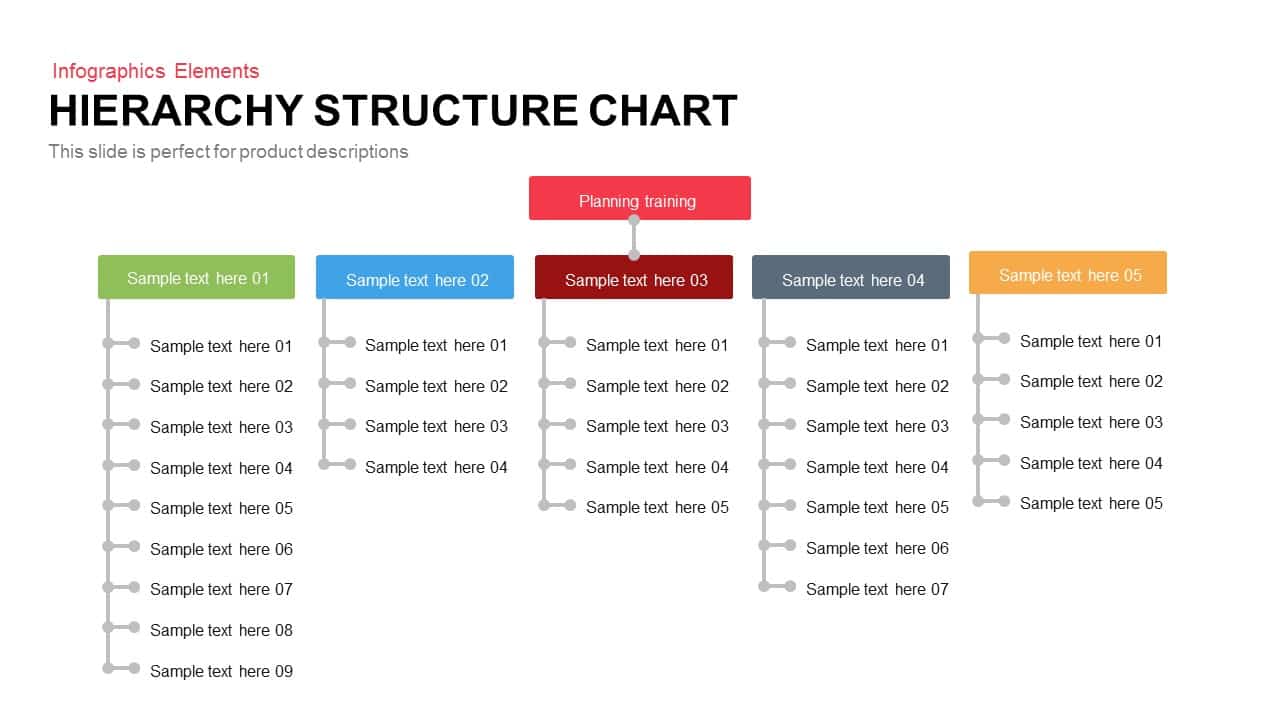
Five-Branch Hierarchy Structure Chart template for PowerPoint & Google Slides
Org Chart

Product Roadmap Gantt Chart Timeline template for PowerPoint & Google Slides
Gantt Chart

Eight Section Donut Chart Infographic Template for PowerPoint & Google Slides
Pie/Donut

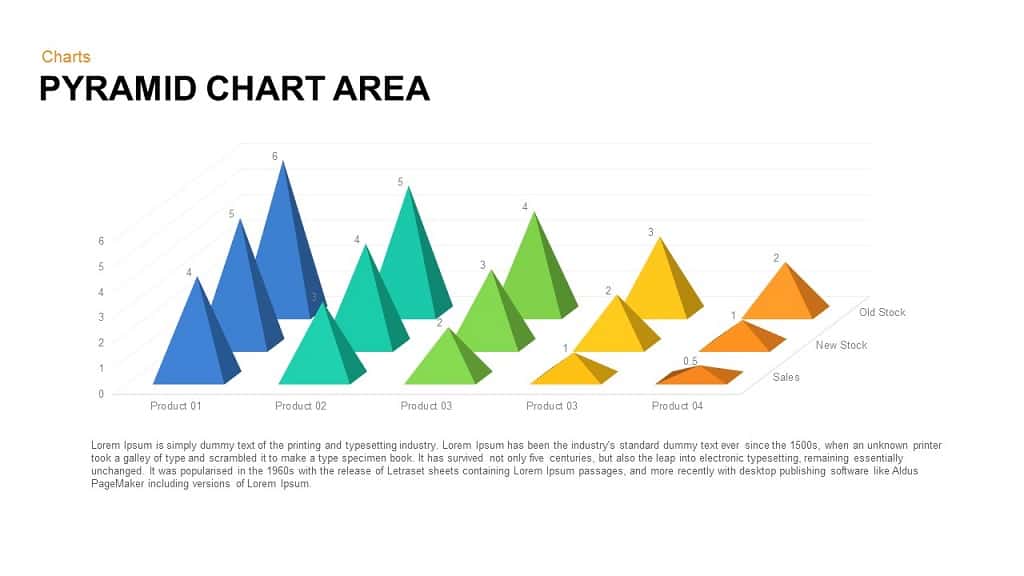
Pyramid Chart Area template for PowerPoint & Google Slides
Pyramid
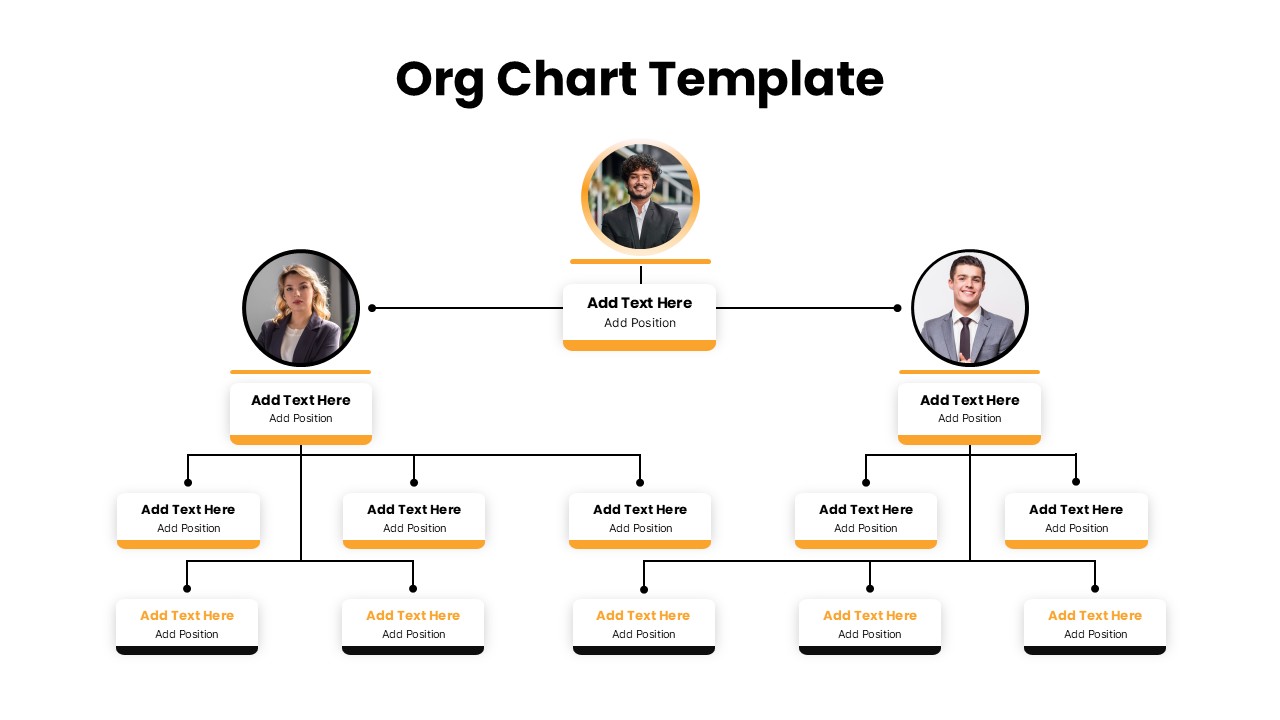
Professional Organizational Chart Diagram Template for PowerPoint & Google Slides
Org Chart
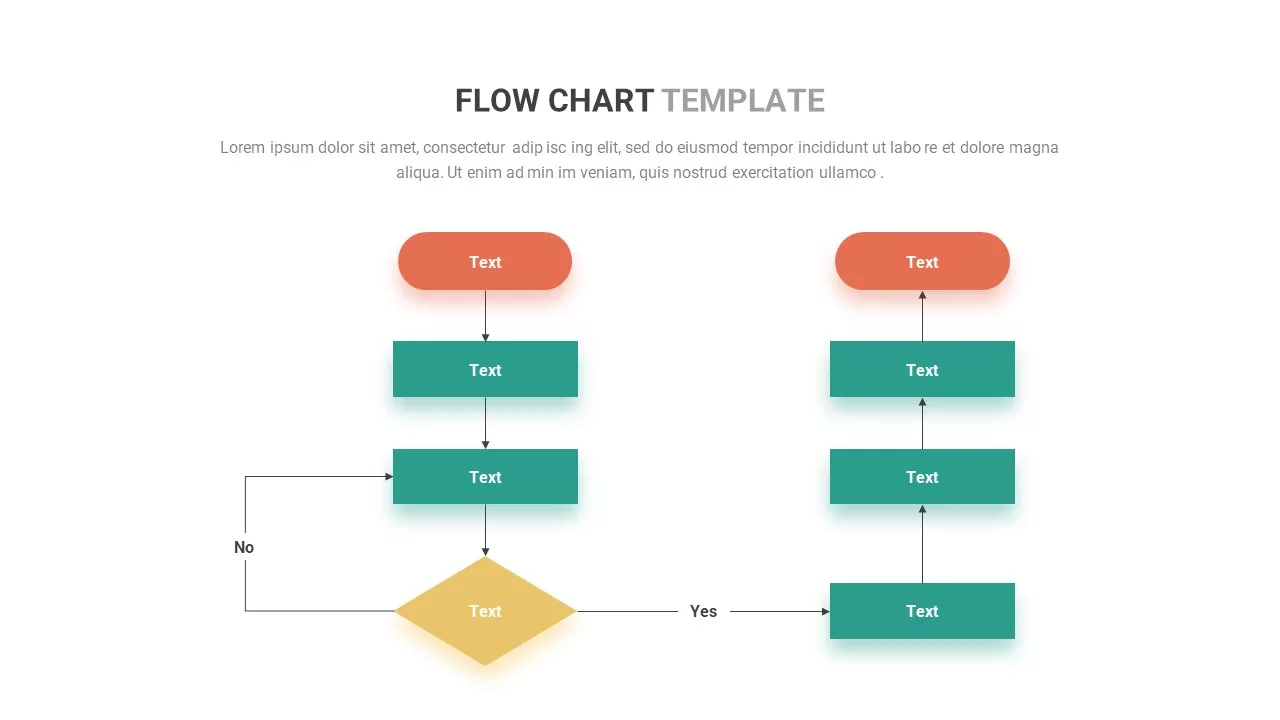
Flow Chart template for PowerPoint & Google Slides
Flow Charts
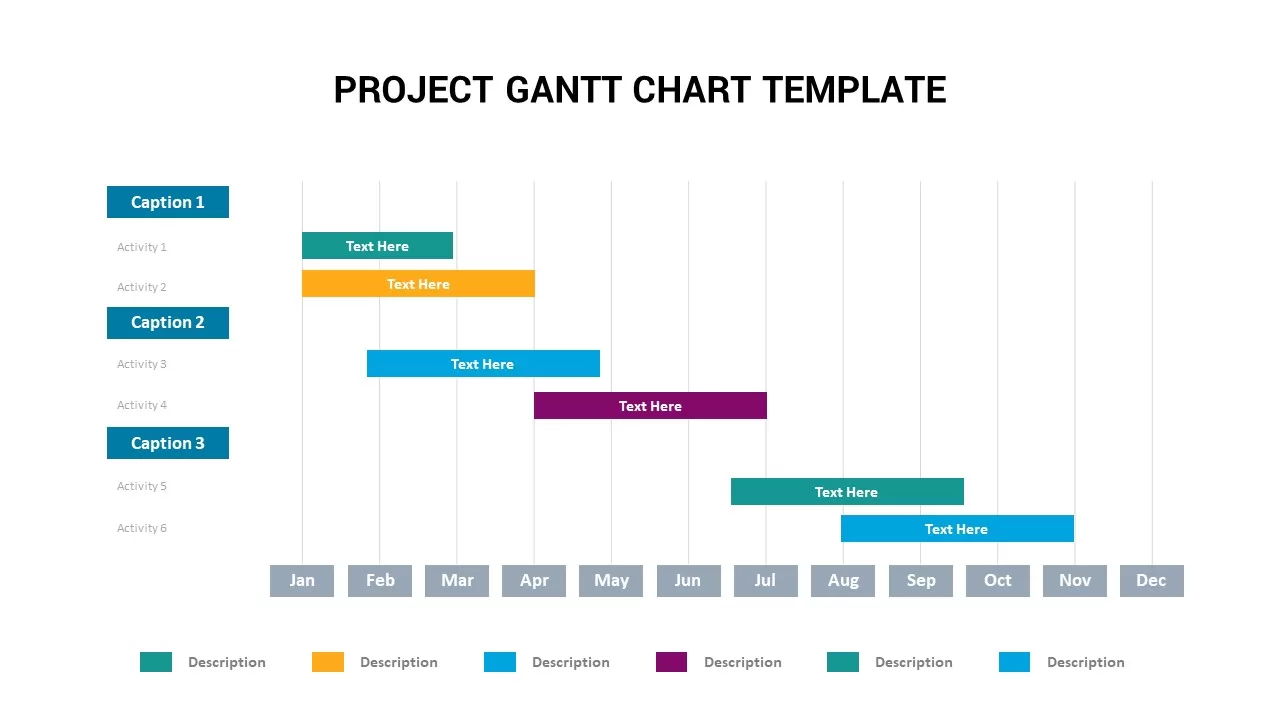
Project Gantt Chart Template for PowerPoint & Google Slides
Gantt Chart
Cost Reduction Strategy Donut Chart Template for PowerPoint & Google Slides
Pie/Donut
Statistics Infographic & KPI Bar Chart Template for PowerPoint & Google Slides
Bar/Column
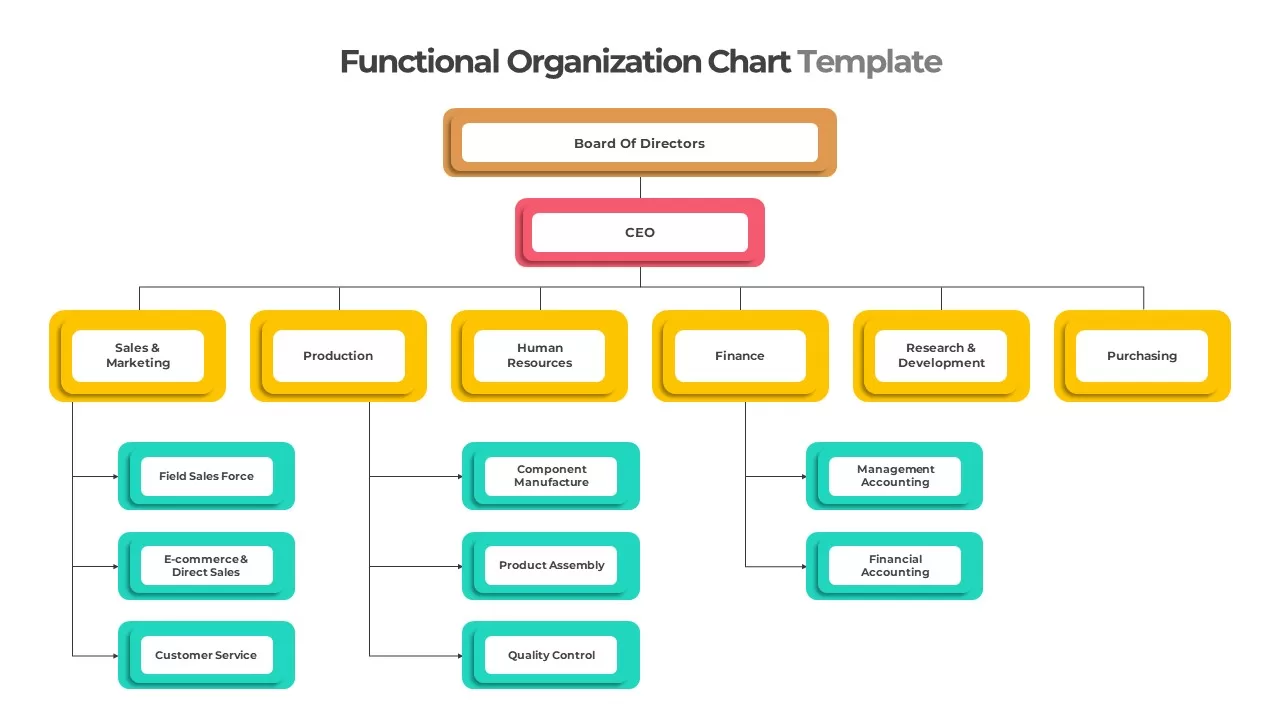
Colorful Functional Organization Chart Template for PowerPoint & Google Slides
Org Chart
Flat Organization Chart Diagram Template for PowerPoint & Google Slides
Org Chart
3D pie chart infographic template for PowerPoint & Google Slides
Pie/Donut
Multi-Series Stacked Bar Chart Template for PowerPoint & Google Slides
Bar/Column
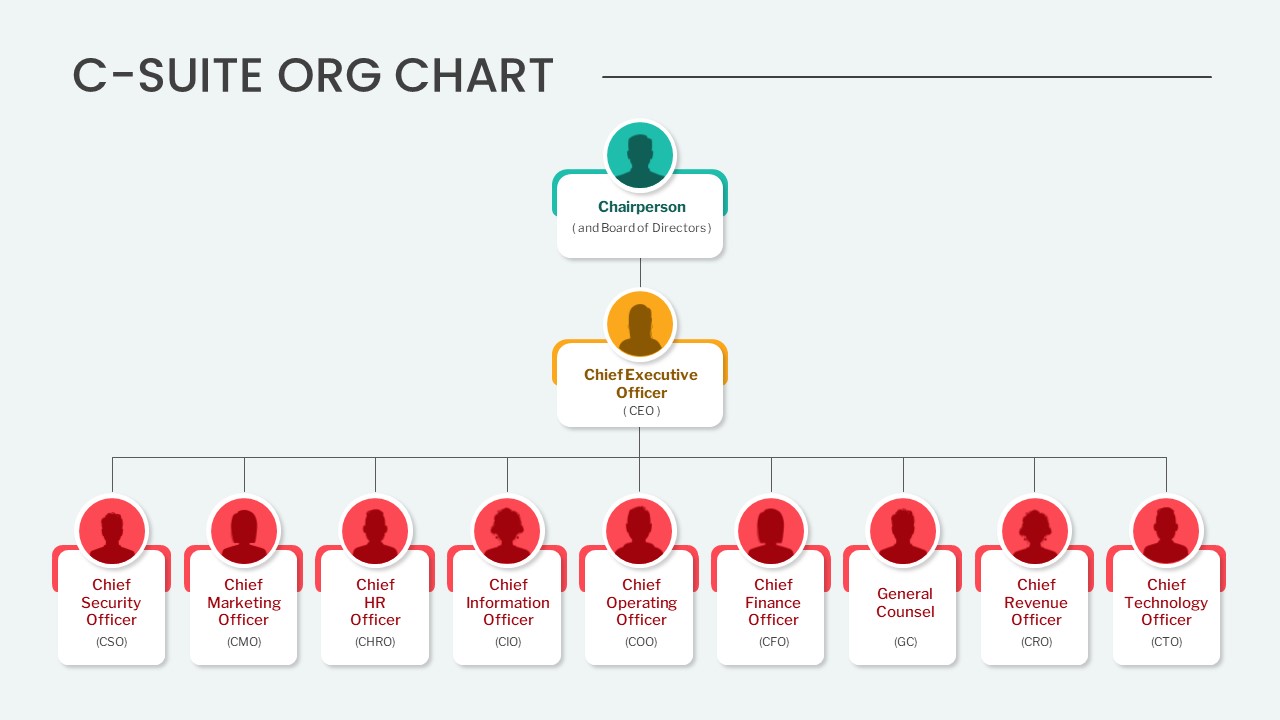
Editable C-Suite Organizational Chart Template for PowerPoint & Google Slides
Org Chart
Professional Quad Chart Layout Template for PowerPoint & Google Slides
Pie/Donut
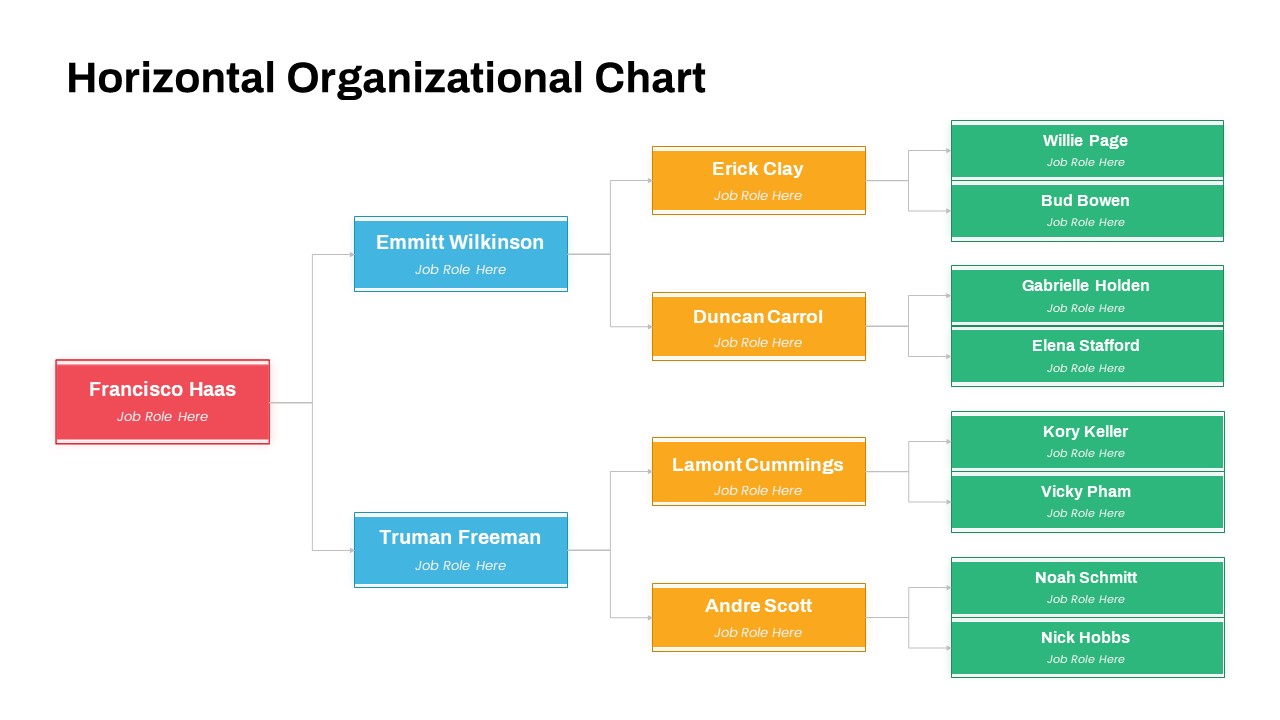
Horizontal Organizational Chart Template for PowerPoint & Google Slides
Org Chart
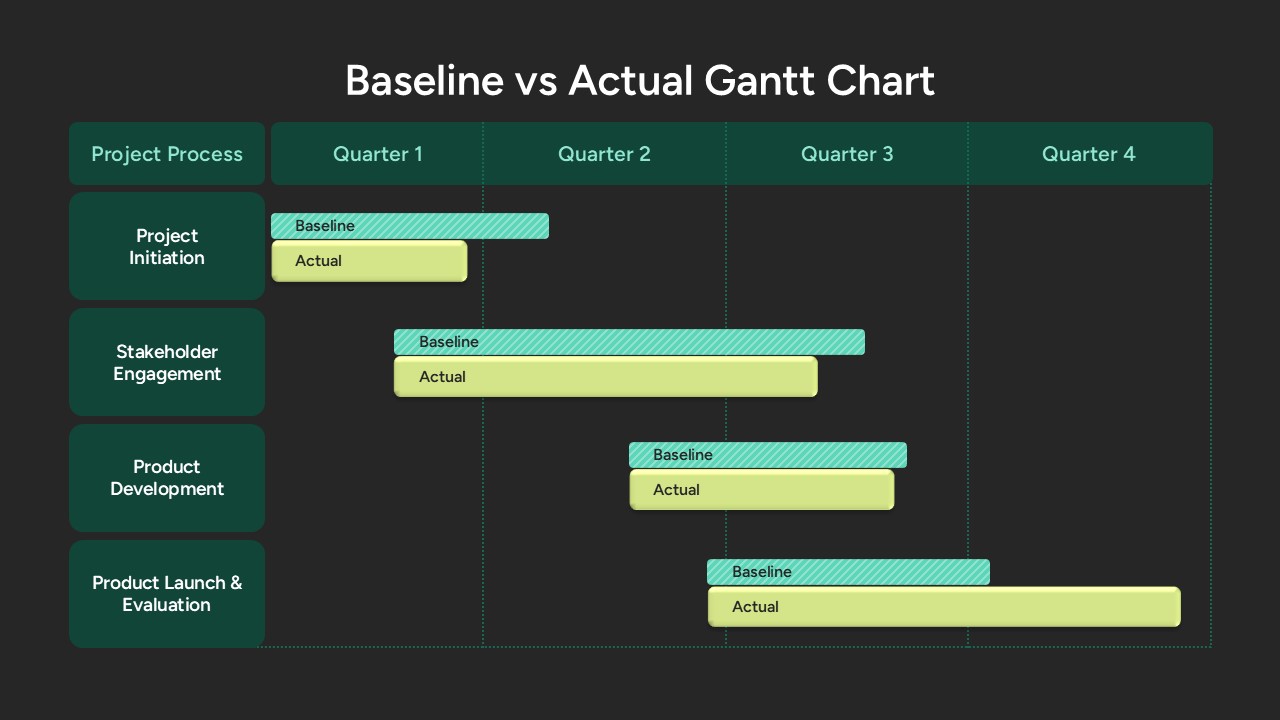
Baseline vs Actual Gantt Chart Template for PowerPoint & Google Slides
Gantt Chart
Yearly Gantt Chart with Presentation Template for PowerPoint & Google Slides
Gantt Chart
Quarterly Comparison Pie Chart Template for PowerPoint & Google Slides
Pie/Donut
Corporate Hierarchy Org Chart Template for PowerPoint & Google Slides
Org Chart

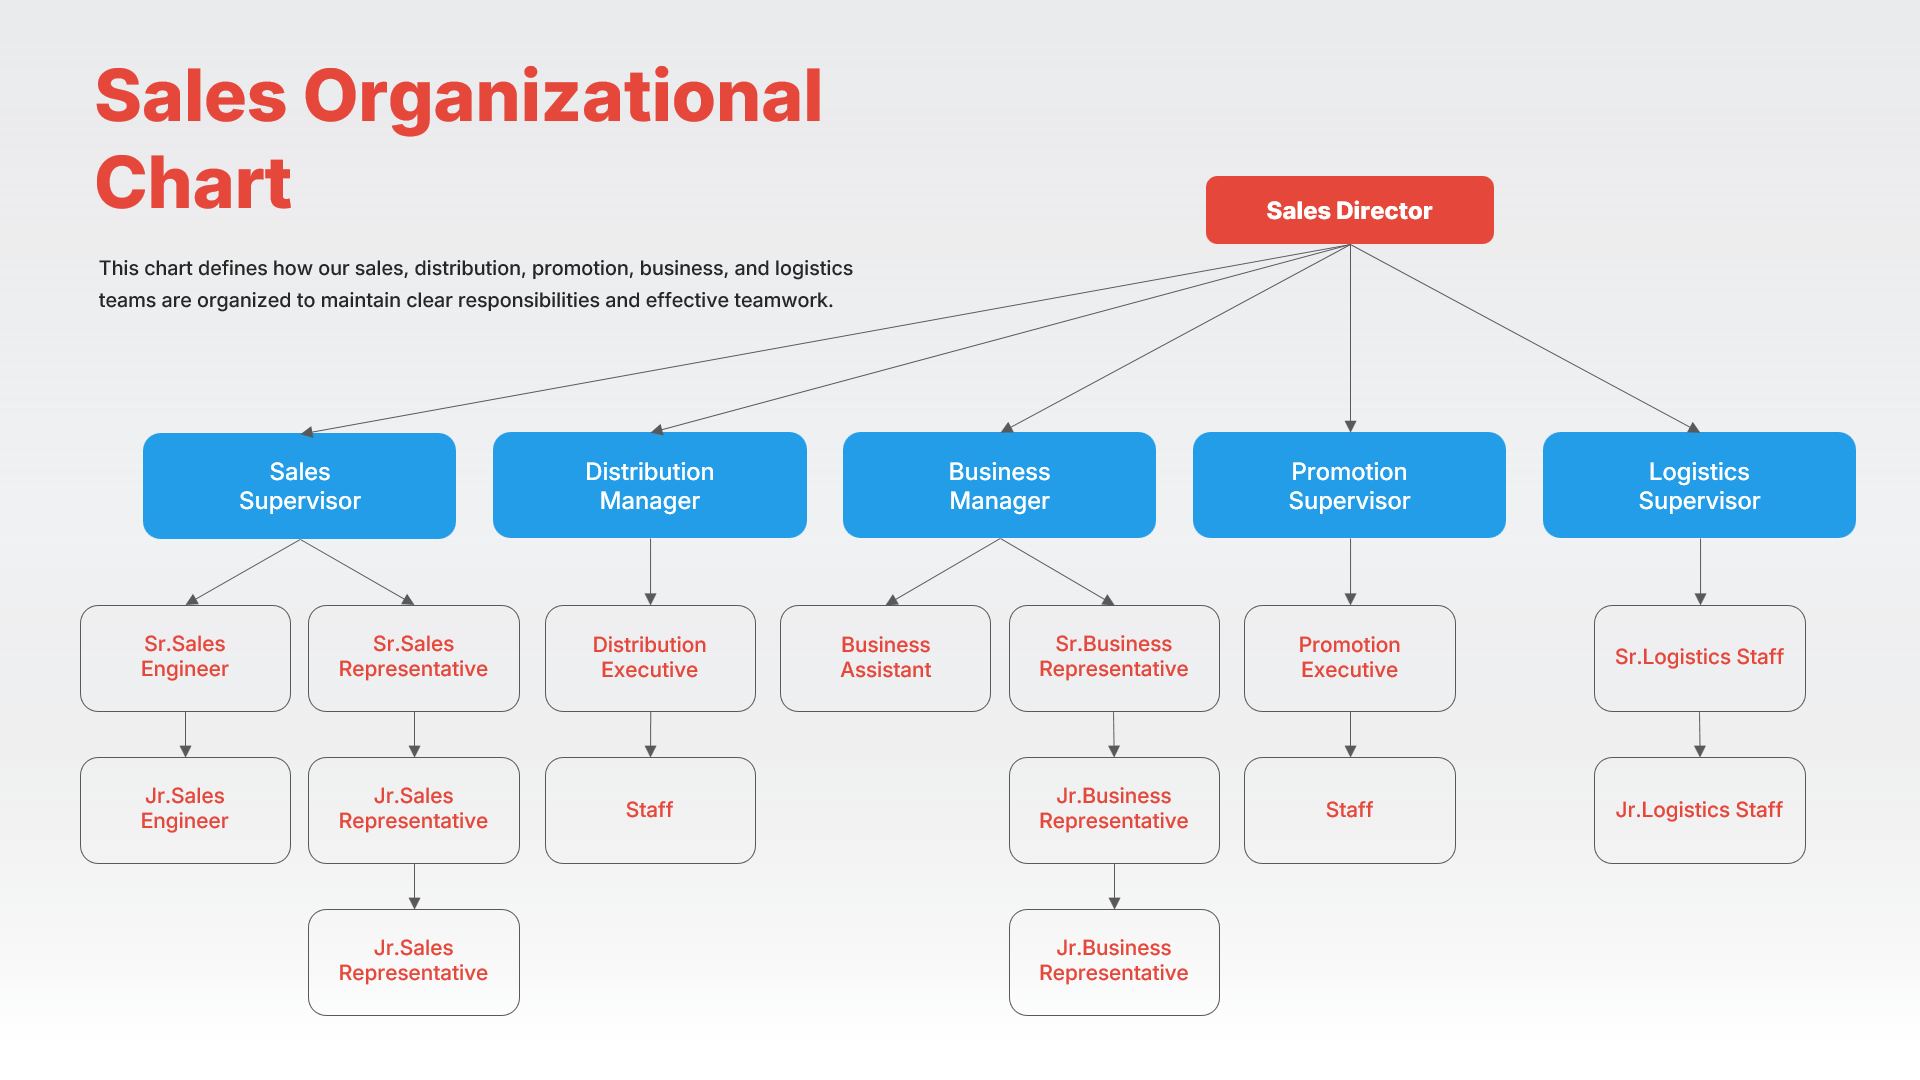
Sales Organizational Chart Hierarchy Template for PowerPoint & Google Slides
Org Chart