Customer Satisfaction KPI Dashboard Template for PowerPoint & Google Slides
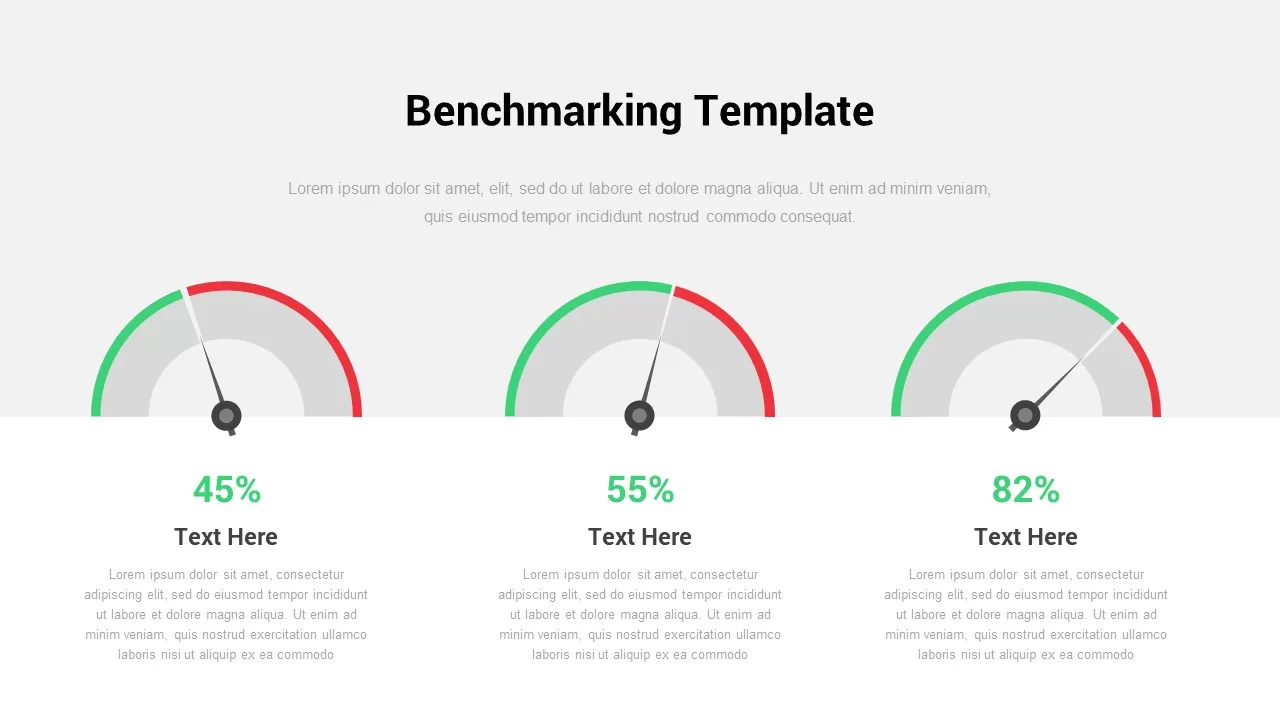
Present a versatile suite of customer satisfaction templates comprising three distinct slide layouts designed for impact and ease of use. The first layout features a satisfaction checklist alongside a stylized mobile review graphic, employing emotive emoji icons ranging from ecstatic to frustrated to capture user sentiment. The second layout delivers a semi-circular gauge chart with adjustable pointers and percentage labels, allowing you to spotlight overall satisfaction scores in a clear visual dial. The third layout leverages a five-segment donut meter to display distribution percentages across sentiment categories, accompanied by a horizontal bar breakdown for rapid comparison. All diagrams are crafted as fully editable vector shapes within consistent master slide frameworks, complete with intuitive text placeholders, icon slots, and theme-aware color variables. Swap icons, adjust gauge arcs, or modify percentage markers effortlessly while maintaining pixel-perfect alignment, consistent padding, and cohesive typography across all slides.
Engineered for seamless cross-platform compatibility, these templates run flawlessly in both Microsoft PowerPoint and Google Slides. Apply your corporate palette in seconds using built-in theme controls, animate each element sequentially to guide audience attention, and export high-resolution graphics for print or digital handouts. Collaboration is streamlined through centralized masters and locked layouts that prevent accidental misalignment, enabling distributed teams to update survey metrics and labels without breaking design integrity. Whether you’re conducting quarterly NPS reviews, reporting customer experience KPIs, or preparing board presentations, these assets deliver professional polish and functional flexibility.
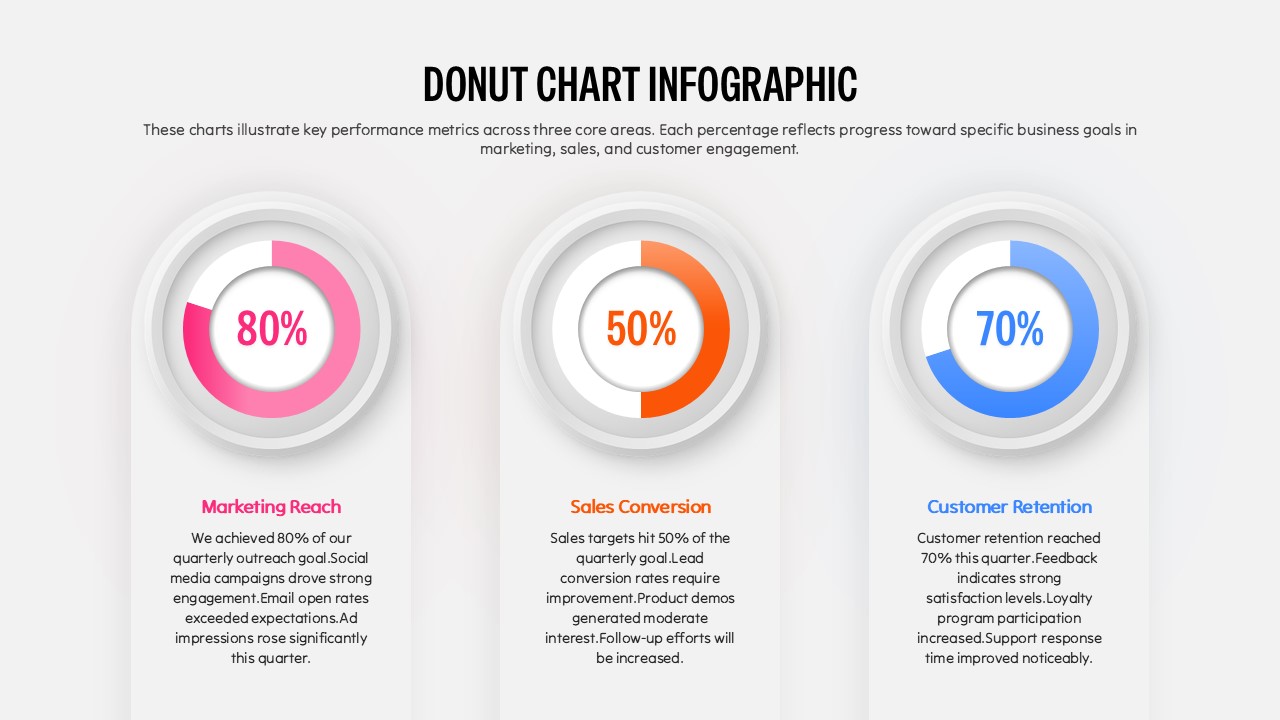
Extend beyond customer satisfaction by repurposing the gauge and checklist formats for employee engagement surveys, quality assurance metrics, project health indicators, service-level dashboards, or marketing performance reviews. The modular architecture supports resizing, reordering, or hiding elements, making this template collection an indispensable toolkit for any scenario requiring sentiment analysis or KPI visualization.
Who is it for
Customer experience managers, CX analysts, marketing teams, and executive sponsors will benefit from these layouts when presenting satisfaction data, aligning cross-functional teams, and driving data-driven improvements.
Other Uses
Use these designs for employee feedback surveys, quality assurance dashboards, stakeholder satisfaction reports, or project status indicators. The adaptable vector formats ensure you can tailor visuals to any dataset or narrative requirement.
Login to download this file


