Customer Interview Insights Dashboard Template for PowerPoint & Google Slides

Description
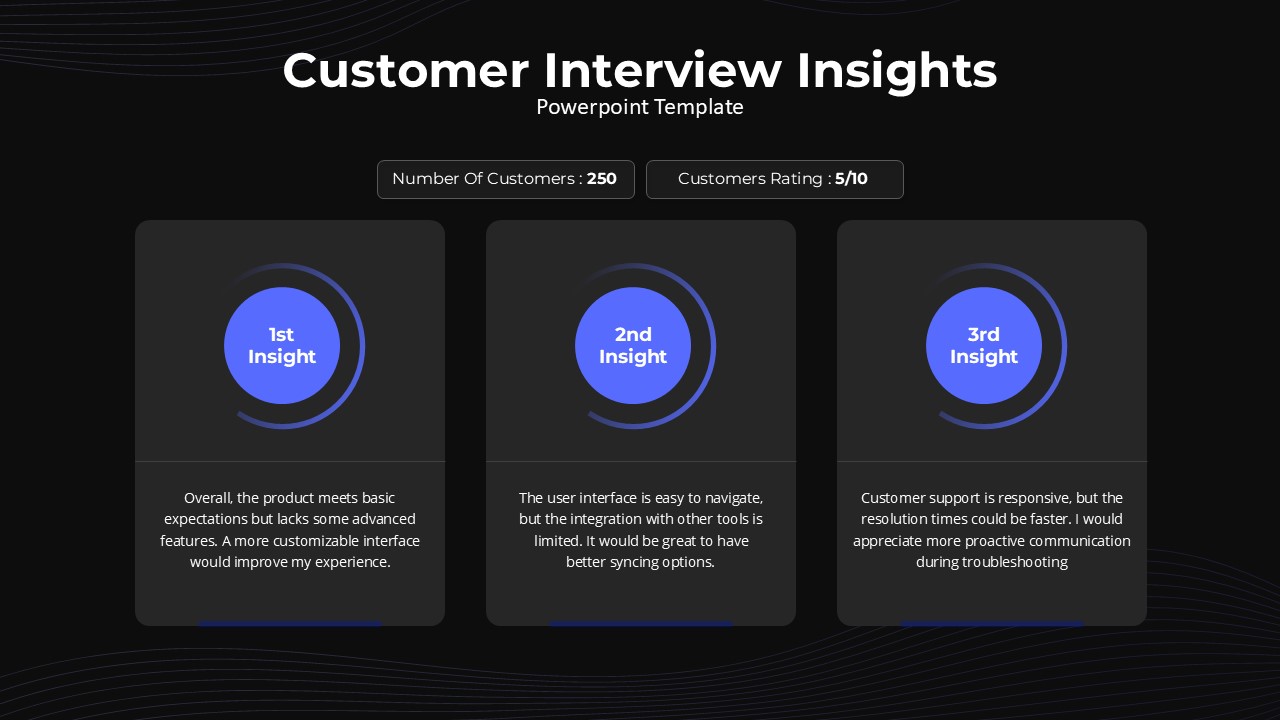
Leverage this customer interview insights slide to present qualitative feedback and key metrics in an engaging, visual format. Set against a modern blue background with subtle wave patterns, the slide places two outlined data cards at the top—“Number of Customers: 250” and “Customers Rating: 5/10”—for at-a-glance metrics. Below, three white rounded panels each feature a semi-circular progress ring highlighting “1st Insight,” “2nd Insight,” and “3rd Insight,” accompanied by concise descriptive text. This structured layout ensures that both quantitative and qualitative data are clearly separated yet unified in design, guiding your audience through metrics, insights, and recommendations seamlessly.
Engineered for swift customization, every element on this slide is fully editable in PowerPoint and Google Slides. Change the background hue, adjust the wave pattern opacity, modify ring colors, resize the metric boxes, or reposition the panels with ease. Built-in master slides and placeholder text allow you to swap out sample data—such as customer counts, rating scales, or feedback quotes—in seconds. The vector shapes maintain full resolution on any display, while the dotted progress rings automatically update to reflect new percentages.
Ideal for stakeholder presentations, this slide empowers teams to share user experience findings, customer satisfaction levels, and support performance in one cohesive view. Incorporate your brand fonts and color palette, or apply corporate theme settings to align with your visual identity. Whether you are delivering a quarterly business review, conducting a UX workshop, or reporting on product usability tests, this slide serves as a versatile template for conveying customer insights with clarity and professionalism.
Who is it for
Marketing managers, UX researchers, customer success managers, and product teams will benefit from this slide when presenting interview findings, satisfaction metrics, or support feedback. Consultants, trainers, and business analysts can also leverage it for workshops, stakeholder briefings, and usability reports.
Other Uses
Beyond interview insights, reuse this slide to display survey results, NPS breakdowns, user research summaries, support ticket analysis, or product usability scores. Adapt the circular rings to illustrate project progress, performance benchmarks, or competitive analysis across any field.
Login to download this file

Item ID
SB04905
Related Templates

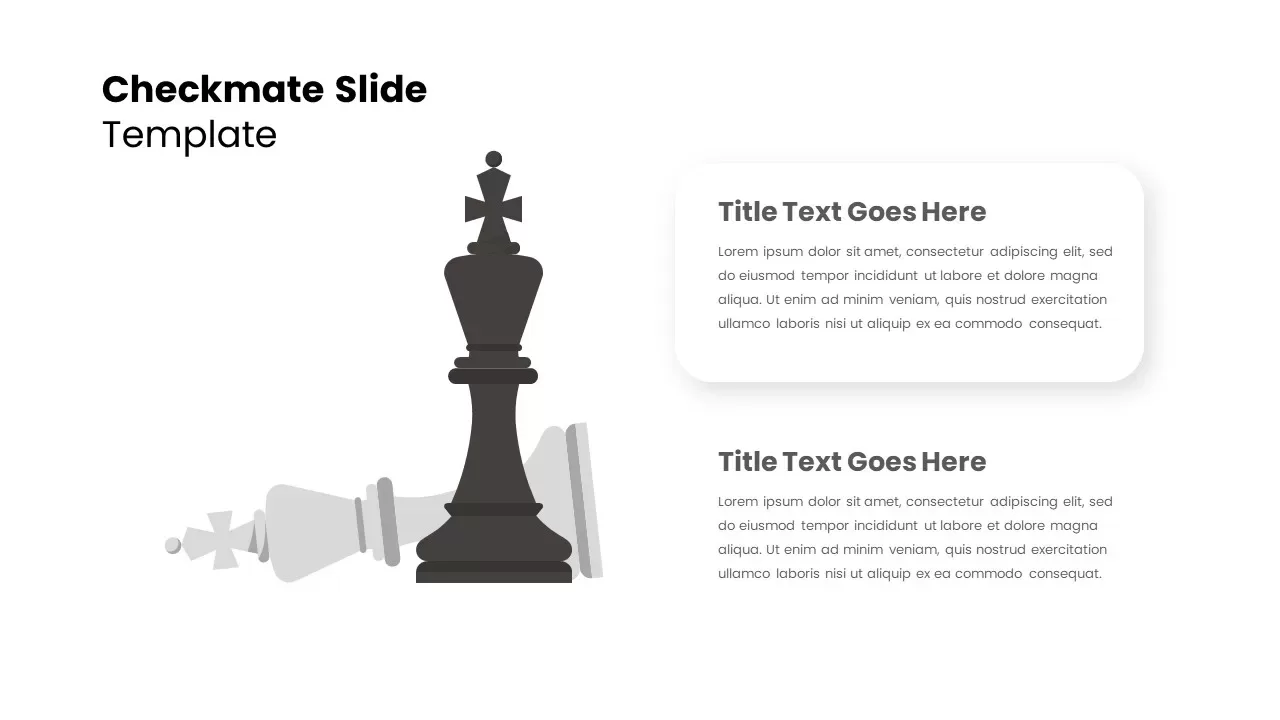
Checkmate Slide for Strategic Insights Template for PowerPoint & Google Slides
Accomplishment
Data Analysis Bar Chart with Insights Template for PowerPoint & Google Slides
Bar/Column
Free
Finance AI Strategy & Insights Template for PowerPoint & Google Slides
AI
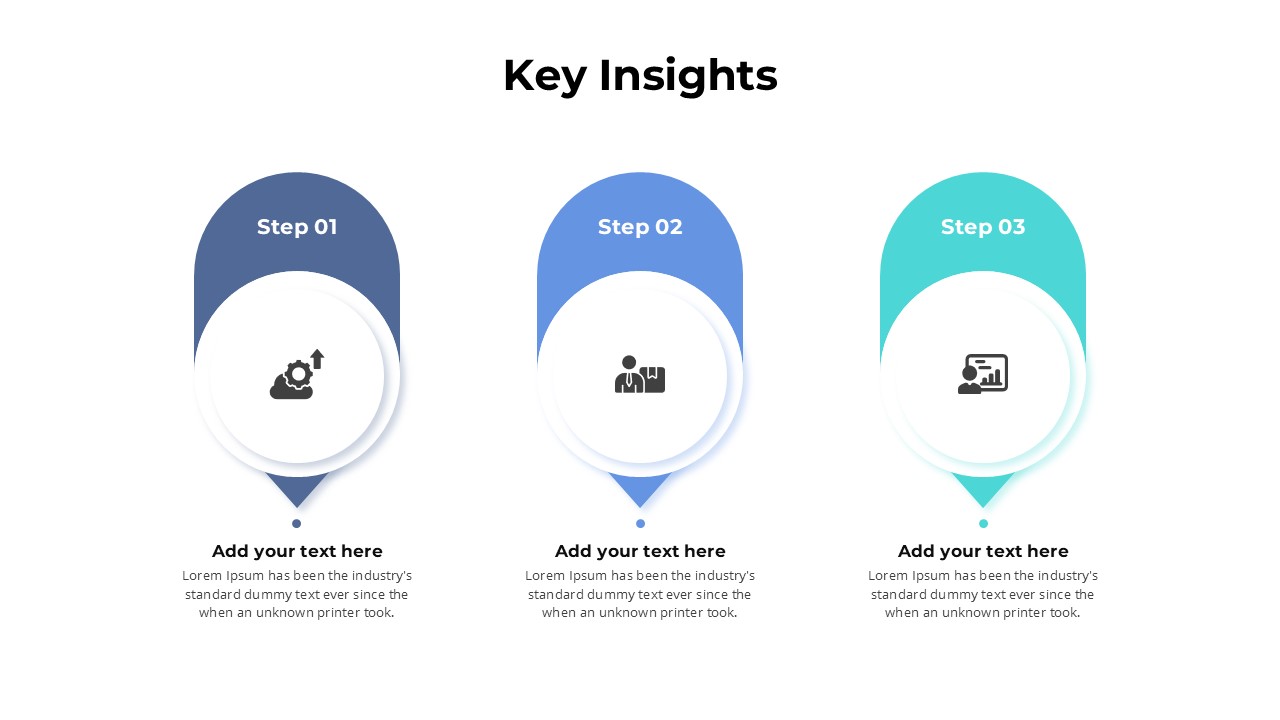
Key Insights Process Template for PowerPoint & Google Slides
Process
Data Studio Insights template for PowerPoint & Google Slides
Business Report
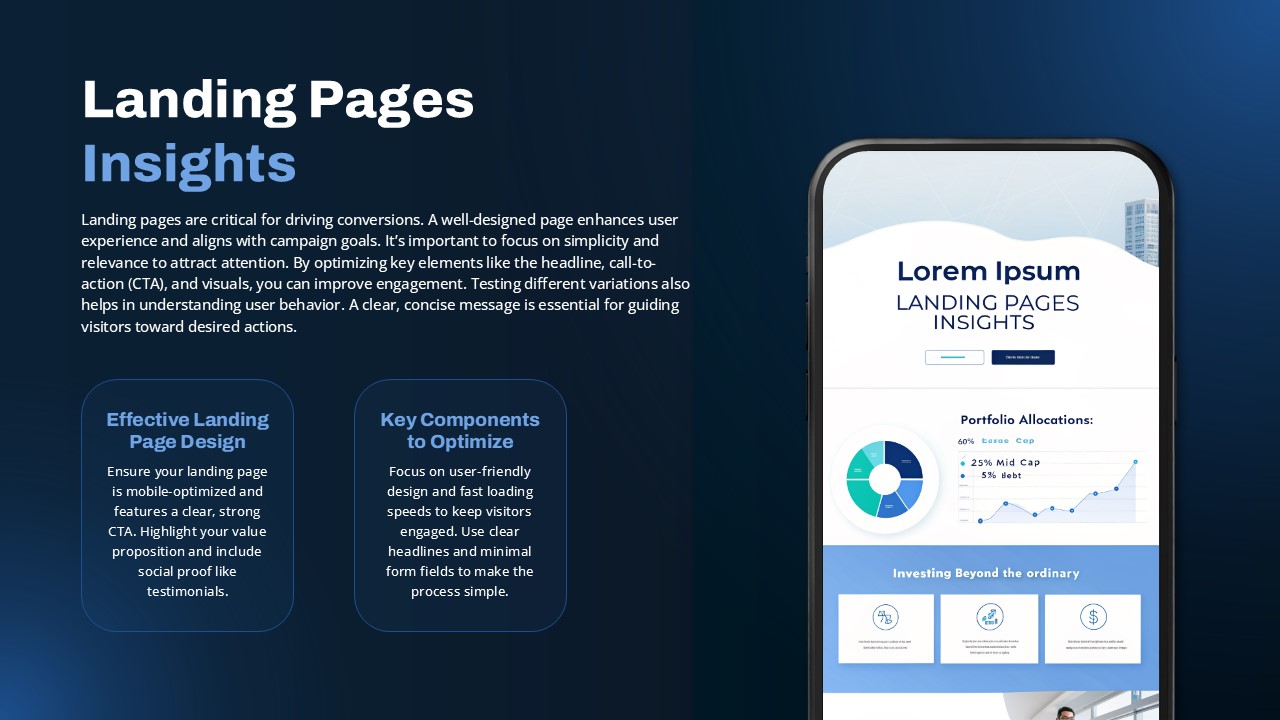
Landing Pages Optimization Insights Template for PowerPoint & Google Slides
Marketing Funnel
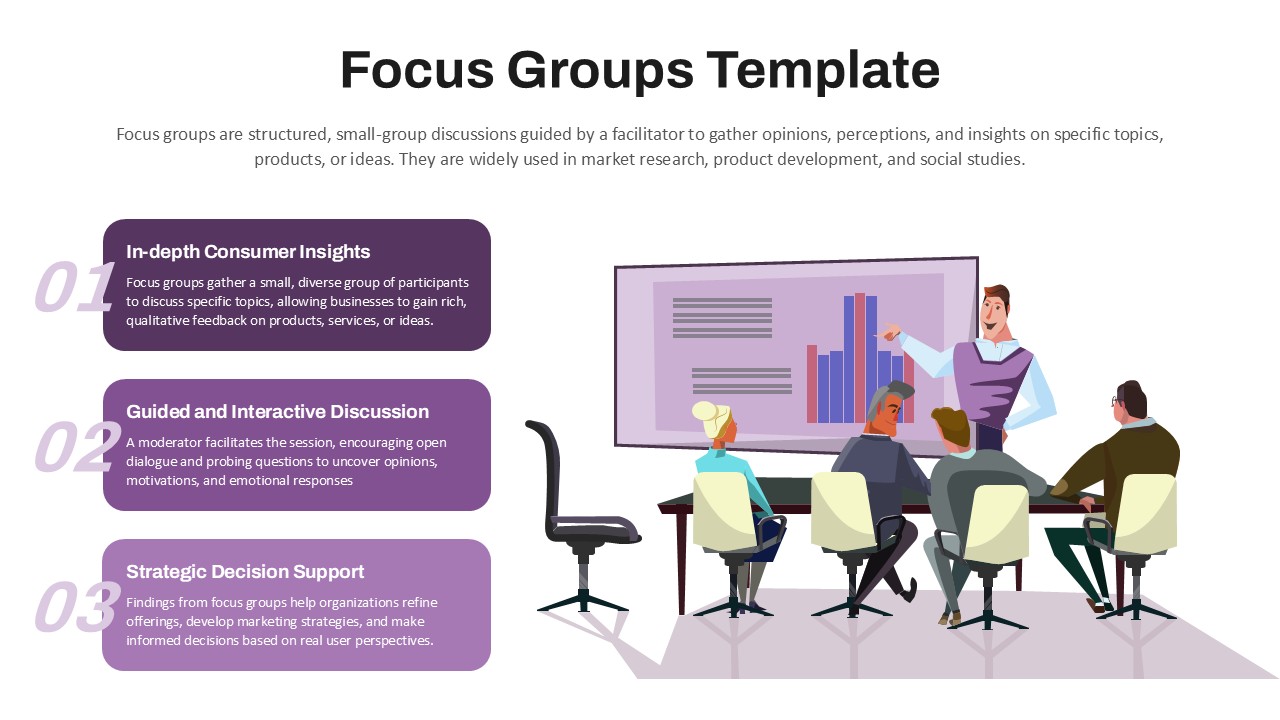
Focus Group Discussion and Insights Template for PowerPoint & Google Slides
Customer Experience
Customer Satisfaction KPI Dashboard Template for PowerPoint & Google Slides
Customer Experience
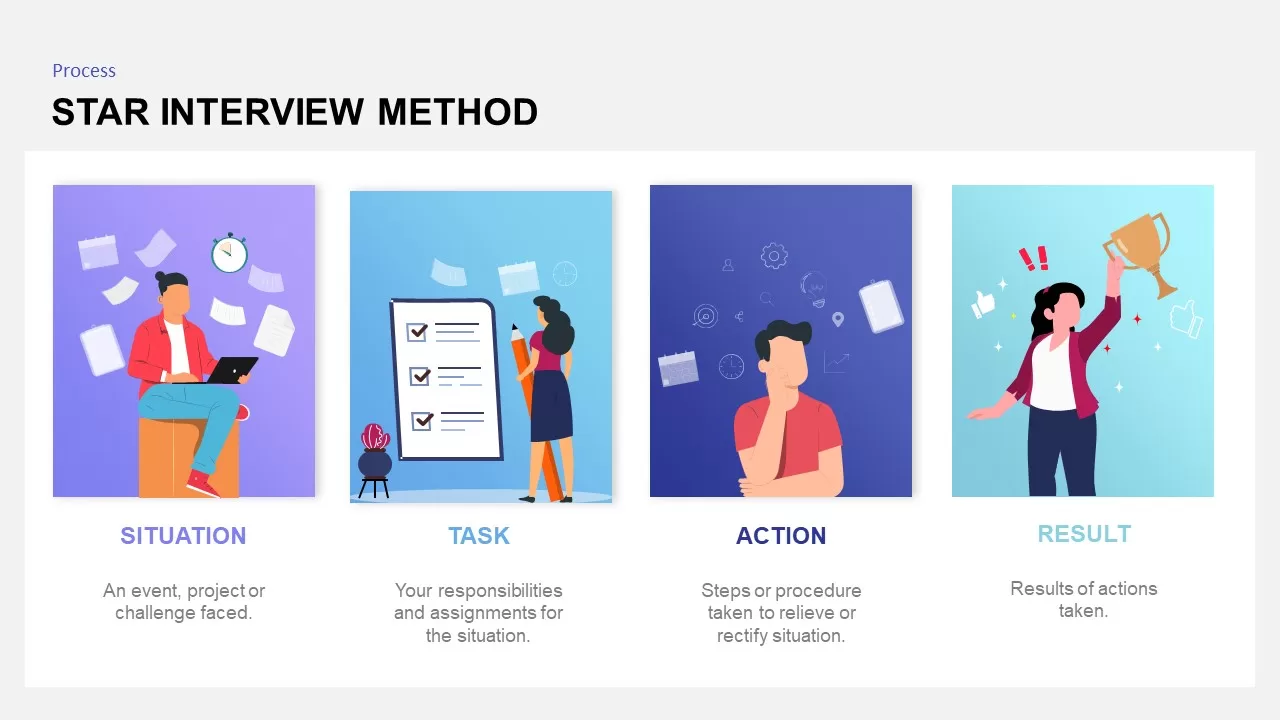
STAR Interview Method Process template for PowerPoint & Google Slides
Recruitment
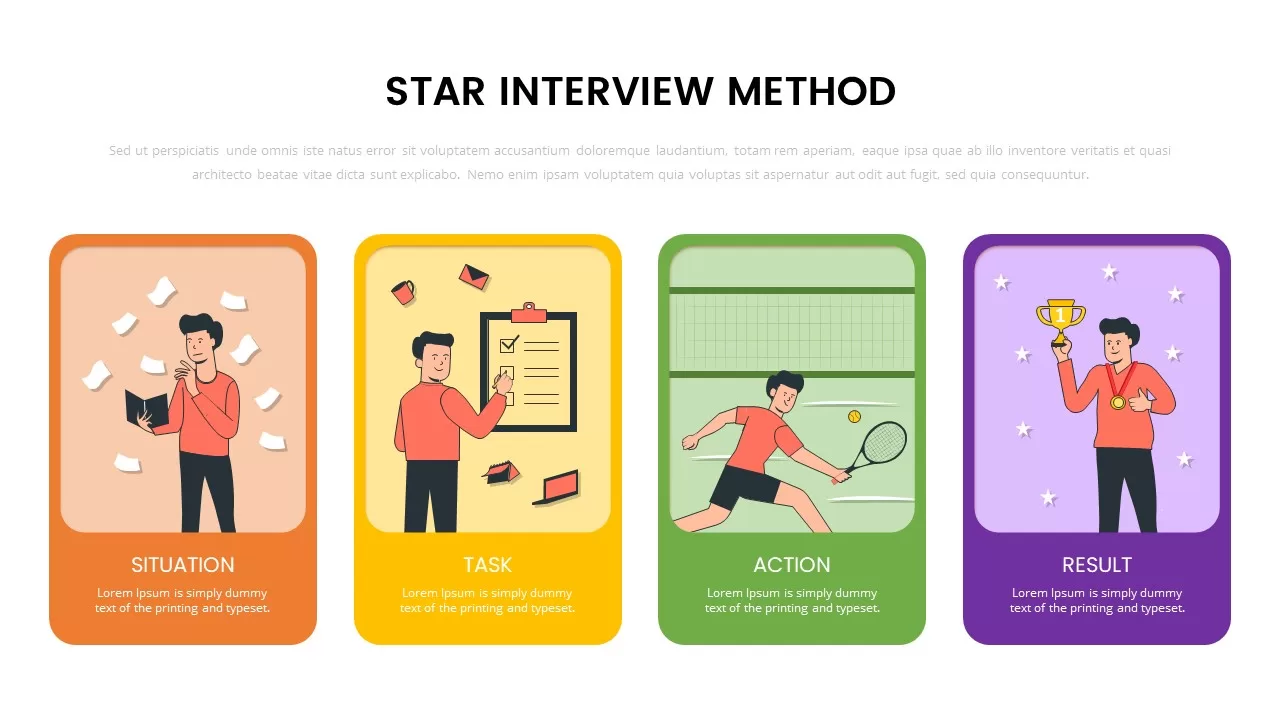
STAR Interview Technique template for PowerPoint & Google Slides
Business
STAR Interview Method Template for PowerPoint & Google Slides
Recruitment

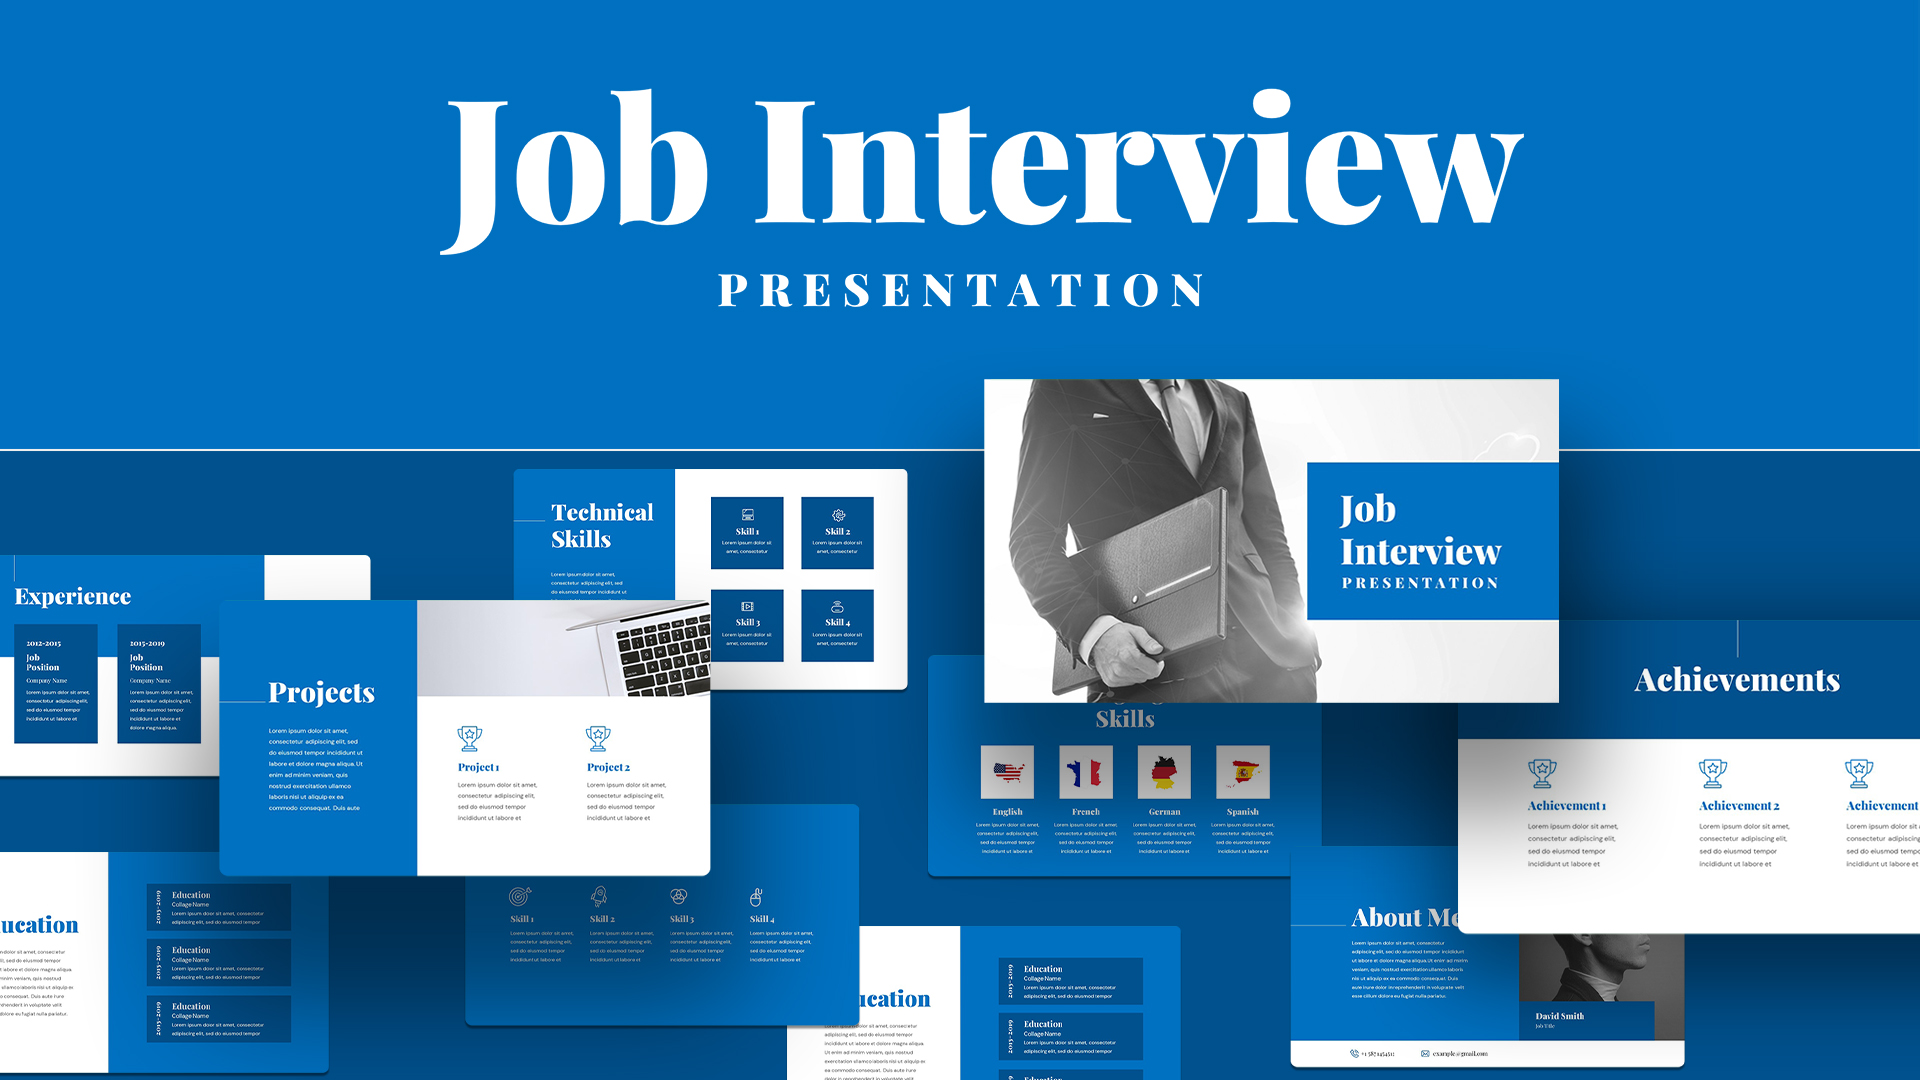
Free Job Interview Presentation template for PowerPoint & Google Slides
Recruitment
Free
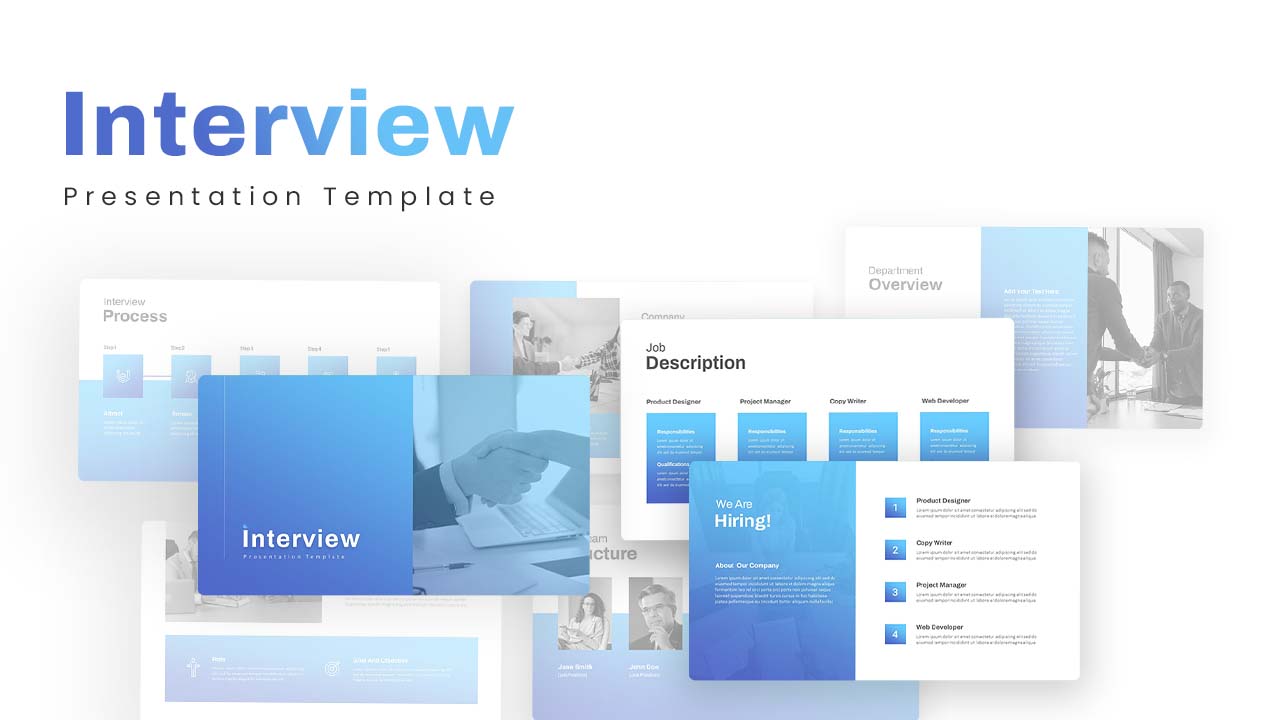
Recruitment Interview Presentation Template for PowerPoint & Google Slides
Recruitment
Personal Job Interview Presentation Template for PowerPoint & Google Slides
Recruitment
Technical Interview Best Practices Template for PowerPoint & Google Slides
Process
Free KPI Dashboard PowerPoint Template for PowerPoint & Google Slides
Charts
Free
E-commerce Analytics Dashboard Template for PowerPoint & Google Slides
Bar/Column

Dynamic Data Dashboard Infographic Template for PowerPoint & Google Slides
Bar/Column
Product Usage Analytics Dashboard Chart Template for PowerPoint & Google Slides
Bar/Column
Data Analytics Dashboard Design template for PowerPoint & Google Slides
Bar/Column

Efficiency KPI Dashboard Metaphor Template for PowerPoint & Google Slides
Infographics
Business Dashboard Analytics & KPIs Template for PowerPoint & Google Slides
Bar/Column

Professional Team Efficiency Dashboard Template for PowerPoint & Google Slides
Business Report
Project Management Dashboard Template for PowerPoint & Google Slides
Project
Website Performance Dashboard template for PowerPoint & Google Slides
Charts
Sales Performance Dashboard template for PowerPoint & Google Slides
Business Report
Immigration Data Dashboard Template for PowerPoint & Google Slides
Bar/Column
Employee Skill Analysis Dashboard Template for PowerPoint & Google Slides
Employee Performance
Sales Growth Dashboard: KPI Gauge & Line Template for PowerPoint & Google Slides
Revenue
Social Media Performance Dashboard Template for PowerPoint & Google Slides
Bar/Column
Net Promoter Score Dashboard Template for PowerPoint & Google Slides
Customer Experience
Modern Project Status Report Dashboard Template for PowerPoint & Google Slides
Project Status
Performance KPI Dashboard Slide Template for PowerPoint & Google Slides
Business Report
Bull and Bear Stock Market Dashboard Template for PowerPoint & Google Slides
Infographics
KPI Dashboard template for PowerPoint & Google Slides
Business Report
KPI Dashboard Overview template for PowerPoint & Google Slides
Finance
KPI Dashboard Data Visualization Template for PowerPoint & Google Slides
Bar/Column
KPI Dashboard Data Overview Slide Template for PowerPoint & Google Slides
Bar/Column
Professional Nurse Infographic Dashboard Template for PowerPoint & Google Slides
Nursing
Interactive Benchmarking Gauge Dashboard Template for PowerPoint & Google Slides
Pie/Donut
Heat Map Risk Matrix Dashboard Template for PowerPoint & Google Slides
Comparison Chart
Project Status Dashboard Table Template for PowerPoint & Google Slides
Project Status
Project Status Dashboard with Metrics Template for PowerPoint & Google Slides
Project Status
Colorful Project Status Dashboard Template for PowerPoint & Google Slides
Project Status
Weekly Update Schedule Dashboard Template for PowerPoint & Google Slides
Agenda
Project Status Dashboard Template for PowerPoint & Google Slides
Project Status
Weekly Status Report Dashboard Template for PowerPoint & Google Slides
HR
Free Metro UI Dashboard Infographic Template for PowerPoint & Google Slides
Business Report
Free
Website Performance Monitoring Dashboard Template for PowerPoint & Google Slides
Business Report
One Pager Project Status Dashboard Template for PowerPoint & Google Slides
Project Status
One Pager Annual Report Dashboard Template for PowerPoint & Google Slides
Business Report
Social Media Analytics Dashboard Template for PowerPoint & Google Slides
Digital Marketing
Social Media Statistics 2023 Dashboard Template for PowerPoint & Google Slides
Comparison
Mastodon Metrics Infographic Dashboard Template for PowerPoint & Google Slides
Business Report
Soccer Match Stats Dashboard Slide Template for PowerPoint & Google Slides
Graphics
Employee Satisfaction Survey Dashboard Template for PowerPoint & Google Slides
Employee Performance
Weekly Project Status Dashboard Template for PowerPoint & Google Slides
Project Status
Freight Logistics Dashboard Infographic Template for PowerPoint & Google Slides
Comparison Chart
Free Quarterly Business Review Dashboard Template for PowerPoint & Google Slides
Business
Free
Cost Cutting Savings Dashboard Template for PowerPoint & Google Slides
Pie/Donut
Macroeconomic Indicators Dashboard Template for PowerPoint & Google Slides
PEST
Free Monthly Report PowerPoint Template for PowerPoint & Google Slides
Business Report
Free
Michigan County Map with KPI Dashboard Template for PowerPoint & Google Slides
World Maps
Quarterly Financial Summary Dashboard Template for PowerPoint & Google Slides
Business Report
Banking Financial Overview Dashboard Template for PowerPoint & Google Slides
Finance
Quarterly Business Review Dashboard Template for PowerPoint & Google Slides
Pitch Deck
Monthly Business Review Dashboard Deck Template for PowerPoint & Google Slides
Business Report
DevOps KPI Dashboard Performance Metrics Template for PowerPoint & Google Slides
Software Development
Purchasing KPI Metrics Dashboard Template for PowerPoint & Google Slides
Business Report
Procurement KPI Dashboard & Metrics Template for PowerPoint & Google Slides
Business Report
Project Progress Dashboard Pie Charts Template for PowerPoint & Google Slides
Project
Monthly Sales Performance Dashboard Template for PowerPoint & Google Slides
Charts
HR Report Dashboard Template for PowerPoint & Google Slides
Employee Performance
Budget Forecast Dashboard & Donut Charts Template for PowerPoint & Google Slides
Pie/Donut
Risk Level Gauge Comparison Dashboard Template for PowerPoint & Google Slides
Comparison
Inventory Management Dashboard Template for PowerPoint & Google Slides
Process
Digital Marketing KPIs Dashboard Dark Template for PowerPoint & Google Slides
Business Report
Employee Performance Metrics Dashboard Template for PowerPoint & Google Slides
Employee Performance
Turnover Analysis Dashboard Template for PowerPoint & Google Slides
Employee Performance
Project Tracking Dashboard Table Template for PowerPoint & Google Slides
Project Status
Action Items Management Dashboard Table Template for PowerPoint & Google Slides
Project Status
Electronic Health Records Dashboard template for PowerPoint & Google Slides
Health
Account Overview Dashboard template for PowerPoint & Google Slides
Business
Project Status Dashboard Report Template for PowerPoint & Google Slides
Project Status
Project Status Update Dashboard Table Template for PowerPoint & Google Slides
Project Status
Cohort Analysis Retention Dashboard Template for PowerPoint & Google Slides
Comparison Chart
Project Status Dashboard Template for PowerPoint & Google Slides
Project Status
Dashboard Project Status Template for PowerPoint & Google Slides
Project Status
Project Status Template Dashboard with Gauge for PowerPoint & Google Slides
Project Status
Task Completion Rate Dashboard Template for PowerPoint & Google Slides
Business
Project Status Dashboard with RAG Legend Template for PowerPoint & Google Slides
Project Status
End of Year Review Dashboard Template for PowerPoint & Google Slides
Business Report
Construction Project Dashboard Template for PowerPoint & Google Slides
Project
Employee Headcount Dashboard Report Template for PowerPoint & Google Slides
Employee Performance
4DX Scoreboard KPI Gauge Dashboard Template for PowerPoint & Google Slides
Business Strategy
Dashboard Templates for PowerPoint & Google Slides
Bar/Column
Free Infographic Statistics Dashboard Slide for PowerPoint & Google Slides
Bar/Column
Free
Engineering Maintenance Dashboard Slide for PowerPoint & Google Slides
Software Development
Incident Tracking Dashboard for PowerPoint & Google Slides
Business Plan
MVP Product Roadmap Delivery Dashboard for PowerPoint & Google Slides
Roadmap