Company Features Circle Diagram for PowerPoint & Google Slides

Description
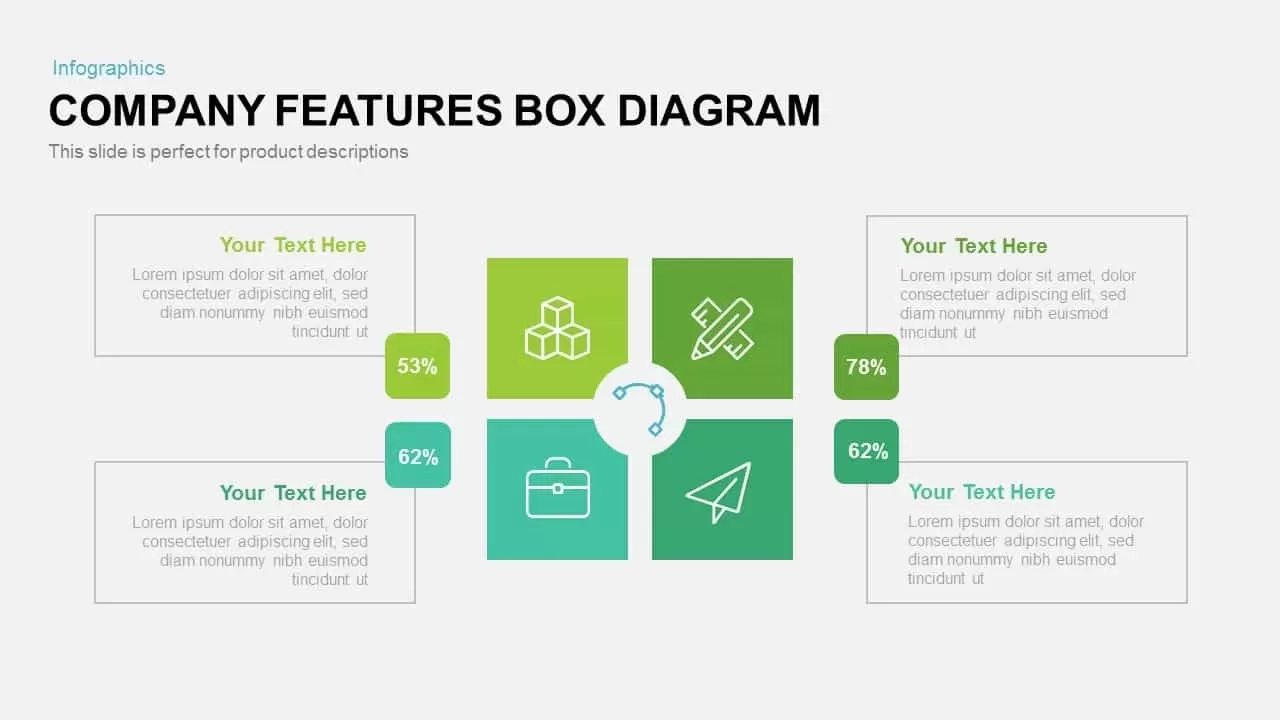
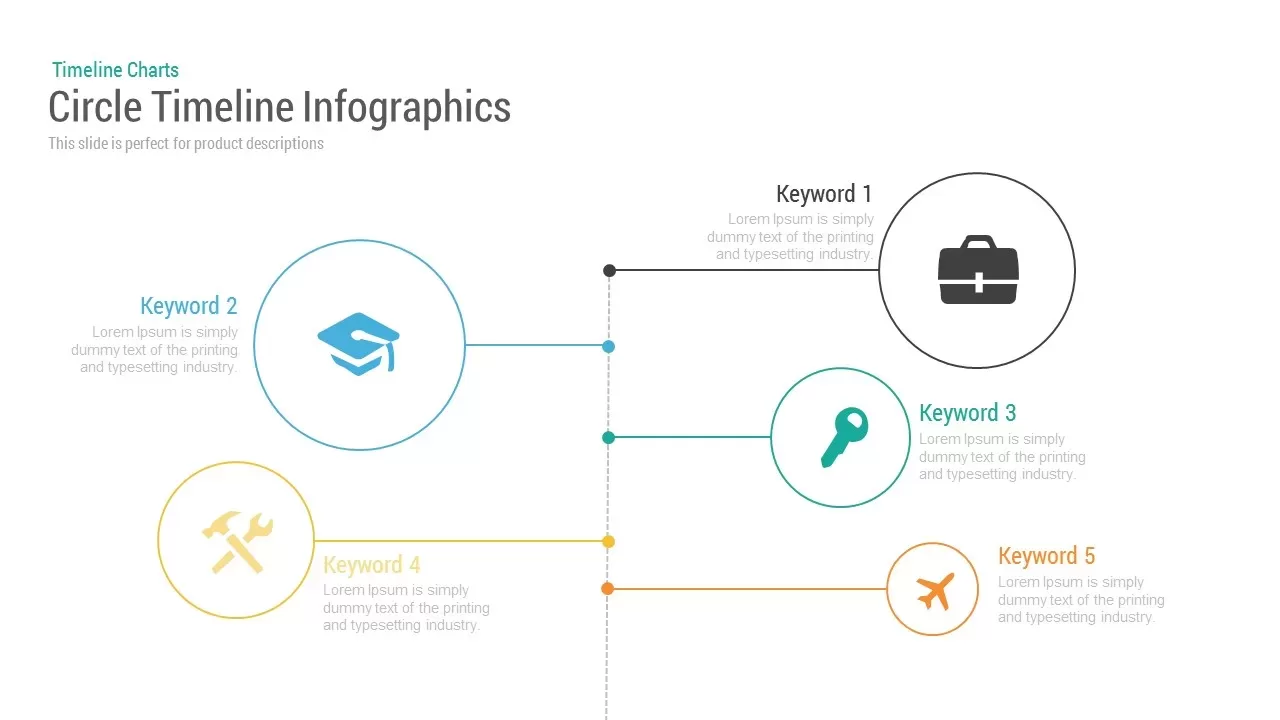
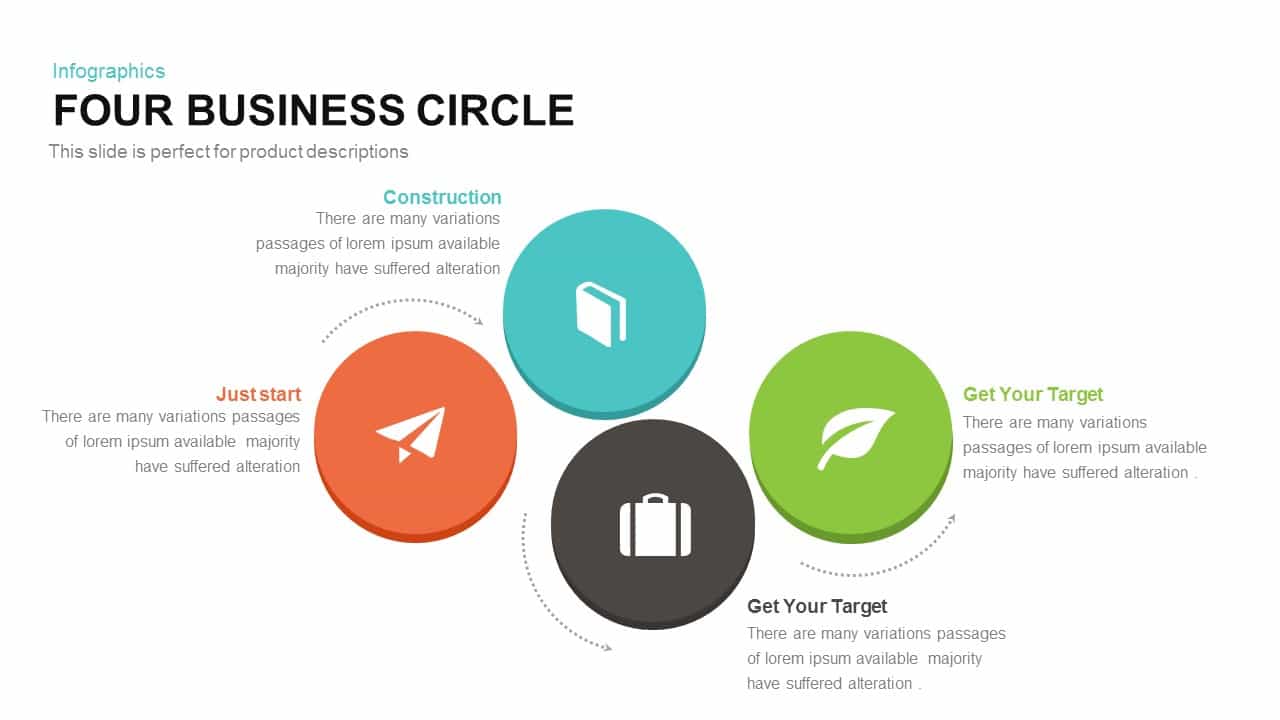
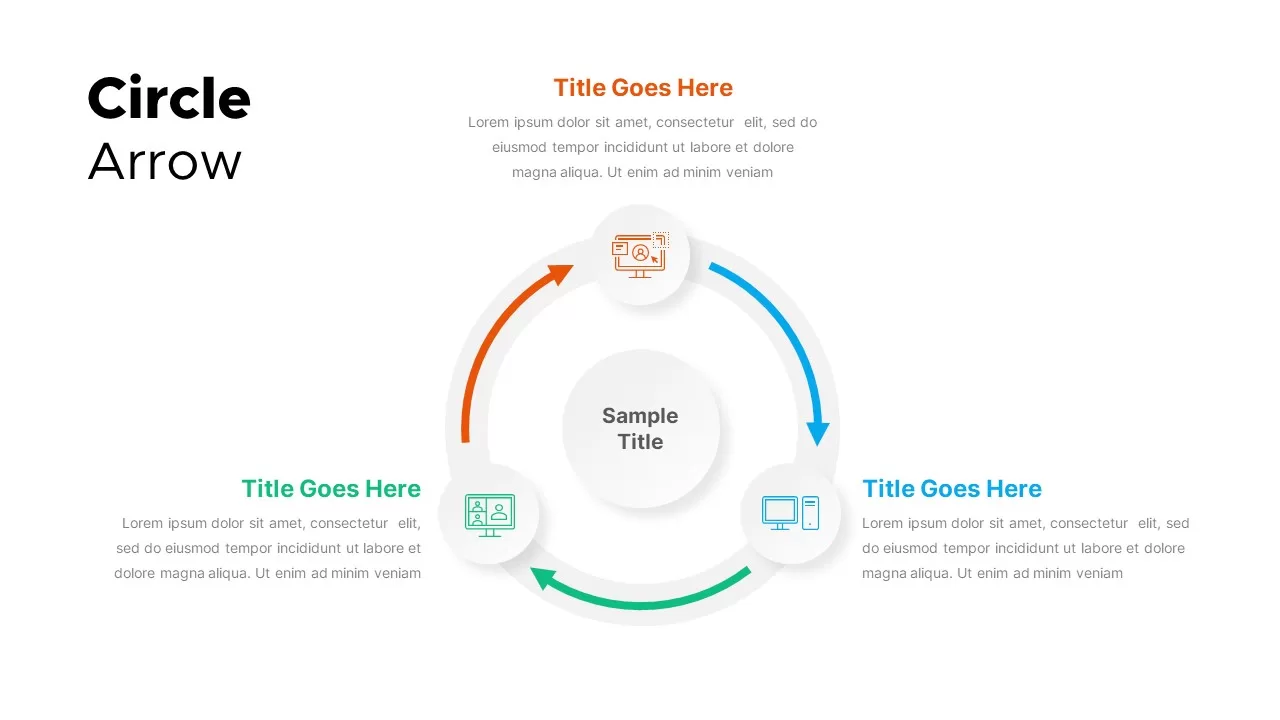
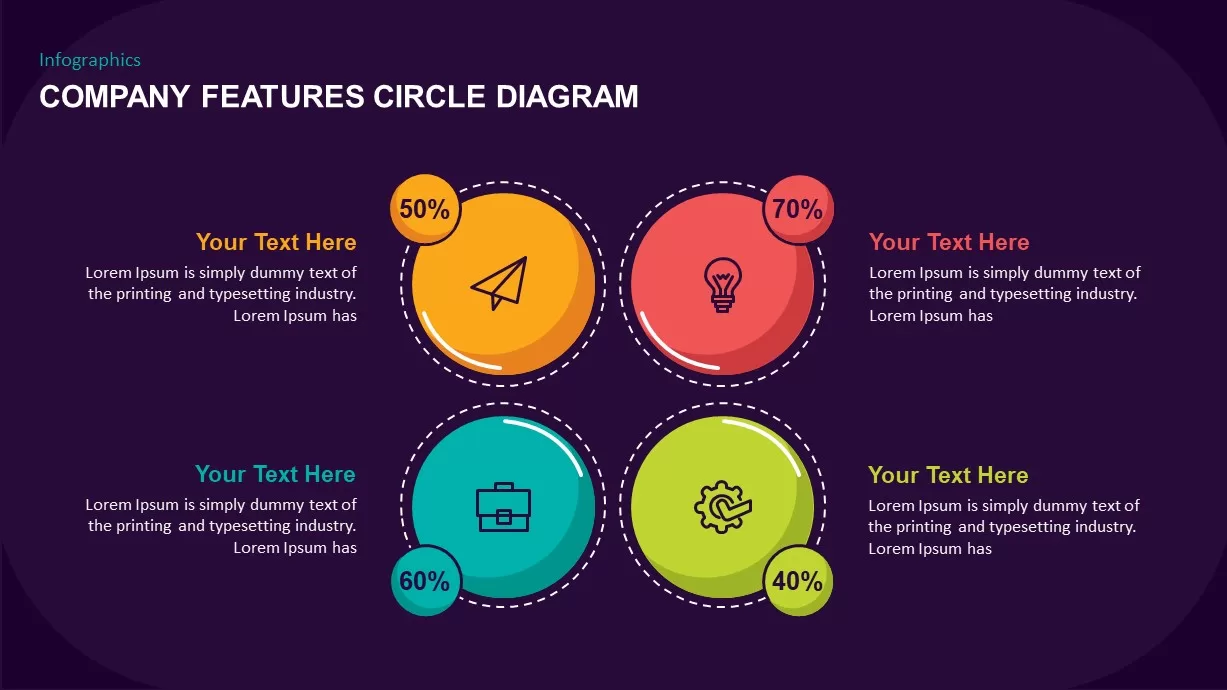
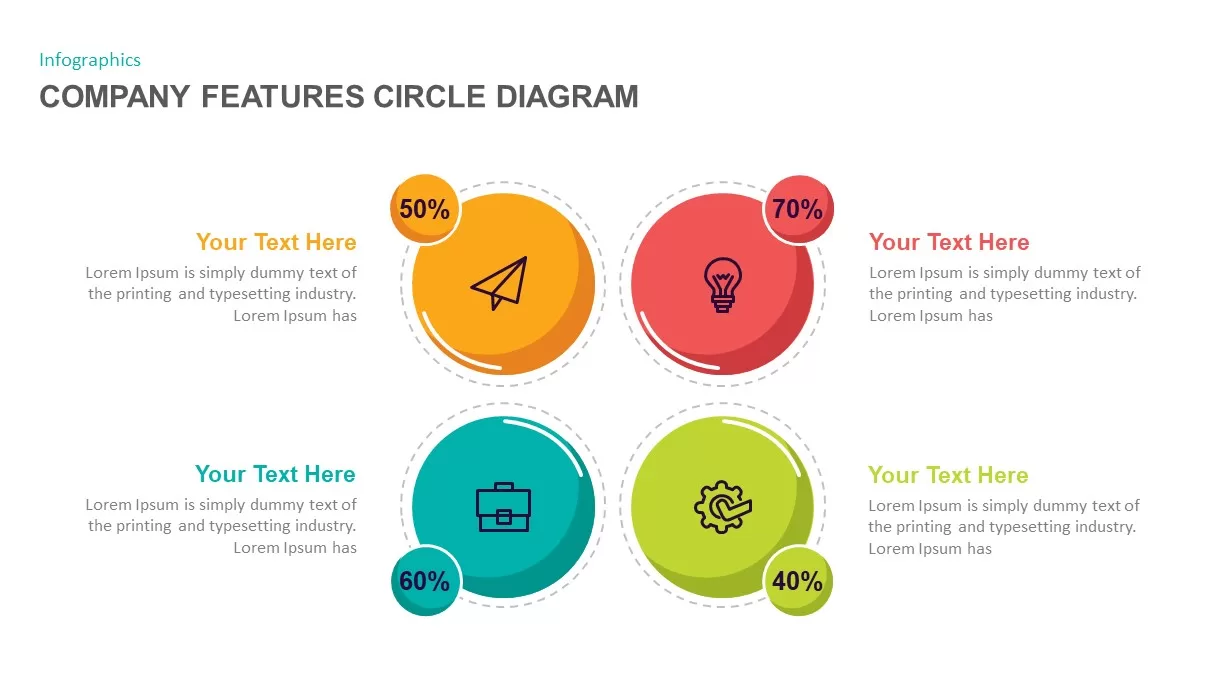
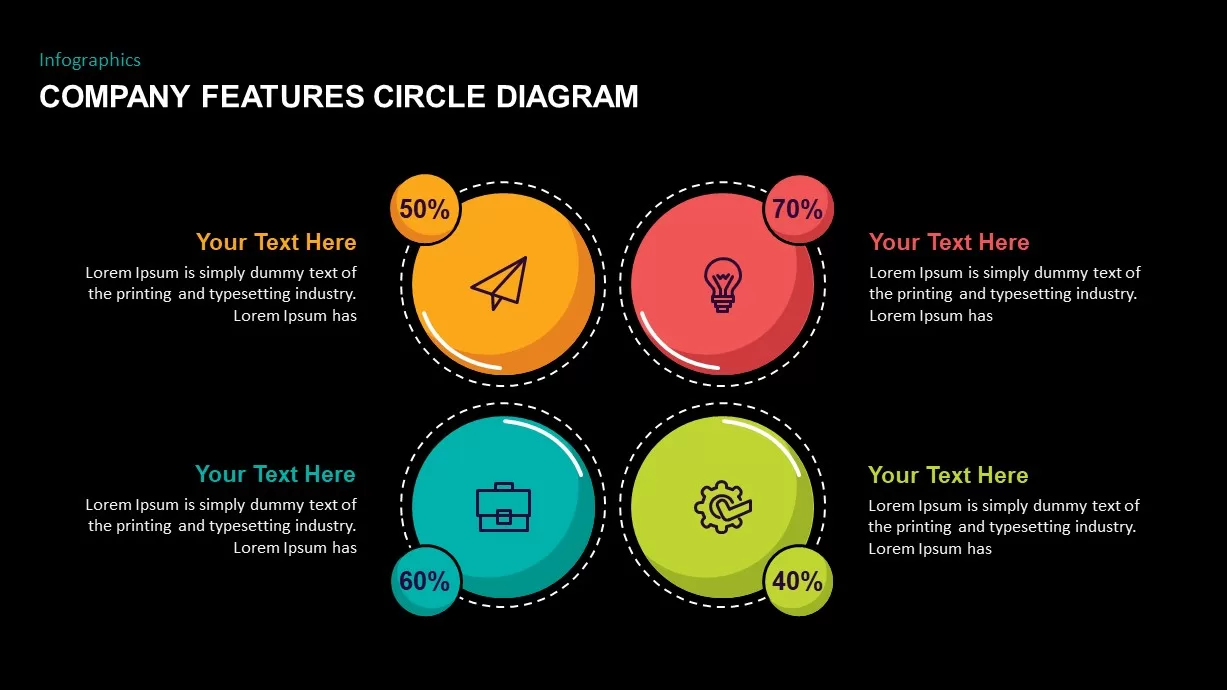
This company features circle diagram template enables you to present key business features with a clean, modern, and intuitive visual format. With four distinct, color-coded circles, each representing a unique feature or metric, you can easily convey percentage-based data alongside custom descriptions. The vibrant color scheme—ranging from orange to red, green, and blue—helps differentiate between various categories, ensuring clarity and focus during your presentation. Each circle has a percentage indicator (50%, 60%, 70%, 40%) and is accompanied by a corresponding icon, such as a paper plane, light bulb, suitcase, or gear, making it visually engaging while maintaining professionalism.
This template is perfect for highlighting and explaining the performance, goals, or priorities of different aspects of a business. It supports clear, concise communication, helping stakeholders understand key metrics and progress quickly. The customizable text areas allow for easy editing, enabling you to tailor the content according to your specific needs, whether for internal reporting, stakeholder meetings, or project updates.
Optimized for both PowerPoint and Google Slides, this template ensures seamless formatting across all devices, offering full compatibility and ease of use for quick updates. Perfect for presentations in business, strategy, or project management contexts, it can also be adapted for a variety of other professional uses.
Who is it for
This diagram is ideal for business leaders, project managers, and marketing professionals looking to showcase performance metrics, progress reports, or feature breakdowns. Consultants, strategists, and entrepreneurs can use it to highlight different aspects of their business, such as product features, project milestones, or team performance.
Other Uses
Beyond company feature analysis, the template can be used for reporting on marketing campaign performance, sales goals, or project completion rates. It can also serve as an engaging way to showcase a company’s strategic initiatives, key achievements, or department-specific metrics, making it a versatile tool for various industries.
Login to download this file

Item ID
SB01707
Related Templates

Custom Company Features Box Diagram Template for PowerPoint & Google Slides
Comparison
Puzzle DNA Diagram for Product Features Template for PowerPoint & Google Slides
Process
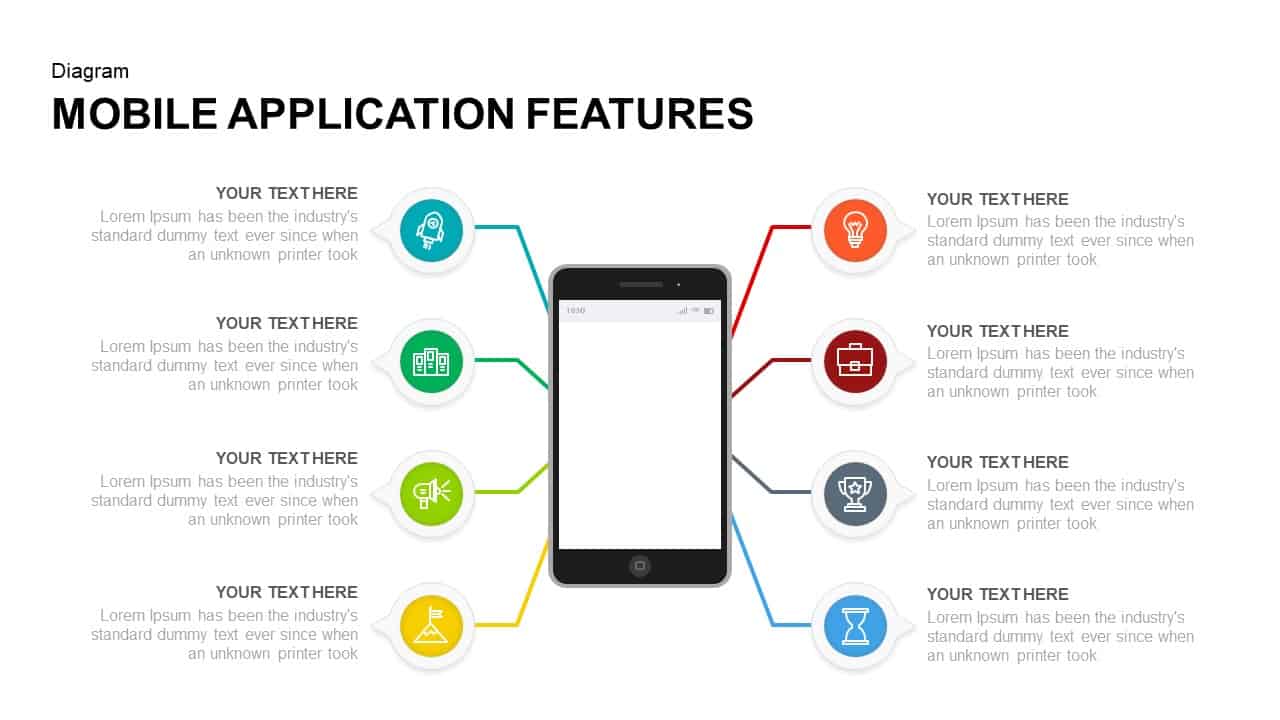
Mobile Application Features Diagram for PowerPoint & Google Slides
Technology
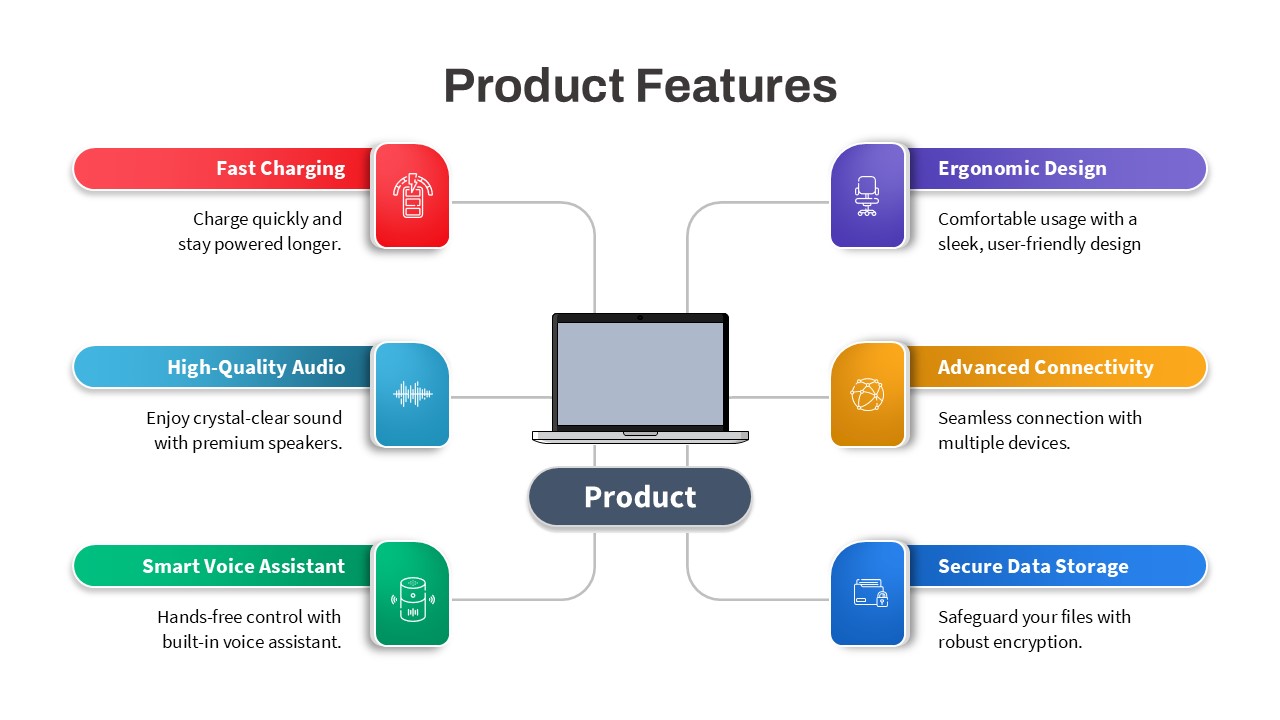
Product Features Diagram Template for PowerPoint & Google Slides
Process
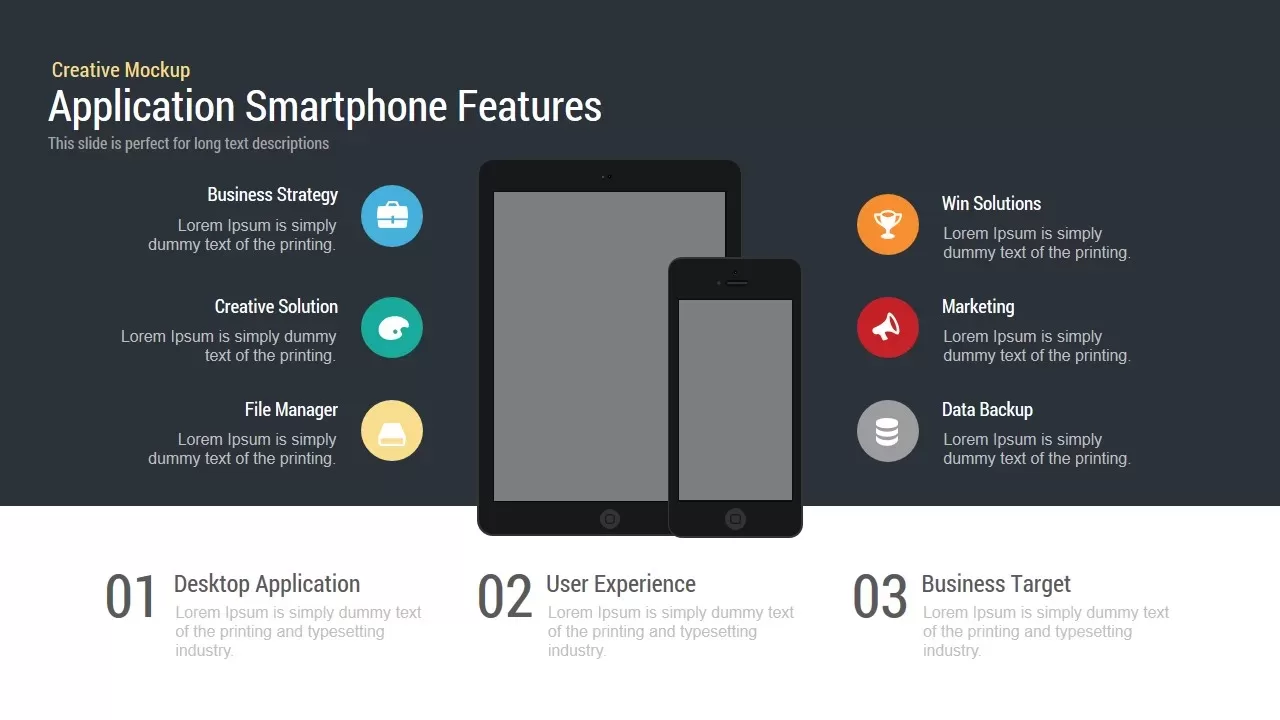
Application Smartphone Features template for PowerPoint & Google Slides
Technology
Mobile App Features template for PowerPoint & Google Slides
Technology
Business Investment Features Infographic Template for PowerPoint & Google Slides
Finance

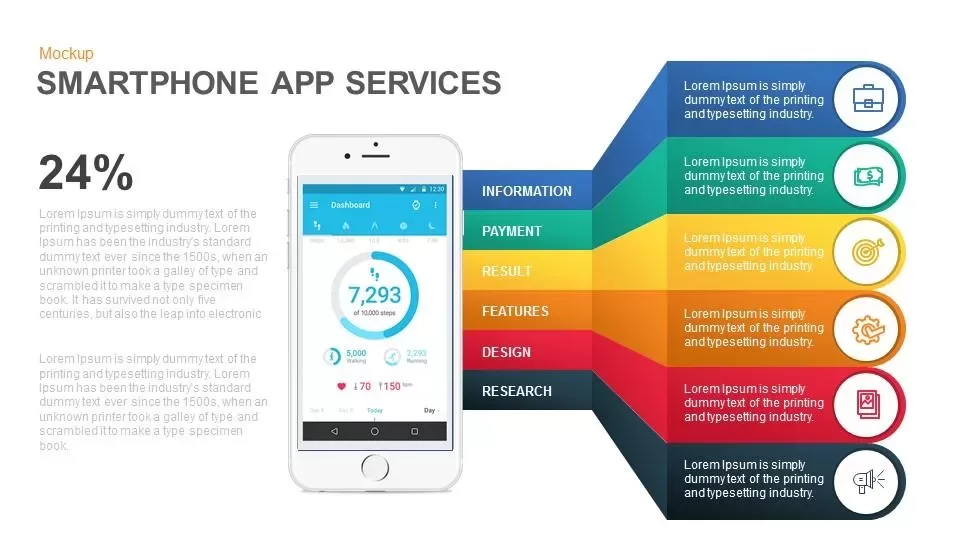
Mobile Service Features Infographic Template for PowerPoint & Google Slides
Process
Smartphone App Features Mockup Template for PowerPoint & Google Slides
Software Development
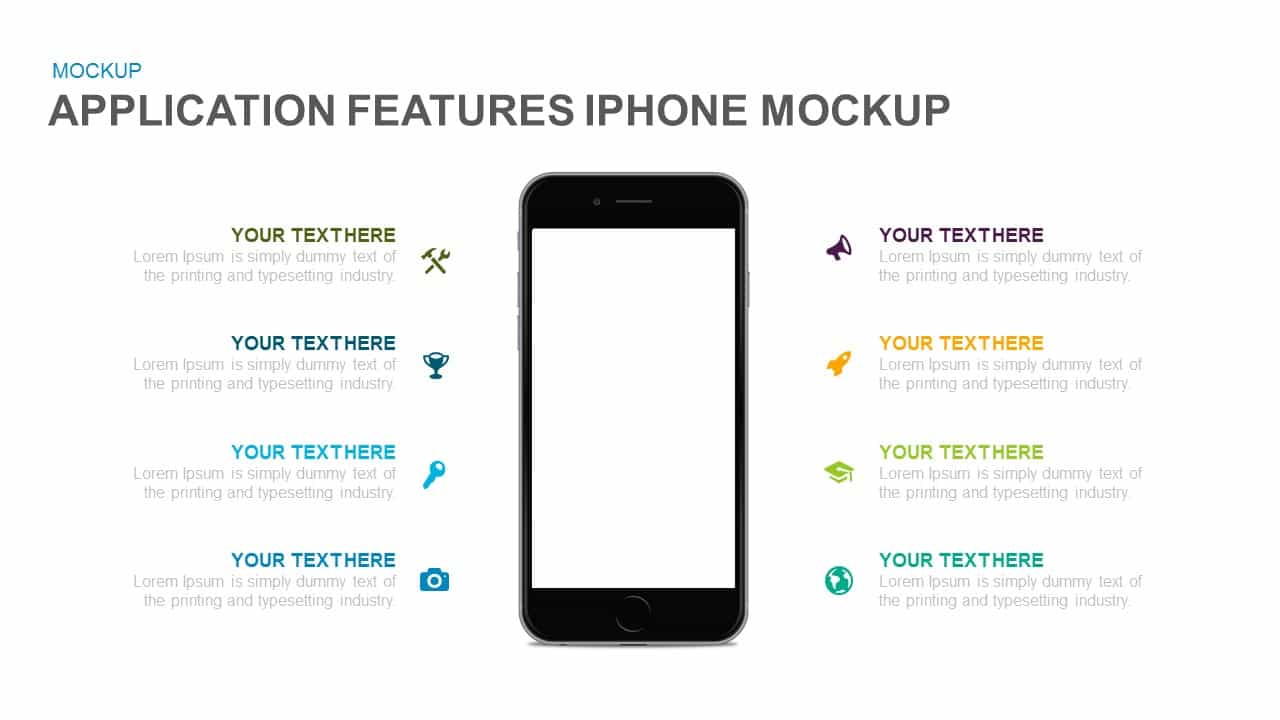
Application Features iPhone Mockup for PowerPoint & Google Slides
Graphics
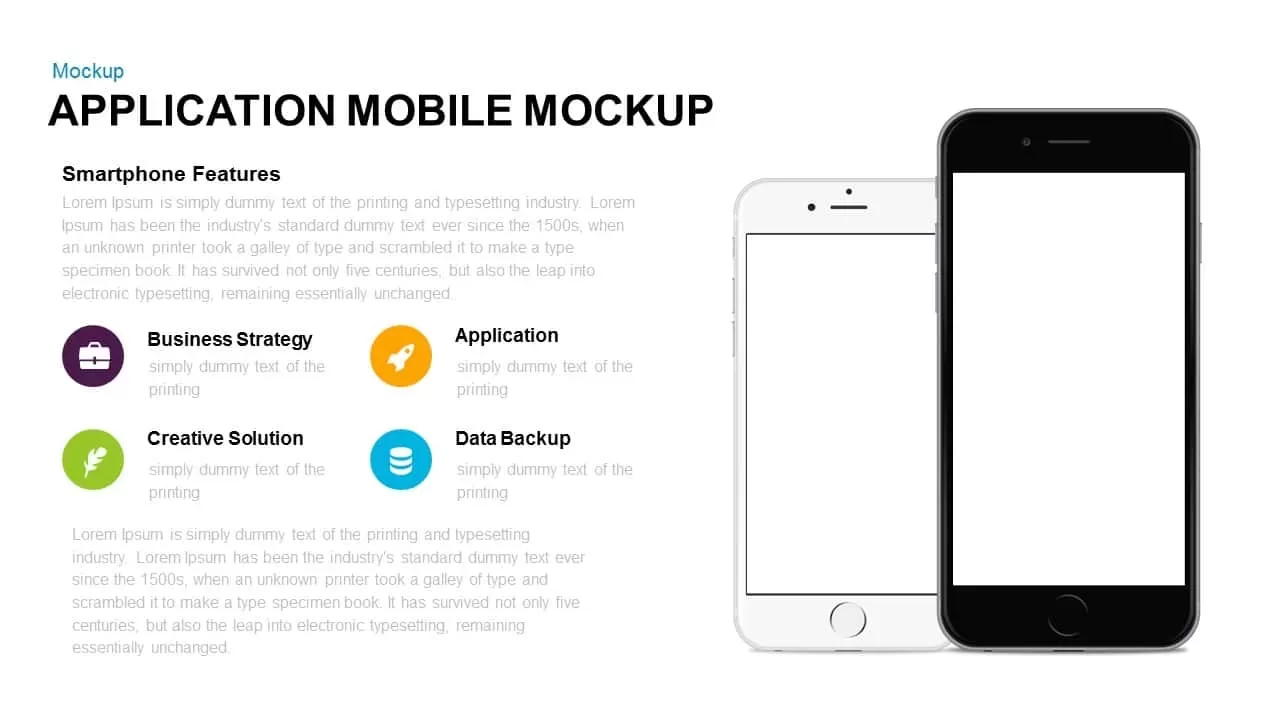
Mobile Application Features Mockup for PowerPoint & Google Slides
Graphics

Smartphone & Web Application Features template for PowerPoint & Google Slides
Software Development
Service Features Presentation template for PowerPoint & Google Slides
Business Proposal
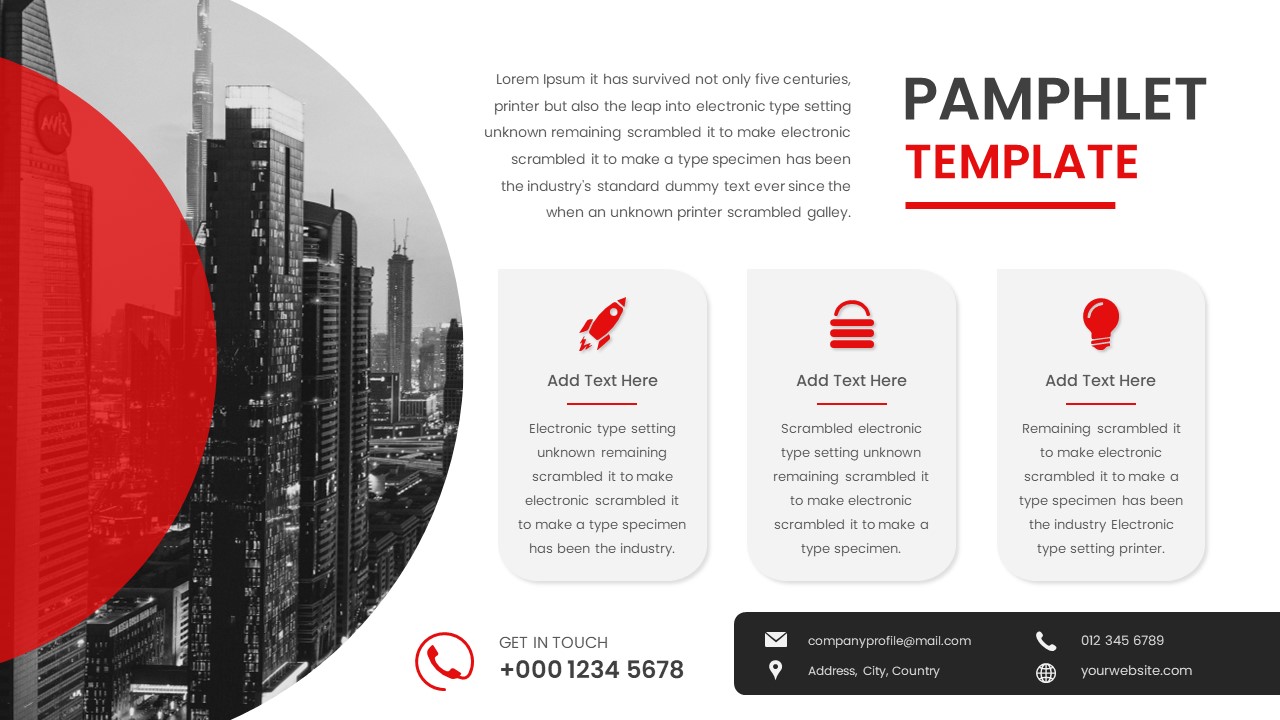
Corporate Pamphlet with Icon Features Template for PowerPoint & Google Slides
Graphics
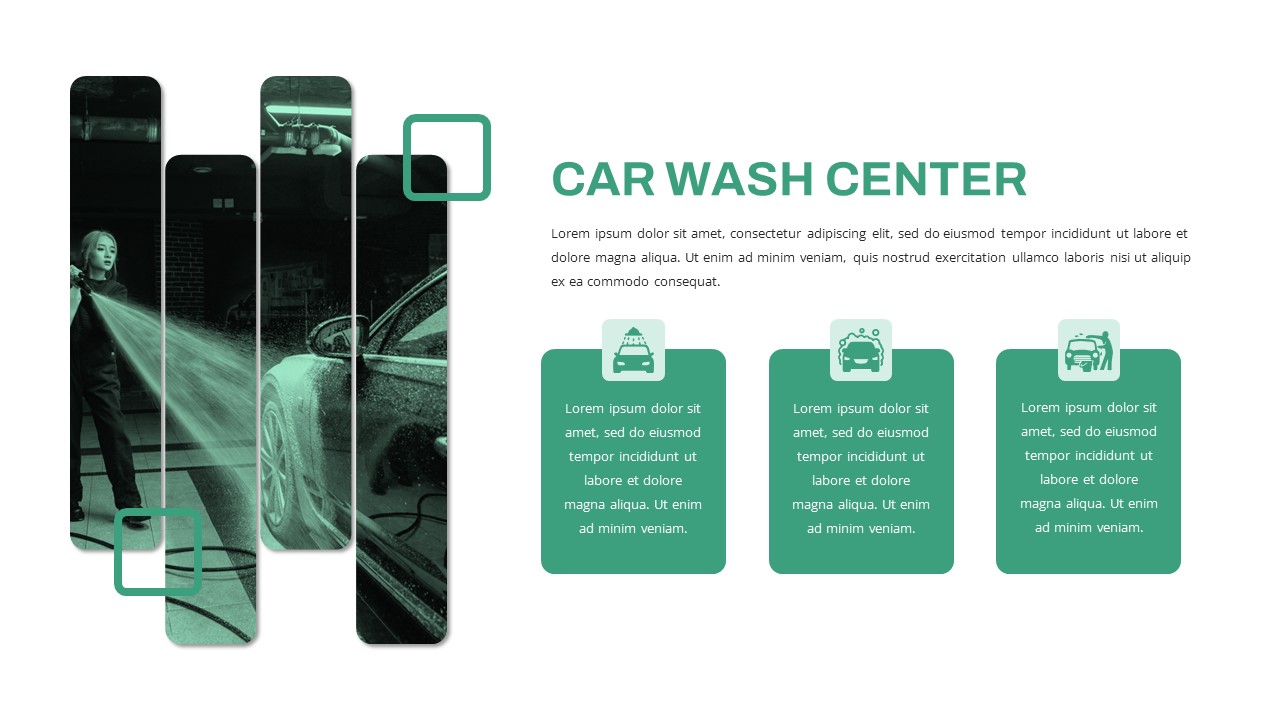
Free Car Wash Center Service Features Slide Template for PowerPoint & Google Slides
Business Proposal
Free
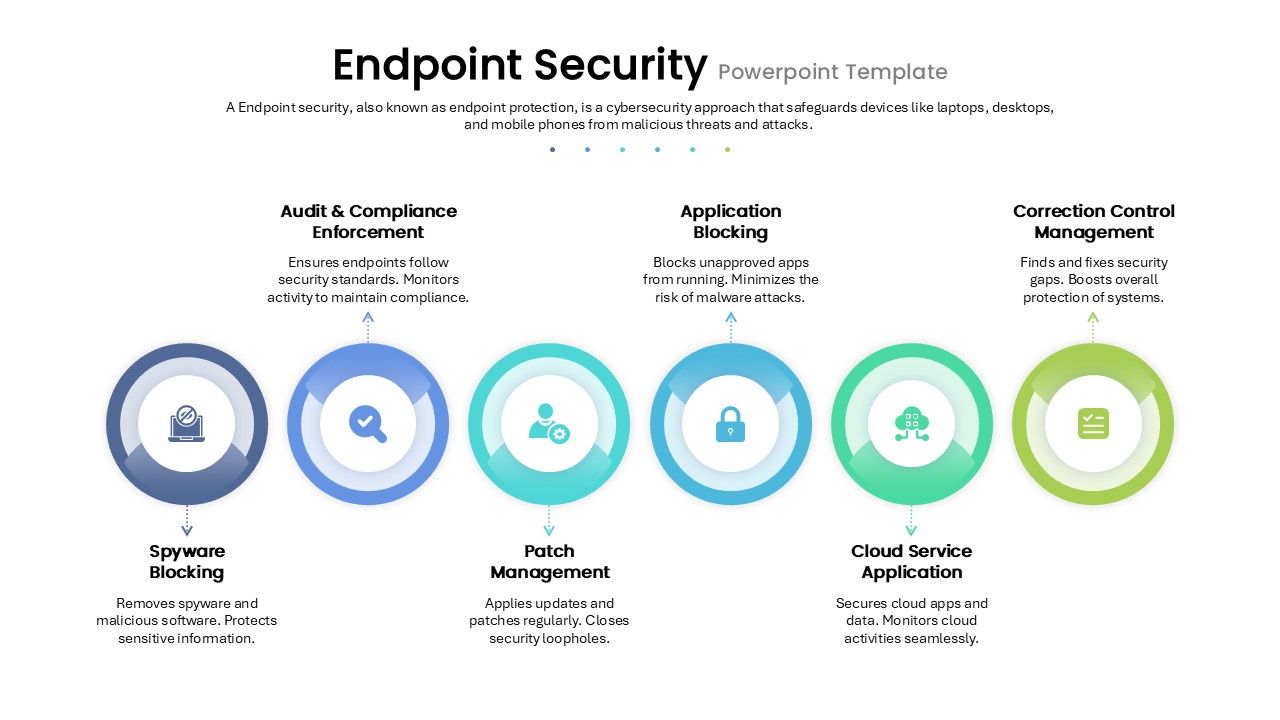
Endpoint Security Protection Features Template for PowerPoint & Google Slides
Information Technology
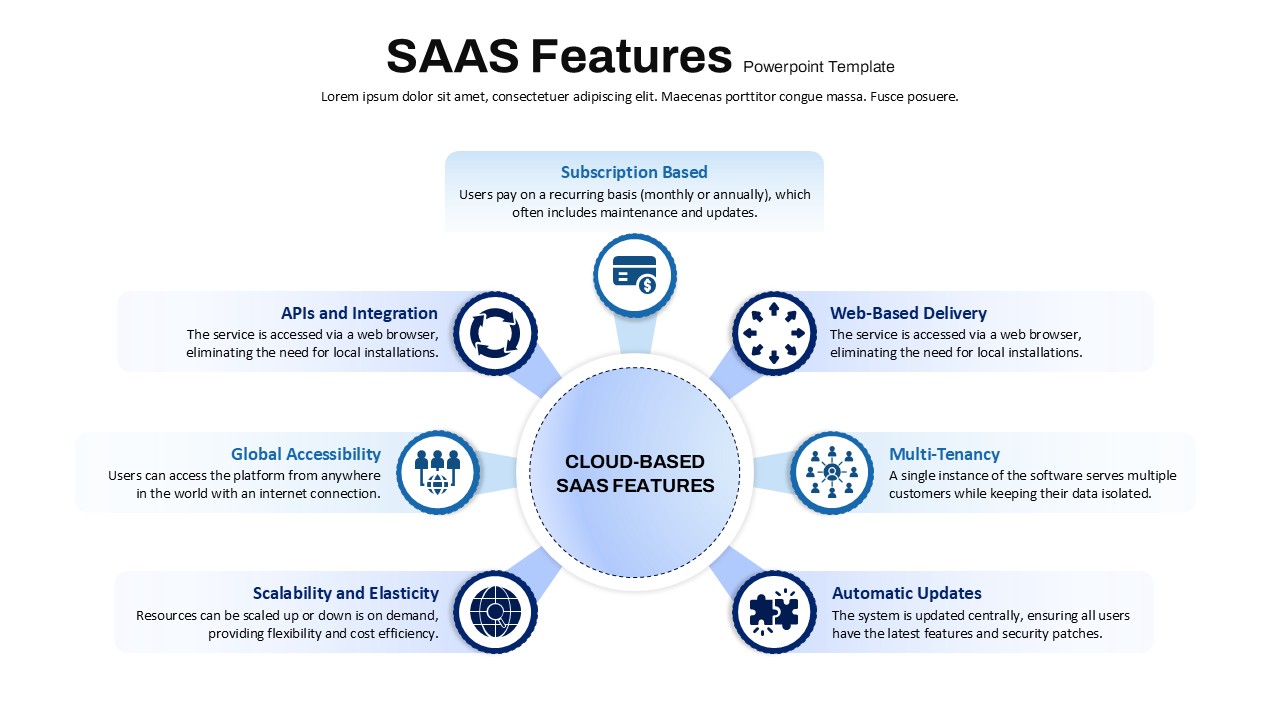
SAAS Features template for PowerPoint & Google Slides
Cloud Computing
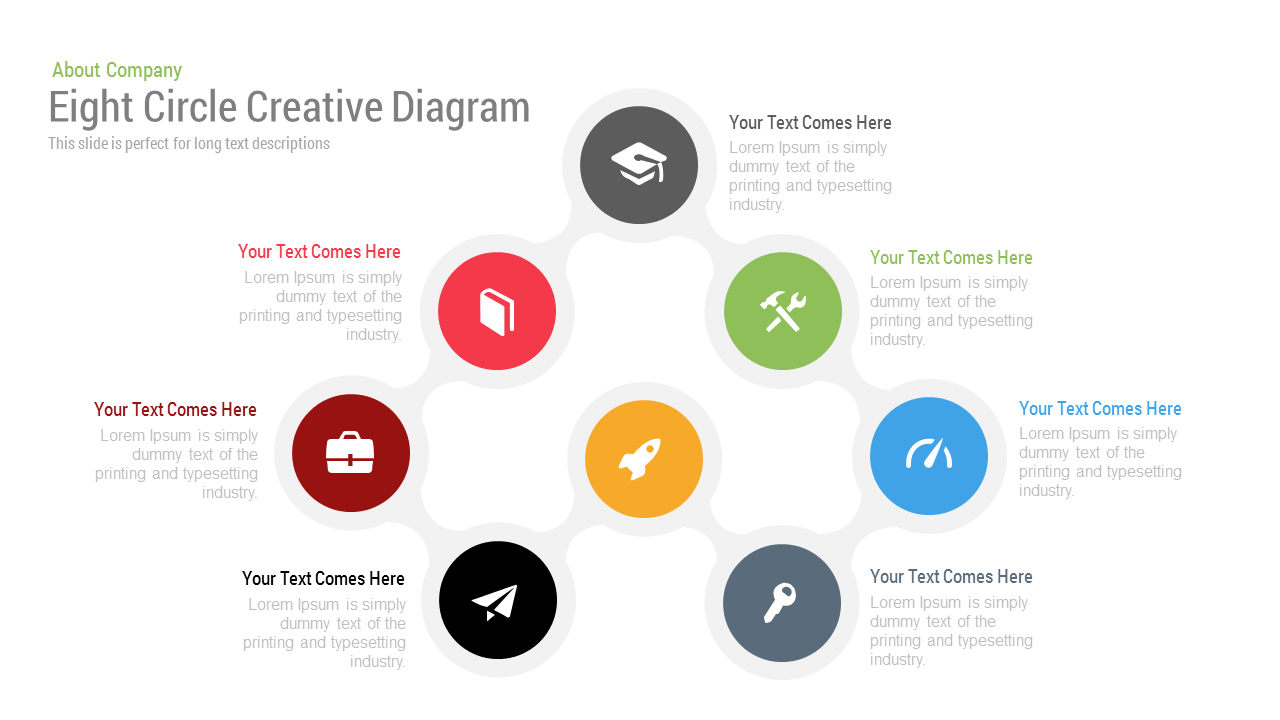
Free Eight Circle Creative Diagram template for PowerPoint & Google Slides
Circular
Free
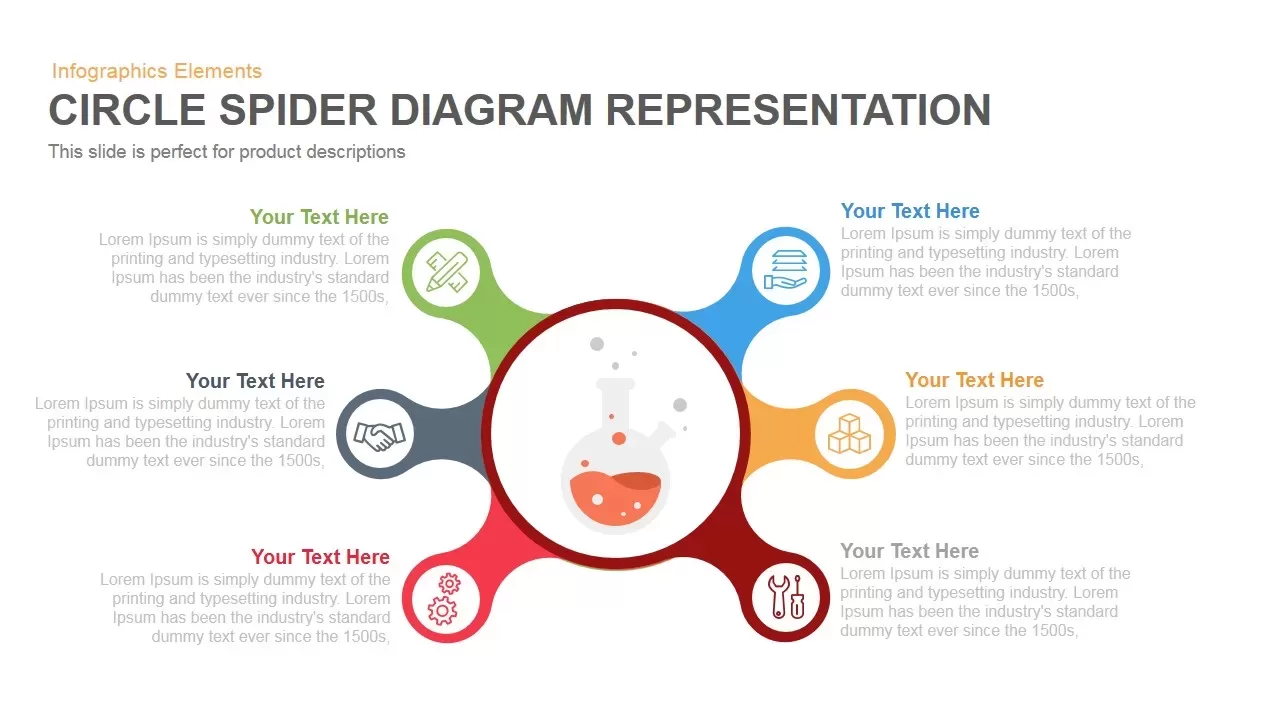
Circle Spider Diagram Representation Template for PowerPoint & Google Slides
Circular
Modern Circle SWOT Analysis Diagram Template for PowerPoint & Google Slides
SWOT
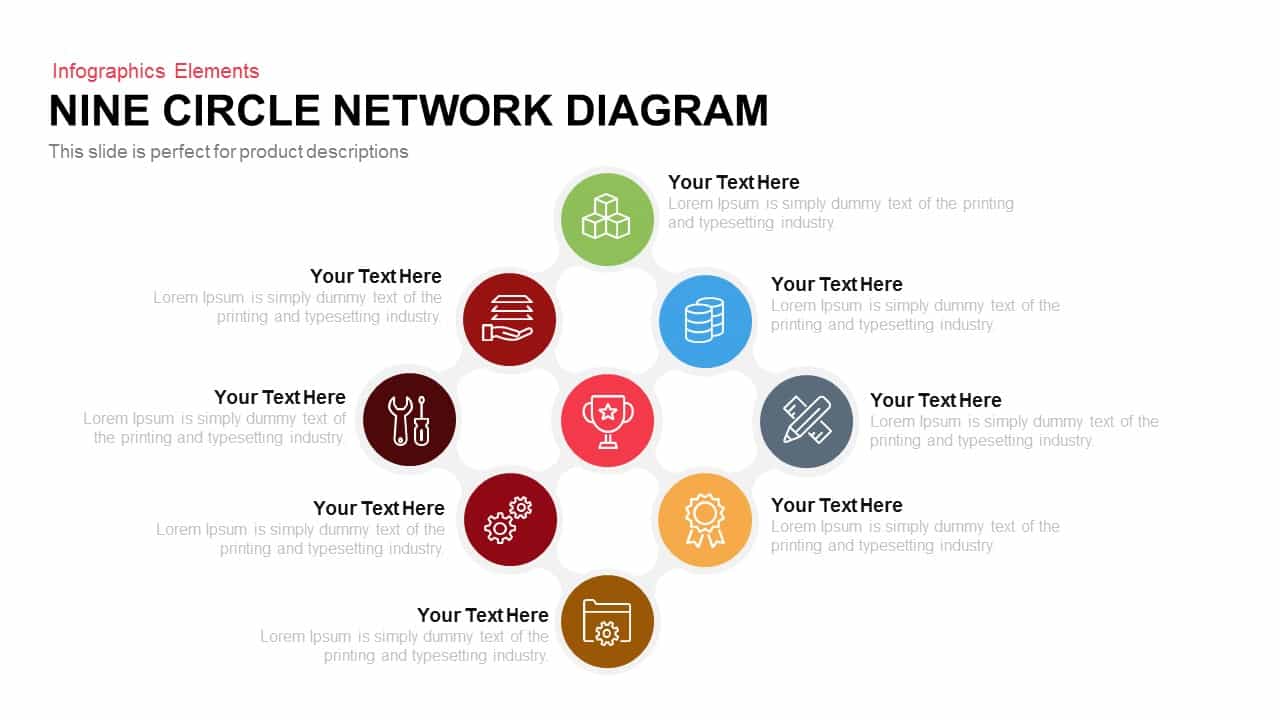
Modern Nine Circle Network Diagram Template for PowerPoint & Google Slides
Circular
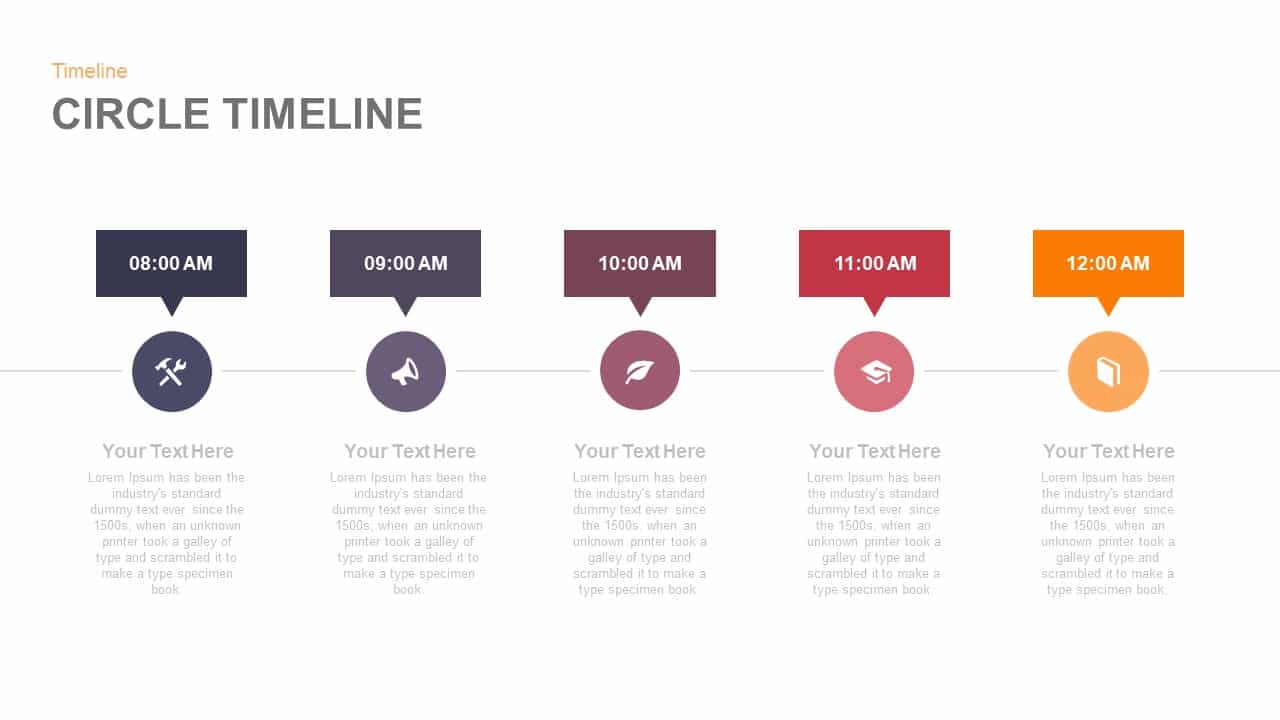
Alternating Circle Timeline Diagram Template for PowerPoint & Google Slides
Timeline
Three Circle Arrow Process Diagram template for PowerPoint & Google Slides
Circular
Multi-Segment Circle Split Diagram template for PowerPoint & Google Slides
Circular

Eight Circle Diagram Template for PowerPoint & Google Slides
Circular
Multi-layout Circle Spoke Diagram Template for PowerPoint & Google Slides
Circular
Four-Circle Venn Process Diagram template for PowerPoint & Google Slides
Process
Editable Twin Circle Process Diagram Template for PowerPoint & Google Slides
Process
Three-Level Sequence Circle Diagram Template for PowerPoint & Google Slides
Circular
Five-Staged Circle Sections Diagram Template for PowerPoint & Google Slides
Circular
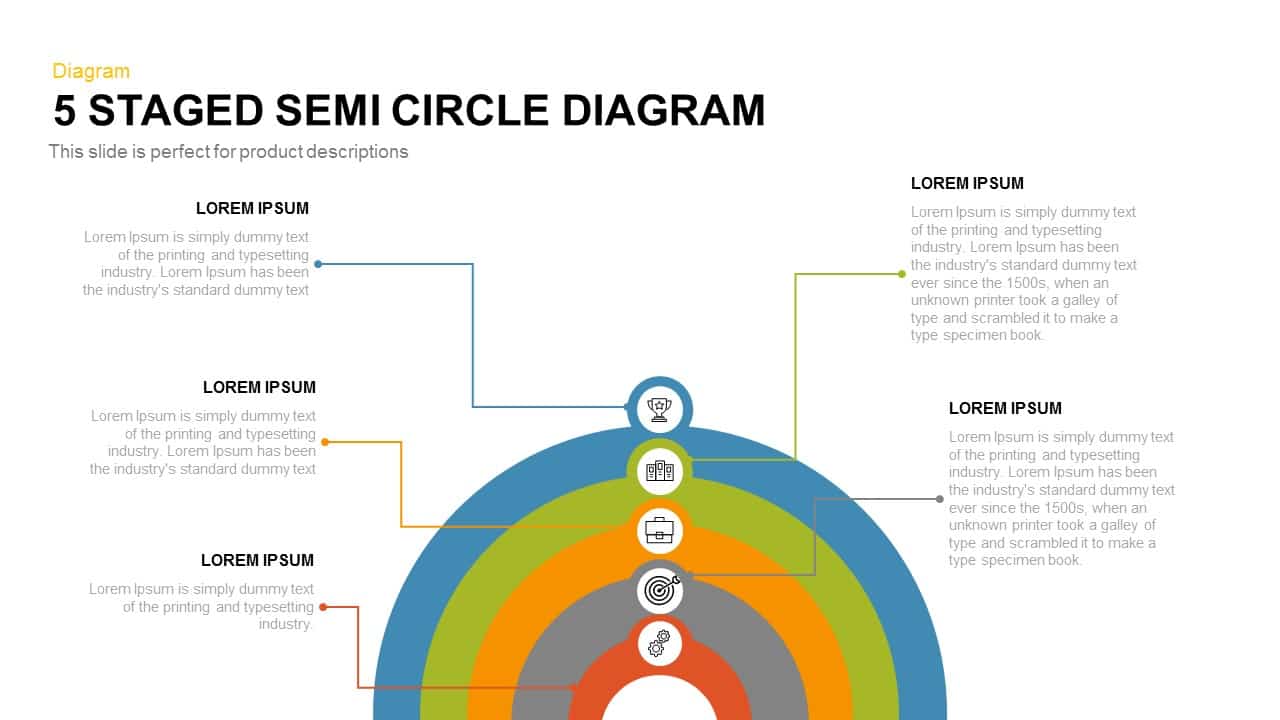
Five-Stage Semi-Circle Diagram Template for PowerPoint & Google Slides
Process
Five-Stage Circle Arrow Diagram Template for PowerPoint & Google Slides
Circular
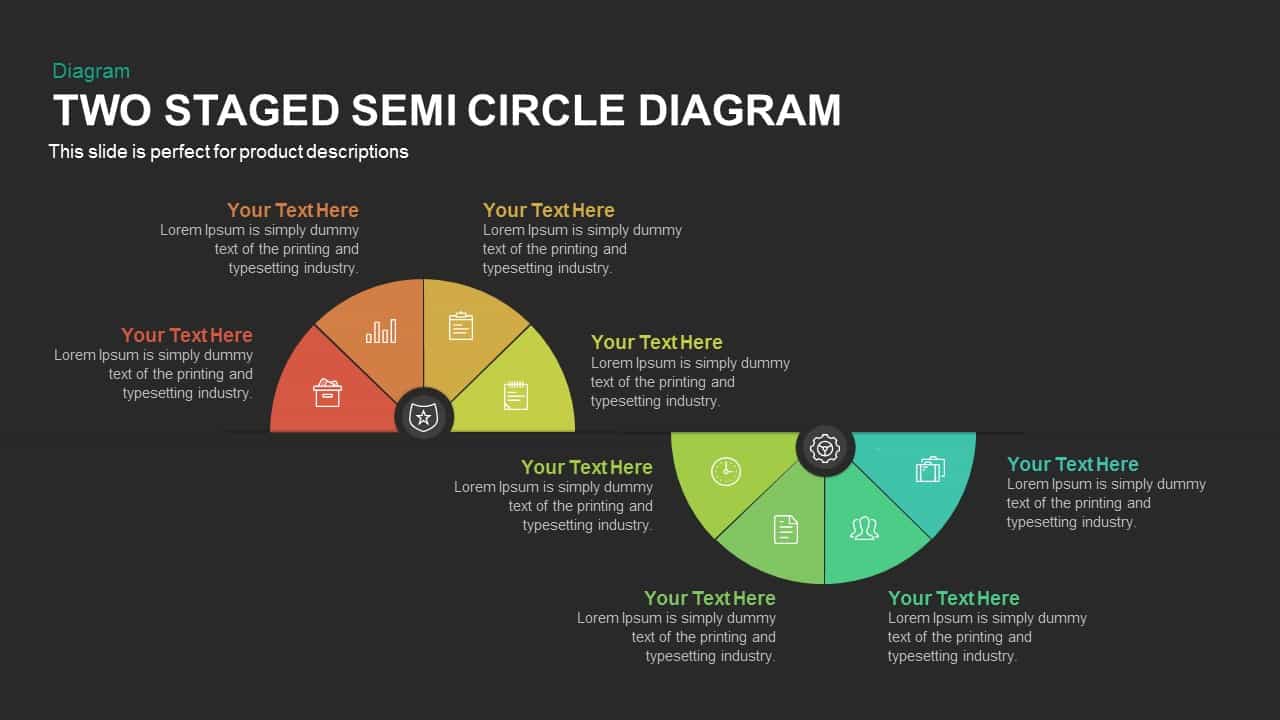
Two-Stage Semi-Circle Diagram Overview Template for PowerPoint & Google Slides
Circular
Three-Circle Diagram Infographic Template for PowerPoint & Google Slides
Circular
Modern Multi-Section Circle Diagram Template for PowerPoint & Google Slides
Circular
Six-Stage Semi-Circle Diagram with Icons Template for PowerPoint & Google Slides
Circular
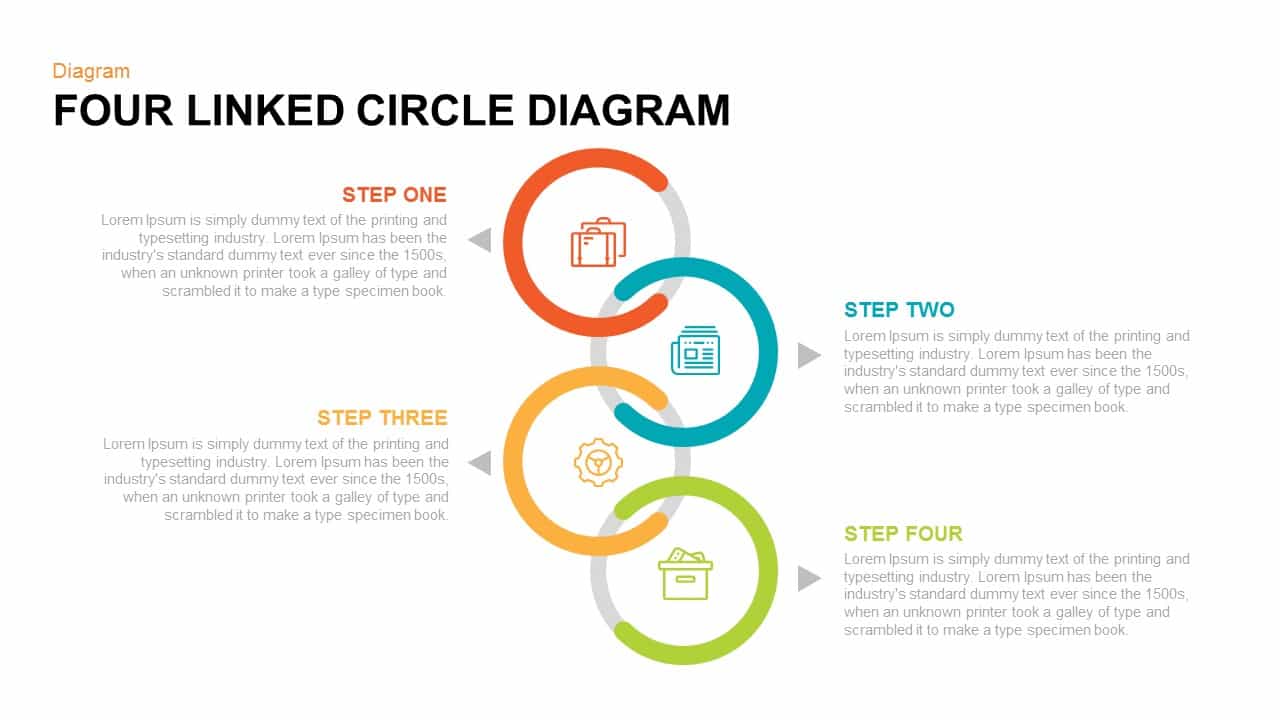
Four Linked Circle Diagram for PowerPoint & Google Slides
Process
Four-Circle Hub and Spoke Diagram Template for PowerPoint & Google Slides
Process
Arrow Circle Flow Diagram for PowerPoint & Google Slides
Infographics
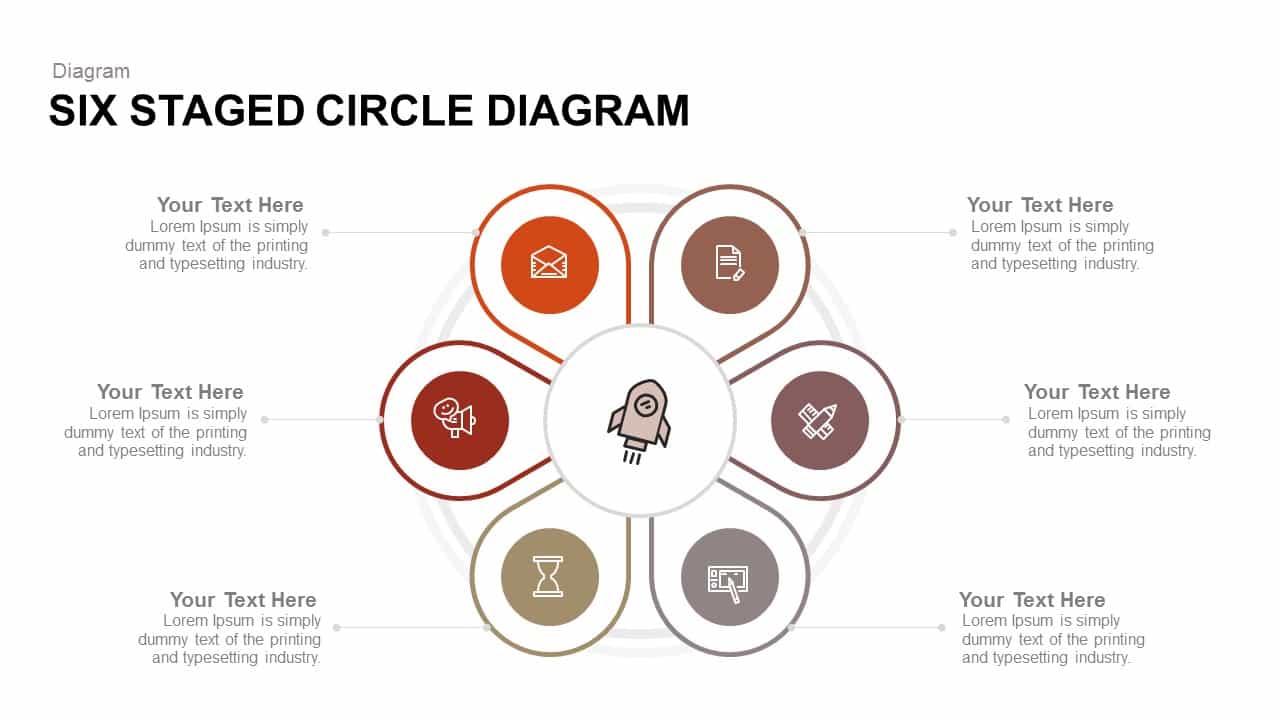
Six Staged Circle Diagram template for PowerPoint & Google Slides
Circular
Five-Point Circle Timeline Diagram Template for PowerPoint & Google Slides
Timeline
Six-Stage Circle Process Diagram Template for PowerPoint & Google Slides
Process
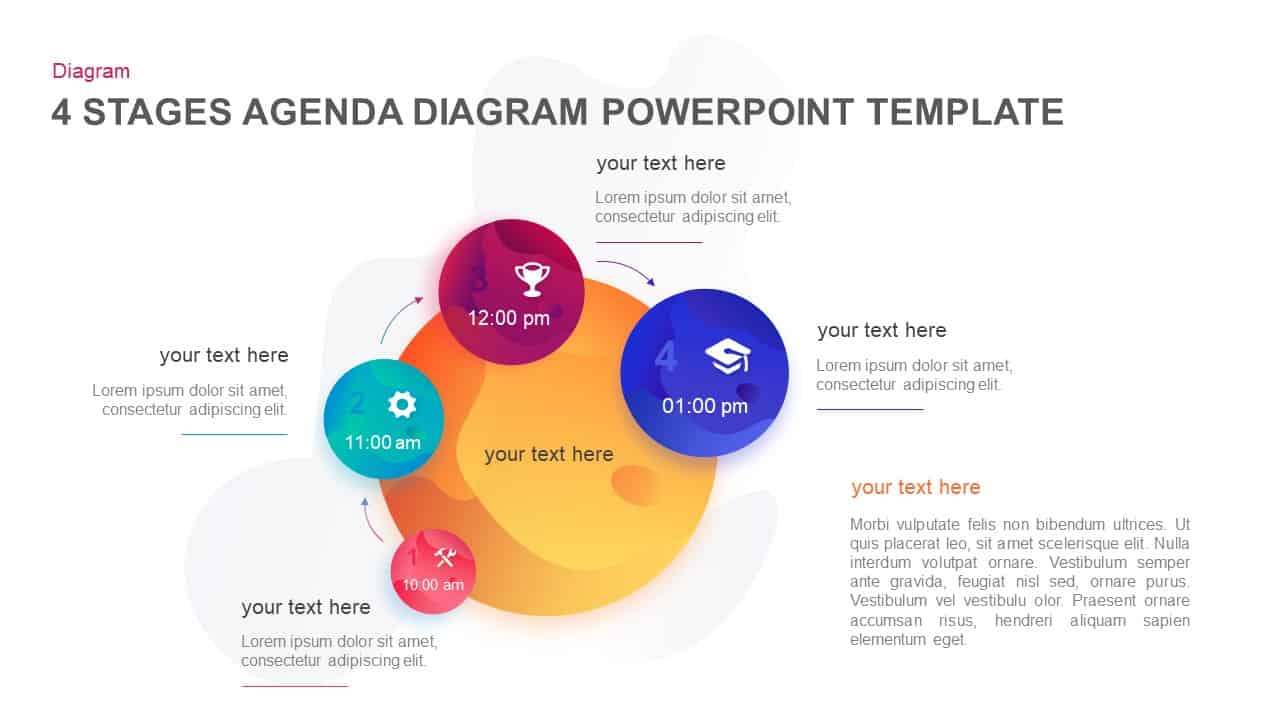
Four-Stage Agenda Circle Diagram Slide Template for PowerPoint & Google Slides
Agenda
Creative Three-Circle Venn Diagram Template for PowerPoint & Google Slides
Comparison
Six-Circle Process Infographic Diagram Template for PowerPoint & Google Slides
Circular
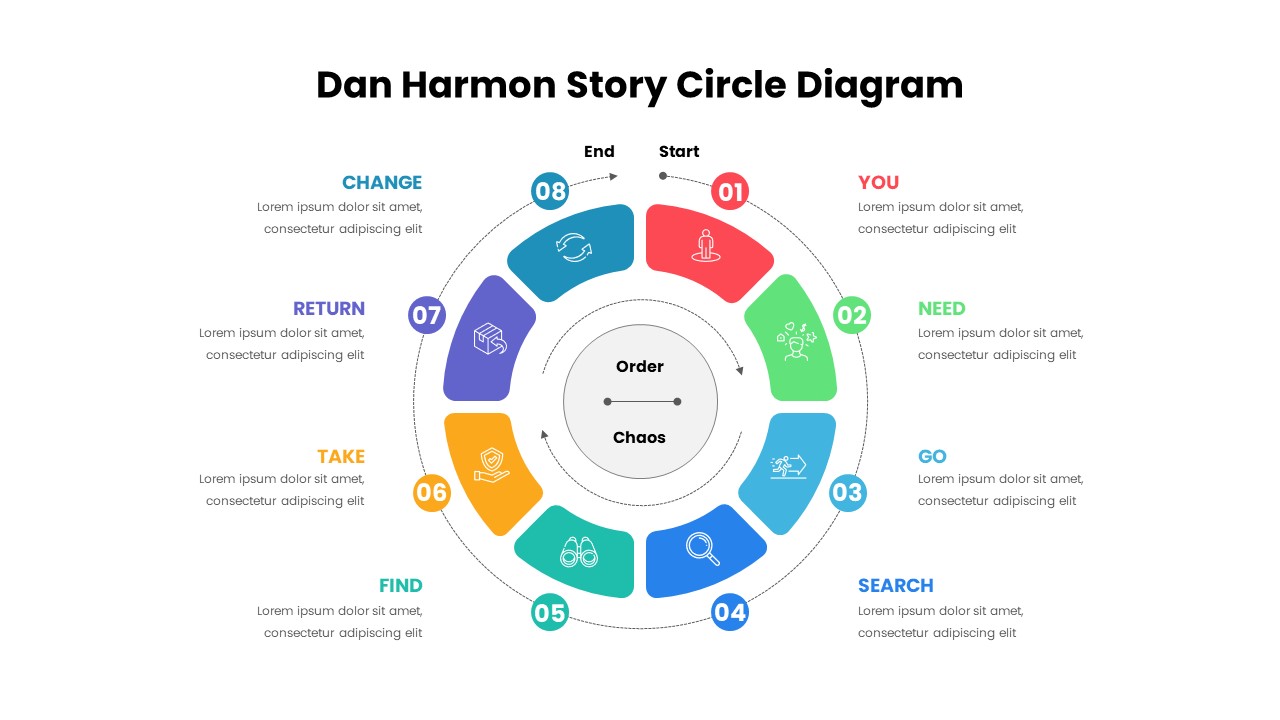
Dan Harmon Story Circle Diagram Template for PowerPoint & Google Slides
Circular
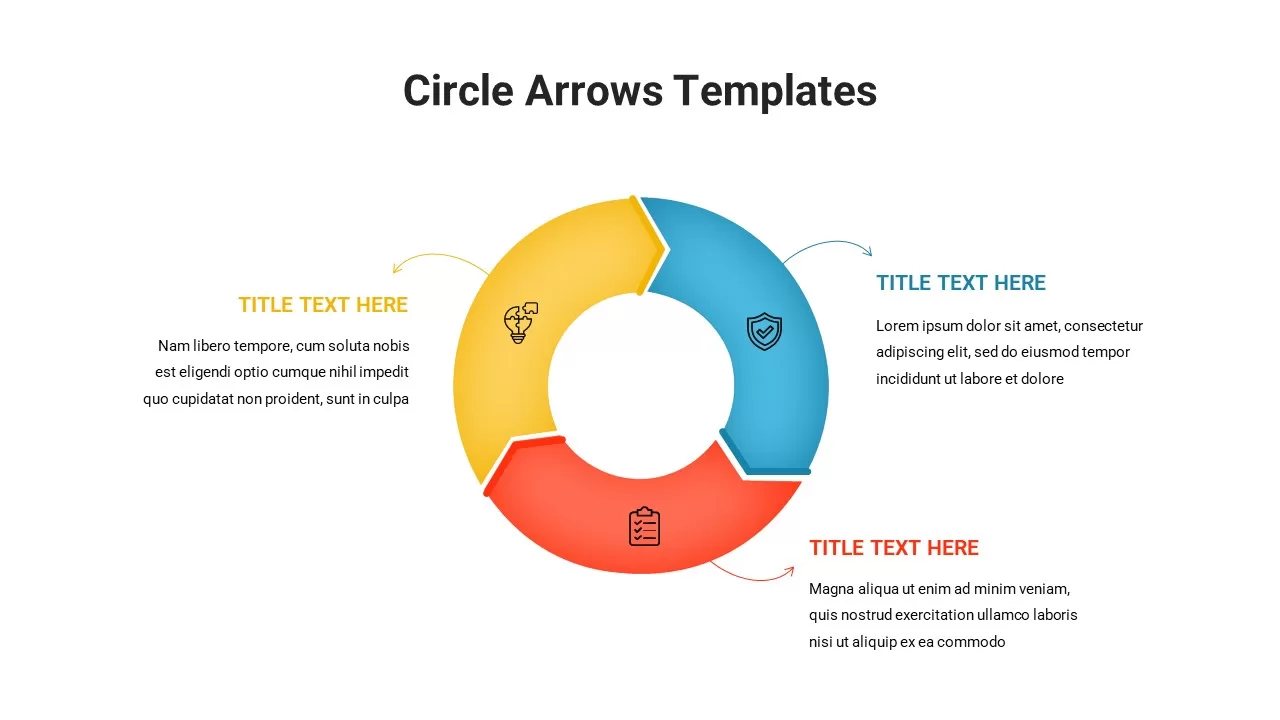
Circle Arrows Diagram template for PowerPoint & Google Slides
Process
Five Circle Venn Diagram for Template for PowerPoint & Google Slides
Circular
8 Circle Venn Diagram Infographic Design Template for PowerPoint & Google Slides
Circular
Professional 6 Circle Venn Diagram Template for PowerPoint & Google Slides
Circular
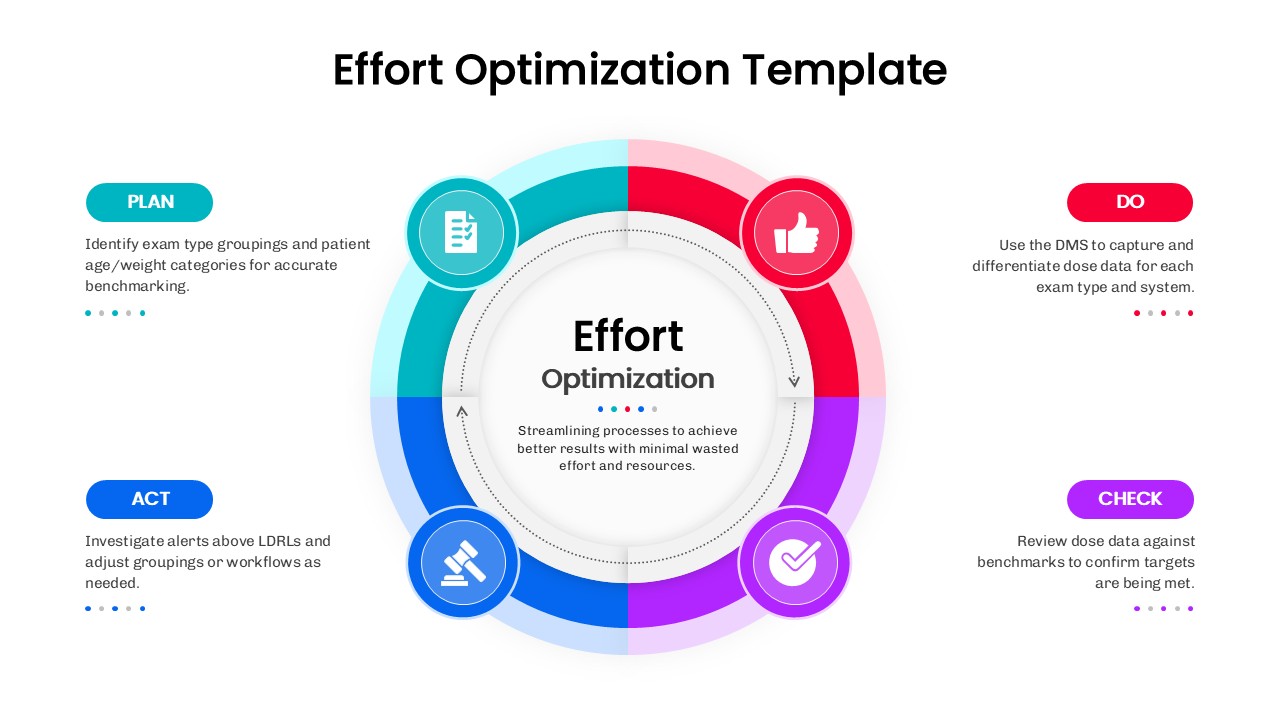
Effort Optimization PDCA Circle Diagram Template for PowerPoint & Google Slides
Circular
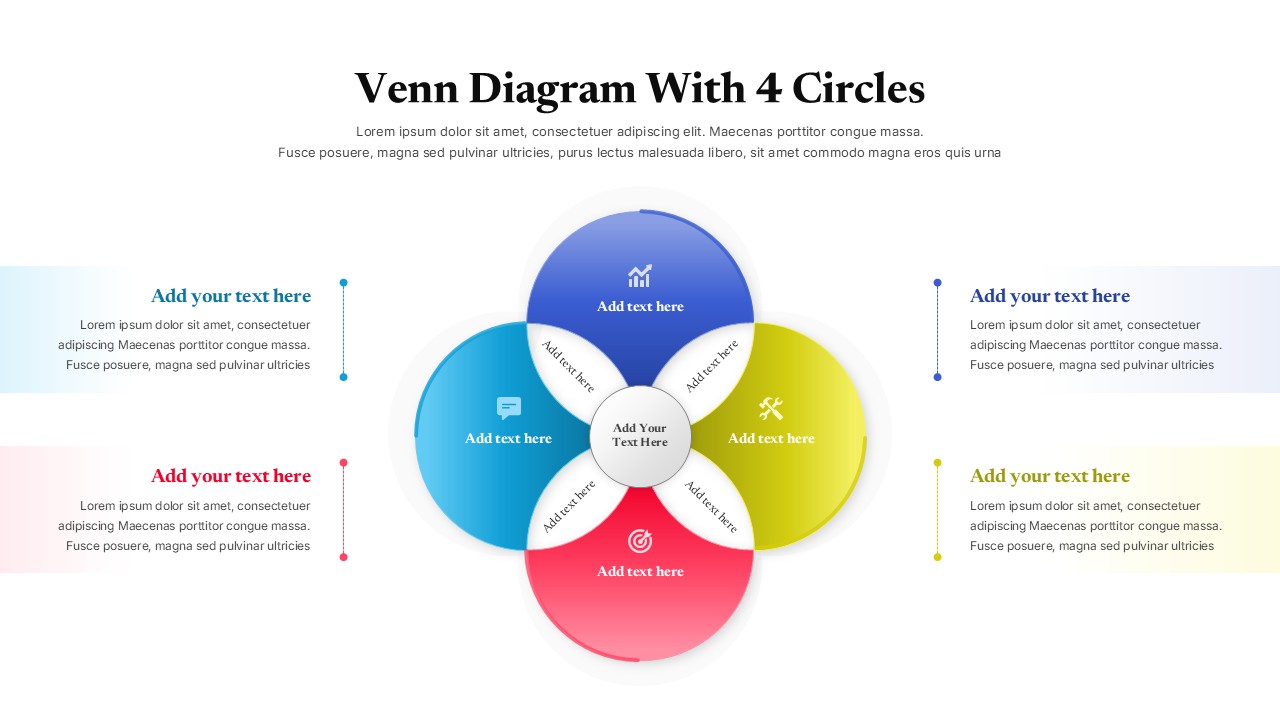
Colorful Venn Diagram with 4 Circle for PowerPoint & Google Slides
Circular
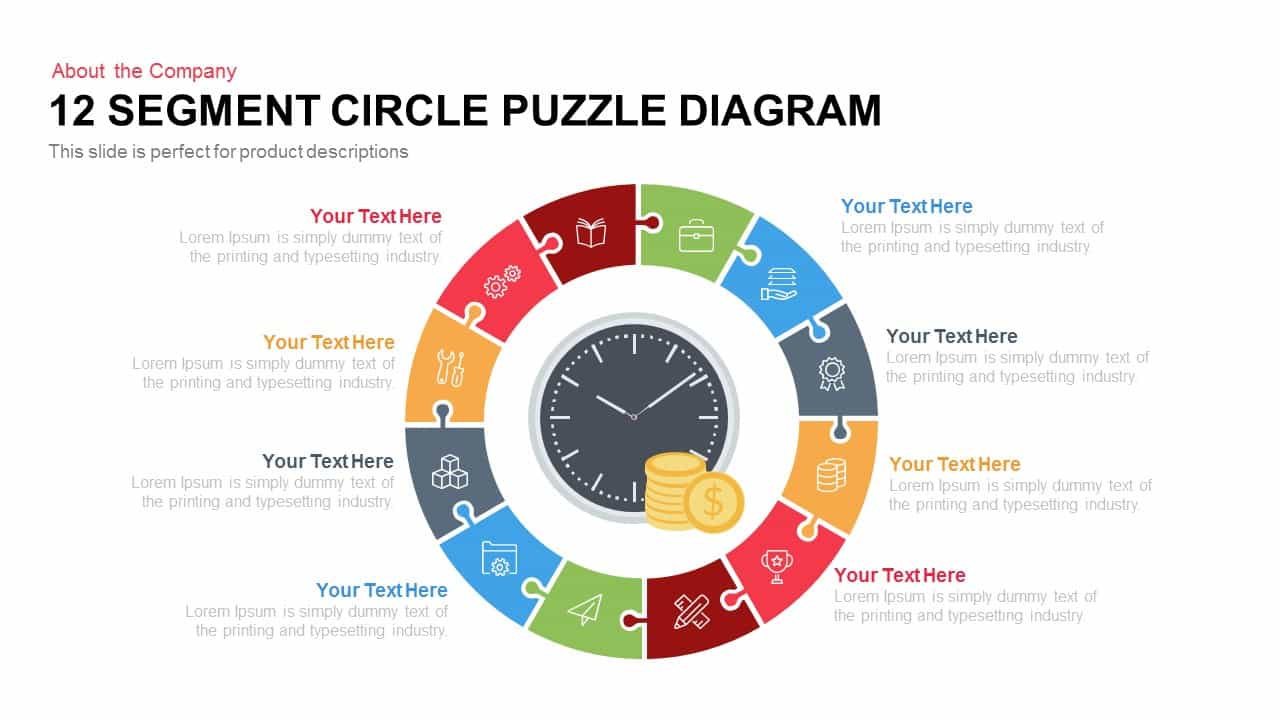
12 Segment Circle Puzzle Diagram Template for PowerPoint and Keynote
Circular
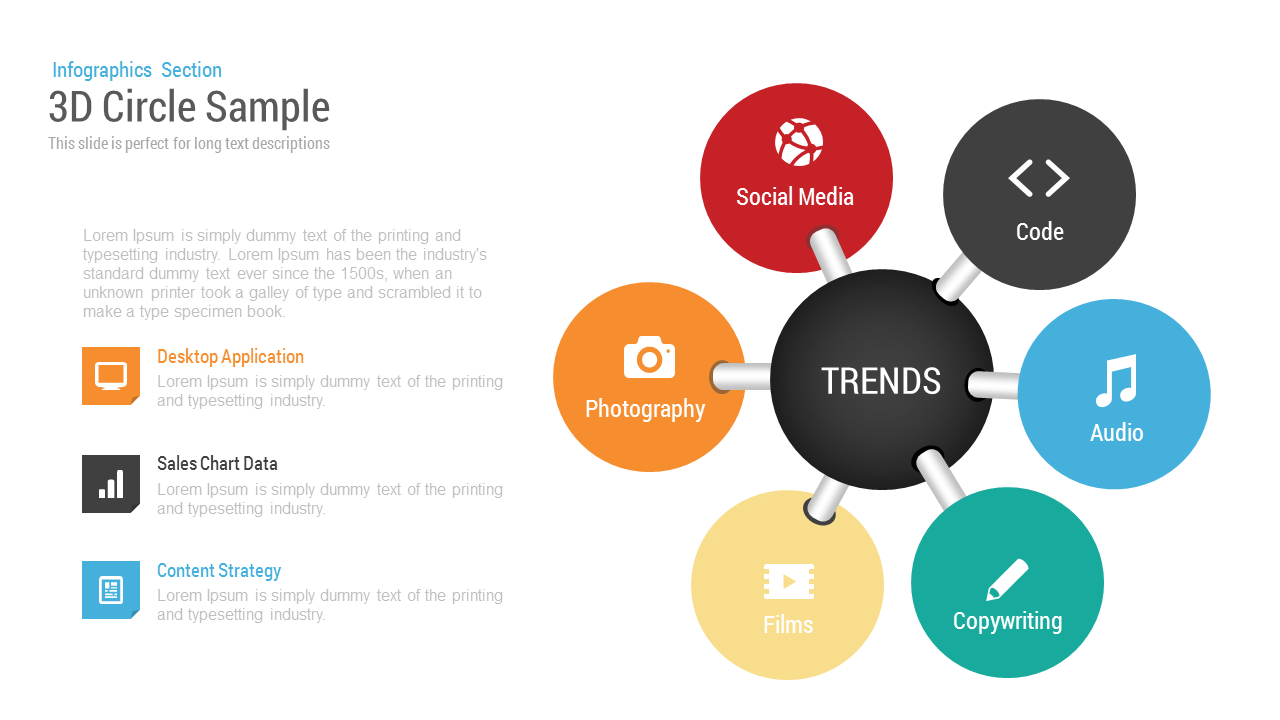
3D Circle Sample template for PowerPoint & Google Slides
Circular
Circle Strategy Creative Chart template for PowerPoint & Google Slides
Business Strategy
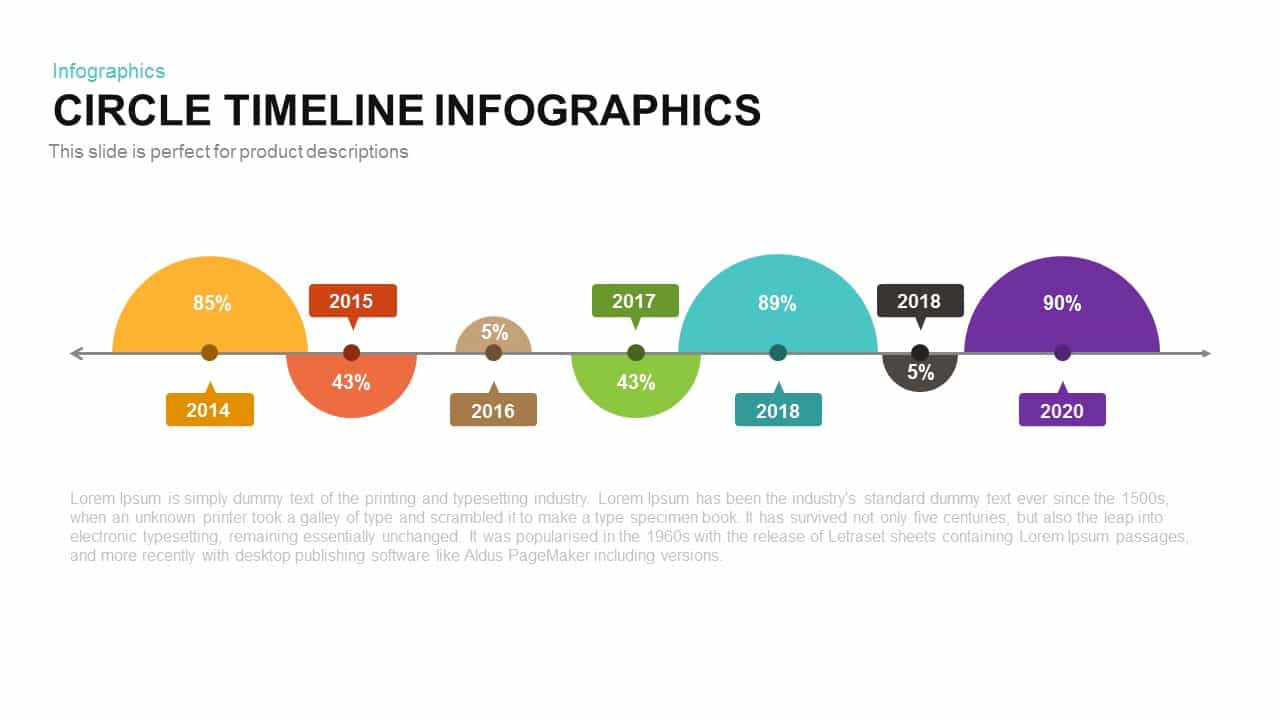
Circle Timeline Infographics template for PowerPoint & Google Slides
Timeline
Circle Chart Data template for PowerPoint & Google Slides
Pie/Donut
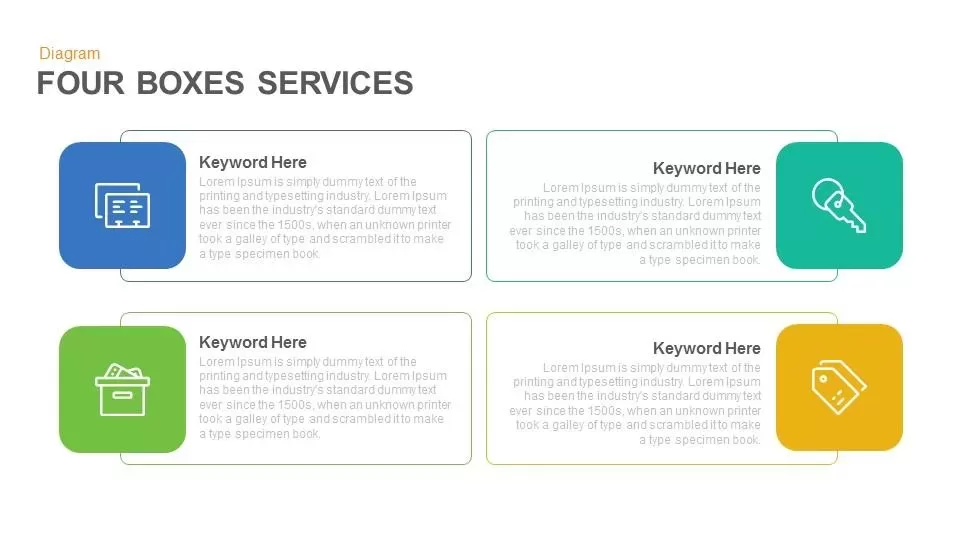
Four Circle Service template for PowerPoint & Google Slides
Process
Circle Abstract Shape Infographics Template for PowerPoint & Google Slides
Circular
Circle Segment Sales Metrics Infographic Template for PowerPoint & Google Slides
Circular
Circle Graph Data Visualization Template for PowerPoint & Google Slides
Circular
Four-Circle Business Process Infographic Template for PowerPoint & Google Slides
Circular
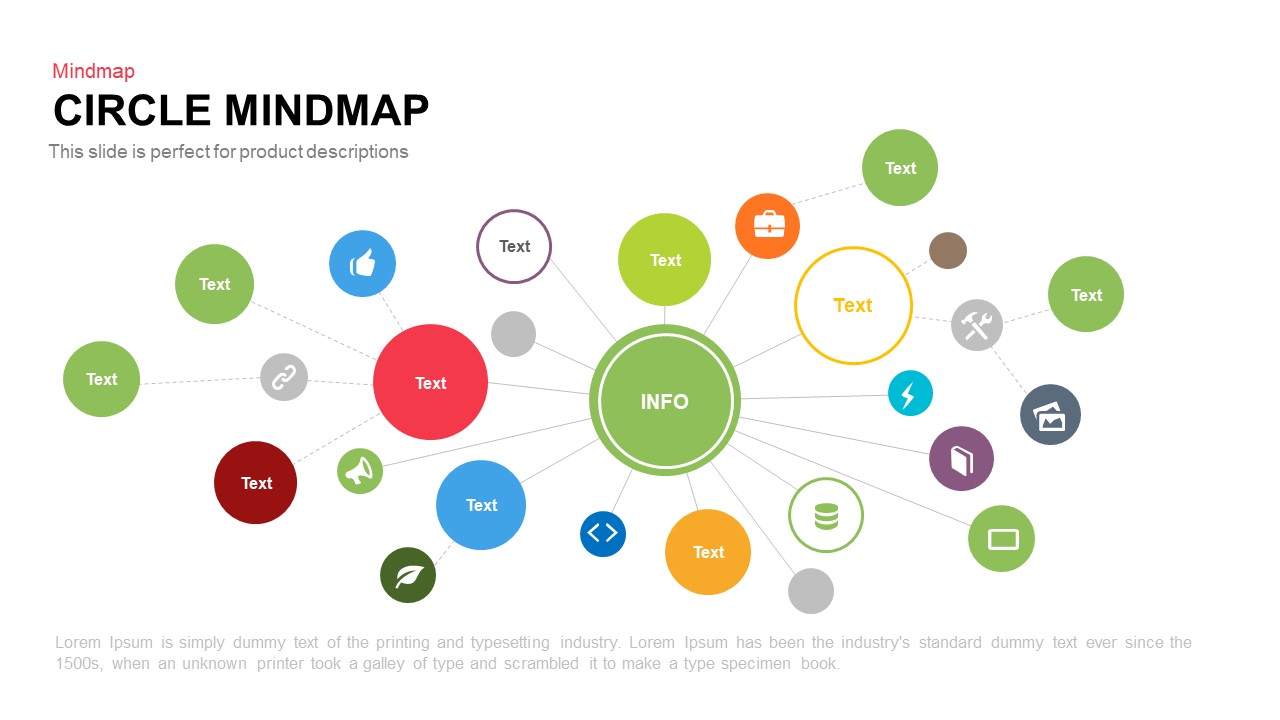
Circle Mindmap template for PowerPoint & Google Slides
Mind Maps
Dynamic Circle Timeline Infographics template for PowerPoint & Google Slides
Timeline
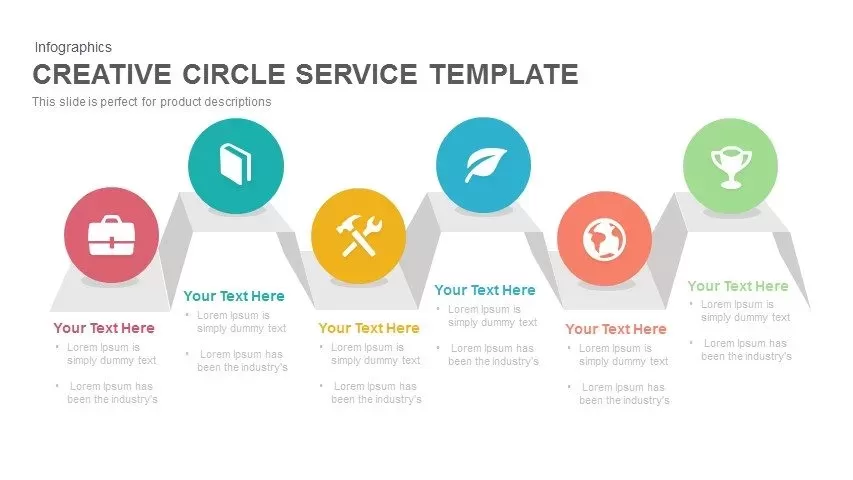
Creative Zigzag Circle Service Steps Template for PowerPoint & Google Slides
Process
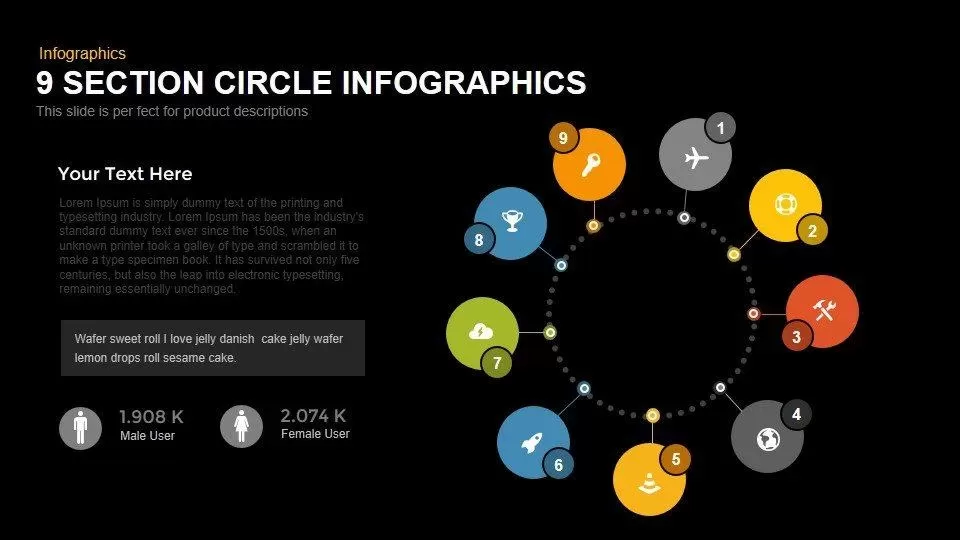
Modern 9-Section Circle Infographics Template for PowerPoint & Google Slides
Circular
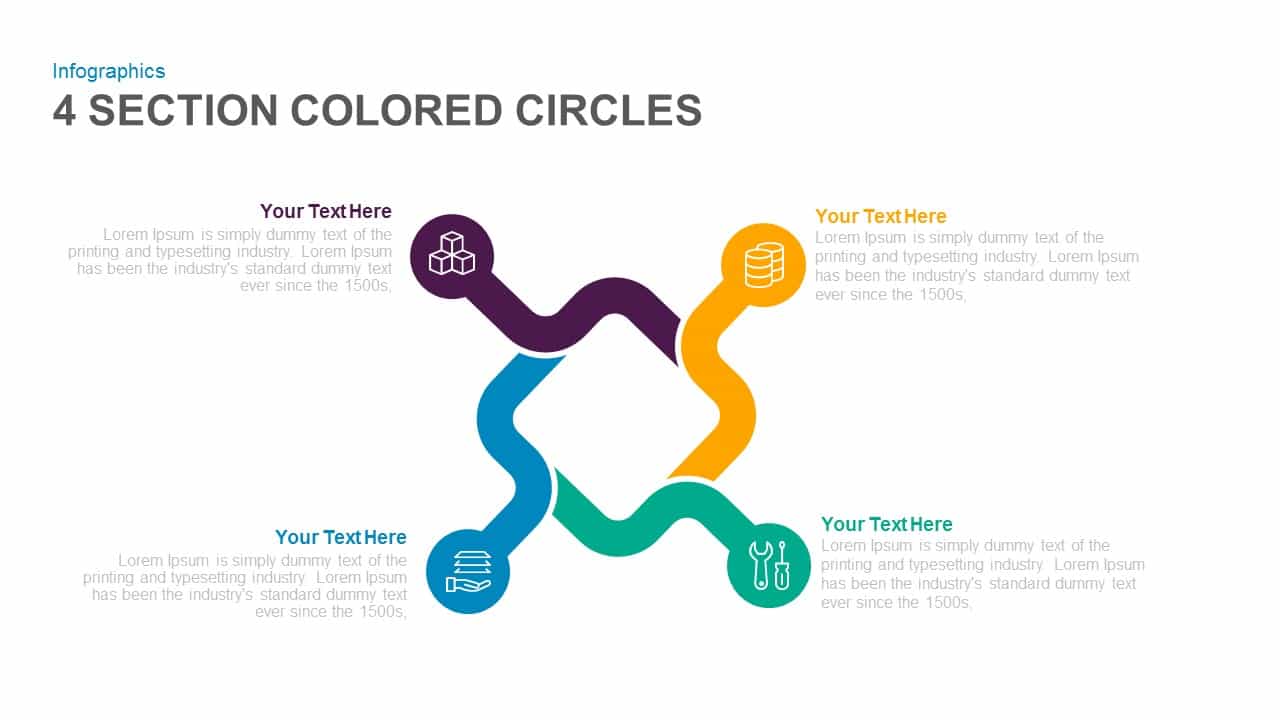
Four-Section Colored Circle Infographic Template for PowerPoint & Google Slides
Circular
Creative Circle Elements for PowerPoint & Google Slides
Infographics
4 Circle Process for PowerPoint & Google Slides
Process

Three-Circle Process Infographic Template for PowerPoint & Google Slides
Circular
Circle Arrows Process Flow template for PowerPoint & Google Slides
Process
Circle Arrow Process Flow template for PowerPoint & Google Slides
Process
Circle Arrow Process Flow template for PowerPoint & Google Slides
Process
Four-Stage Circle Arrow Infographic Template for PowerPoint & Google Slides
Circular
Four-Stage Circle Arrow Infographic Template for PowerPoint & Google Slides
Circular
Free Graduation Photo Collage Circle Slide Template for PowerPoint & Google Slides
Decks
Free

Blue Circle Mobile Apps Presentation Template for PowerPoint & Google Slides
Information Technology
Modern Semi Circle Infographic Template for PowerPoint & Google Slides
Circular
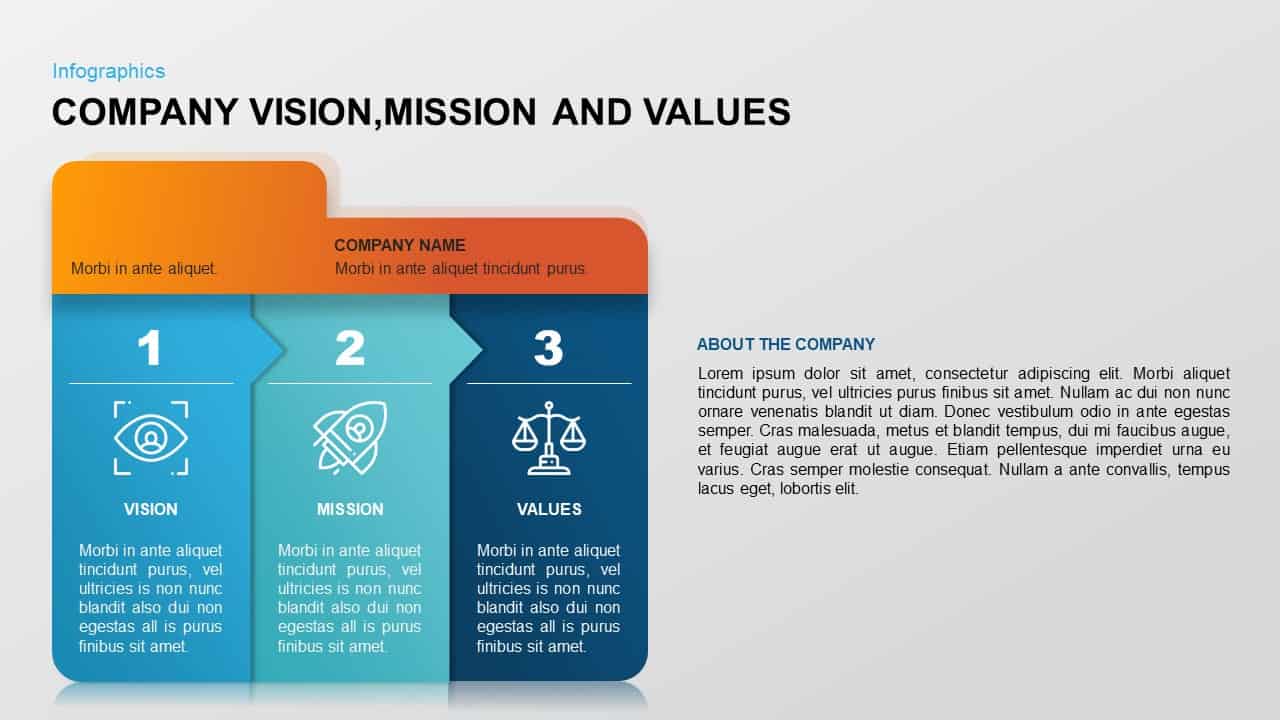
Company Vision, Mission & Values Diagram Template for PowerPoint & Google Slides
Vision and Mission

Free Company Profile template for PowerPoint & Google Slides
Company Profile
Free
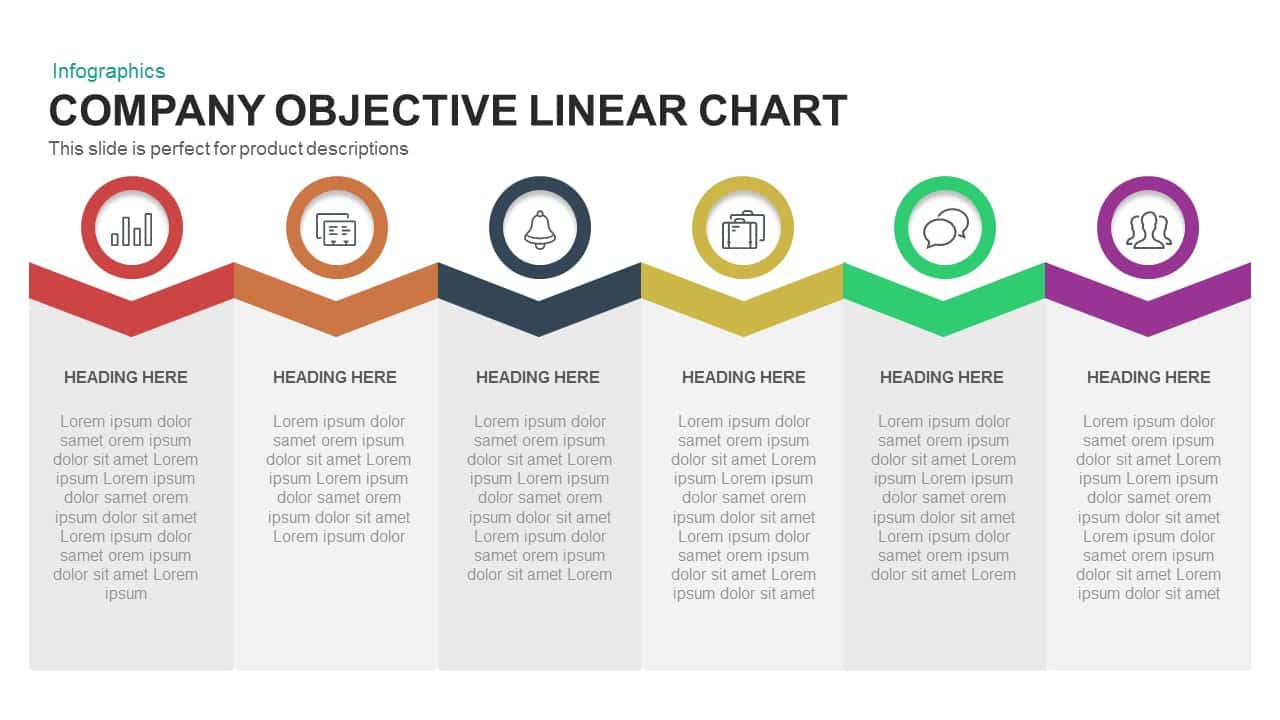
Company Objective Linear Chart Template for PowerPoint & Google Slides
Flow Charts
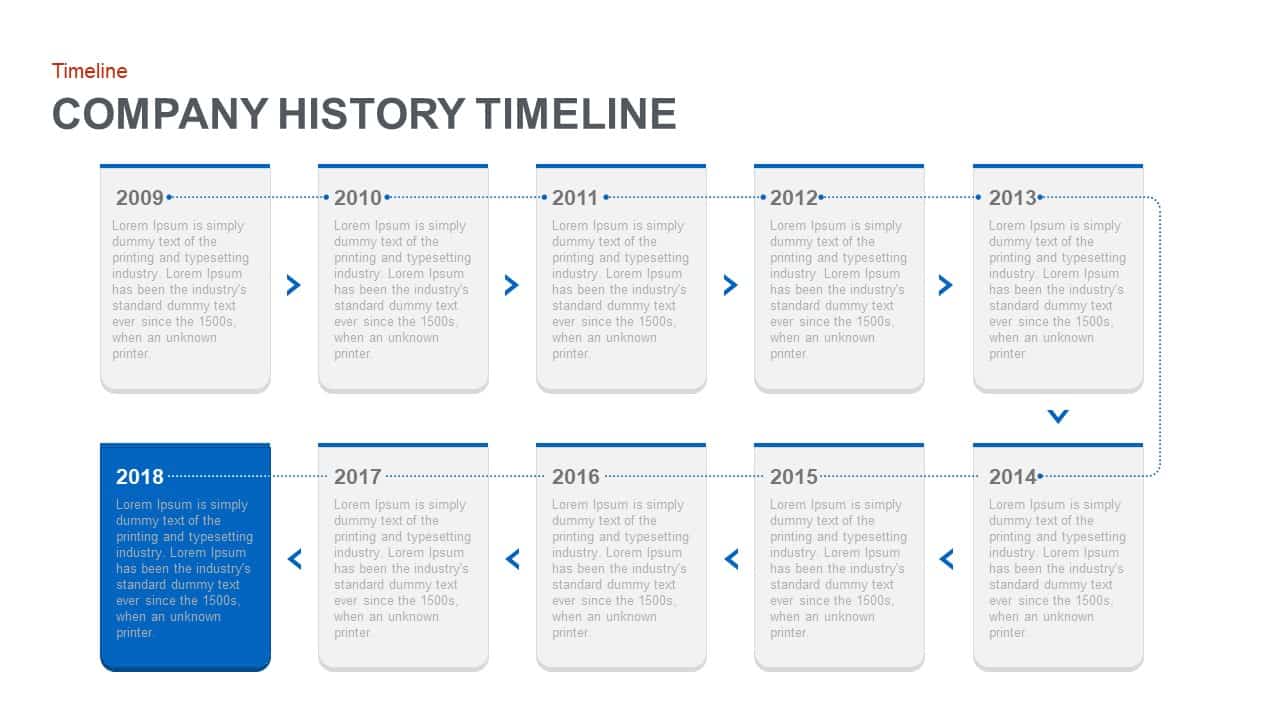
Company History Timeline Roadmap Template for PowerPoint & Google Slides
Timeline
Company Profile Pitch Deck Design Template for PowerPoint & Google Slides
Company Profile
Medical Company Profile Slide Deck Template for PowerPoint & Google Slides
Company Profile
Free Helooo Creative Company Profile Template for PowerPoint & Google Slides
Company Profile
Free
Business Company Profile Template for PowerPoint & Google Slides
Company Profile
Free App Development Company Profile template for PowerPoint & Google Slides
Company Profile
Free
Free Real Estate Company Profile Template for PowerPoint & Google Slides
Company Profile
Free
Pink White Theme Company Profile template for PowerPoint & Google Slides
Company Profile
About Us Company Profile Template for PowerPoint & Google Slides
Marketing
Cyber Security Company Profile Presentation for PowerPoint & Google Slides
Business Proposal
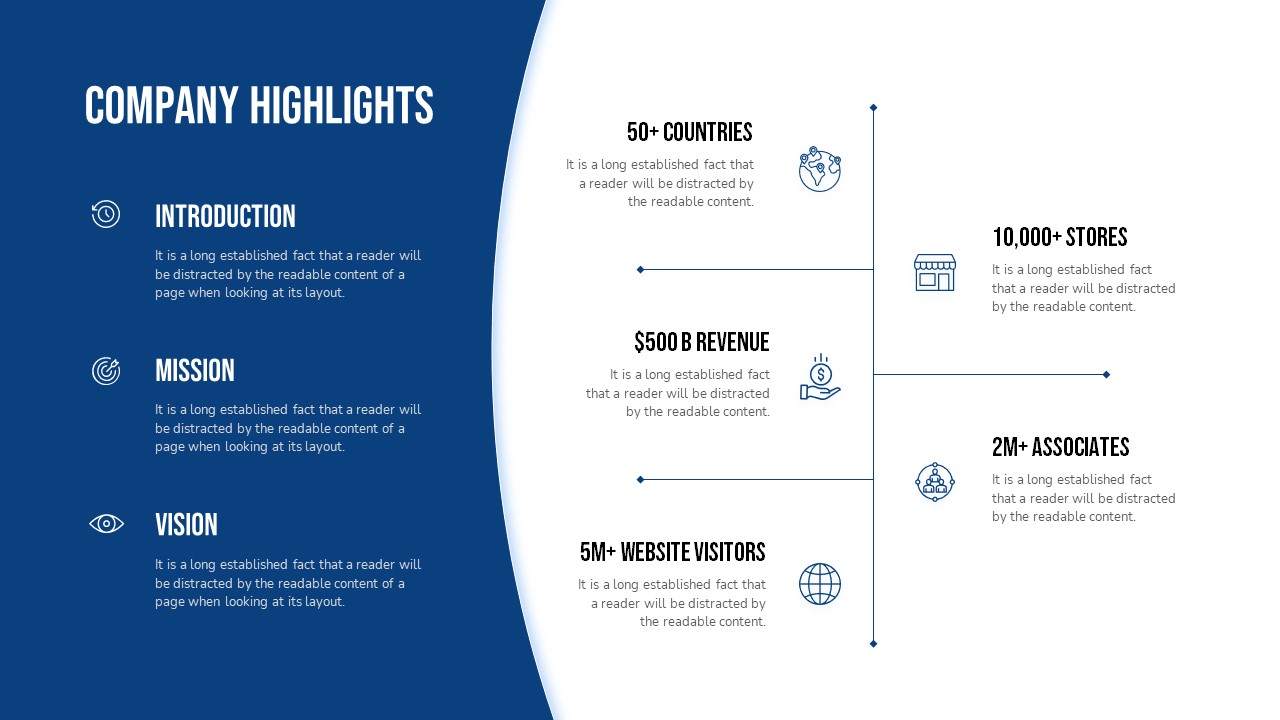
Company Highlights Profile Presentation Template for PowerPoint & Google Slides
Business
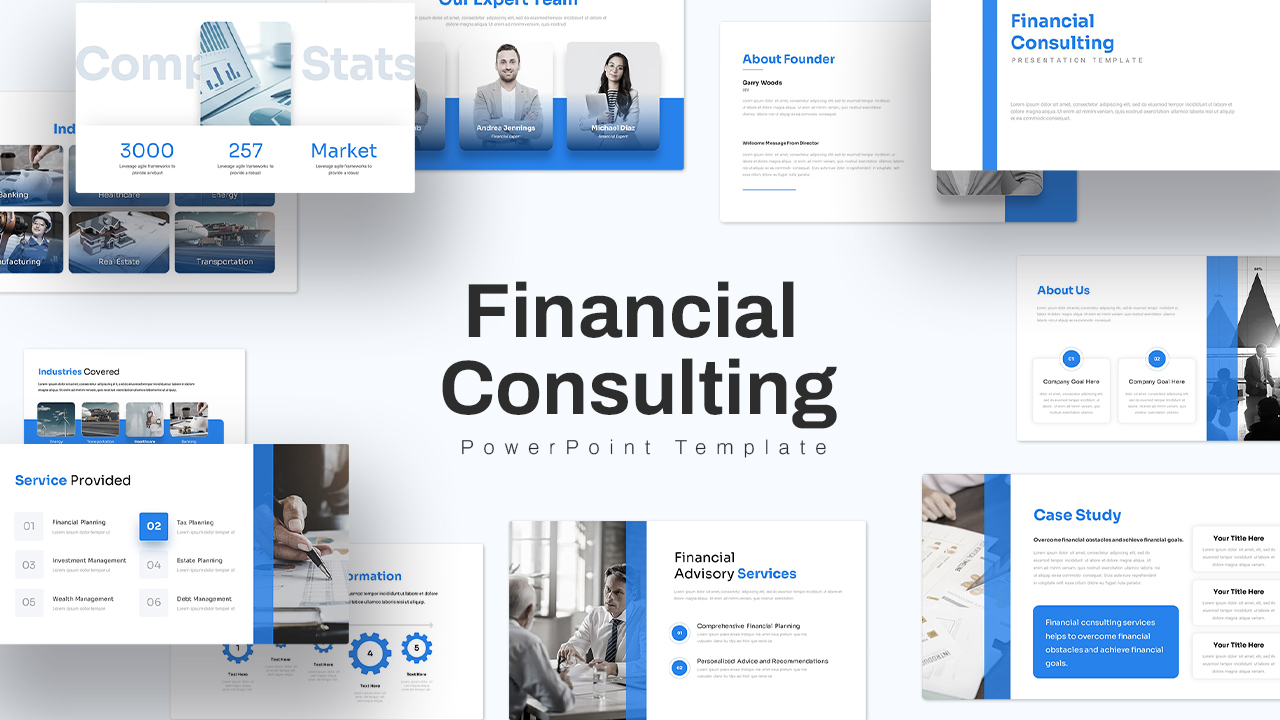
Financial Consulting Company Profile Template for PowerPoint & Google Slides
Finance
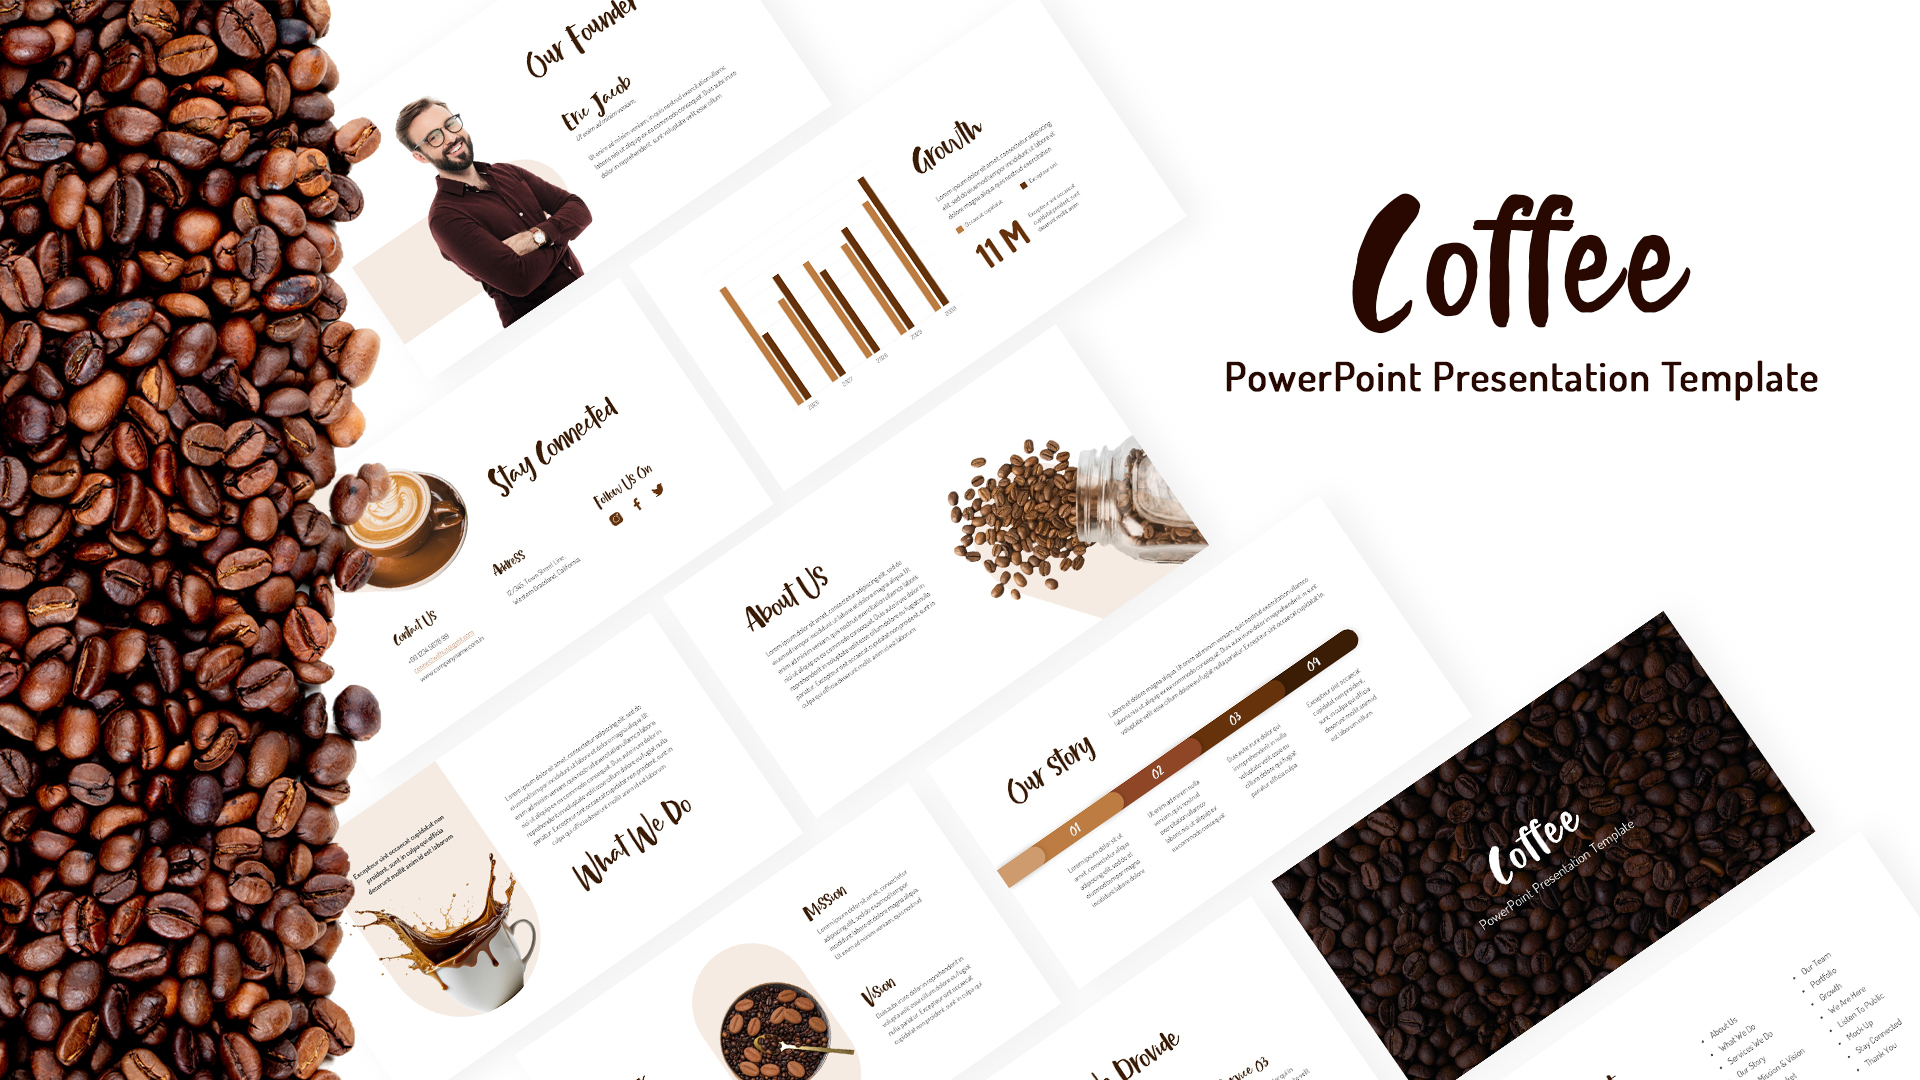
Free Coffee Company Profile Presentation Template for PowerPoint & Google Slides
Company Profile
Free
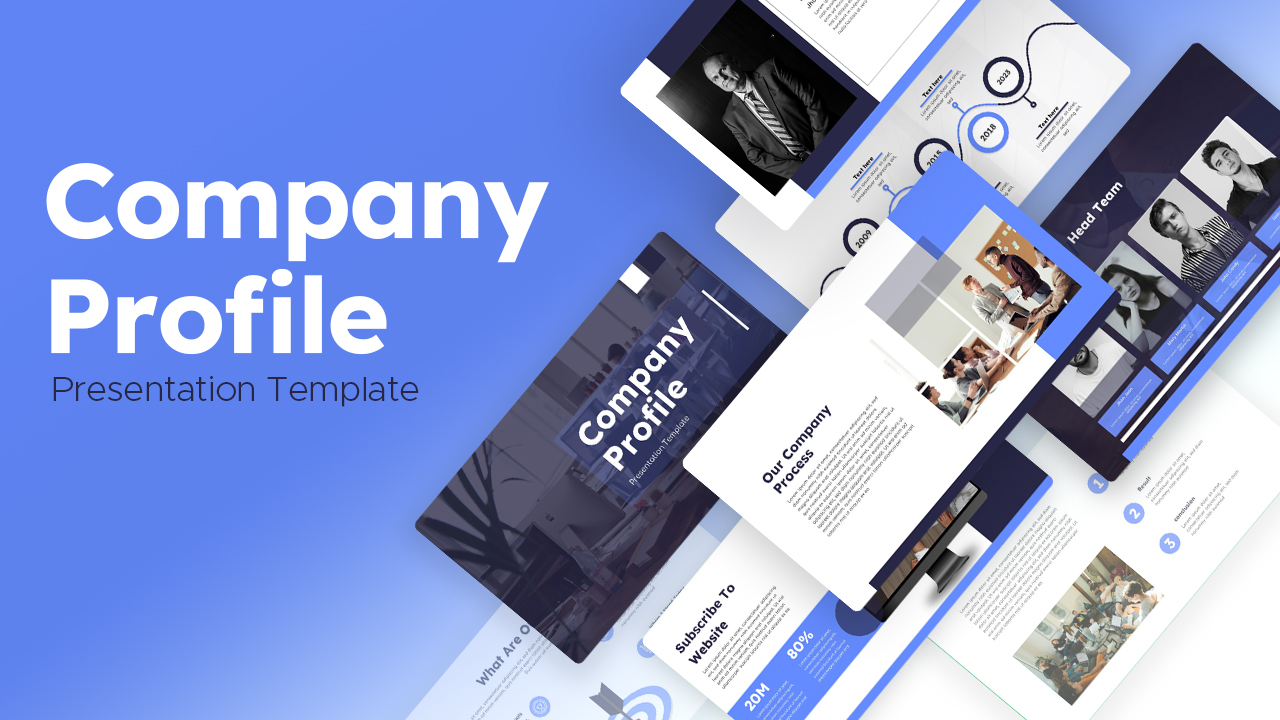
Free Modern Blue Company Profile Deck Template for PowerPoint & Google Slides
Company Profile
Free
Free Dark Coffee Shop Company Profile Template for PowerPoint & Google Slides
Company Profile
Free
Company Anniversary Celebration Deck Template for PowerPoint & Google Slides
Company Profile
Hospital Company Profile Presentation Template for PowerPoint & Google Slides
Decks
Finance Company Template for PowerPoint & Google Slides
Finance
Training Consulting Company Profile Template for PowerPoint & Google Slides
Company Profile