Performance Dashboards Overview Template for PowerPoint & Google Slides
Description
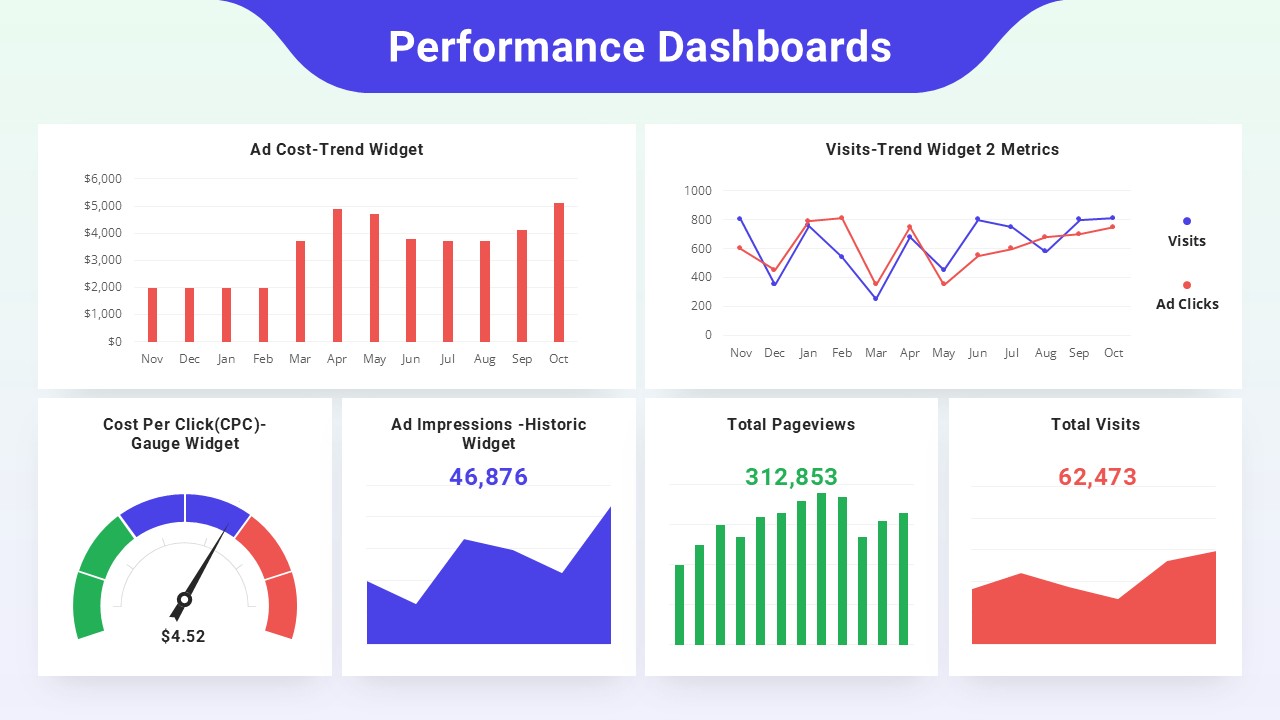
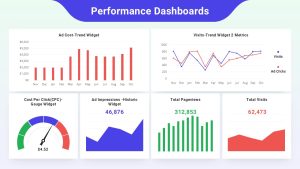
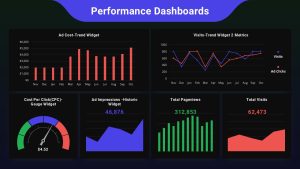
Leverage this comprehensive Performance Dashboards slide to deliver a unified view of critical marketing and web analytics metrics in any presentation. The design spans two rows of configurable widgets: the top row houses an Ad Cost Trend Bar Chart tracing monthly spend from November to October, alongside a Visits vs. Ad Clicks dual-line chart that highlights traffic fluctuations and campaign response over the same period. Below, four KPI panels provide at-a-glance insights: a Cost Per Click (CPC) gauge widget with color-coded performance zones; an Ad Impressions historic area chart coupled with a bold numeric display; a vertical bar chart summarizing Total Pageviews; and an area chart for Total Visits complete with a prominent data label.
Each widget occupies a dedicated container with subtle drop shadows and rounded corners, ensuring visual separation and clarity. The multi-hued chart palette leverages red for cost, blue for impressions and visits, and green for pageviews—ideal for aligning with brand guidelines or colorblind-friendly schemes. Built on editable master slides with intuitive placeholders, you can swap icons, adjust color scales, update data labels, and resize or rearrange widgets in seconds without compromising layout integrity or cross-platform compatibility.
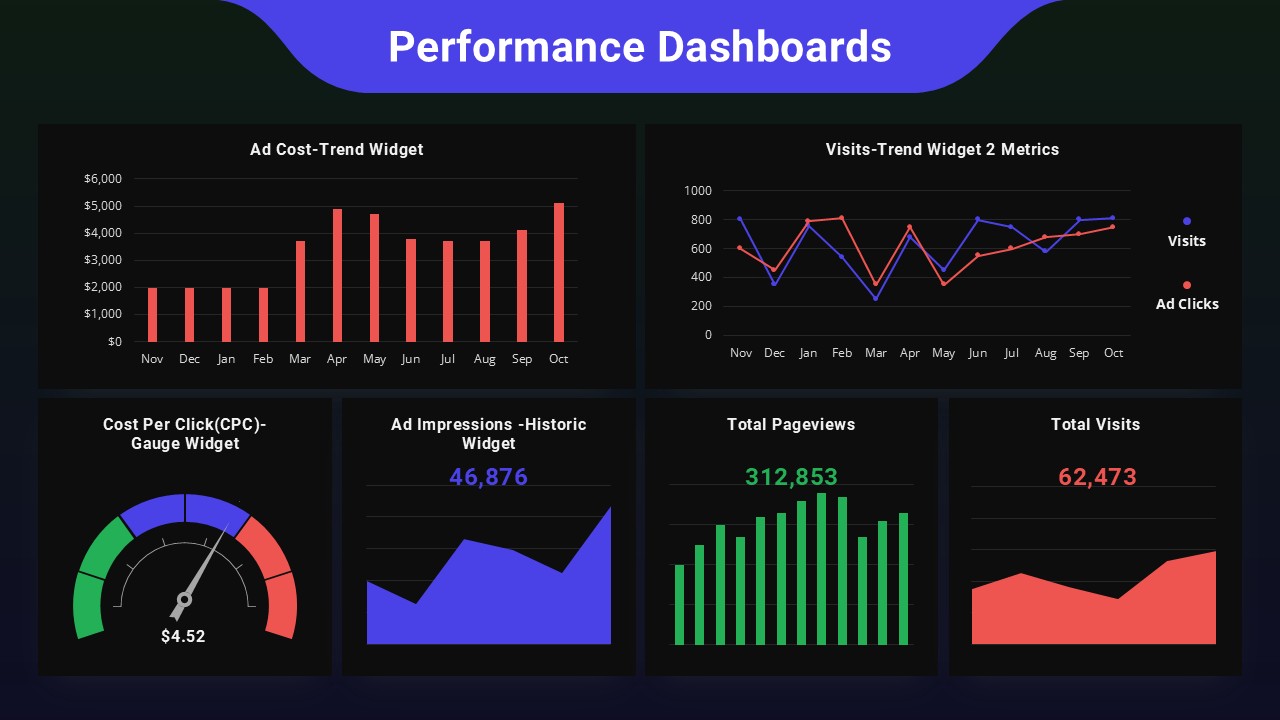
Optimized for PowerPoint and Google Slides on both light and dark background variants, this performance dashboard template preserves pixel-perfect alignment and resolution across devices, eliminating version-control headaches. Whether instructing marketing teams, briefing executive leadership, or training analytics students, this slide enables data-driven storytelling with maximum impact. Its modular structure also supports expansion: duplicate panels to add conversion, bounce rate or revenue widgets, or repurpose the layout for sales dashboards, financial KPIs or operational scorecards. With this slide in your toolkit, you can transform raw data into clear, actionable insights.
Who is it for
Marketing managers, digital analysts, performance marketing teams and data-driven executives will find this dashboard invaluable when reporting campaign spend, website traffic and engagement metrics. Analytics consultants, business intelligence professionals and training facilitators can also leverage it to align stakeholders on KPIs and process data-driven discussions.
Other Uses
Beyond digital marketing metrics, repurpose this template for sales pipelines, financial reporting, HR dashboards or operational scorecards. Simply relabel panels, swap icons and update color zones to map any multi-metric overview or executive summary.
Login to download this file

Item ID
SB05061
Related Templates

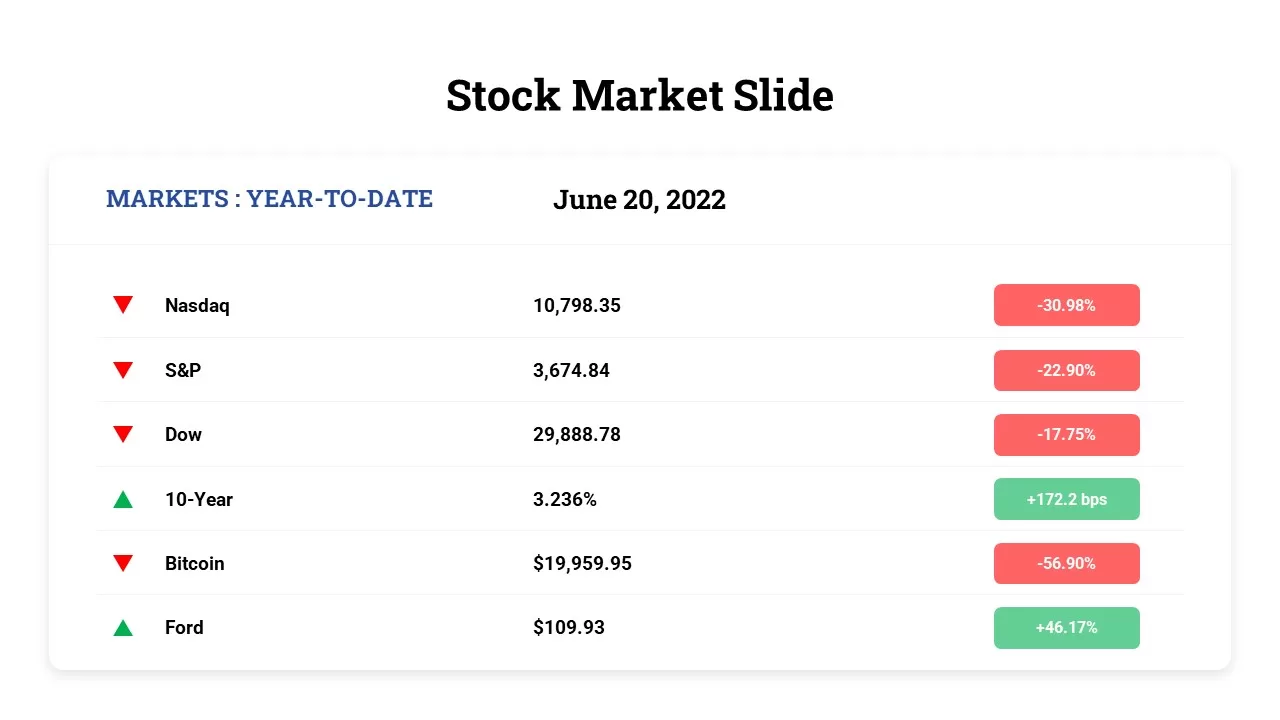
Free Stock Market Performance Overview template for PowerPoint & Google Slides
Finance
Free
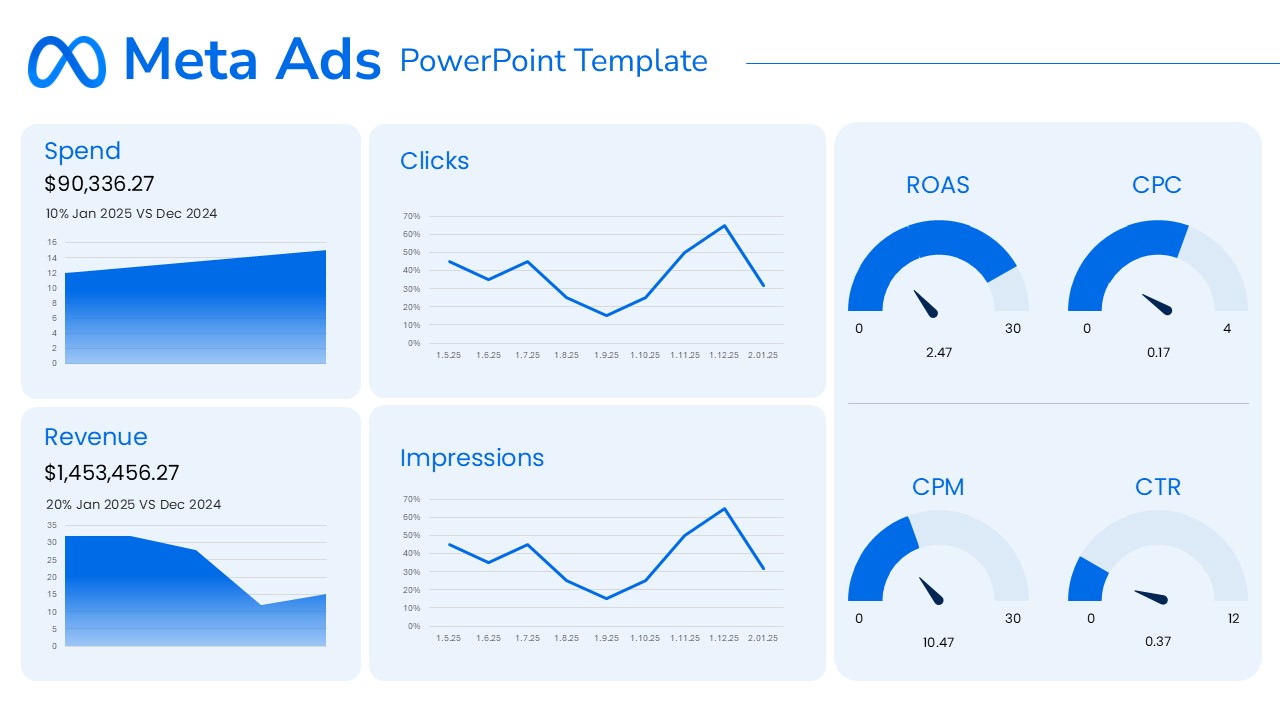
Meta Ads Performance Overview template for PowerPoint & Google Slides
Advertising
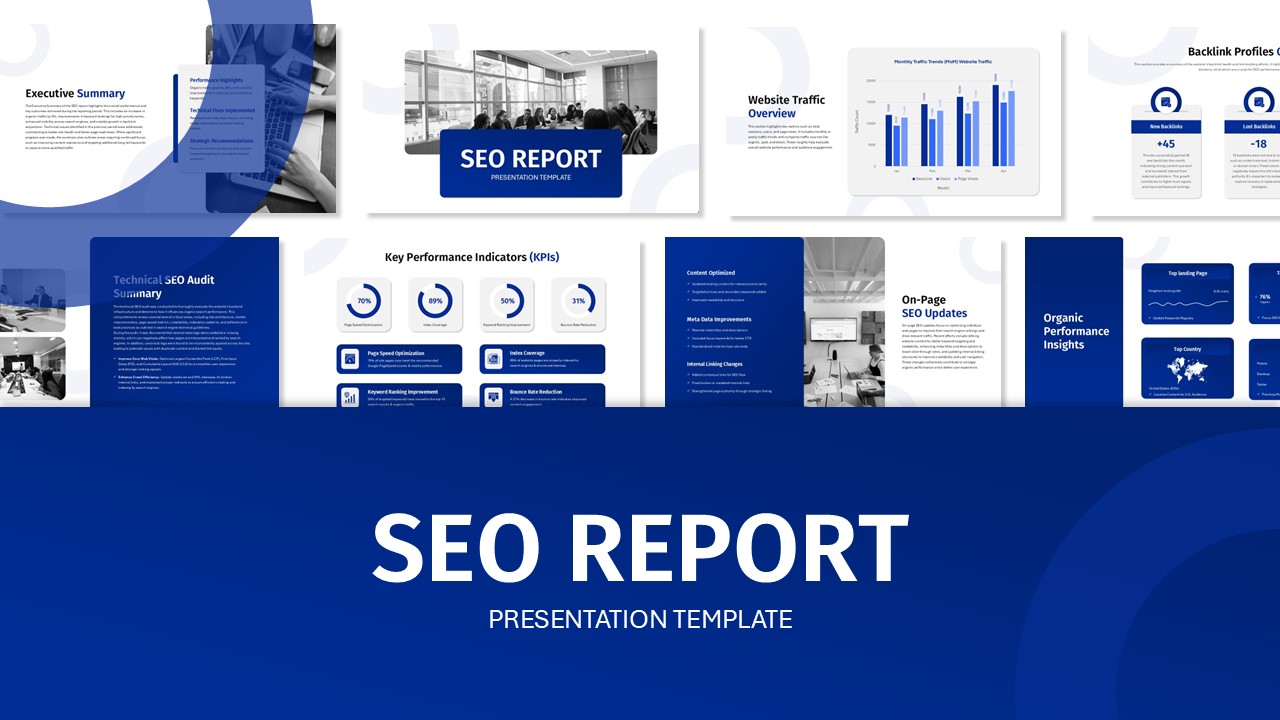
SEO Performance Report Overview template for PowerPoint & Google Slides
Digital Marketing
Google Ads Optimization & Performance Infographic Template for PowerPoint & Google Slides
Digital Marketing
Profit Performance Trend Chart Template for PowerPoint & Google Slides
Finance
Sales vs Budget Performance Chart Template for PowerPoint & Google Slides
Bar/Column

Website Performance Dashboard template for PowerPoint & Google Slides
Charts
Sales Performance Dashboard template for PowerPoint & Google Slides
Business Report
Performance Review Process Management Cycle template for PowerPoint & Google Slides
Employee Performance
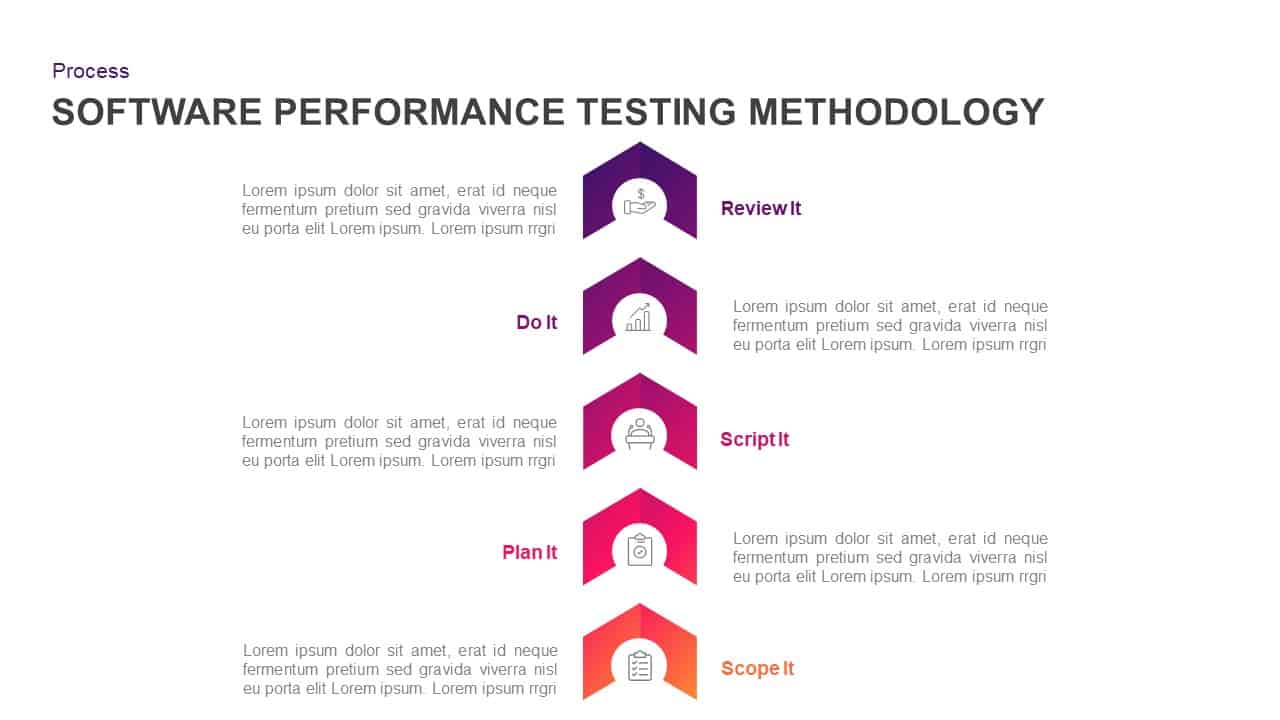
Software Performance Testing Methodology Template for PowerPoint & Google Slides
Process
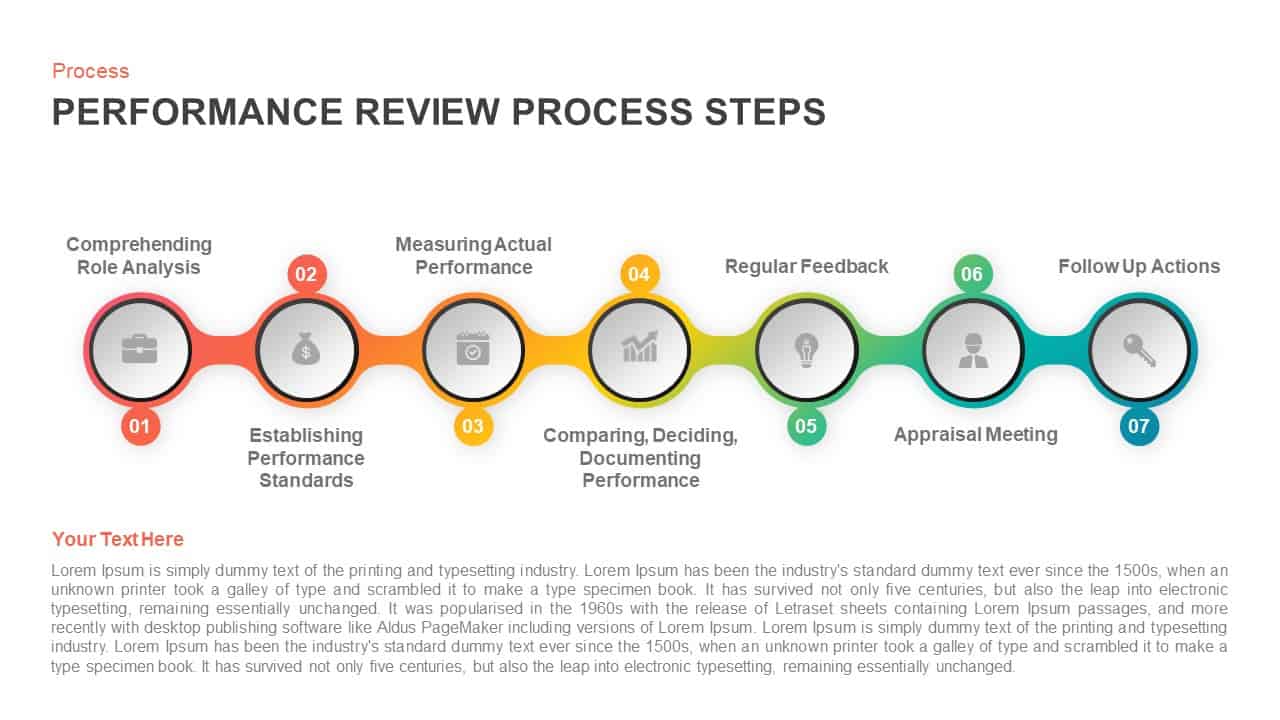
Performance Review Process Steps Template for PowerPoint & Google Slides
Employee Performance
Social Media Performance Dashboard Template for PowerPoint & Google Slides
Bar/Column
Professional Sales Performance Report Template for PowerPoint & Google Slides
Business Report
Performance Review Progress Management Template for PowerPoint & Google Slides
Process
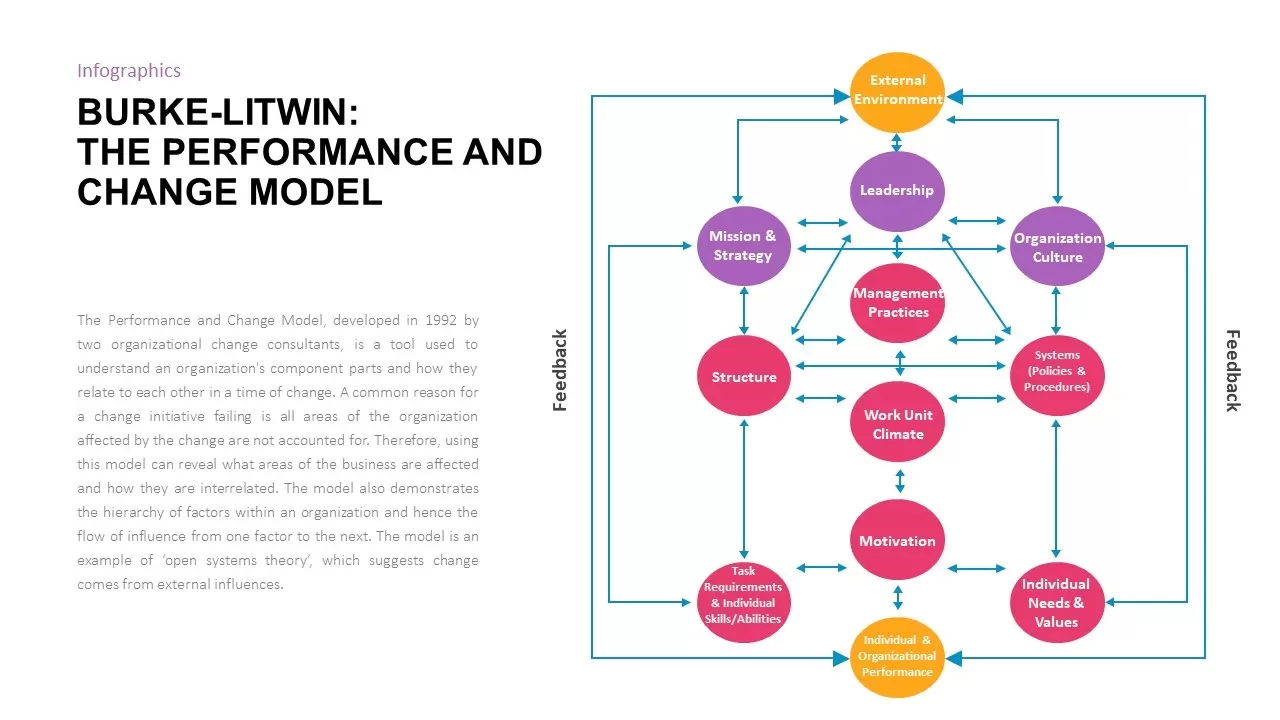
Burke-Litwin Performance and Change Model template for PowerPoint & Google Slides
Infographics
Corporate Performance Management Template for PowerPoint & Google Slides
Pitch Deck
Performance KPI Dashboard Slide Template for PowerPoint & Google Slides
Business Report
9-Box Matrix for Performance & Potential Template for PowerPoint & Google Slides
Employee Performance
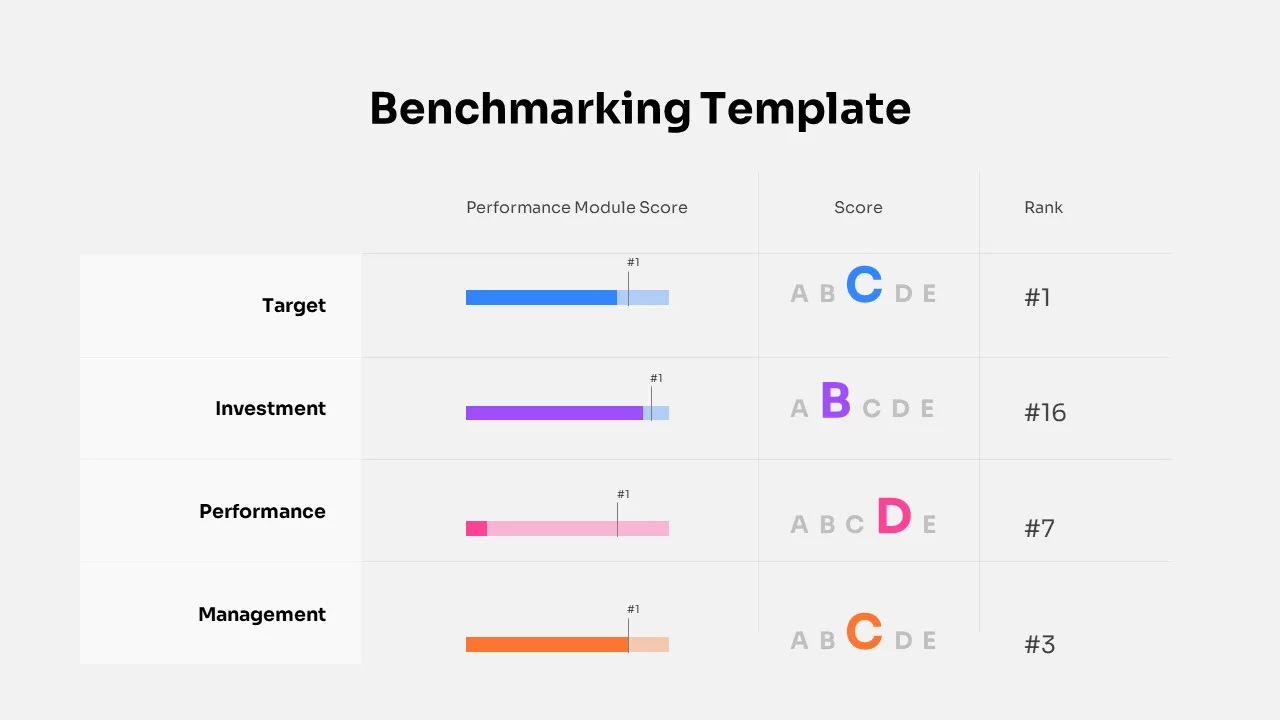
Benchmarking Performance Score Template for PowerPoint & Google Slides
Comparison Chart
Website Performance Monitoring Dashboard Template for PowerPoint & Google Slides
Business Report
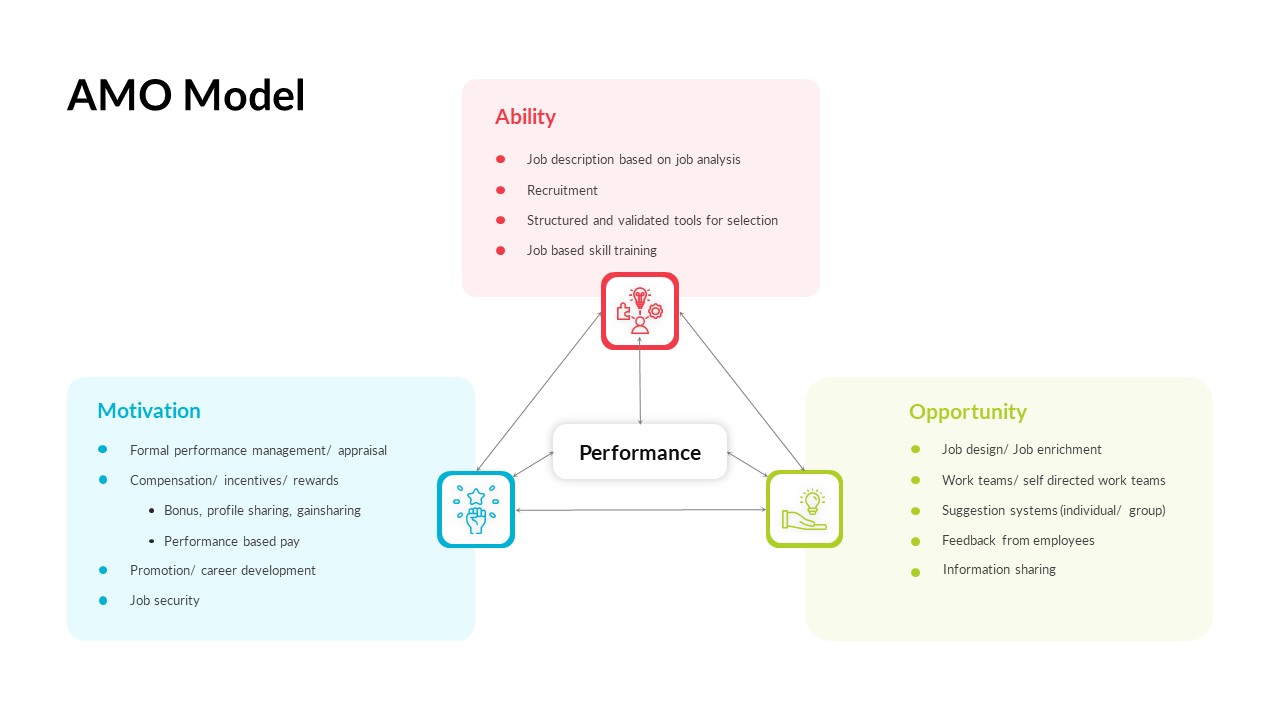
AMO Performance Model Feedback Diagram Template for PowerPoint & Google Slides
Employee Performance
Hits and Misses Performance Comparison Template for PowerPoint & Google Slides
Comparison
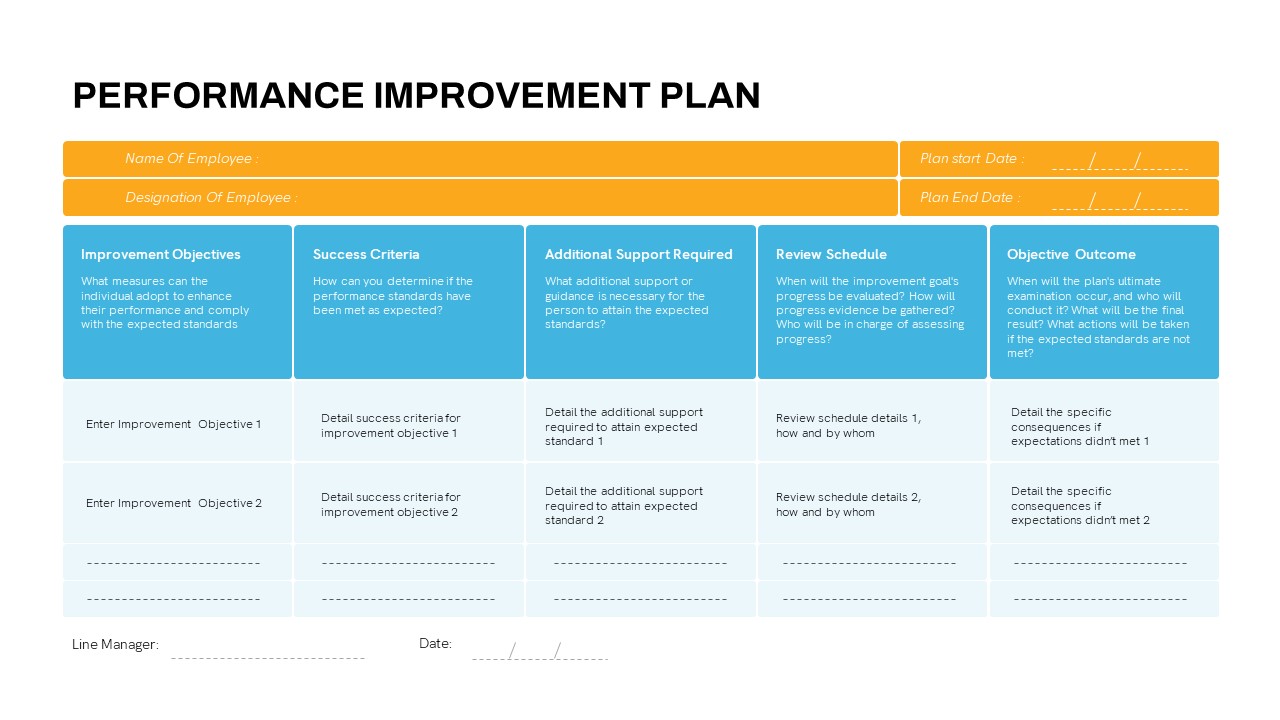
Detailed Performance Improvement Plan Template for PowerPoint & Google Slides
Employee Performance
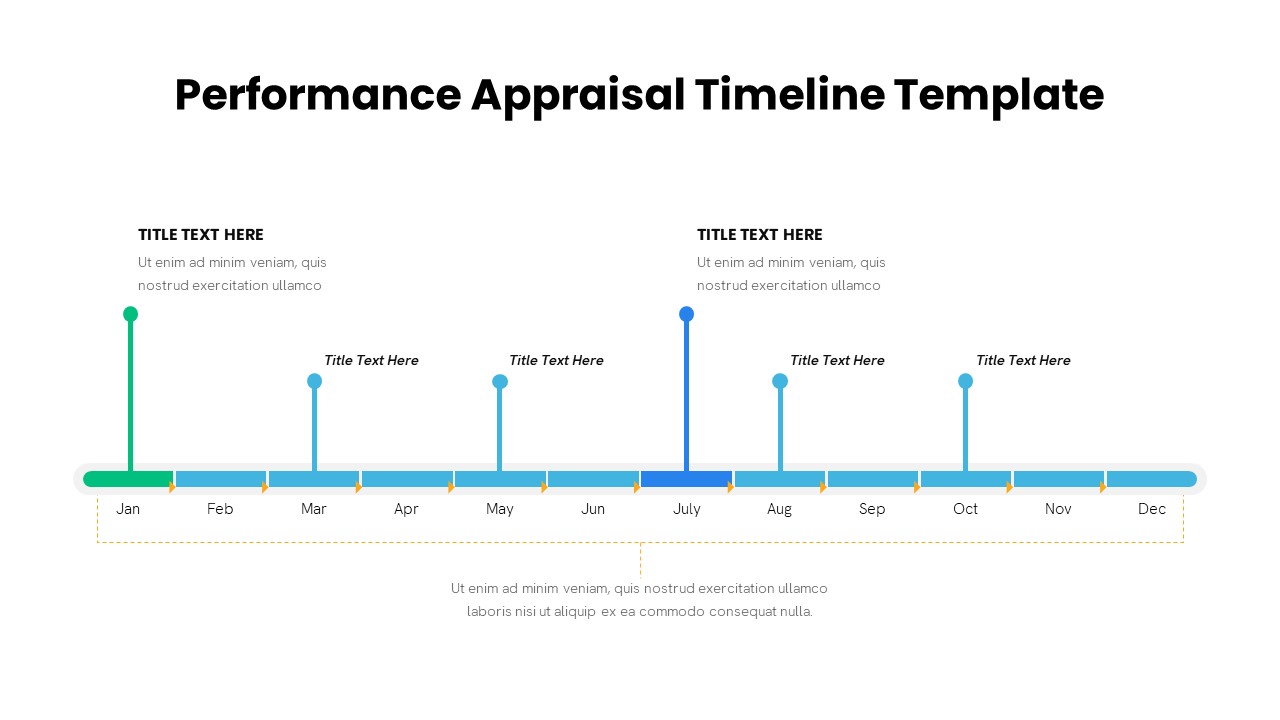
Performance Appraisal Timeline Diagram Template for PowerPoint & Google Slides
Timeline
DevOps KPI Dashboard Performance Metrics Template for PowerPoint & Google Slides
Software Development
Monthly Sales Performance Dashboard Template for PowerPoint & Google Slides
Charts
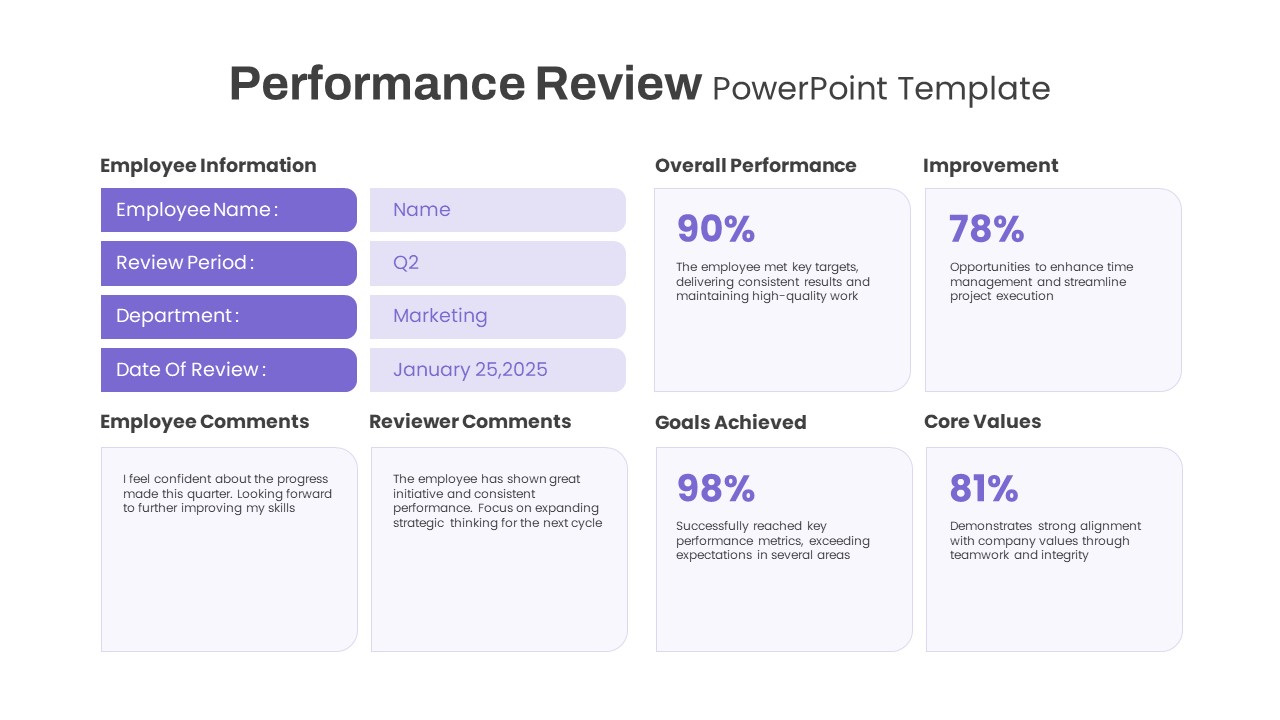
Performance Review template for PowerPoint & Google Slides
Employee Performance
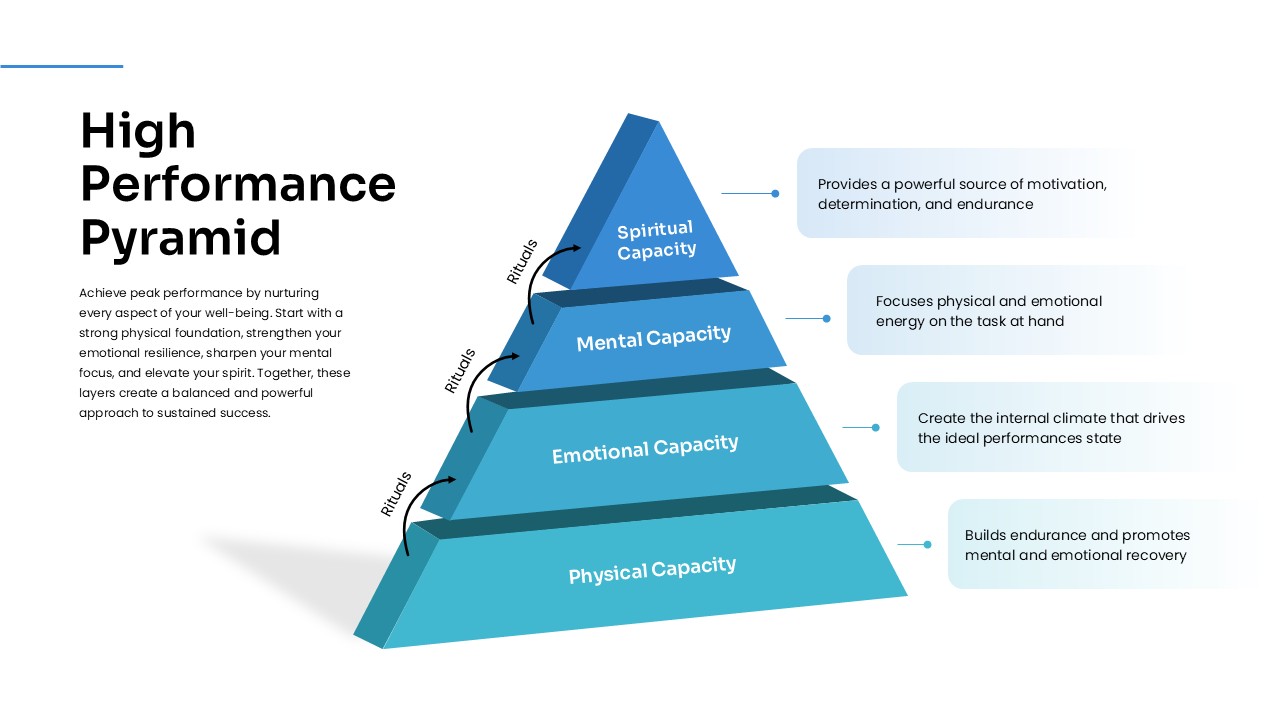
High Performance Pyramid Diagram Template for PowerPoint & Google Slides
Pyramid
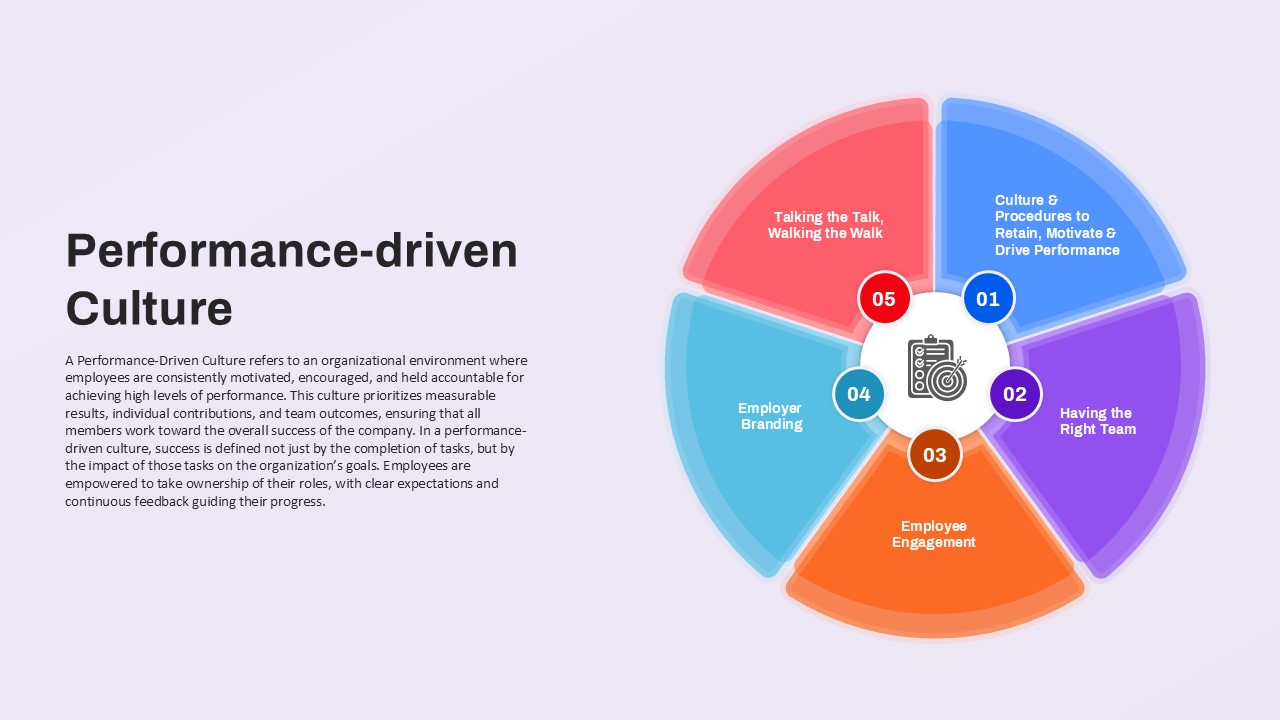
Performance-driven Culture framework template for PowerPoint & Google Slides
Leadership
Employee Performance Metrics Dashboard Template for PowerPoint & Google Slides
Employee Performance
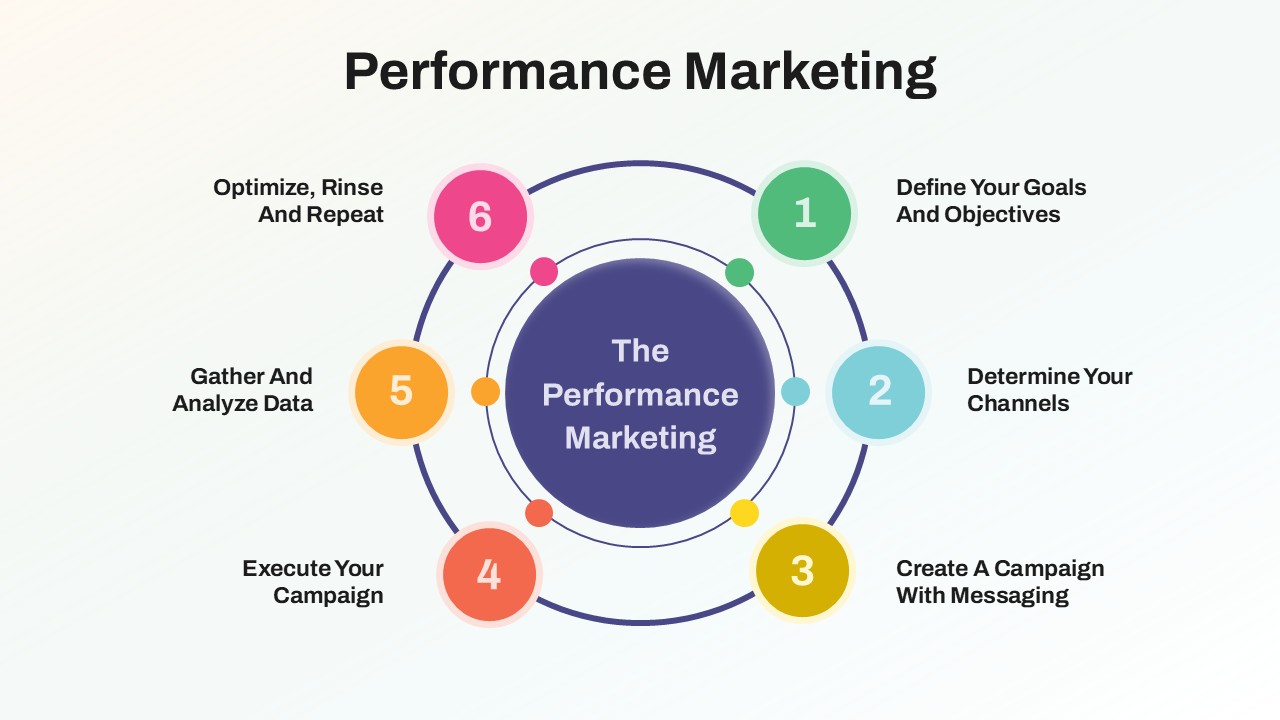
Performance Marketing Strategy template for PowerPoint & Google Slides
Digital Marketing
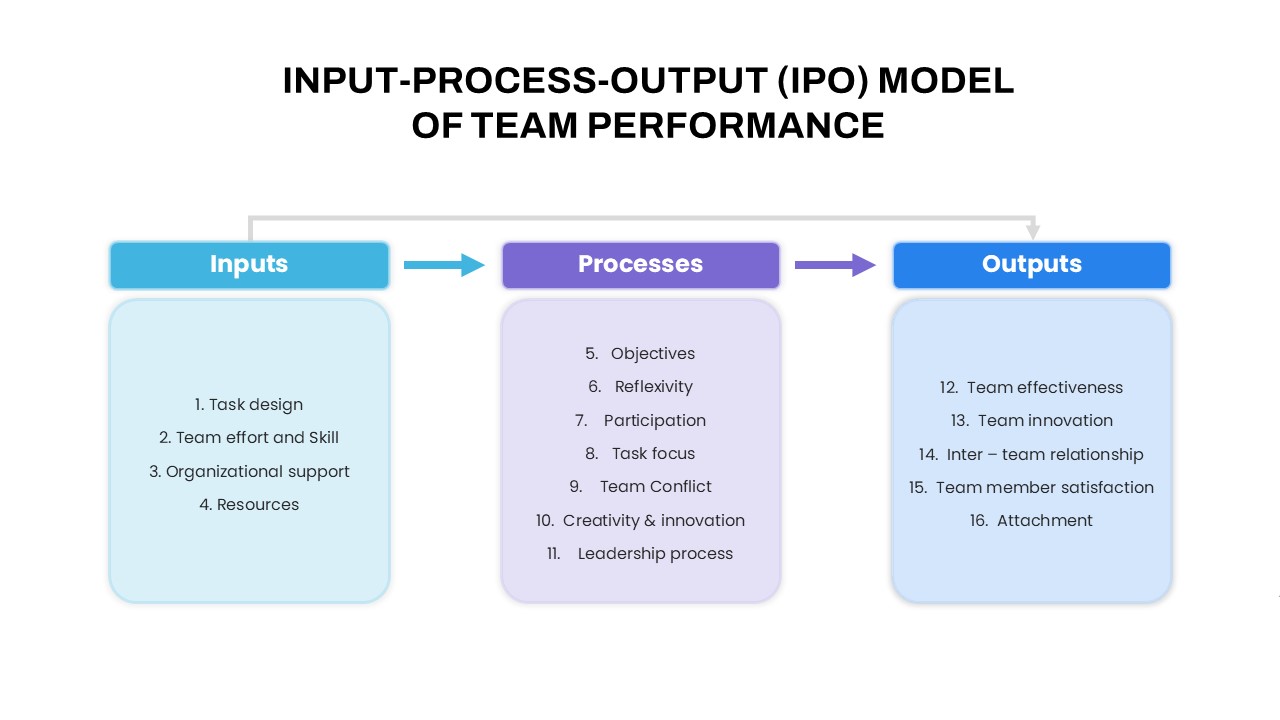
IPO Model of Team Performance for PowerPoint & Google Slides
Process
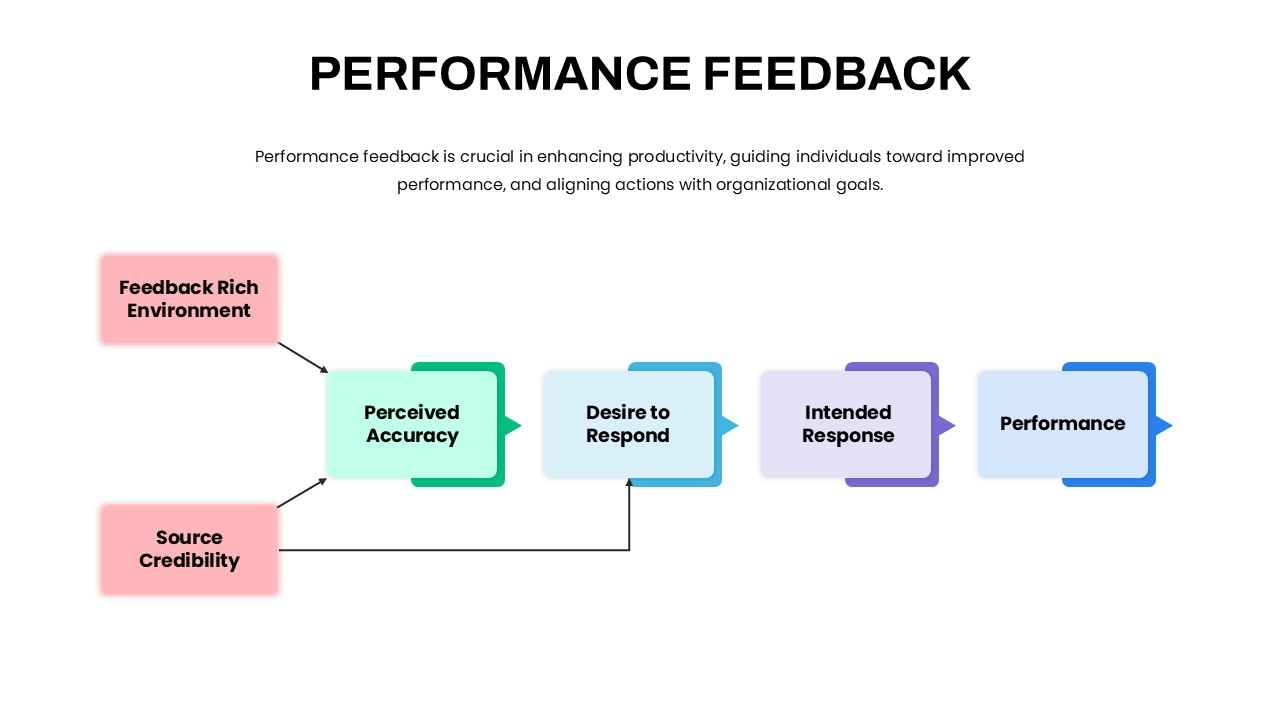
Performance Feedback Model for PowerPoint & Google Slides
Employee Performance
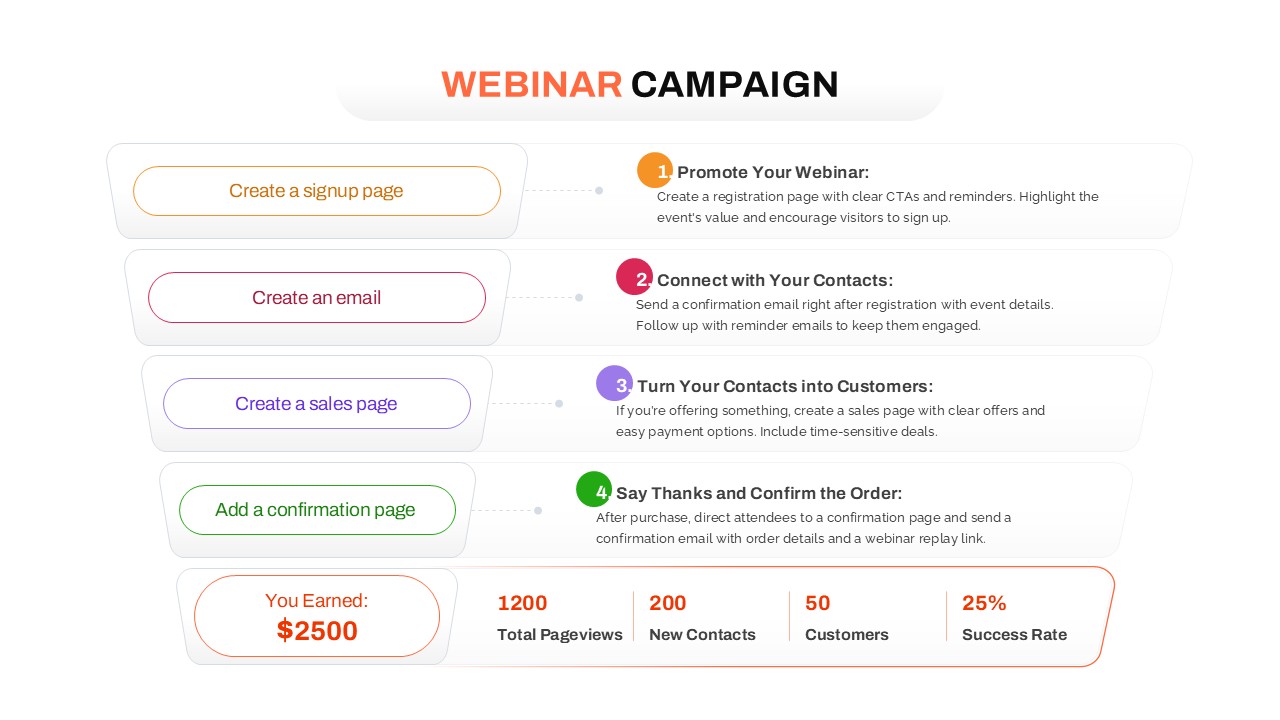
Webinar Campaign Steps and Performance for PowerPoint & Google Slides
Advertising
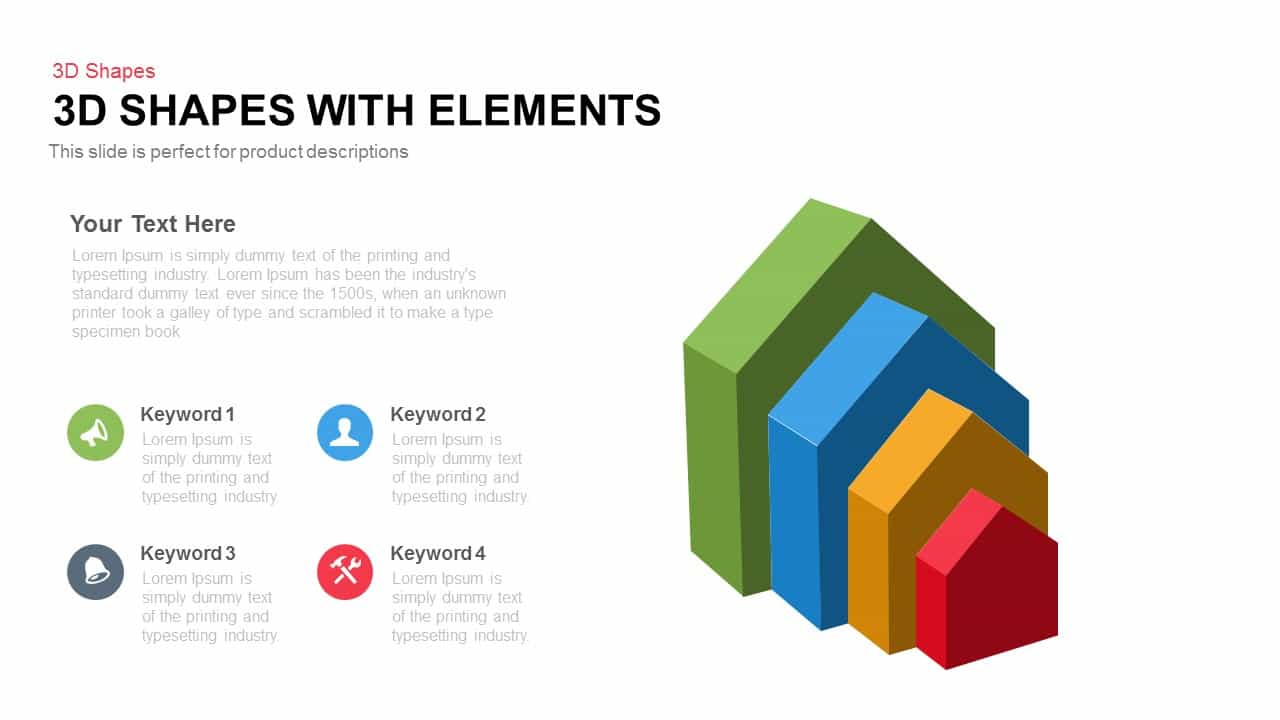
3D Shapes Overview template for PowerPoint & Google Slides
Process
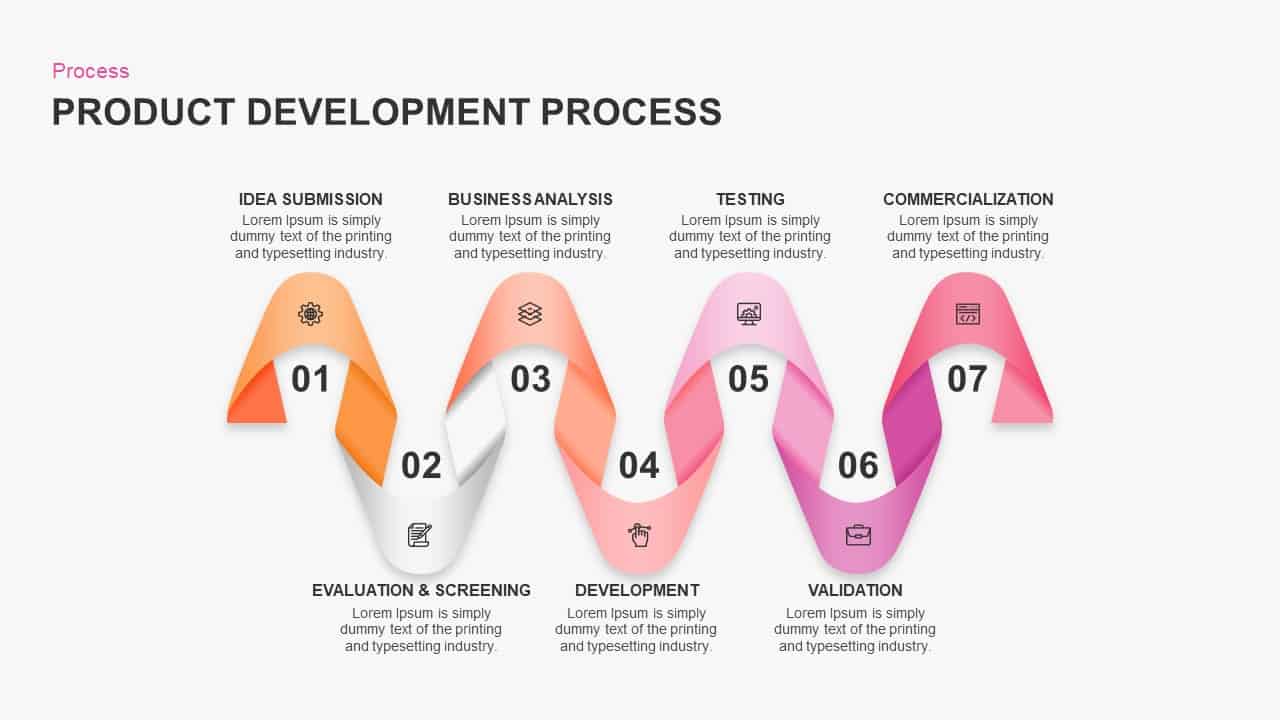
Product Development Process Overview template for PowerPoint & Google Slides
Process
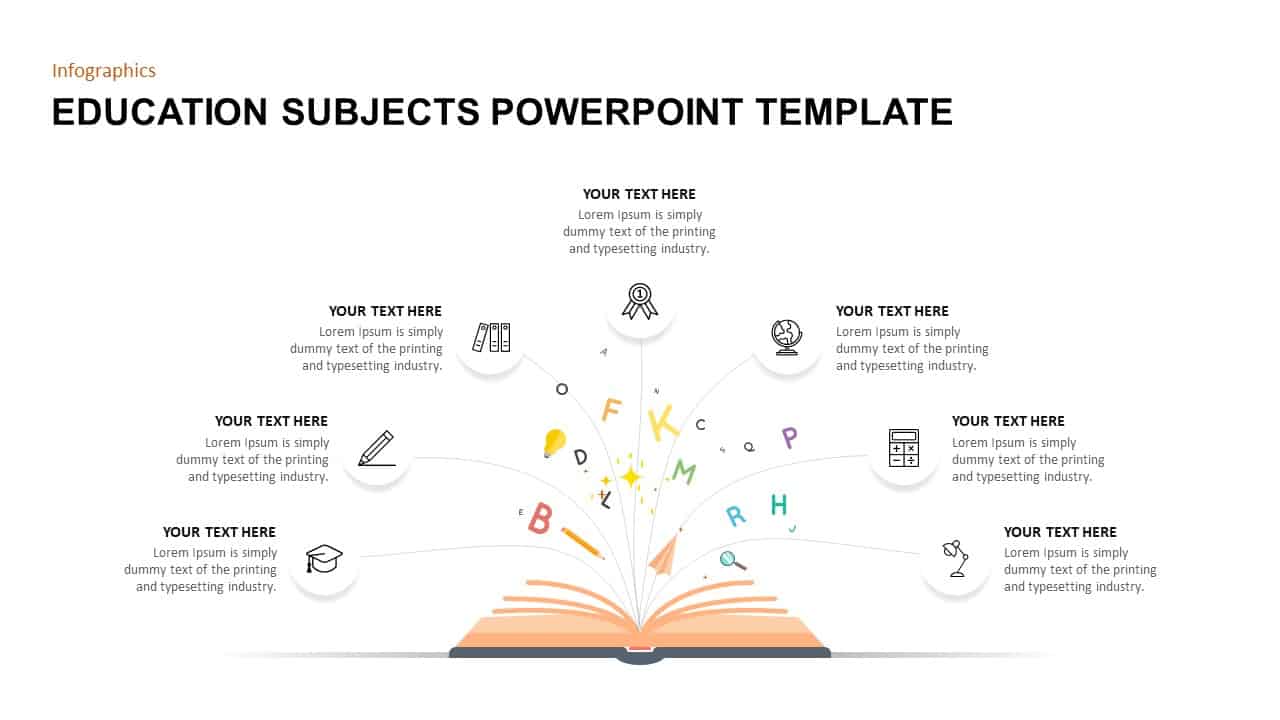
Education Subjects Overview template for PowerPoint & Google Slides
Agenda
Company Profile Overview template for PowerPoint & Google Slides
Company Profile
Business Proposal Overview template for PowerPoint & Google Slides
Business Proposal
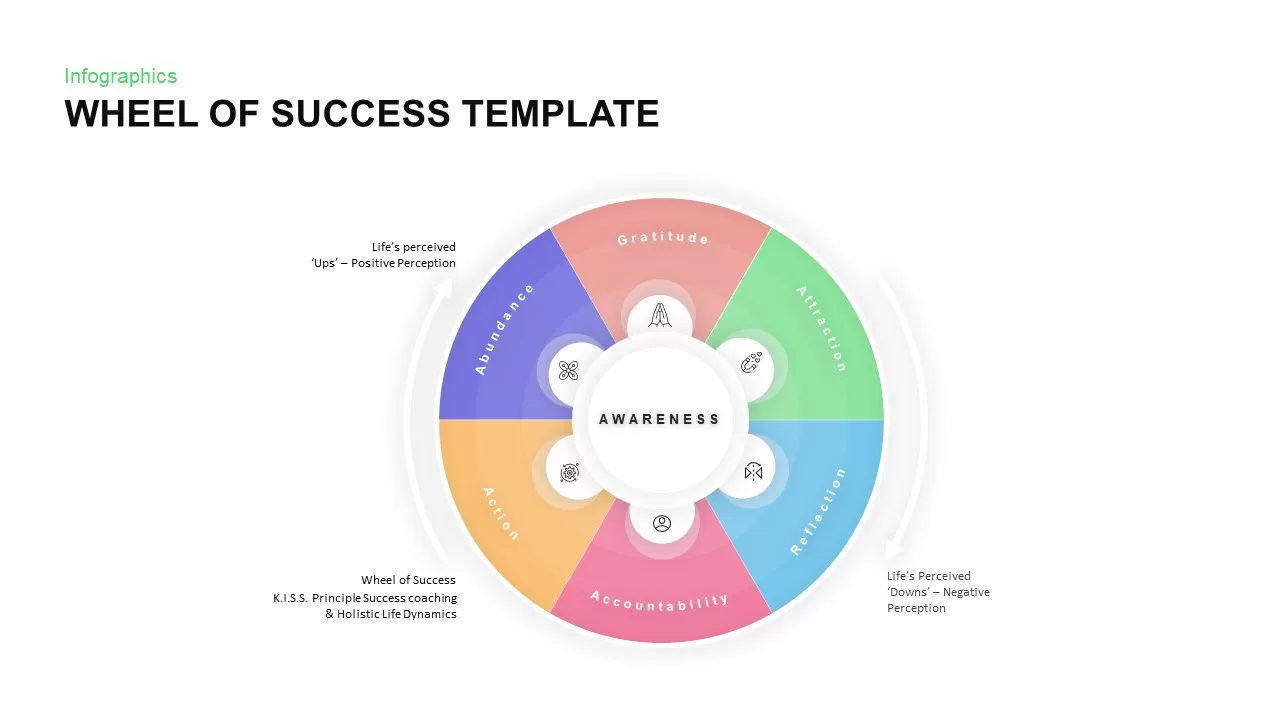
Wheel of Success Overview template for PowerPoint & Google Slides
Business Strategy
Corporate Level Strategy Overview template for PowerPoint & Google Slides
Business Strategy
Investment Idea Deck Overview Template for PowerPoint & Google Slides
Decks
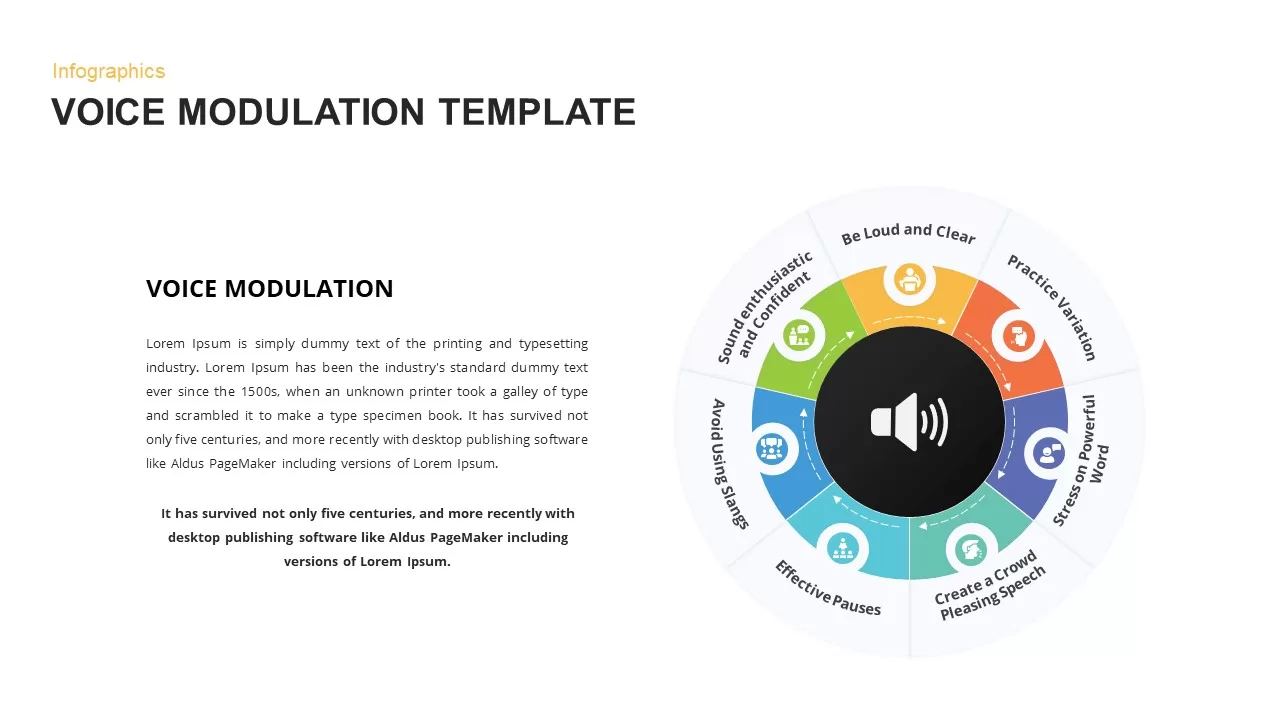
Voice Modulation Overview Template for PowerPoint & Google Slides
Circular
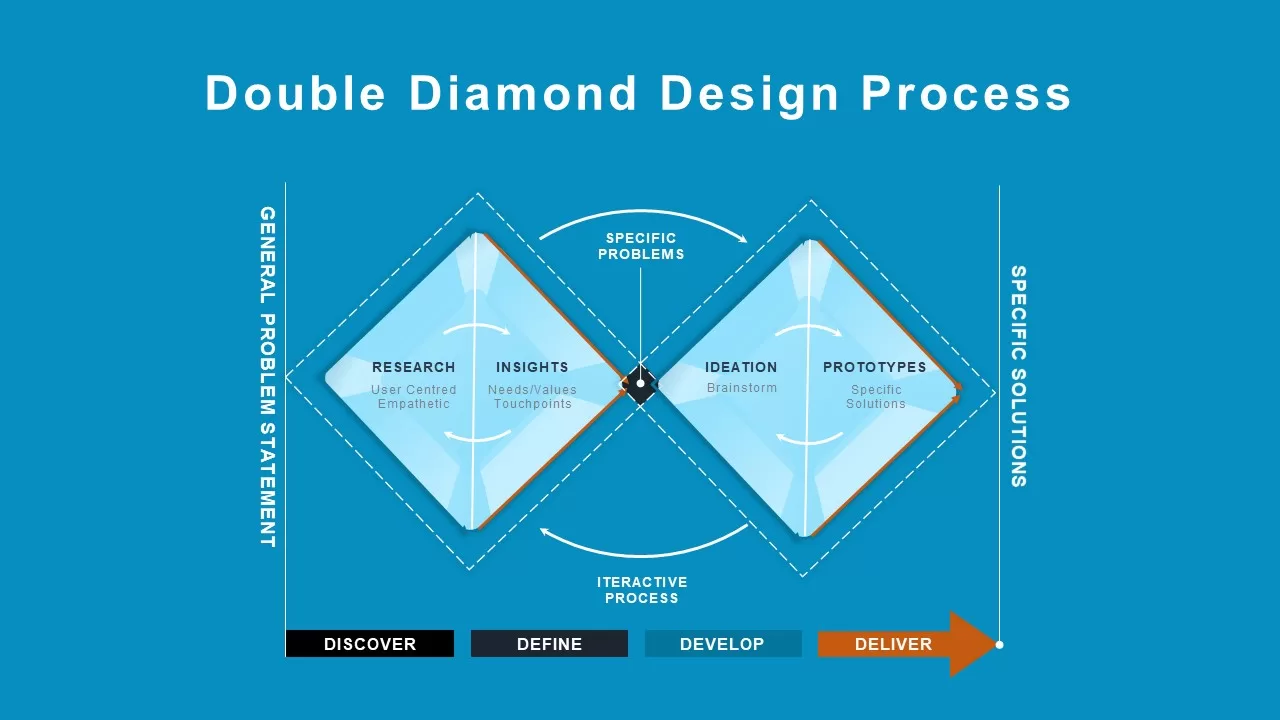
Double Diamond Design Process Overview Template for PowerPoint & Google Slides
Process
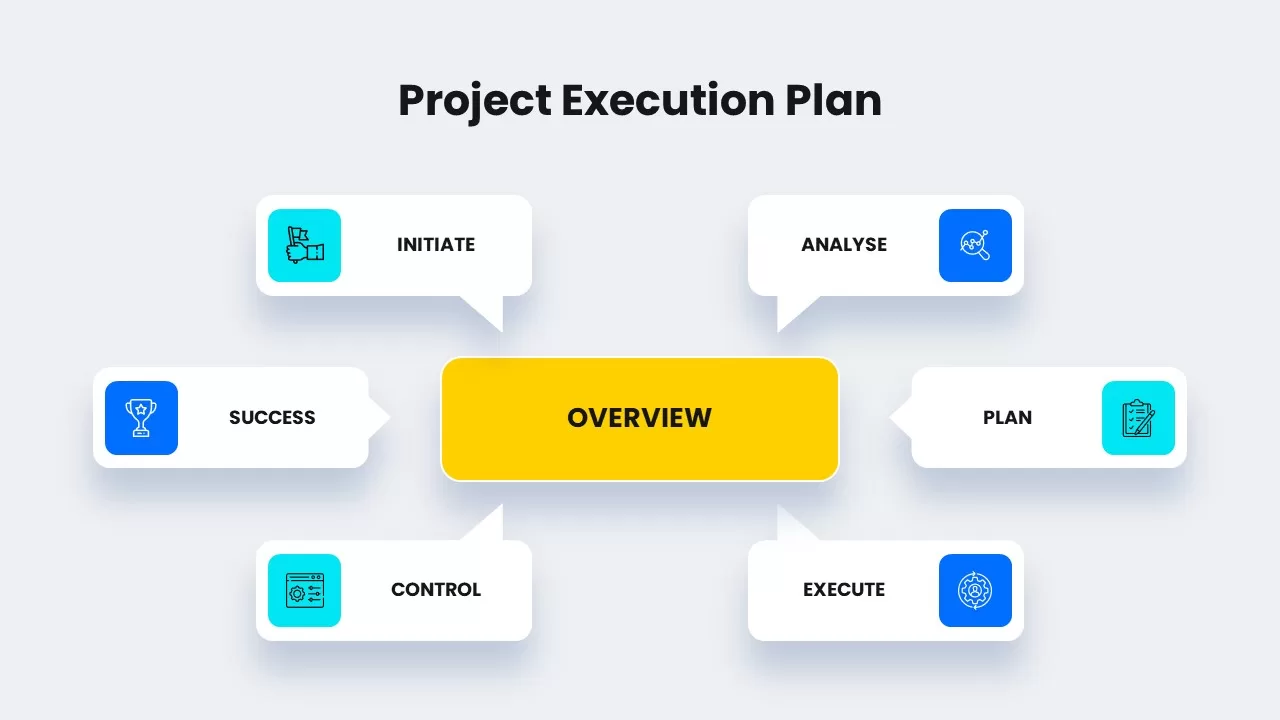
Project Execution Plan Overview Template for PowerPoint & Google Slides
Project Status
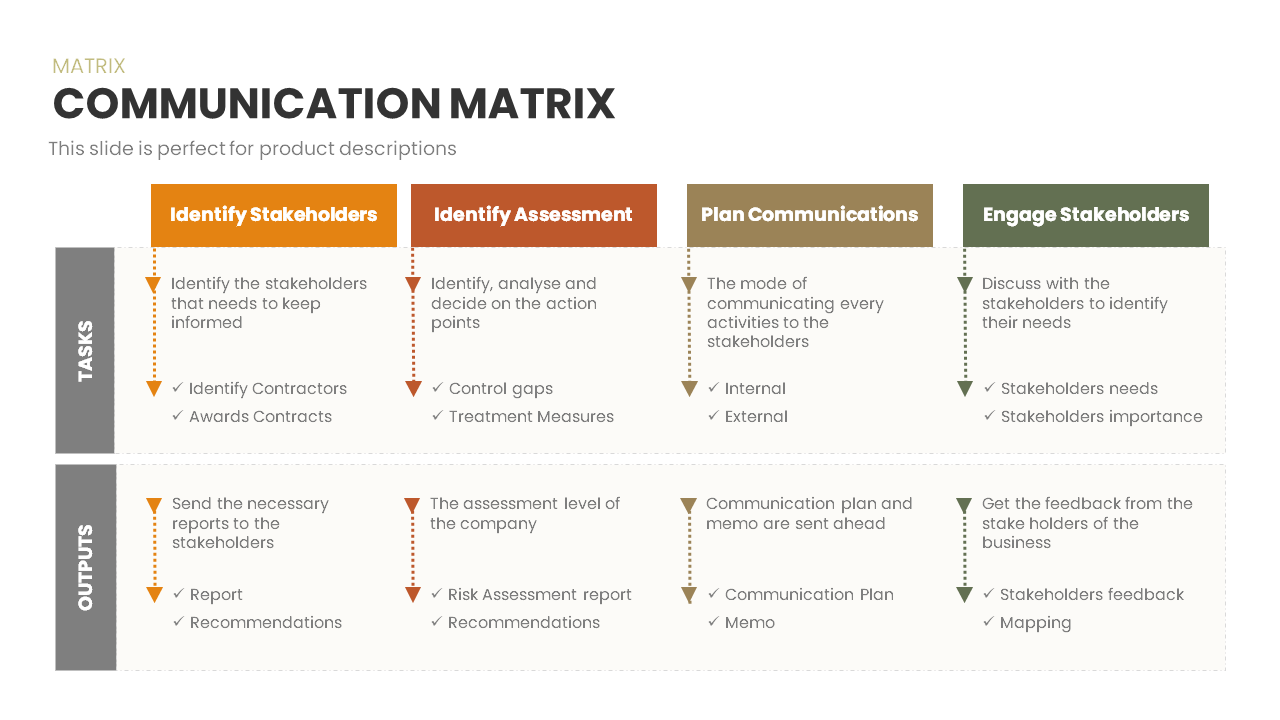
Communication Matrix Overview Template for PowerPoint & Google Slides
Business
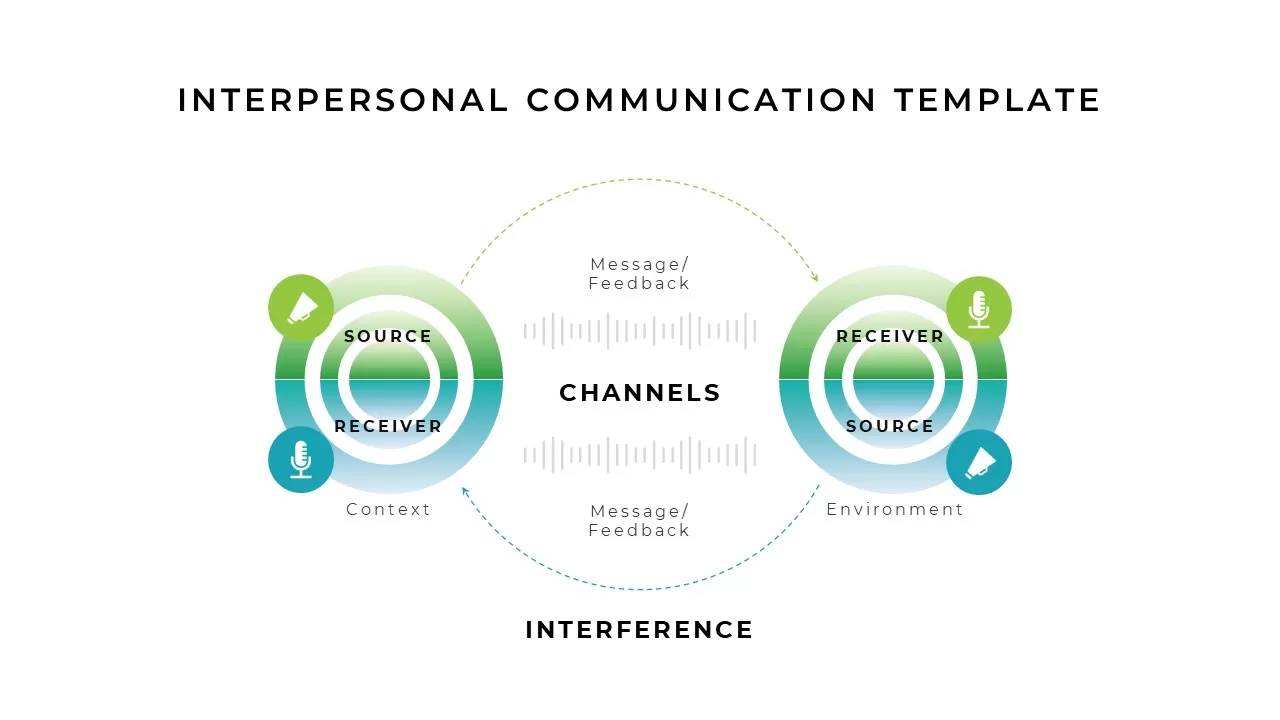
Interpersonal Communication Model Overview template for PowerPoint & Google Slides
Business
FreeBlack History Month Celebration Overview Template for PowerPoint & Google Slides
Pitch Deck
Free
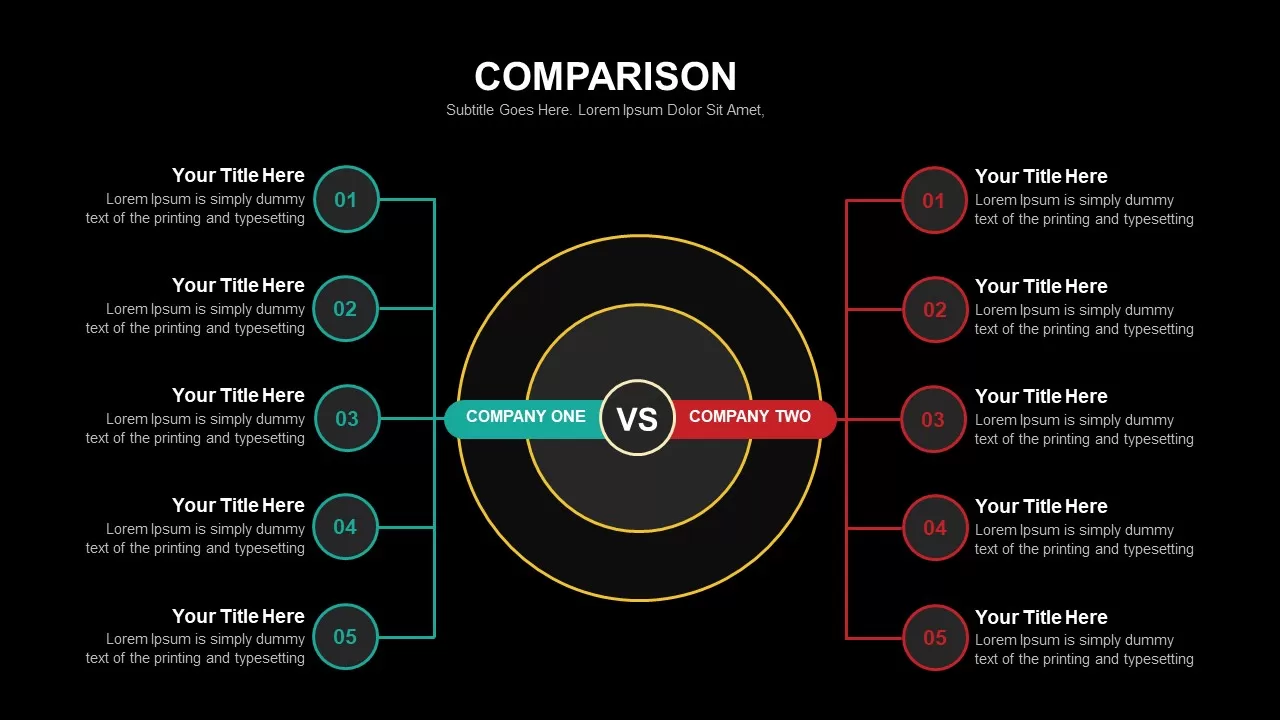
Comparison Infographic Overview template for PowerPoint & Google Slides
Business
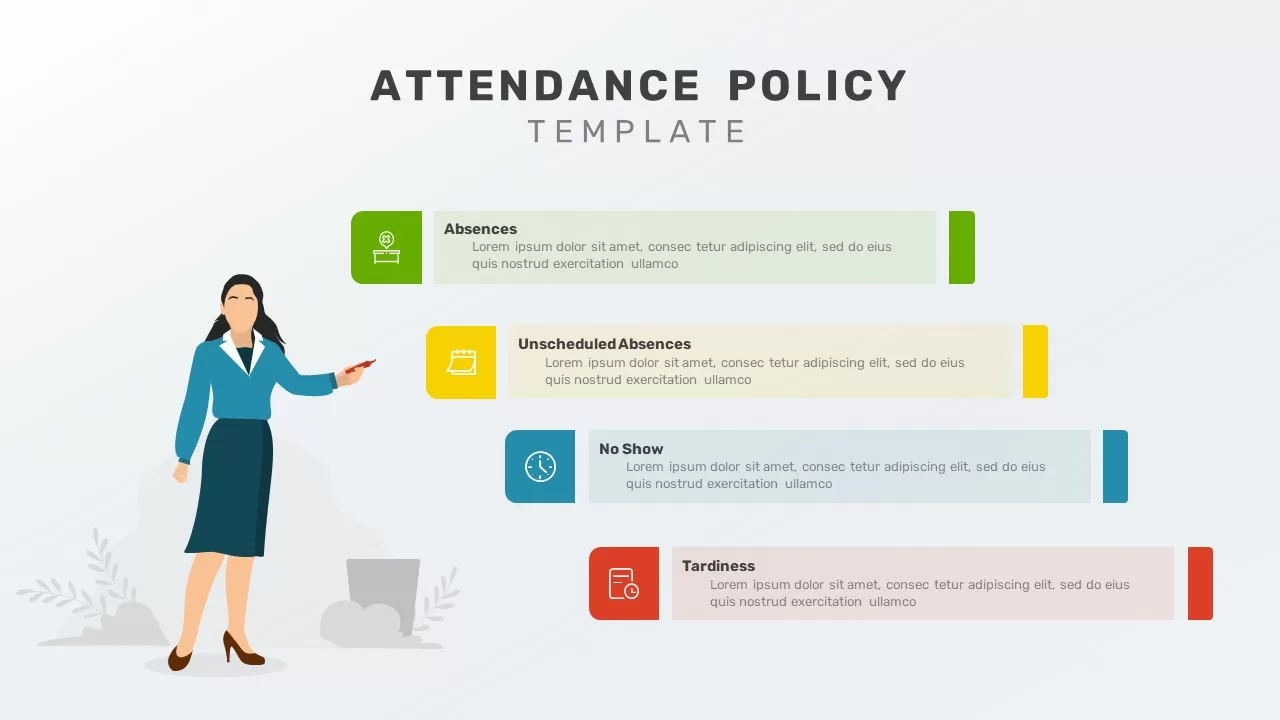
Comprehensive Attendance Policy Overview Template for PowerPoint & Google Slides
Process
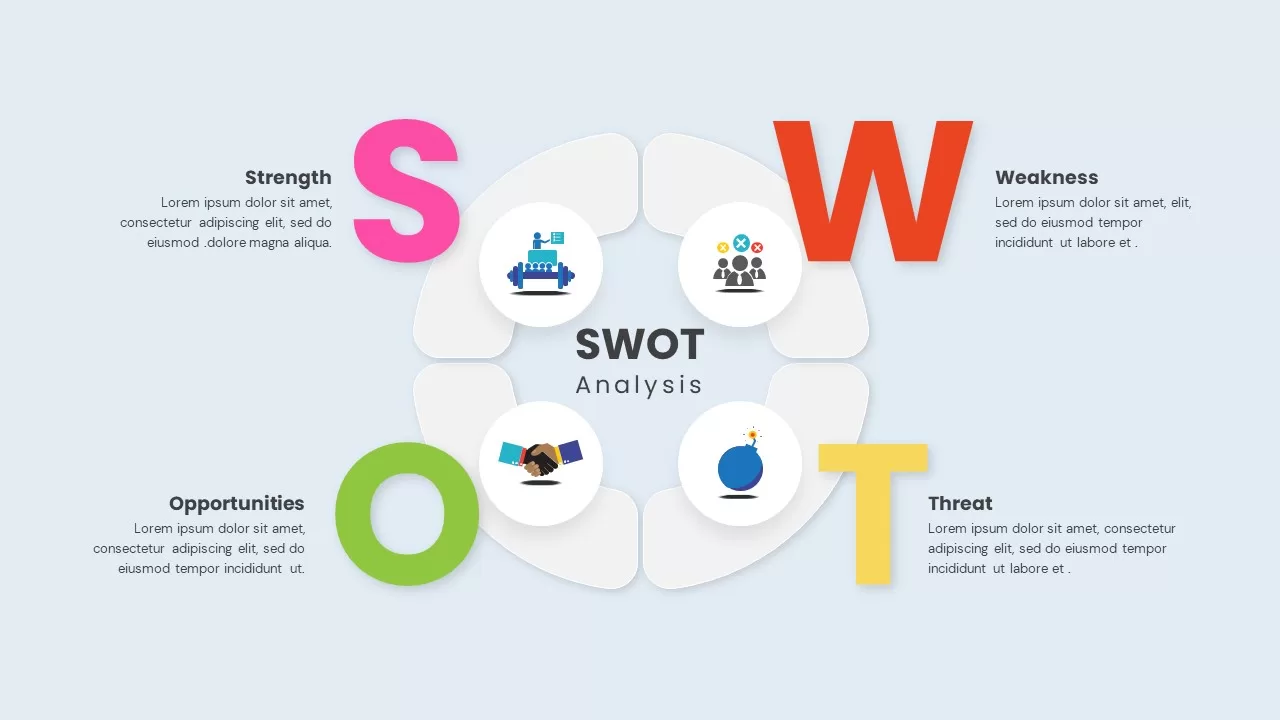
SWOT Analysis Visual Overview template for PowerPoint & Google Slides
Business Strategy
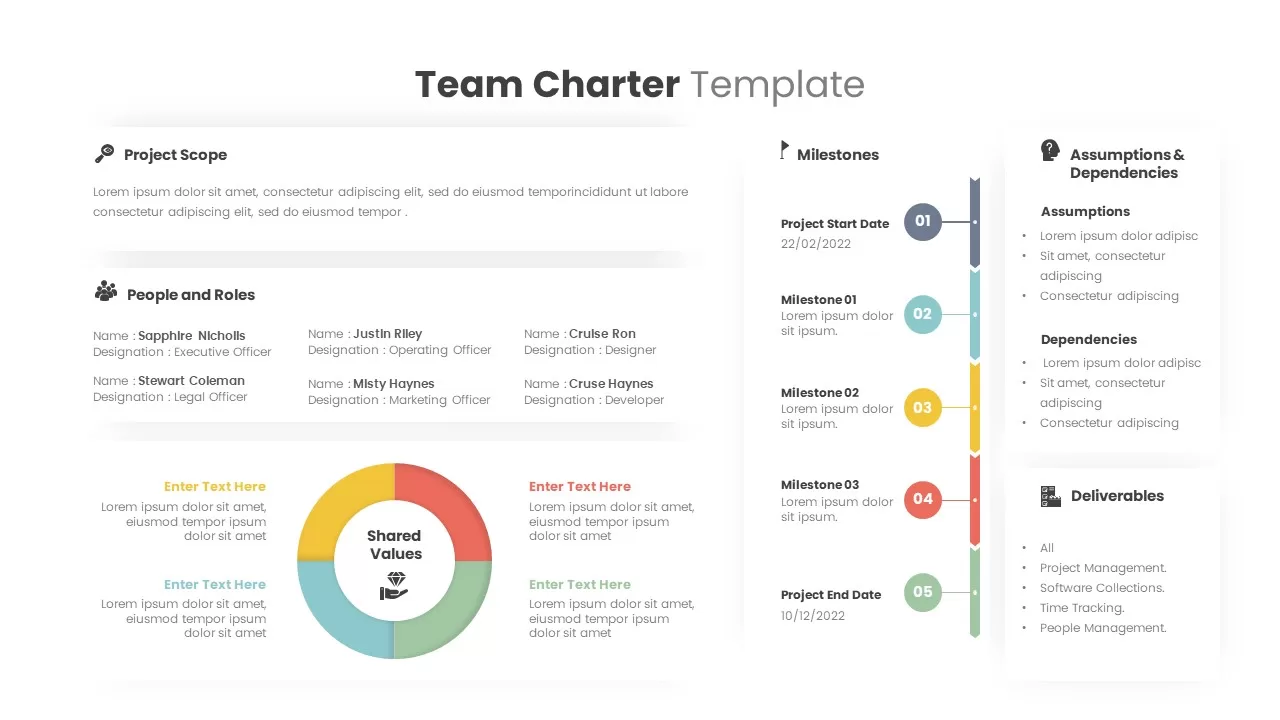
Team Charter Overview template for PowerPoint & Google Slides
Business Plan
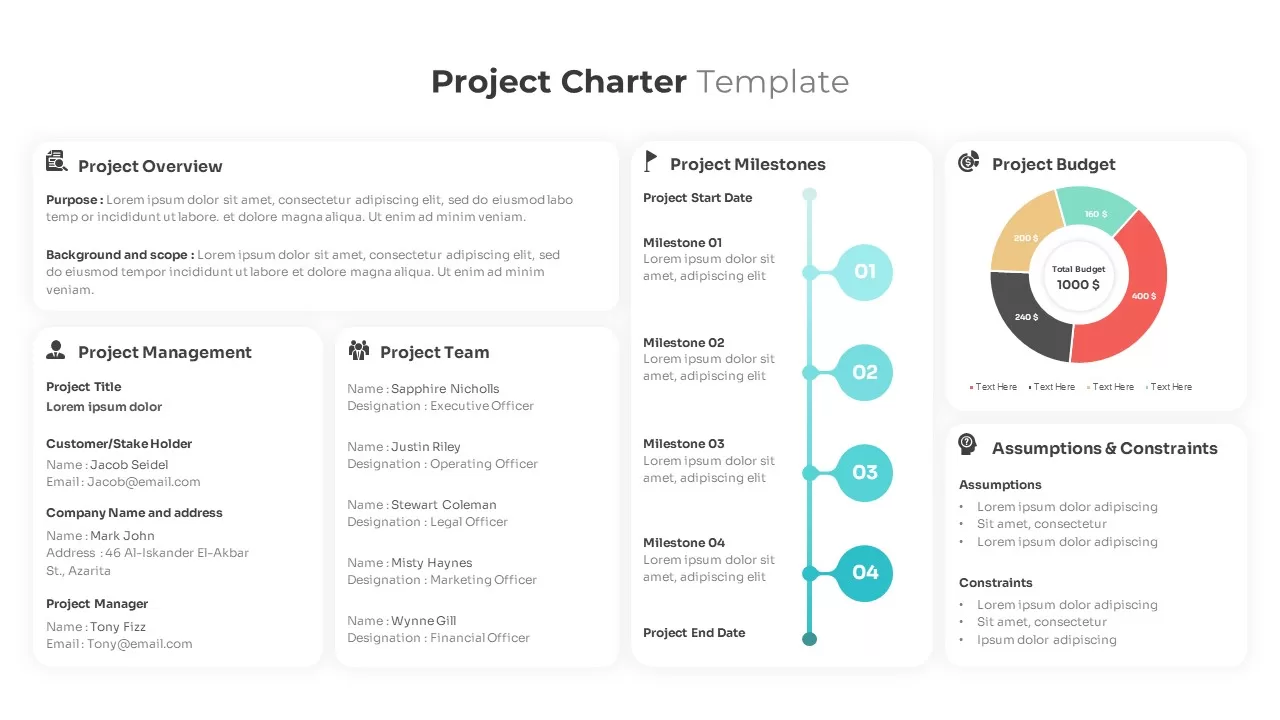
Project Charter Overview template for PowerPoint & Google Slides
Business Plan
Free SWOT Analysis Overview template for PowerPoint & Google Slides
SWOT
Free
5 Stage Process Flow Overview template for PowerPoint & Google Slides
Process

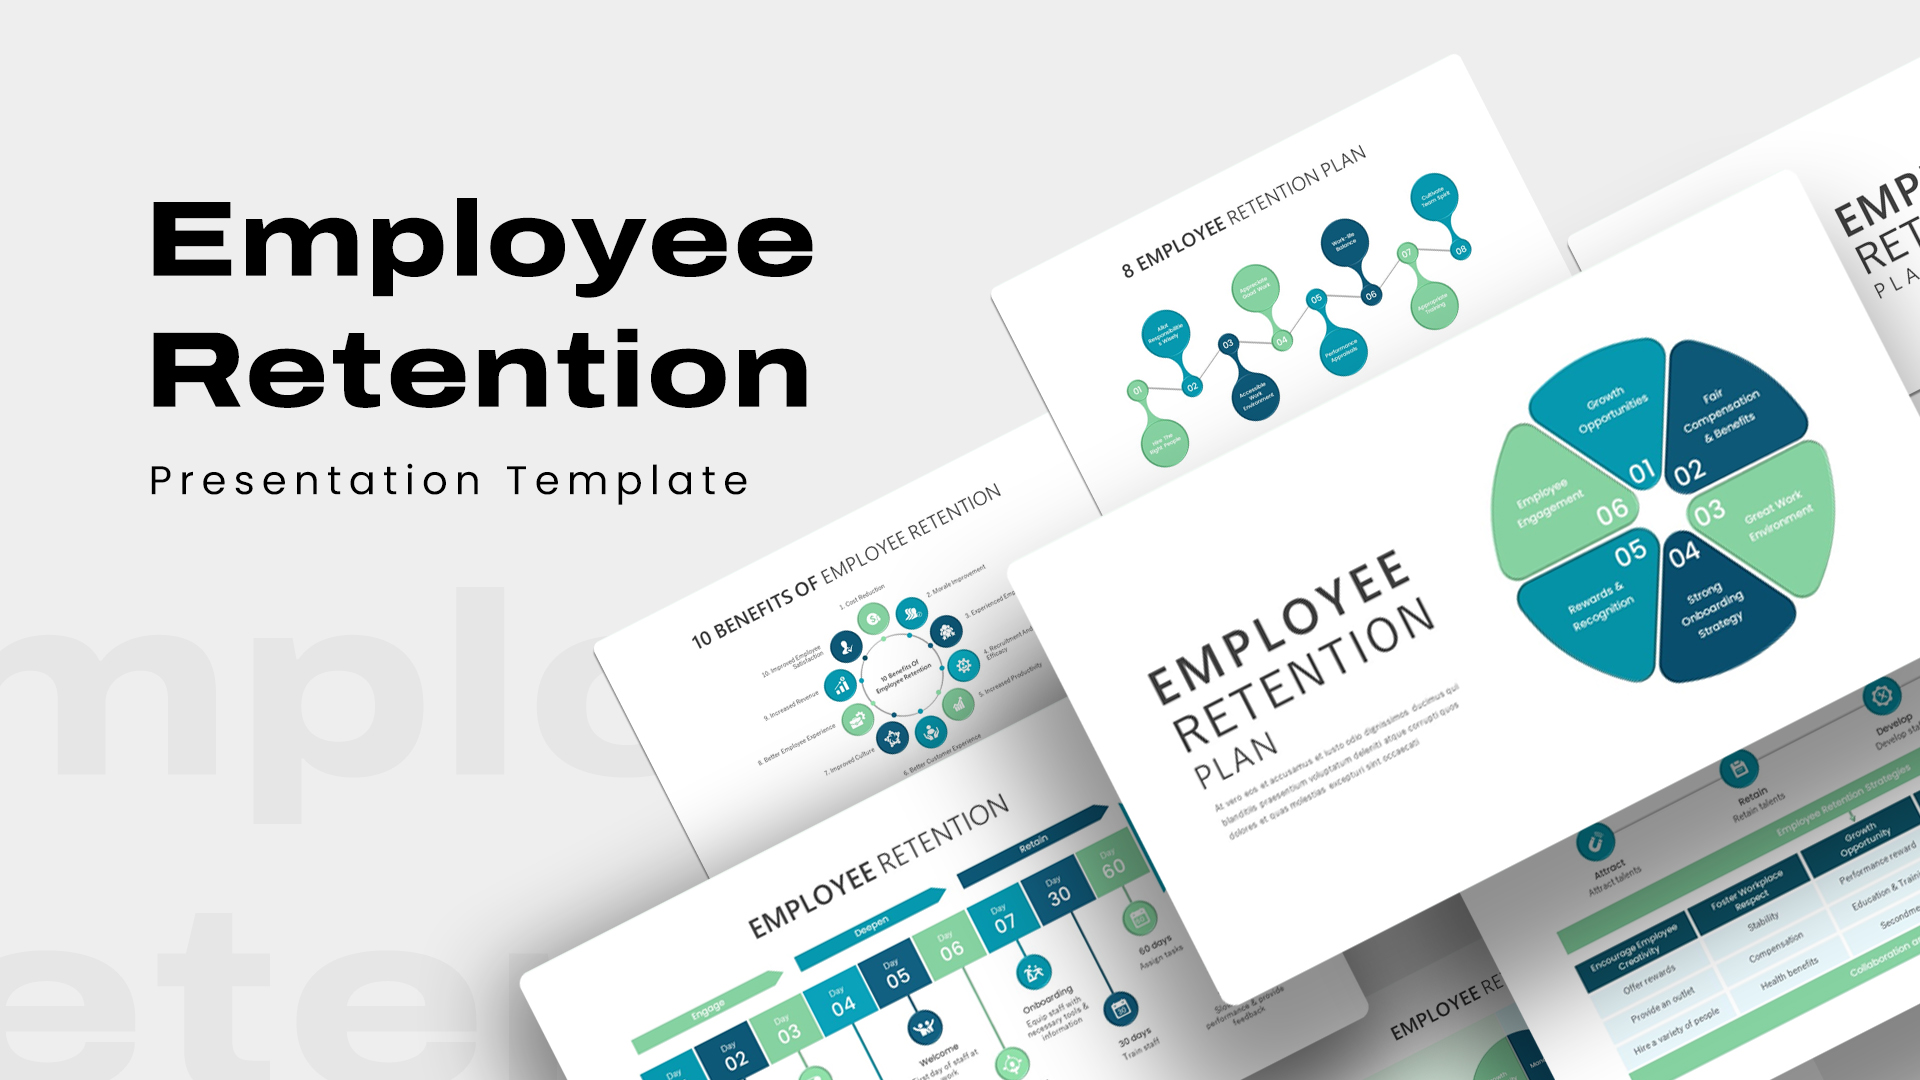
Employee Retention Plan Overview template for PowerPoint & Google Slides
Company Profile
Graduation Celebration Overview template for PowerPoint & Google Slides
Pitch Deck
Streaming Service Overview template for PowerPoint & Google Slides
Business Proposal
Strategic Initiatives Overview template for PowerPoint & Google Slides
Business Strategy
KPI Dashboard Overview template for PowerPoint & Google Slides
Finance
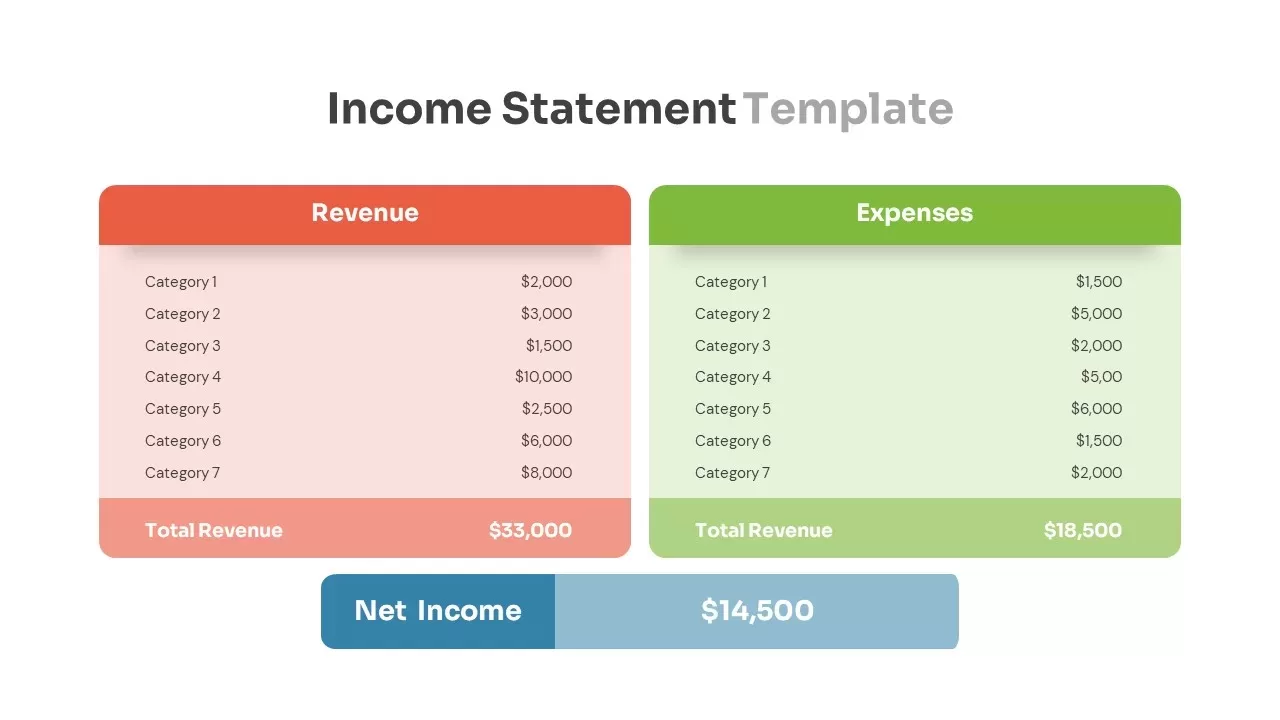
Comprehensive Income Statement Overview Template for PowerPoint & Google Slides
Business Report
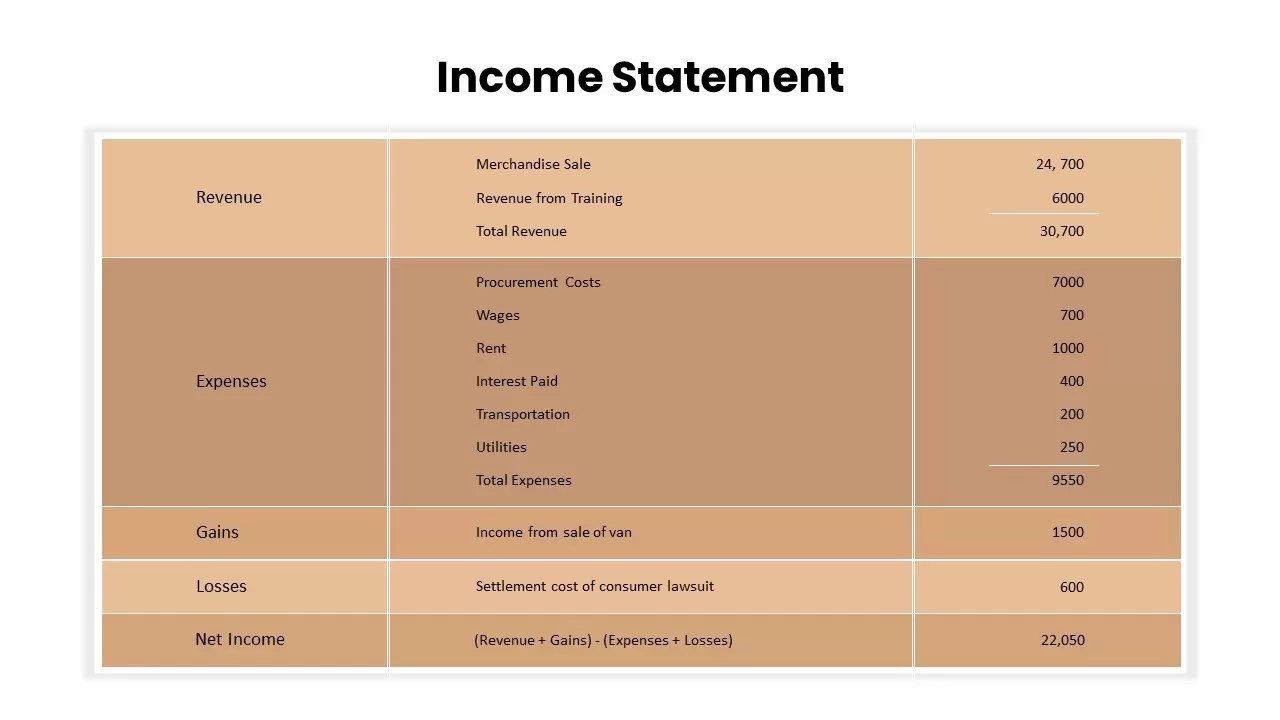
Income Statement Overview Table Template for PowerPoint & Google Slides
Finance
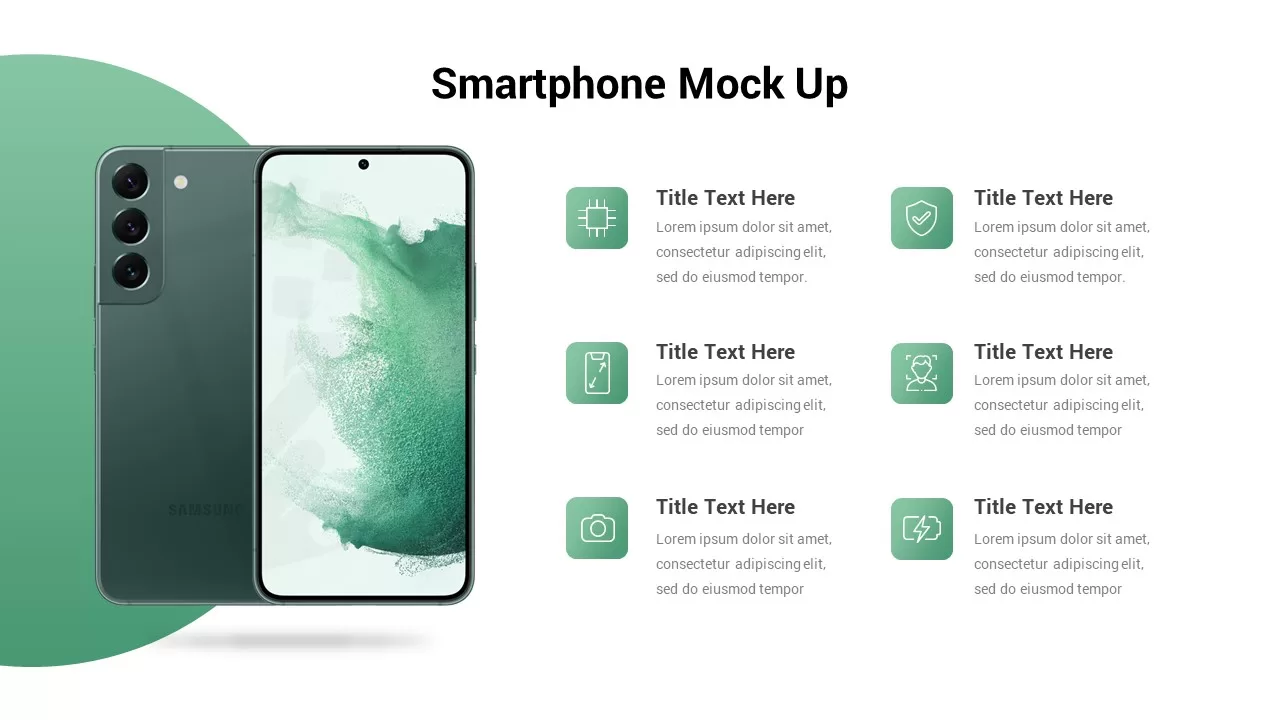
Smartphone Mockup Feature Overview Template for PowerPoint & Google Slides
Graphics
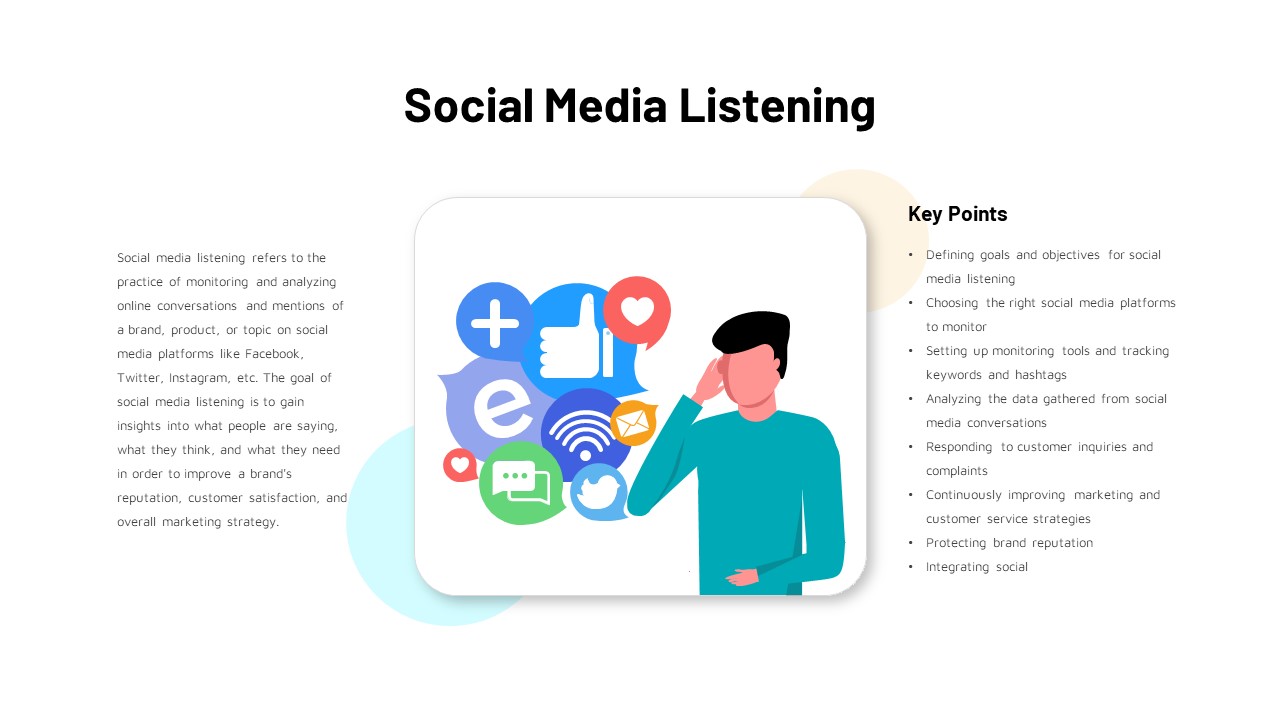
Social Media Listening Overview Slide Template for PowerPoint & Google Slides
Customer Experience
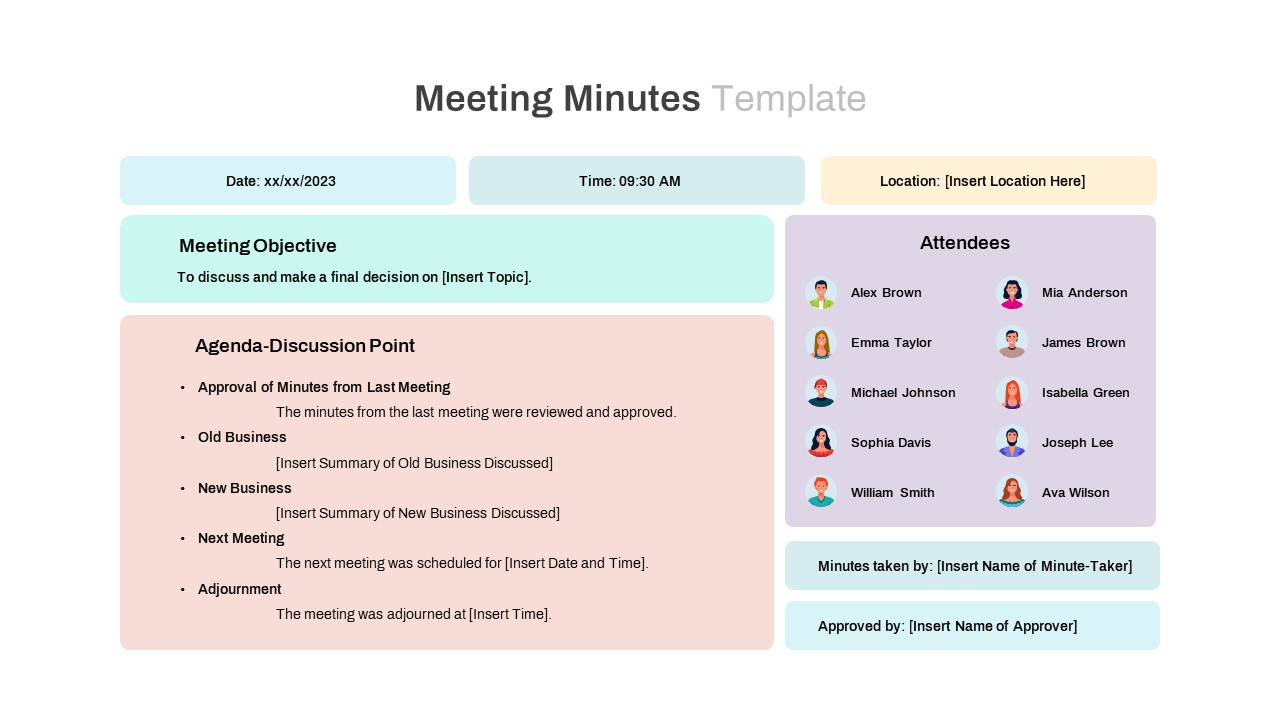
Meeting Minutes and Attendees Overview Template for PowerPoint & Google Slides
Business Report
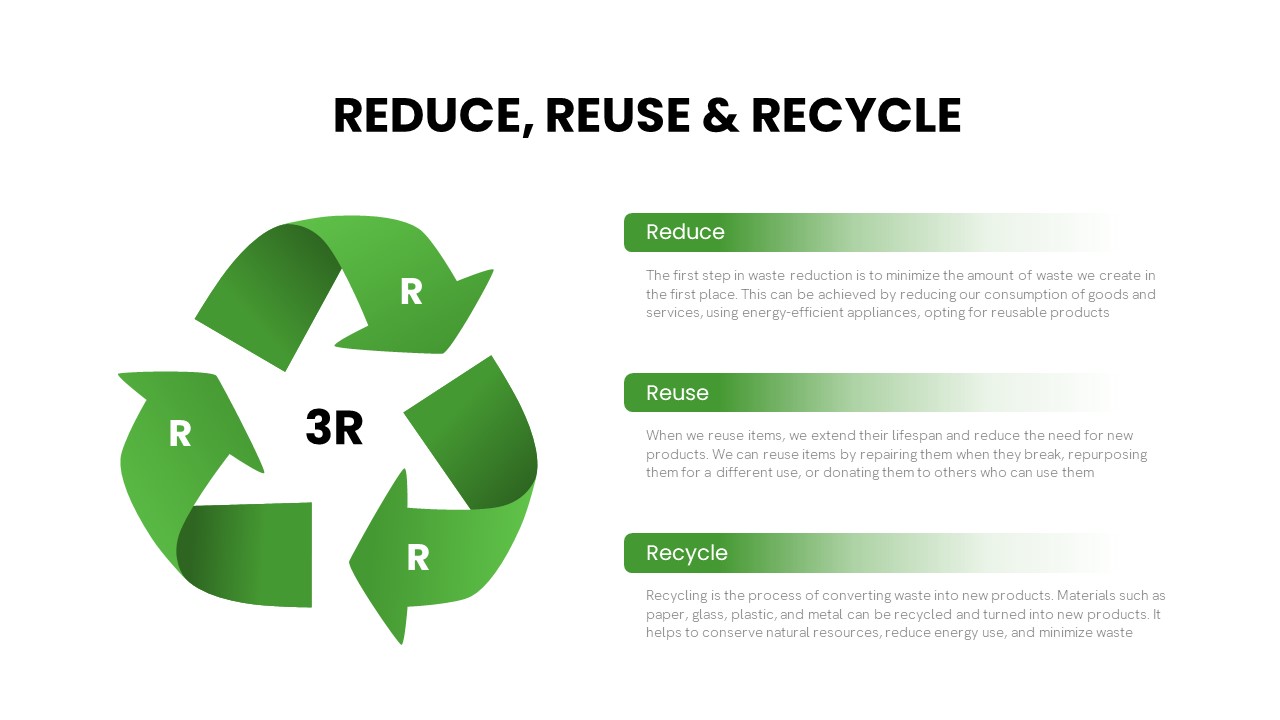
3R Waste Management Cycle Overview template for PowerPoint & Google Slides
Process

Modern Construction Project Overview Template for PowerPoint & Google Slides
Pitch Deck
Free TikTok Marketing Analytics Overview Template for PowerPoint & Google Slides
Company Profile
Free
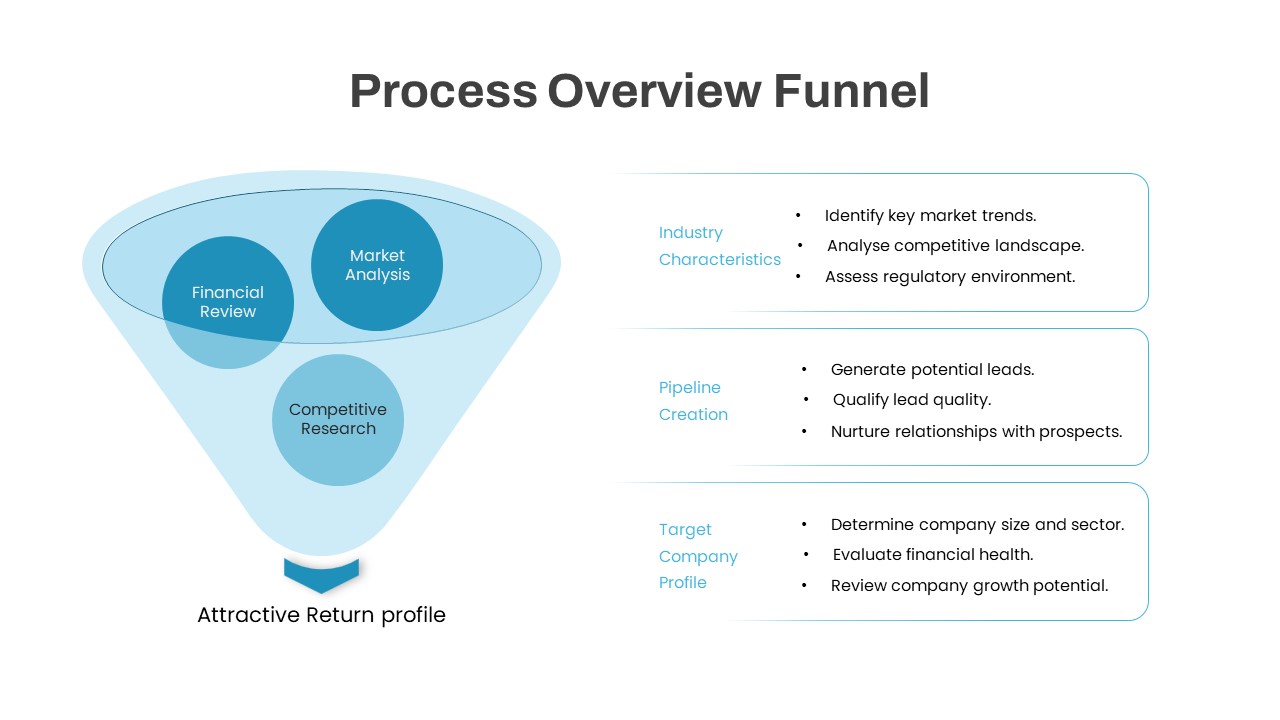
Process Overview Funnel Diagram Template for PowerPoint & Google Slides
Funnel
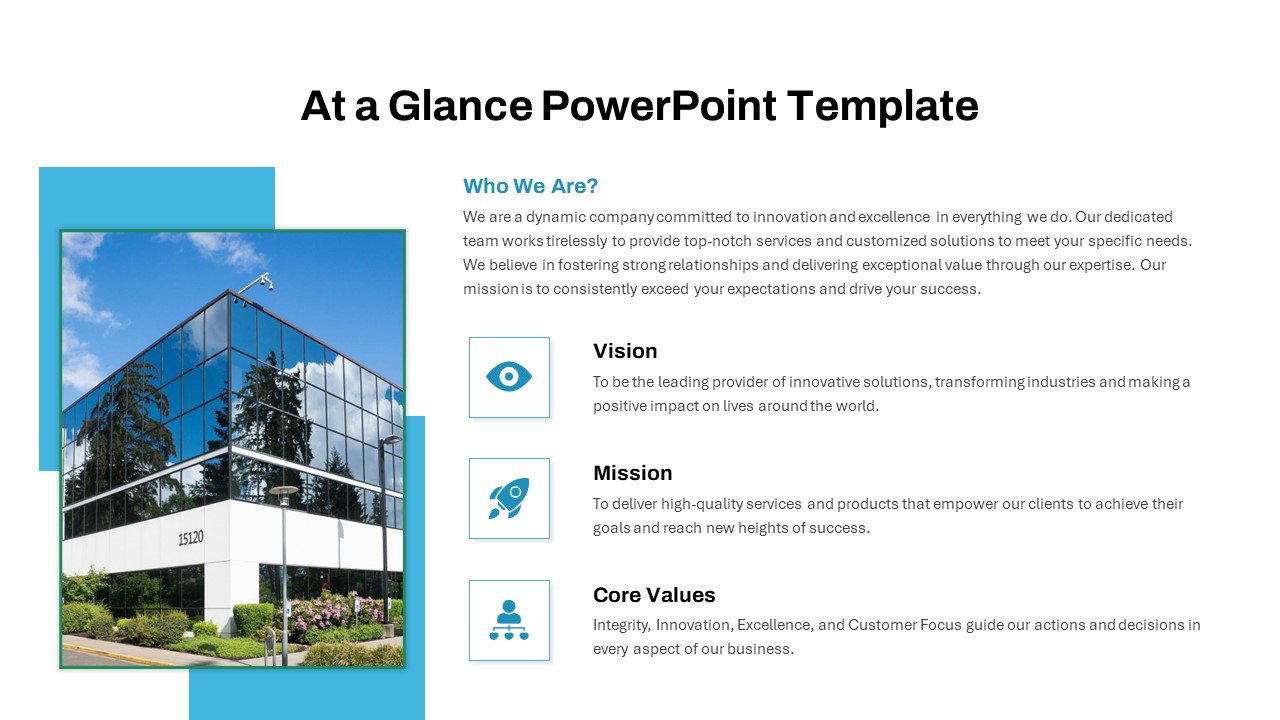
At a Glance Company Profile Overview Template for PowerPoint & Google Slides
Company Profile
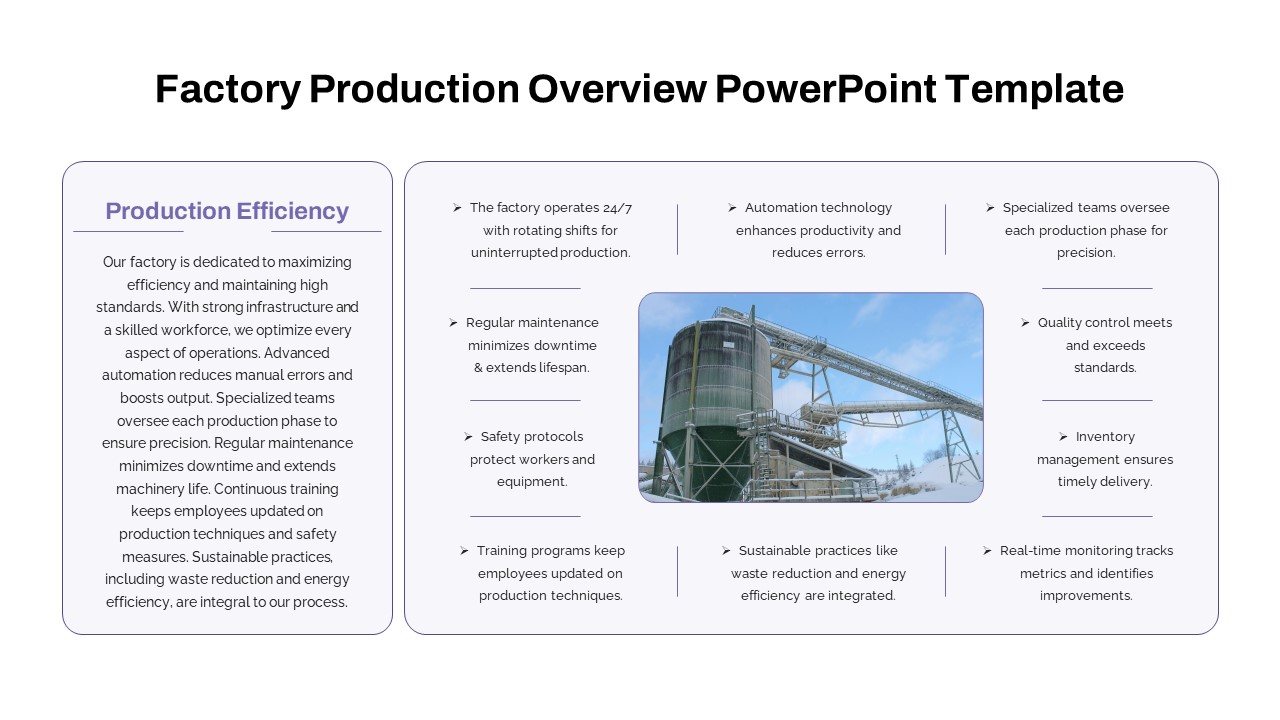
Factory Production Overview Template for PowerPoint & Google Slides
Business Report
Financial Snapshot & Metrics Overview Template for PowerPoint & Google Slides
Finance
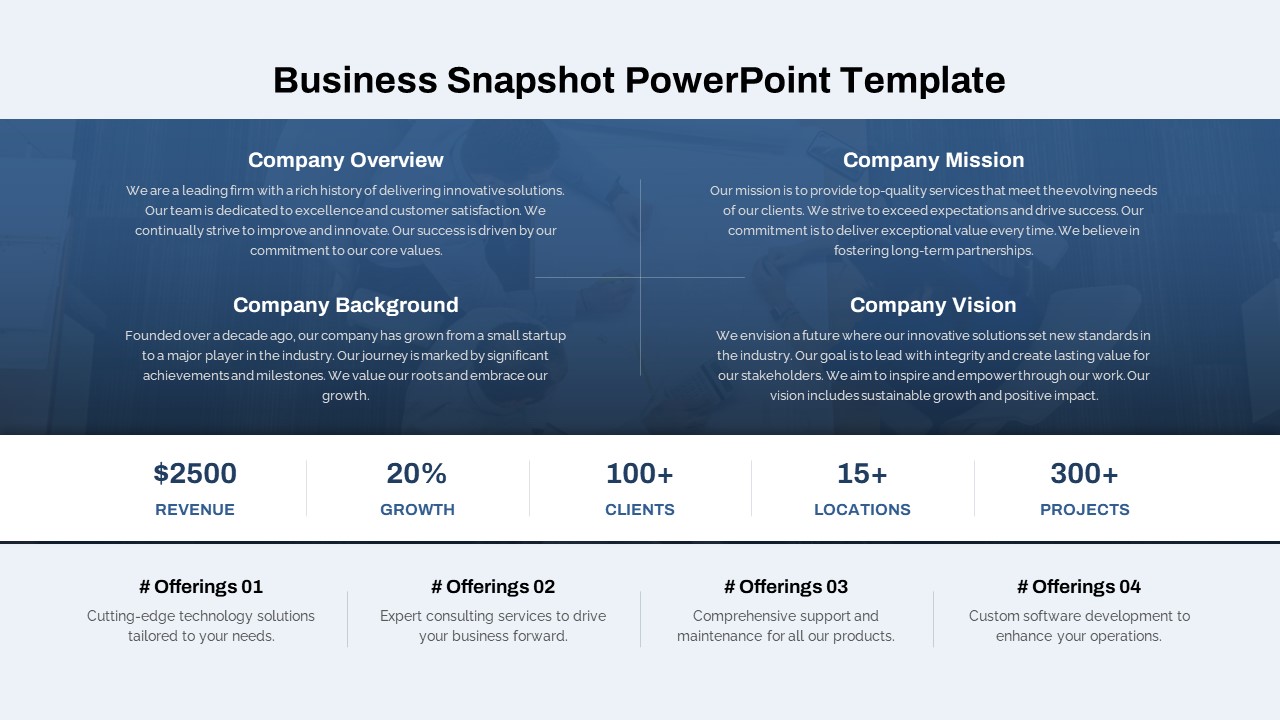
Modern Business Snapshot Overview Template for PowerPoint & Google Slides
Business Report
Zero Trust Security Model Overview template for PowerPoint & Google Slides
Infographics
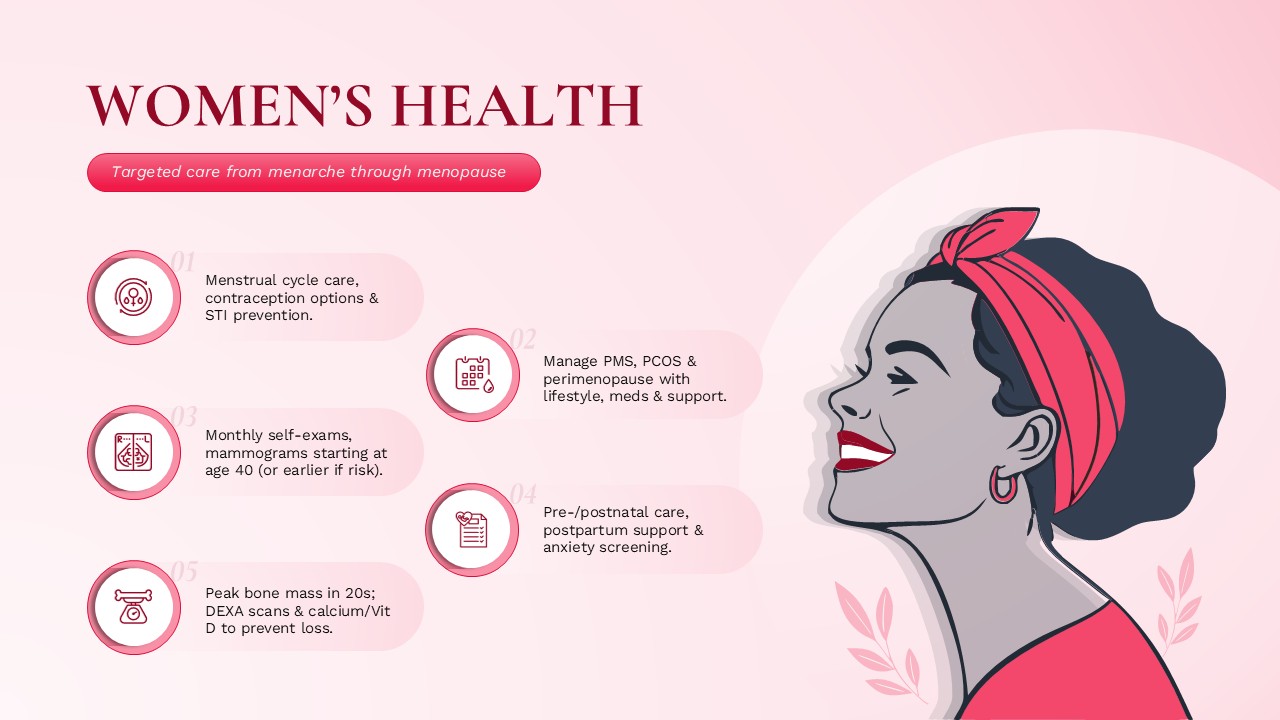
Women’s Health Care Overview template for PowerPoint & Google Slides
Medical
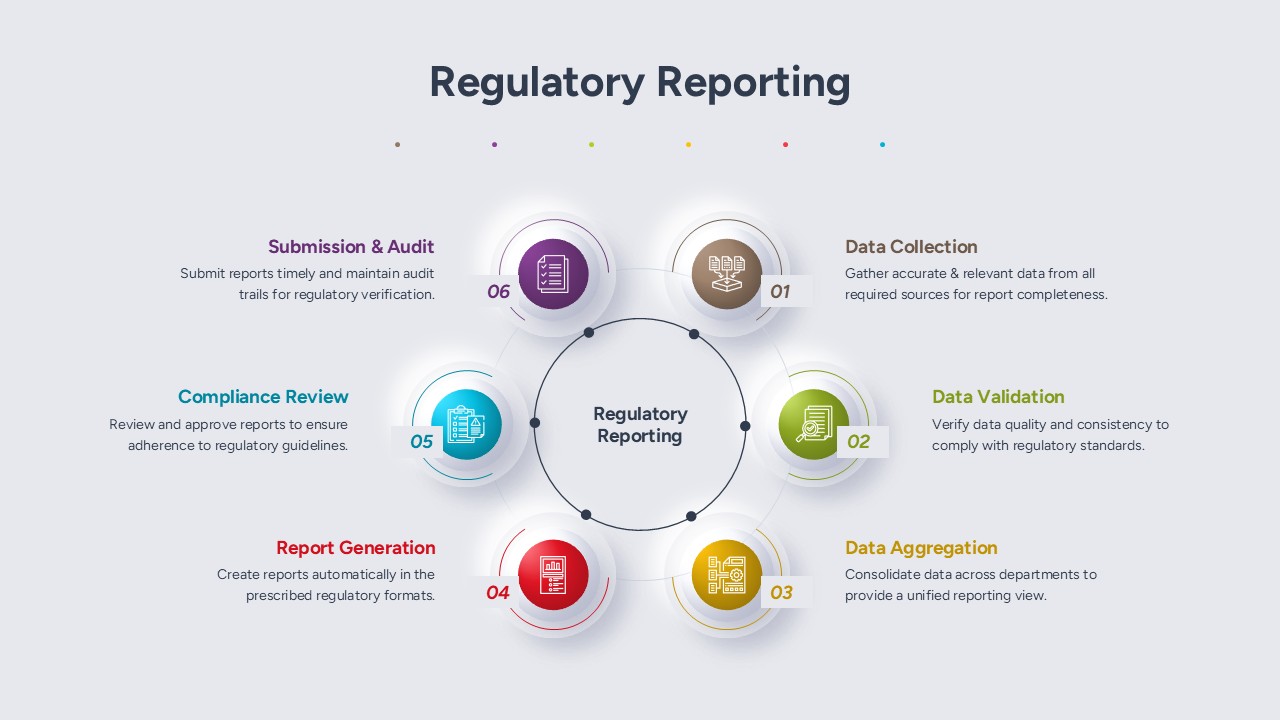
Regulatory Reporting Process Overview template for PowerPoint & Google Slides
Business
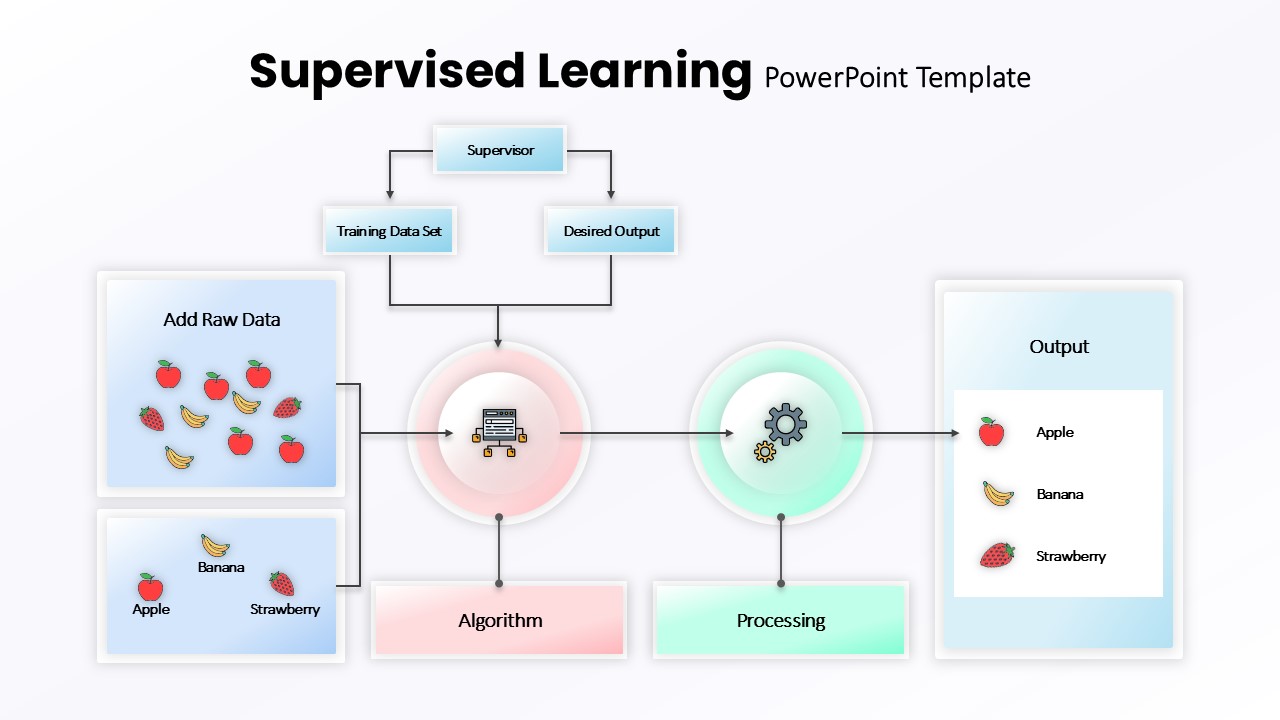
Supervised Learning Overview template for PowerPoint & Google Slides
Technology
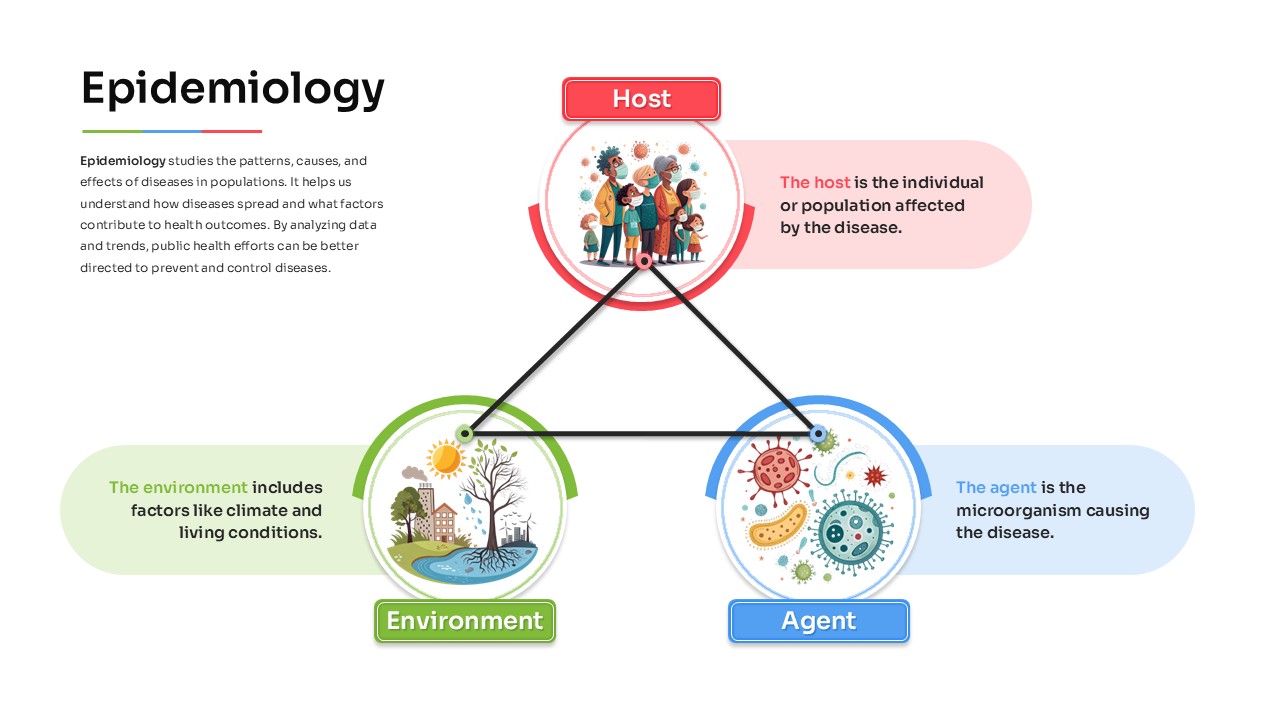
Epidemiology Overview template for PowerPoint & Google Slides
Health
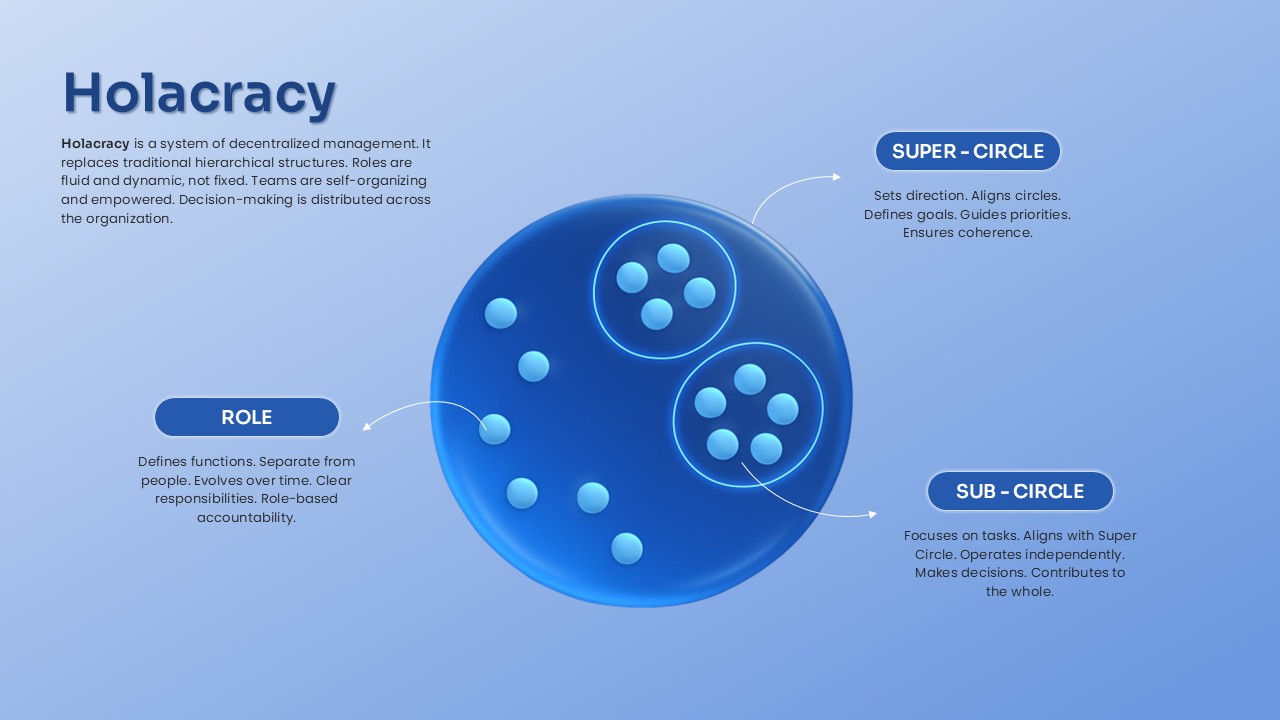
Holacracy System Overview template for PowerPoint & Google Slides
Process
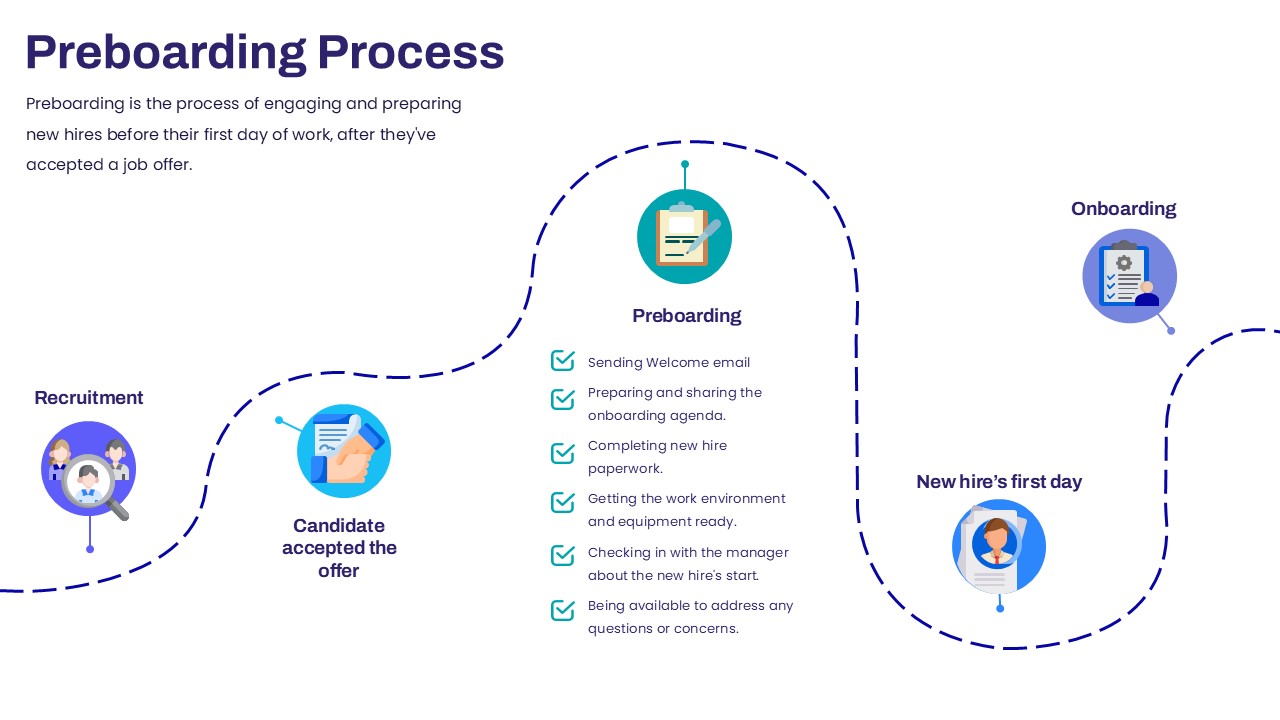
Preboarding Process Overview template for PowerPoint & Google Slides
Company Profile
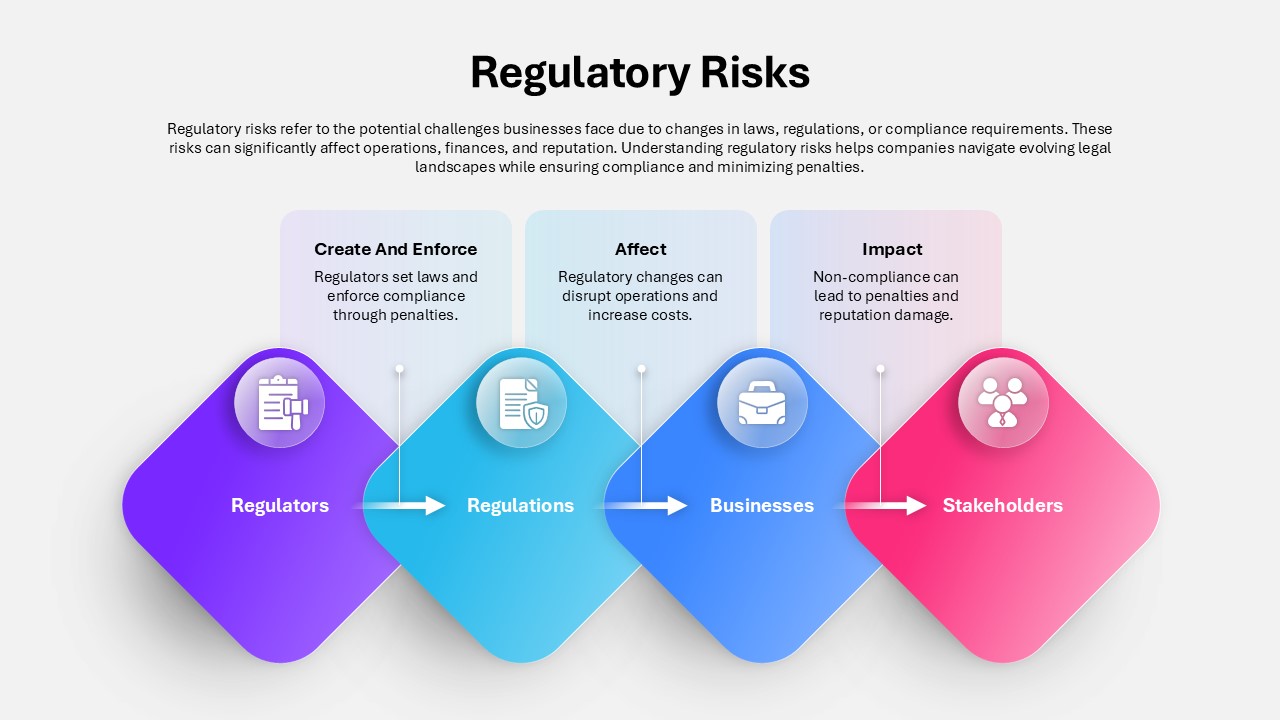
Regulatory Risks Overview template for PowerPoint & Google Slides
Process
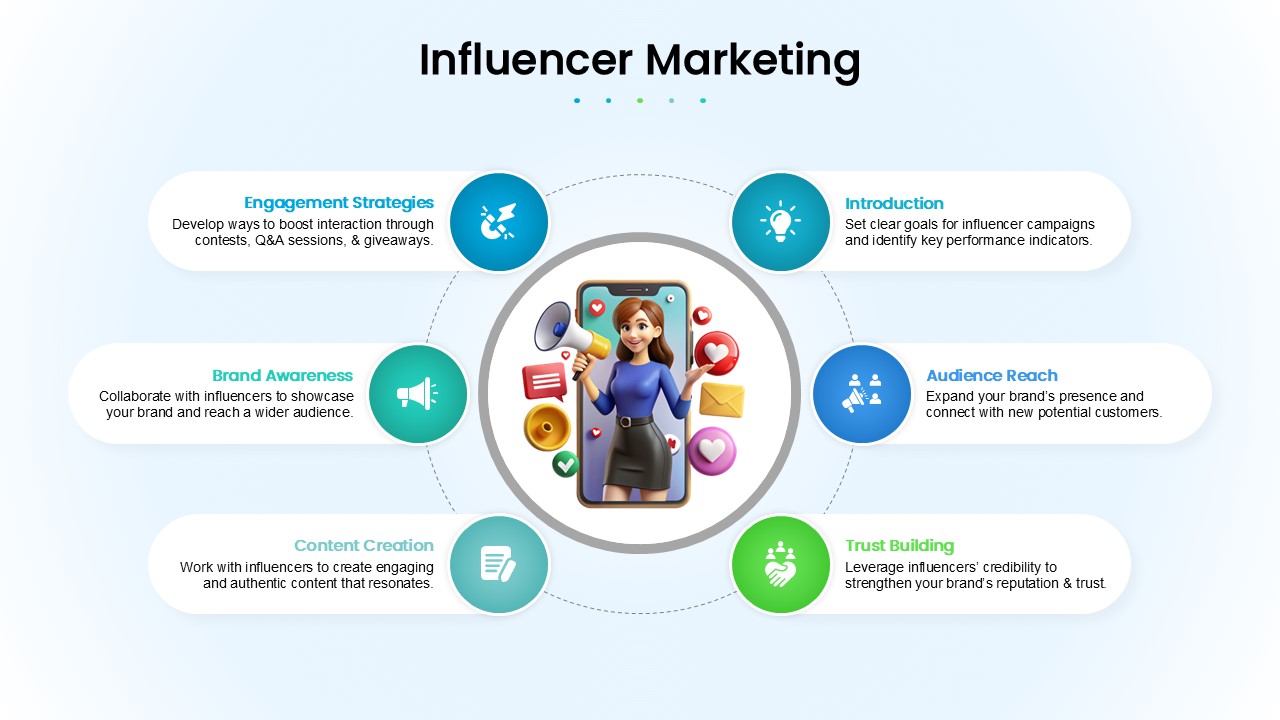
Influencer Marketing Overview template for PowerPoint & Google Slides
Business
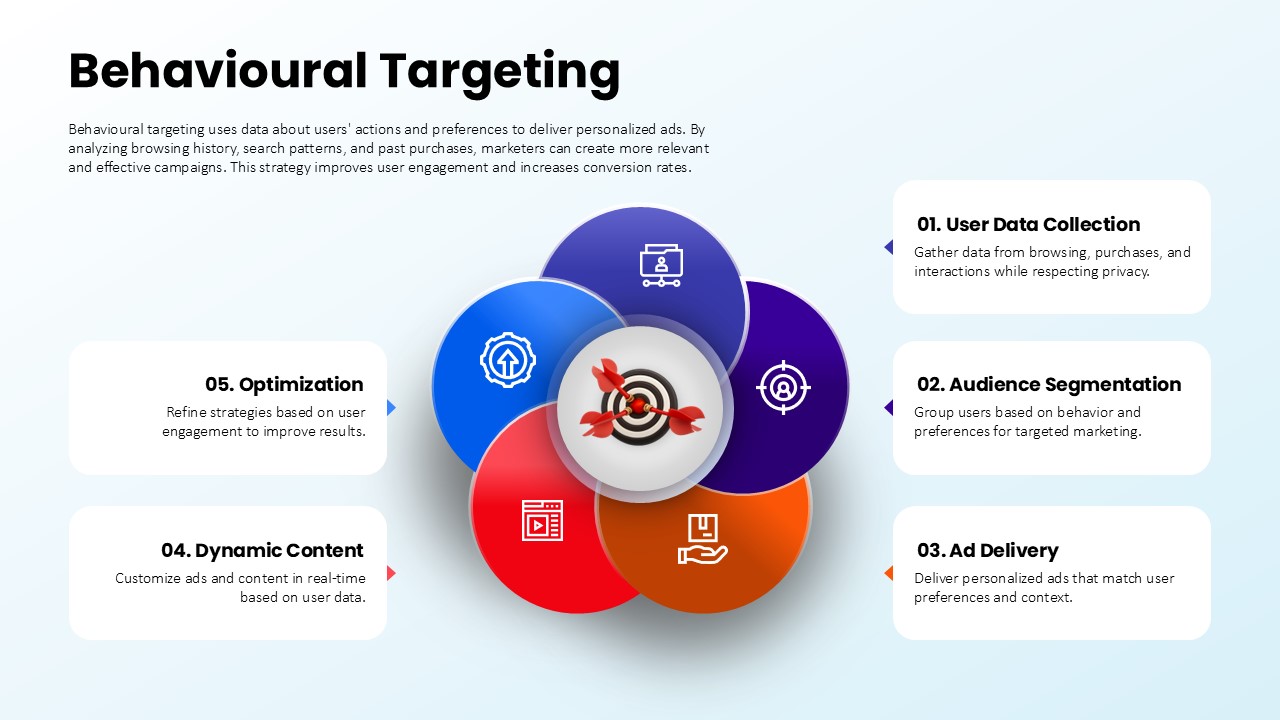
Behavioural Targeting Strategy Overview template for PowerPoint & Google Slides
Process
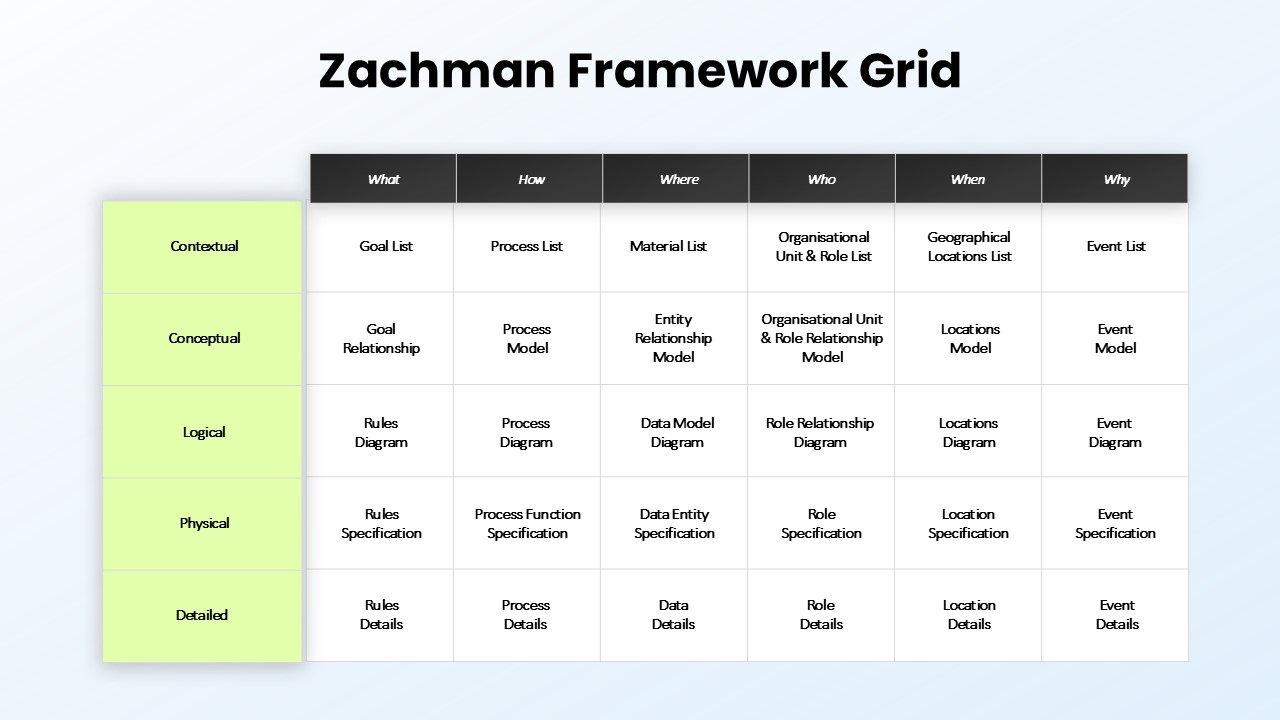
Zachman Framework Grid Overview template for PowerPoint & Google Slides
Process
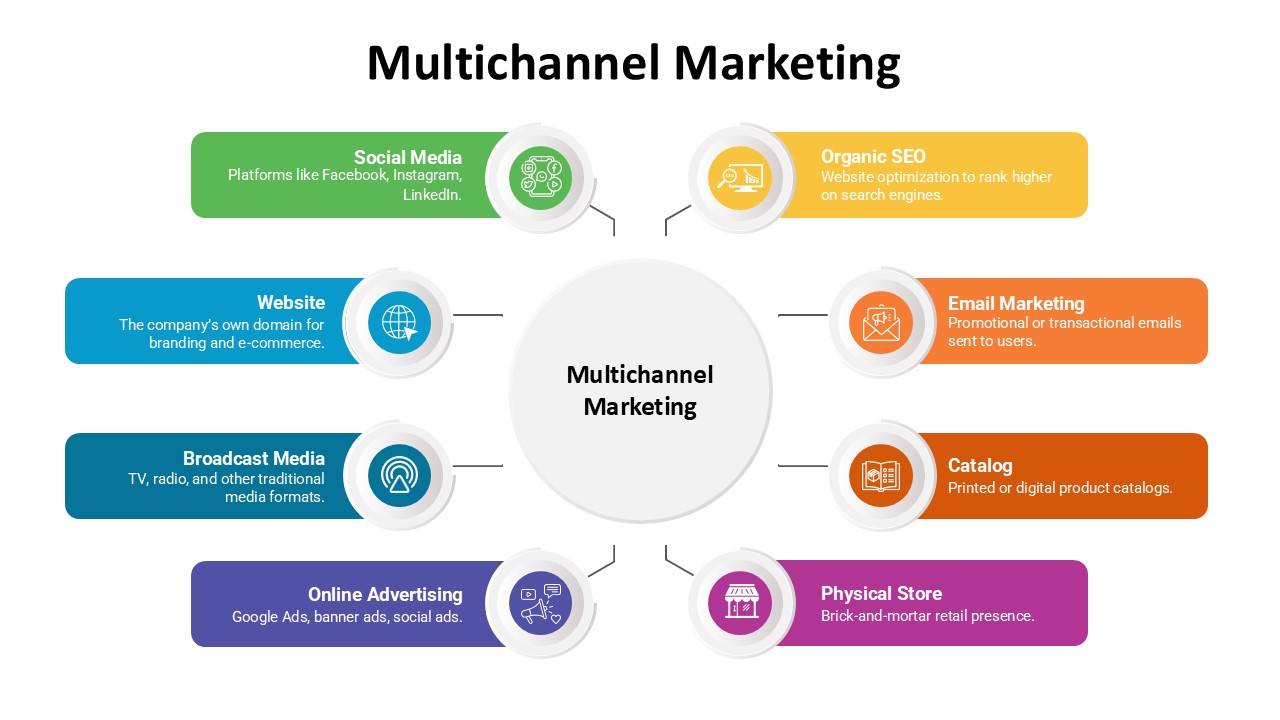
Multichannel Marketing Strategy Overview template for PowerPoint & Google Slides
Business
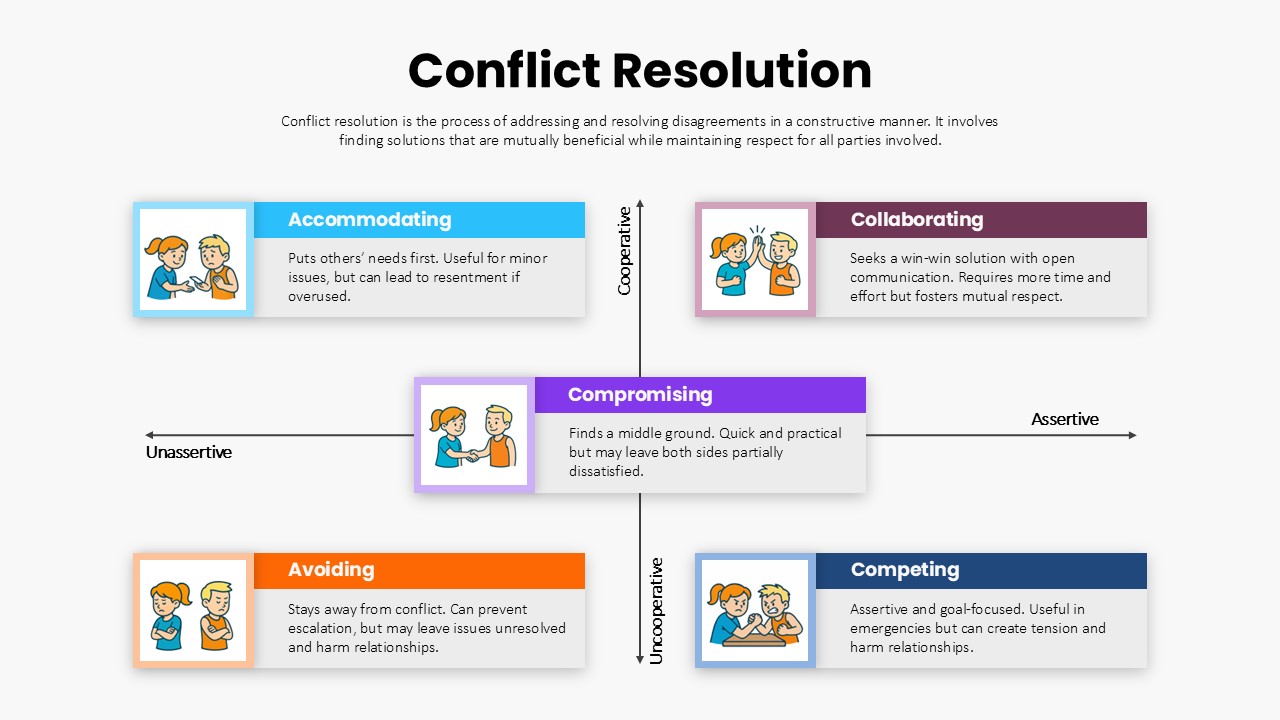
Conflict Resolution Strategies Overview template for PowerPoint & Google Slides
Process
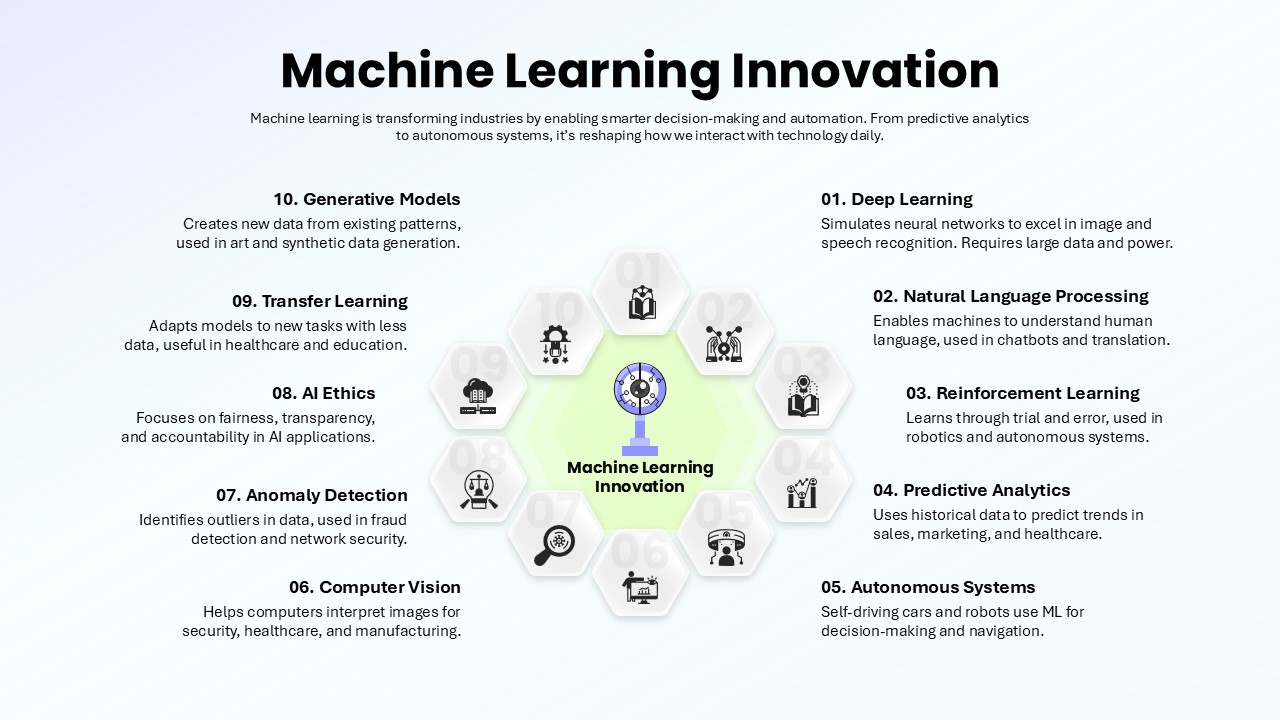
Machine Learning Innovation Overview template for PowerPoint & Google Slides
AI
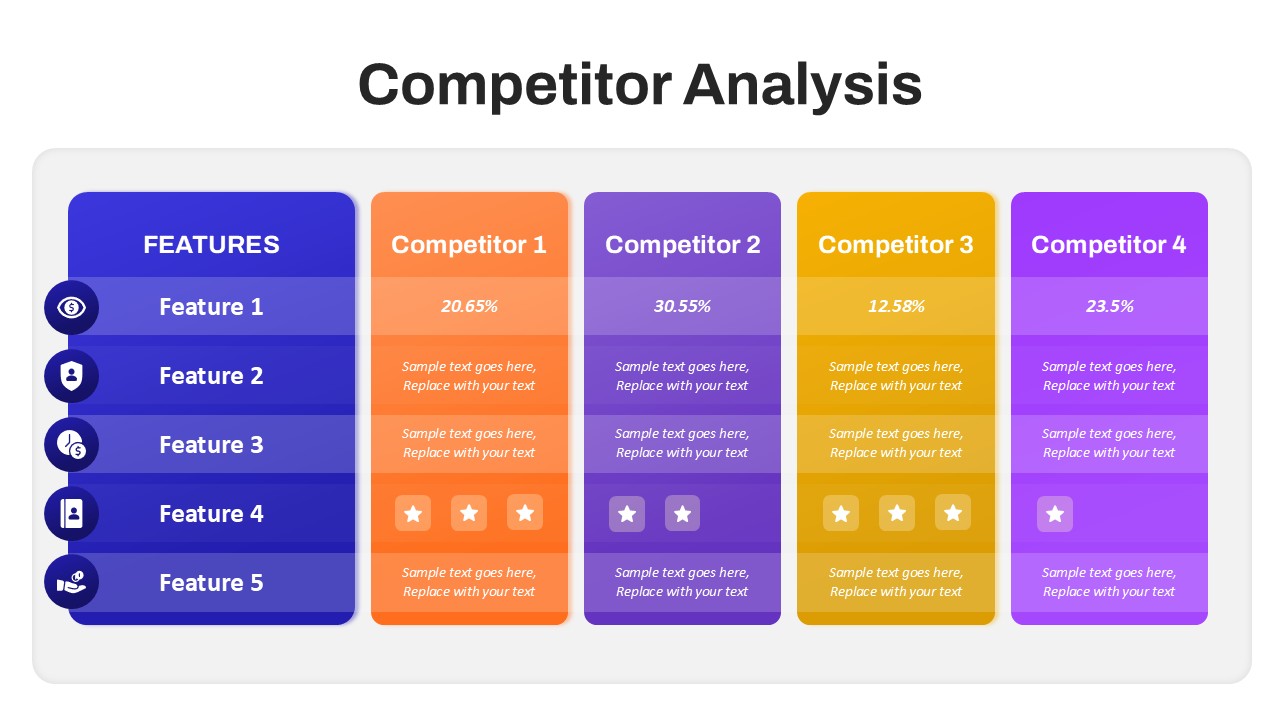
Competitor Analysis Overview template for PowerPoint & Google Slides
Competitor Analysis
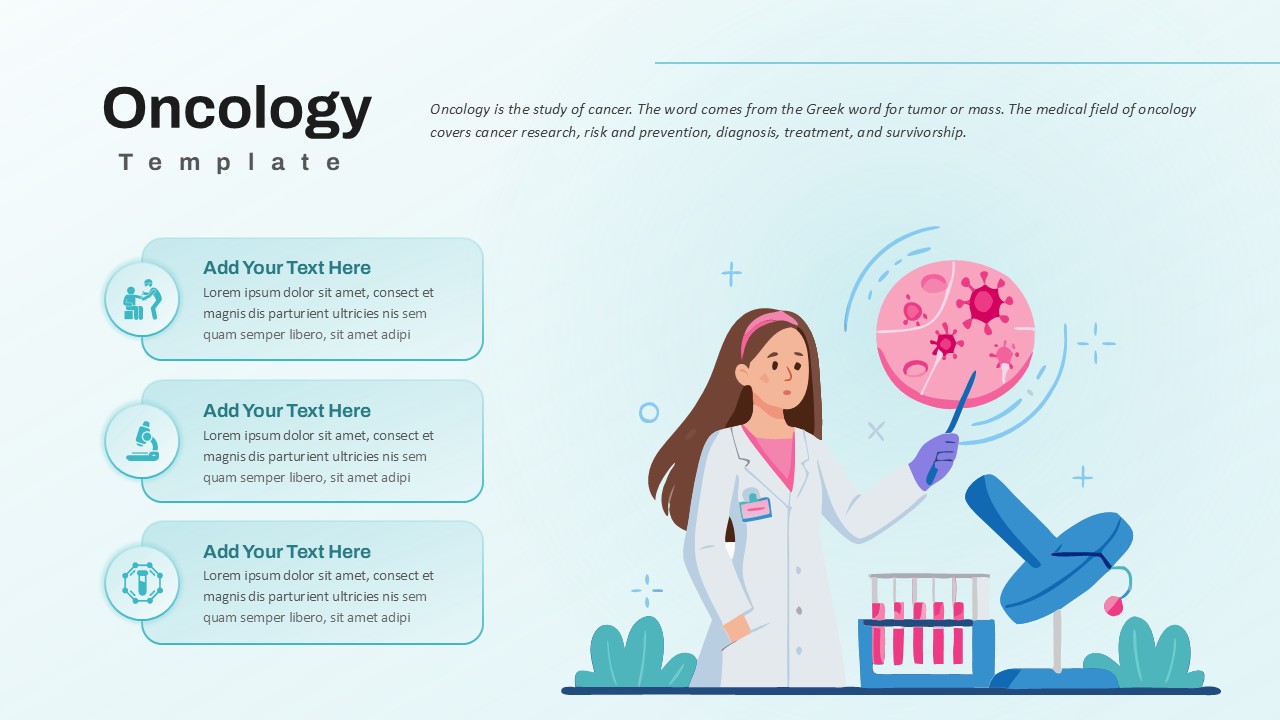
Oncology Overview template for PowerPoint & Google Slides
Health
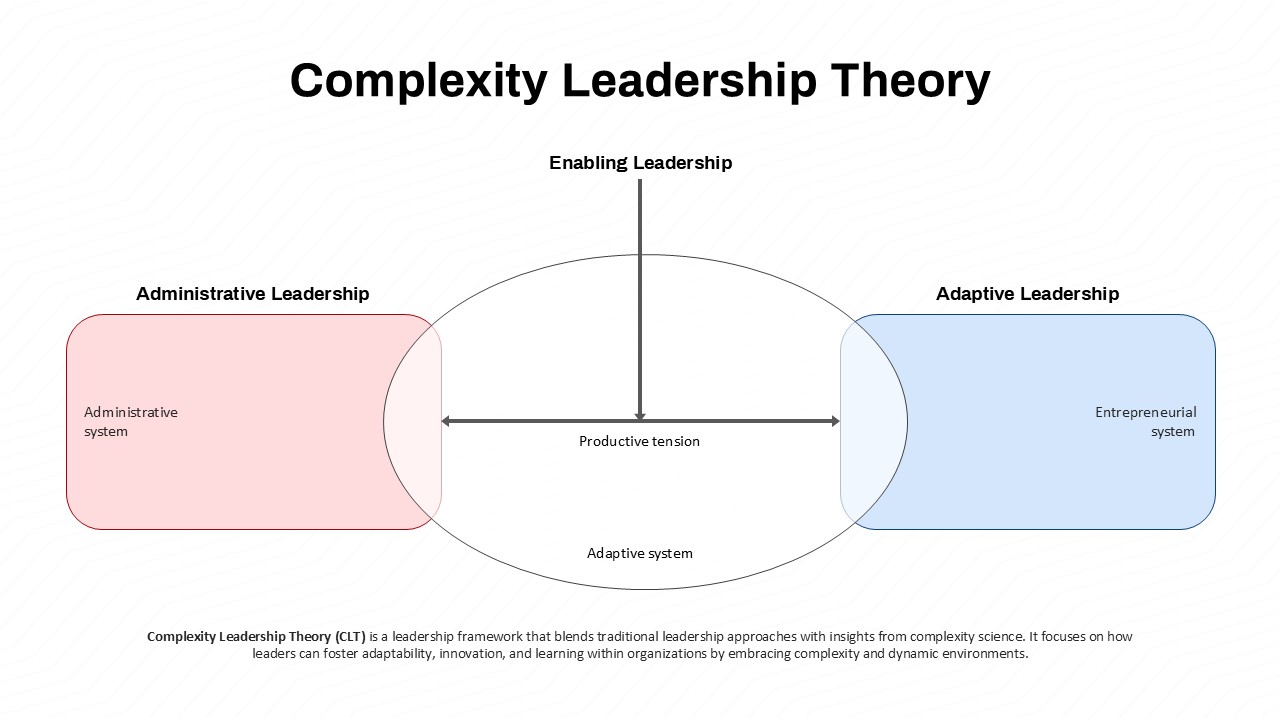
Complexity Leadership Theory Overview Template for PowerPoint & Google Slides
Leadership
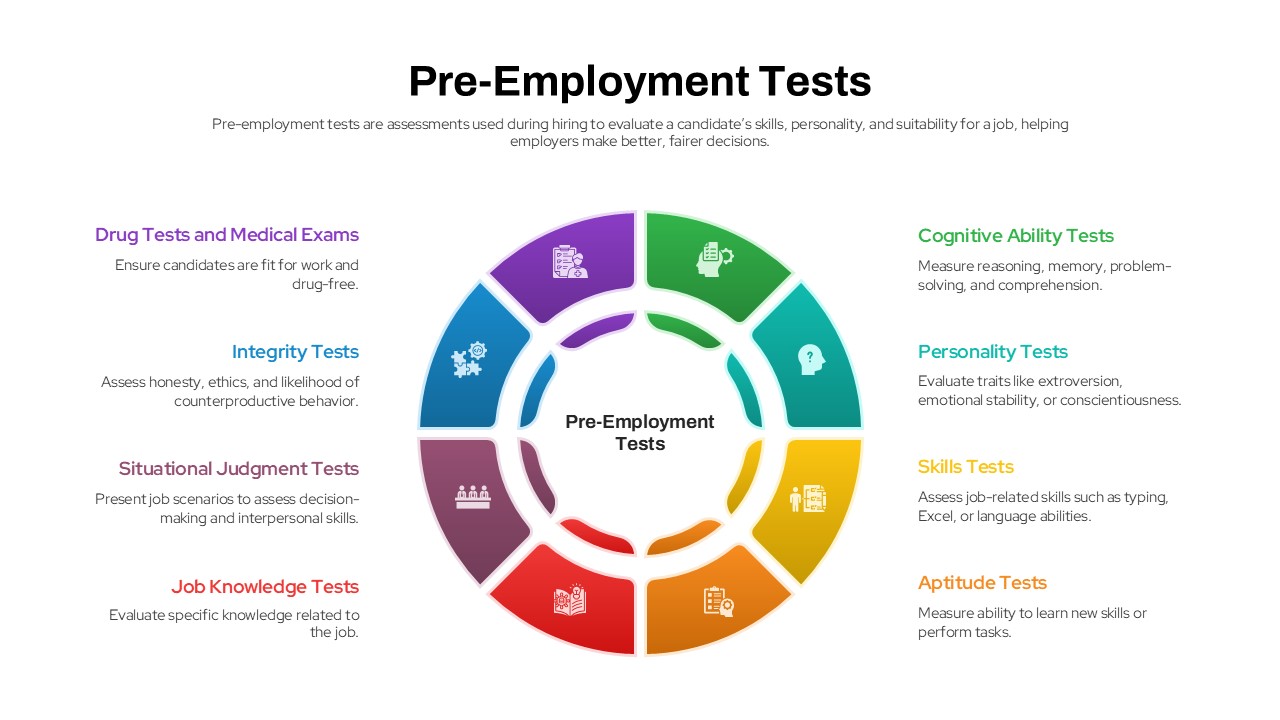
Pre-Employment Tests overview template for PowerPoint & Google Slides
Business
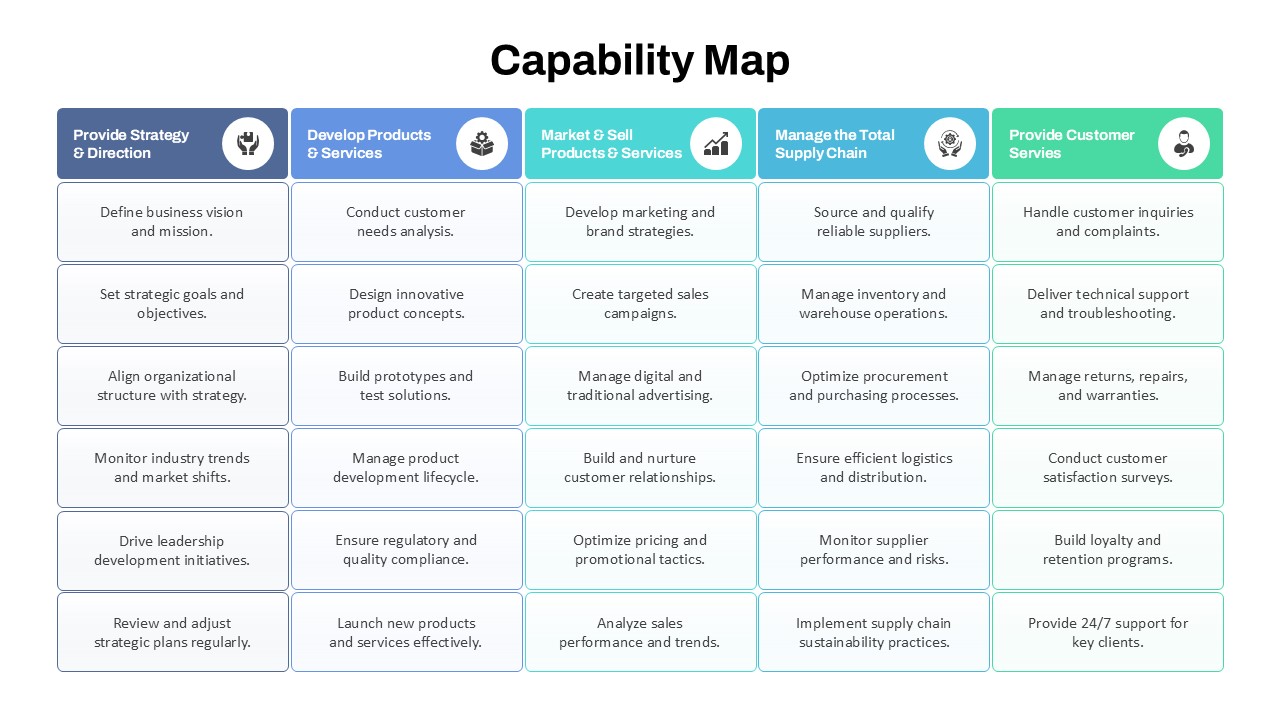
Capability Map Overview Template for PowerPoint & Google Slides
Business Strategy
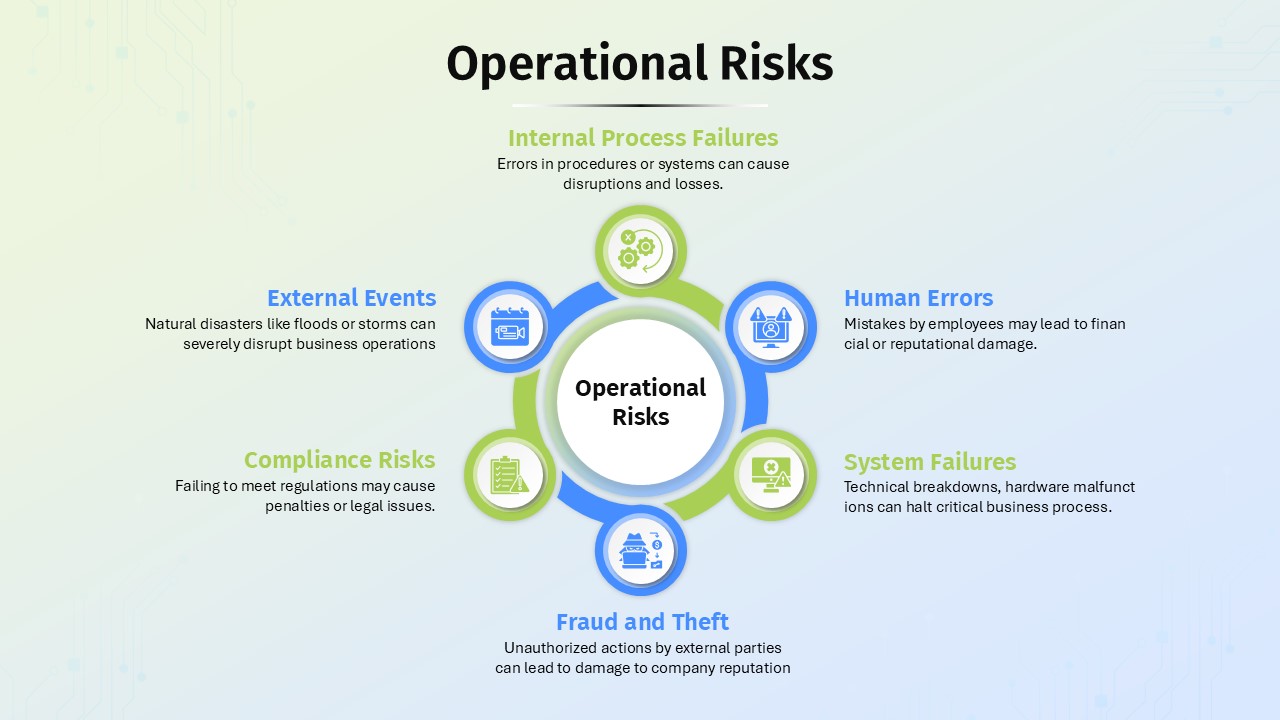
Operational Risks Overview template for PowerPoint & Google Slides
Business
3 Focus Areas Overview Template for PowerPoint & Google Slides
Process
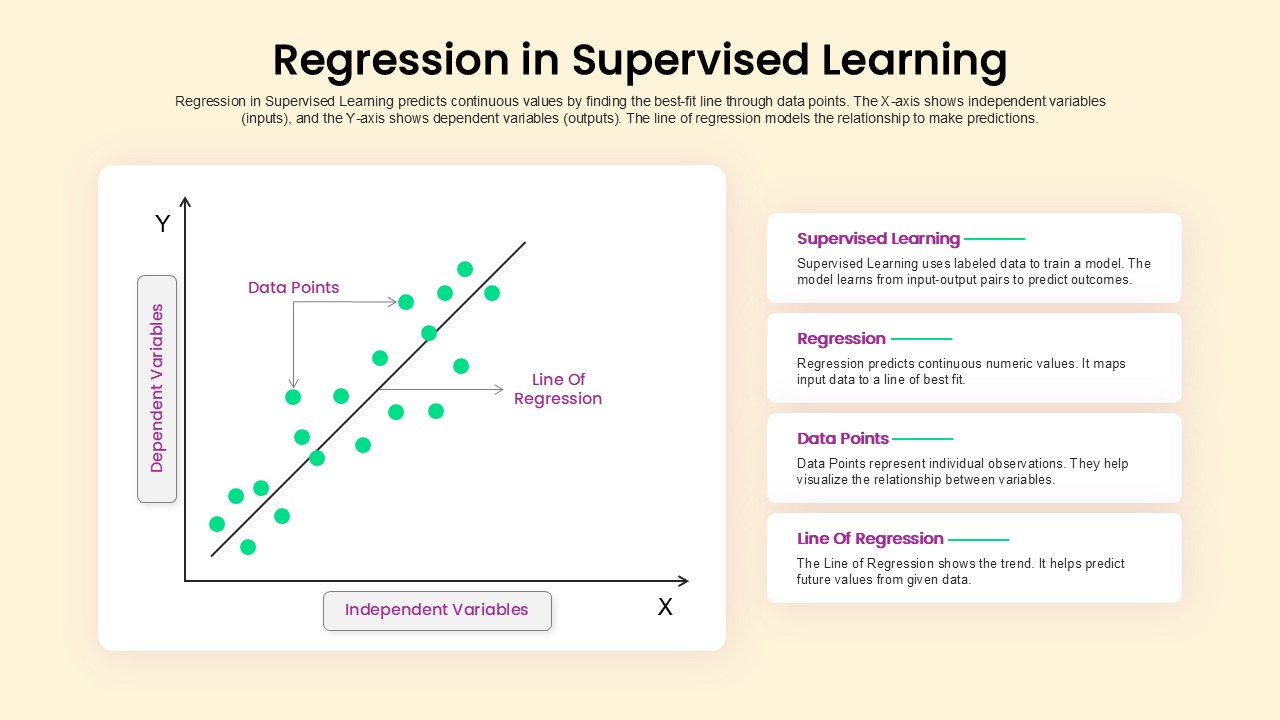
Regression in Supervised Learning Overview template for PowerPoint & Google Slides
Process
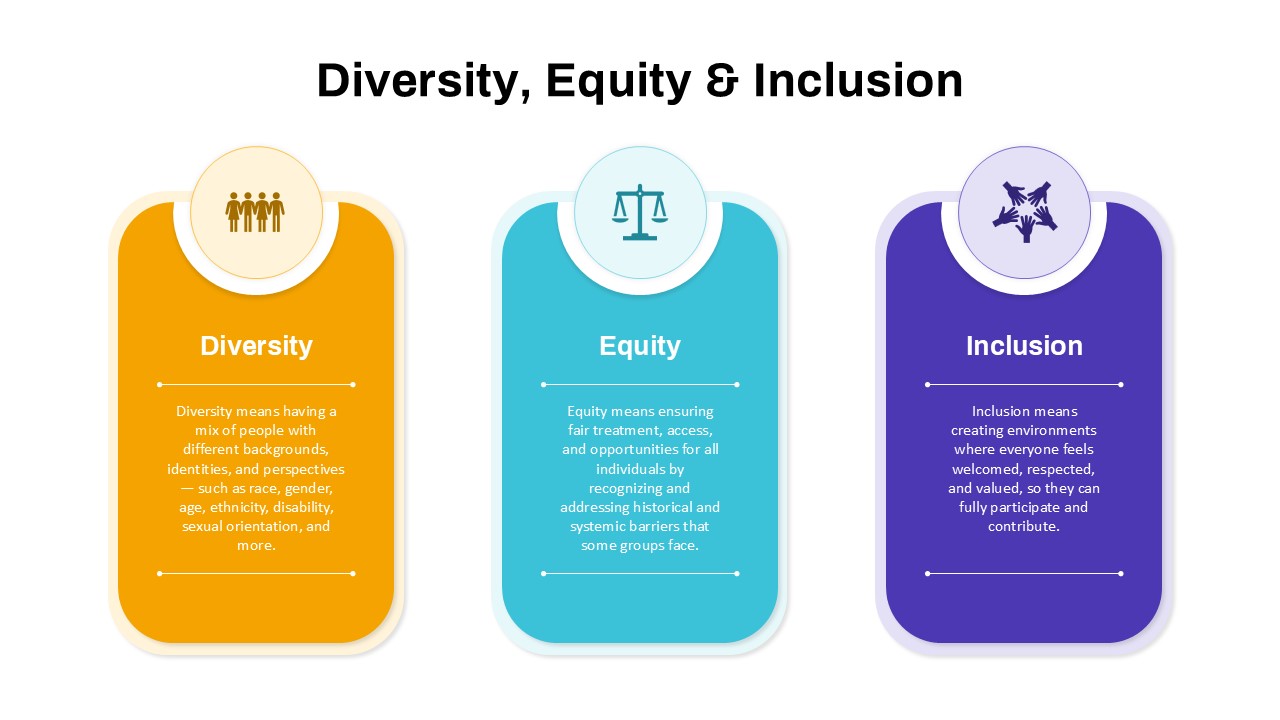
Diversity, Equity & Inclusion Overview template for PowerPoint & Google Slides
Employee Performance
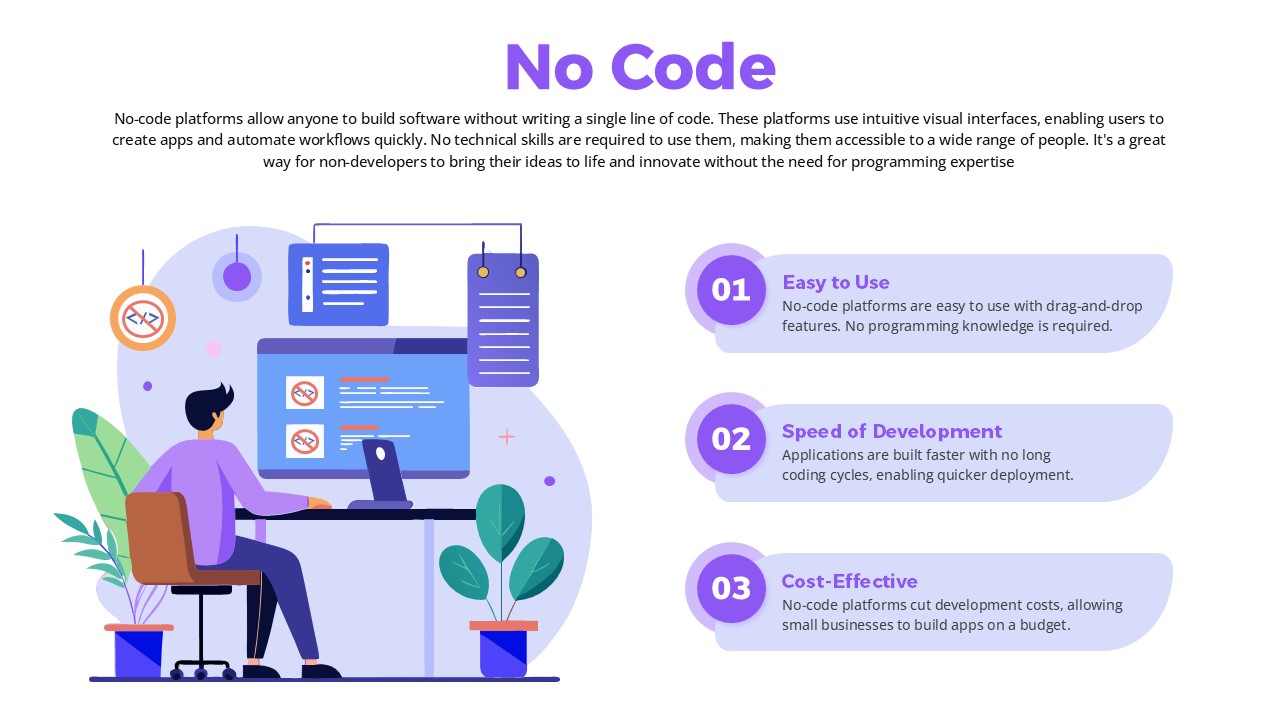
No-Code Overview with 3 Key Benefits Template for PowerPoint & Google Slides
Software Development
Personal Growth Overview Template for PowerPoint & Google Slides
Business
Civil Engineering Project Overview Deck Template for PowerPoint & Google Slides
Decks
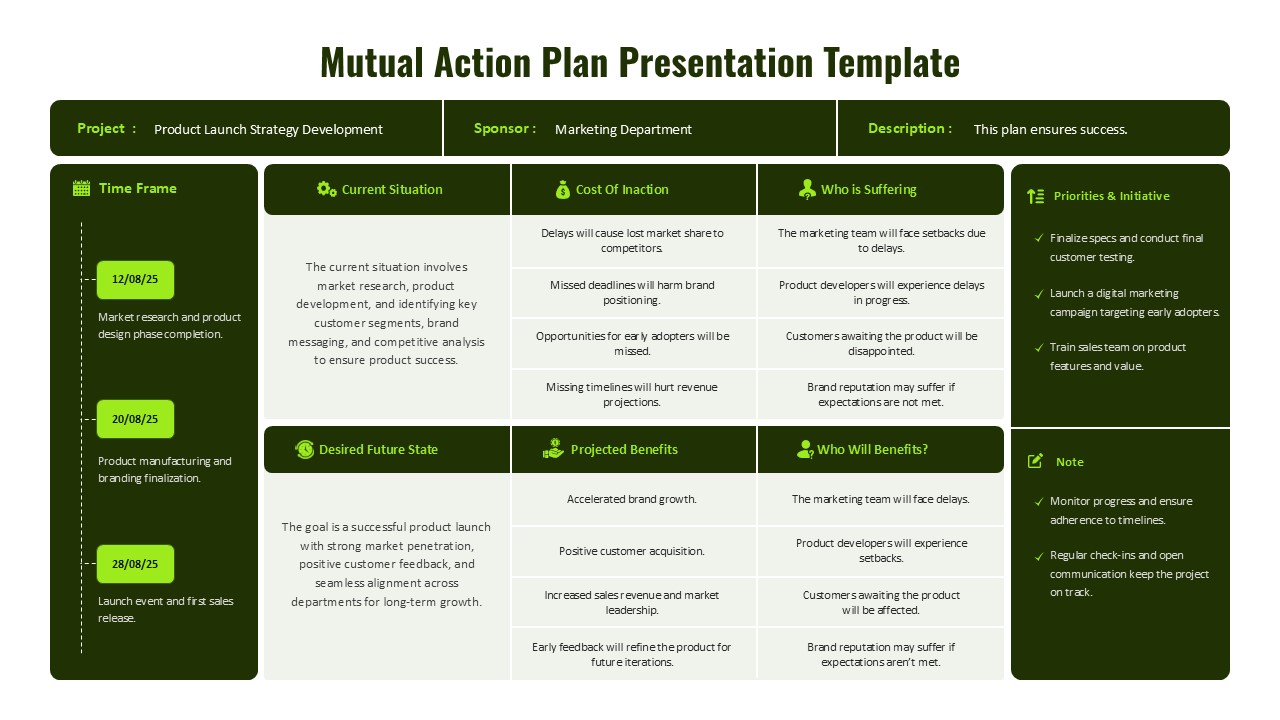
Mutual Action Plan Framework Overview Template for PowerPoint & Google Slides
Project