6-Part Circular Gear Infographic Diagram Template for PowerPoint & Google Slides


Description
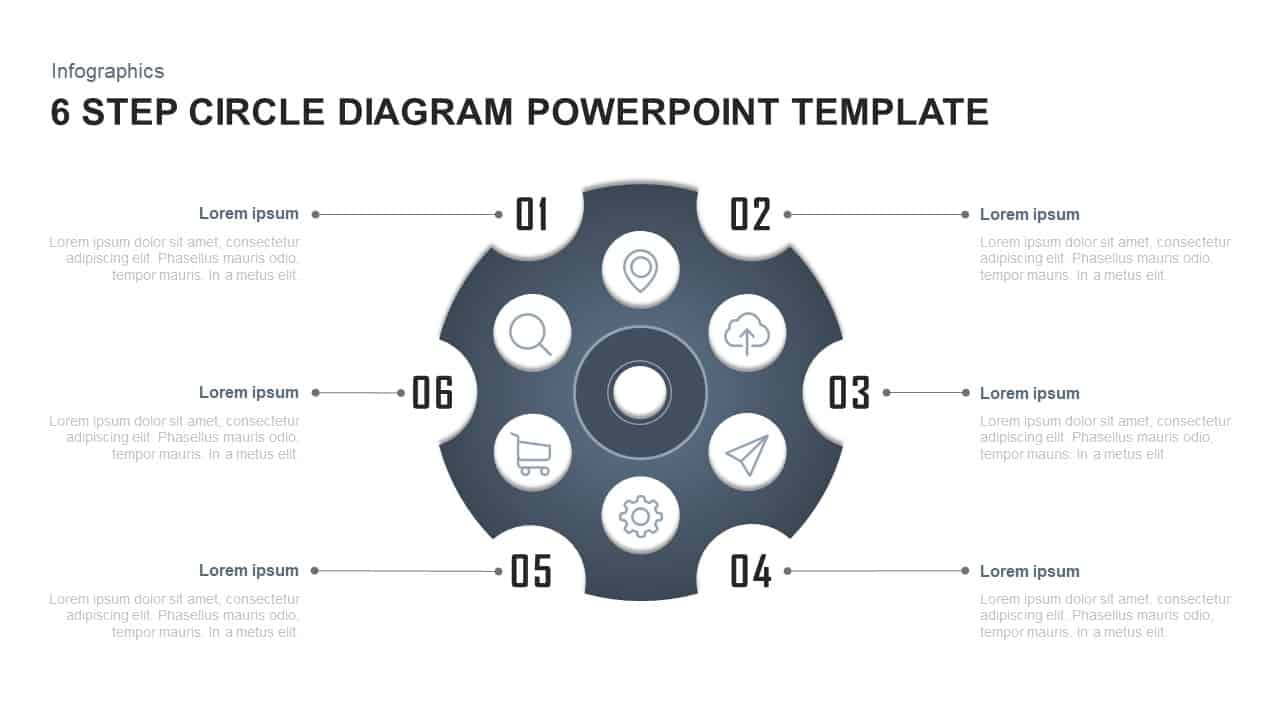
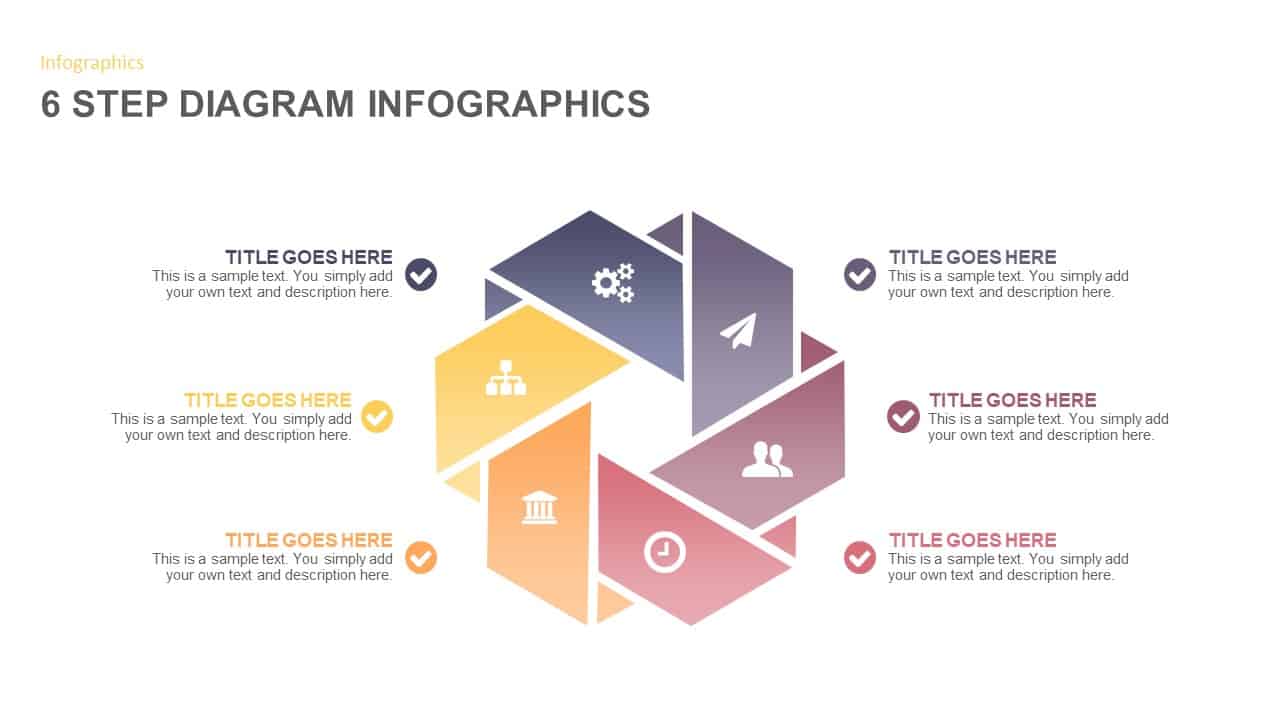
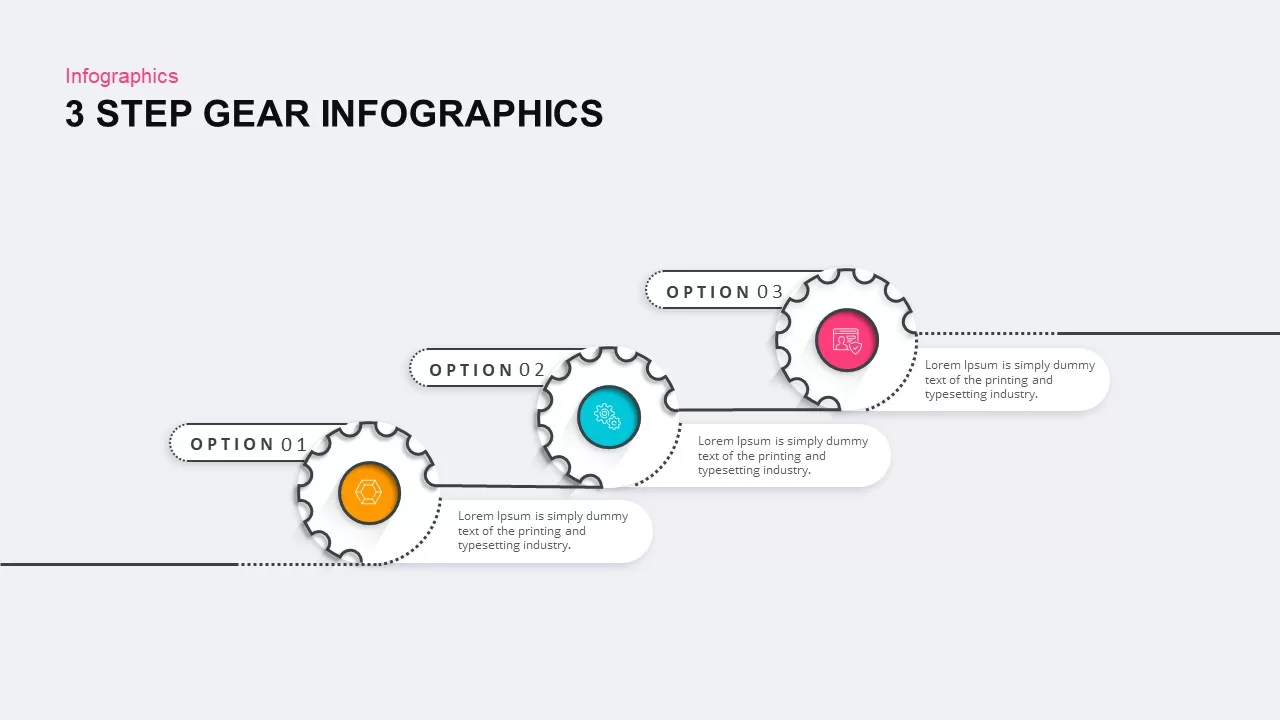
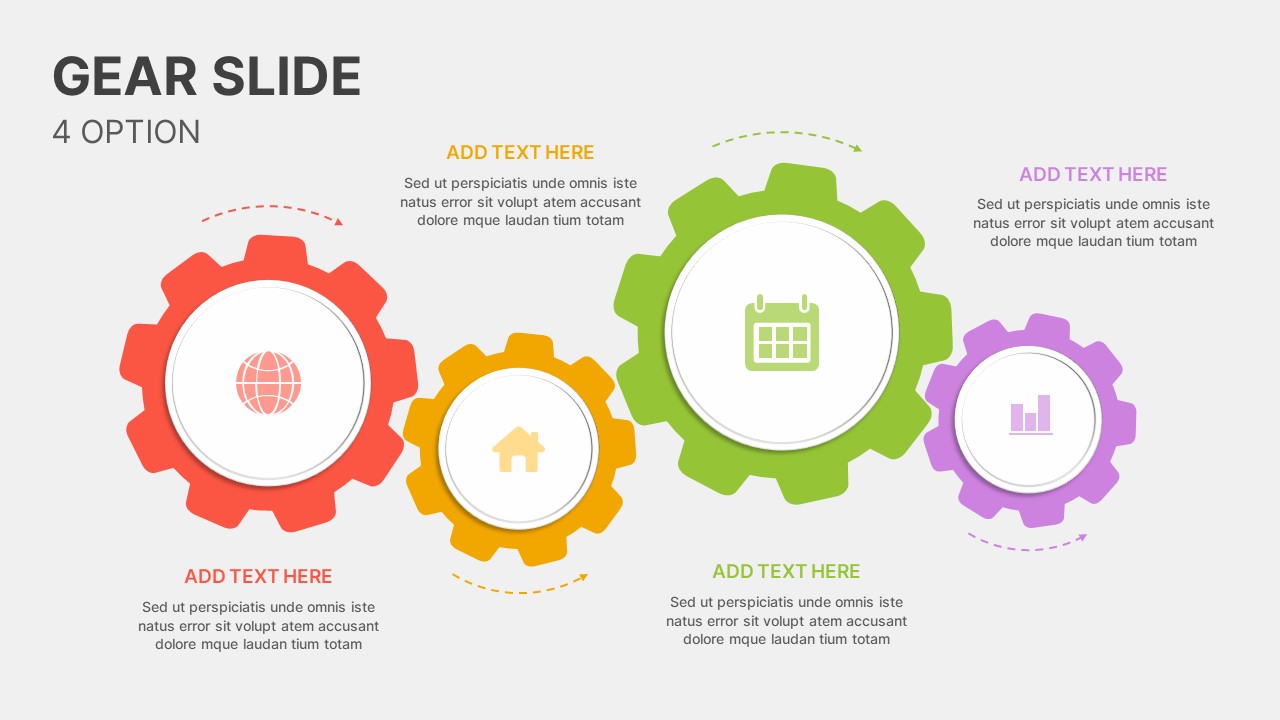
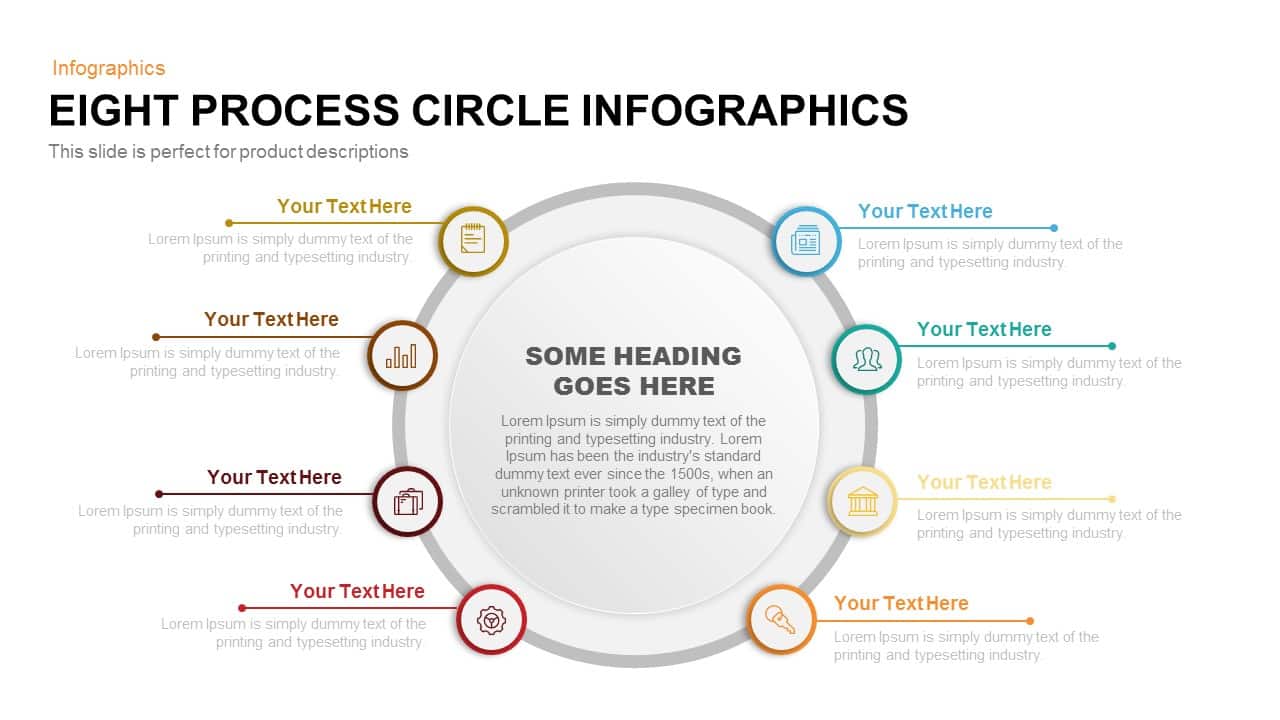
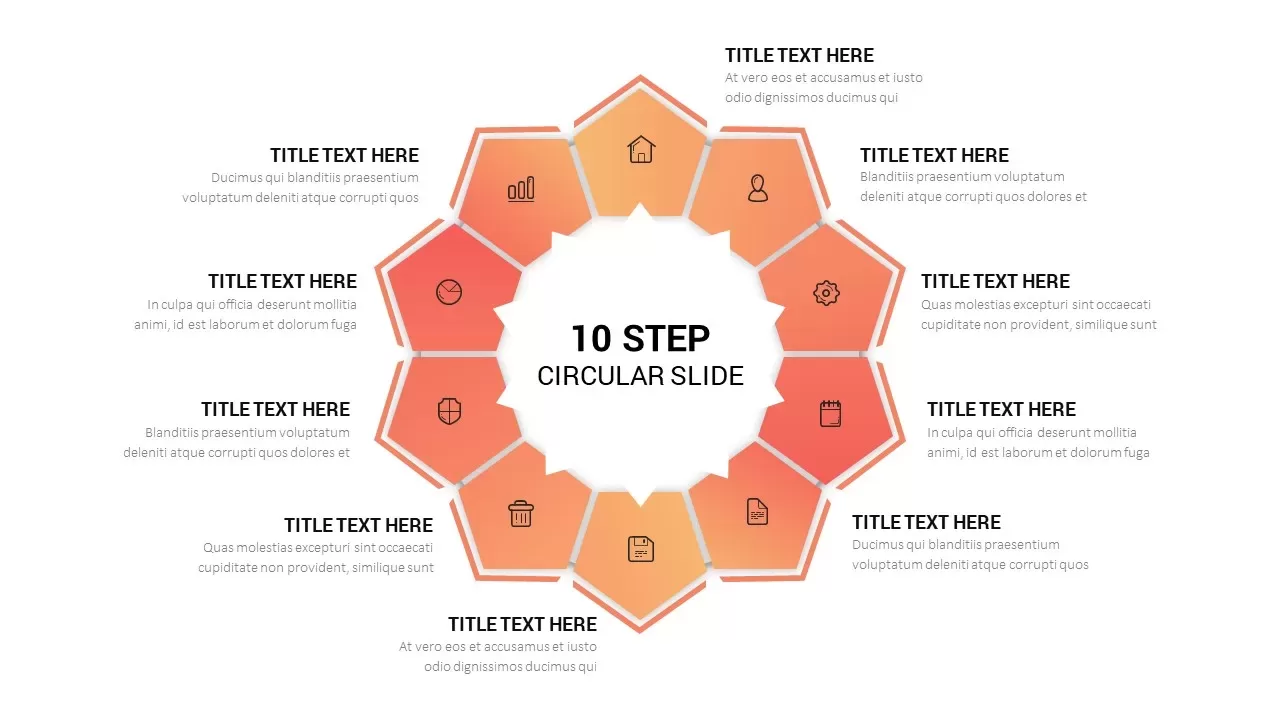
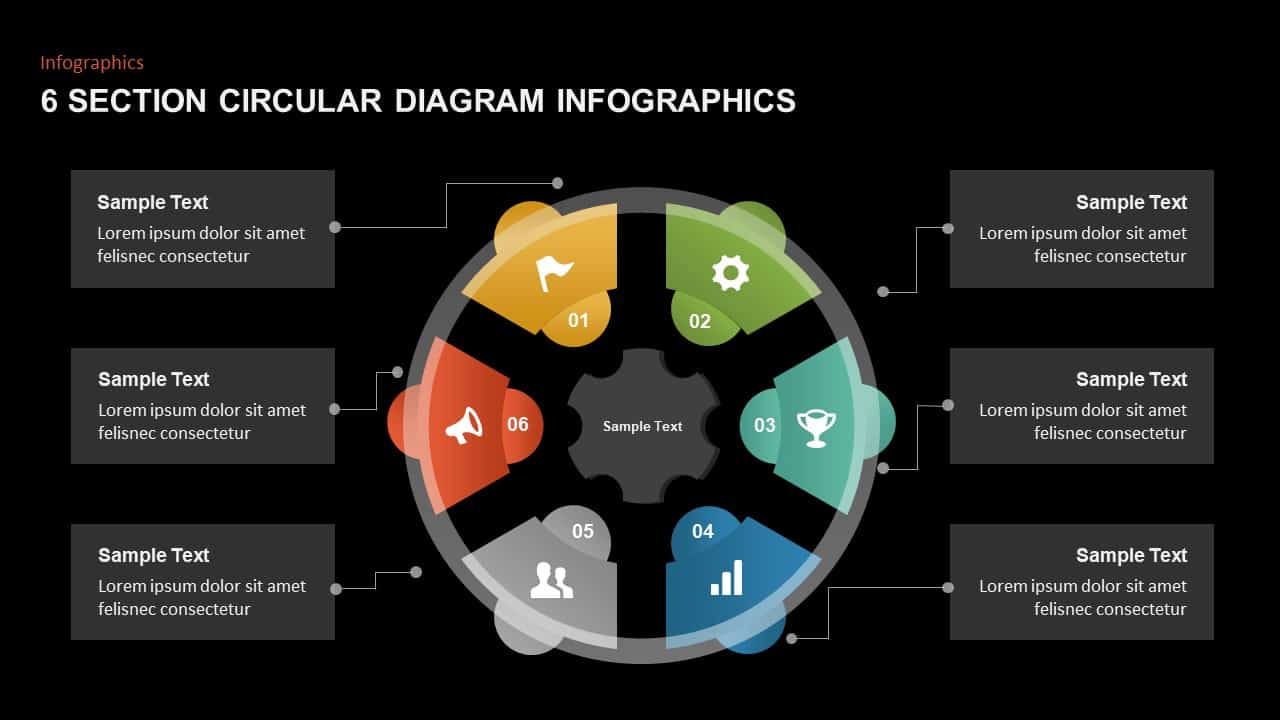
This 6-part circular gear infographic slide is designed to visually organize complex processes or stages into a cohesive and engaging format. Each of the six segments is shaped like a gear tooth and assigned a distinct color—orange, red, green, blue, cyan, and gray—making it easy to distinguish between different components or phases. Centered around a core gear icon, the layout suggests connectivity, teamwork, and continuity, making it ideal for process flows, strategic frameworks, or business cycles.
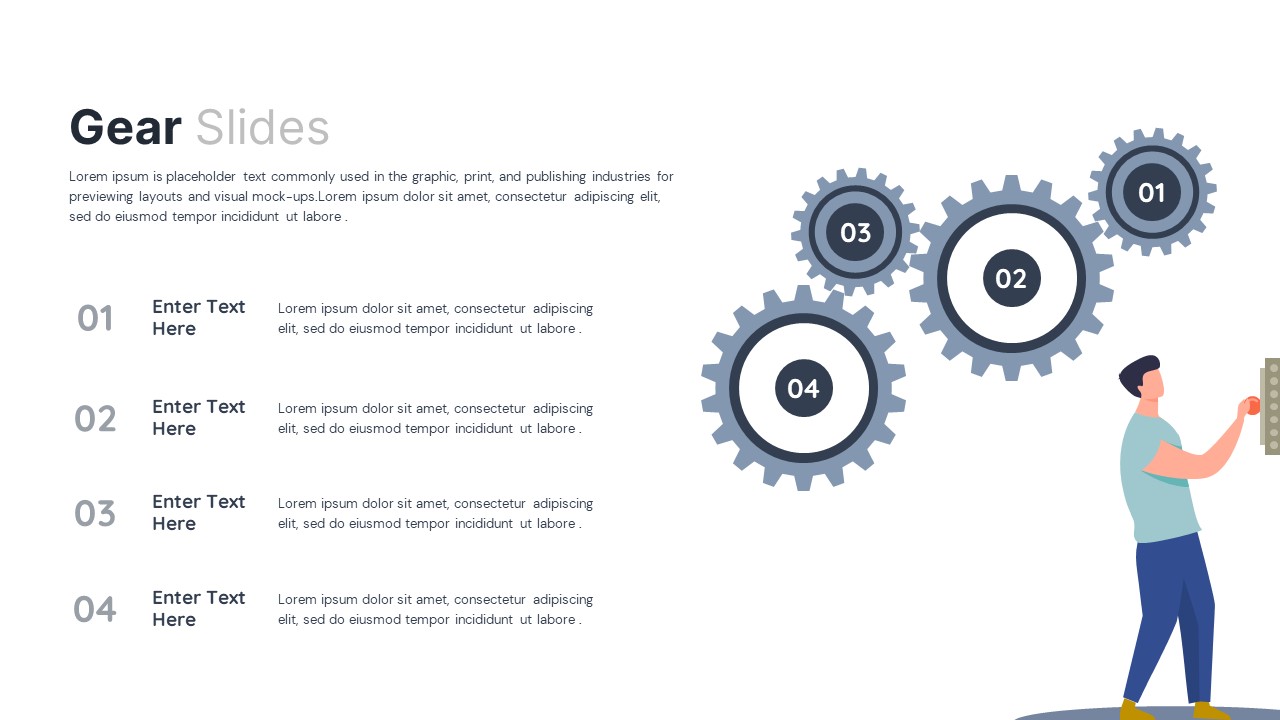
Each section includes a bold icon, title, and editable text box that can be used to label steps, departments, or objectives. The radial design naturally guides the viewer’s eye from the center outward or around the circular path, enhancing narrative flow during presentations. With sleek lines, shadows, and a subtle gradient background, the modern aesthetic ensures visual appeal without distracting from your message.
Fully editable in both PowerPoint and Google Slides, this infographic slide allows for fast customization—adjust colors to match your branding, replace icons to suit your topic, or expand sections for greater detail. Whether you’re illustrating a 6-step methodology, project lifecycle, or team structure, this gear-based design will keep your audience engaged and focused.
Who is it for
Ideal for project managers, business consultants, marketing strategists, and operations leads who need to present cyclical processes or segmented frameworks. Trainers and educators can also use this diagram to explain modular content or interconnected systems clearly.
Other Uses
Beyond corporate use, this slide is effective in education, supply chain management, or healthcare to depict continuous improvement cycles, curriculum maps, or patient care stages. It can also serve as a visual roadmap for onboarding programs or customer experience journeys.
Login to download this file

Item ID
SB01608
Related Templates

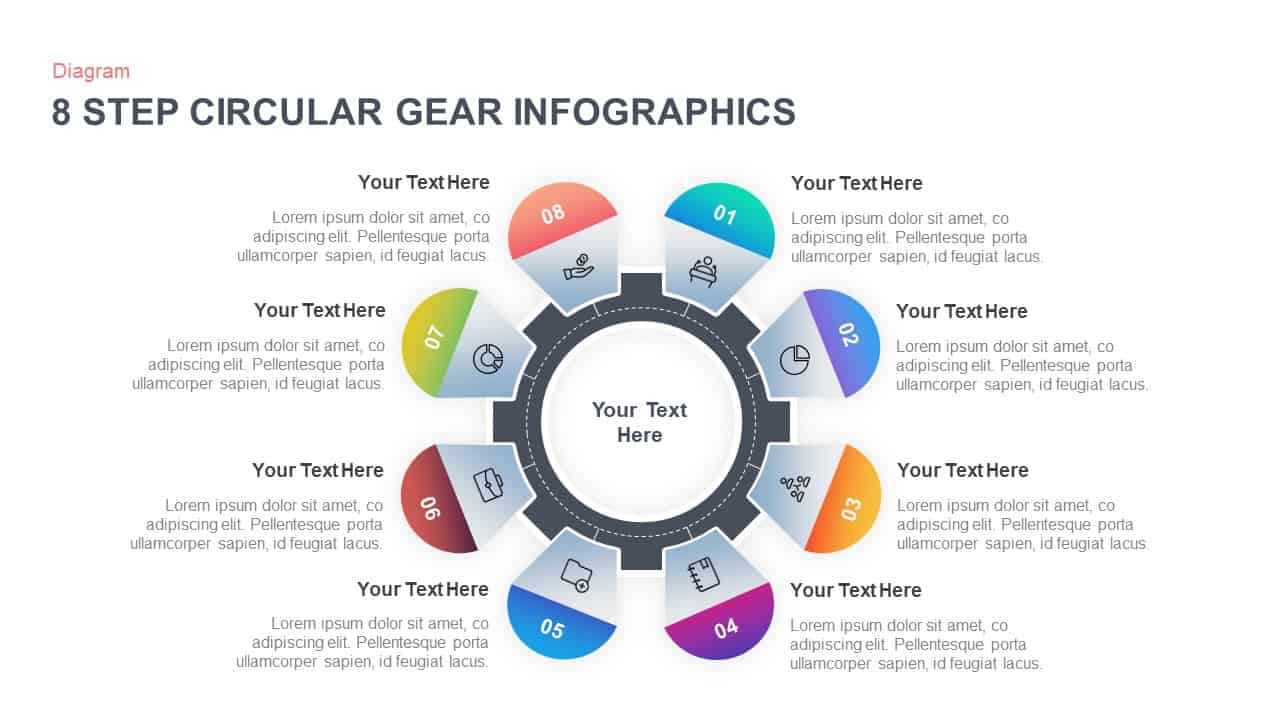
8-Step Circular Gear Infographic Diagram Template for PowerPoint & Google Slides
Circular
8-Step Circular Gear Infographics Diagram for PowerPoint & Google Slides
Process
Modern Gear Venn Diagram Infographic Template for PowerPoint & Google Slides
Comparison

Support Services Gear Infographic Template for PowerPoint & Google Slides
Business

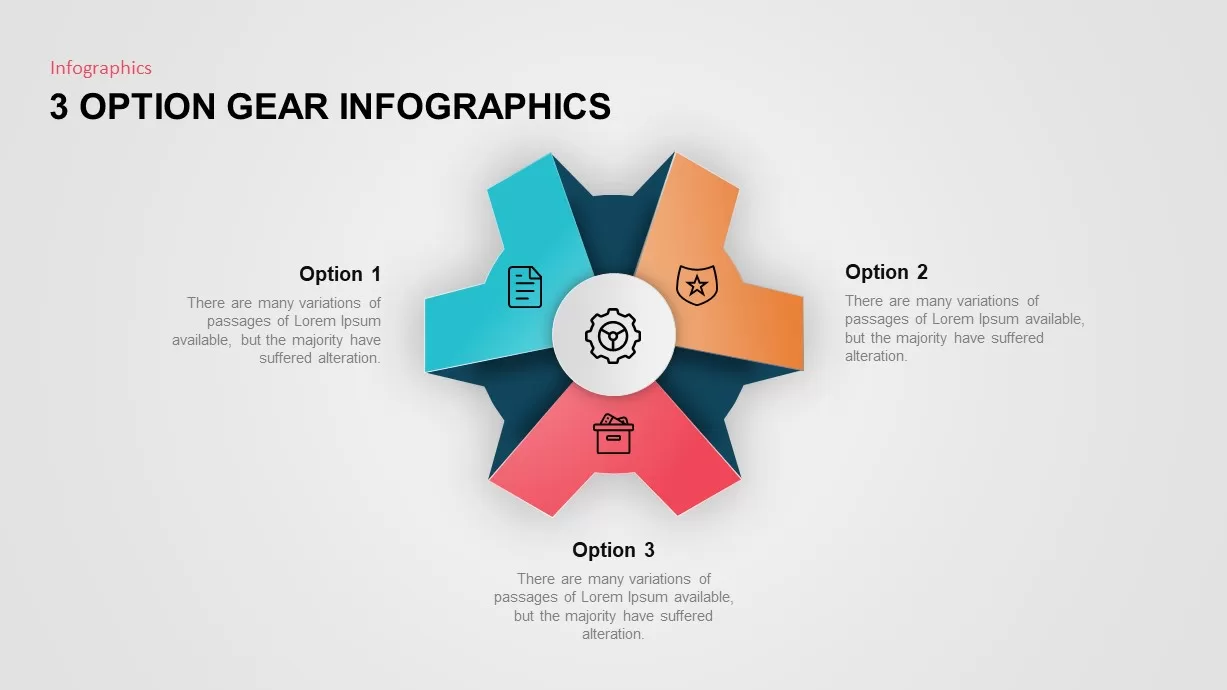
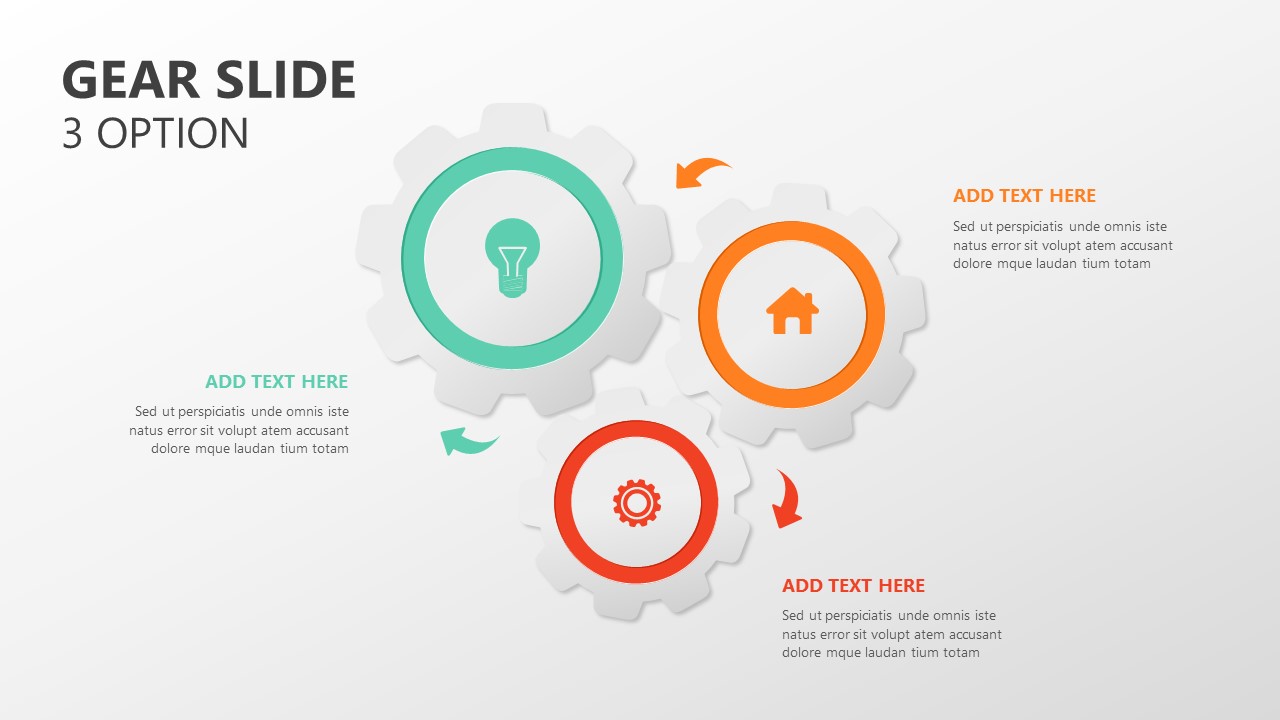
Three-Option Gear Infographic Pro Template for PowerPoint & Google Slides
Process
Three-Phase Planning Gear Infographic Template for PowerPoint & Google Slides
Process
Animated Multi-Gear Cluster Infographic Template for PowerPoint & Google Slides
Process
Six Colorful Gear Shapes Infographic Template for PowerPoint & Google Slides
Process
Free
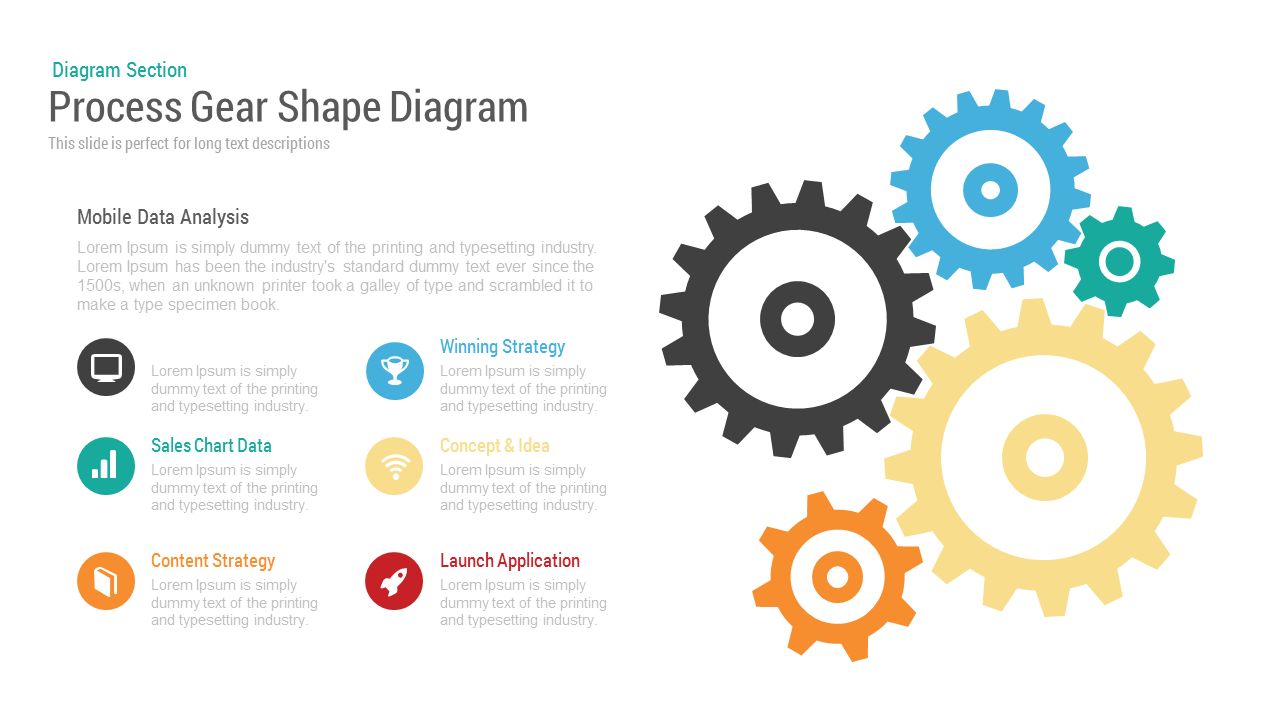
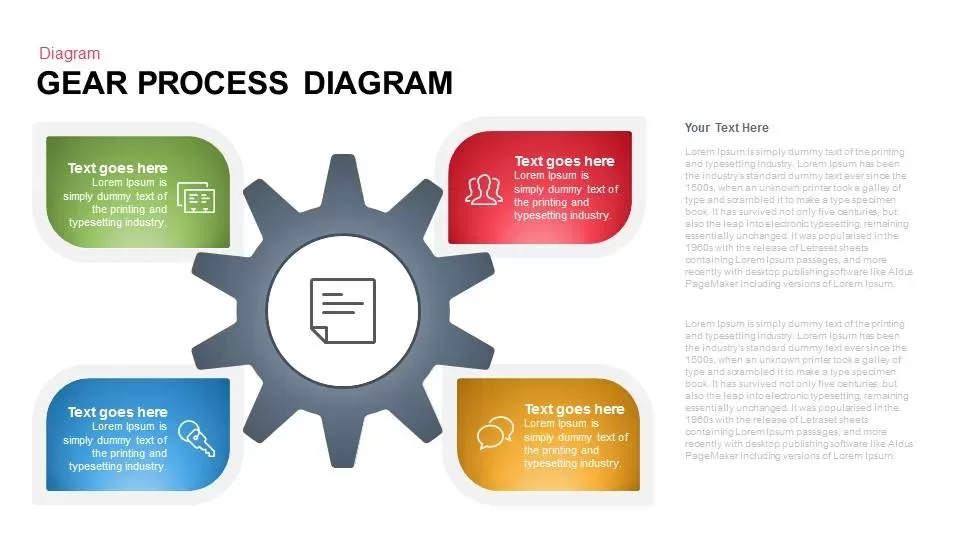
Gear Process Diagram PowerPoint Template for PowerPoint & Google Slides
Process
Gear Process Diagram template for PowerPoint & Google Slides
Process
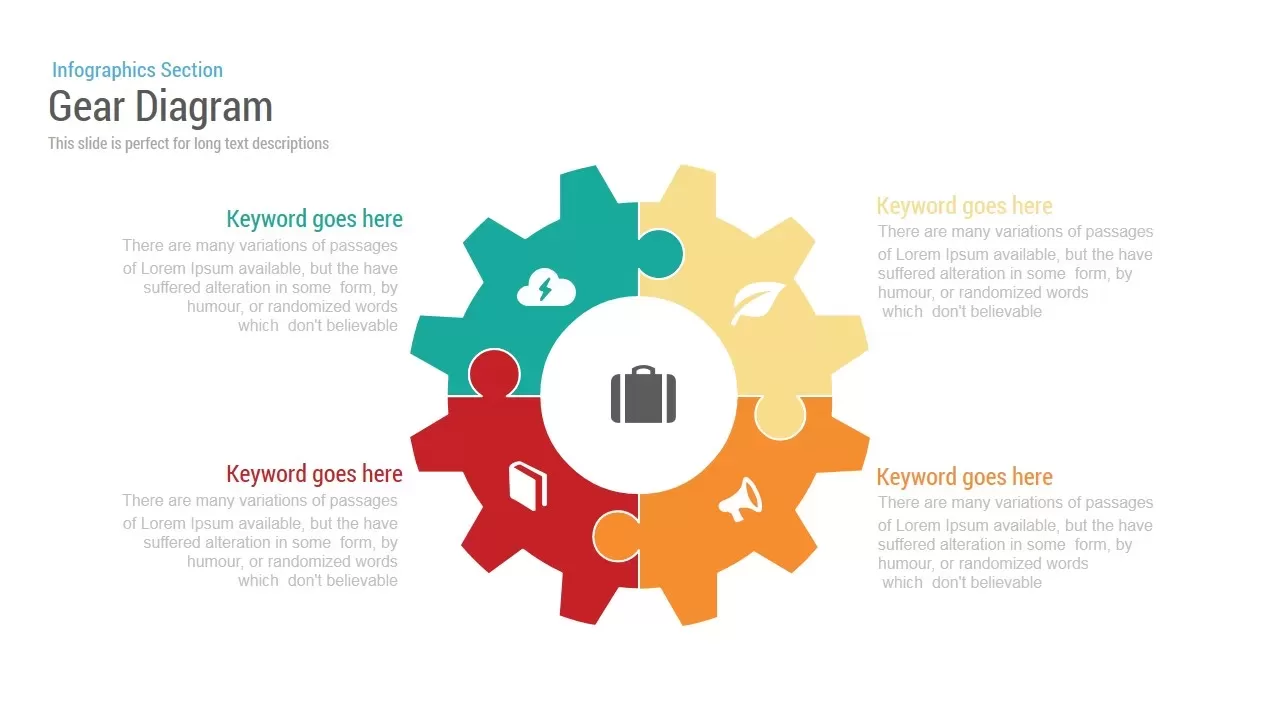
Gear Diagram template for PowerPoint & Google Slides
Process
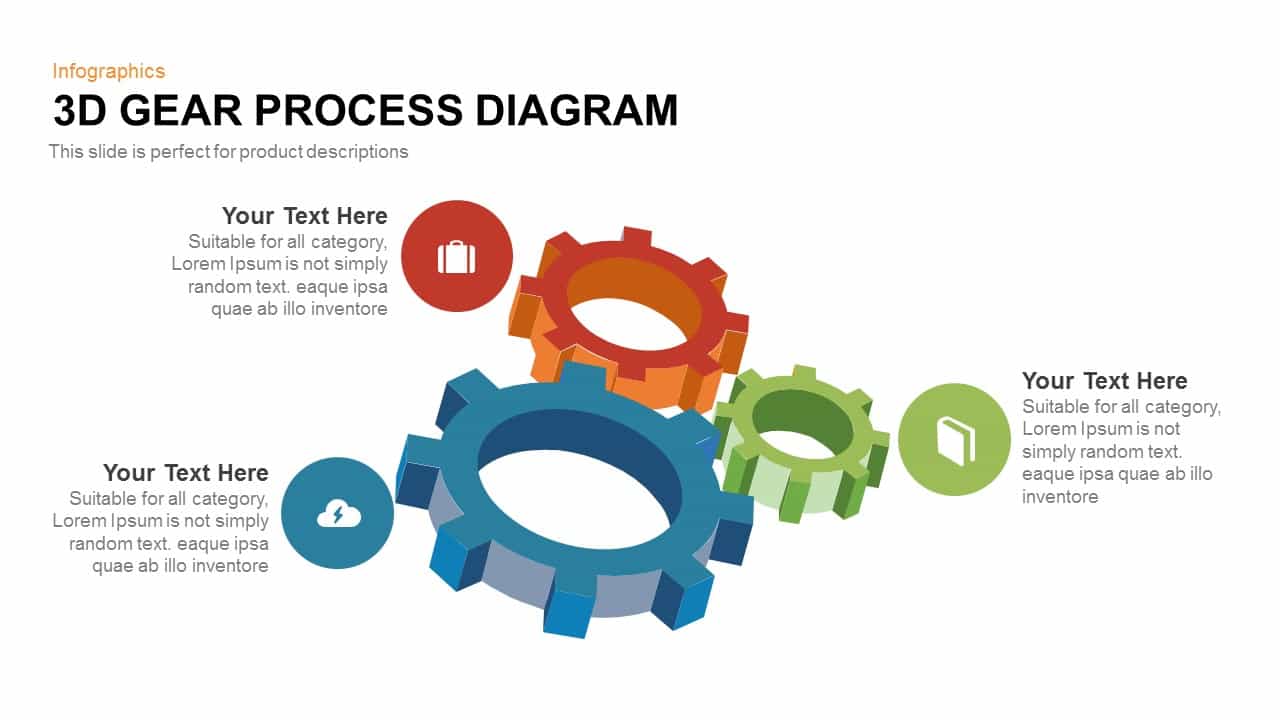
Professional 3D Gear Process Diagram Template for PowerPoint & Google Slides
Process
Gear Process Phase Diagram template for PowerPoint & Google Slides
Process

Five-Step Gear Process Diagram Template for PowerPoint & Google Slides
Process
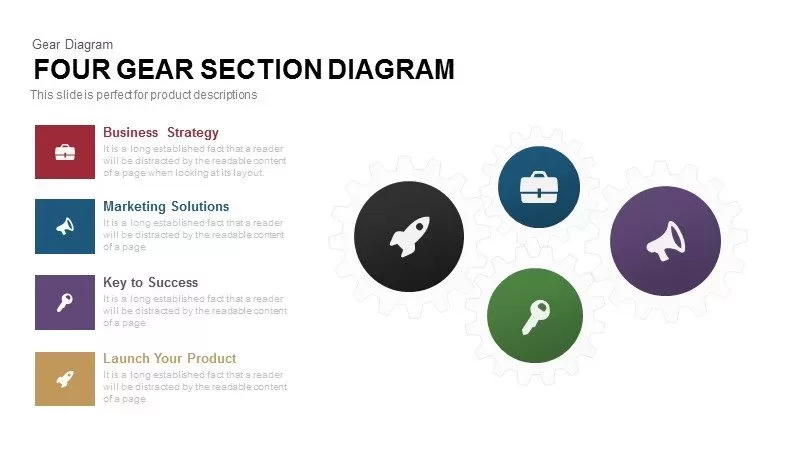
Four Gear Section Diagram Template for PowerPoint & Google Slides
Circular

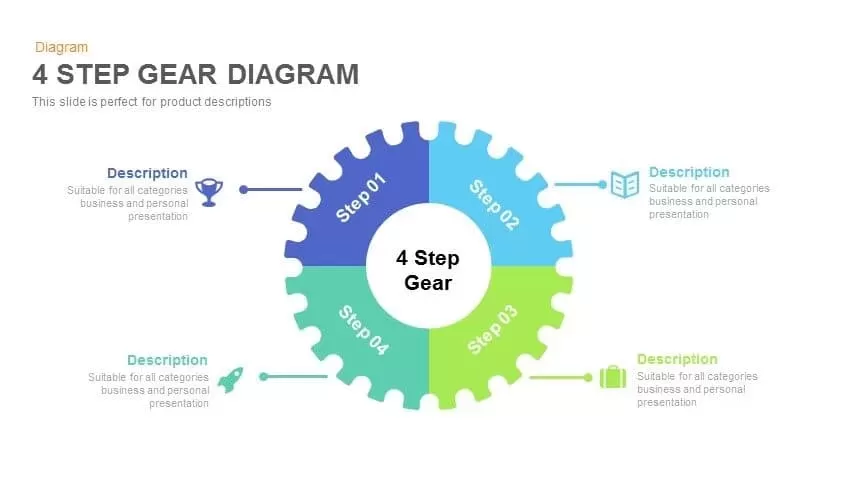
4 Step Gear Diagram Template for PowerPoint & Google Slides
Process
Dynamic 4 Gear Process Diagram Template for PowerPoint & Google Slides
Process
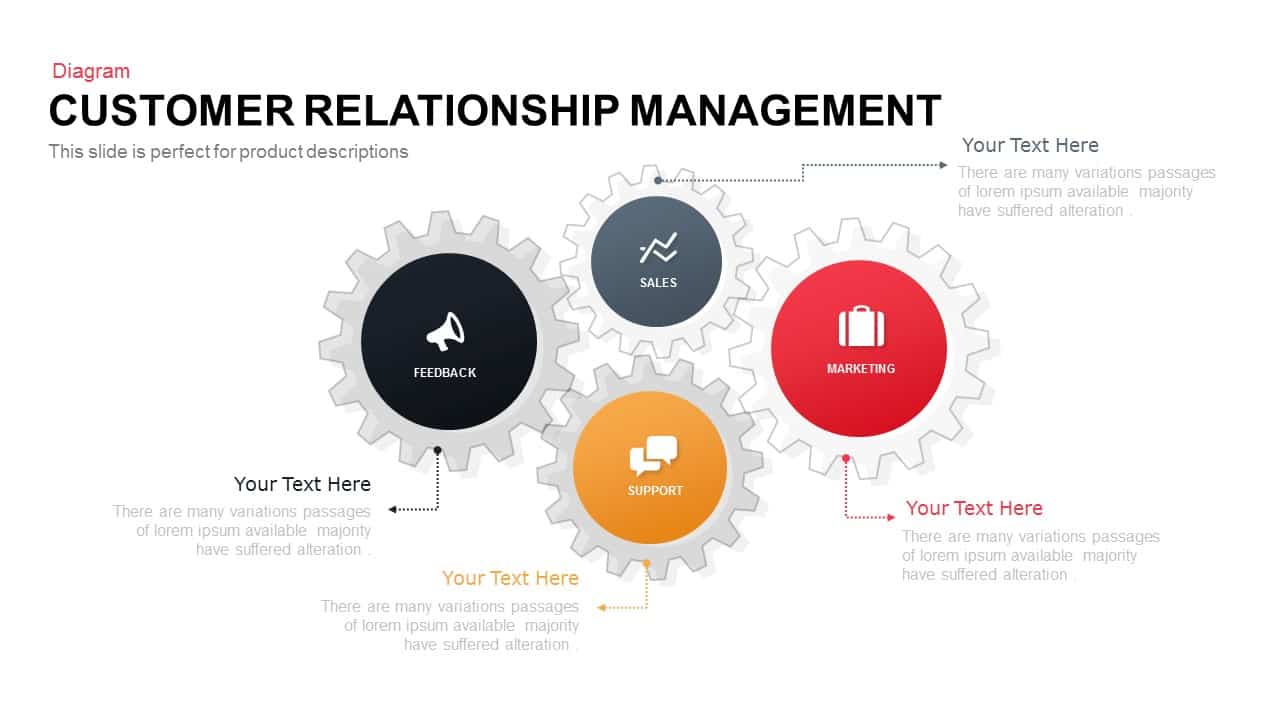
Colorful Modern CRM Gear Diagram Template for PowerPoint & Google Slides
Customer Experience
Gear Pie Diagram Data Visualization Template for PowerPoint & Google Slides
Pie/Donut
Six-Staged Gear Diagram Framework Template for PowerPoint & Google Slides
Process
Gear Flow Diagram template for PowerPoint & Google Slides
Process

Modern Four Stage Gear Diagram Template for PowerPoint & Google Slides
Process
Artificial Intelligence Gear Diagram Template for PowerPoint & Google Slides
Process
Marketing Risk Management Gear Diagram Template for PowerPoint & Google Slides
Risk Management
SWOT Analysis Gear Diagram Slide Template for PowerPoint & Google Slides
SWOT
Supply Chain Process Gear Diagram Template for PowerPoint & Google Slides
Process
Six Sigma Gear Process Diagram Template for PowerPoint & Google Slides
Process
Six-Stage Gear Wheel Diagram Template for PowerPoint & Google Slides
Circular
Four-Stage Gear Process Diagram Template for PowerPoint & Google Slides
Process
5-Stage Gear Process Flow Diagram Template for PowerPoint & Google Slides
Process
Sales Process Improvement Gear Diagram Template for PowerPoint & Google Slides
Process
Eight-Stage Gear Diagram Process Template for PowerPoint & Google Slides
Process
Three-Step Triangular Gear Diagram Template for PowerPoint & Google Slides
Process
Dynamic Gear Diagram Infographics Template for PowerPoint & Google Slides
Process
Six-Option Gear Diagram Slide Template for PowerPoint & Google Slides
Circular
Gear Process Diagram Template for PowerPoint & Google Slides
Process
Gear Process Diagram Template for PowerPoint & Google Slides
Process
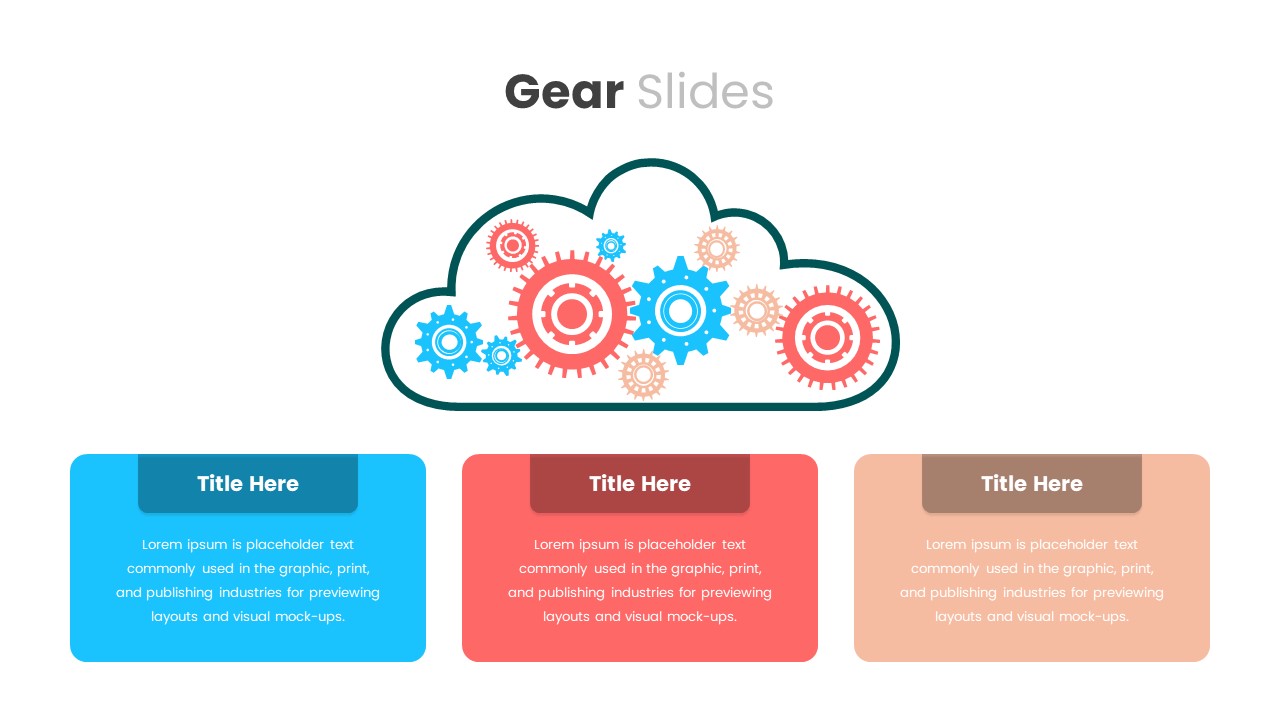
Cloud Gear Automation Diagram Template for PowerPoint & Google Slides
Cloud Computing
Gear Process Diagram for PowerPoint & Google Slides
Process
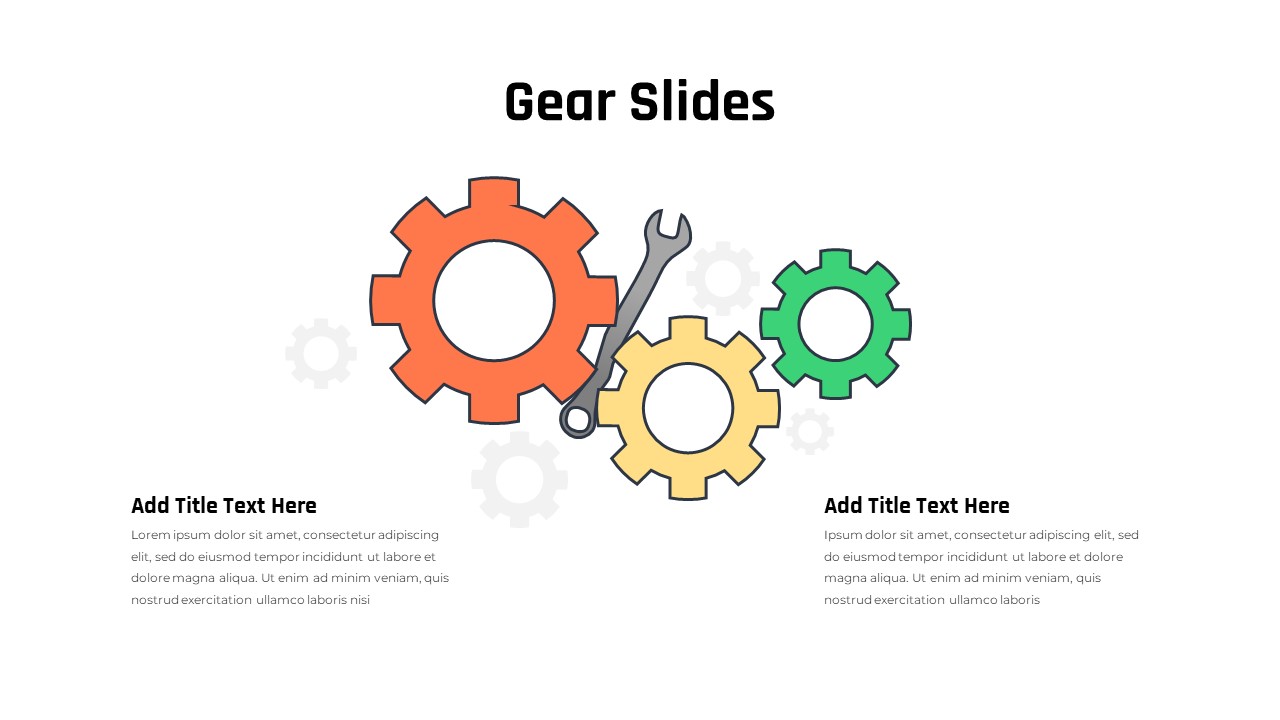
Gear Slides for PowerPoint & Google Slides
Infographics
Six Section Circular Infographic Diagram Template for PowerPoint & Google Slides
Circular
Eight-Step Circular Diagram Infographic Template for PowerPoint & Google Slides
Circular
Five-Stage Circular Infographic Diagram Template for PowerPoint & Google Slides
Process
Four-Stage Circular Diagram Infographic Template for PowerPoint & Google Slides
Circular
4 Factors Circular Diagram Infographic Template for PowerPoint & Google Slides
Circular
Circular CRM Process Diagram Infographic Template for PowerPoint & Google Slides
Circular
Circular Three-Step Infographic Diagram Template for PowerPoint & Google Slides
Circular
6-Step Circular Diagram Infographic Template for PowerPoint & Google Slides
Circular
Circular CRM Process Infographic Diagram Template for PowerPoint & Google Slides
Circular
4-Step Circular Infographic Diagram Template for PowerPoint & Google Slides
Circular
Free Gear Infographics template for PowerPoint & Google Slides
Process
Free
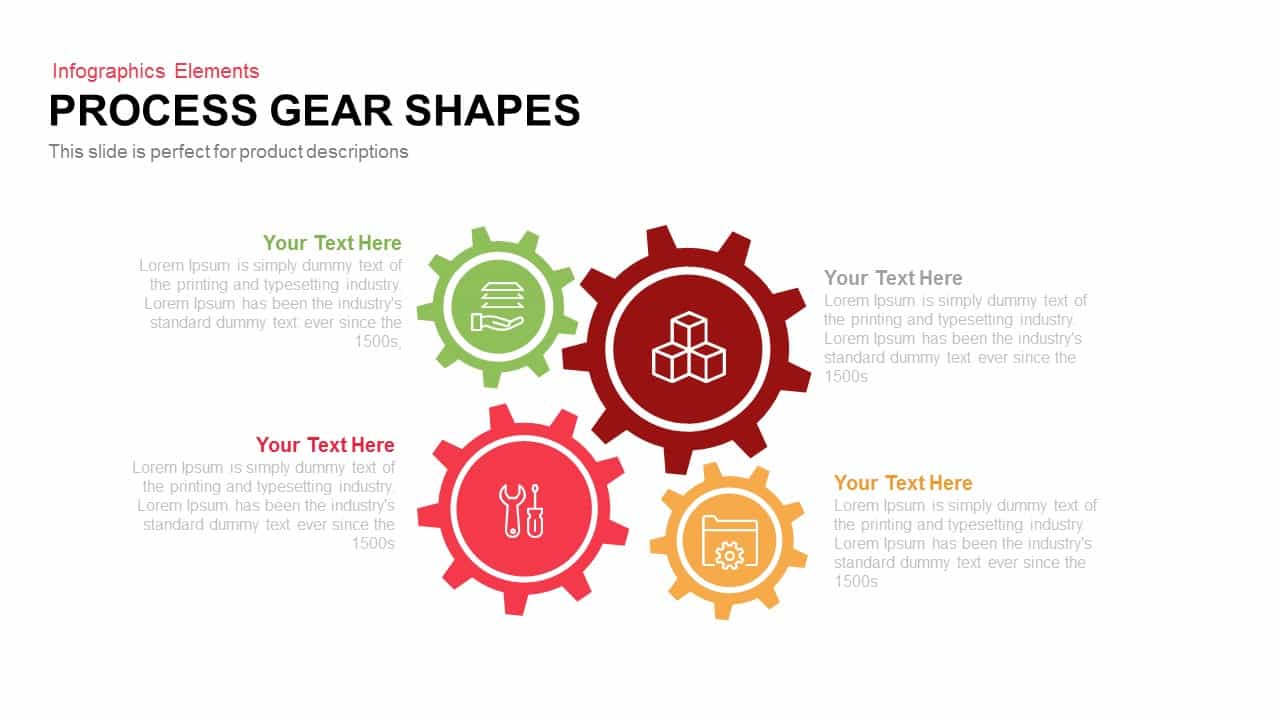
Process Gear Shapes Template for PowerPoint & Google Slides
Infographics
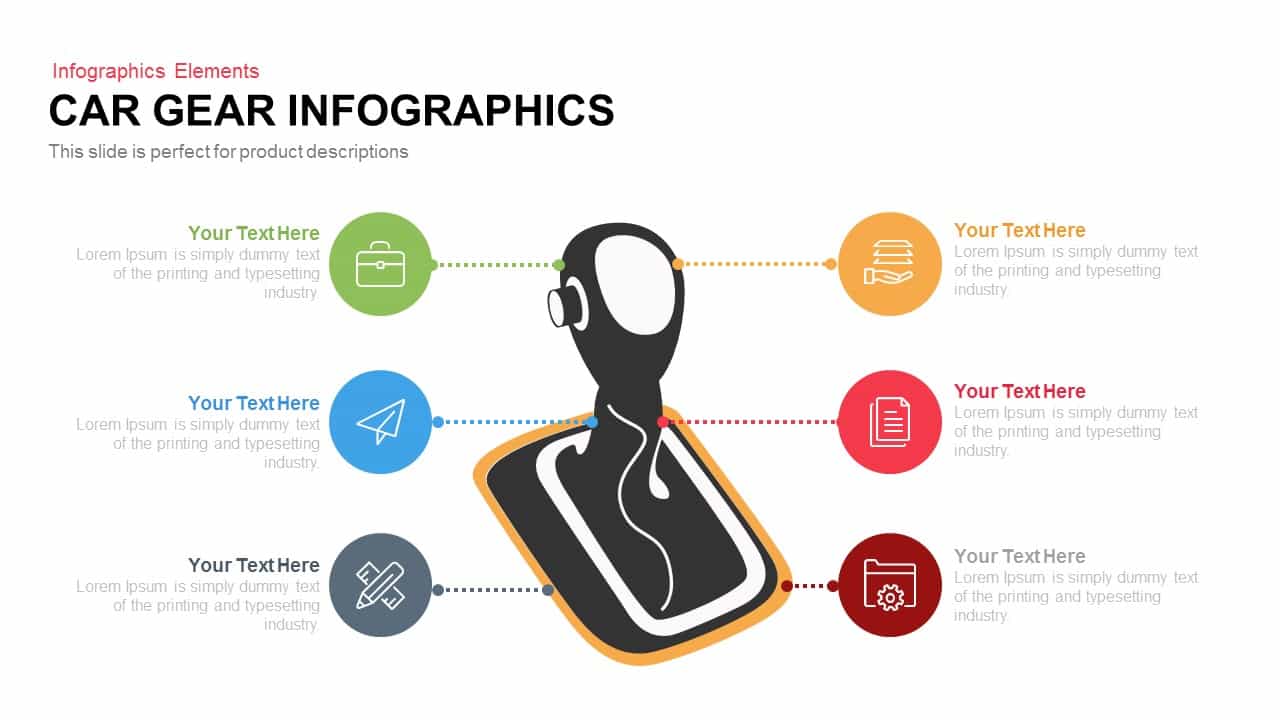
Car Gear Infographics Template for PowerPoint & Google Slides
Infographics
Brain Gear Hub-and-Spoke Infographics template for PowerPoint & Google Slides
Org Chart

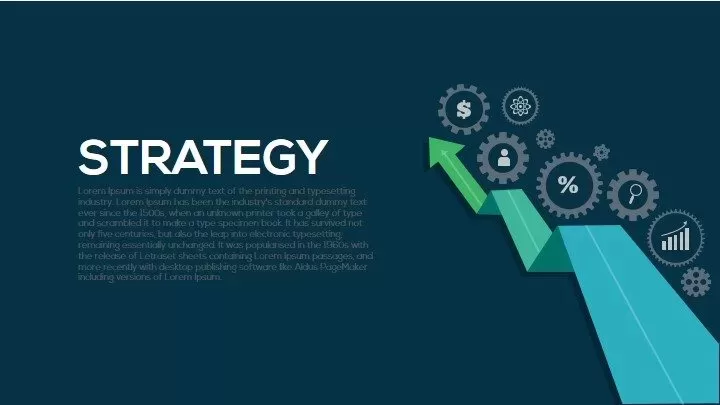
Strategy Arrow and Gear Icons Template for PowerPoint & Google Slides
Infographics
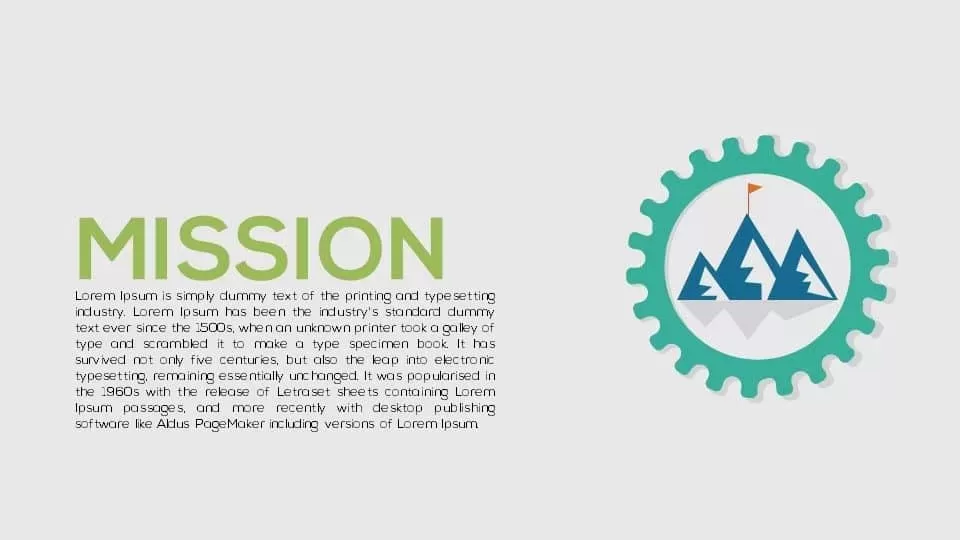
Corporate Mission Statement Gear Slide Template for PowerPoint & Google Slides
Vision and Mission
3, 4, and 5 Step Gear Infographics Template for PowerPoint & Google Slides
Process
Animated Gear Slide for Process Mapping Template for PowerPoint & Google Slides
Process
Dynamic Four-Step Gear Process Template for PowerPoint & Google Slides
Process
Eight-Stage Circular Process Infographic Template for PowerPoint & Google Slides
Circular
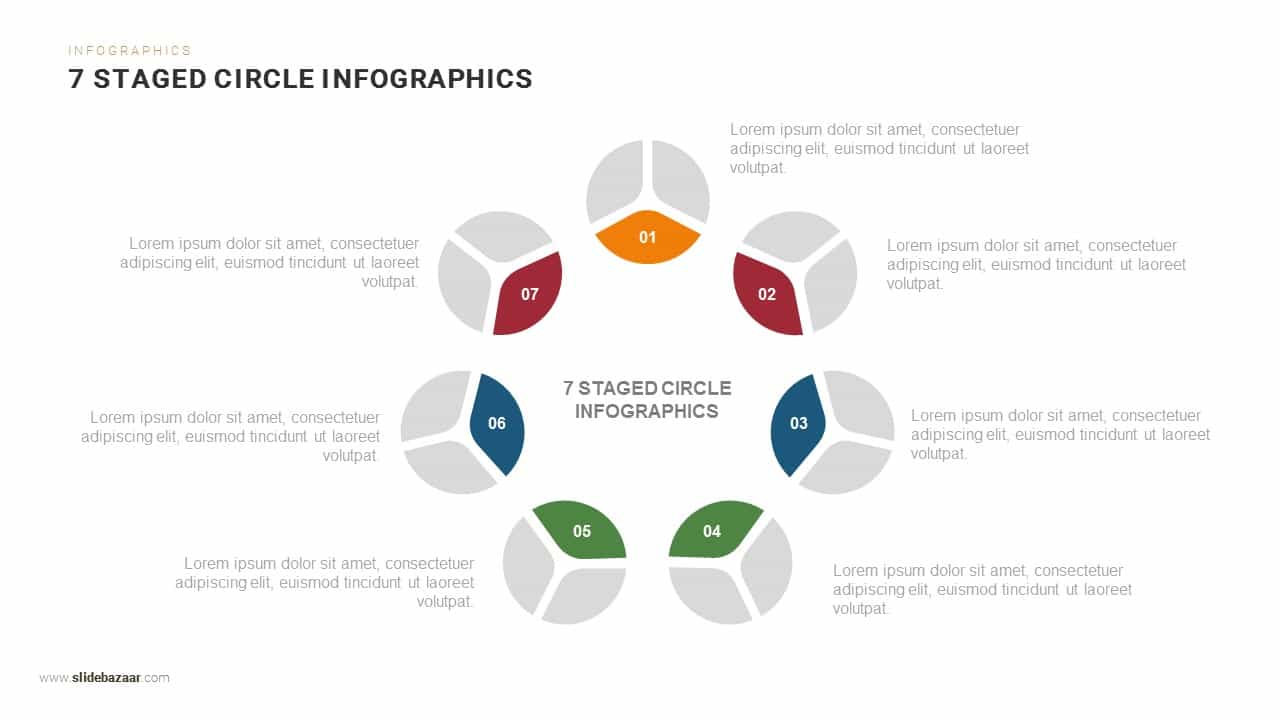
Seven-Stage Circular Infographic Template for PowerPoint & Google Slides
Circular
Six-Segment Circular Hub Infographic Template for PowerPoint & Google Slides
Circular
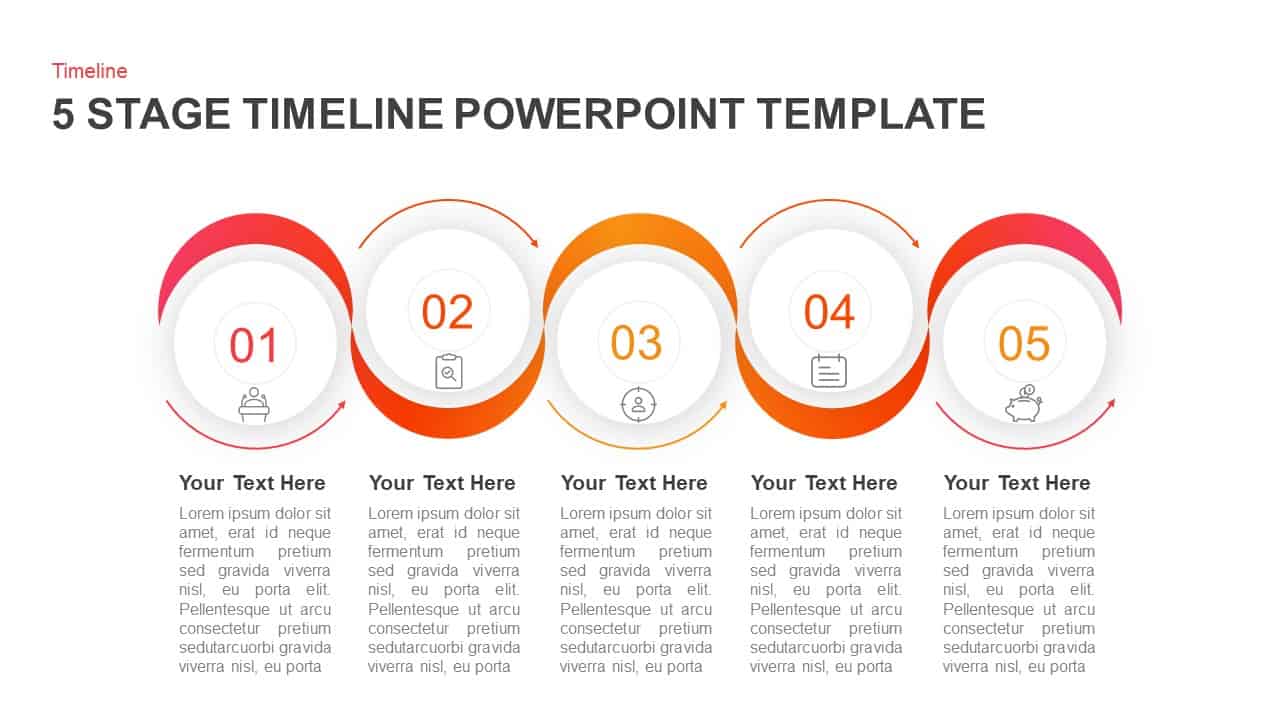
5 Stage Circular Timeline Infographic Template for PowerPoint & Google Slides
Timeline
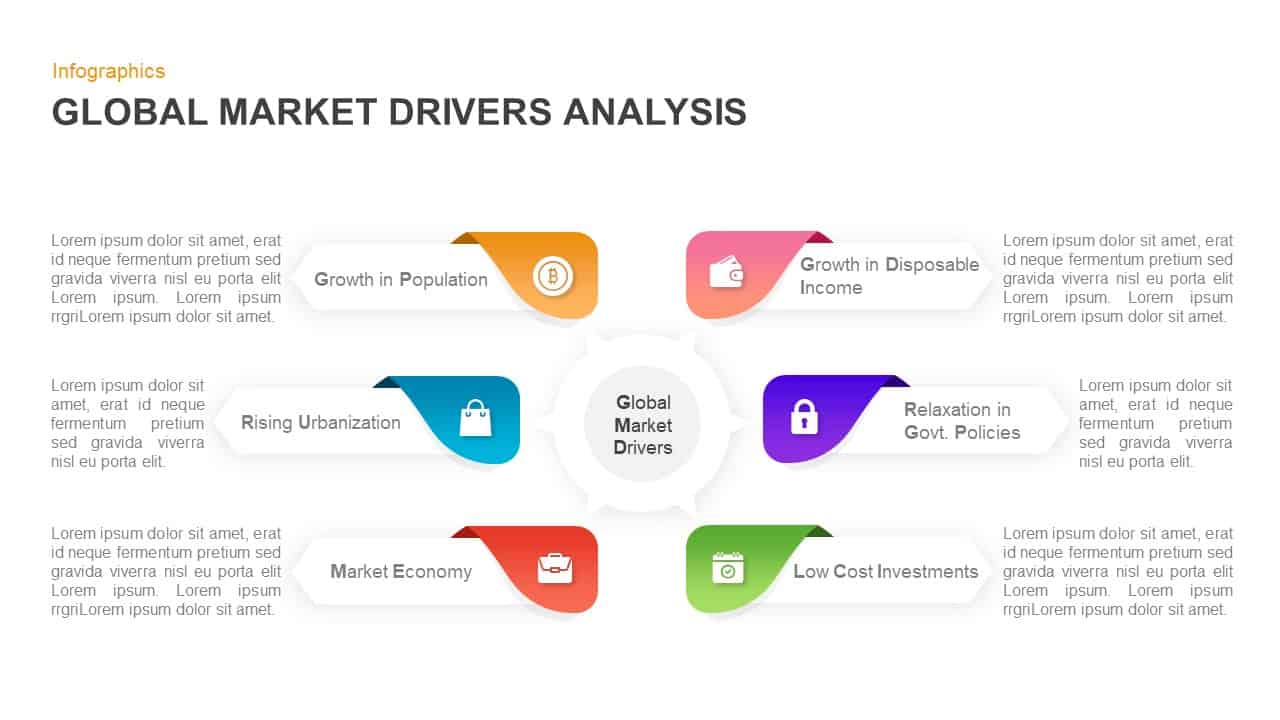
Circular Market Drivers Infographic Template for PowerPoint & Google Slides
Circular
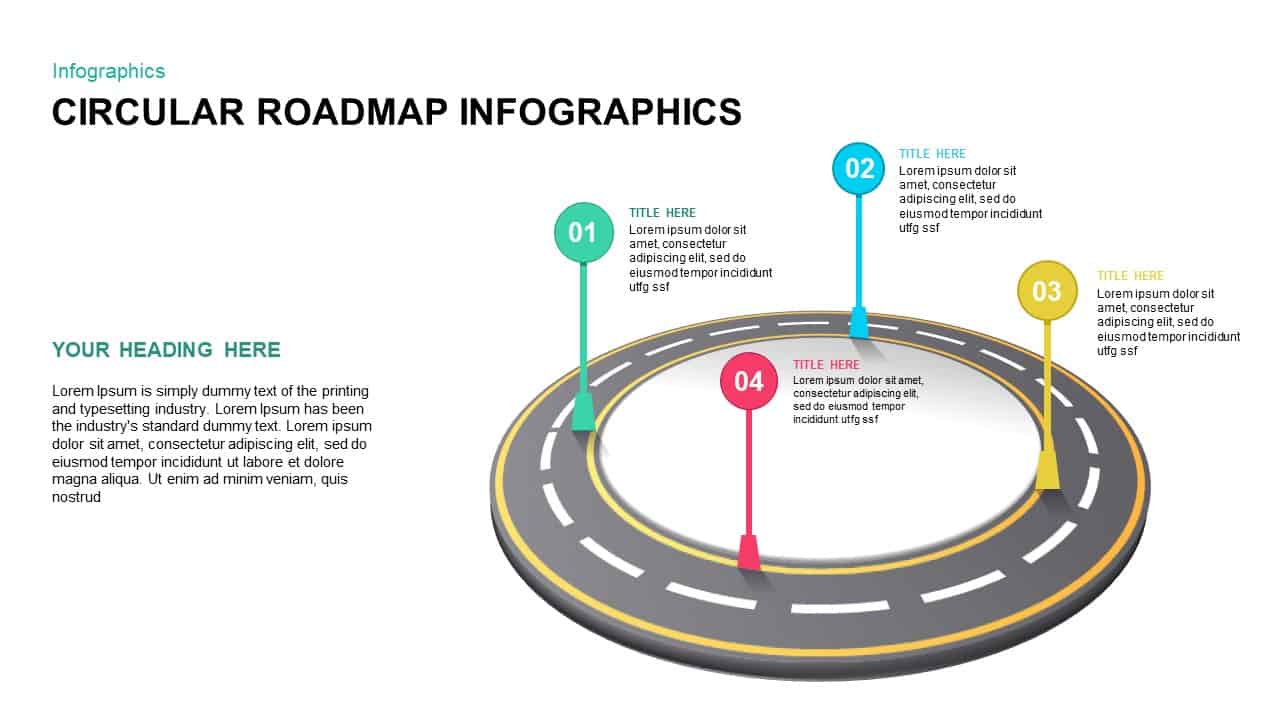
4-Step Circular Roadmap Infographic Template for PowerPoint & Google Slides
Roadmap
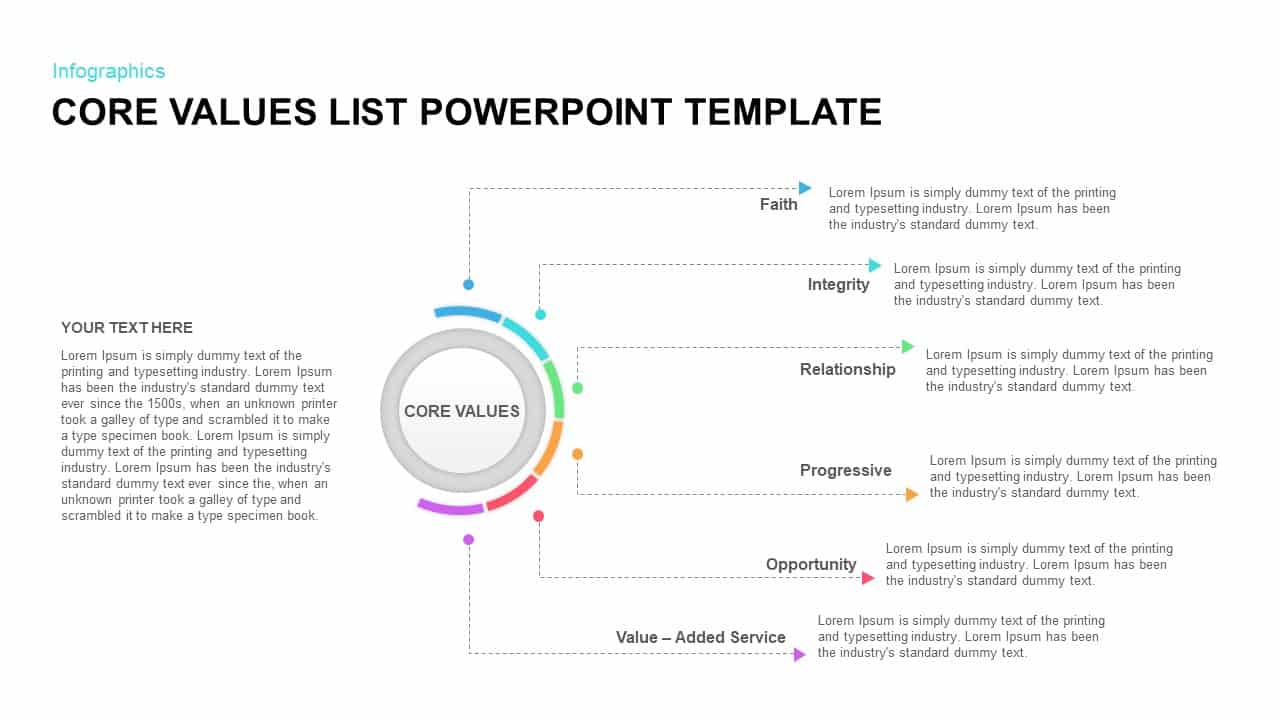
Circular Core Values Infographic List Template for PowerPoint & Google Slides
Circular
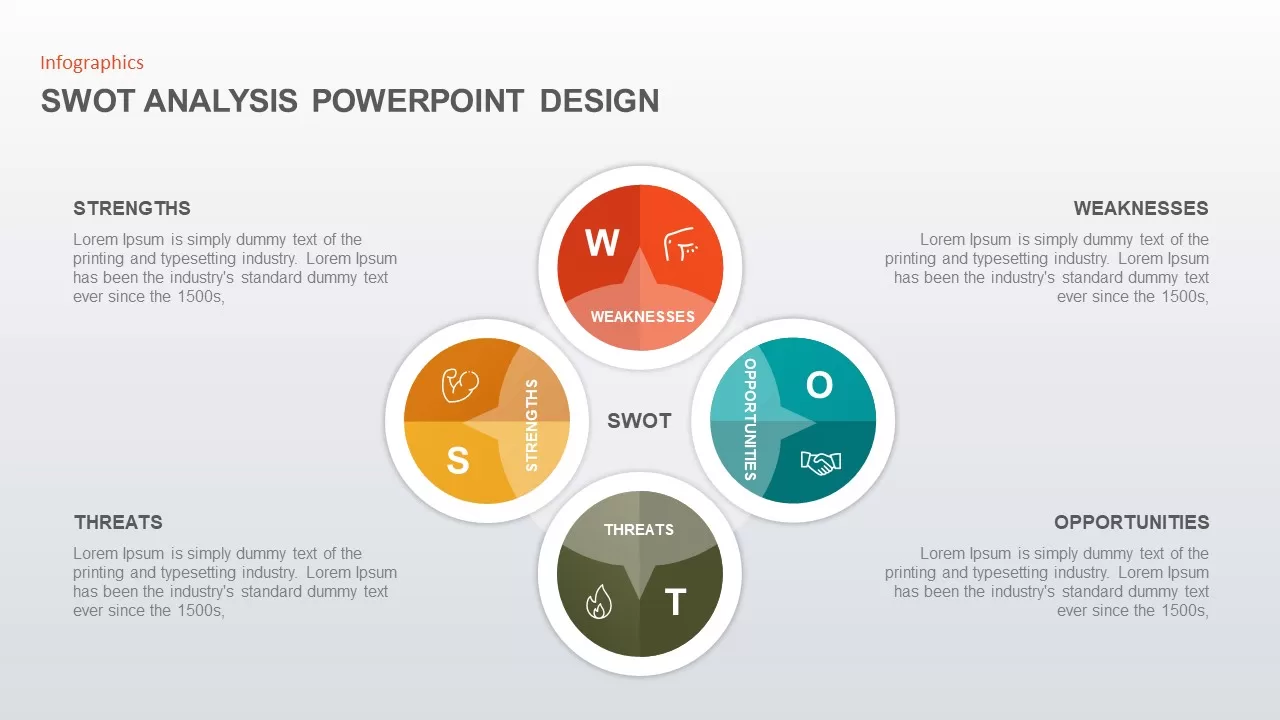
SWOT Analysis Circular Infographic Template for PowerPoint & Google Slides
SWOT
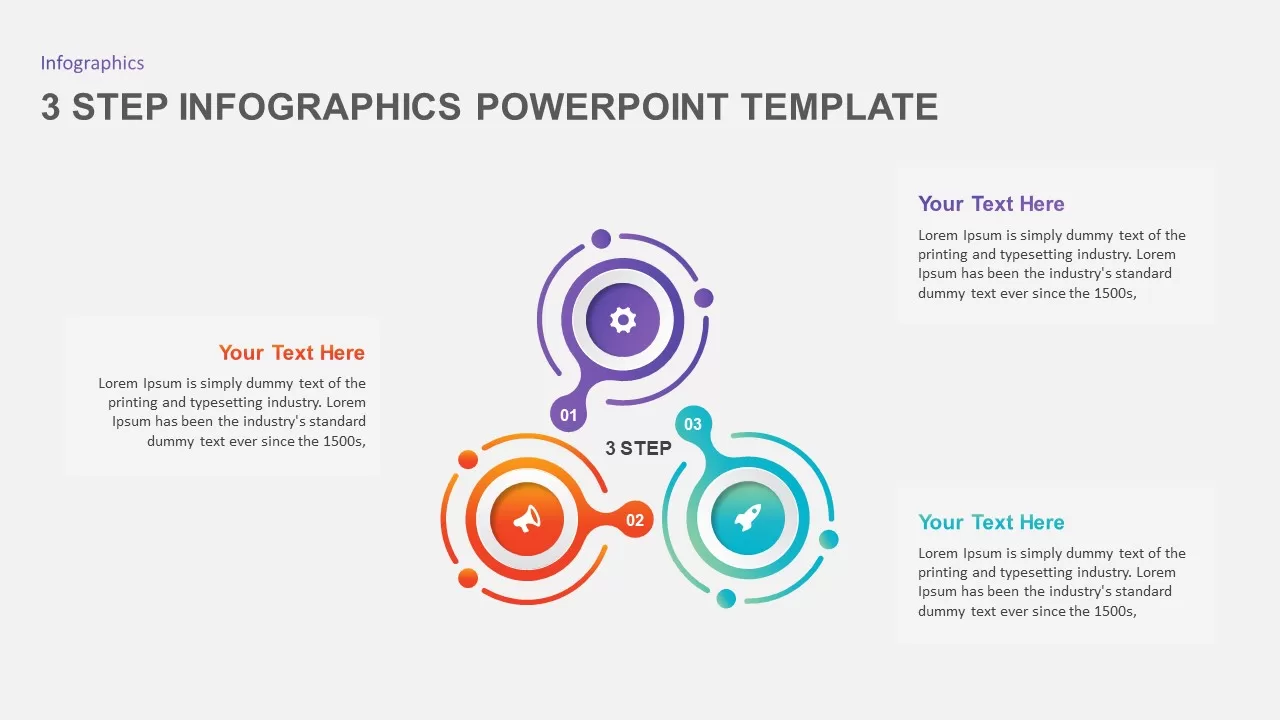
3 & 4 Step Circular Process Infographic Template for PowerPoint & Google Slides
Process
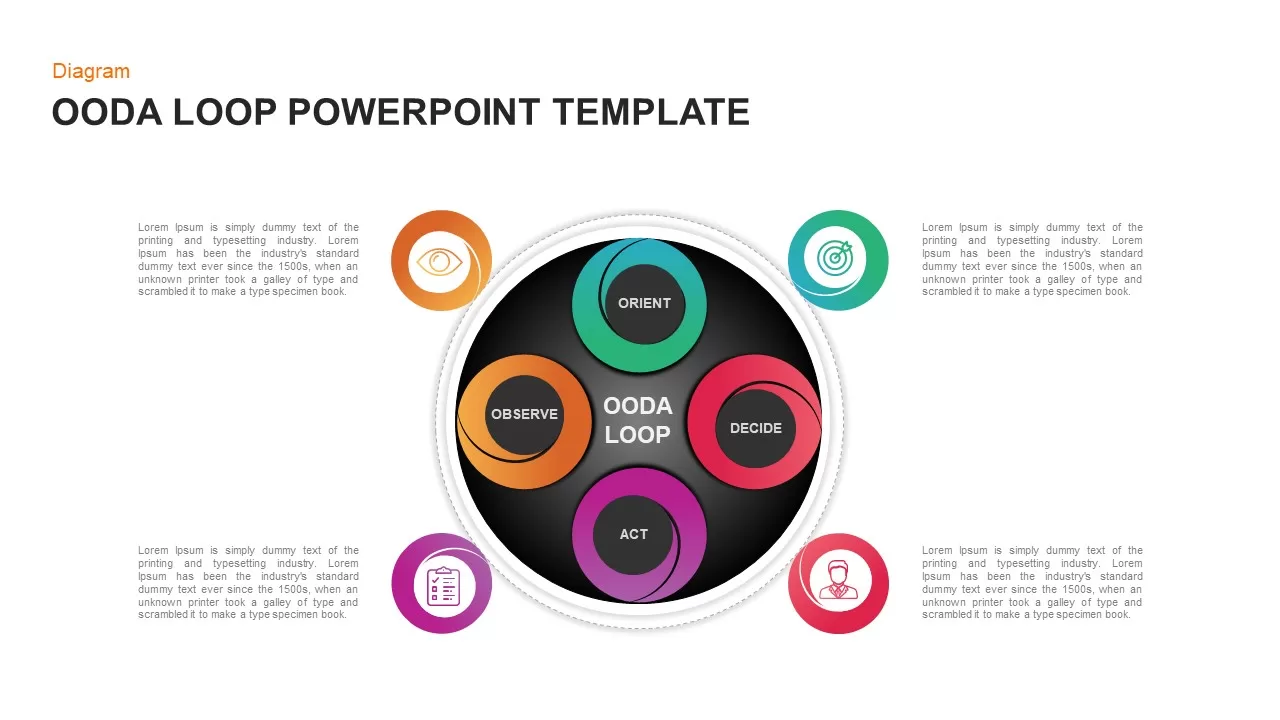
Modern Circular OODA Loop Infographic Template for PowerPoint & Google Slides
Circular
Circular Balanced Scorecard Infographic Template for PowerPoint & Google Slides
Business Strategy
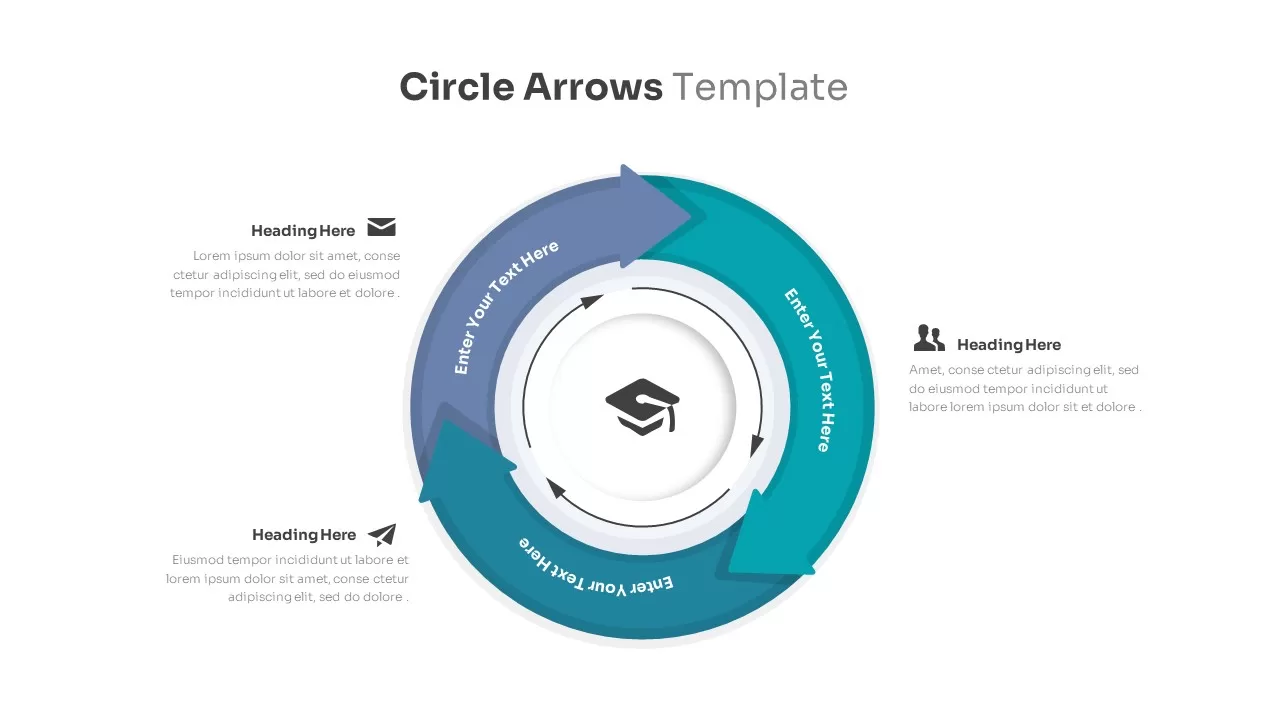
Circular Arrows Infographic Template for PowerPoint & Google Slides
Business
Circular SWOT Analysis Infographic Template for PowerPoint & Google Slides
SWOT
Free Five-Step Circular Timeline Infographic Template for PowerPoint & Google Slides
Timeline
Free
Five-Stage Circular Arrow Infographic Template for PowerPoint & Google Slides
Circular
Accomplishment Circular Infographic Template for PowerPoint & Google Slides
Accomplishment
Six-Segment Circular Arrow Infographic Template for PowerPoint & Google Slides
Circular
Healthcare Nursing Circular Infographic Template for PowerPoint & Google Slides
Nursing
Ten Step Circular Process Infographic Template for PowerPoint & Google Slides
Process
Ten-Step Circular Process Infographic Template for PowerPoint & Google Slides
Circular
Dynamic Circular Hub-and-Spoke Infographic Template for PowerPoint & Google Slides
Circular
Circular Sustainability Infographic Template for PowerPoint & Google Slides
Process
Circular Timeline Infographic Template for PowerPoint & Google Slides
Timeline
Sustainable Business Model Circular Infographic Template for PowerPoint & Google Slides
Business Strategy
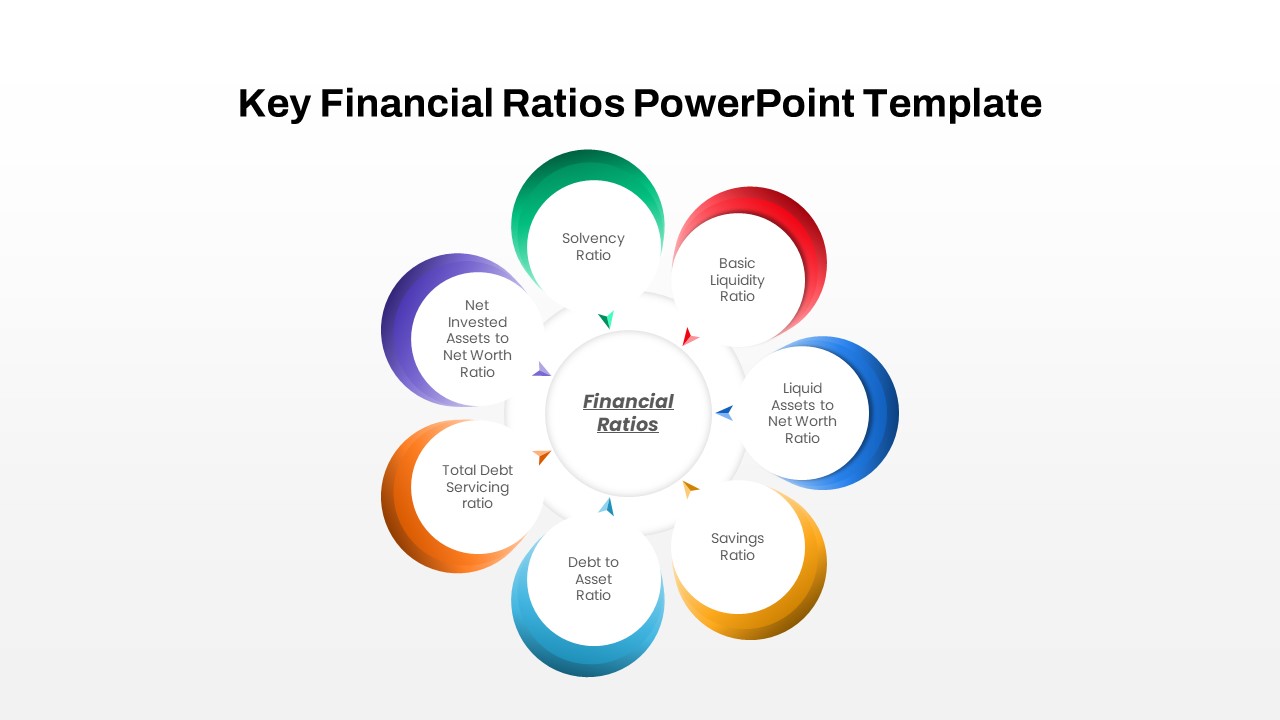
Circular Financial Ratios Infographic Template for PowerPoint & Google Slides
Finance
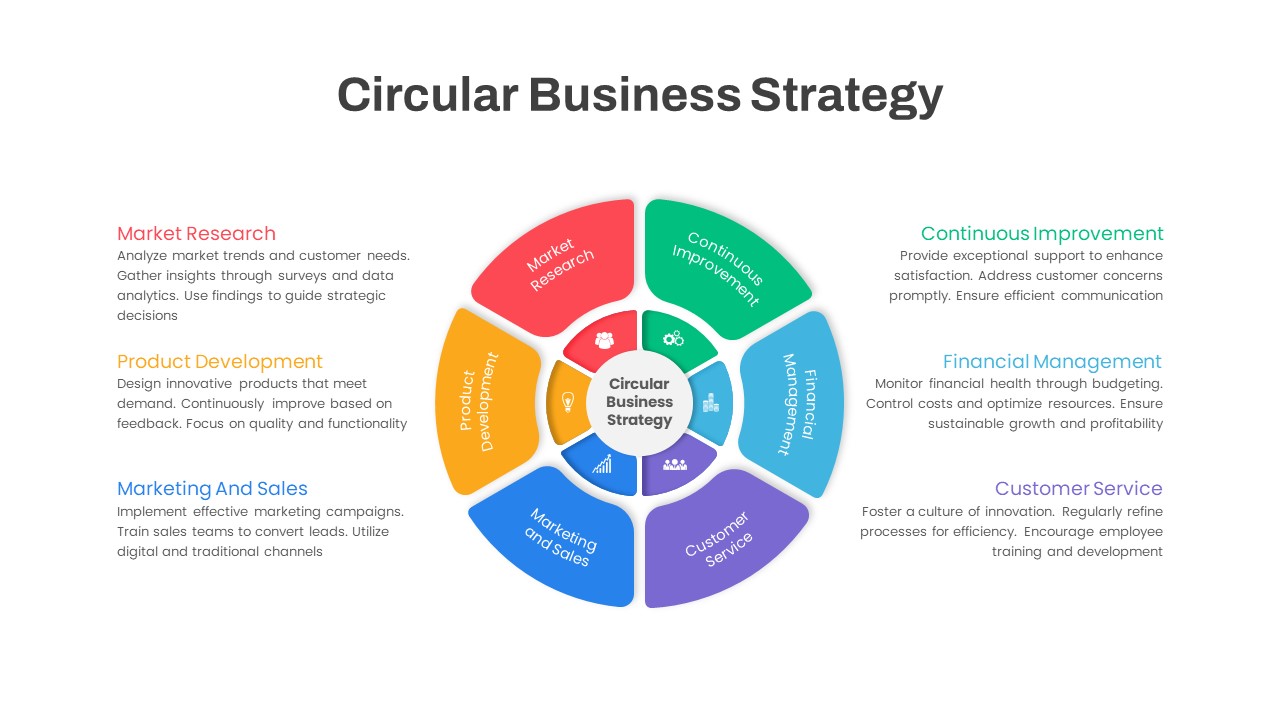
Circular Business Strategy Infographic Template for PowerPoint & Google Slides
Circular
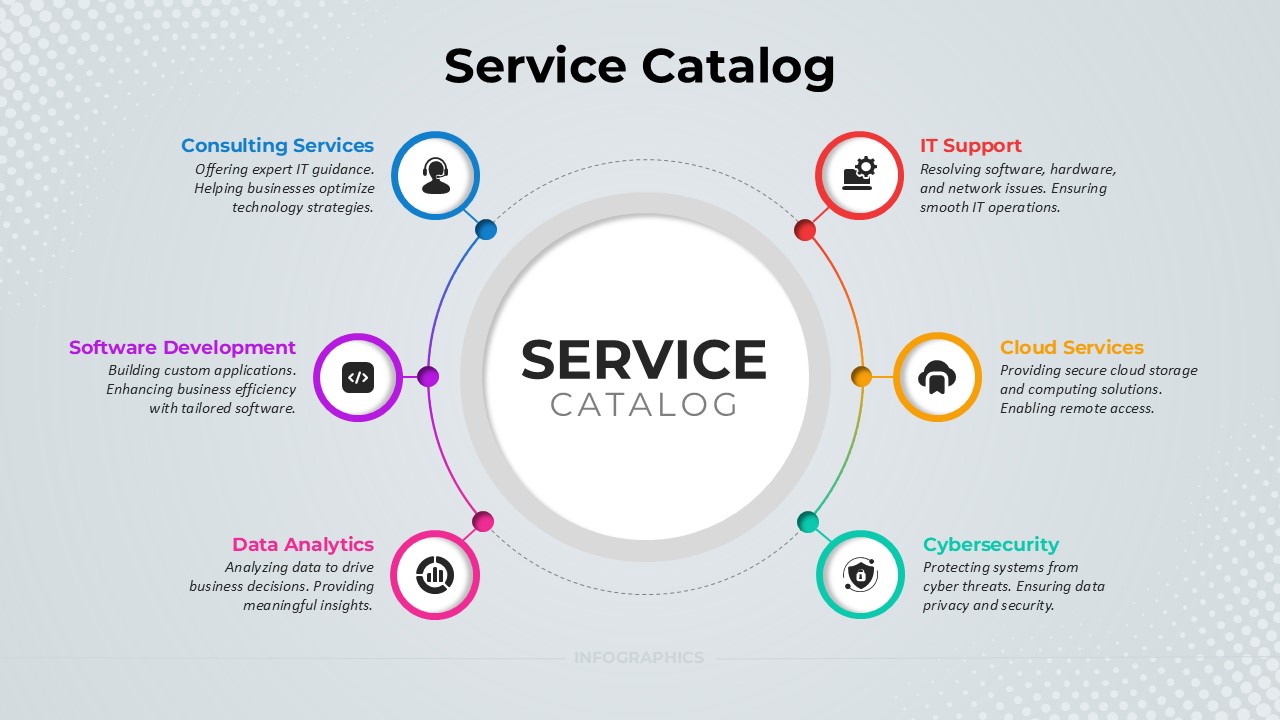
Service Catalog Circular Infographic Template for PowerPoint & Google Slides
Circular
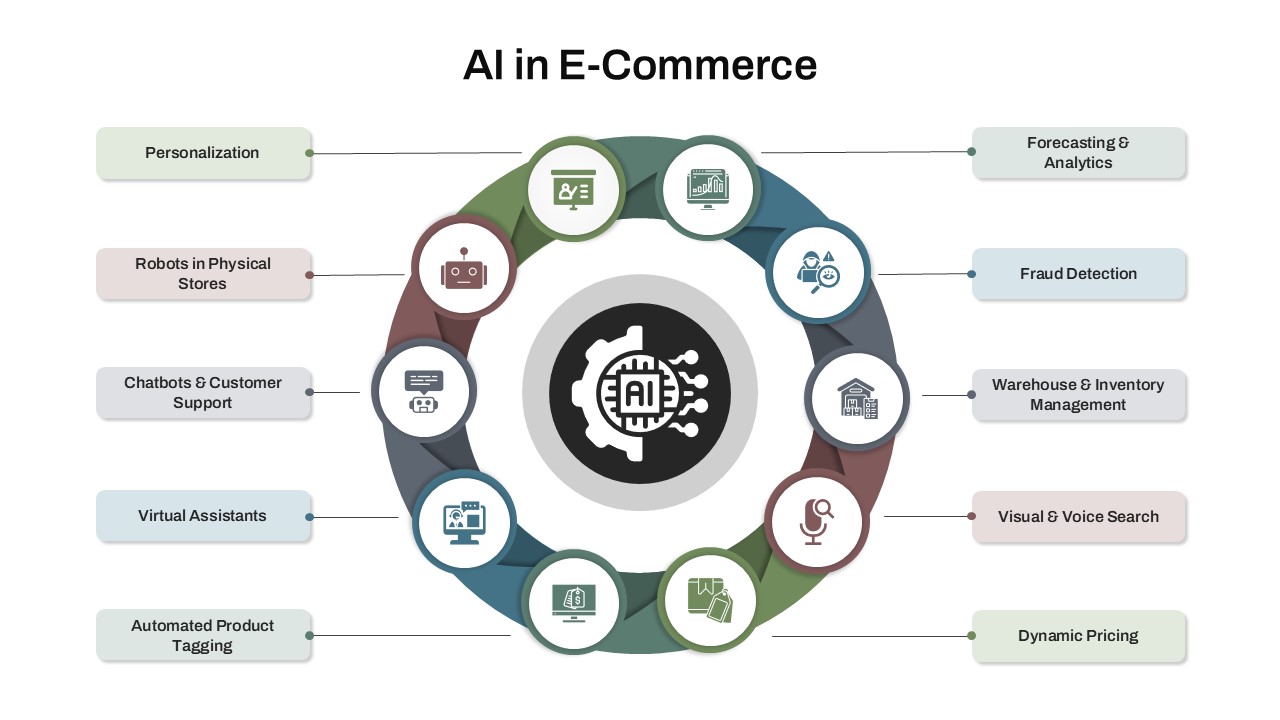
AI in E-Commerce Circular Infographic Template for PowerPoint & Google Slides
AI
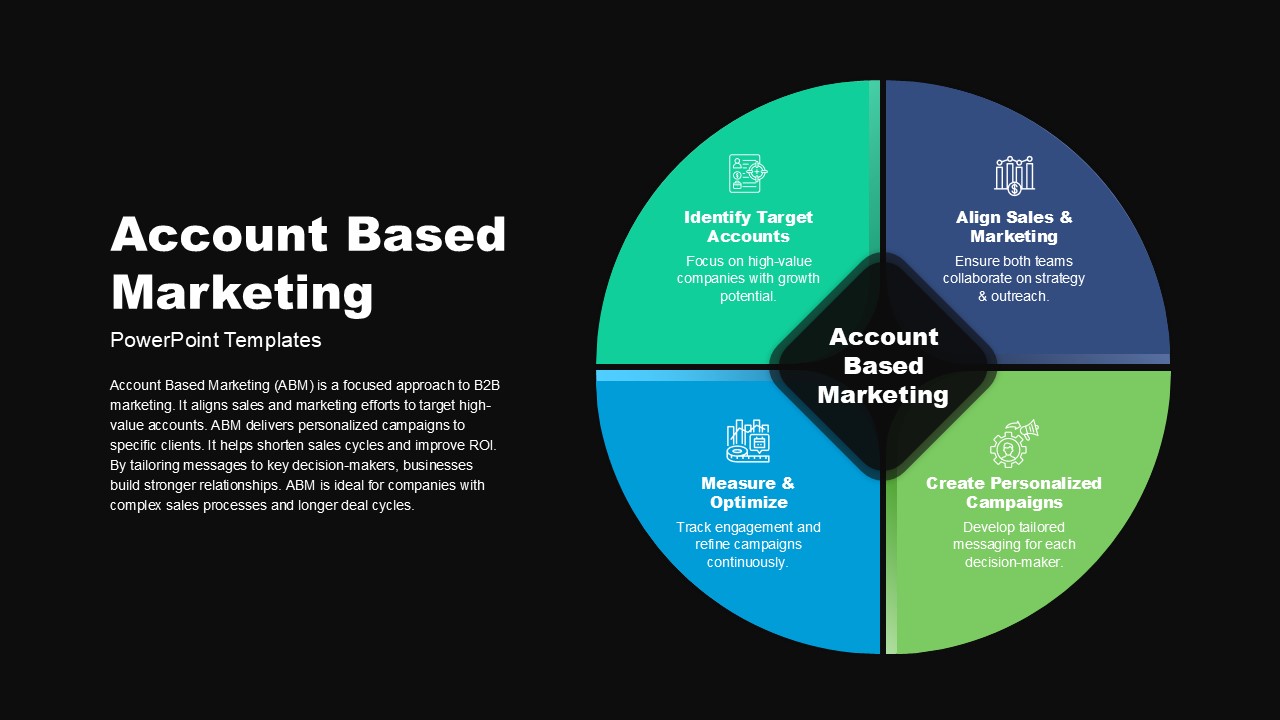
Account Based Marketing Circular Infographic Template for PowerPoint & Google Slides
Marketing
SWOT Analysis Infographic with Circular Icons Template for PowerPoint & Google Slides
SWOT
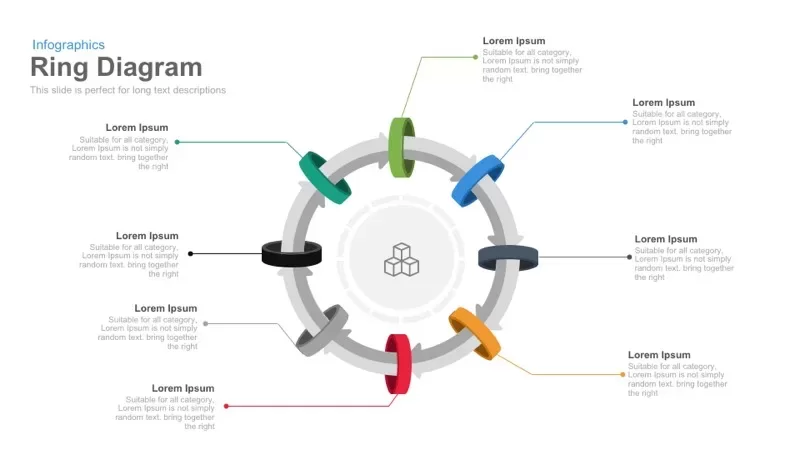
8 Circular Ring Diagram template for PowerPoint & Google Slides
Infographics
PEST Analysis Circular Diagram Template for PowerPoint & Google Slides
PEST
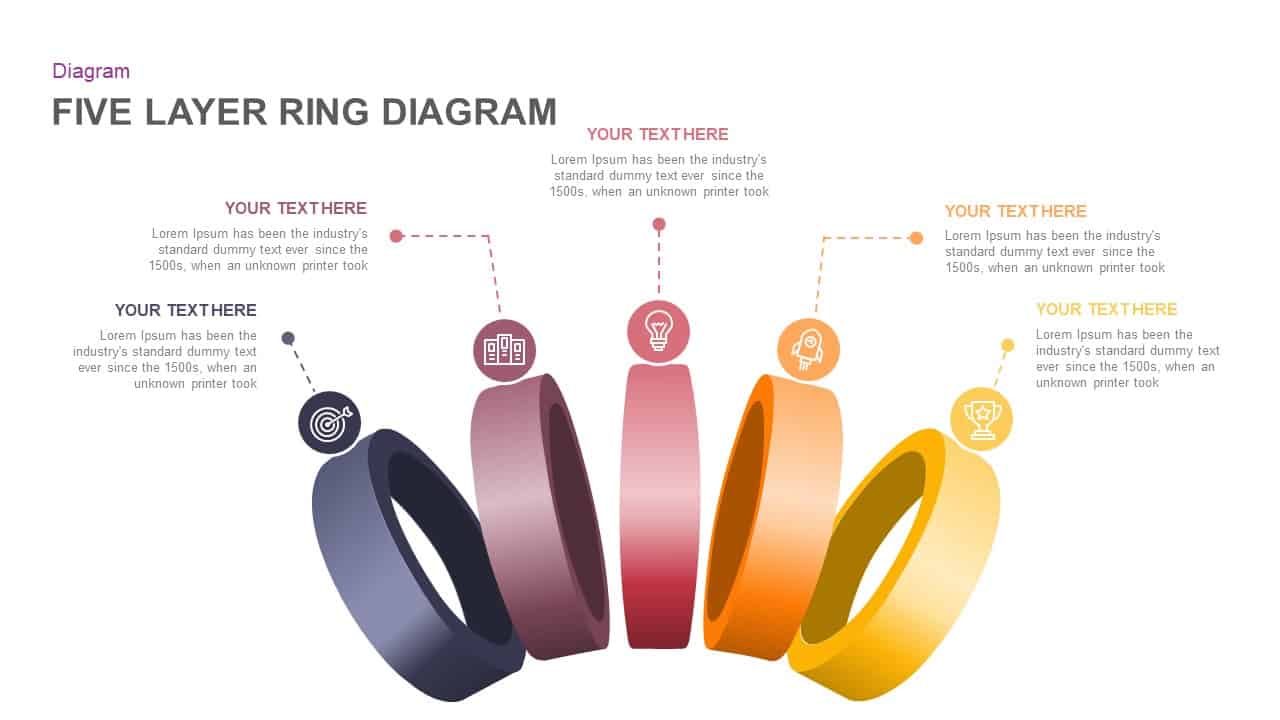
Five Layer Circular Ring Diagram Template for PowerPoint & Google Slides
Circular
Five-Stage Circular Flow Diagram Template for PowerPoint & Google Slides
Circular
Value Chain Circular Process Diagram Template for PowerPoint & Google Slides
Business Models
Three-Step Circular Arrows Diagram Template for PowerPoint & Google Slides
Process
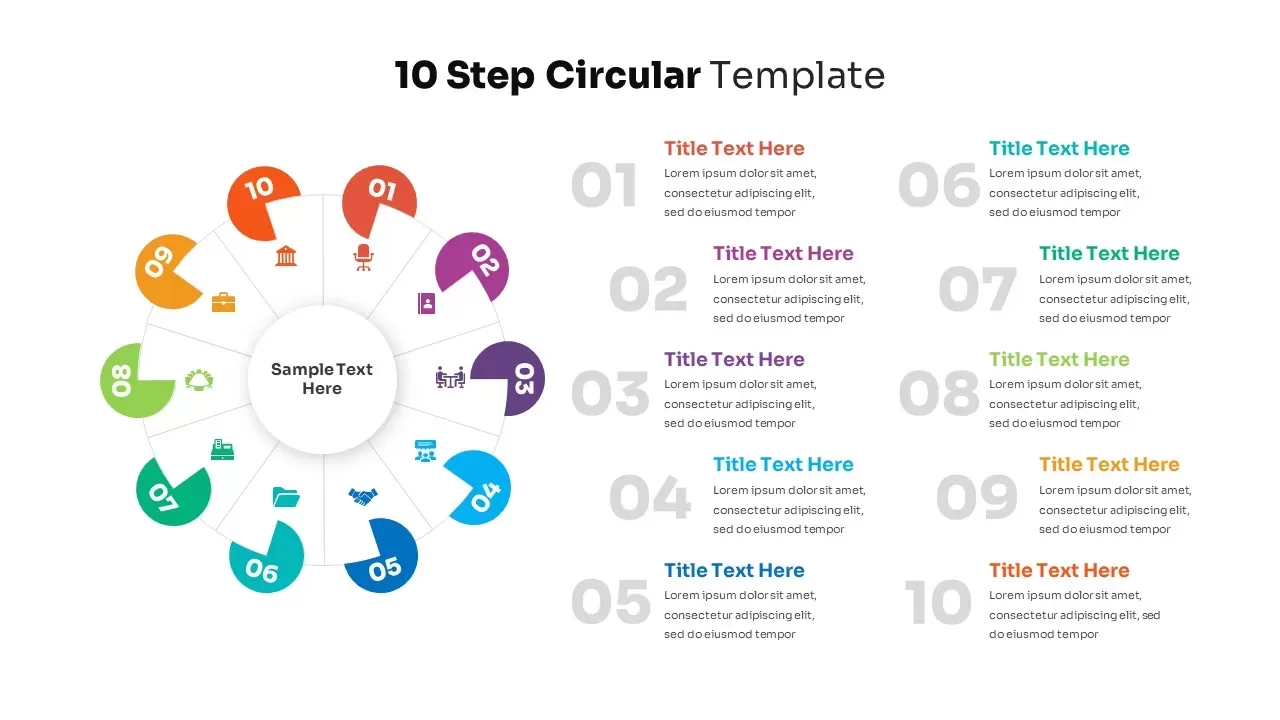
10-Step Colorful Circular Diagram Template for PowerPoint & Google Slides
Circular
Multi-Variation Circular Chart Diagram Template for PowerPoint & Google Slides
Circular
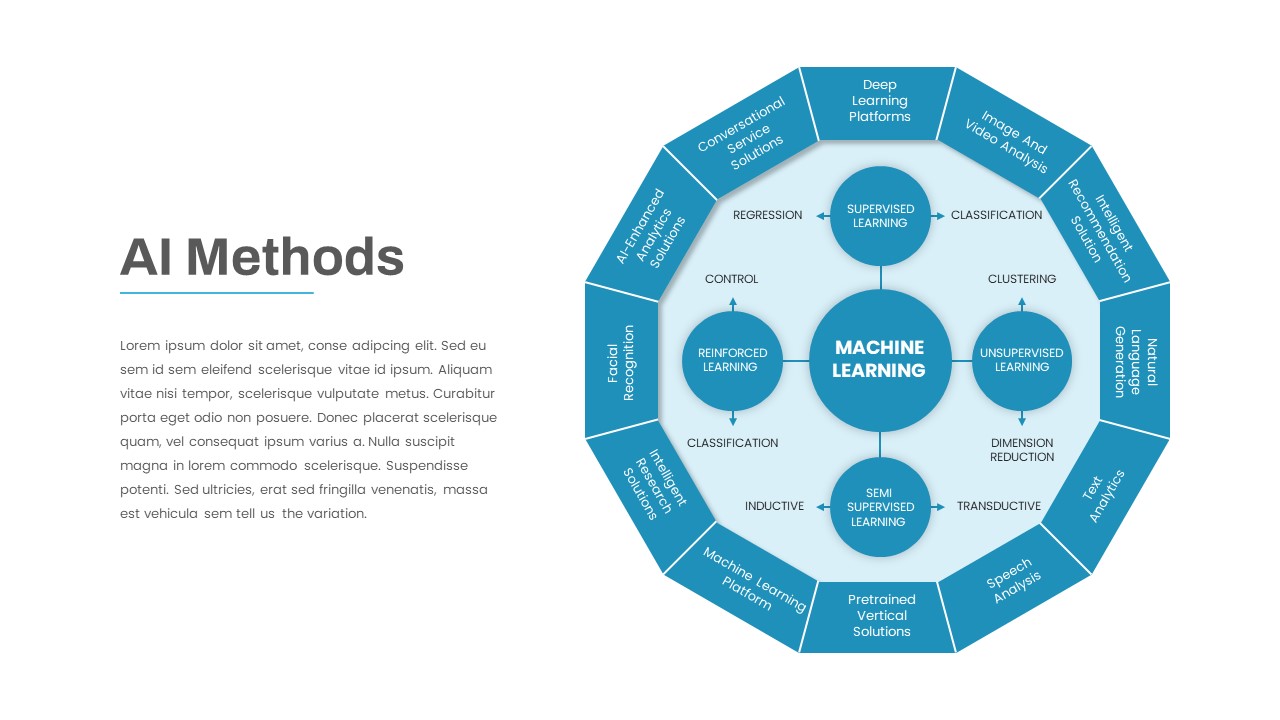
AI Methods Circular Diagram Slide Template for PowerPoint & Google Slides
AI
5Cs of Network Effect Circular Diagram Template for PowerPoint & Google Slides
Circular
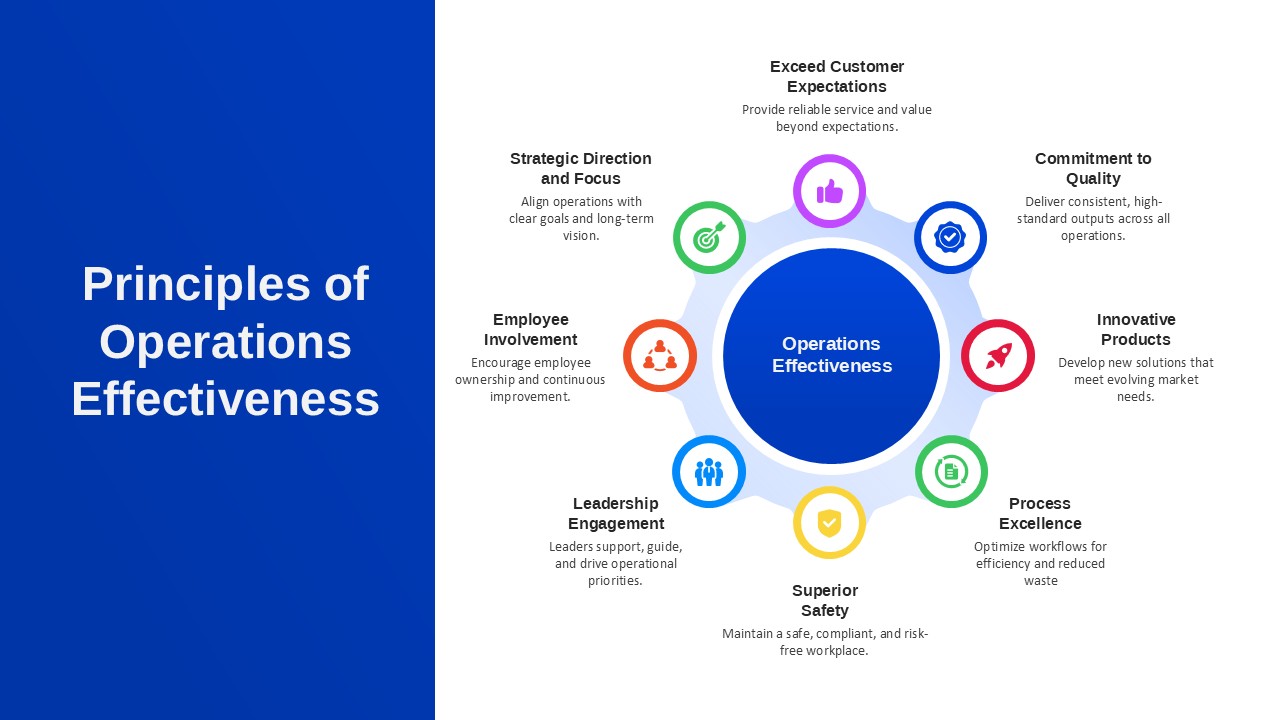
Principles of Operations Effectiveness Circular Diagram Template for PowerPoint & Google Slides
Leadership