4 Staged Circular Business Process Diagram for PowerPoint & Google Slides
Description
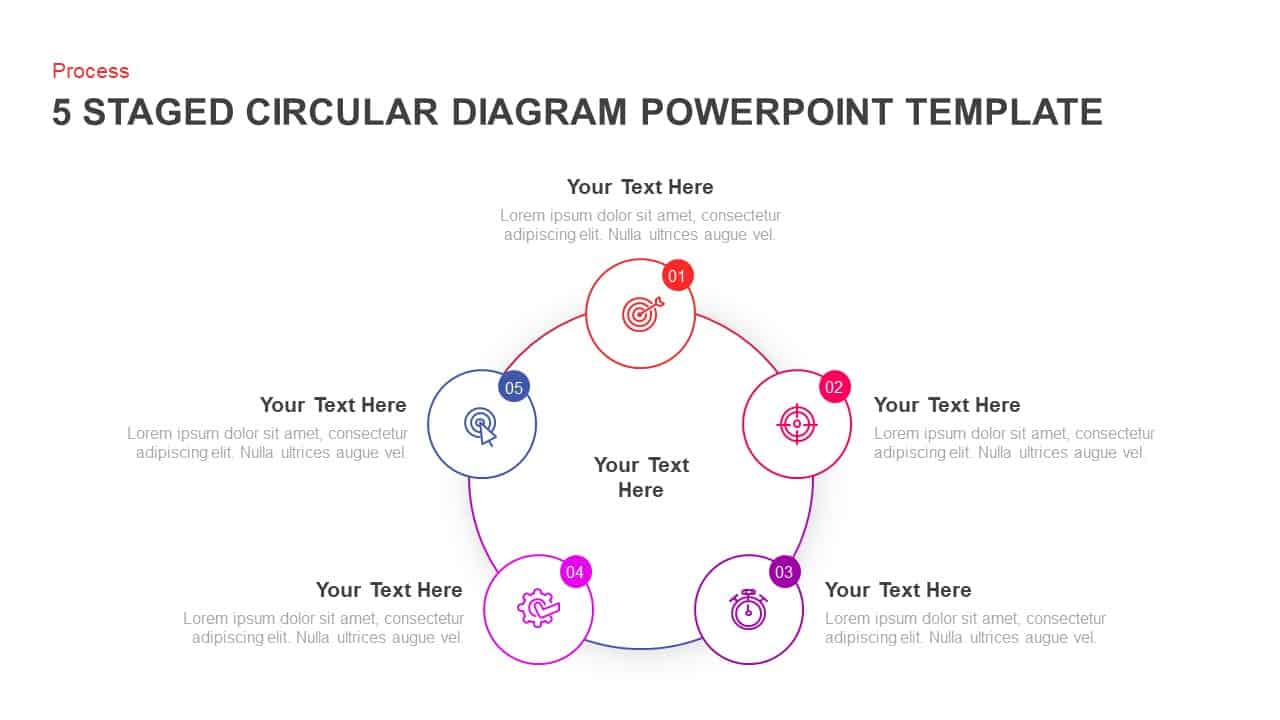
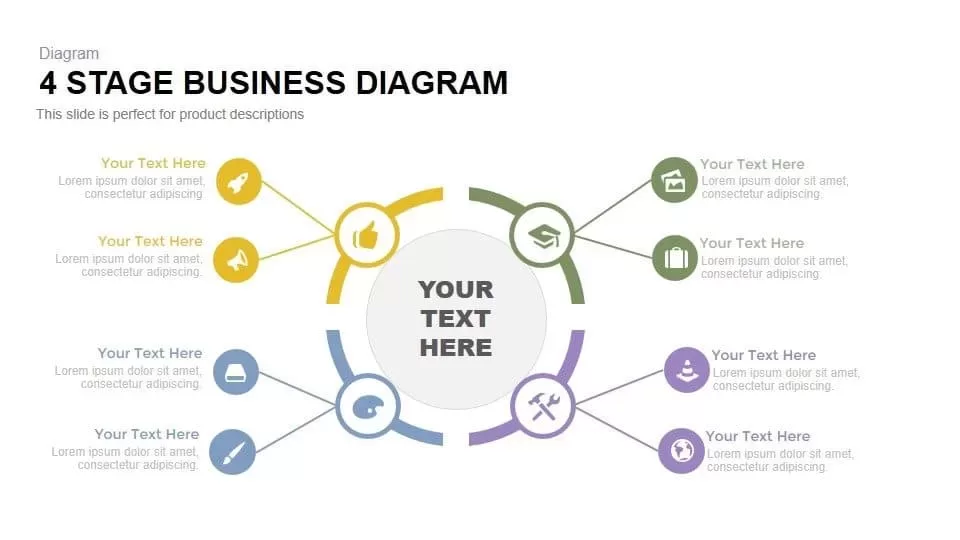
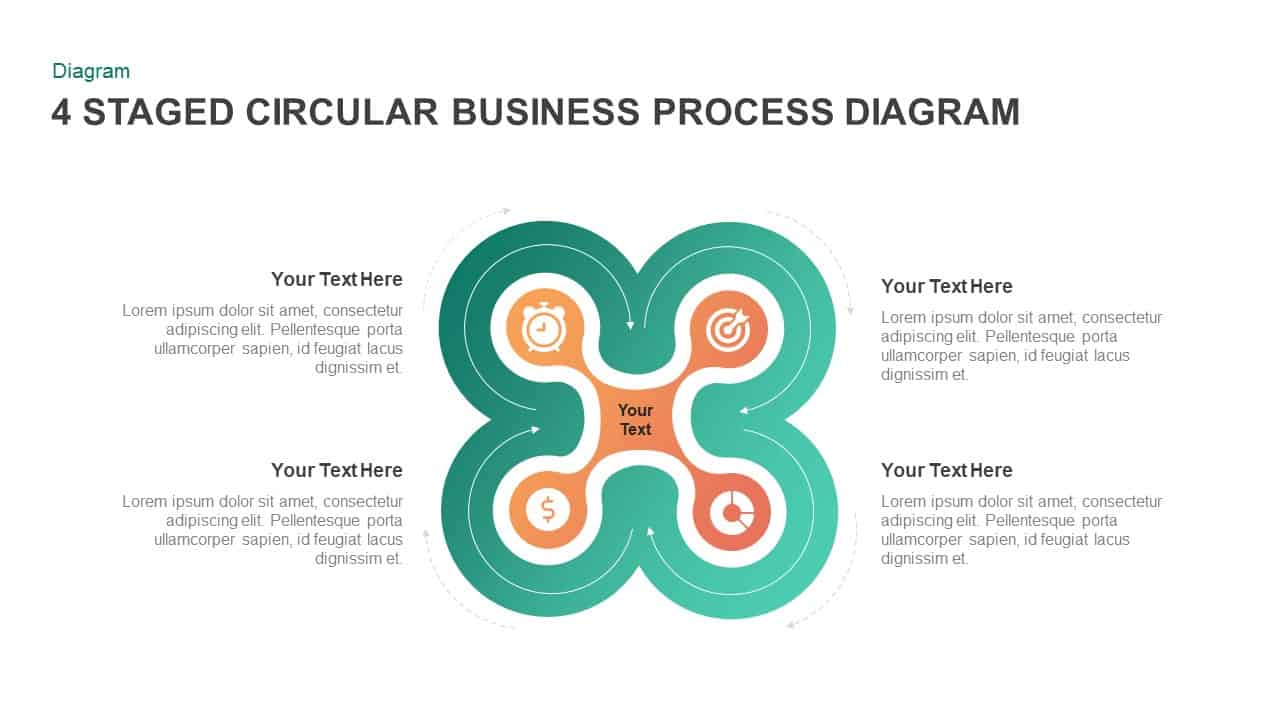
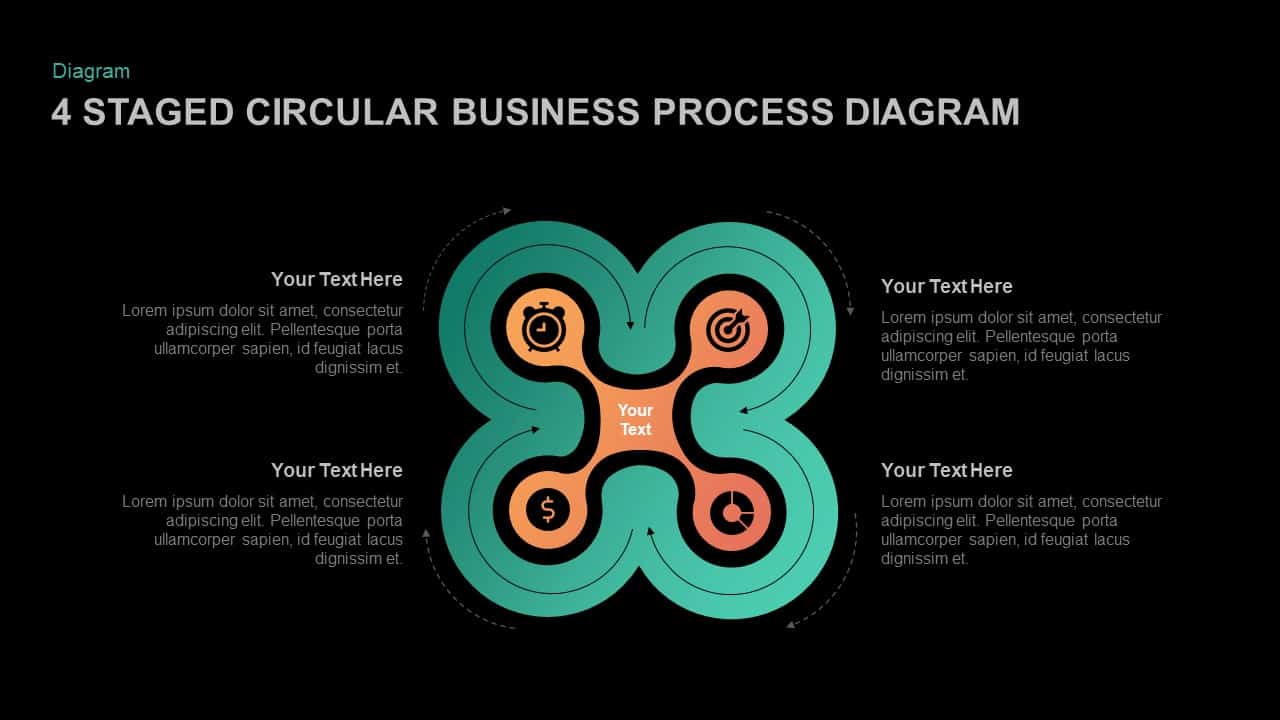
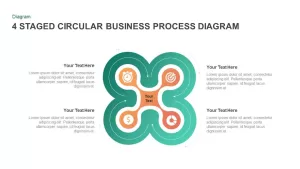
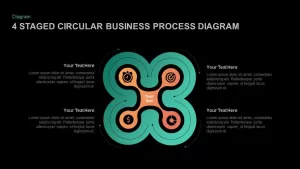
This 4 Staged Circular Business Process Diagram is designed to visually depict sequential stages of a business process, utilizing a circular layout for clear flow and easy comprehension. The diagram is divided into four distinct segments, each represented by an icon (e.g., stopwatch, target, dollar sign, and graph) in a modern color palette of green, orange, and gray. The slide allows you to highlight each process stage, adding custom text to describe the action or outcome at each step.
With a minimalistic yet modern design, this diagram ensures that your audience grasps the key process stages at a glance. Whether used for business strategy presentations, workflow documentation, or process mapping, this slide offers a professional and organized framework. The arrows within the diagram guide the flow of the process, making it easy to follow. The clean, easy-to-edit layout allows for quick customization of text, icons, and colors, while keeping the design simple and engaging.
This PowerPoint and Google Slides-ready diagram is ideal for business leaders, project managers, and consultants who need to clearly present and communicate processes, strategies, or action plans. The customizable elements make it adaptable to various types of business presentations, ensuring it meets your specific needs.
Who is it for
Business professionals, project managers, consultants, and team leaders who need to communicate clear, step-by-step processes or strategies will benefit from this diagram. It’s also useful for presentations aimed at stakeholders, clients, or cross-functional teams involved in process design, business strategy, or operational planning.
Other Uses
This diagram can be adapted for various purposes, such as illustrating stages of product development, customer journey maps, project timelines, or marketing processes. It can also be used in internal meetings, strategy sessions, and reports to display key process flows in a concise and visually engaging format. Duplicate and customize the diagram to track key performance indicators or project milestones over time.
Login to download this file

Item ID
SB01590
Related Templates

4 Staged Circular Business Process Diagram template for PowerPoint & Google Slides
Process
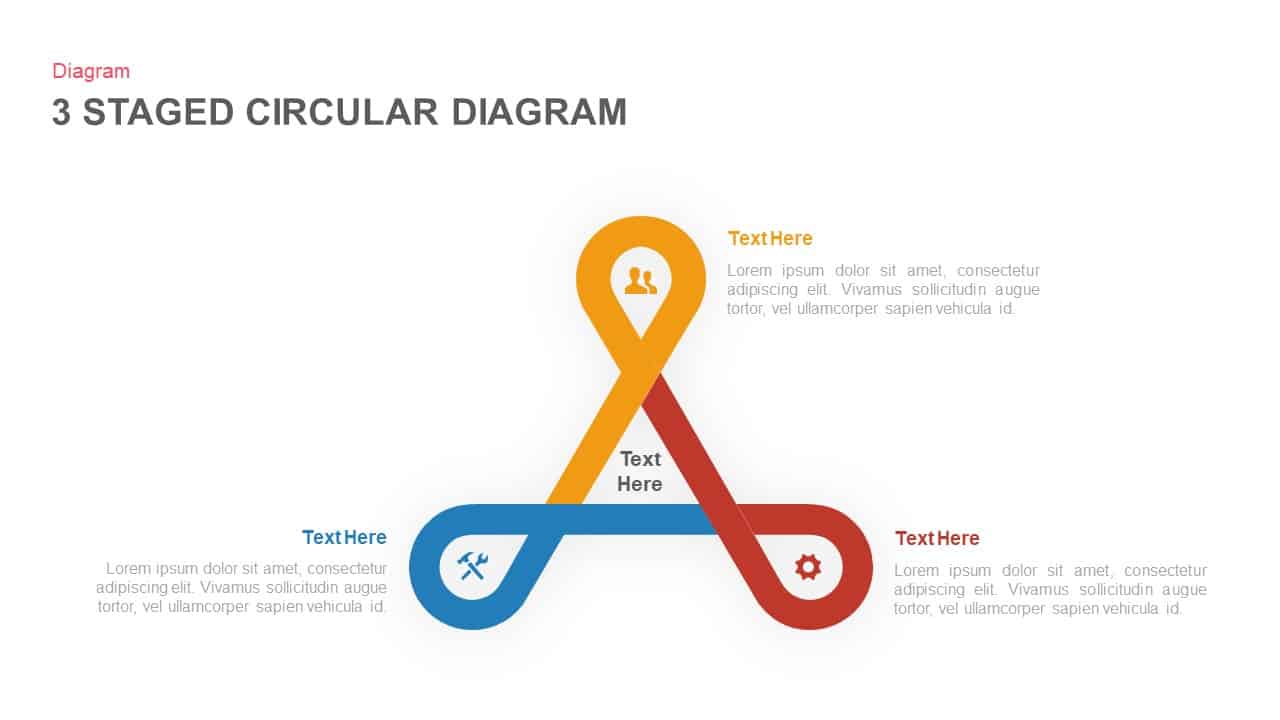
Three to Six Staged Circular Diagram Template for PowerPoint & Google Slides
Process

Four-Staged Business Arrow Diagram Template for PowerPoint & Google Slides
Process
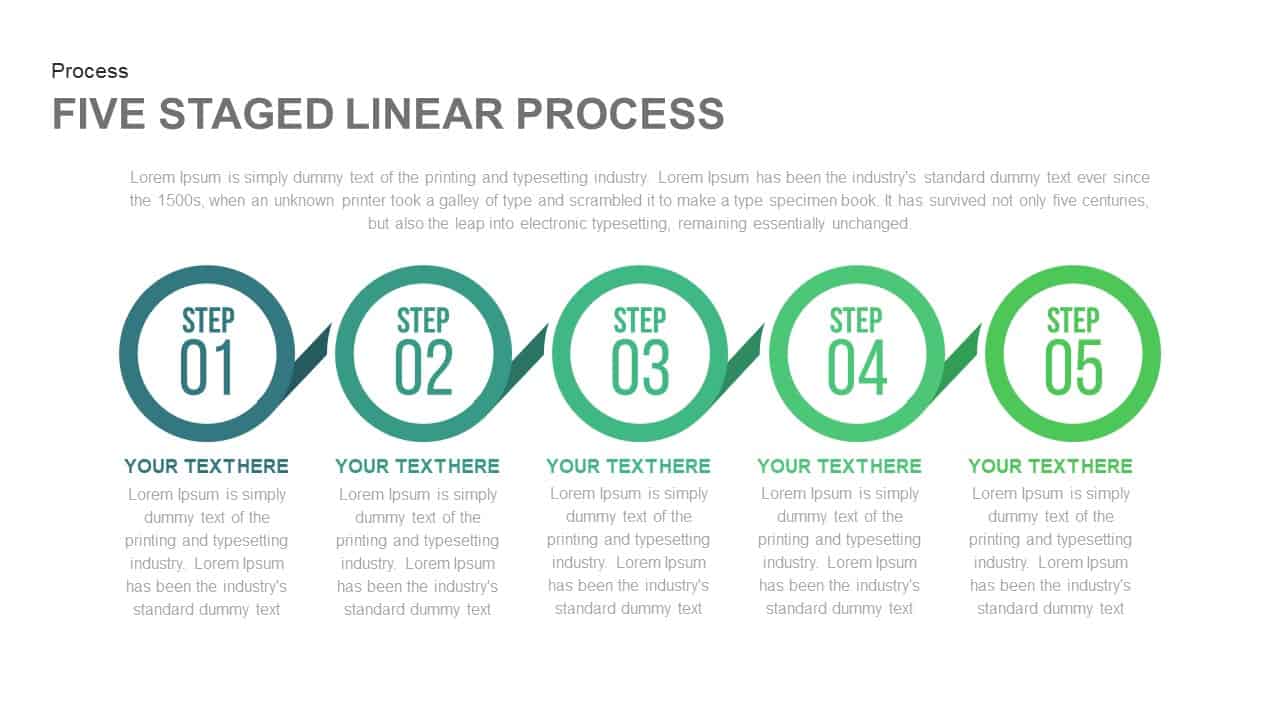
Five Staged Linear Process for PowerPoint & Google Slides
Process
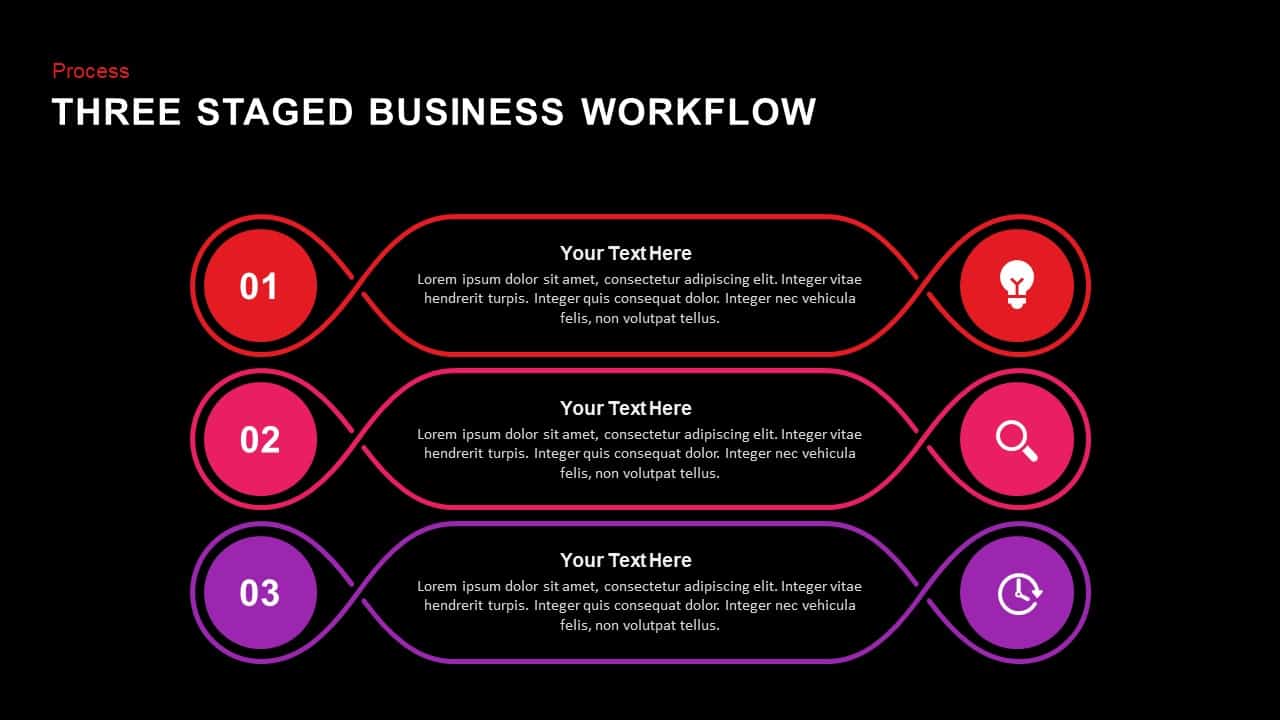
Three Staged Business Workflow template for PowerPoint & Google Slides
Business
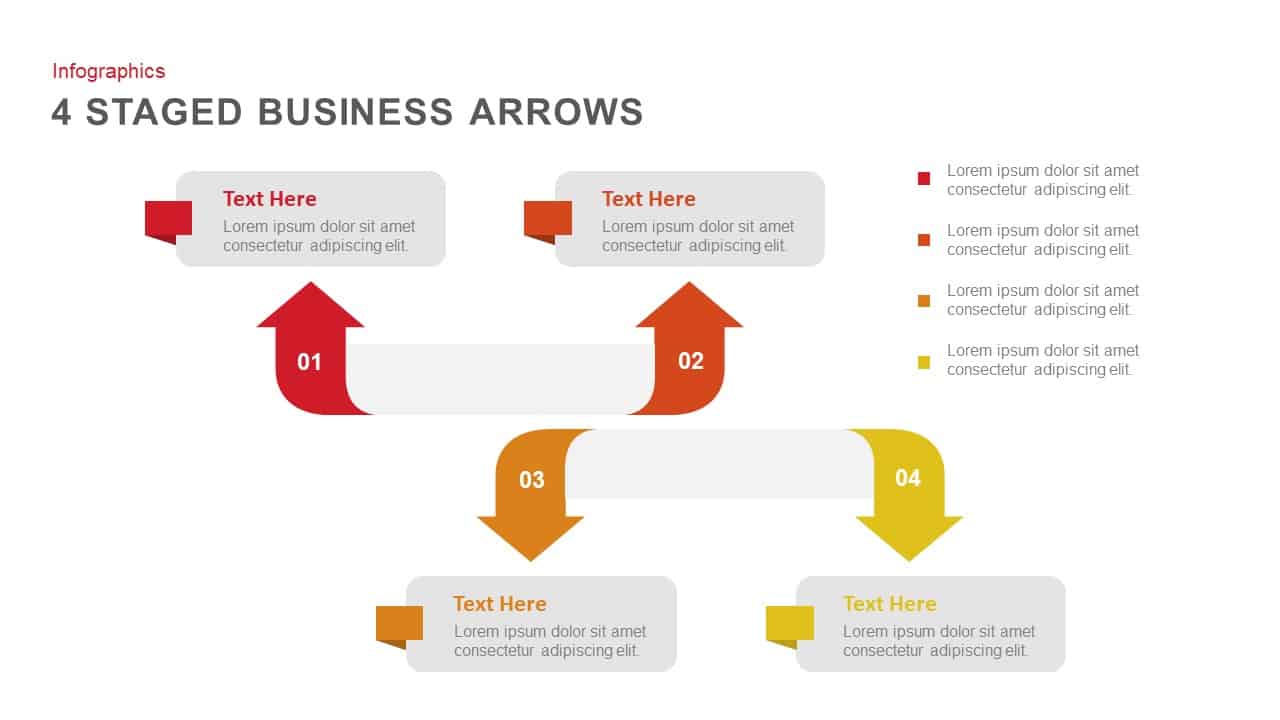
4 Staged Business Arrows Infographic Template for PowerPoint & Google Slides
Arrow
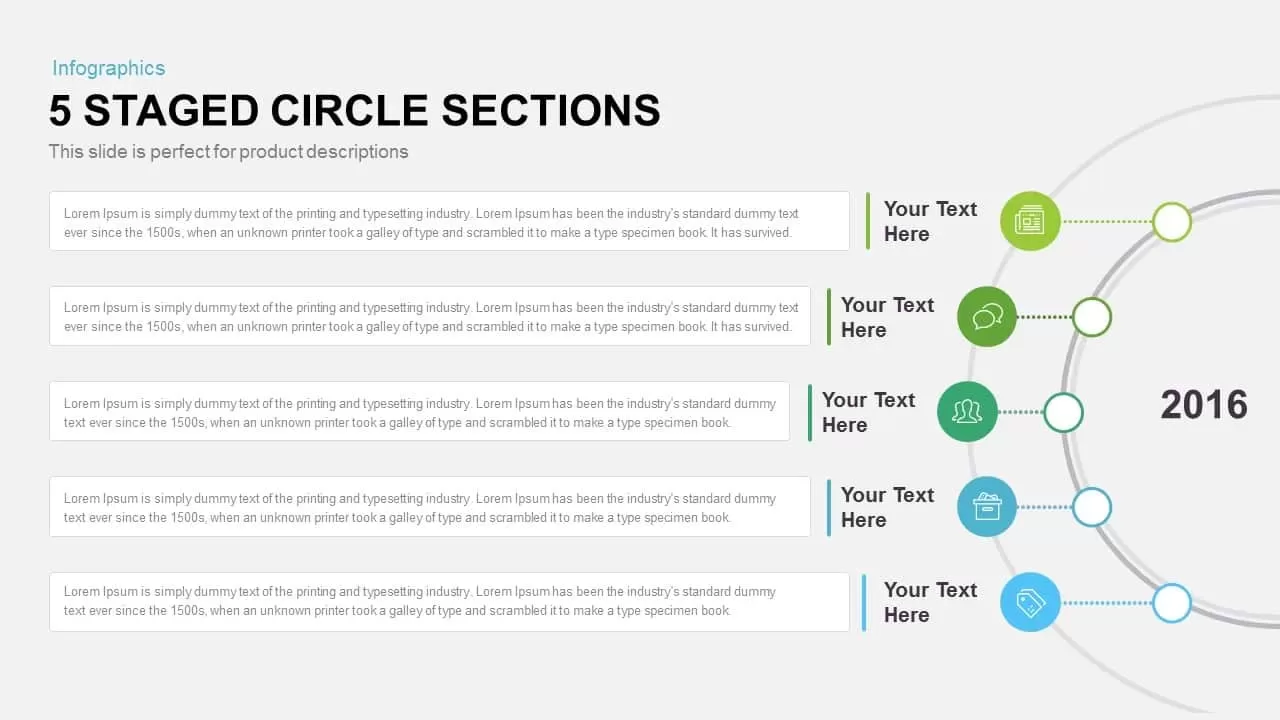
Five-Staged Circle Sections Diagram Template for PowerPoint & Google Slides
Circular
Six-Staged Gear Diagram Framework Template for PowerPoint & Google Slides
Process

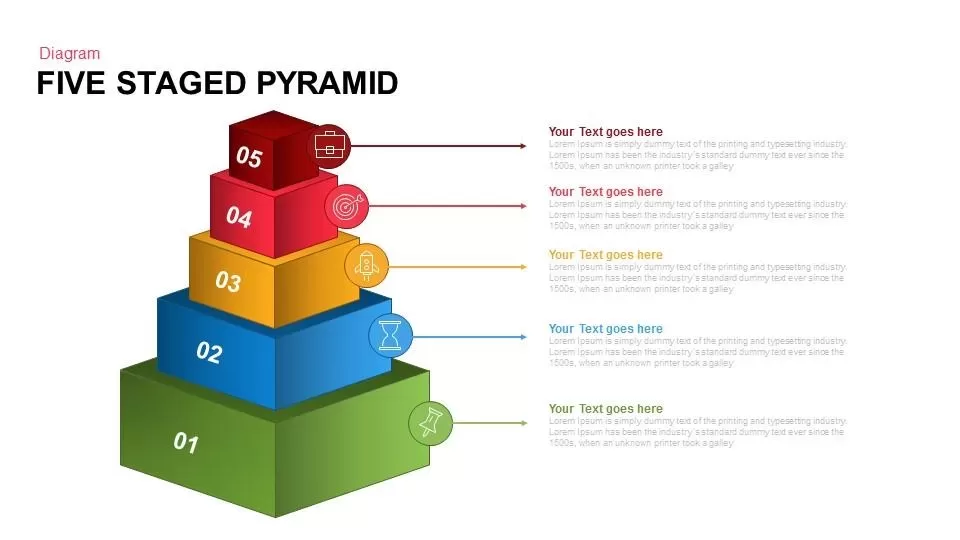
Five Staged Pyramid Diagram for PowerPoint & Google Slides
Pyramid

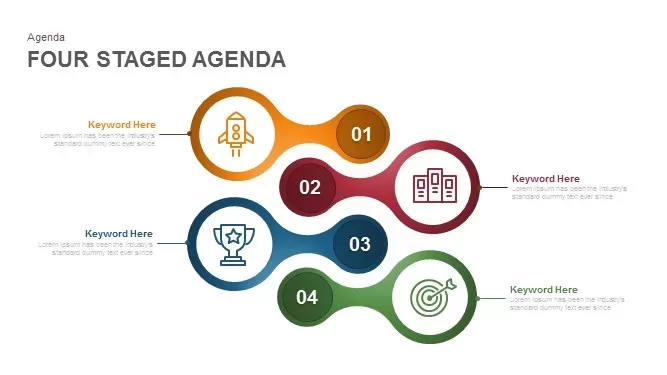
Four Staged Agenda Diagram for PowerPoint & Google Slides
Agenda
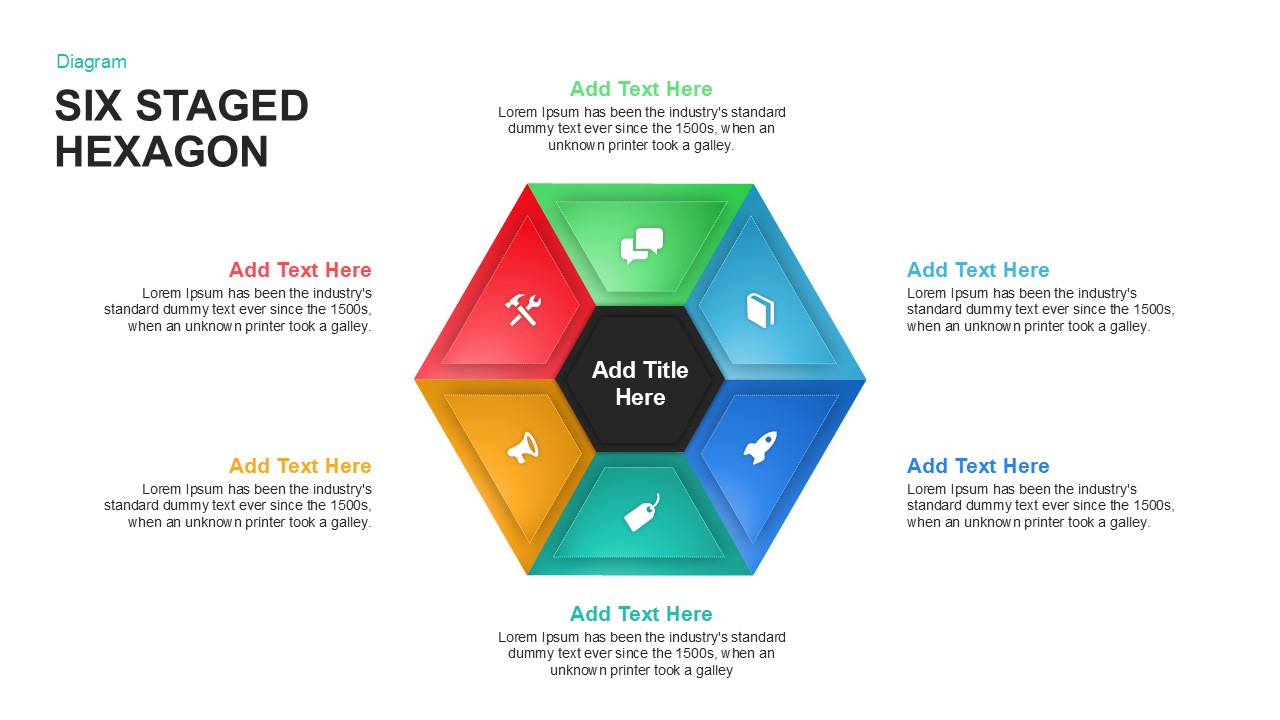
Six Staged Hexagon Diagram for PowerPoint & Google Slides
Process

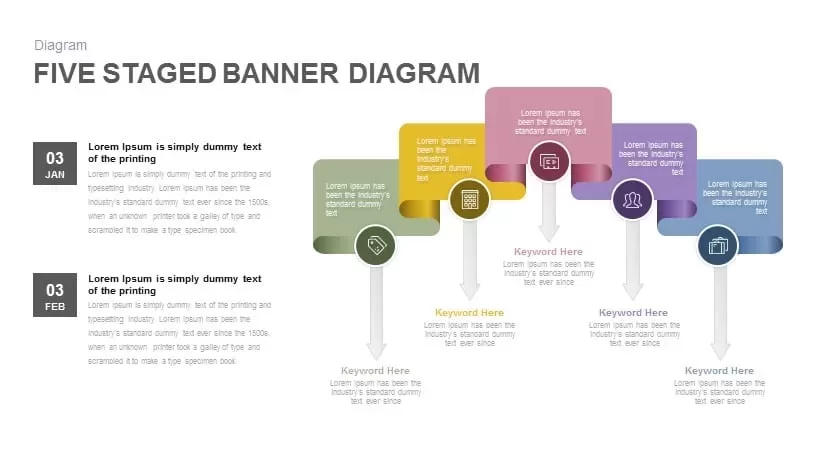
Elegant Five Staged Banner Diagram Template for PowerPoint & Google Slides
Process
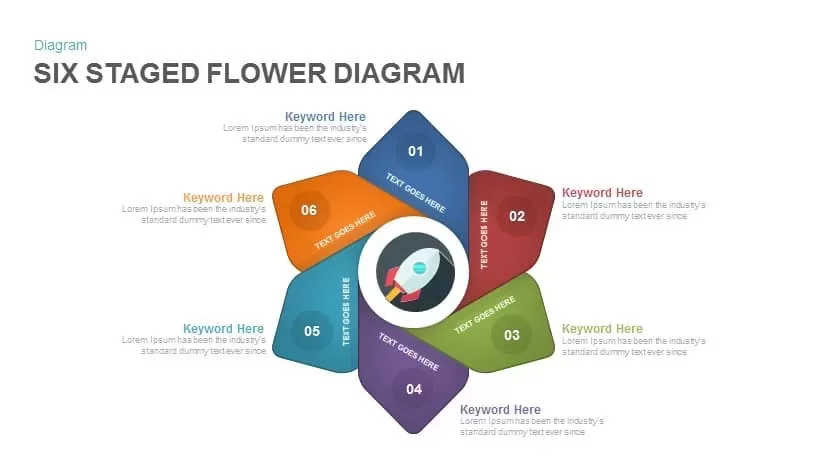
Six Staged Flower Diagram for PowerPoint & Google Slides
Process
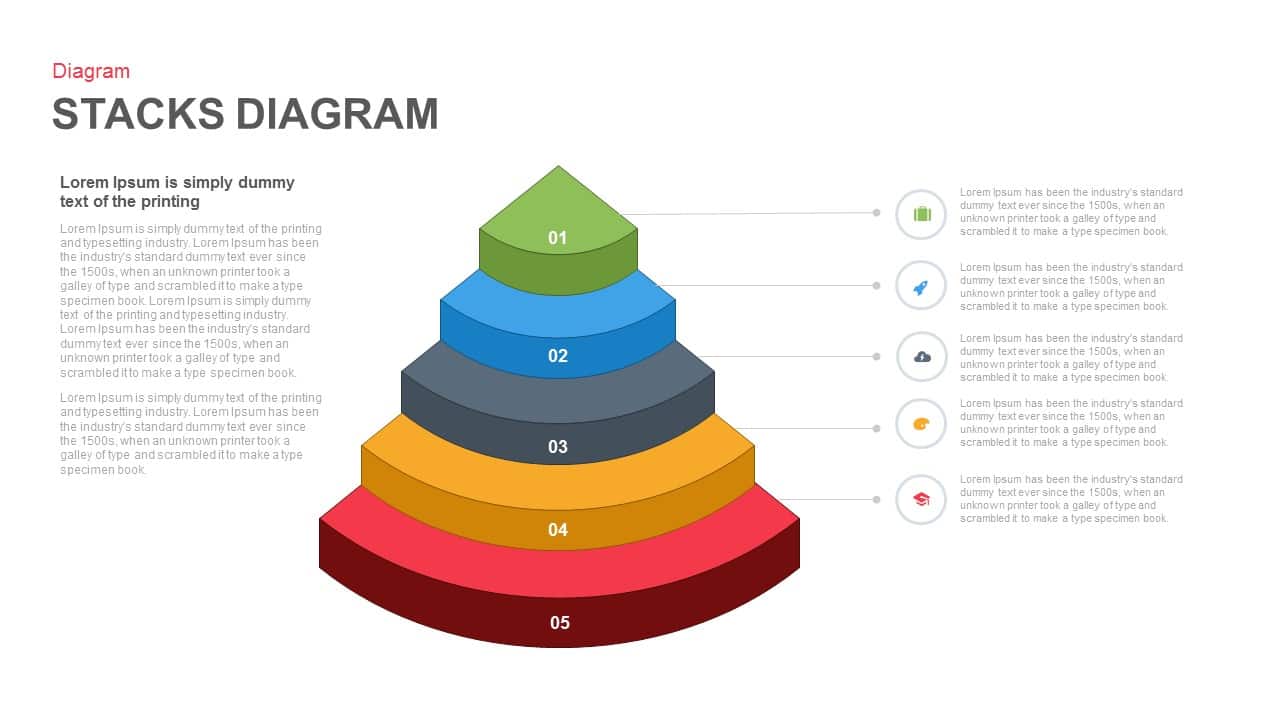
Five Staged Stacks Diagram for PowerPoint & Google Slides
Process
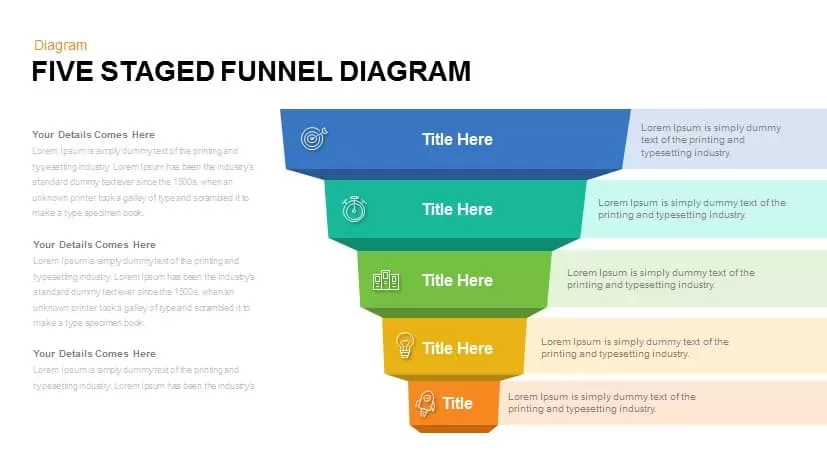
Five Staged Funnel Diagram for PowerPoint & Google Slides
Funnel

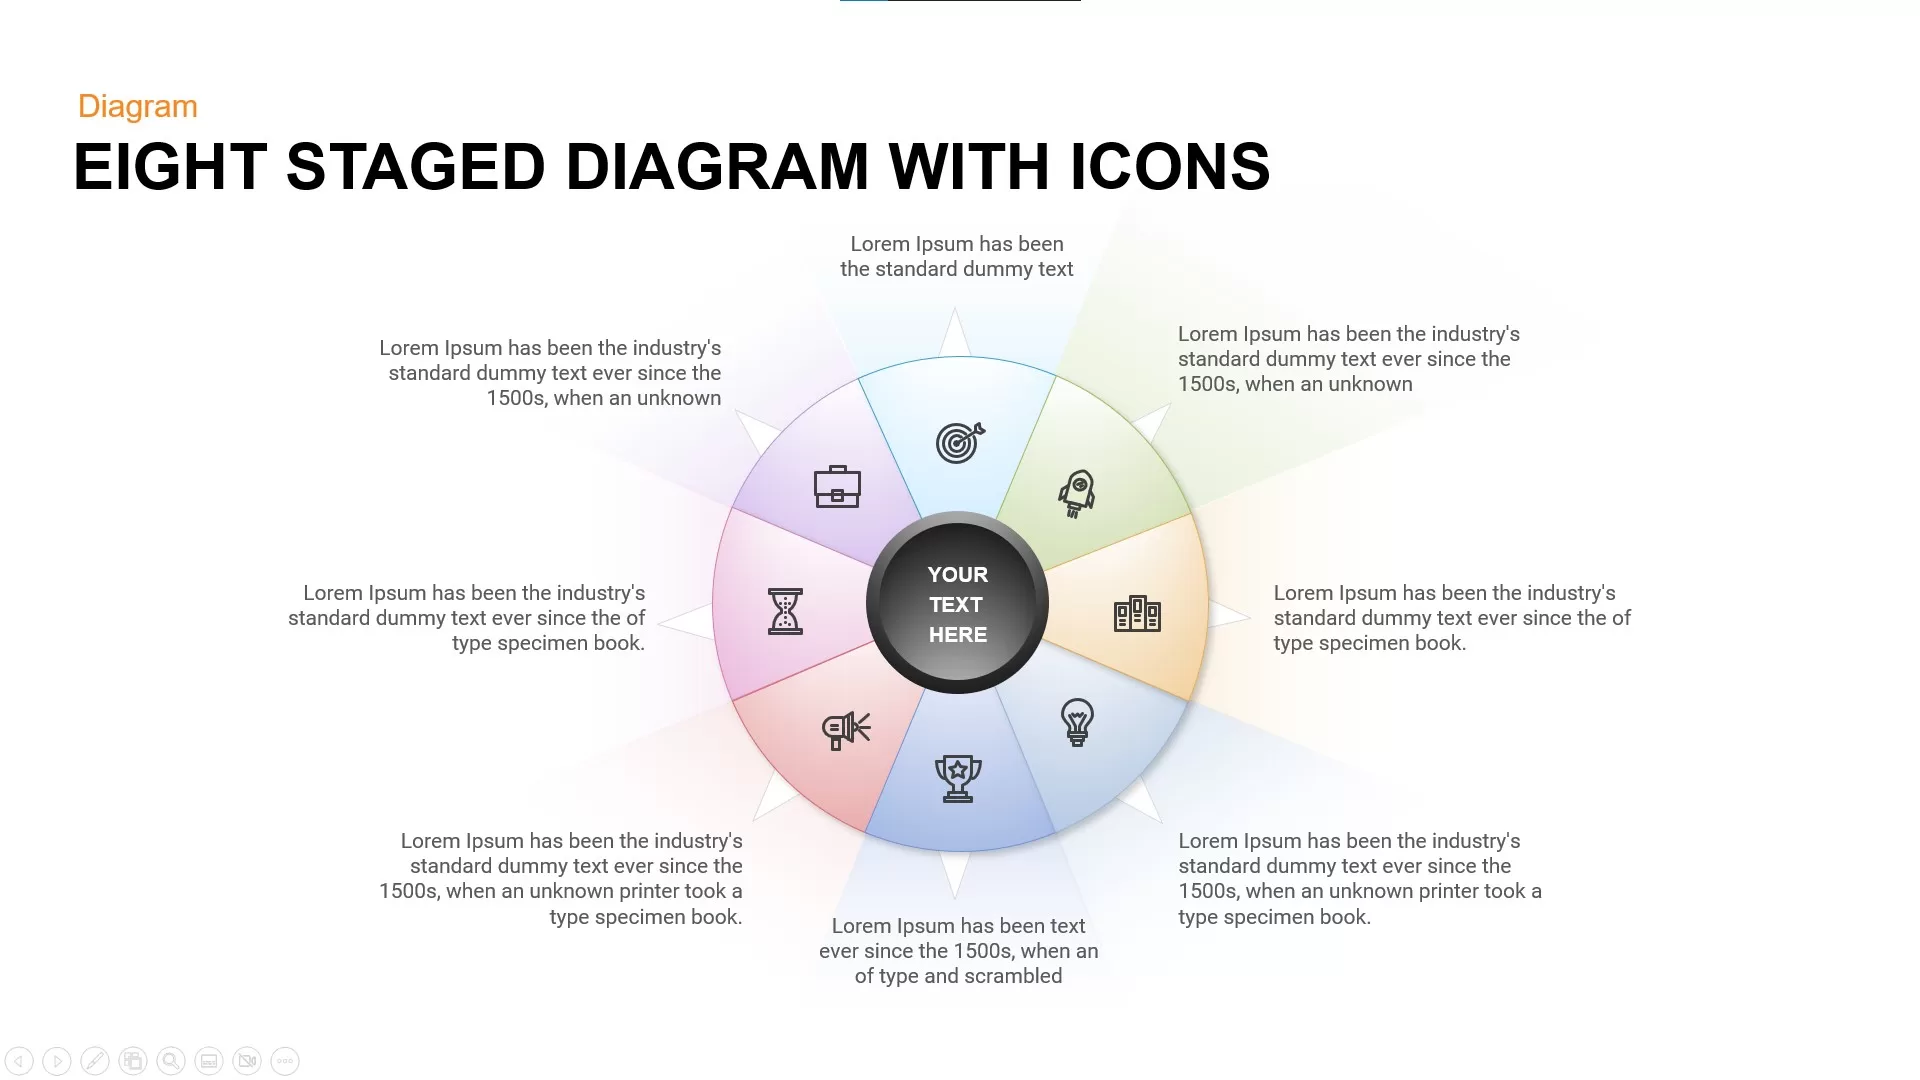
Eight Staged Diagram with Icons template for PowerPoint & Google Slides
Process
Free
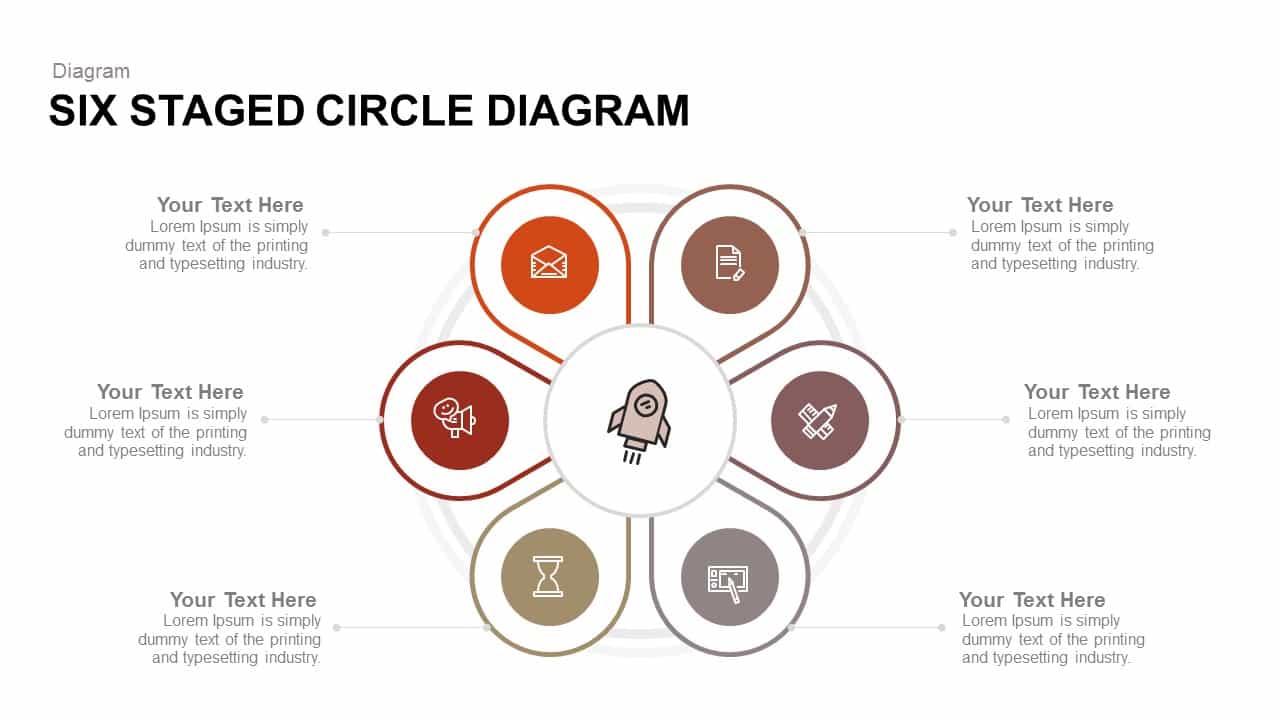
Six Staged Circle Diagram template for PowerPoint & Google Slides
Circular
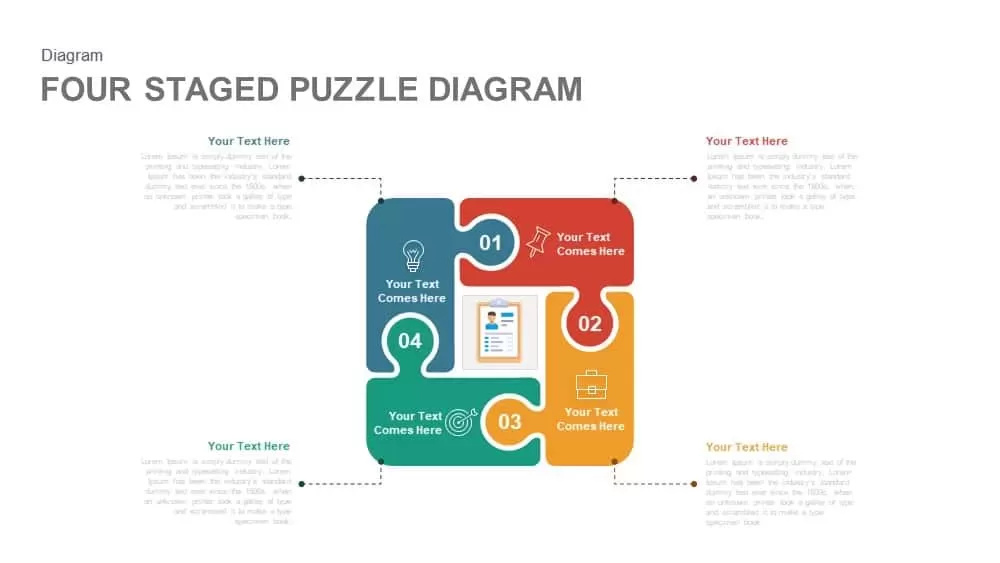
Four-Staged Puzzle Diagram Slide Template for PowerPoint & Google Slides
Process
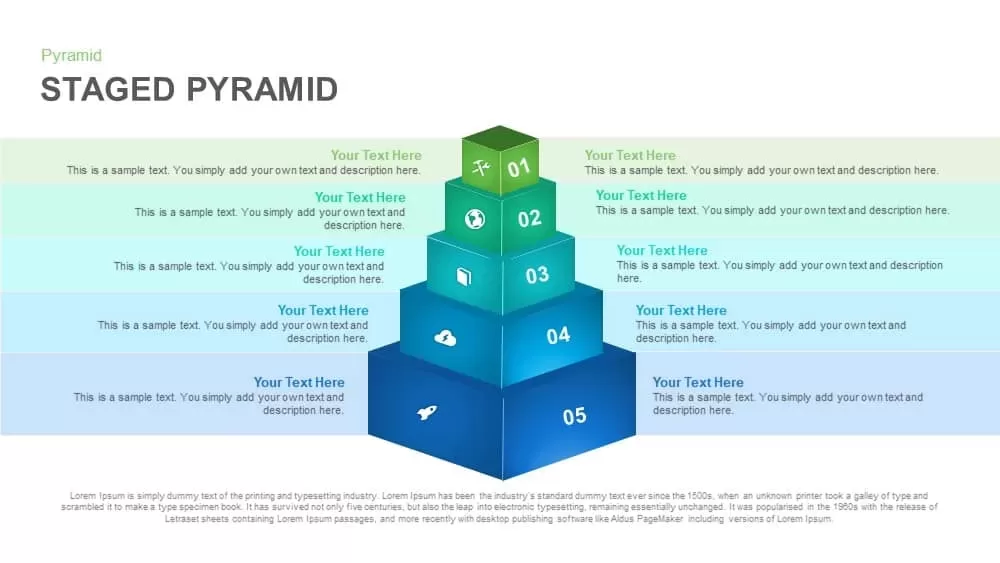
Five-Level Staged Pyramid Diagram Template for PowerPoint & Google Slides
Pyramid
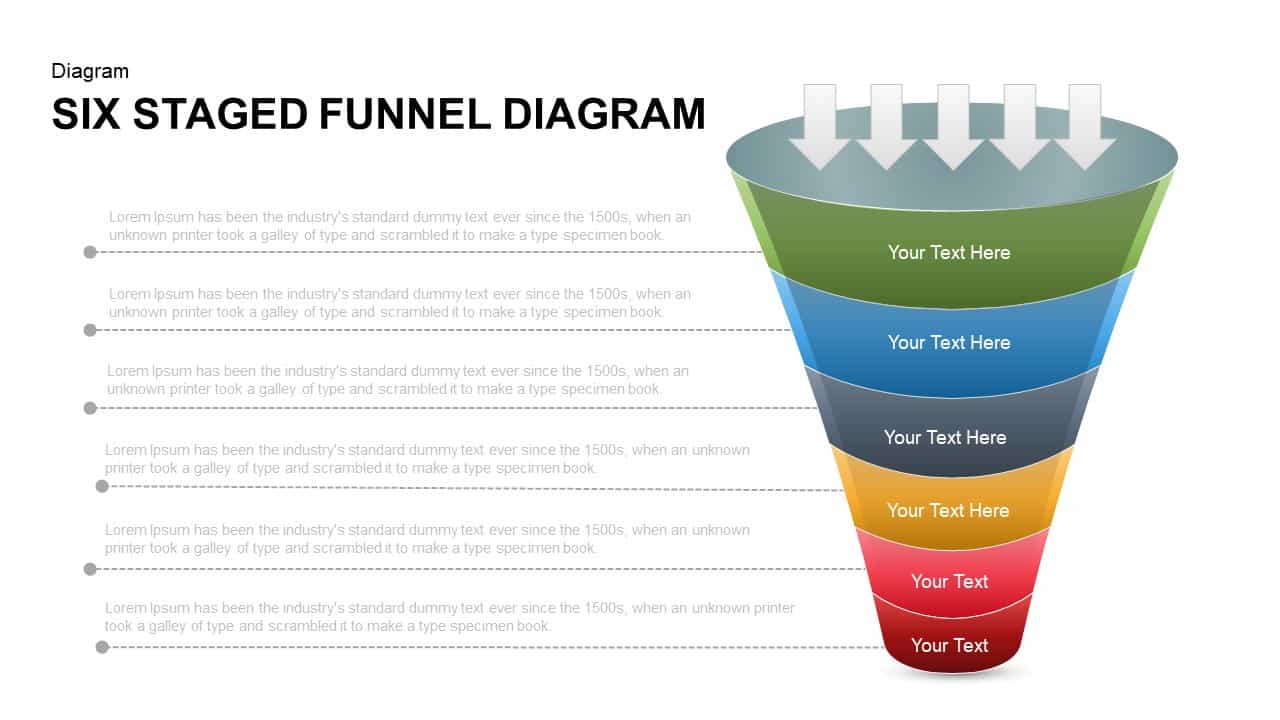
Six Staged Funnel Diagram for PowerPoint & Google Slides
Funnel
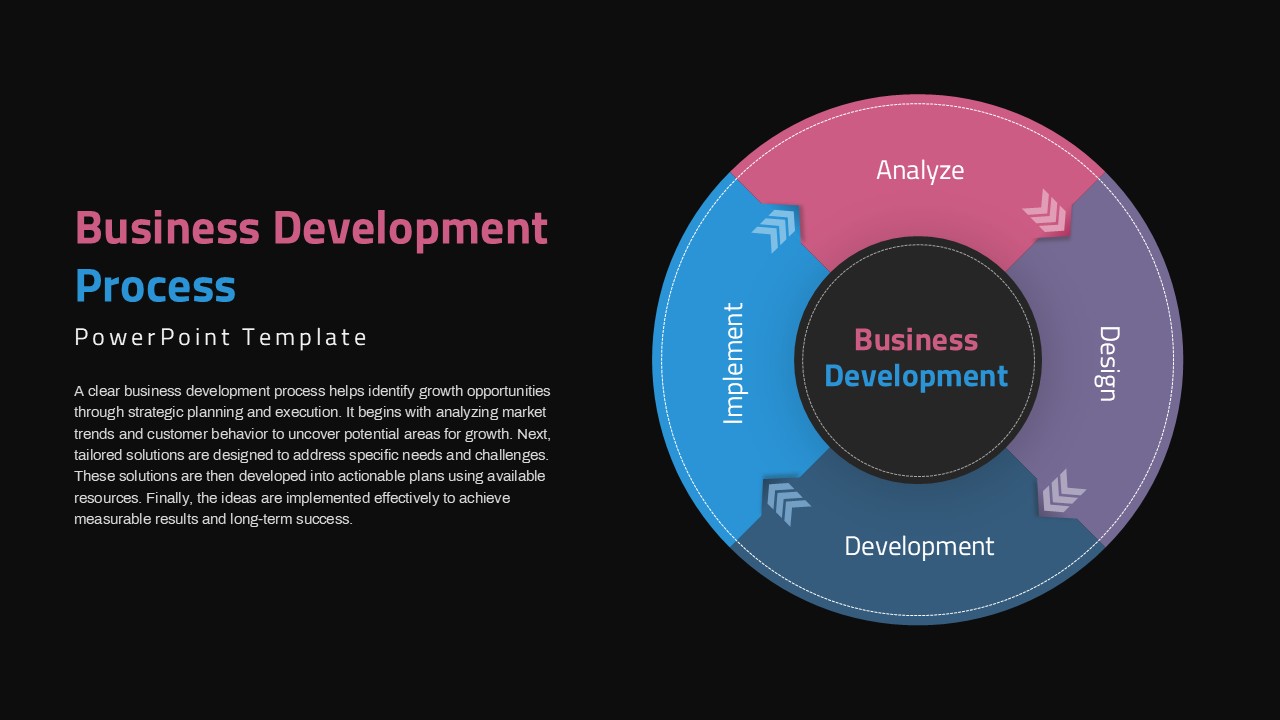
Circular Business Development Process Template for PowerPoint & Google Slides
Process
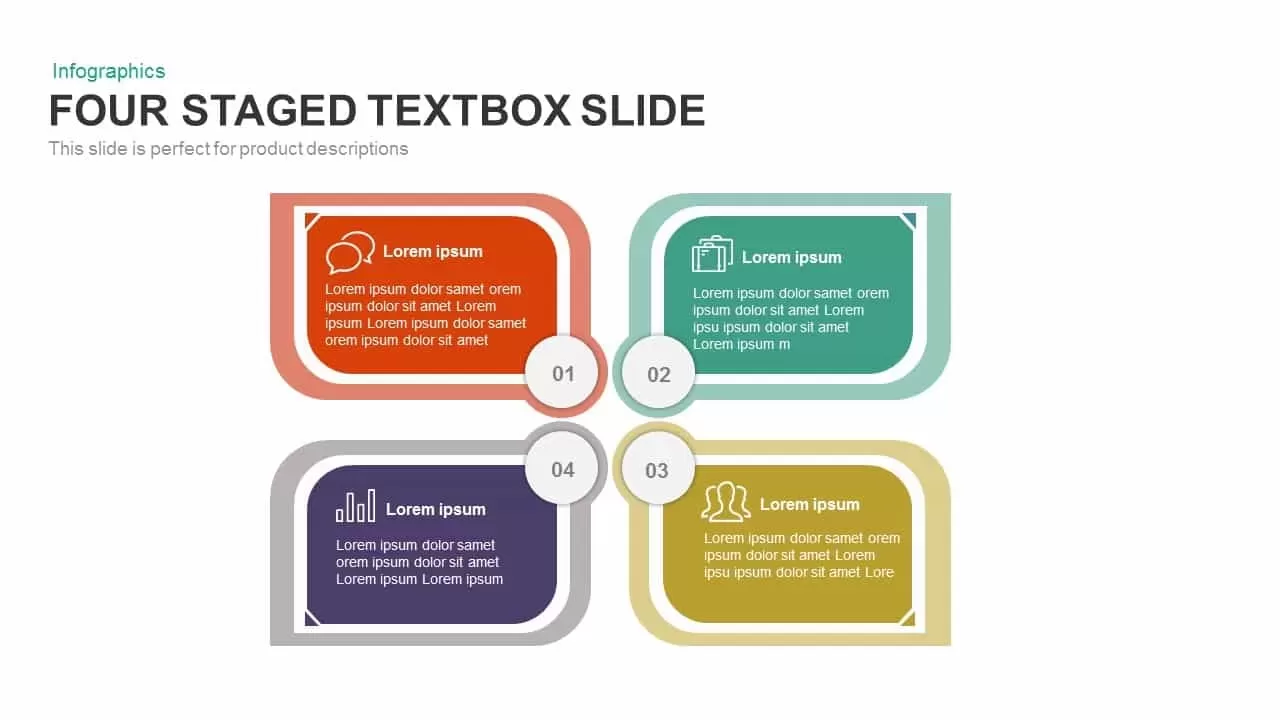
Four-Staged Textbox Infographic Template for PowerPoint & Google Slides
Process

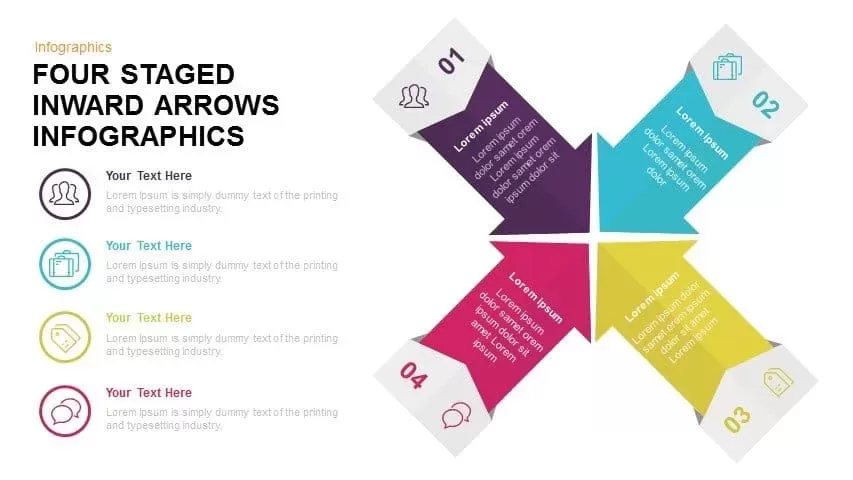
Four Staged Inward Arrows Infographic Template for PowerPoint & Google Slides
Arrow
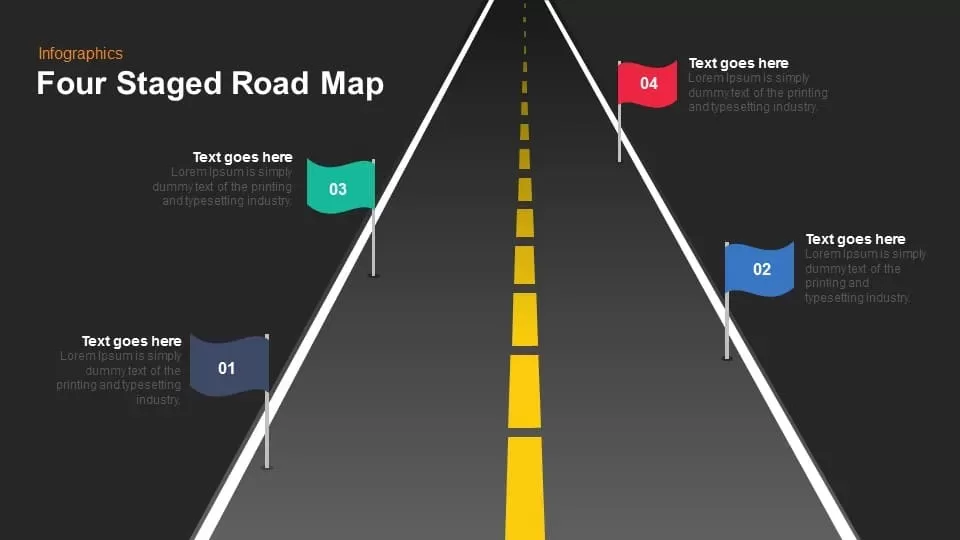
Four Staged Road Map template for PowerPoint & Google Slides
Roadmap
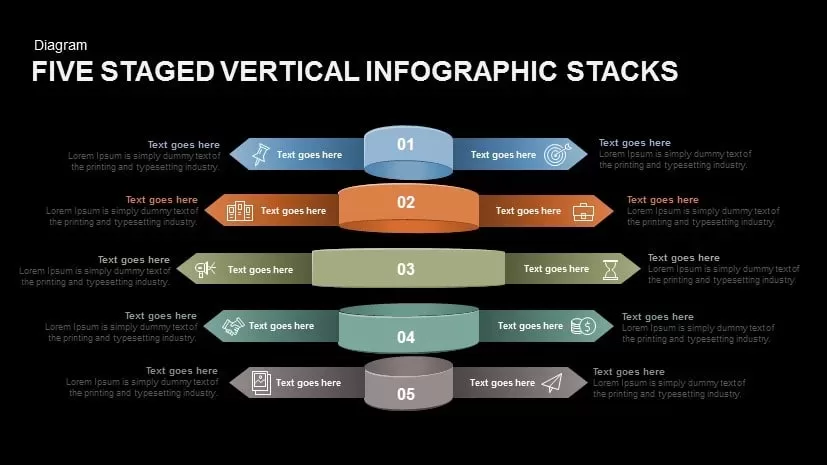
Five Staged Vertical Infographic Stacks for PowerPoint & Google Slides
Process
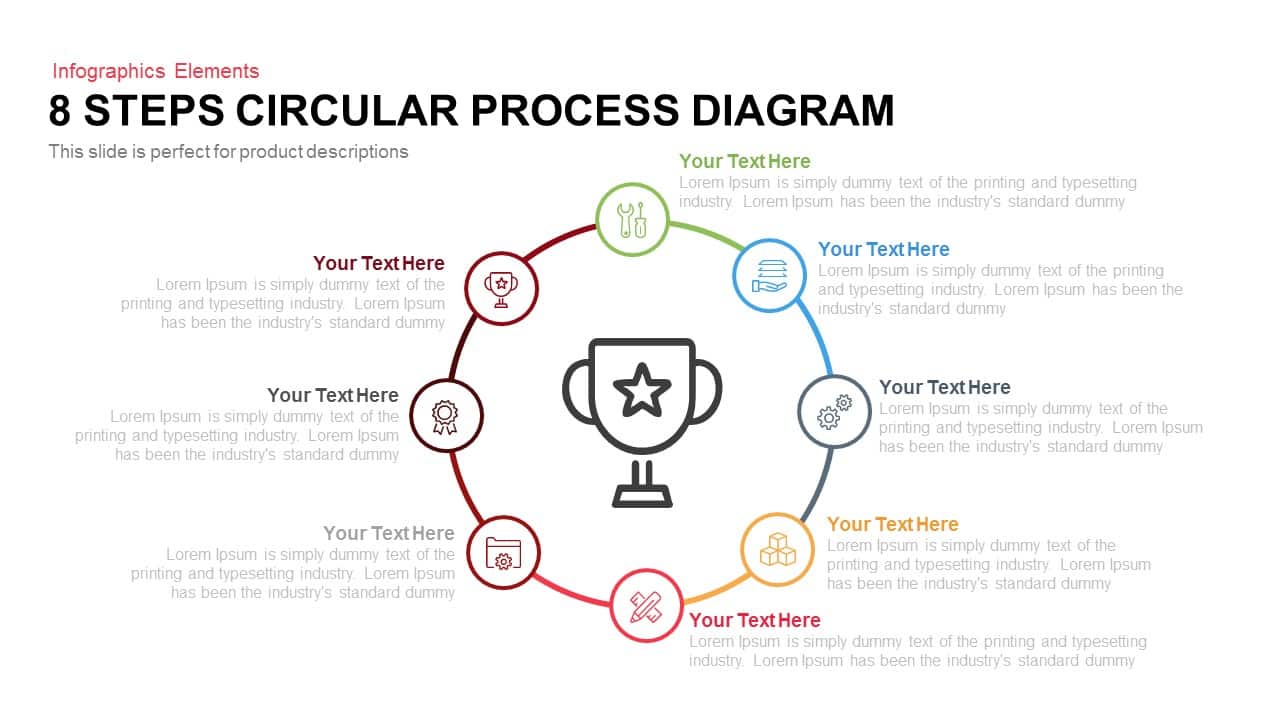
8 Steps Circular Process Diagram Template for PowerPoint & Google Slides
Process
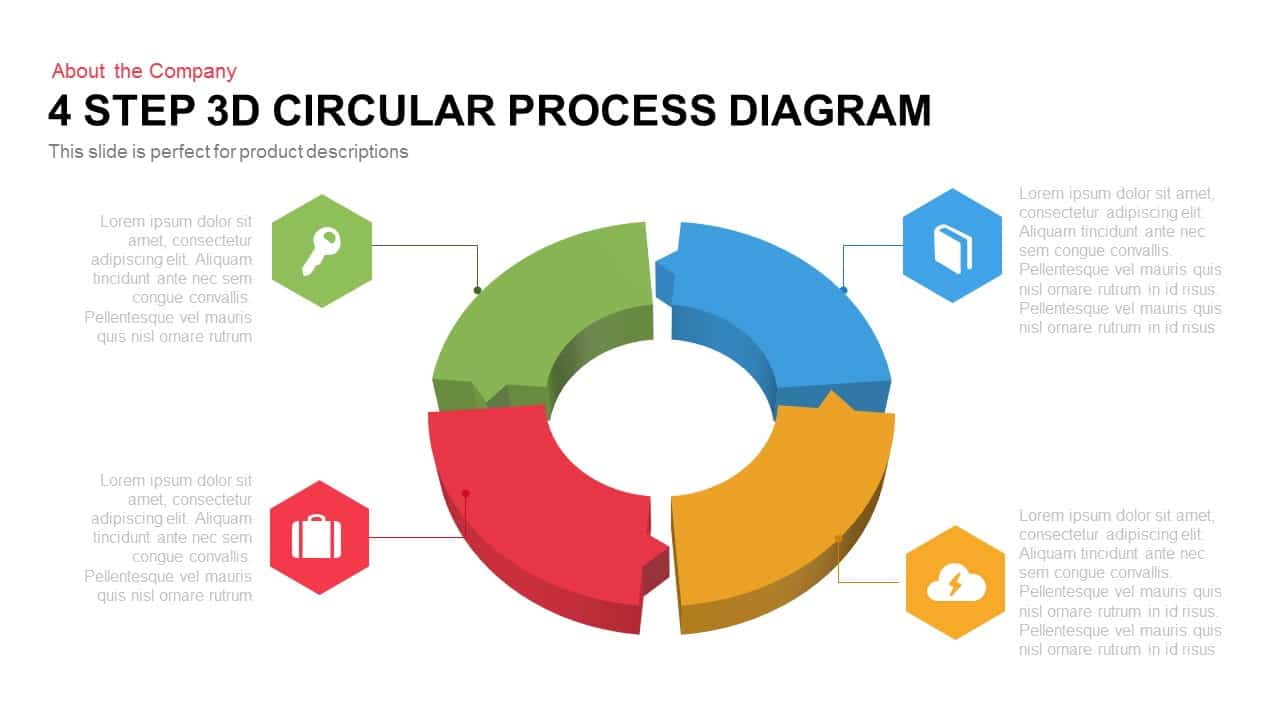
4 Step 3D Circular Process Diagram template for PowerPoint & Google Slides
Process
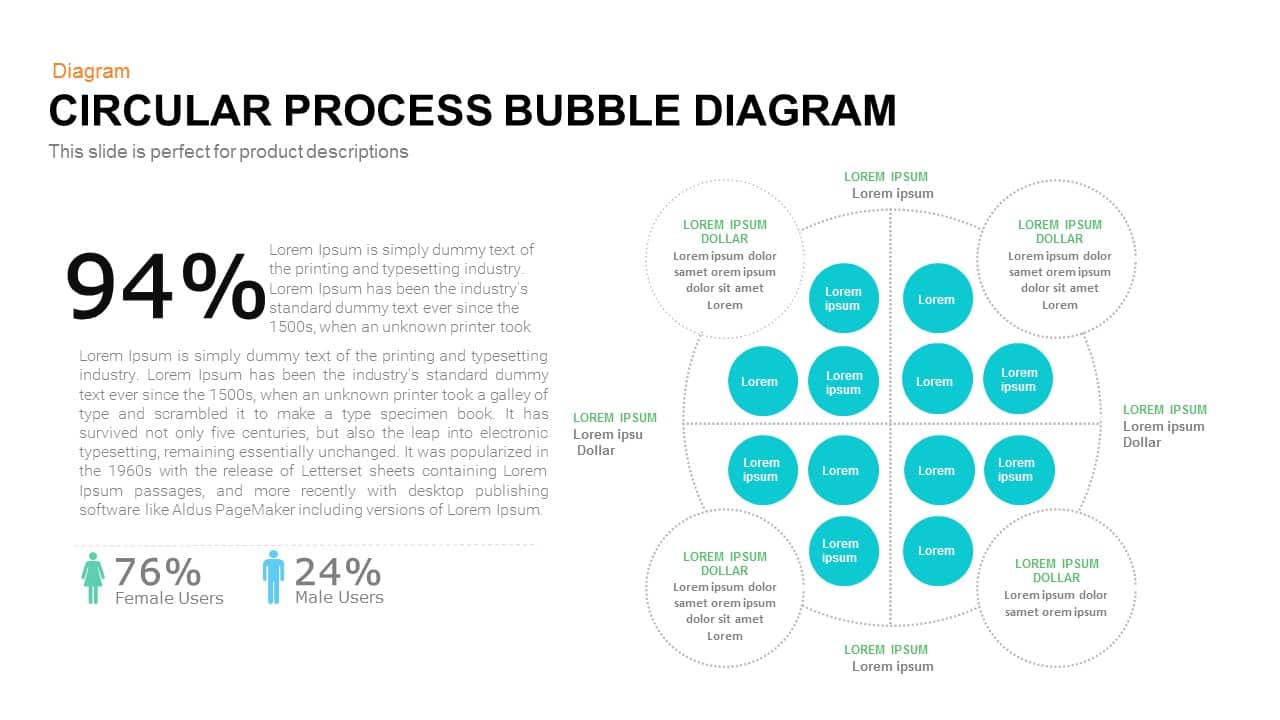
Bubble Circular Process Diagram Template for PowerPoint & Google Slides
Process
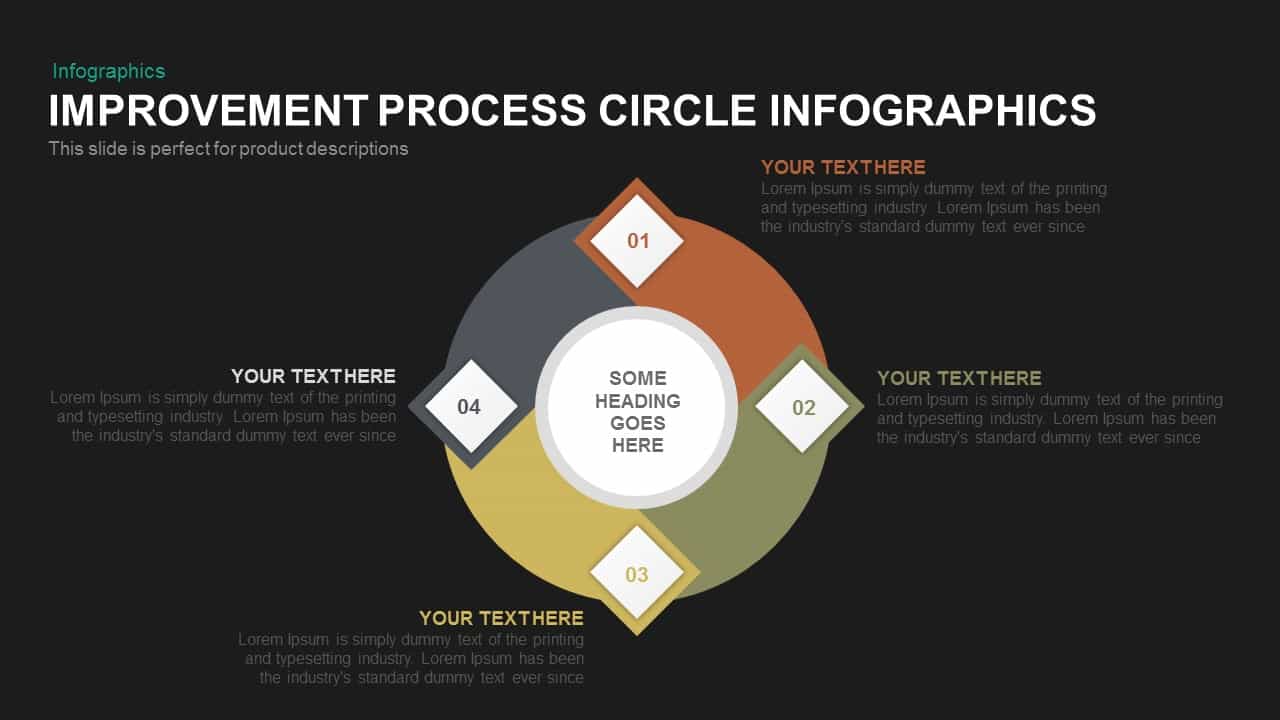
Circular Improvement Process Diagram Template for PowerPoint & Google Slides
Process
Six-Process Circular Arrow Diagram Template for PowerPoint & Google Slides
Circular
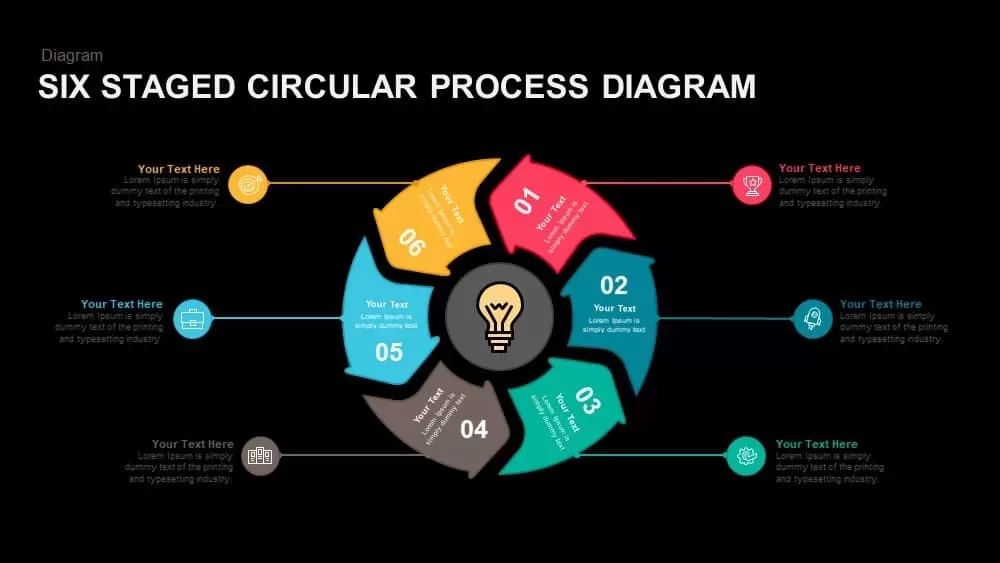
Six-Stage Circular Process Diagram Template for PowerPoint & Google Slides
Process
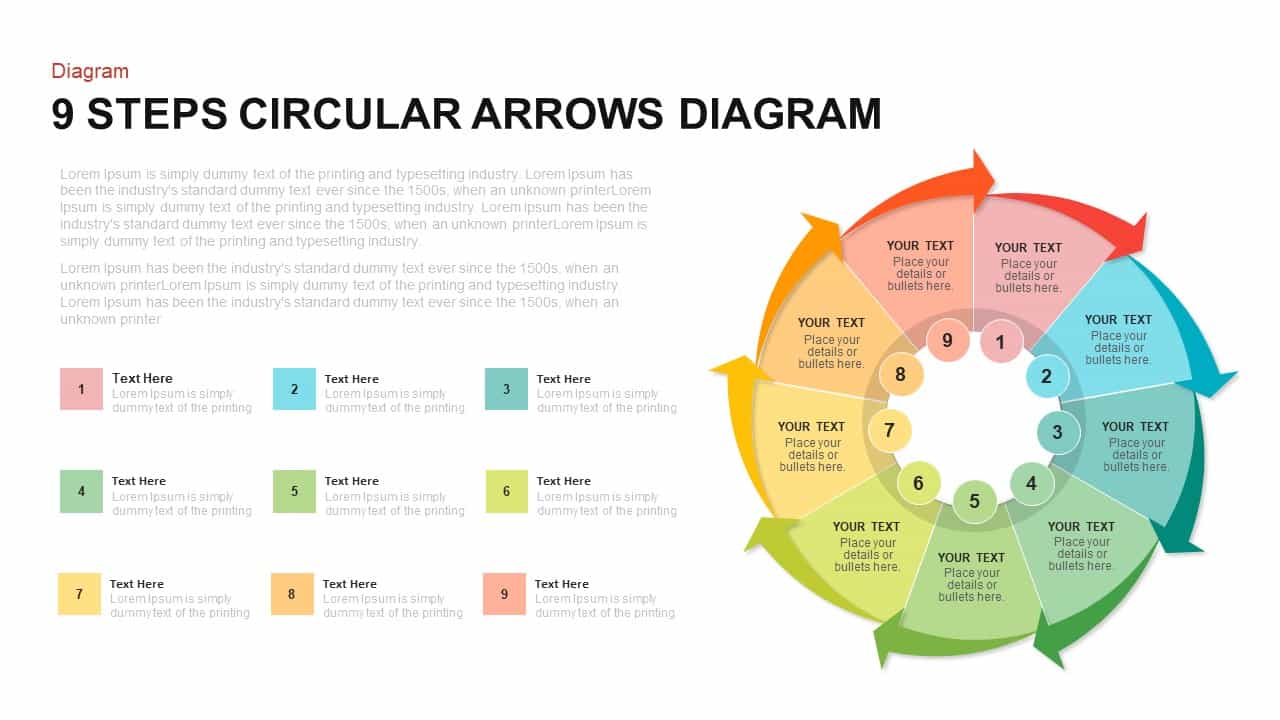
9-Step Circular Arrows Process Diagram Template for PowerPoint & Google Slides
Process
Six-Stage Circular Diagram Process Template for PowerPoint & Google Slides
Circular
Five-Stage Circular Process Diagram Template for PowerPoint & Google Slides
Circular
8 Steps Circular Process Diagram Template for PowerPoint & Google Slides
Circular
Five-Stage Circular Process Flow Diagram Template for PowerPoint & Google Slides
Circular
Five-Step Circular Process Diagram Template for PowerPoint & Google Slides
Circular
Circular CRM Process Diagram Infographic Template for PowerPoint & Google Slides
Circular
8 Step Circular Process Flow Diagram Template for PowerPoint & Google Slides
Process
6-Step Circular Process Flow Diagram Template for PowerPoint & Google Slides
Process
Value Chain Circular Process Diagram Template for PowerPoint & Google Slides
Business Models

Circular CRM Process Infographic Diagram Template for PowerPoint & Google Slides
Circular
Circular Arrow Process Diagram Template for PowerPoint & Google Slides
Circular
10-Step Circular Process Diagram Template for PowerPoint & Google Slides
Process
10-Step Circular Process Diagram Template for PowerPoint & Google Slides
Process
10 Step Circular Process Diagram Template for PowerPoint & Google Slides
Circular
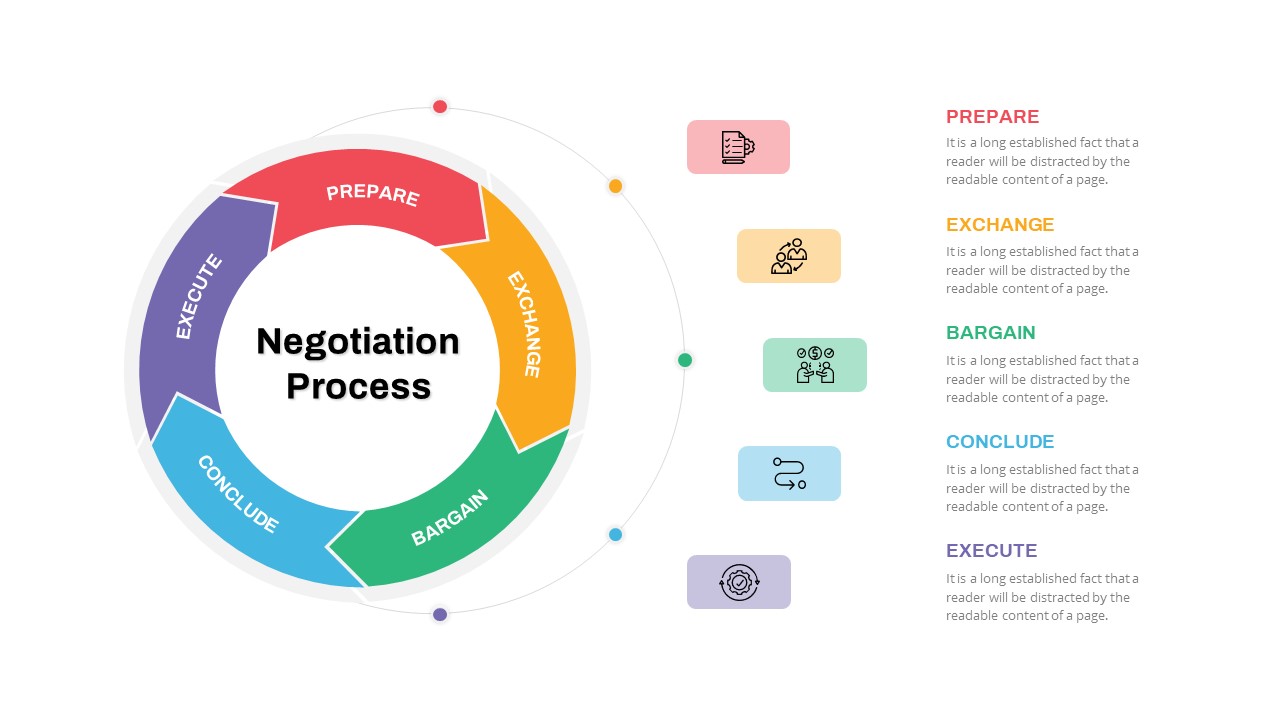
Negotiation Process Circular Diagram Template for PowerPoint & Google Slides
Circular
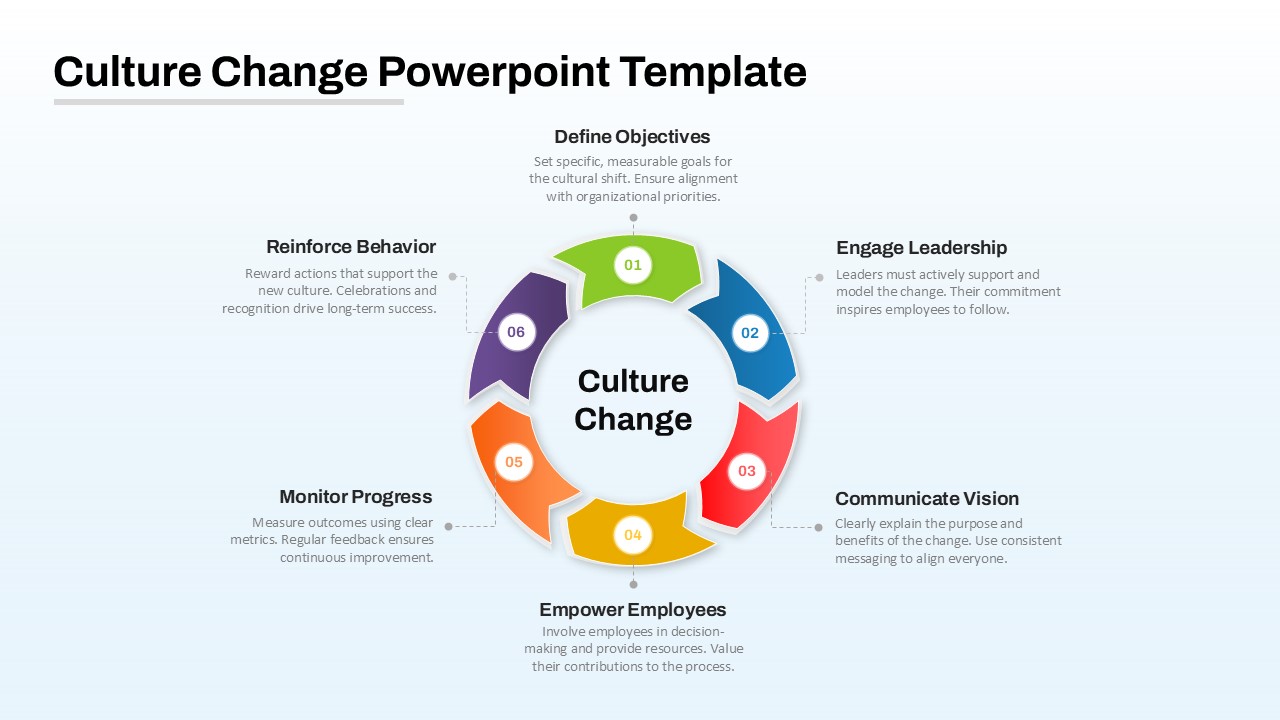
Culture Change Circular Process Diagram Template for PowerPoint & Google Slides
Process
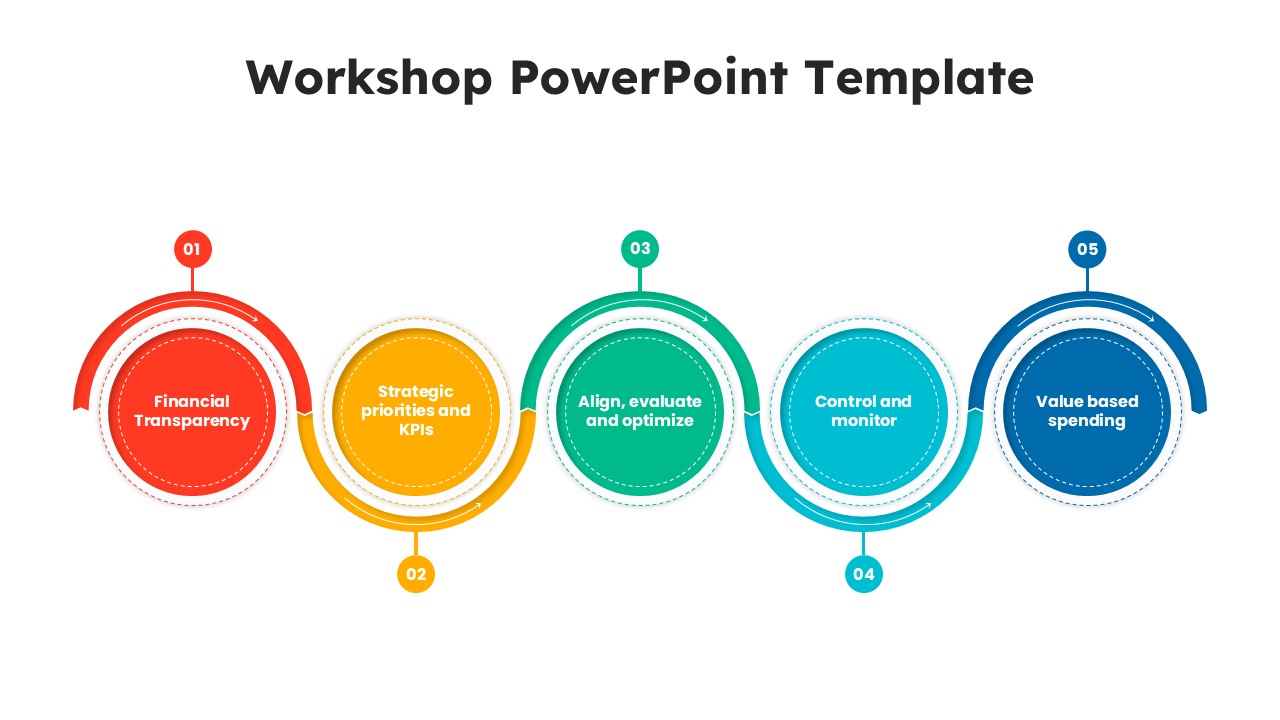
Workshop 5-Step Circular Process Diagram Template for PowerPoint & Google Slides
Circular
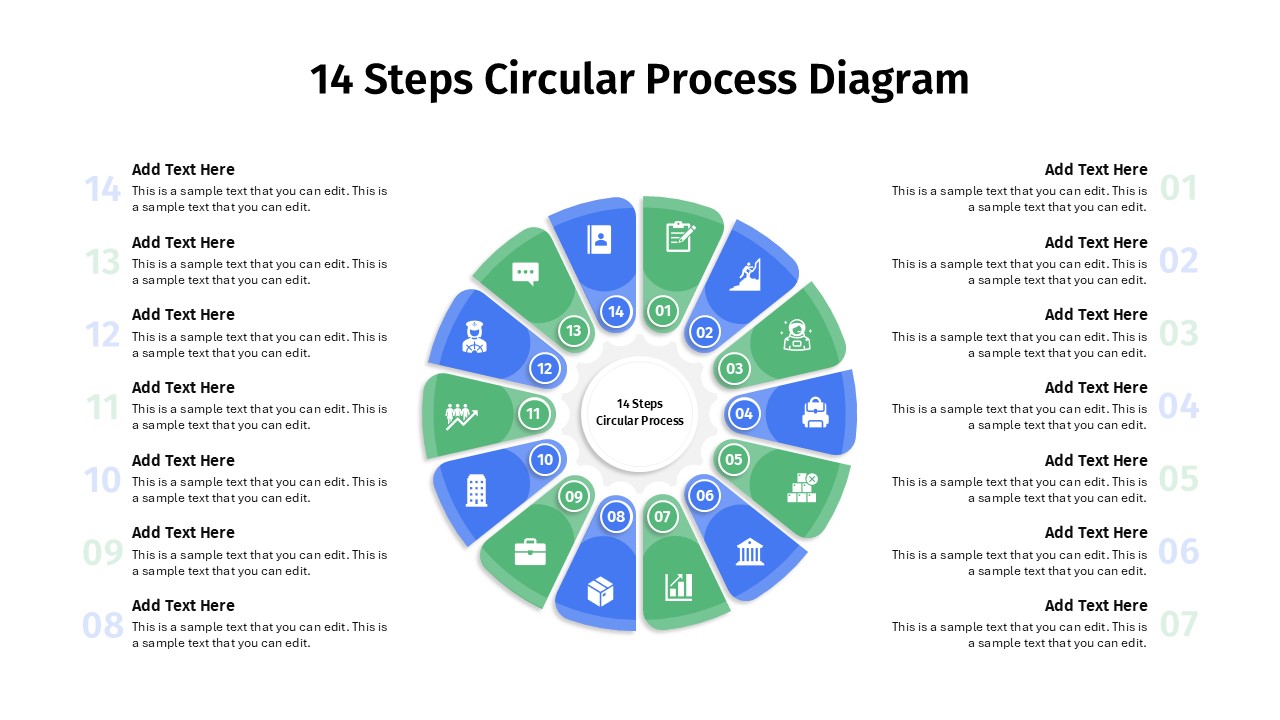
14 Steps Circular Process Diagram Template for PowerPoint & Google Slides
Circular
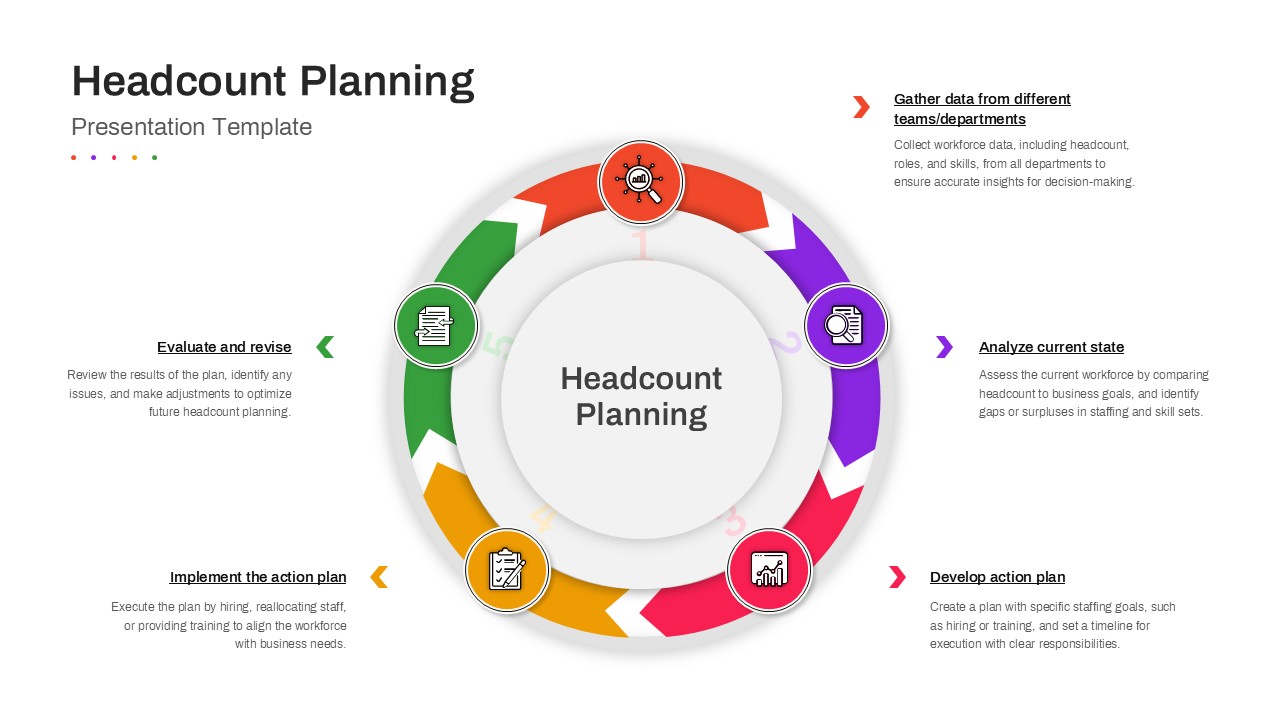
Headcount Planning Circular Process Diagram Template for PowerPoint & Google Slides
HR
Four-Stage Business Circular Diagram Template for PowerPoint & Google Slides
Process
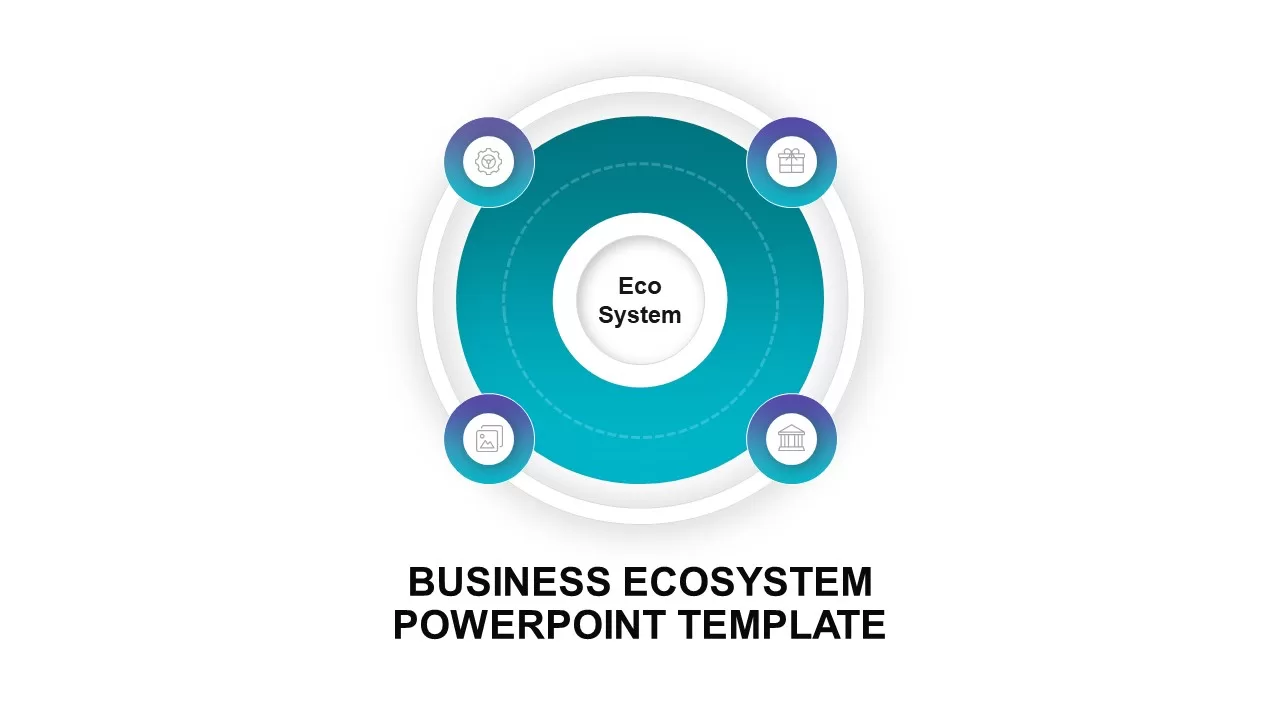
Circular Business Ecosystem Diagram Template for PowerPoint & Google Slides
Business Strategy
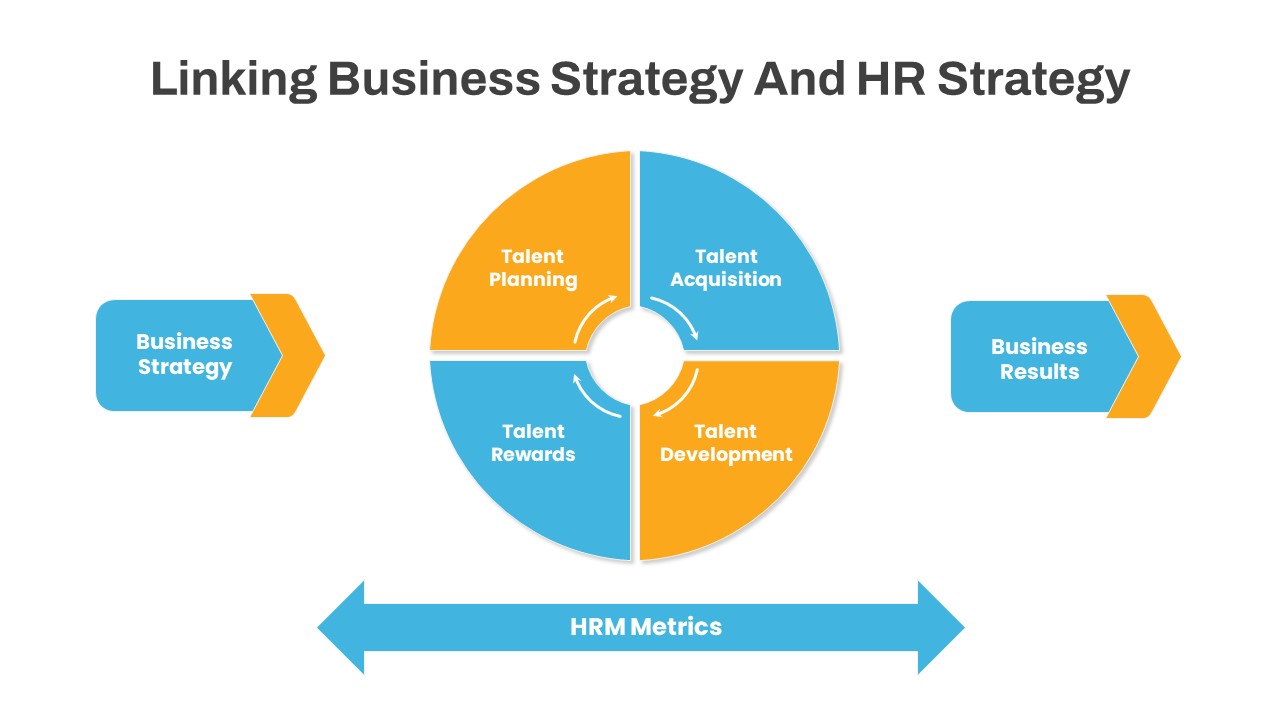
Linking Business HR Strategy Circular Diagram Template for PowerPoint & Google Slides
Business Strategy
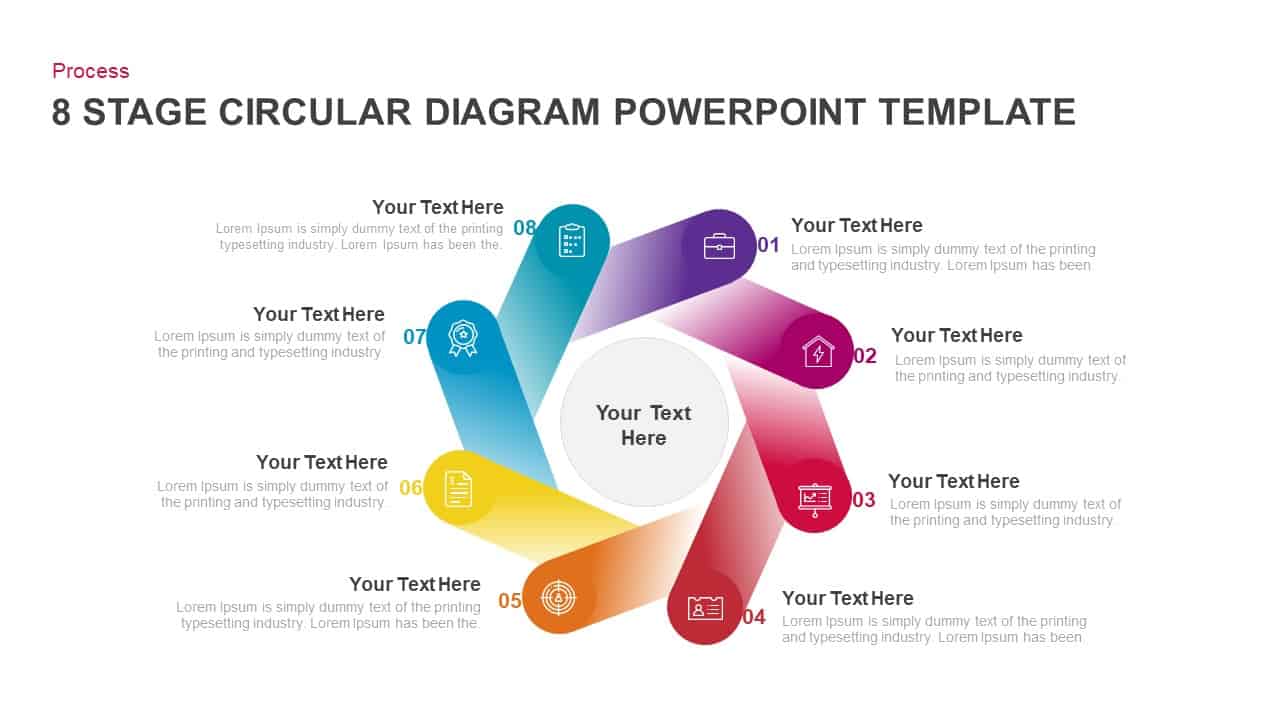
Eight-Stage Circular Process Infographic Template for PowerPoint & Google Slides
Circular
Four-Stage Circular Process Flow Template for PowerPoint & Google Slides
Process
Financial Planning Circular Process Template for PowerPoint & Google Slides
Process
5-Step Circular Gradient Process Flow Template for PowerPoint & Google Slides
Process
Colorful 5-Step Circular Process Template for PowerPoint & Google Slides
Process
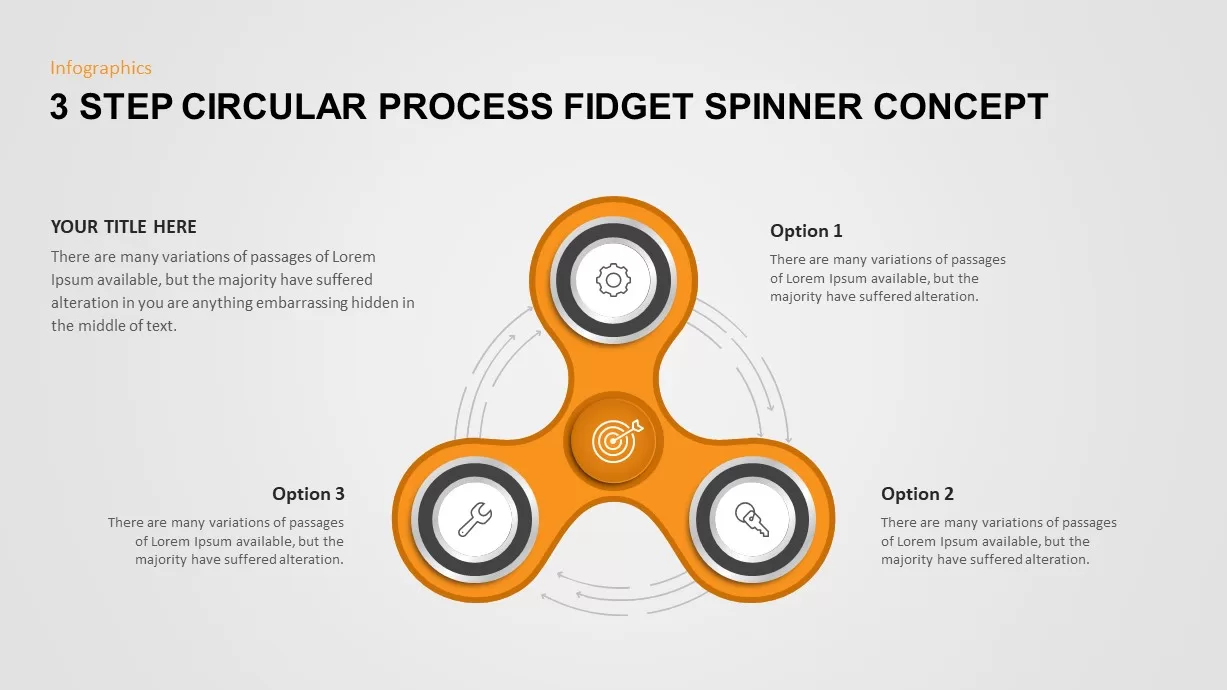
3 Step Circular Process Fidget Spinner Template for PowerPoint & Google Slides
Process
Four-Step Circular Process Infographics Template for PowerPoint & Google Slides
Circular
3 & 4 Step Circular Process Infographic Template for PowerPoint & Google Slides
Process
Circular Arrows Process Flow template for PowerPoint & Google Slides
Process
Circular Arrows Process Flow template for PowerPoint & Google Slides
Process
Circular Arrows Process Flow template for PowerPoint & Google Slides
Process
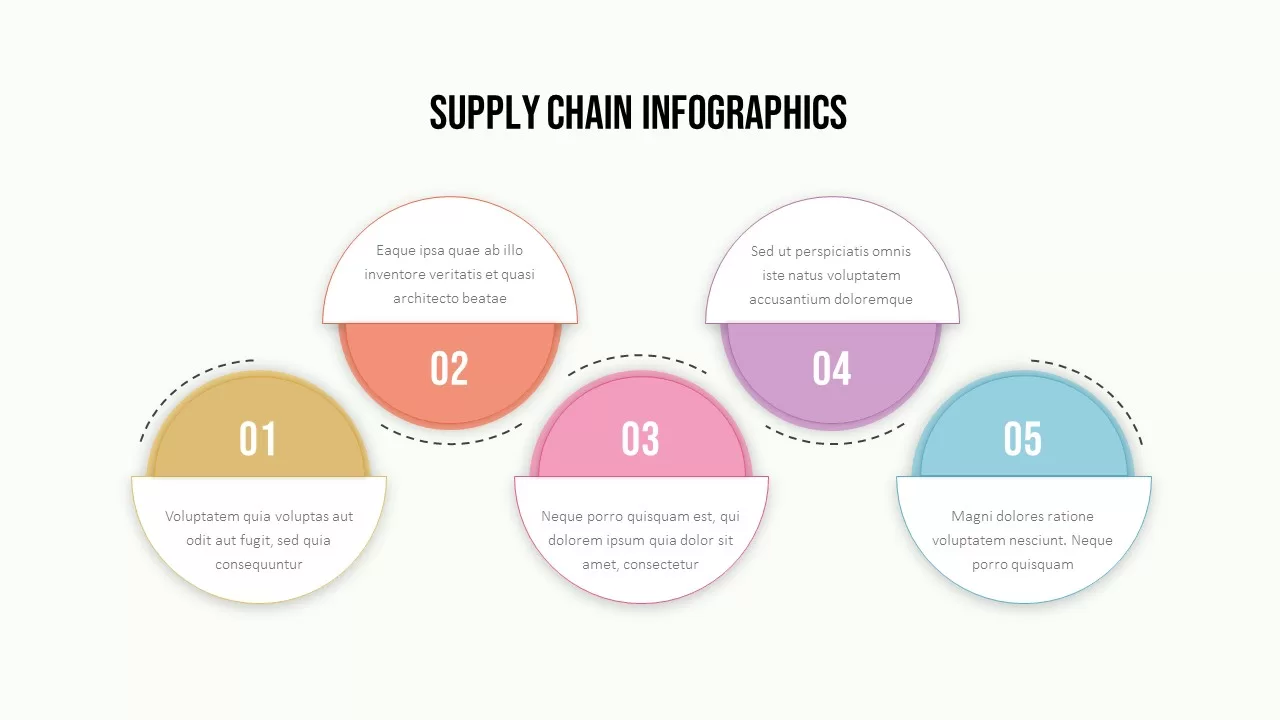
Supply Chain Circular Process Infographics Template for PowerPoint & Google Slides
Business Strategy
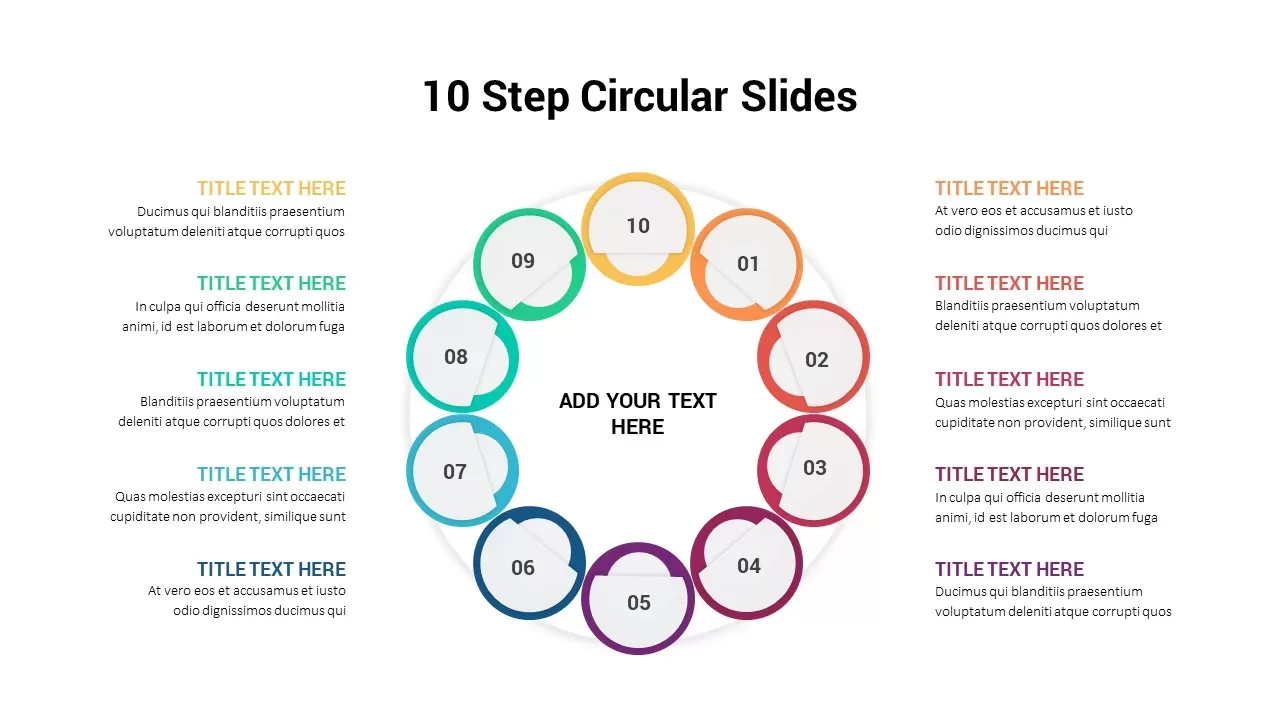
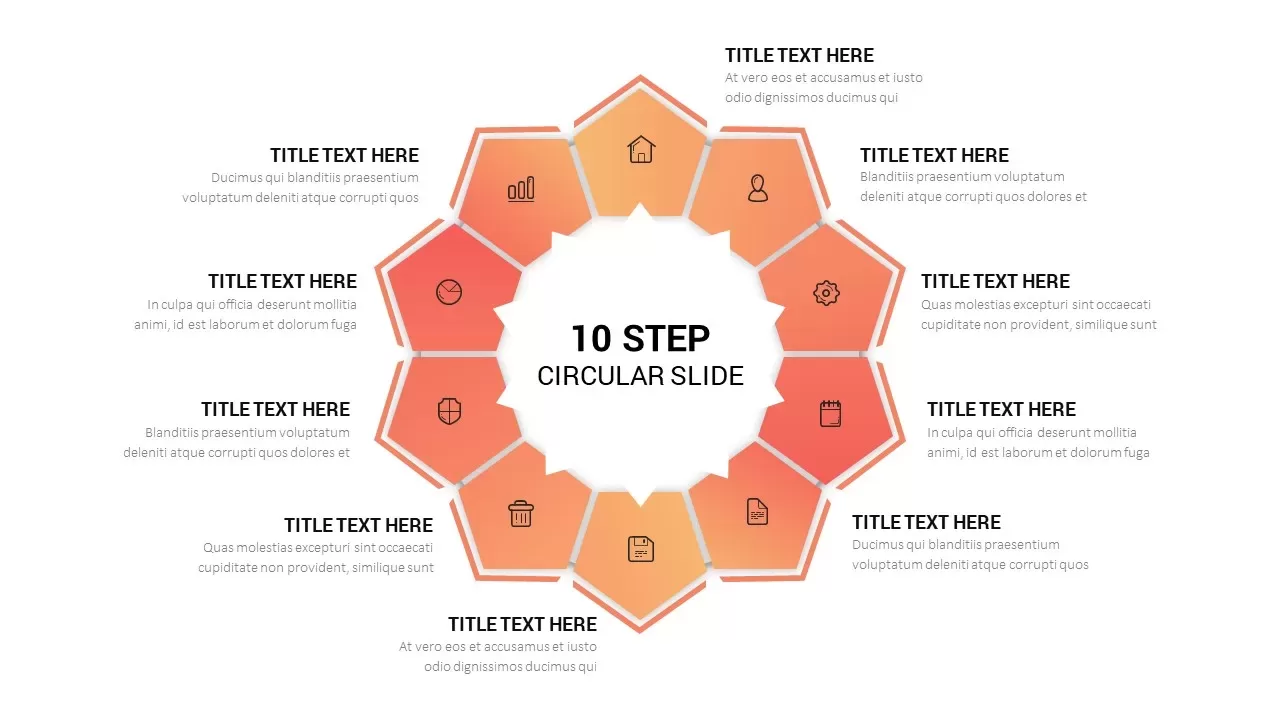
Ten Step Circular Process Infographic Template for PowerPoint & Google Slides
Process
Ten-Step Circular Process Infographic Template for PowerPoint & Google Slides
Circular
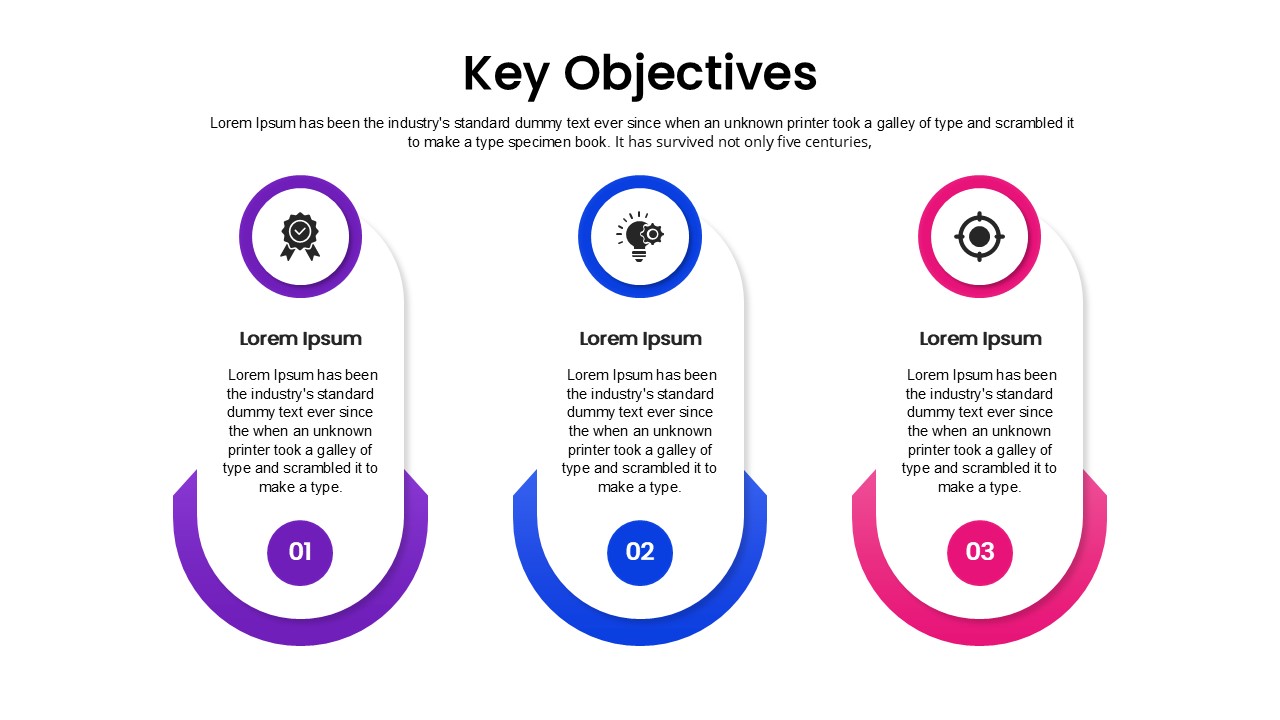
Key Objectives Circular Process template for PowerPoint & Google Slides
Business
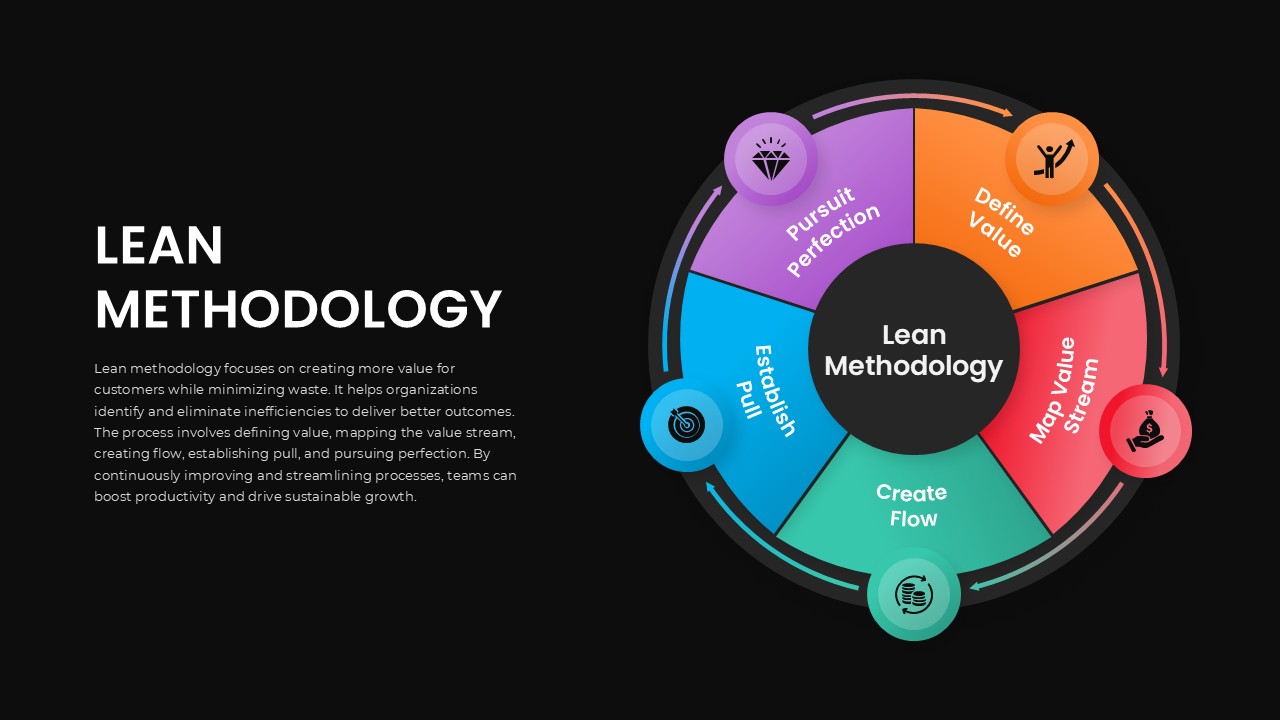
Lean Methodology Circular Process Template for PowerPoint & Google Slides
Process
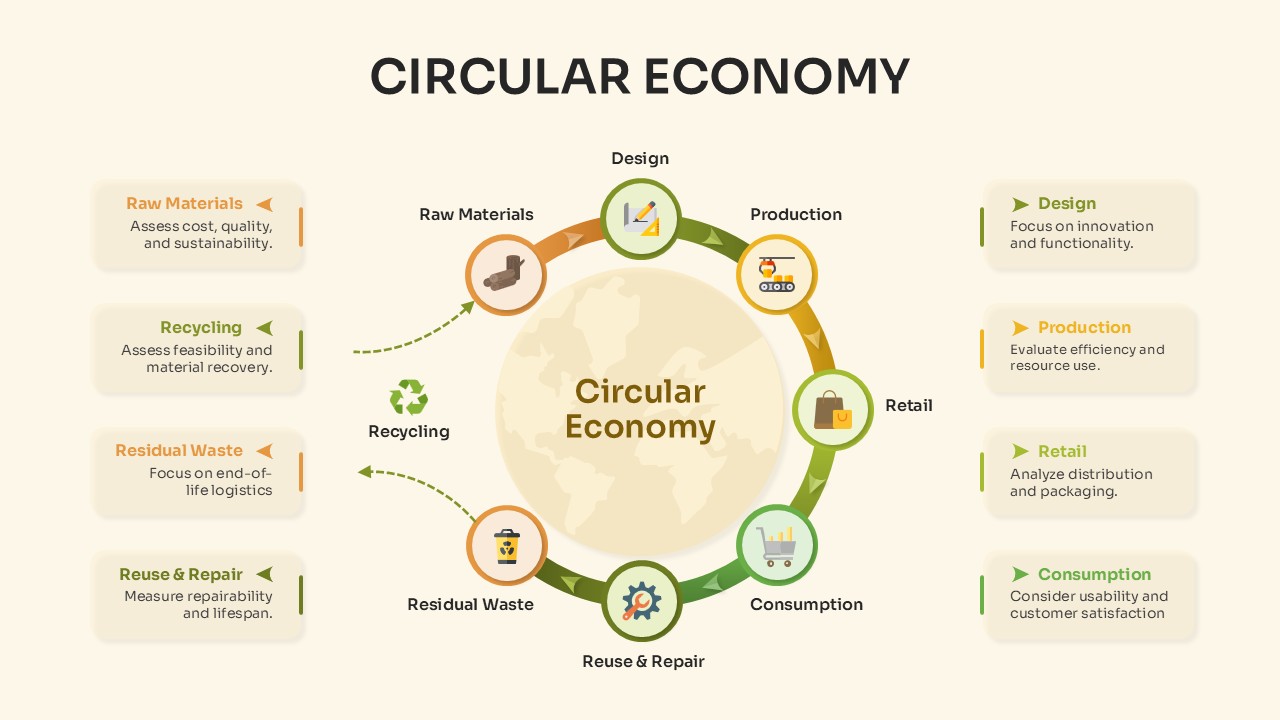
Circular Economy Process Overview Template for PowerPoint & Google Slides
Circular
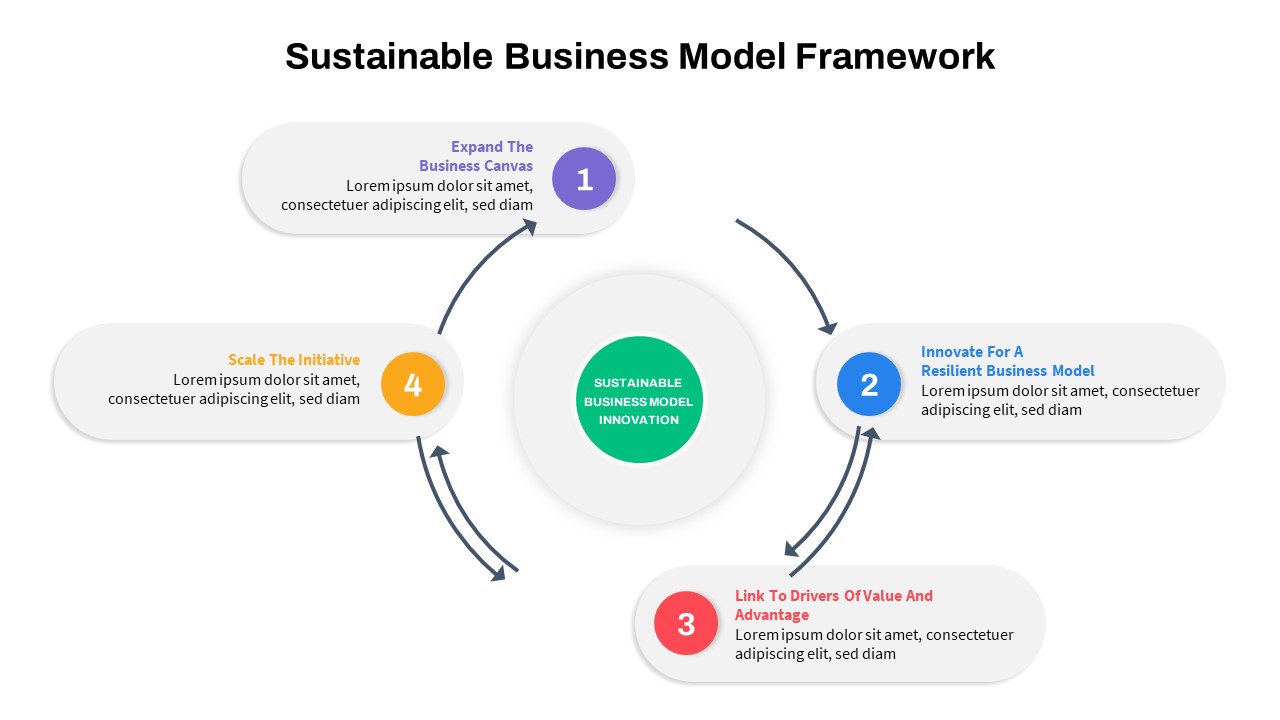
Sustainable Business Model Circular Infographic Template for PowerPoint & Google Slides
Business Strategy
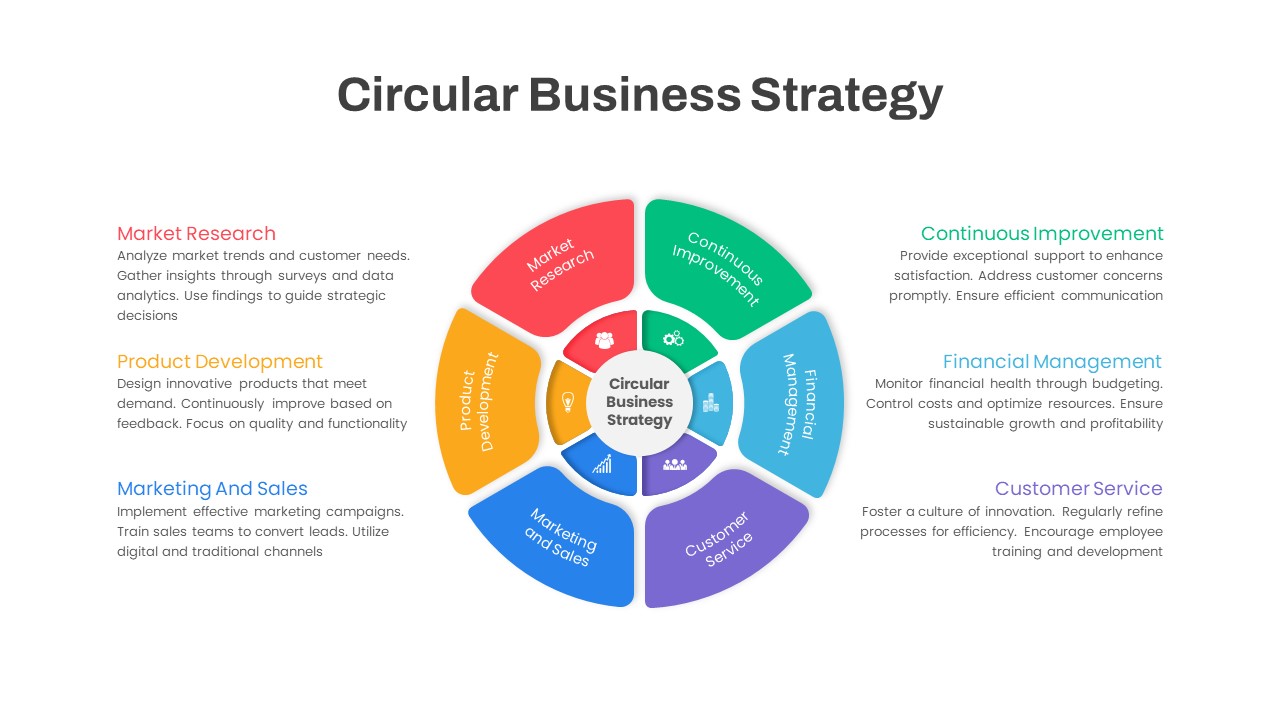
Circular Business Strategy Infographic Template for PowerPoint & Google Slides
Circular
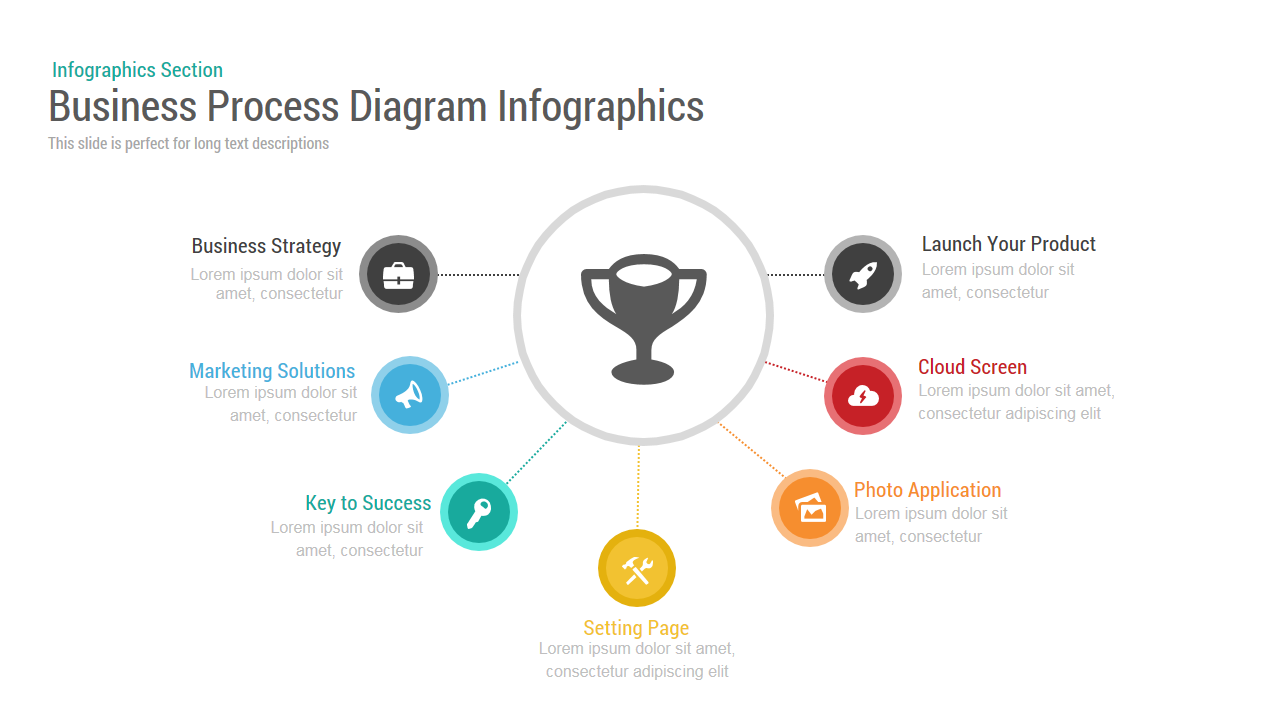
Business Process Diagram template for PowerPoint & Google Slides
Process
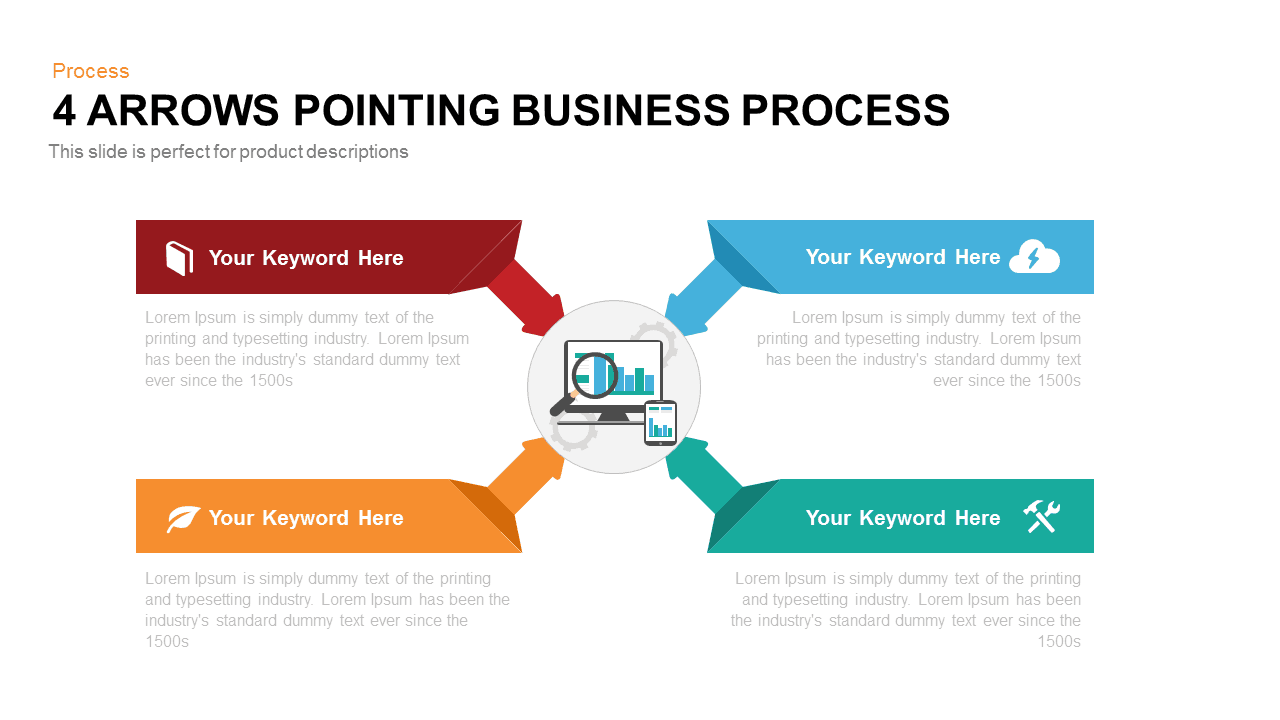
Four Arrows Business Process Diagram template for PowerPoint & Google Slides
Process
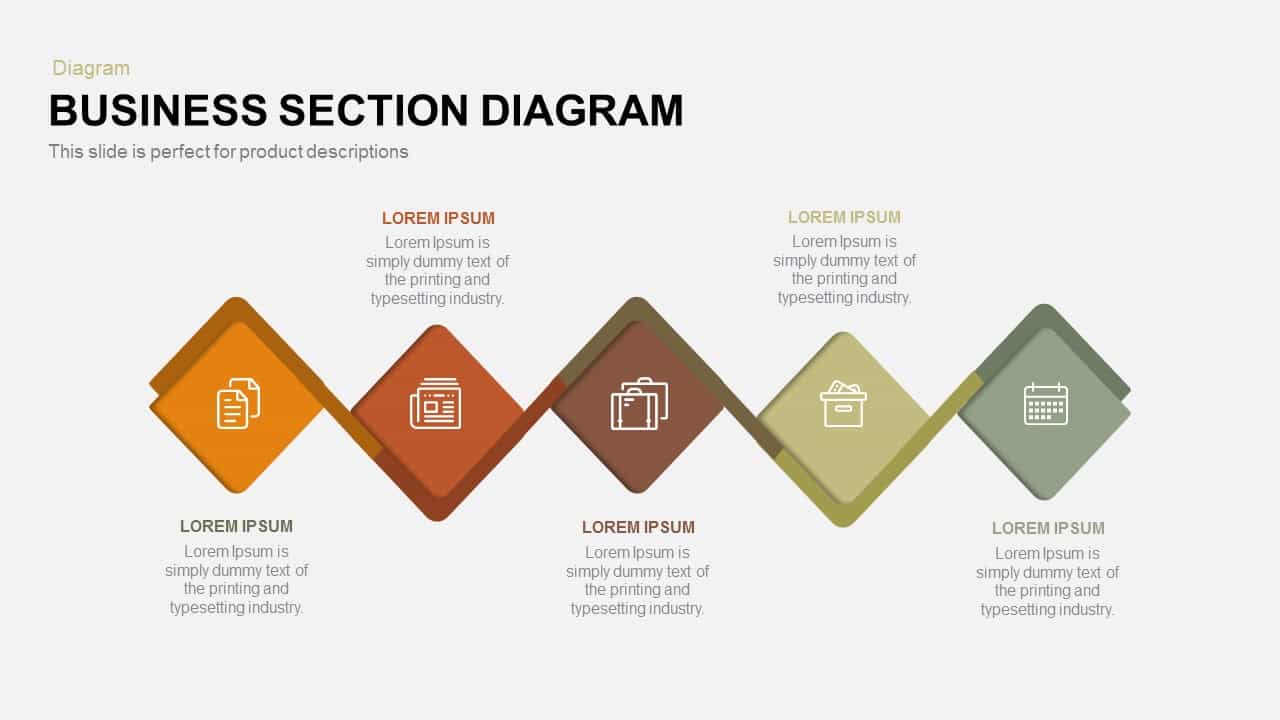
Business Section Diamond Process Diagram Template for PowerPoint & Google Slides
Process
Vertical Business Process Flow Diagram Template for PowerPoint & Google Slides
Process
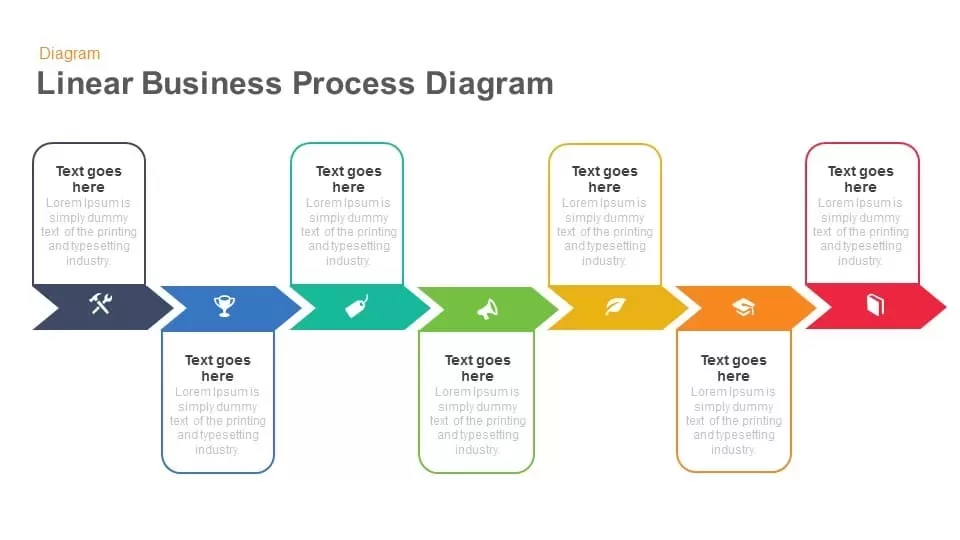
Linear Business Process Diagram template for PowerPoint & Google Slides
Process
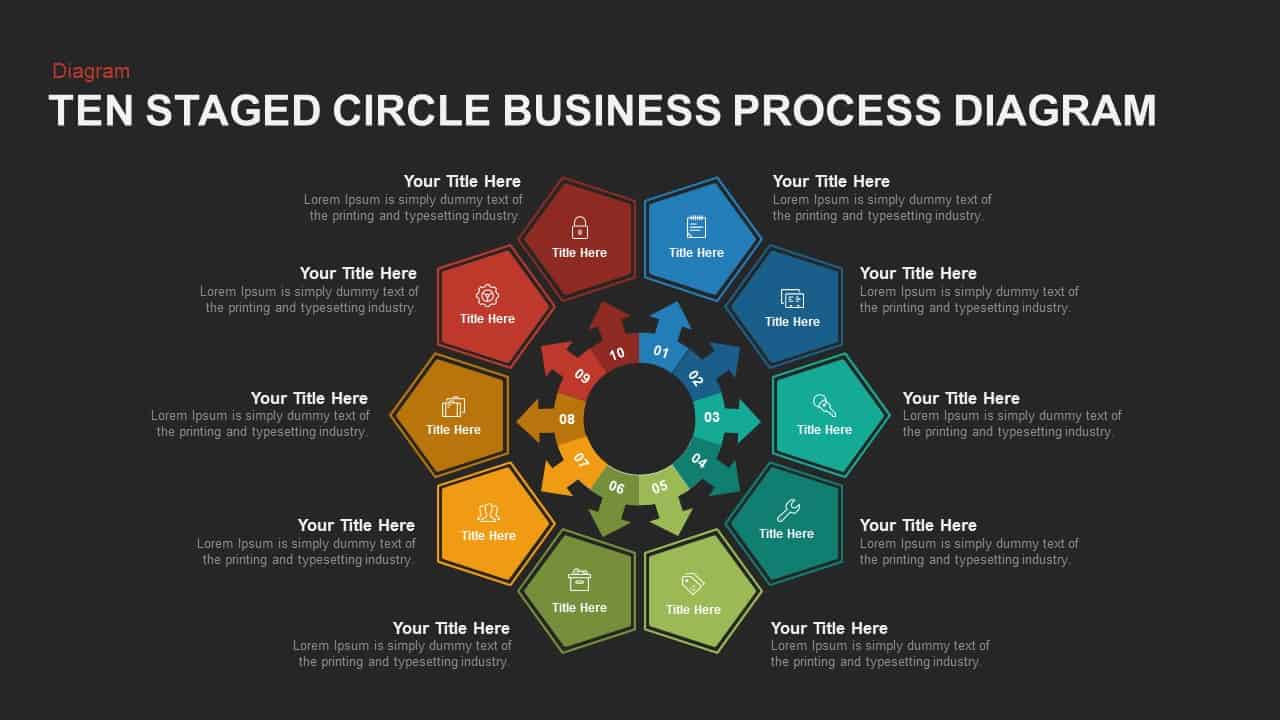
10 Stages Business Flow Process Diagram template for PowerPoint & Google Slides
Business
Ten-Stage Business Process Diagram Template for PowerPoint & Google Slides
Process
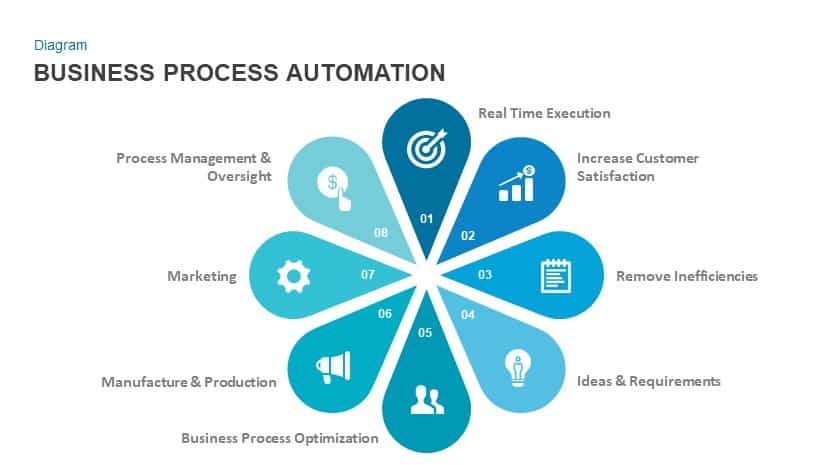
Business Process Automation Diagram Template for PowerPoint & Google Slides
Process
6-Step Business Process Flow Diagram Template for PowerPoint & Google Slides
Process
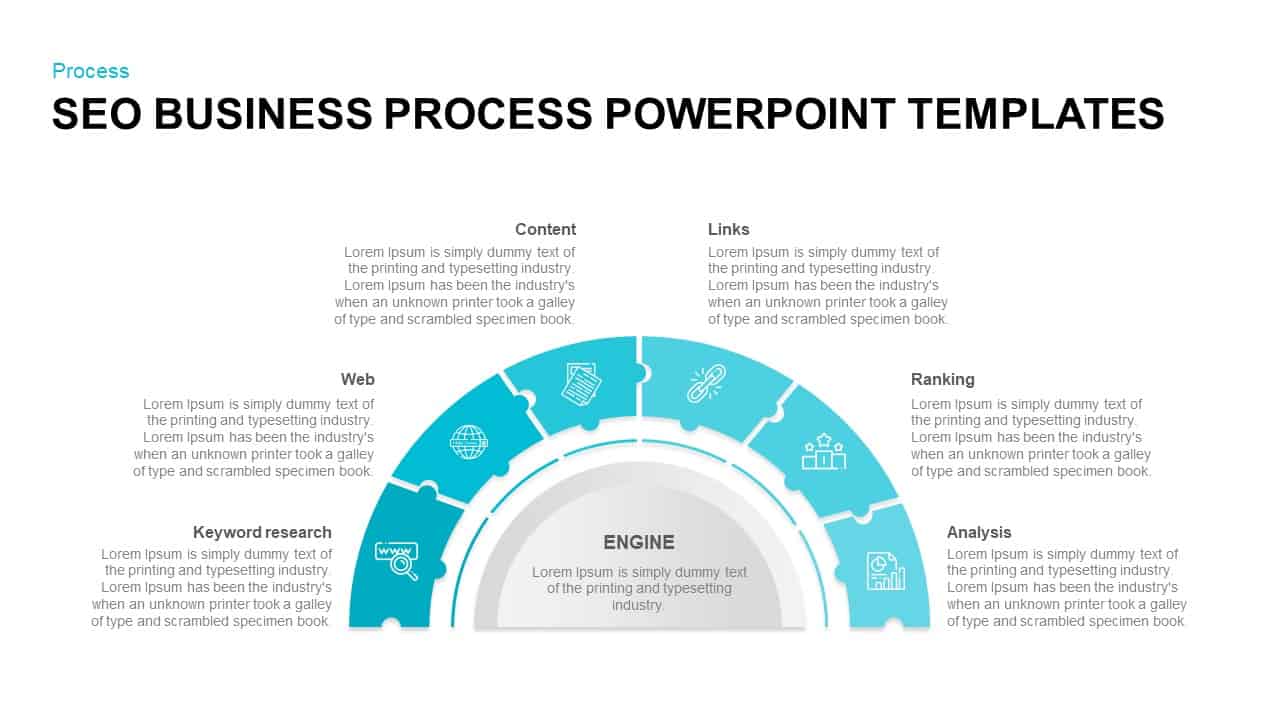
SEO Business Process Puzzle Diagram Template for PowerPoint & Google Slides
Process
Business Process Management Flow Diagram Template for PowerPoint & Google Slides
Process
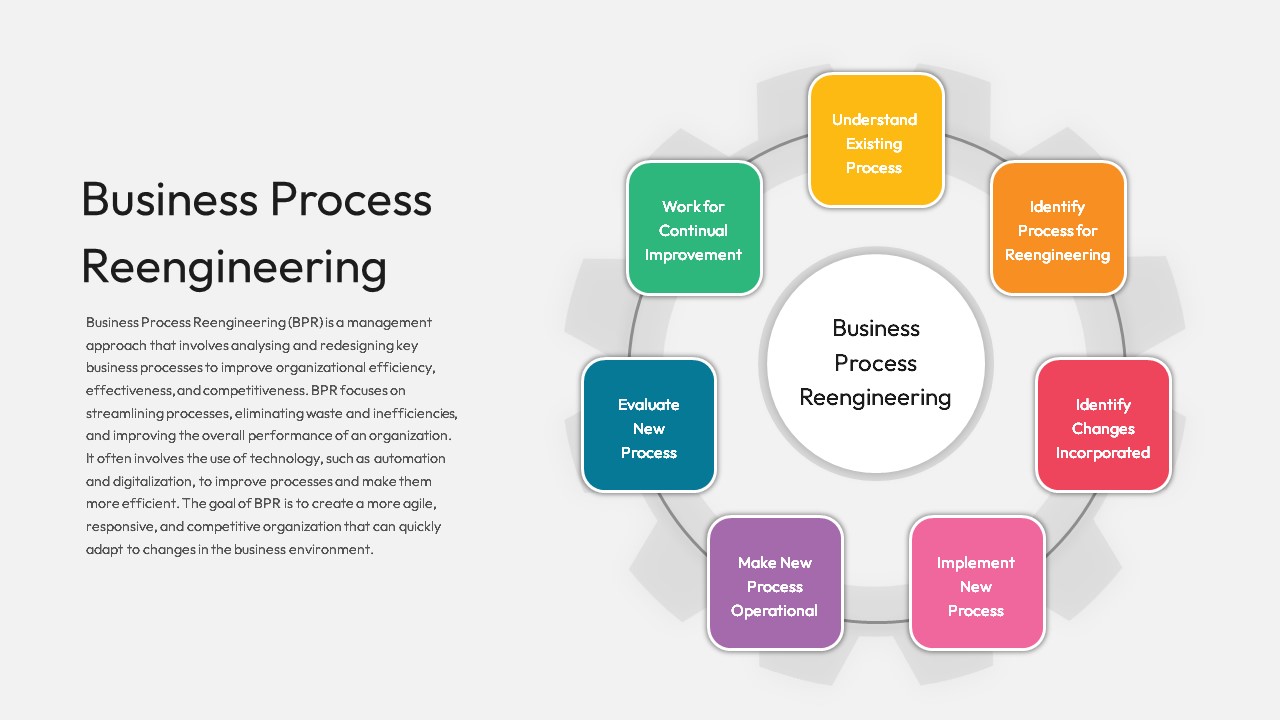
Business Process Reengineering Diagram Template for PowerPoint & Google Slides
Circular
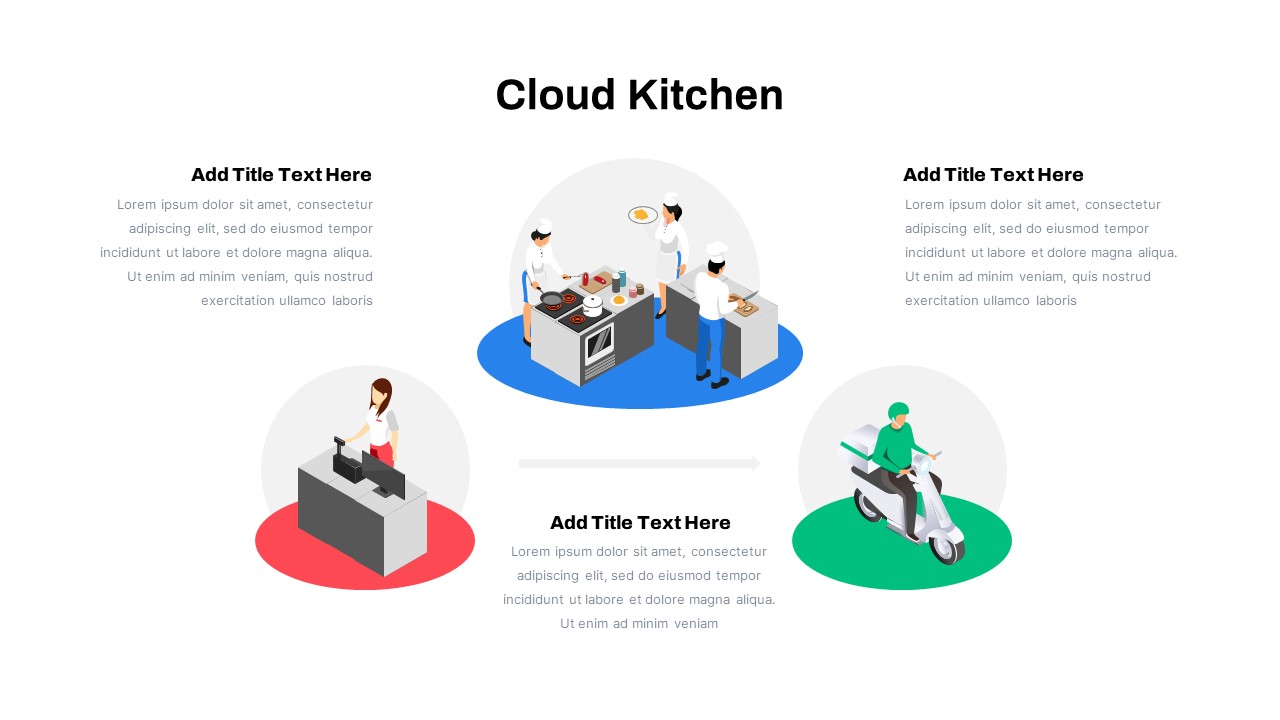
Cloud Kitchen Business Process Diagram Template for PowerPoint & Google Slides
Process
Business Process Analysis Cycle Diagram Template for PowerPoint & Google Slides
Business Strategy
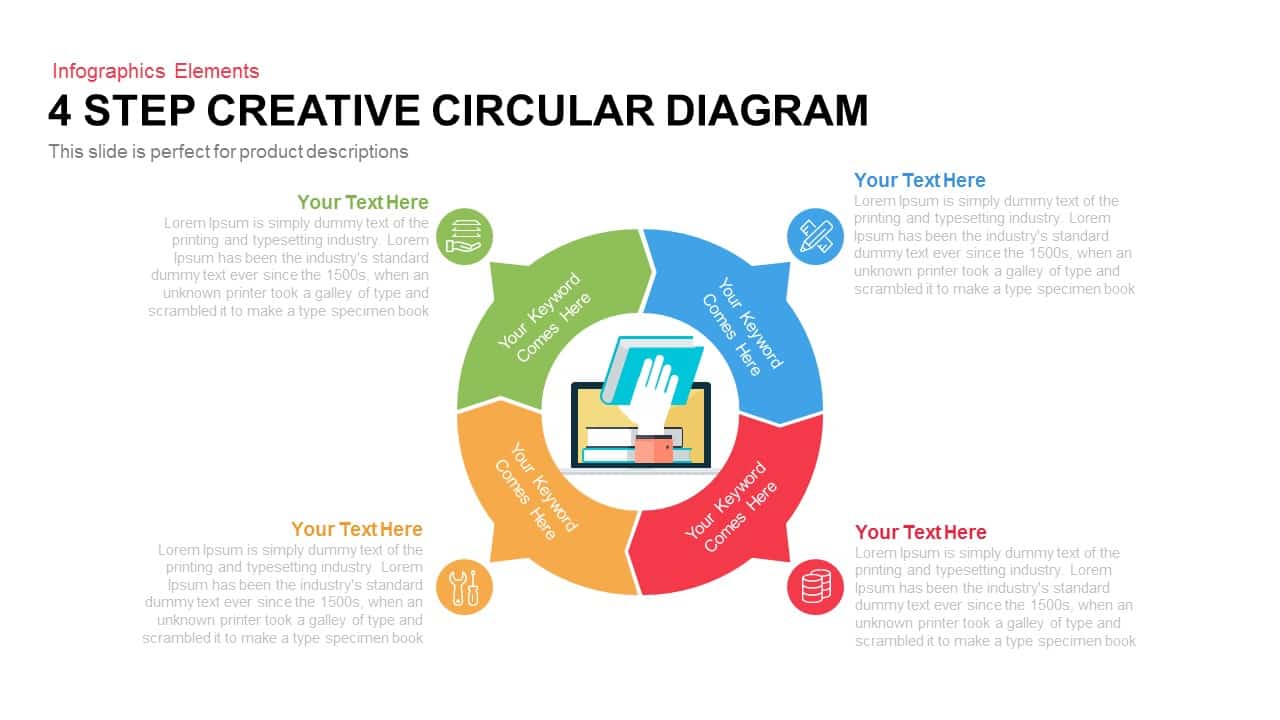
4 Step Creative Circular Diagram Template for PowerPoint & Google Slides
Infographics
Six Section Circular Infographic Diagram Template for PowerPoint & Google Slides
Circular
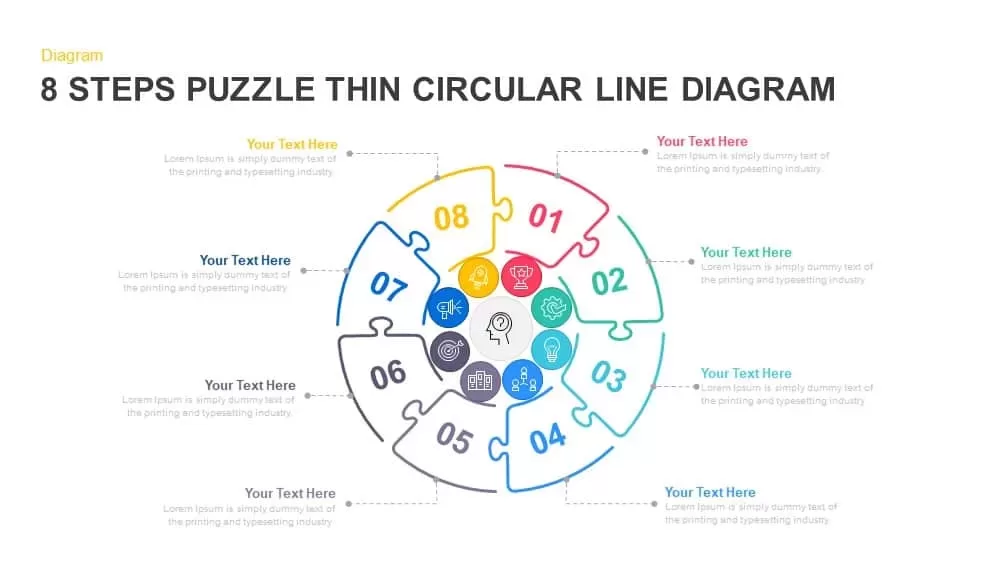
8-Step Puzzle Circular Diagram Template for PowerPoint & Google Slides
Circular
Six-Stage Clockwise Circular Diagram Template for PowerPoint & Google Slides
Circular
8-Stage Chevron Circular Diagram Template for PowerPoint & Google Slides
Process
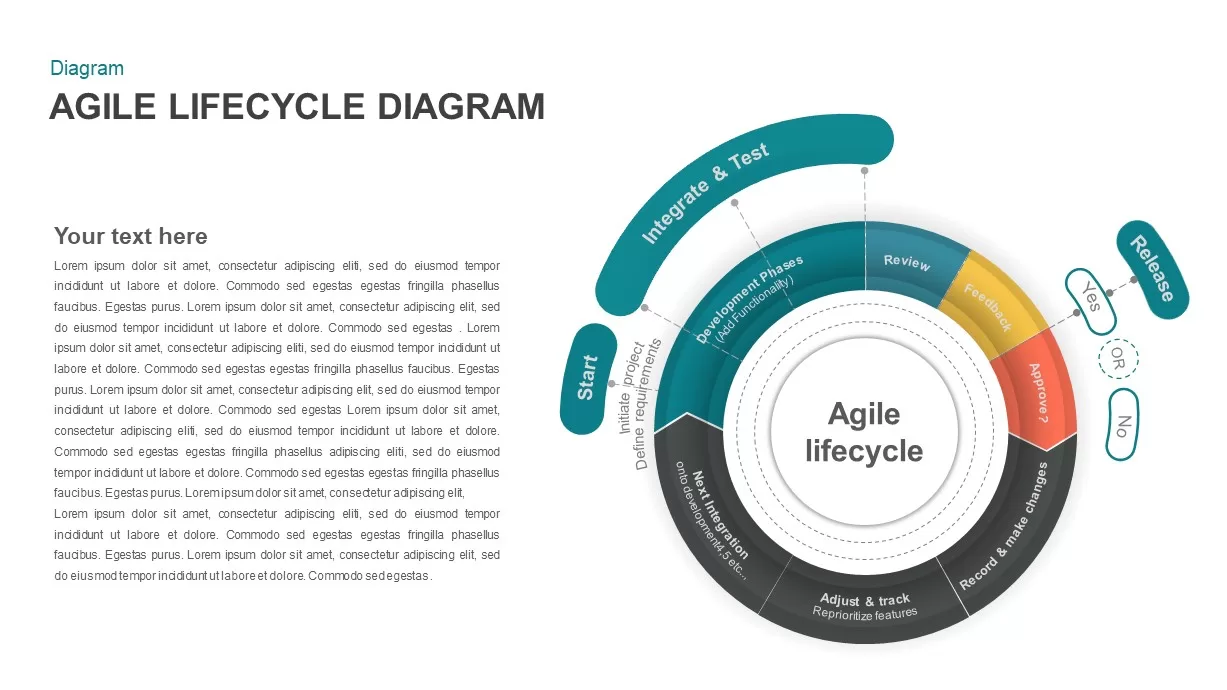
Agile Lifecycle Circular Diagram Template for PowerPoint & Google Slides
Circular
4MAT Learning Cycle Circular Diagram Template for PowerPoint & Google Slides
Circular
Circular 3D Cube Six-Segment Diagram Template for PowerPoint & Google Slides
Infographics
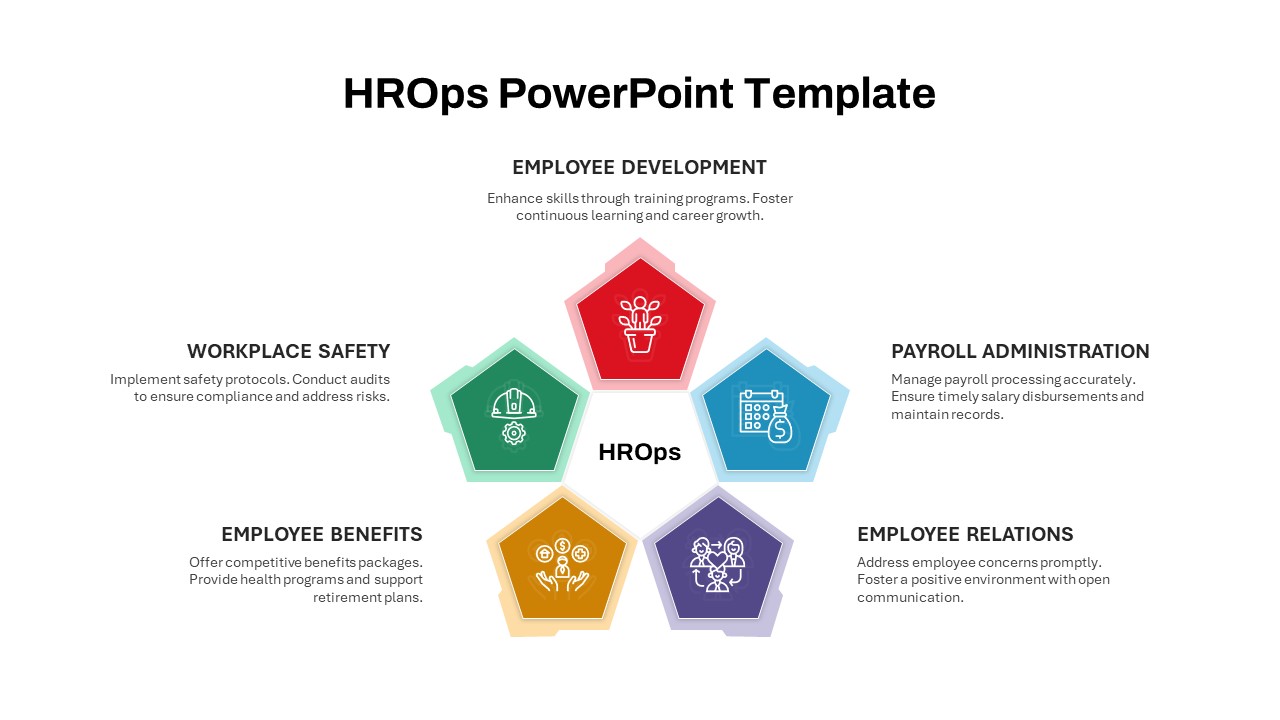
HROps Hub and Spoke Circular Diagram Template for PowerPoint & Google Slides
Circular
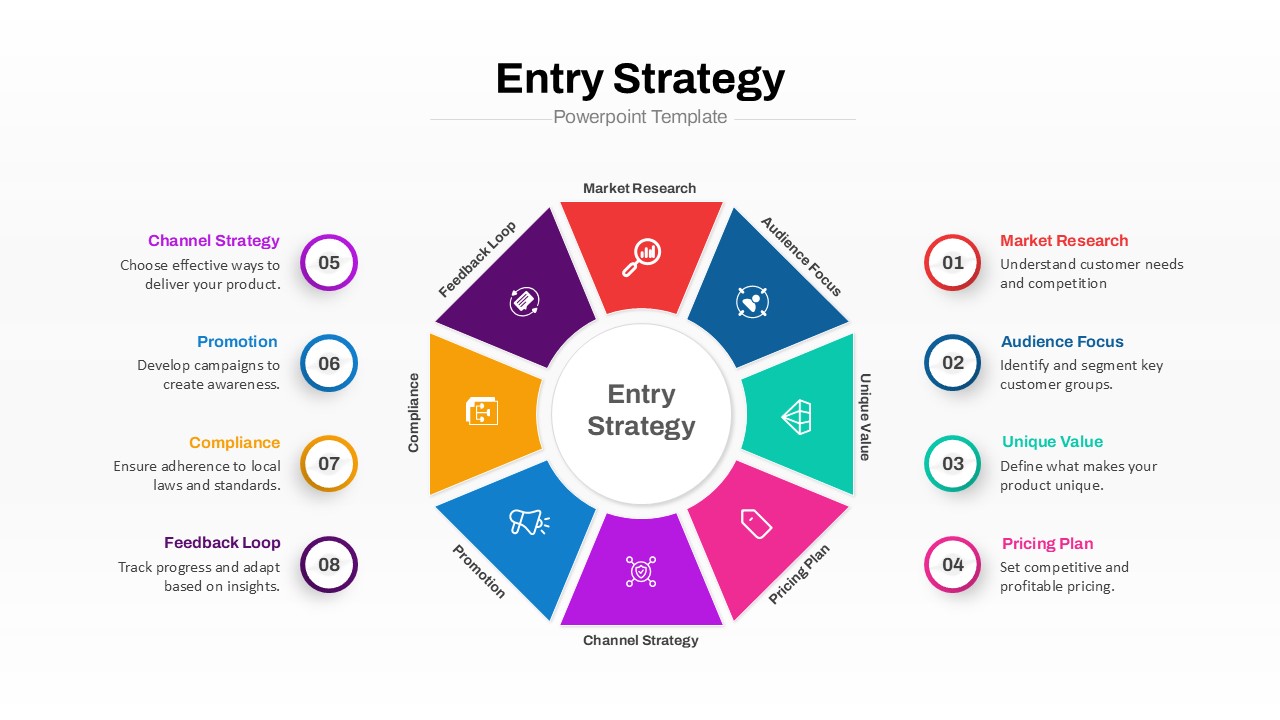
Entry Strategy Circular Diagram Template for PowerPoint & Google Slides
Circular
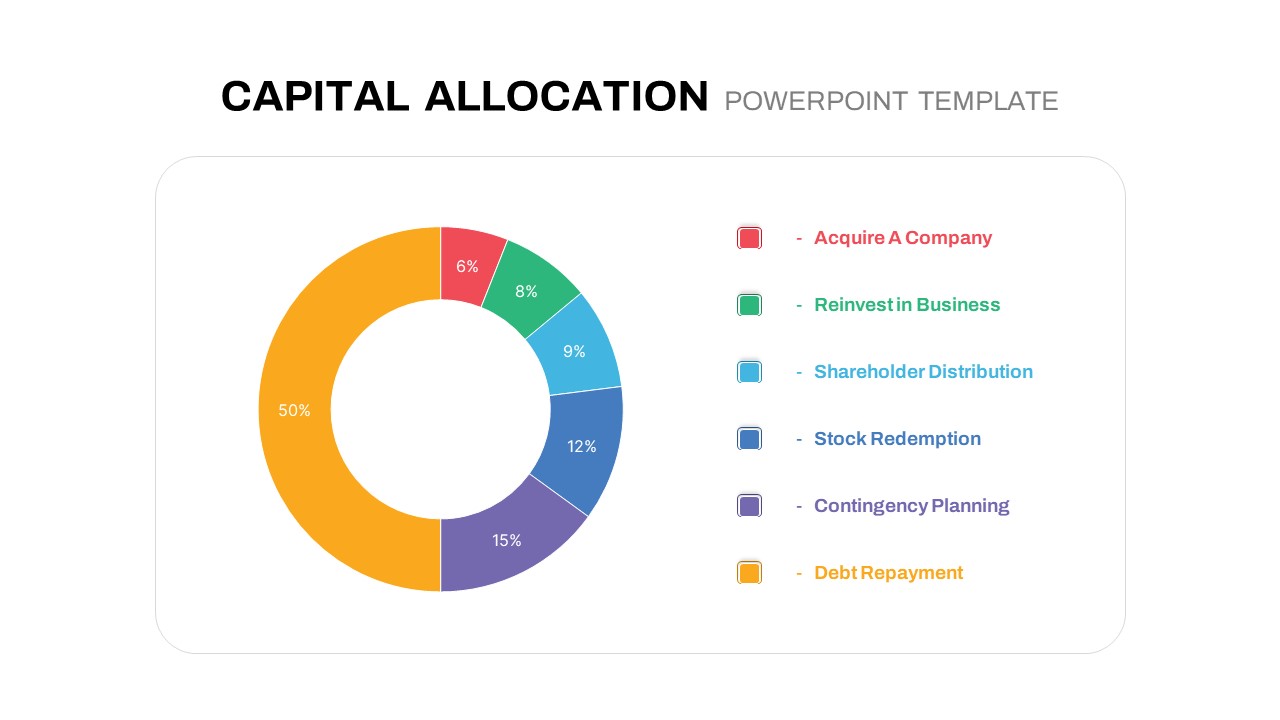
Circular Capital Allocation Diagram Template for PowerPoint & Google Slides
Business Models
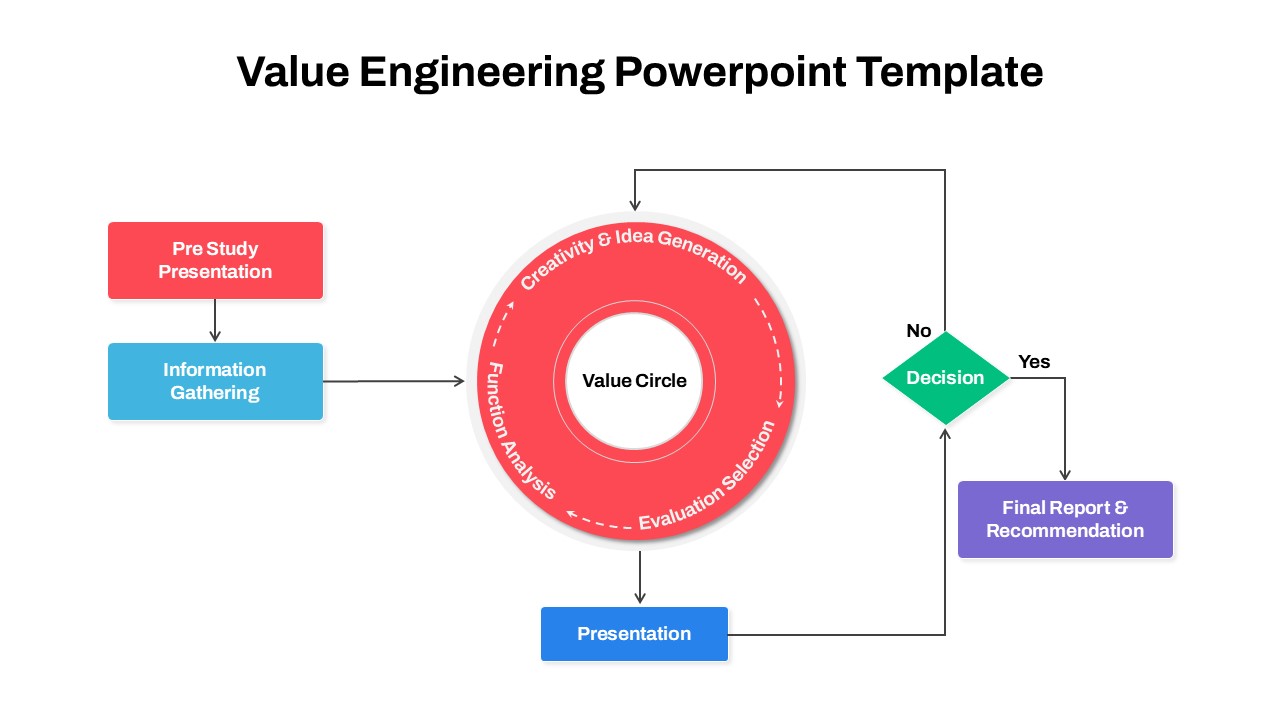
Circular Value Engineering Diagram Template for PowerPoint & Google Slides
Process
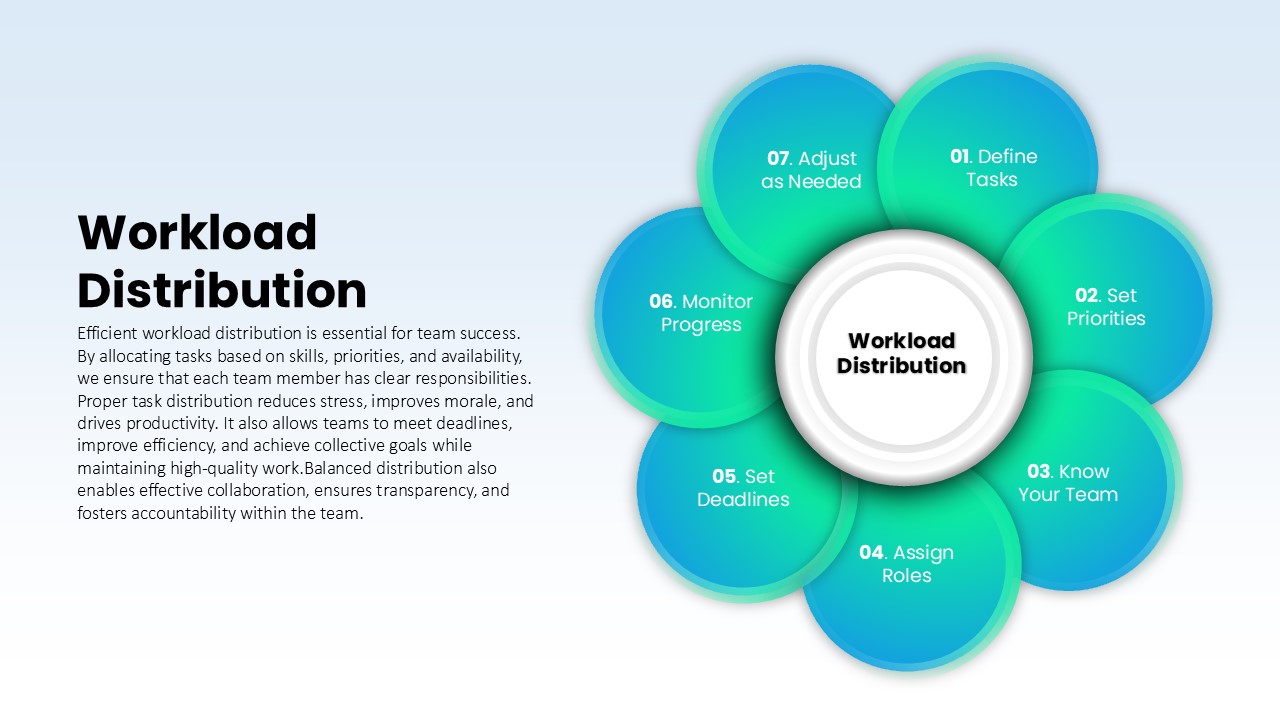
Workload Distribution Circular Diagram Template for PowerPoint & Google Slides
Circular