Assessment Framework Circular Diagram Template for PowerPoint & Google Slides


Description
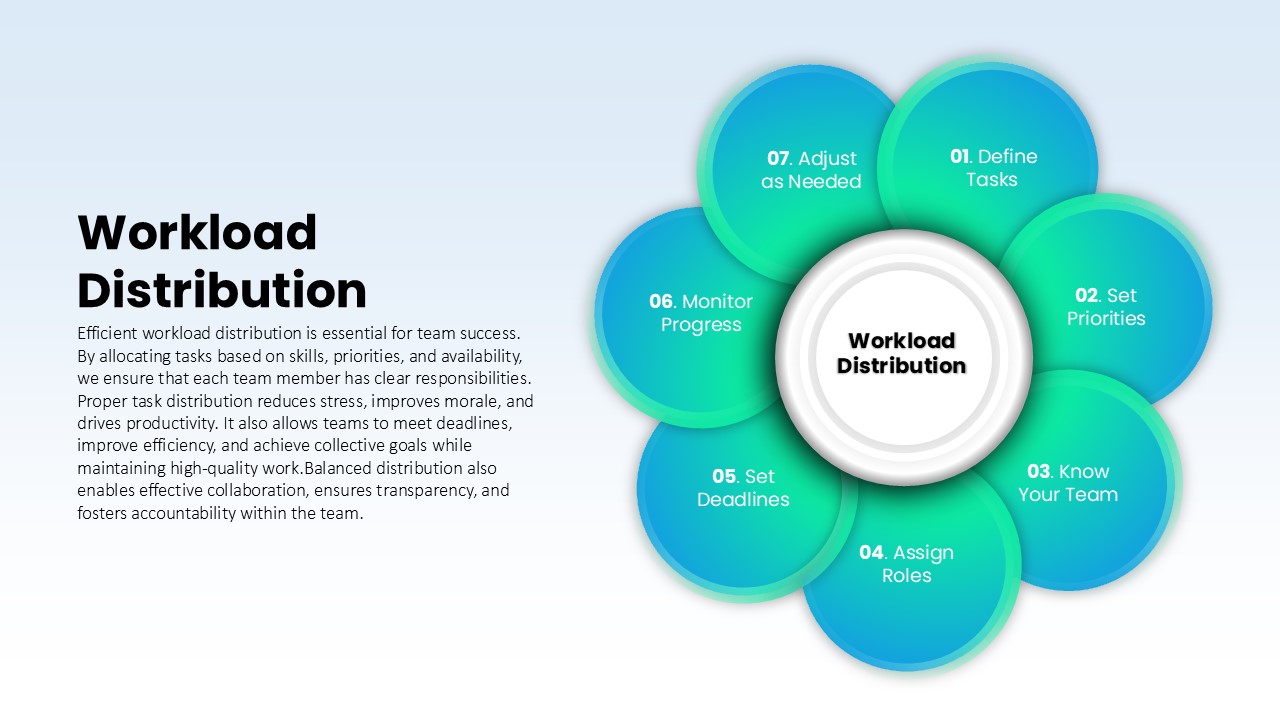
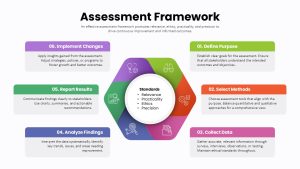
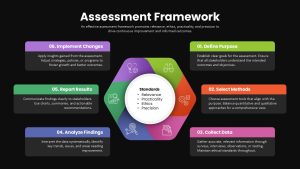
Elevate your assessment presentations with this comprehensive six-step circular framework diagram template. Featuring a central hub labeled Standards, highlighting Relevance, Practicality, Ethics, and Precision, the design is surrounded by six gradient-shaded segments denoting Define Purpose, Select Methods, Collect Data, Analyze Findings, Report Results, and Implement Changes. Each segment incorporates a minimalist icon—binoculars for purpose, gears for methodology, clipboard for data collection, magnifying glass for analysis, bar chart for reporting, and light bulb for implementation—paired with numbered labels to guide viewers through the continuous improvement cycle. The radial layout and overlapping petals, complete with soft drop shadows, rounded edges, and crisp typography, deliver a modern aesthetic that enhances clarity and engagement.
Built on editable master slides, this template leverages scalable vector shapes and intuitive placeholders to accelerate customization. Swap gradient palettes to align with brand guidelines, replace icons to reflect specific assessment tools, or adjust segment titles to match organizational terminology. Data placeholders support linkage with Excel or Google Sheets, enabling real-time updates of metrics, charts, and findings. Layered objects and smart guides ensure consistent alignment and simplify layout adjustments, speeding up deck creation and reducing version-control challenges.
Fully optimized for PowerPoint and Google Slides, the slide maintains full-resolution clarity on desktops, projectors, and mobile devices. Collaboration-friendly features, including linked assets and shared masters, support seamless teamwork and iterative refinement.
Who is it for
Program evaluators, instructional designers, HR professionals, and project managers will find this slide invaluable for planning assessments, presenting findings, and driving continuous improvement.
Other Uses
Repurpose this circular framework for research planning, quality improvement cycles, policy reviews, training modules, or project milestone mapping across various industries.
Login to download this file

Item ID
SB04914
Related Templates

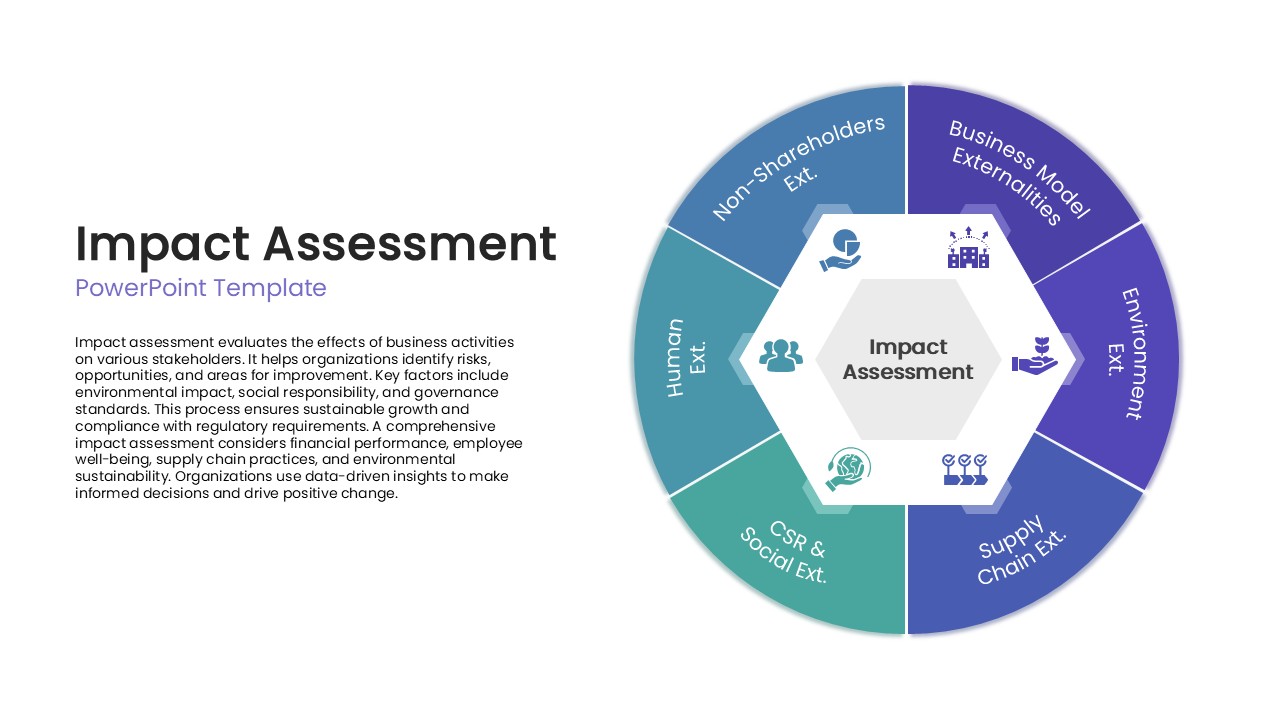
Impact Assessment Circular Diagram Template for PowerPoint & Google Slides
Circular
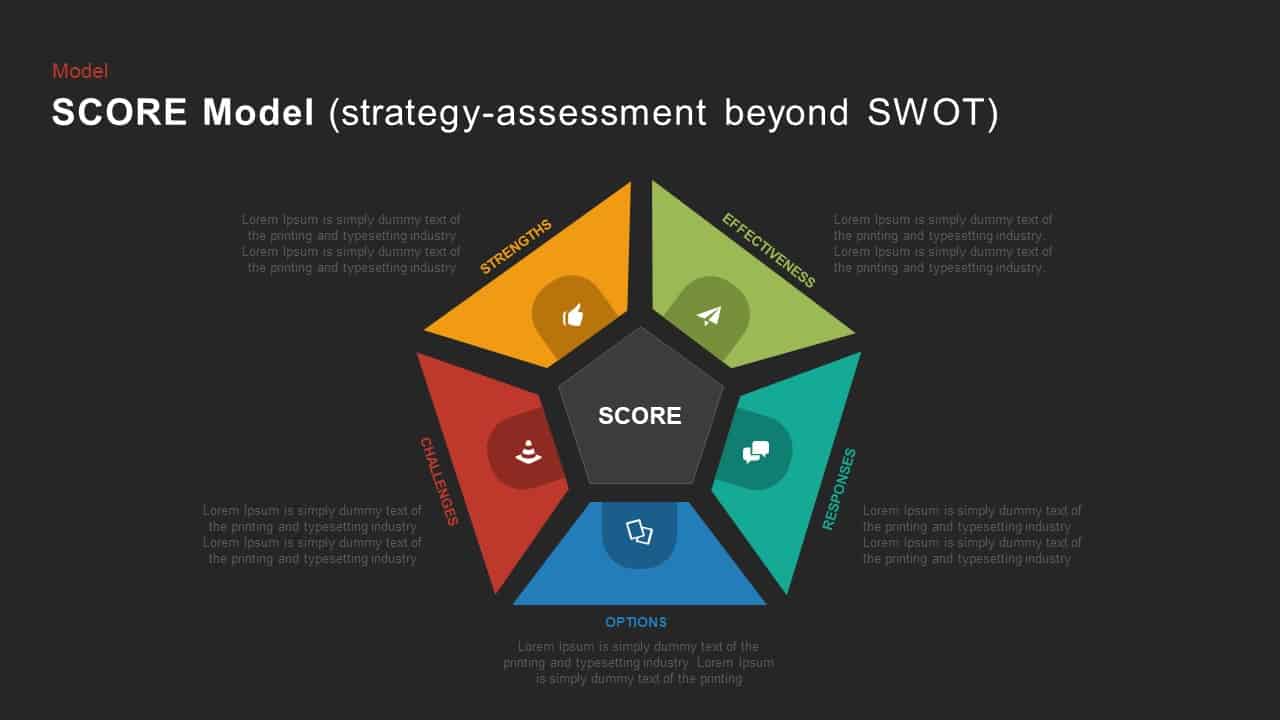
SCORE Model Pentagon Assessment Diagram Template for PowerPoint & Google Slides
Circular
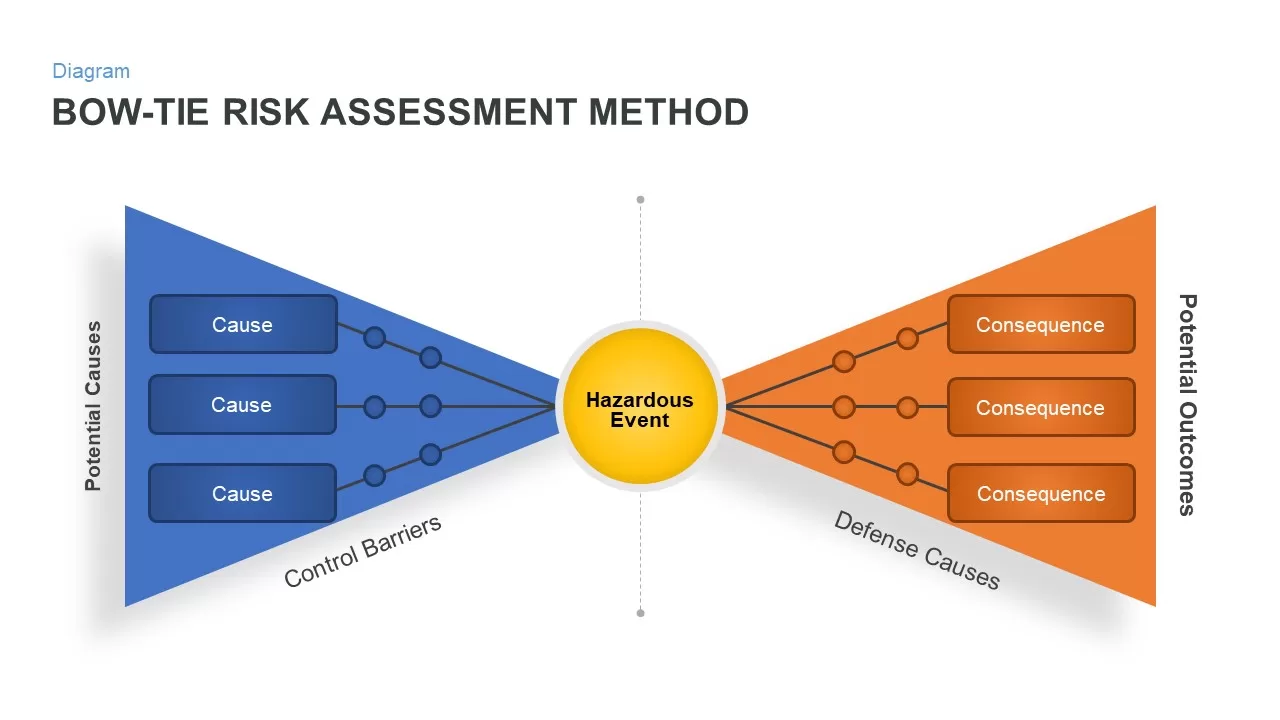
Bow-Tie Risk Assessment Diagram Template for PowerPoint & Google Slides
Risk Management
Materiality Assessment Matrix Diagram Template for PowerPoint & Google Slides
Risk Management
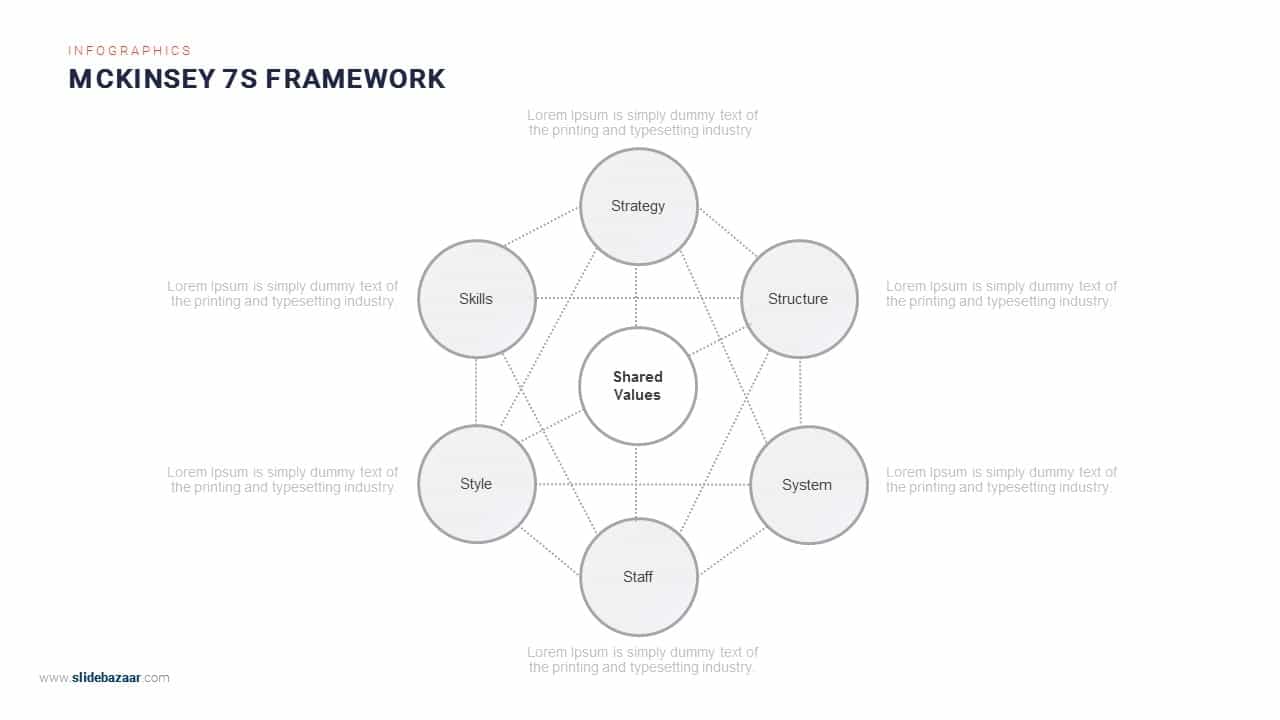
McKinsey 7S Framework Circular Diagram Template for PowerPoint & Google Slides
Circular
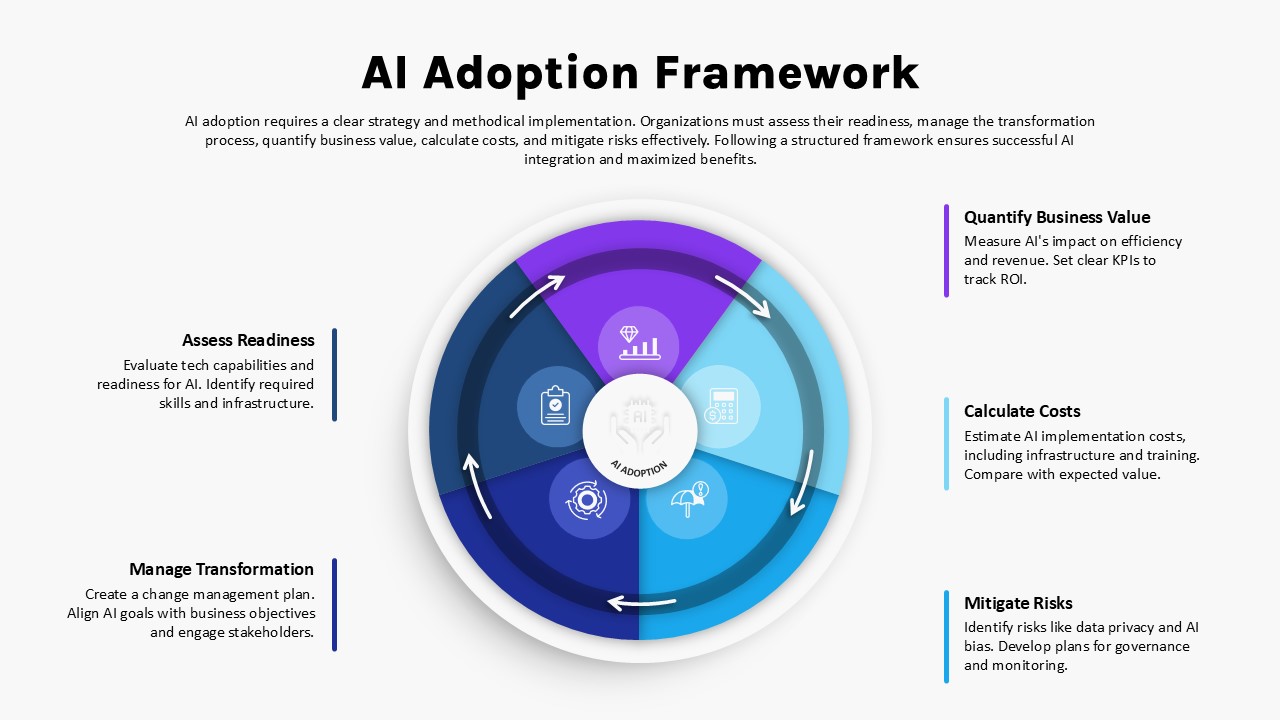
AI Adoption Framework Circular Diagram Template for PowerPoint & Google Slides
AI
Heat Map Risk Assessment Presentation Template for PowerPoint & Google Slides
Risk Management
Risk Assessment Heatmap Matrix Slide Template for PowerPoint & Google Slides
Comparison Chart
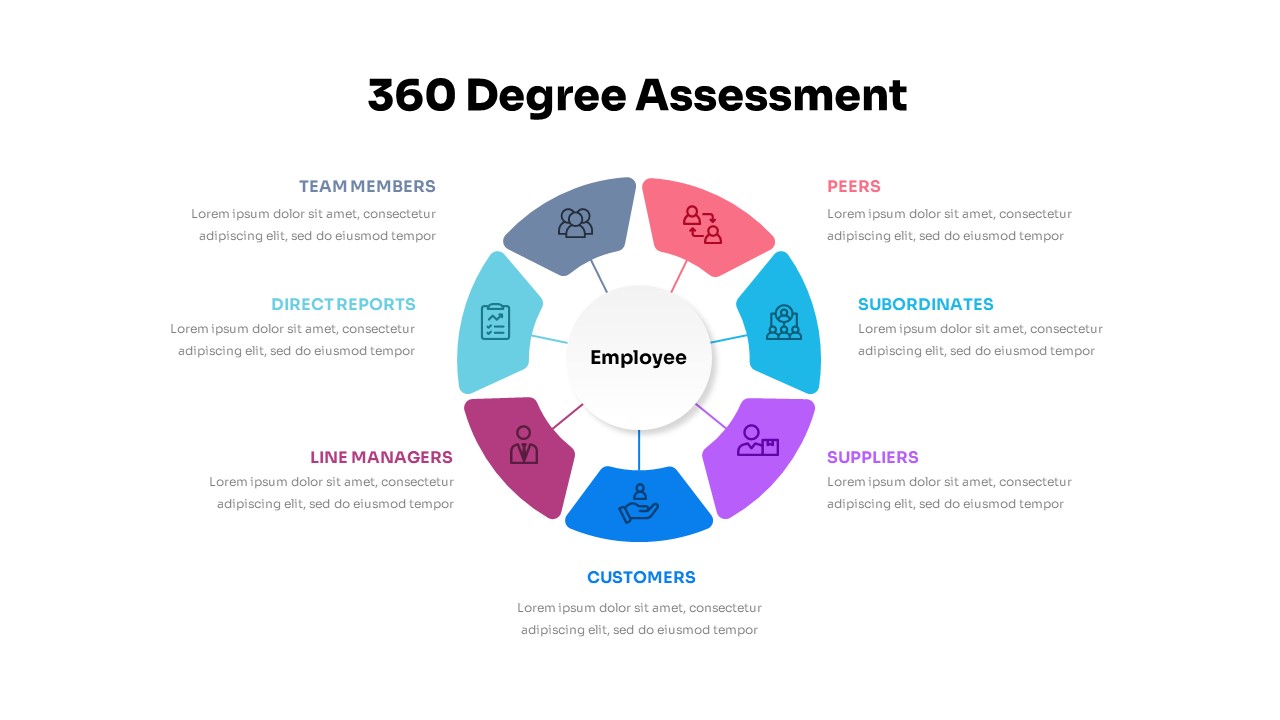
360 Degree Assessment Template for PowerPoint & Google Slides
Employee Performance
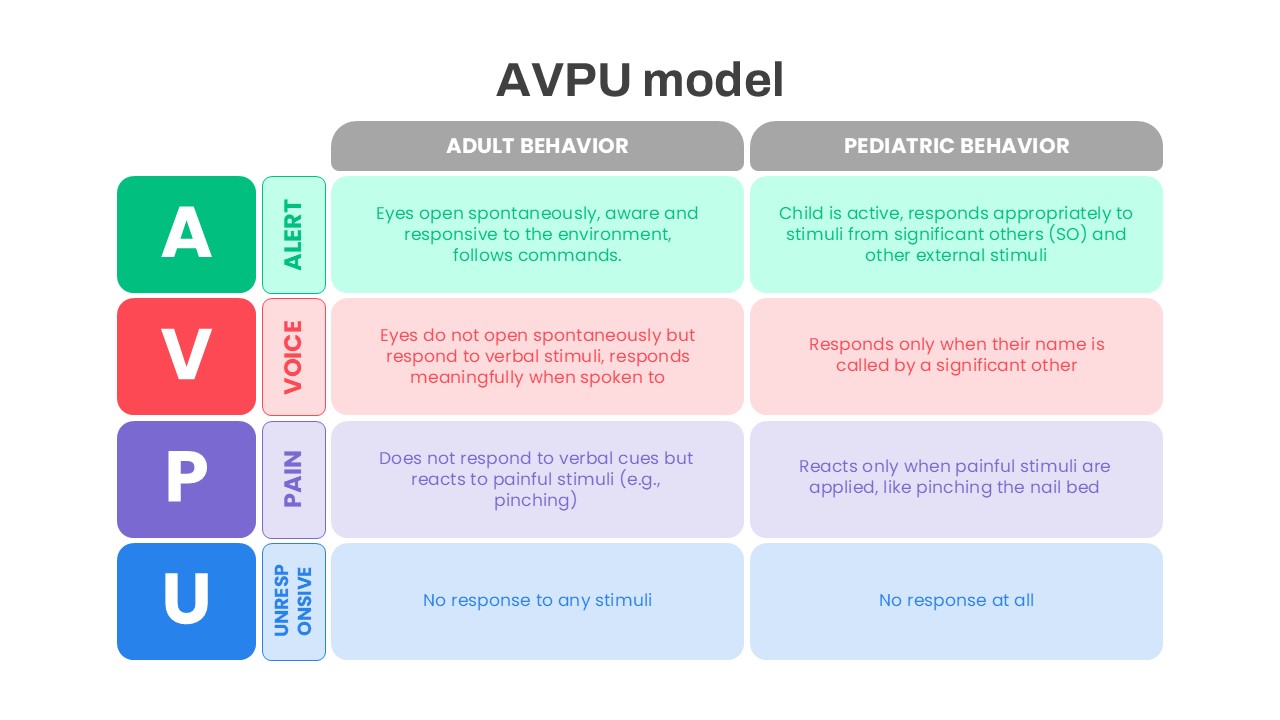
AVPU Model Behavior Assessment Template for PowerPoint & Google Slides
Health
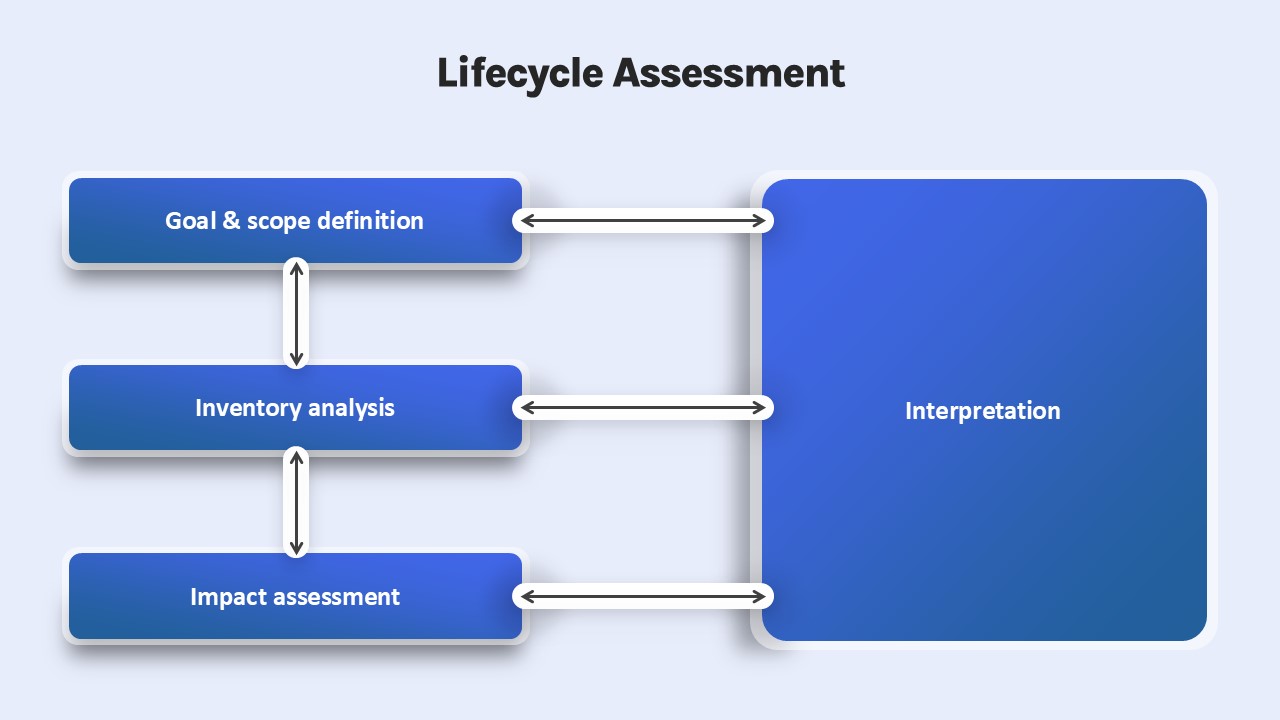
Lifecycle Assessment template for PowerPoint & Google Slides
Process
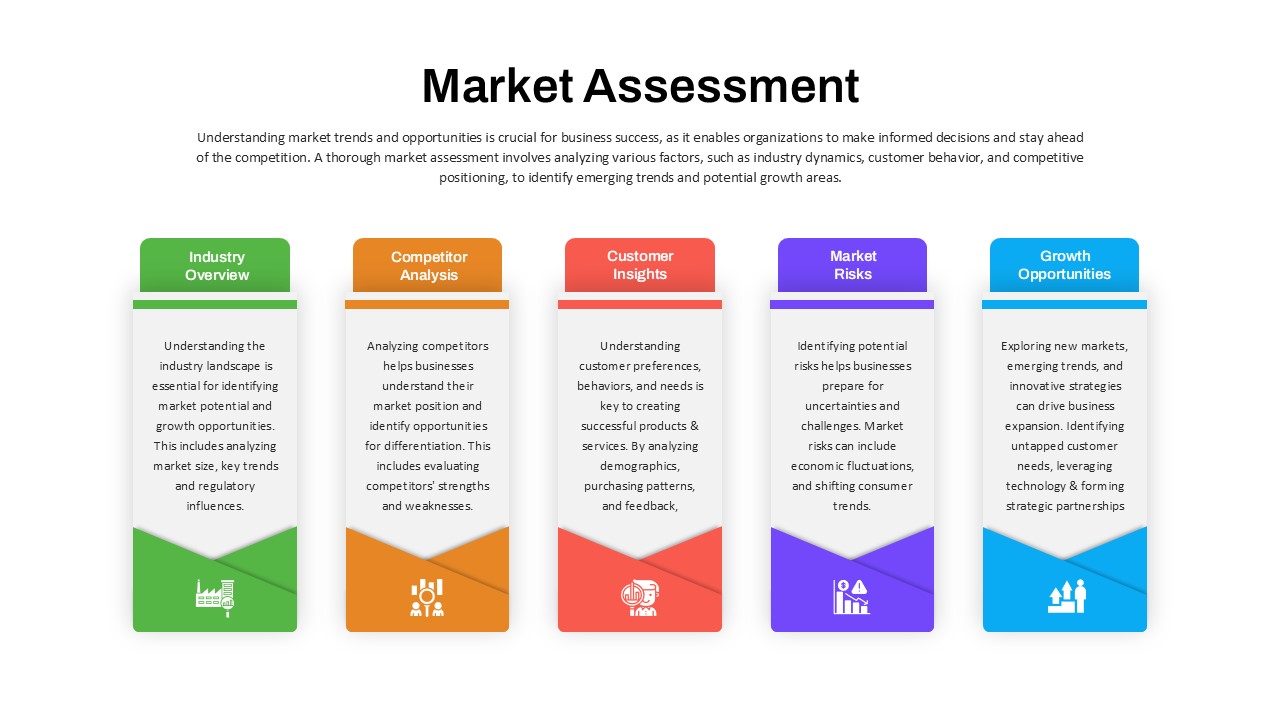
Market Assessment Infographic Slide Template for PowerPoint & Google Slides
Process
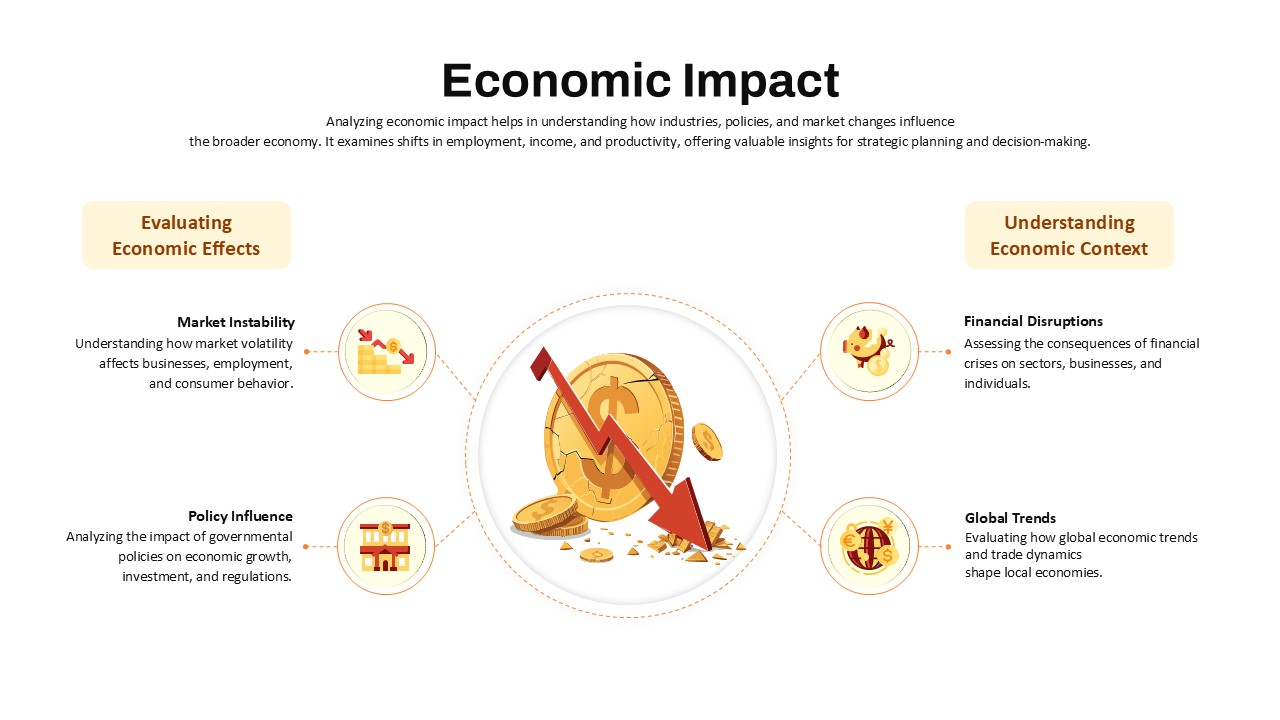
Economic Impact Assessment template for PowerPoint & Google Slides
Business Report
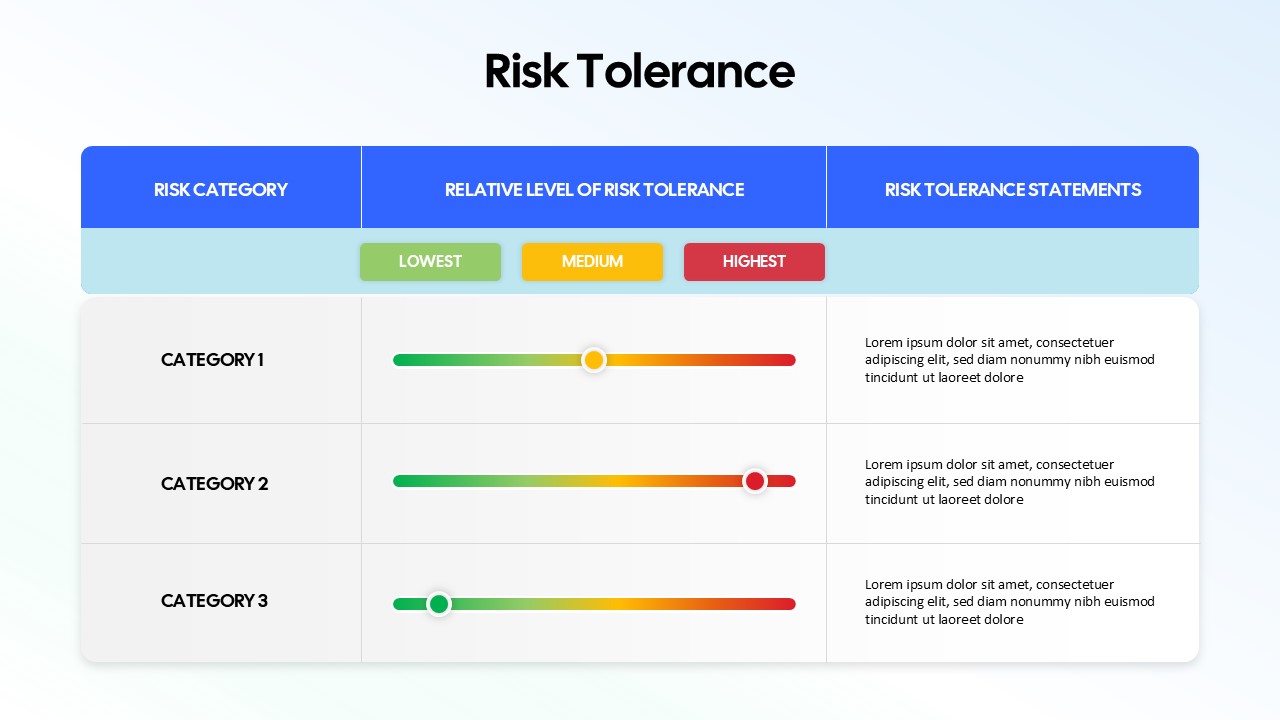
Risk Tolerance Assessment Sliders Template for PowerPoint & Google Slides
Finance
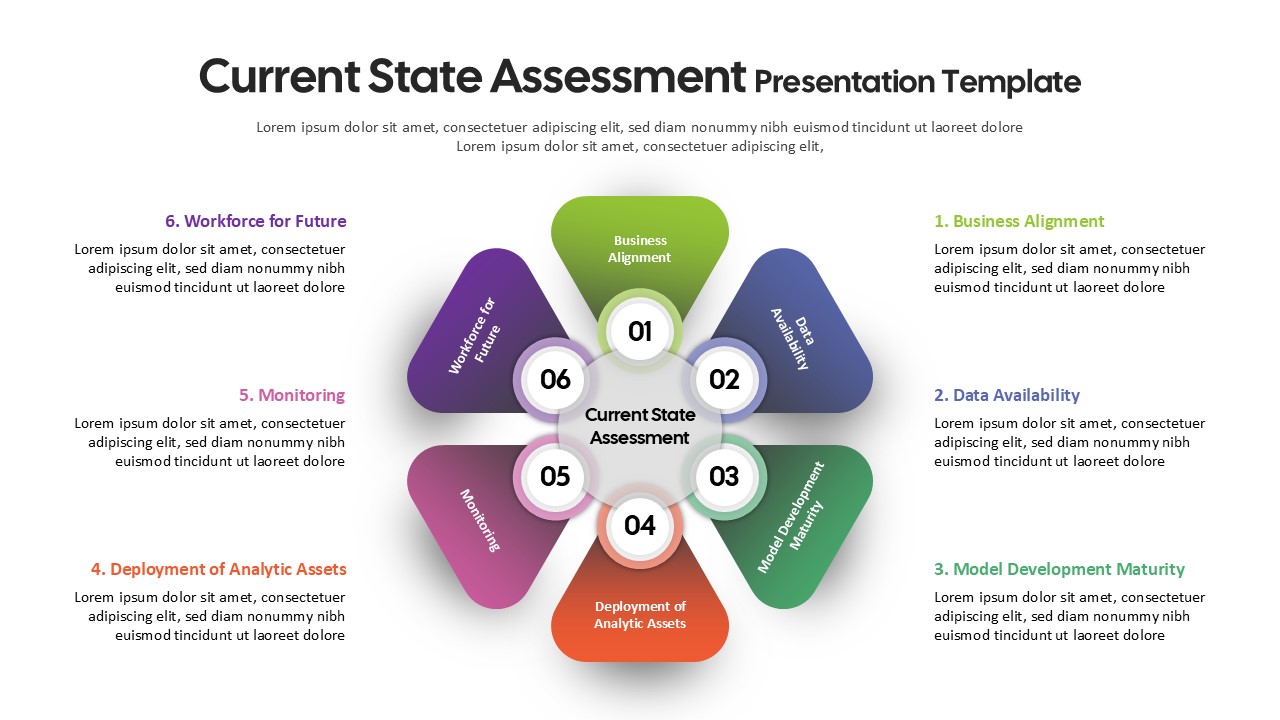
Current State Assessment Template for PowerPoint & Google Slides
Gap
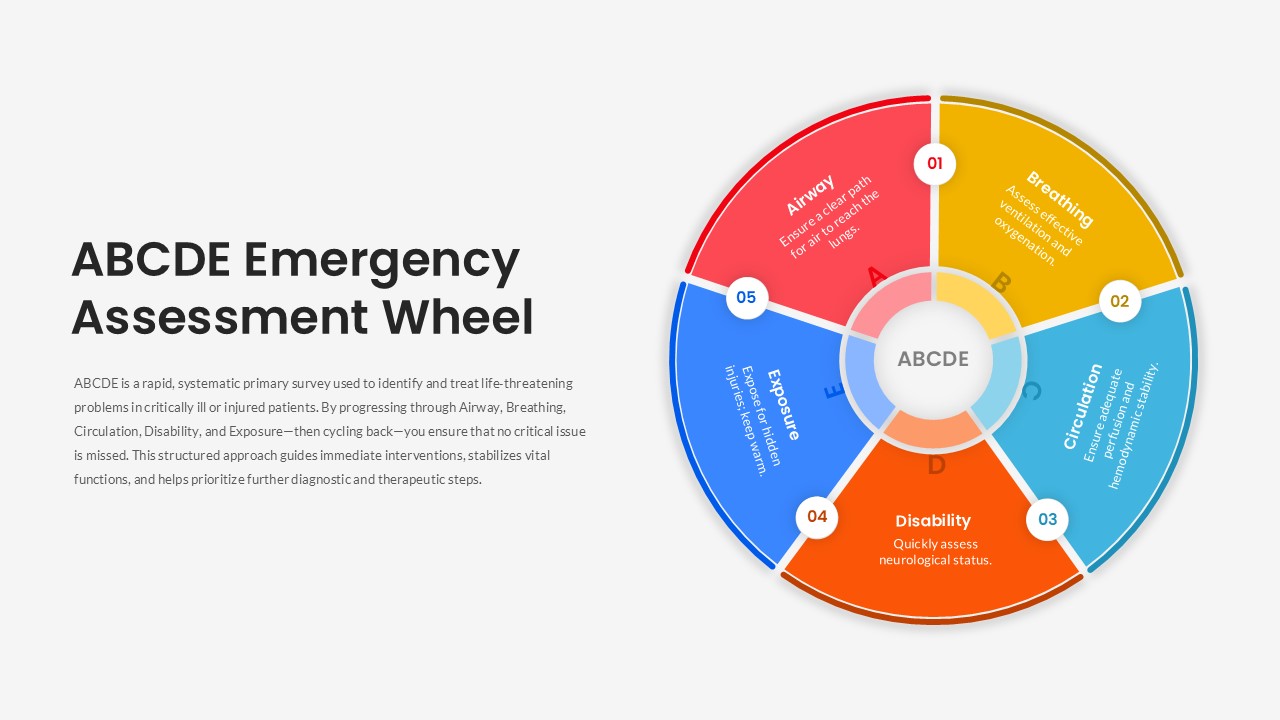
ABCDE Emergency Assessment Wheel Template for PowerPoint & Google Slides
Circular
IT Gap Analysis Assessment Matrix Template for PowerPoint & Google Slides
Information Technology
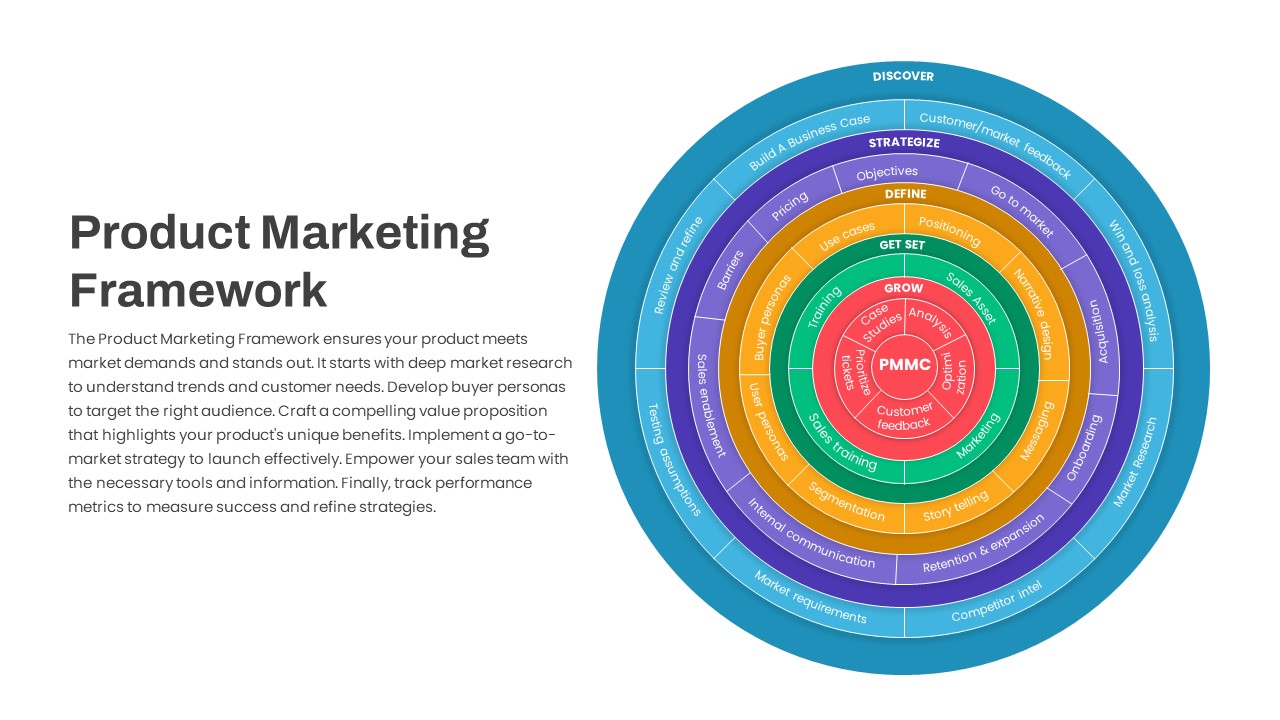
Product Marketing Framework Circular Template for PowerPoint & Google Slides
Circular
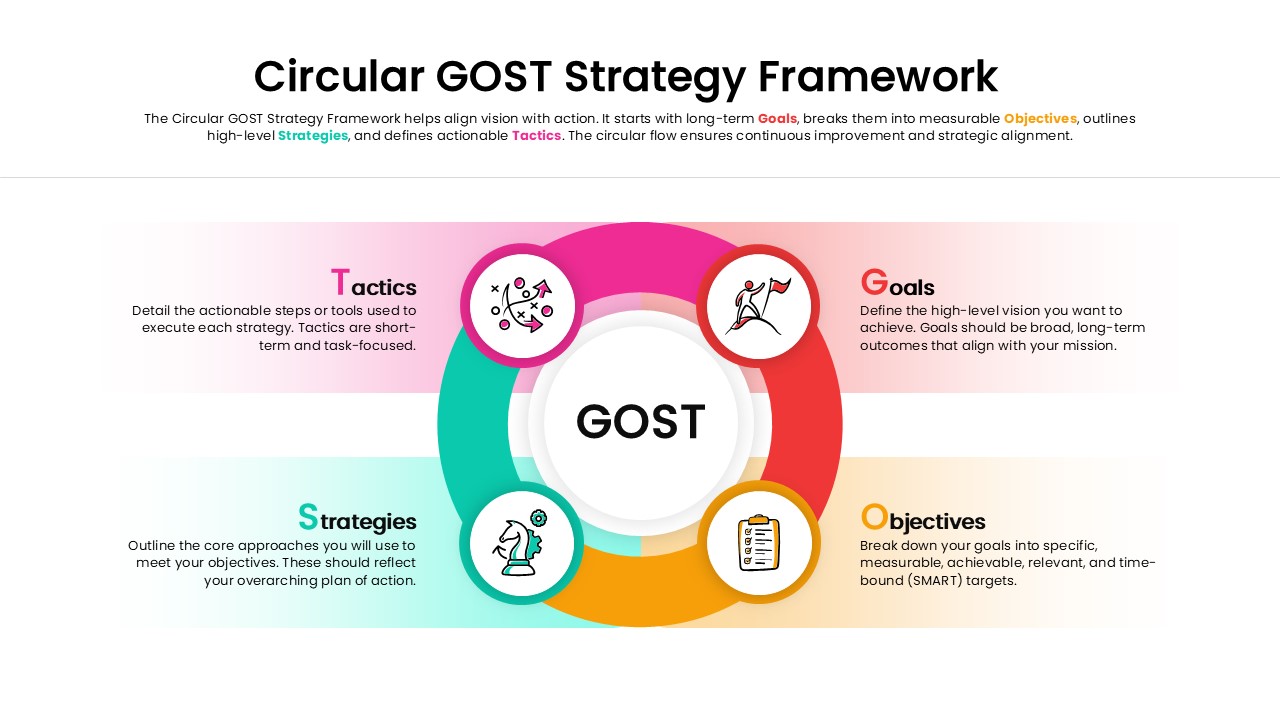
Circular GOST Strategy Framework Template for PowerPoint & Google Slides
Goals
Six-Staged Gear Diagram Framework Template for PowerPoint & Google Slides
Process
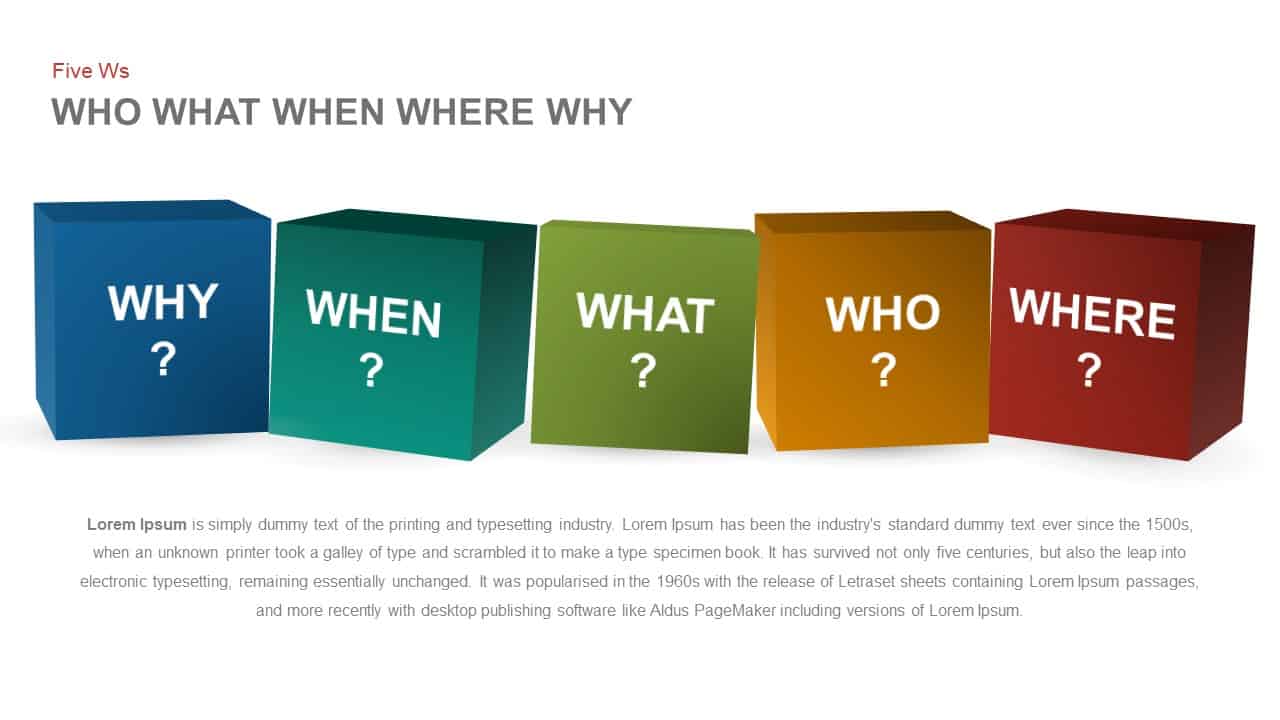
Five Ws Framework Cube Diagram Template for PowerPoint & Google Slides
Comparison
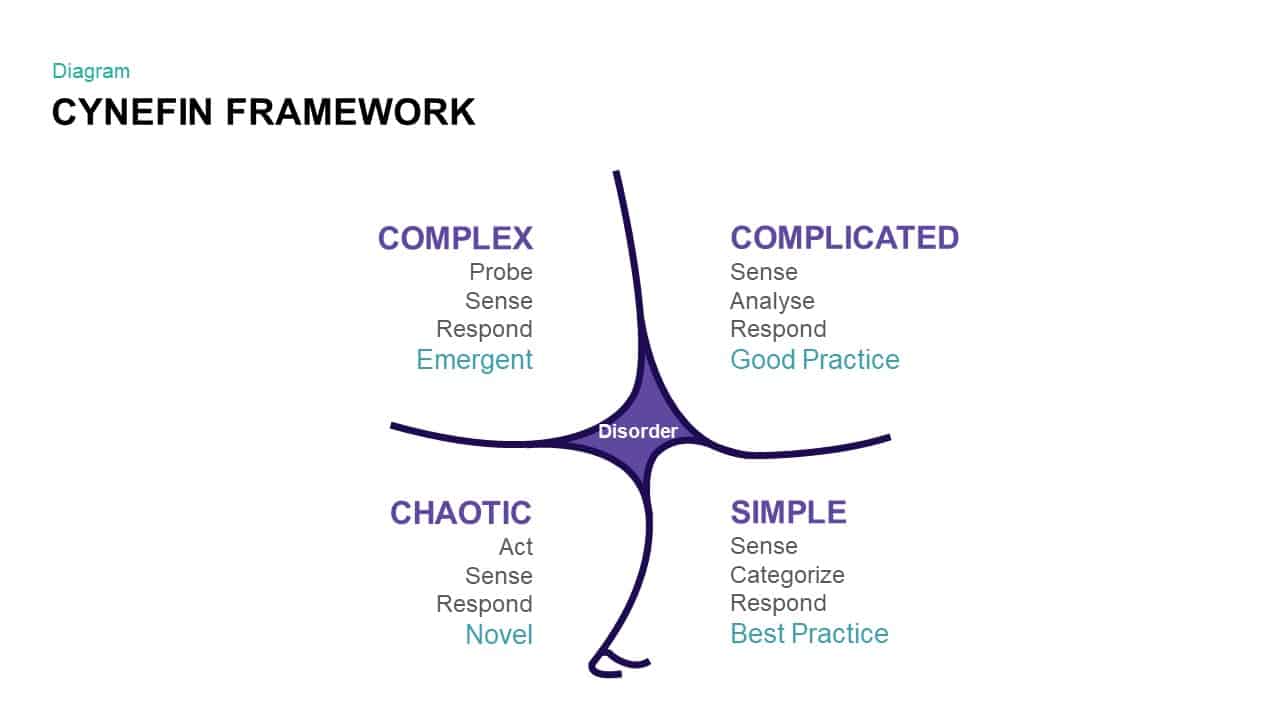
Comprehensive Cynefin Framework Diagram Template for PowerPoint & Google Slides
Opportunities Challenges
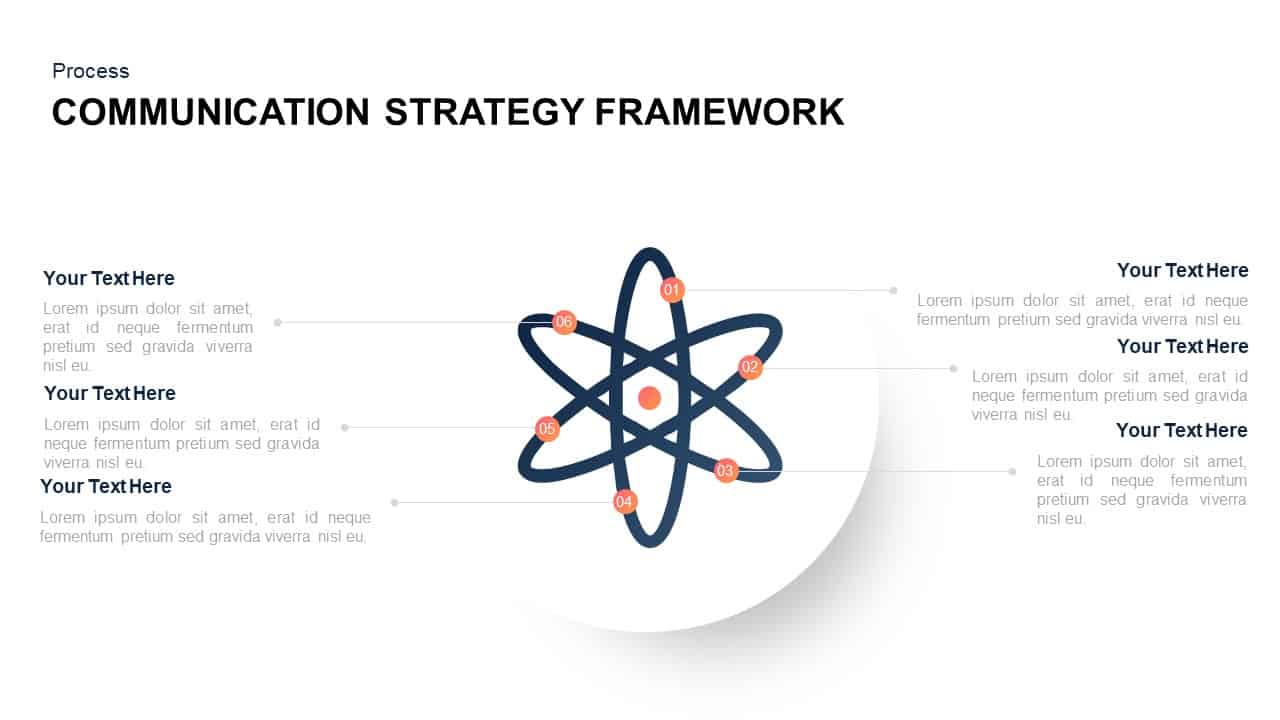
Communication Strategy Framework Diagram Template for PowerPoint & Google Slides
Circular
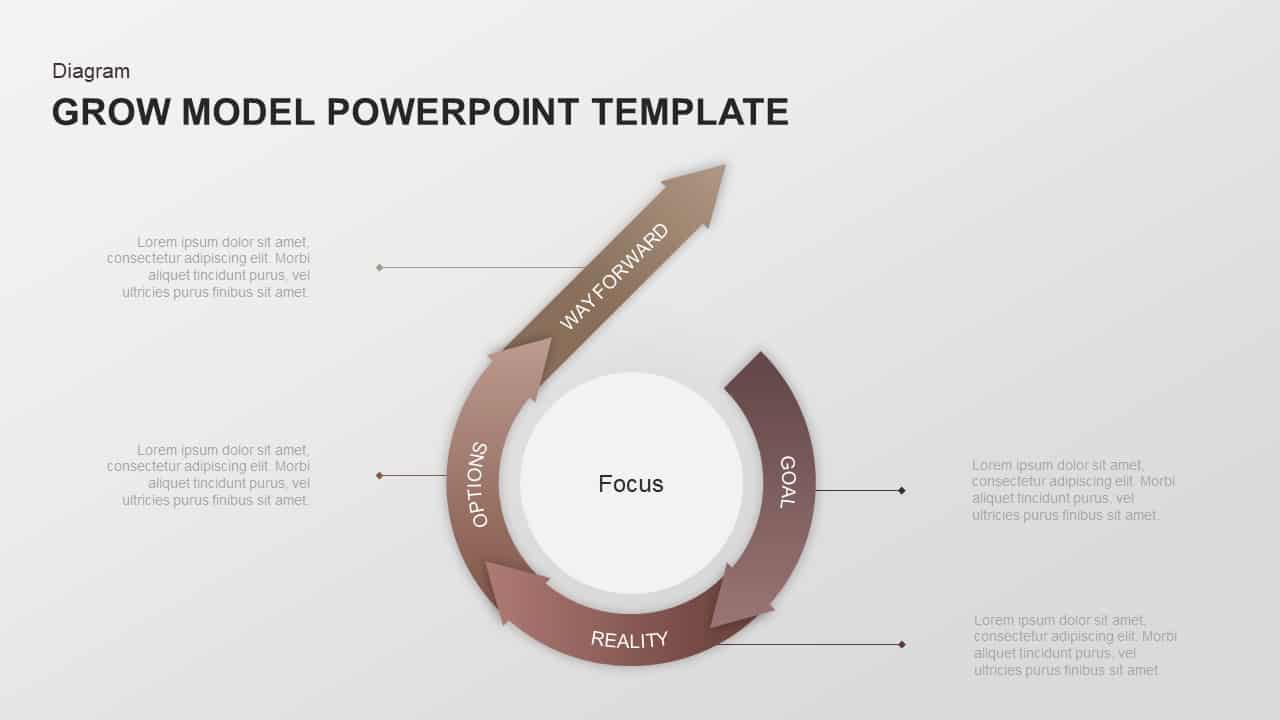
GROW Coaching Framework Diagram Template for PowerPoint & Google Slides
Process
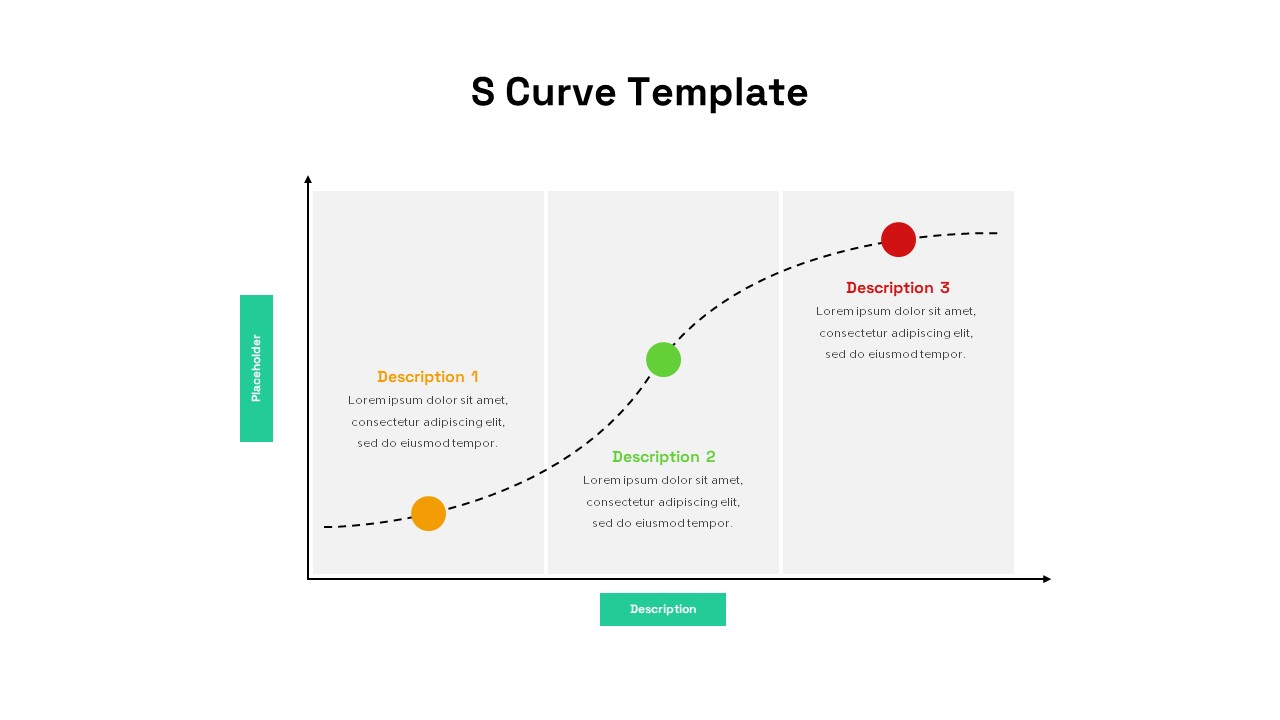
S-Curve Progression Framework Diagram Template for PowerPoint & Google Slides
Charts
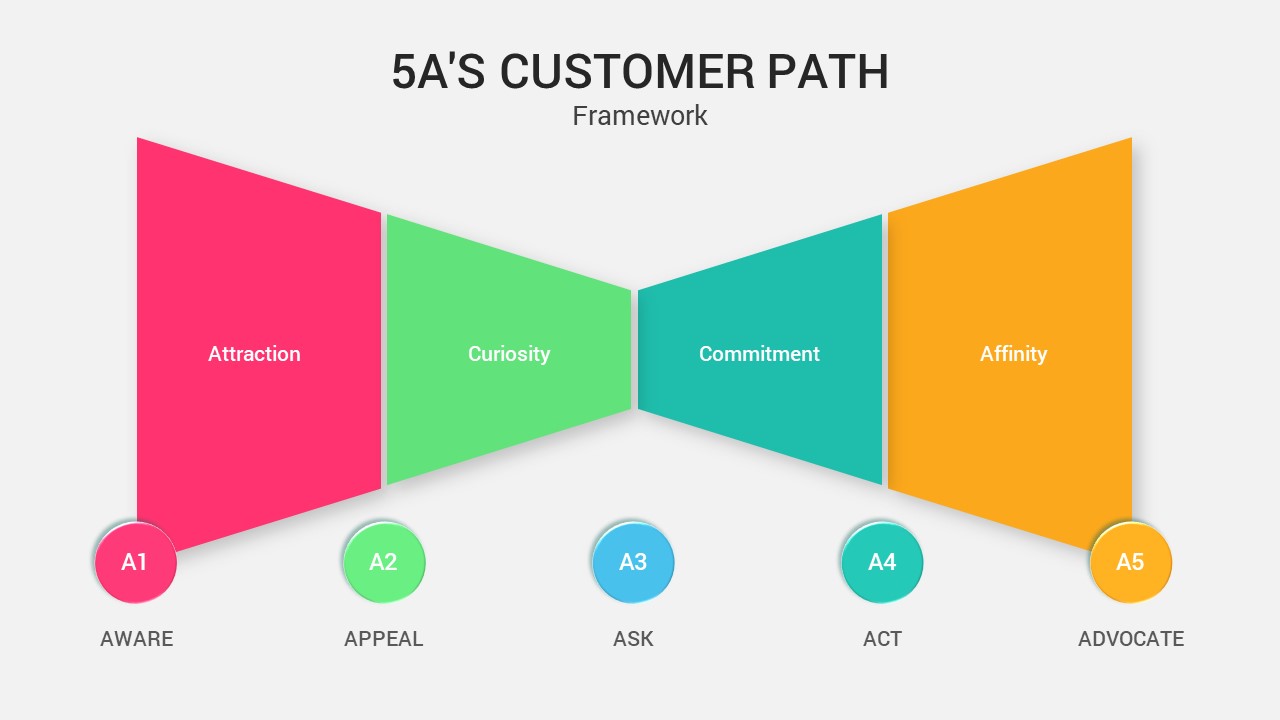
5A’s Customer Path Framework Diagram Template for PowerPoint & Google Slides
Process
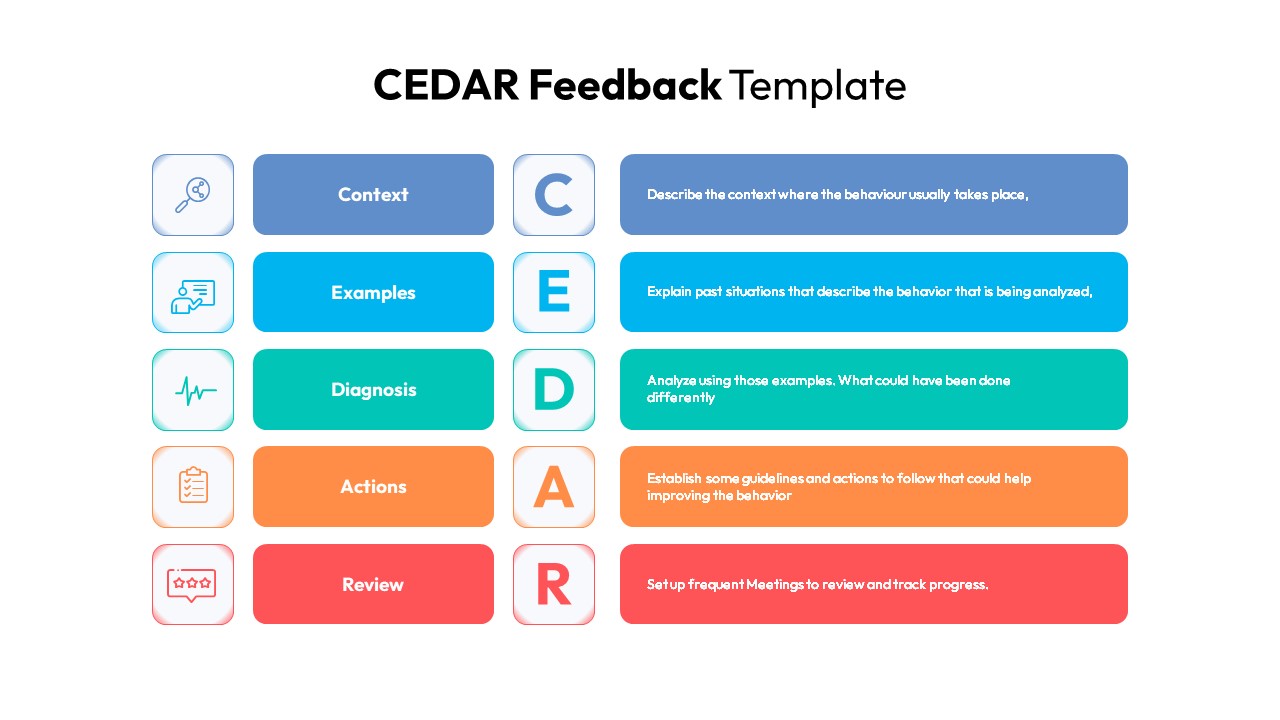
CEDAR Feedback Framework Diagram Template for PowerPoint & Google Slides
Employee Performance
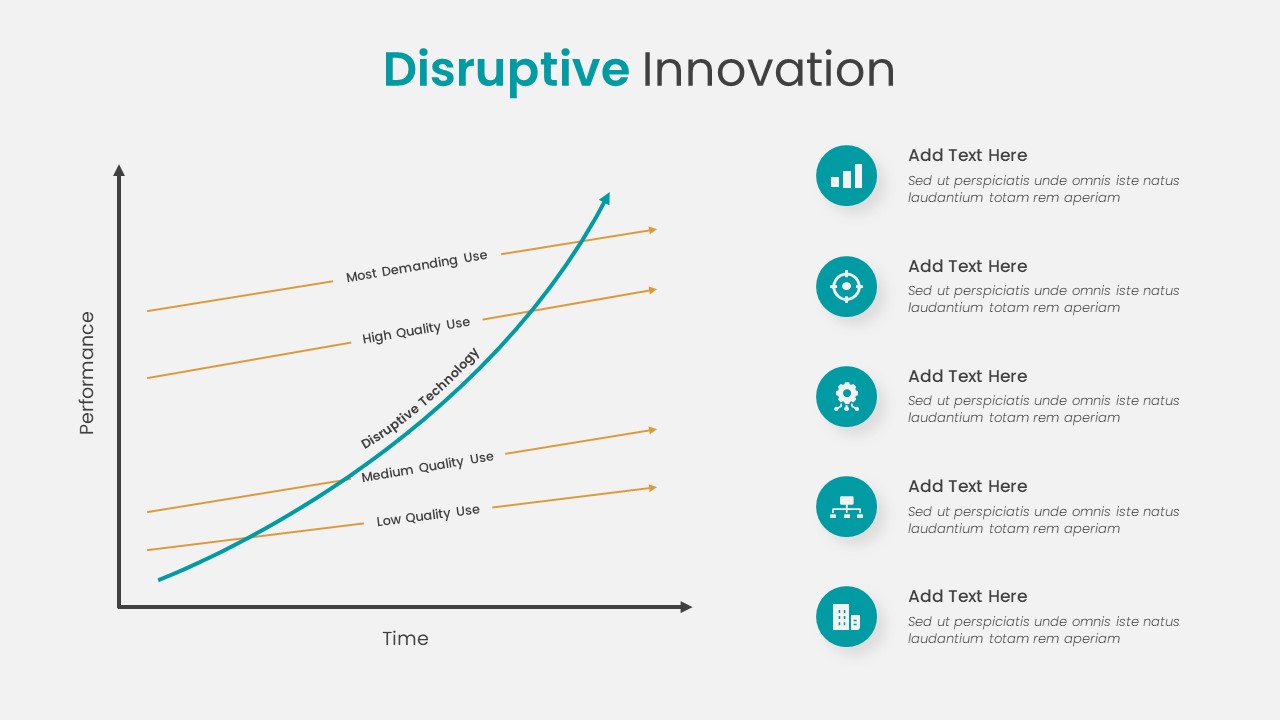
Disruptive Innovation Framework Diagram Template for PowerPoint & Google Slides
Comparison Chart
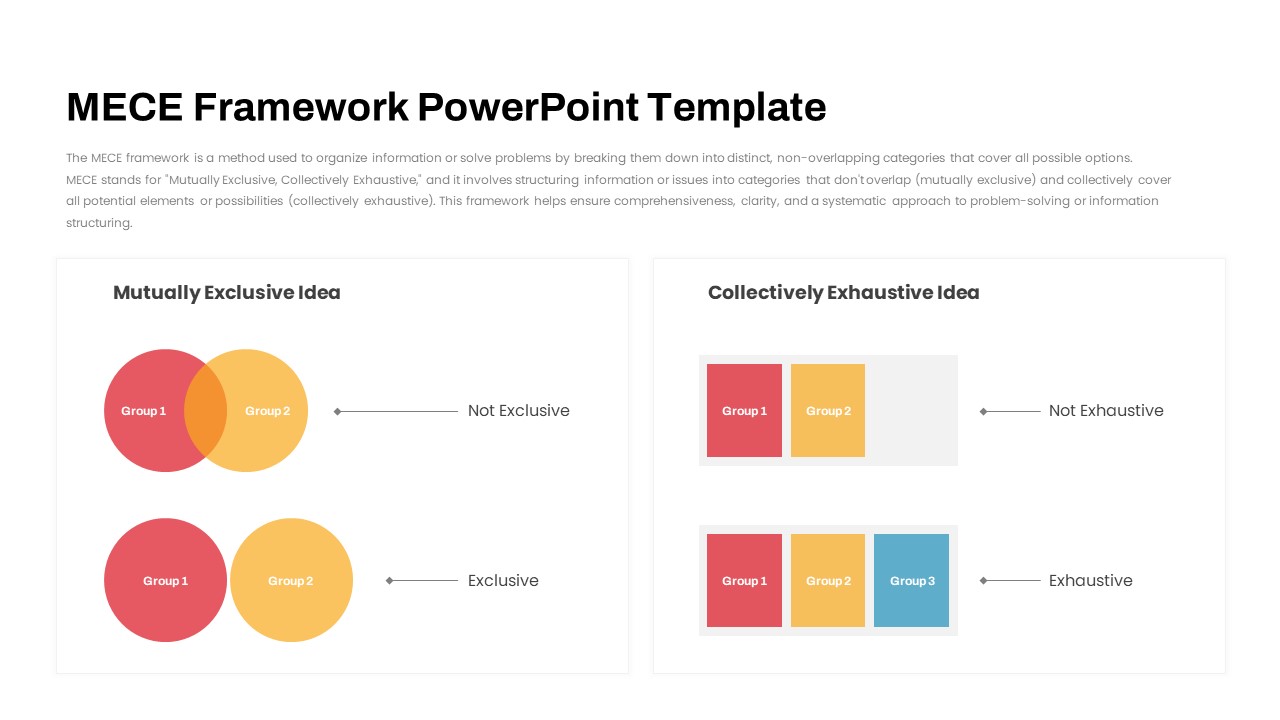
MECE Framework Venn & Block Diagram Template for PowerPoint & Google Slides
Comparison
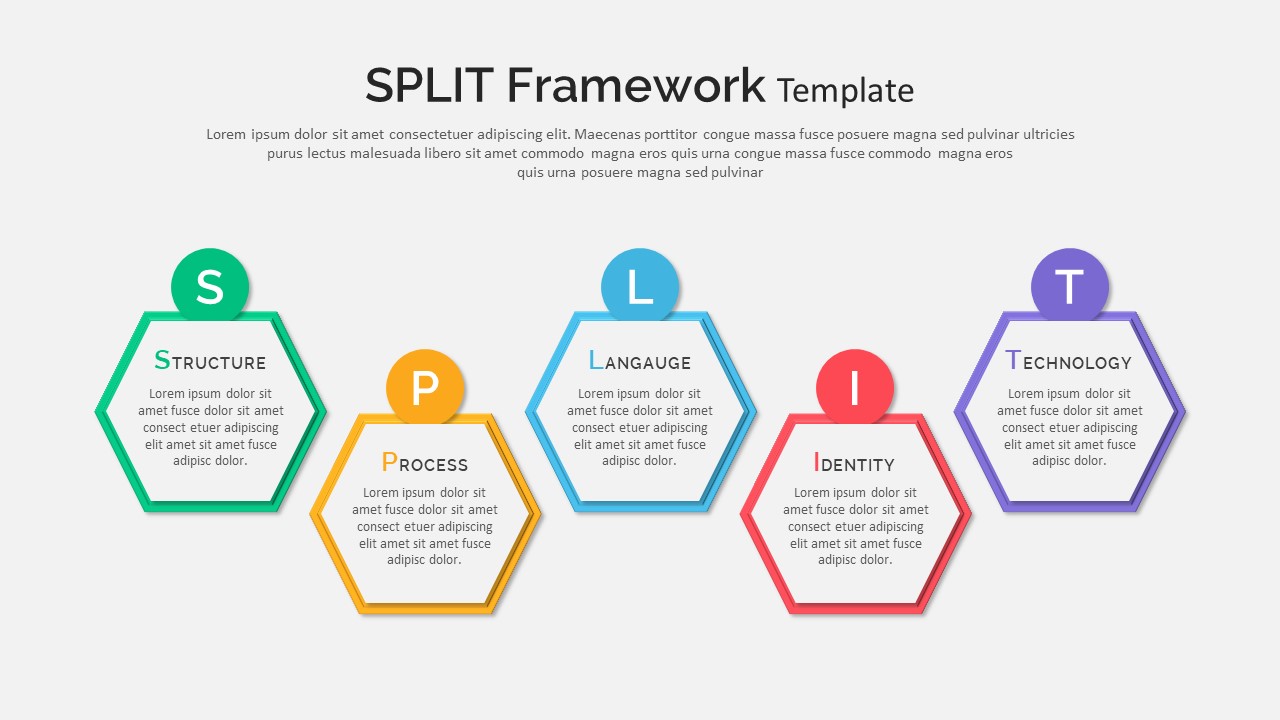
Split Framework Hexagon Diagram Slide Template for PowerPoint & Google Slides
Process
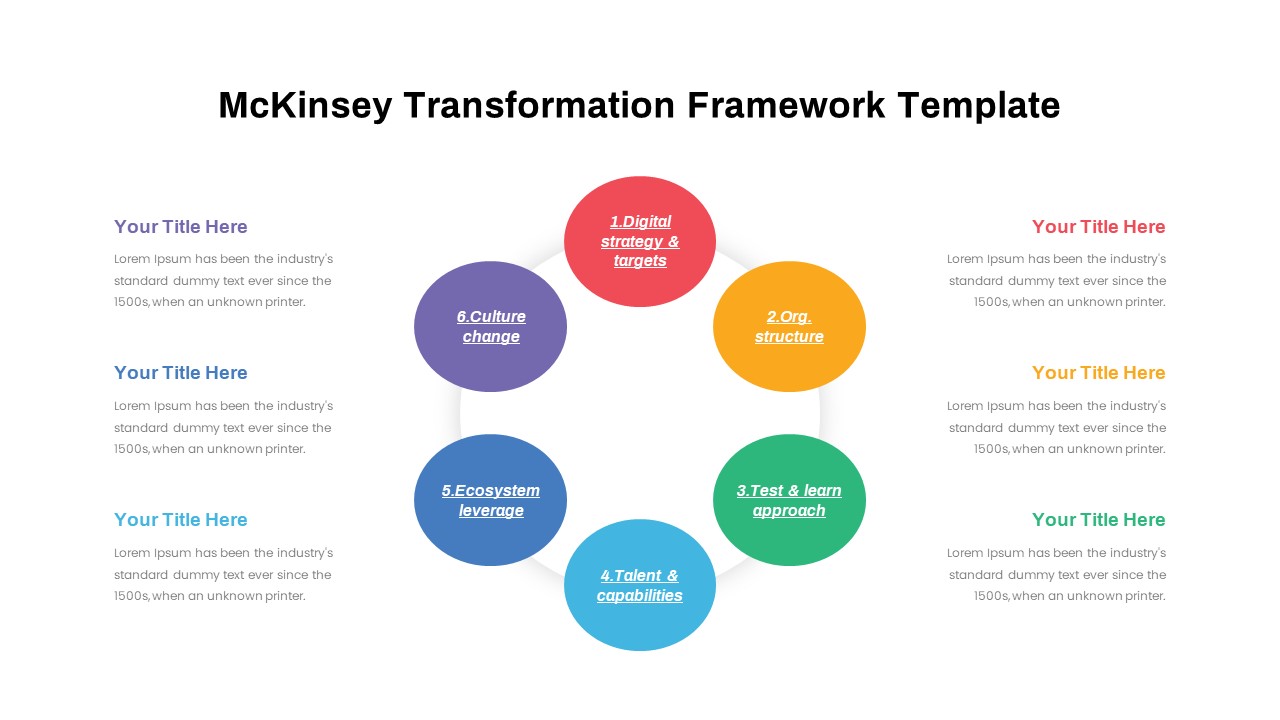
BCG Transformation Framework Diagram Template for PowerPoint & Google Slides
BCG
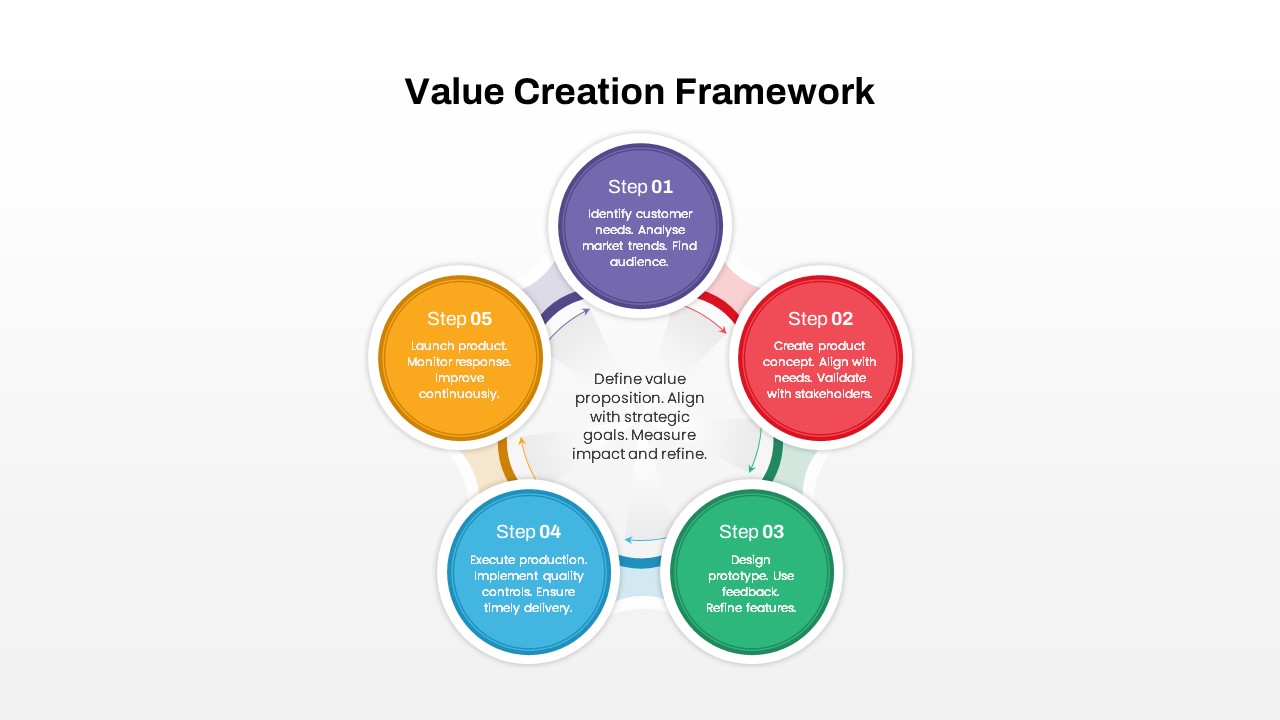
Value Creation Framework Process Diagram Template for PowerPoint & Google Slides
Business Plan
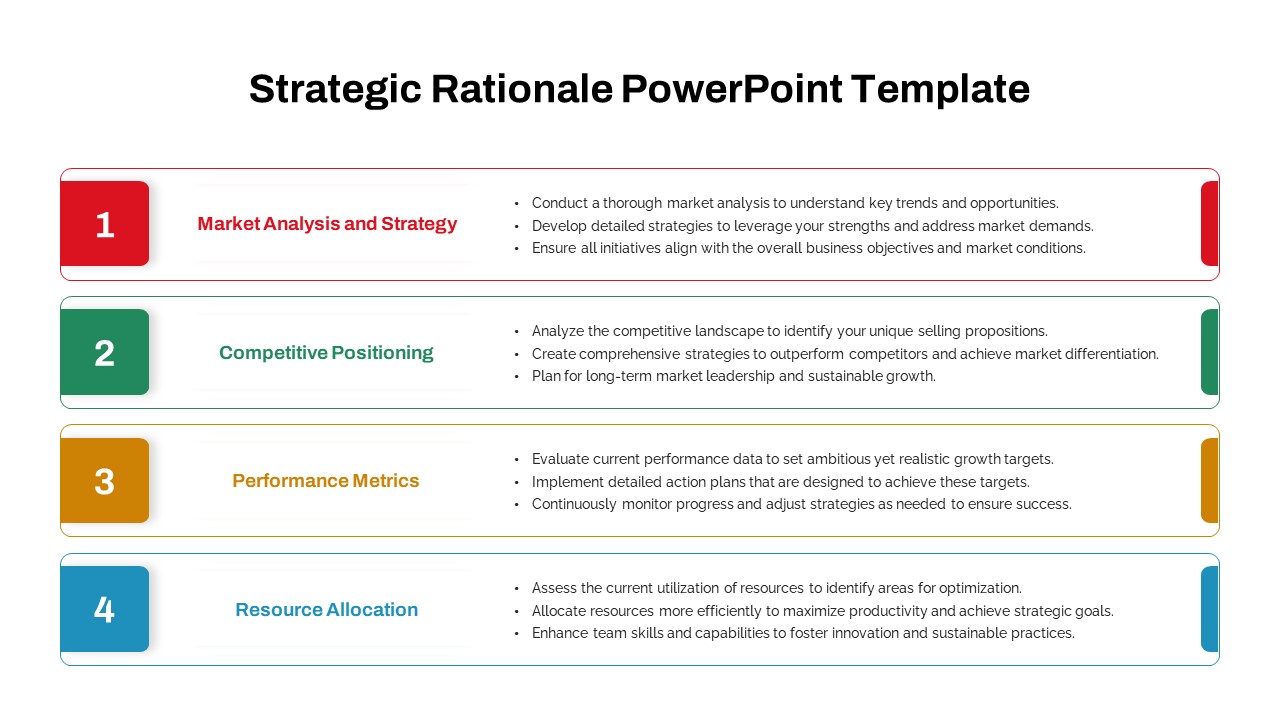
Strategic Rationale Framework Diagram Template for PowerPoint & Google Slides
Process
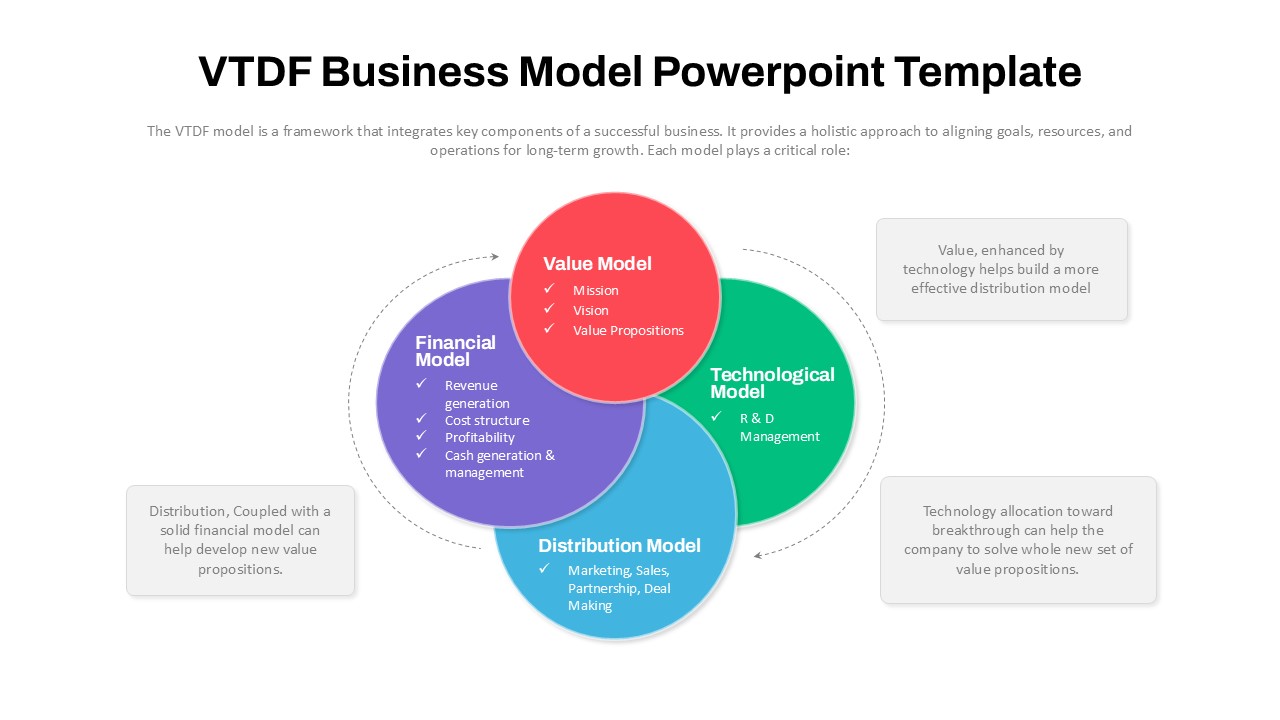
VTDF Business Model Framework Diagram Template for PowerPoint & Google Slides
Business Models
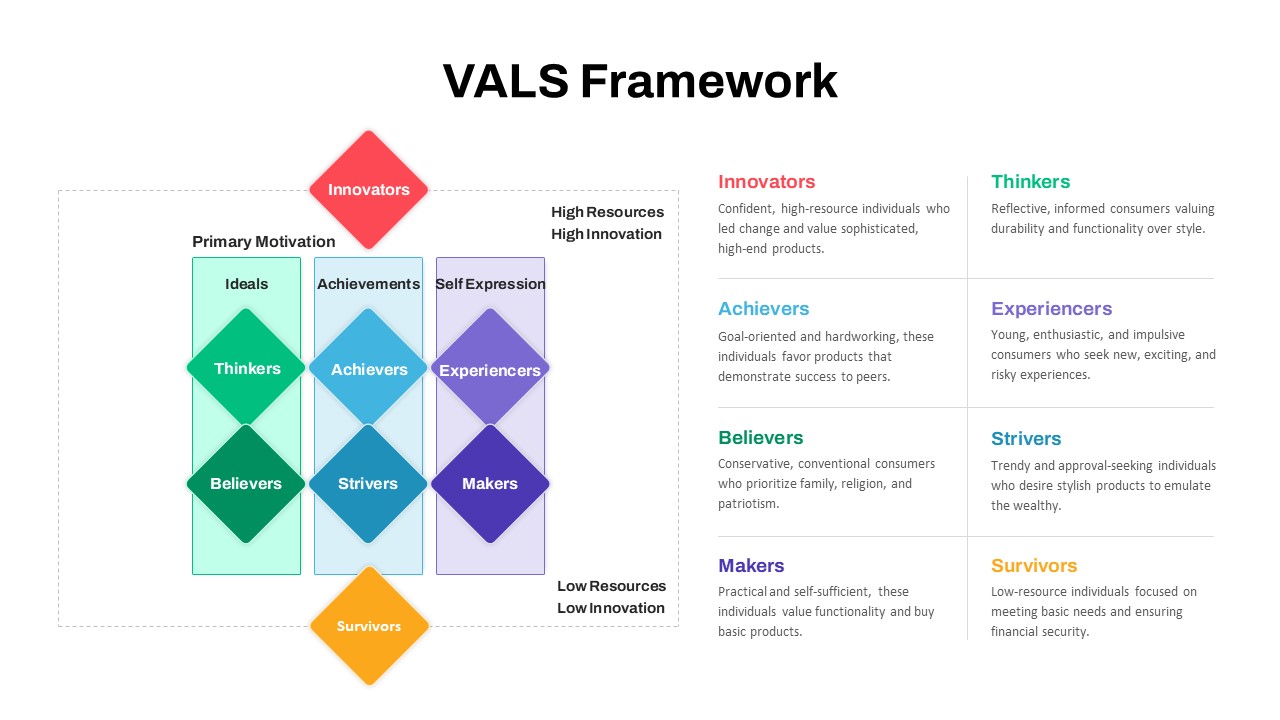
VALS Segmentation Framework Diagram Template for PowerPoint & Google Slides
Marketing
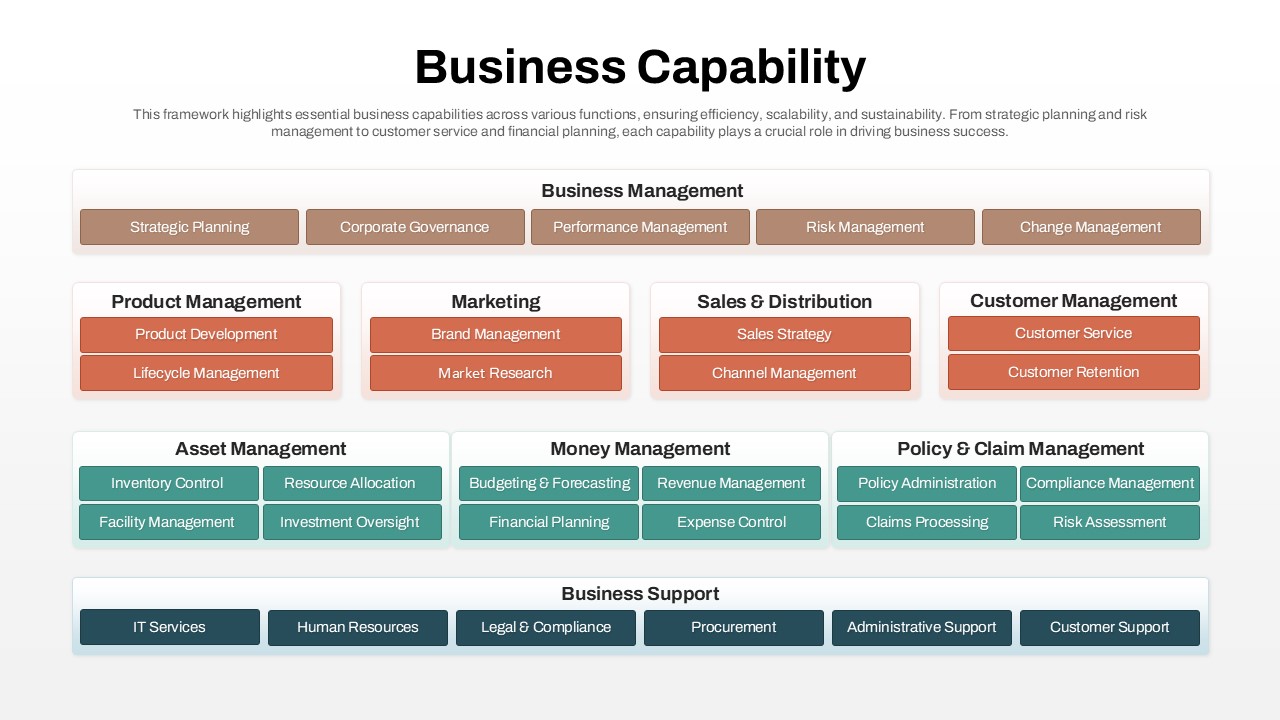
Business Capability Framework Diagram Template for PowerPoint & Google Slides
Business Models
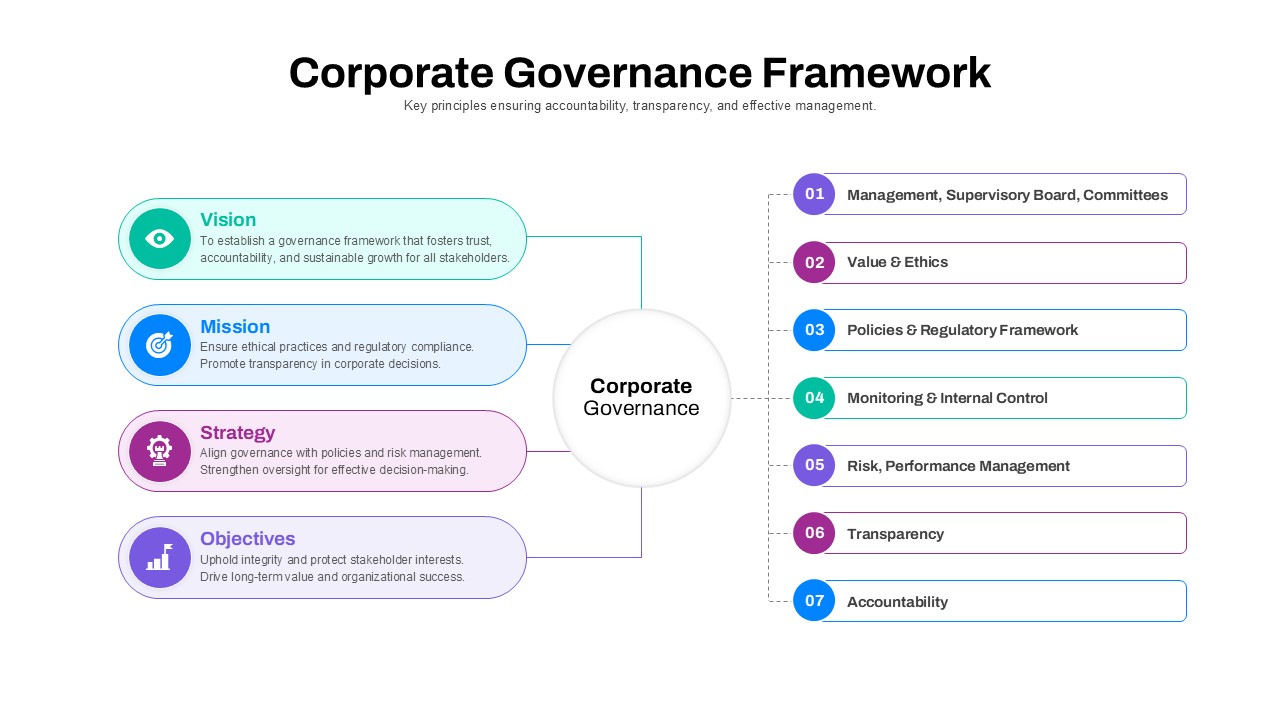
Corporate Governance Framework Diagram Template for PowerPoint & Google Slides
Process
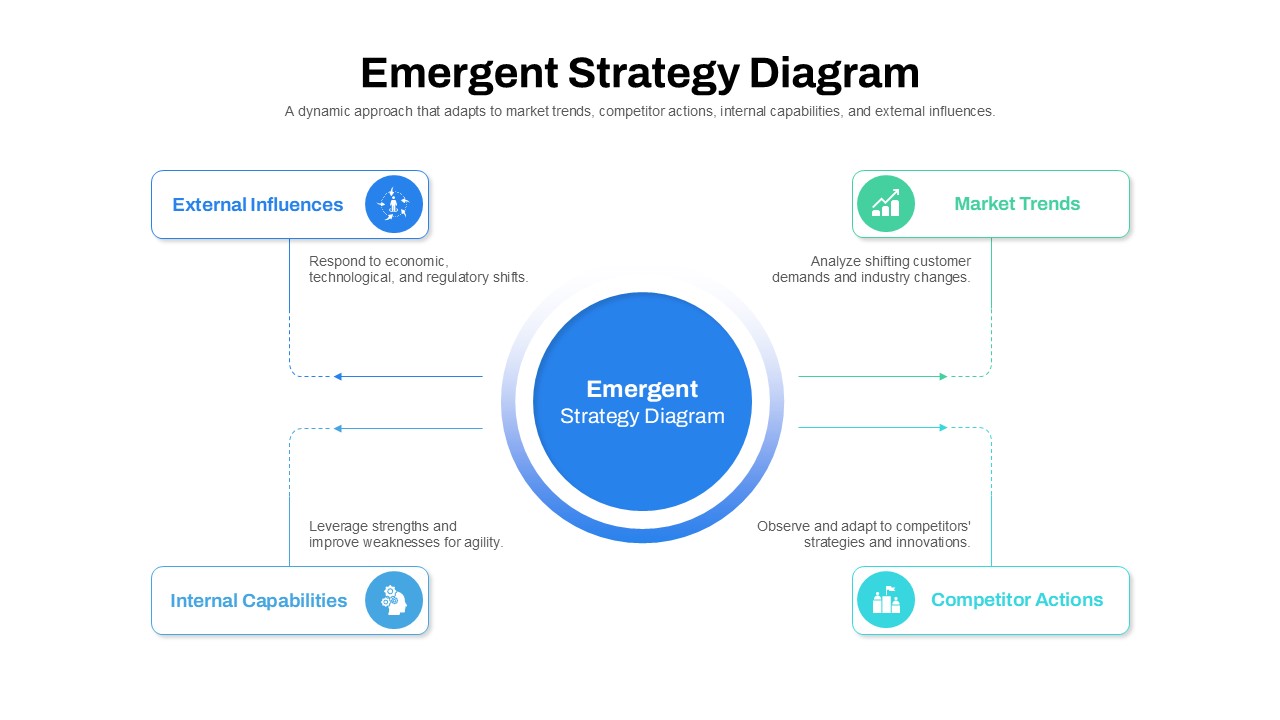
Emergent Strategy Diagram Framework Template for PowerPoint & Google Slides
Process
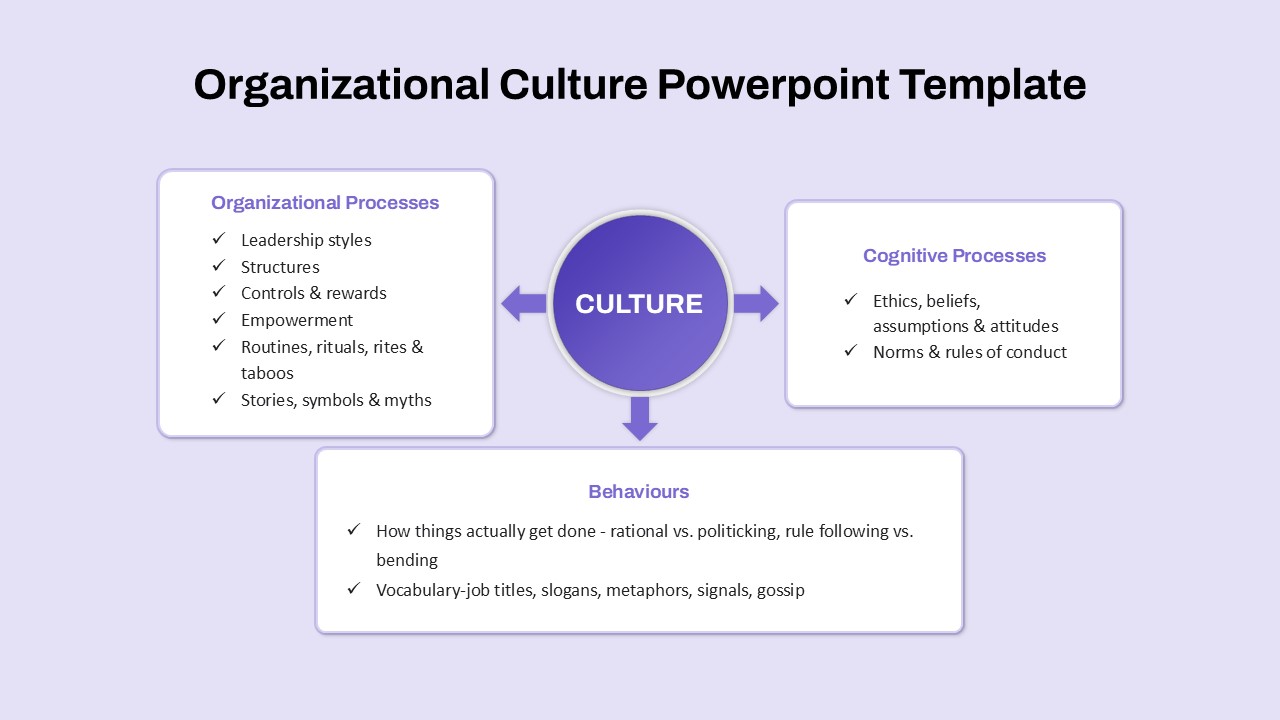
Organizational Culture Framework Diagram Template for PowerPoint & Google Slides
Arrow
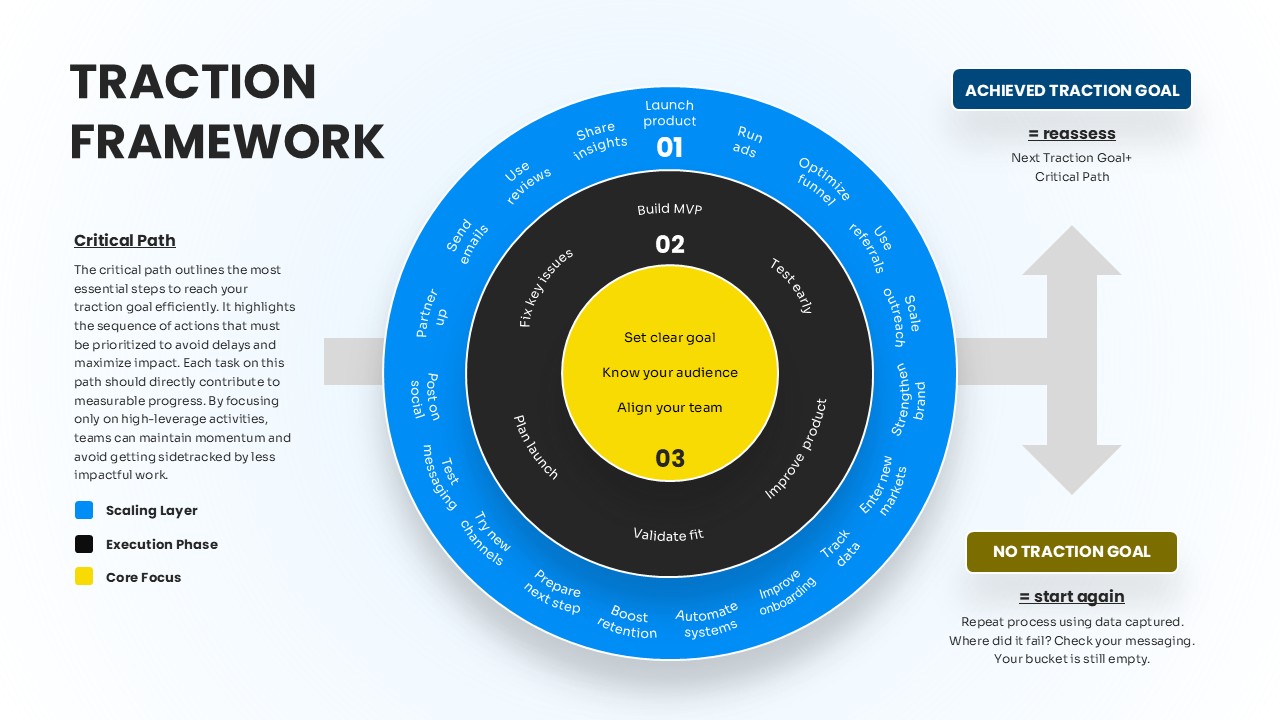
Concentric Traction Framework Diagram Template for PowerPoint & Google Slides
Process
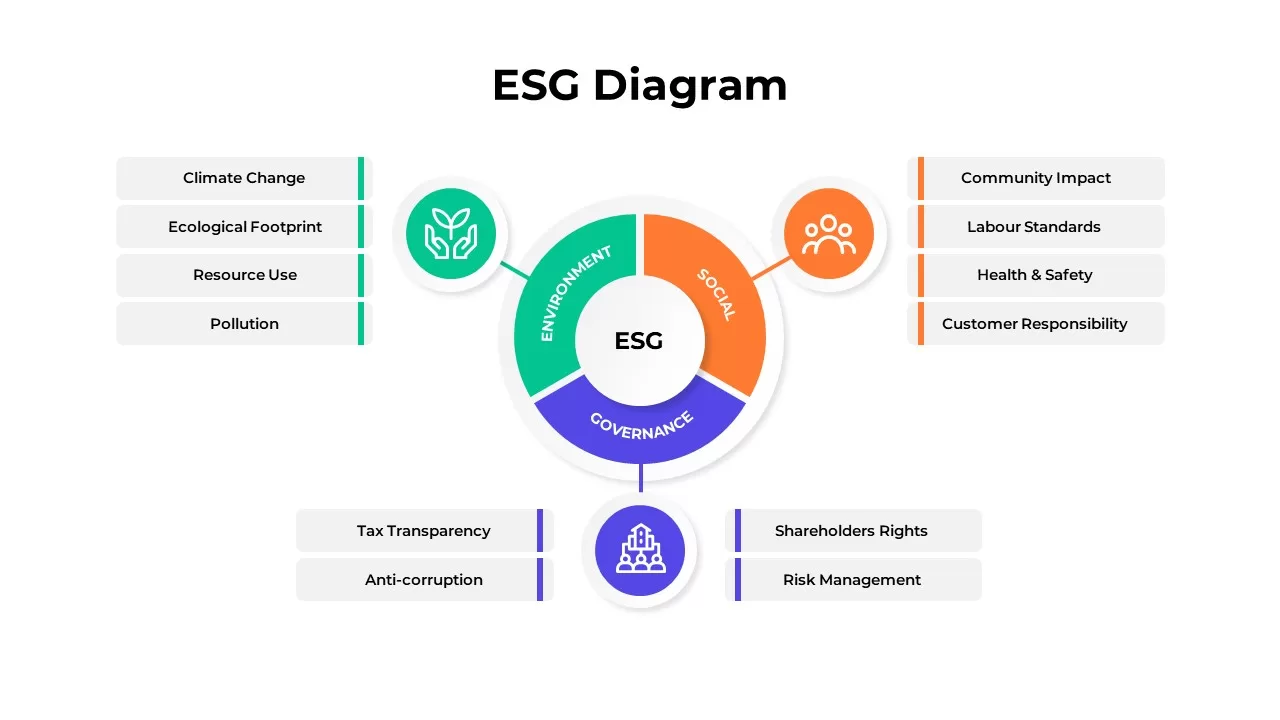
ESG Framework Segmentation Diagram for PowerPoint & Google Slides
Risk Management

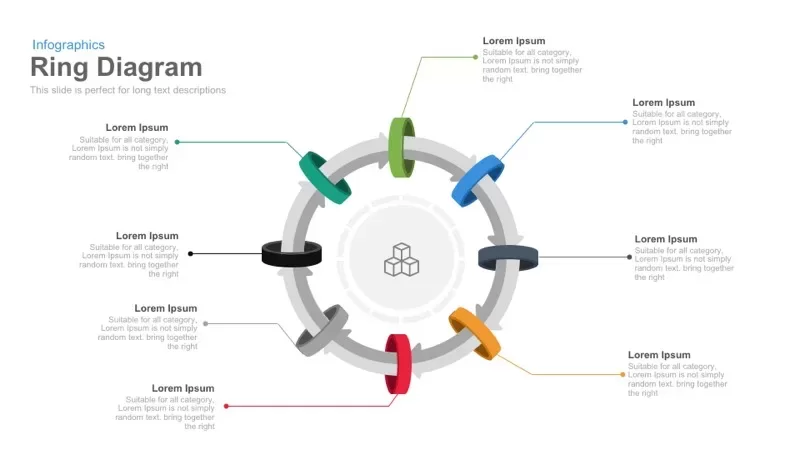
8 Circular Ring Diagram template for PowerPoint & Google Slides
Infographics
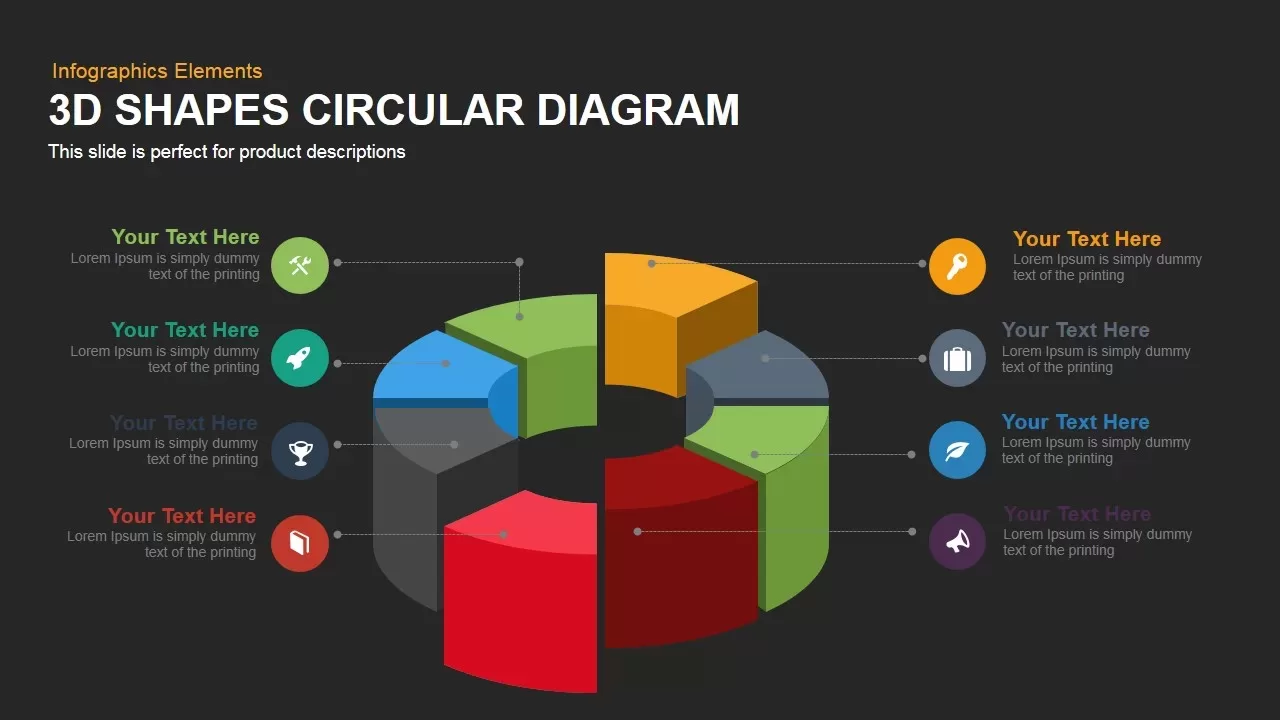
3D Circular Diagram template for PowerPoint & Google Slides
Circular
Circular Flow Diagram Template for PowerPoint & Google Slides
Infographics
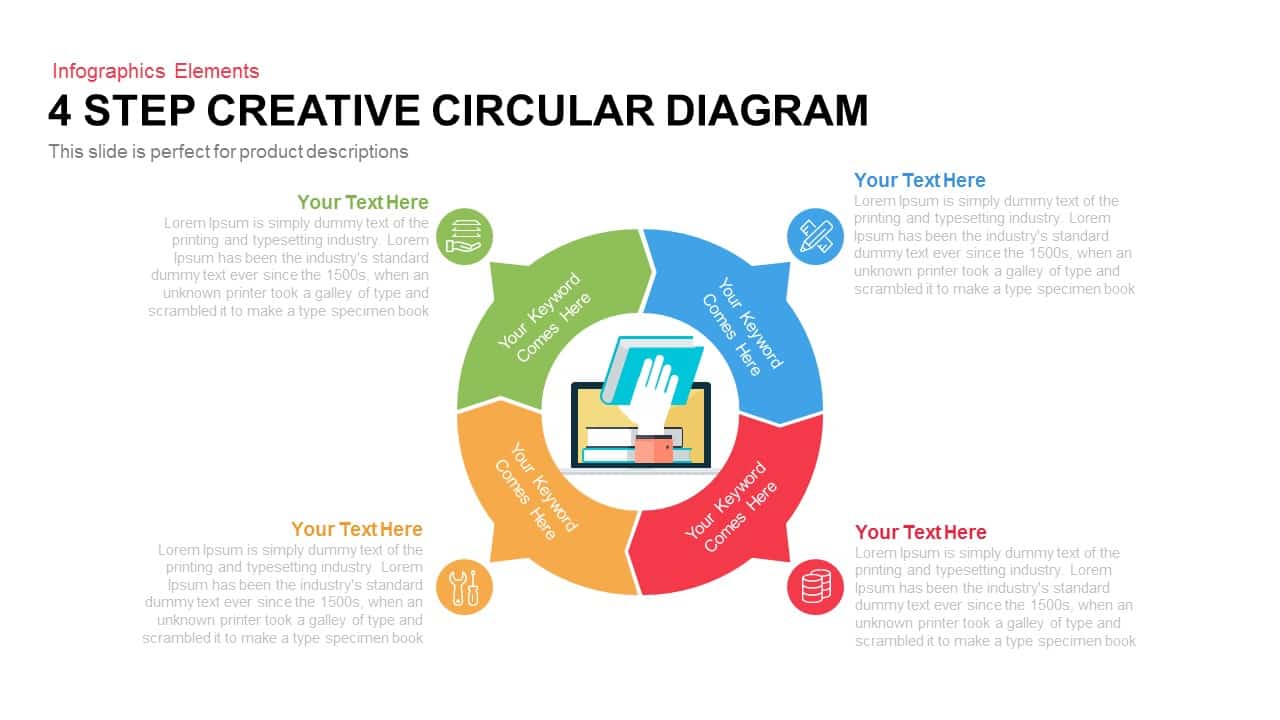
4 Step Creative Circular Diagram Template for PowerPoint & Google Slides
Infographics
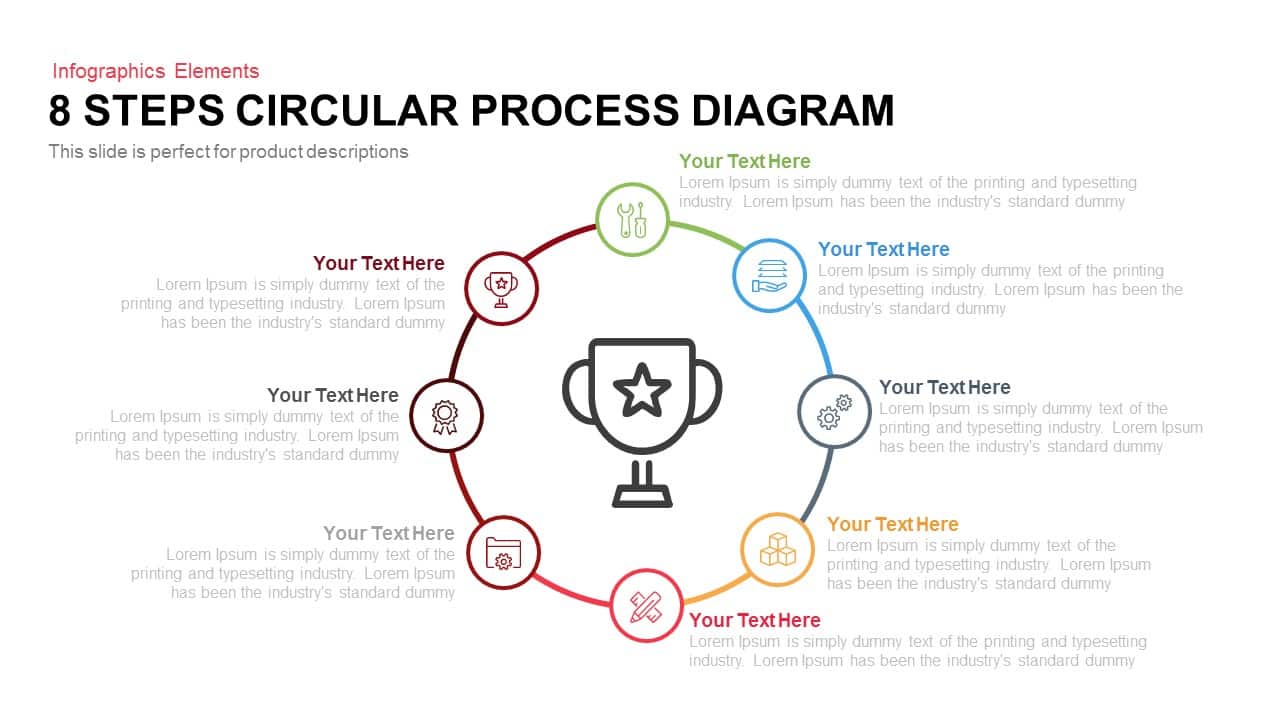
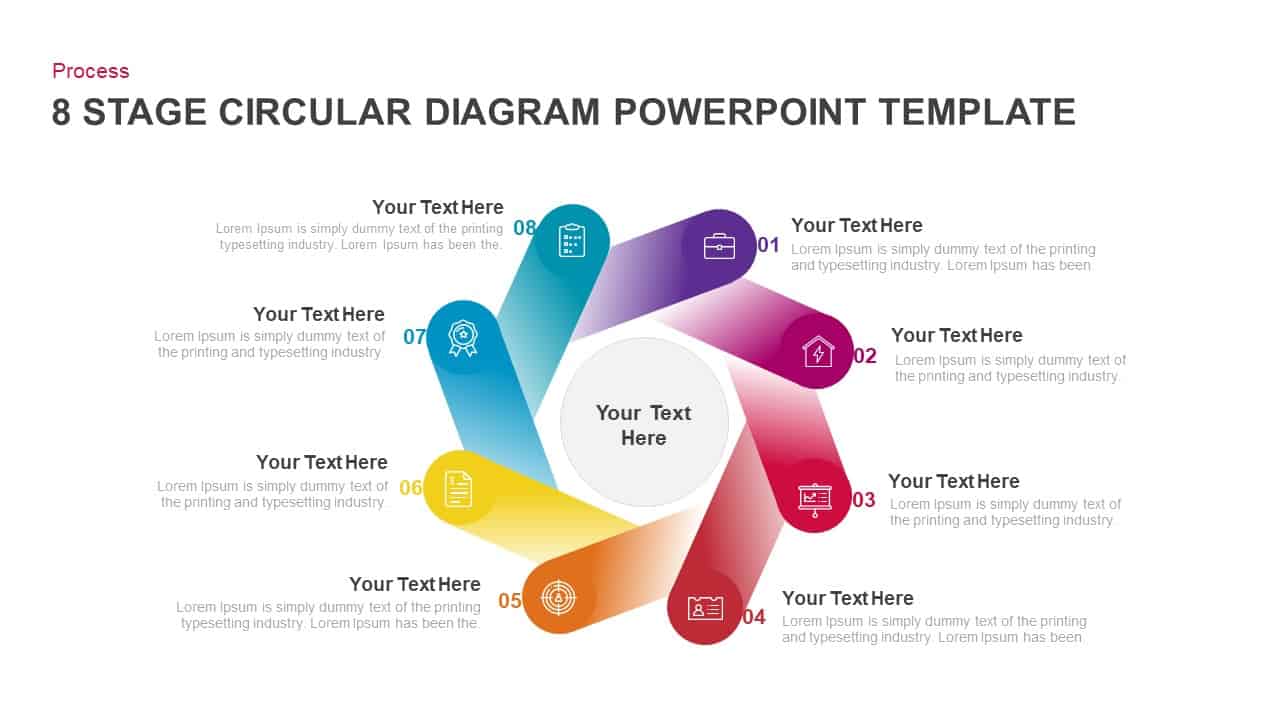
8 Steps Circular Process Diagram Template for PowerPoint & Google Slides
Process
Six Step Creative Circular Diagram Template for PowerPoint & Google Slides
Circular
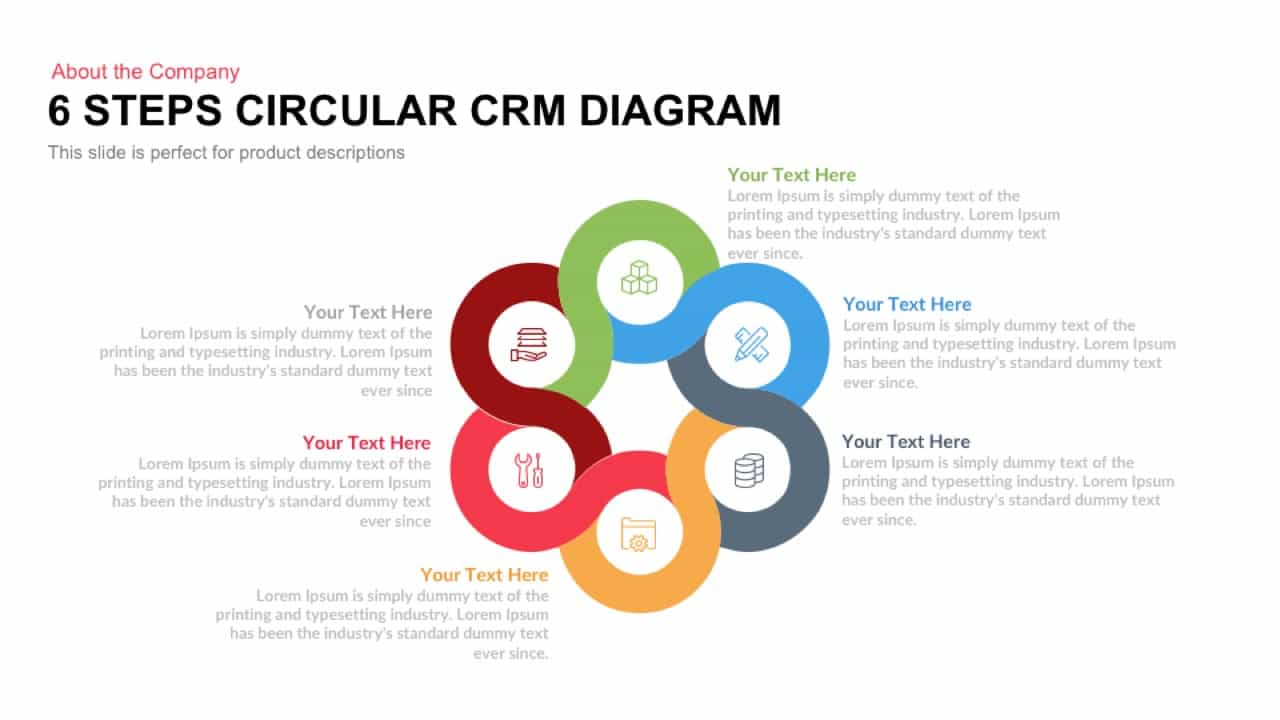
Six Steps Circular CRM Diagram Template for PowerPoint & Google Slides
Customer Journey
Six Section Circular Infographic Diagram Template for PowerPoint & Google Slides
Circular

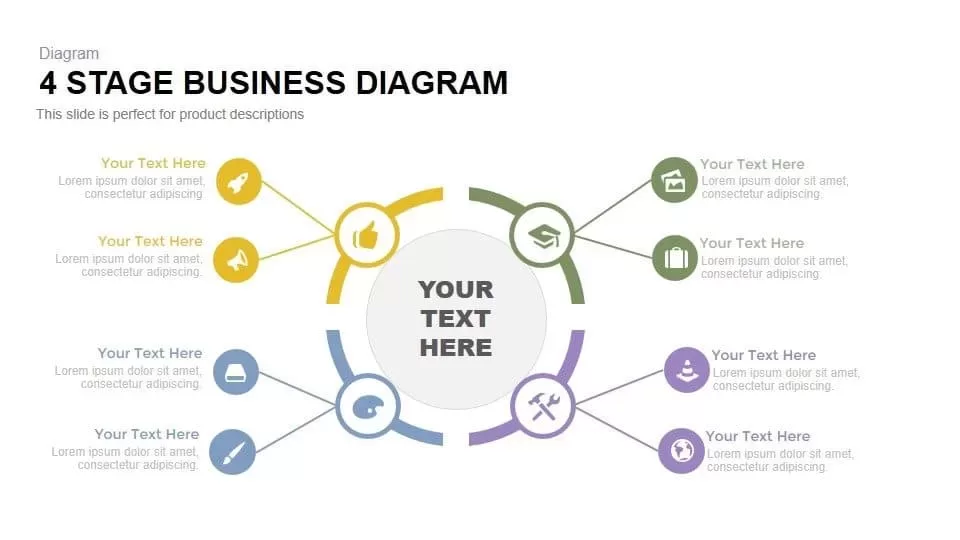
Four-Stage Business Circular Diagram Template for PowerPoint & Google Slides
Process
Five-Section Circular Arrow Diagram Template for PowerPoint & Google Slides
Circular
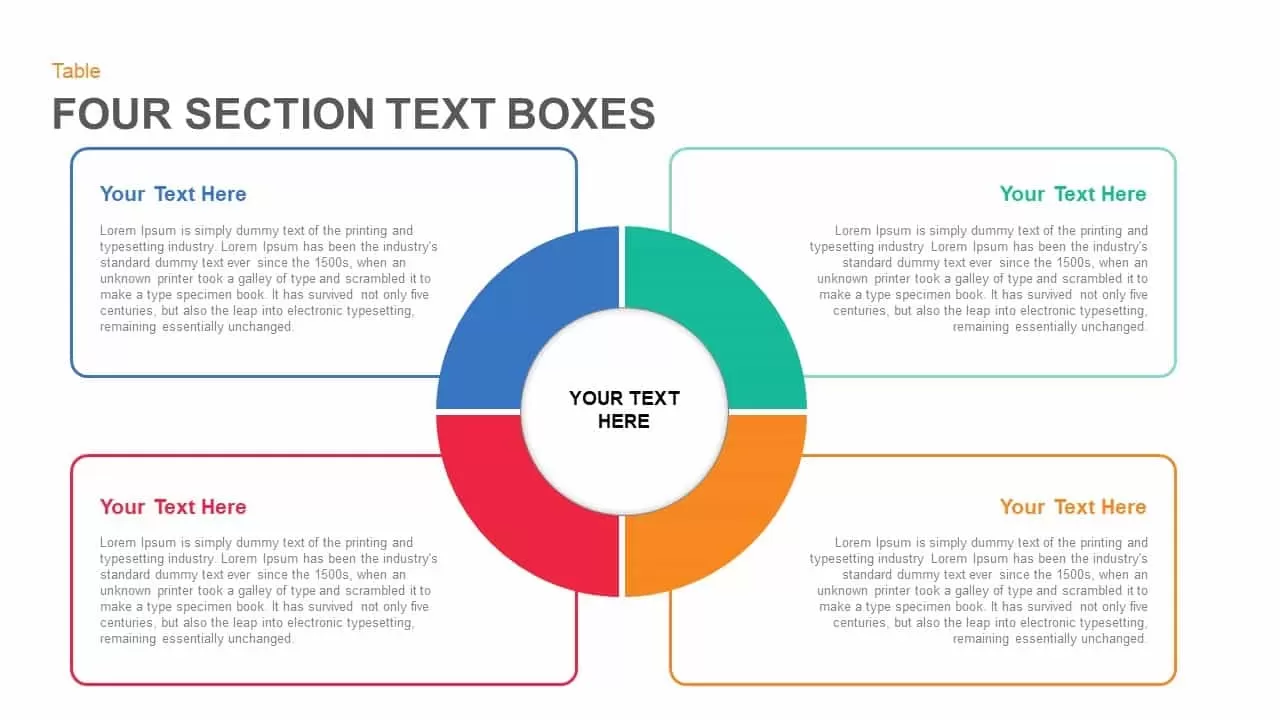
Four Section Circular Text Boxes Diagram Template for PowerPoint & Google Slides
Circular
Eight-Step Circular Diagram Infographic Template for PowerPoint & Google Slides
Circular

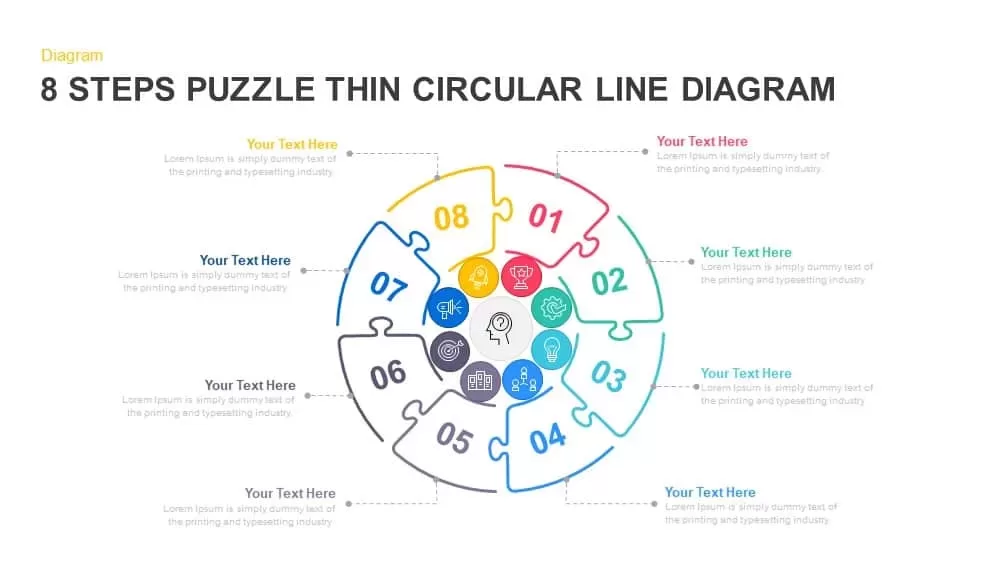
8-Step Puzzle Circular Diagram Template for PowerPoint & Google Slides
Circular
PEST Analysis Circular Diagram Template for PowerPoint & Google Slides
PEST
4 Staged Circular Business Process Diagram template for PowerPoint & Google Slides
Process
Six-Stage Circular Diagram Process Template for PowerPoint & Google Slides
Circular
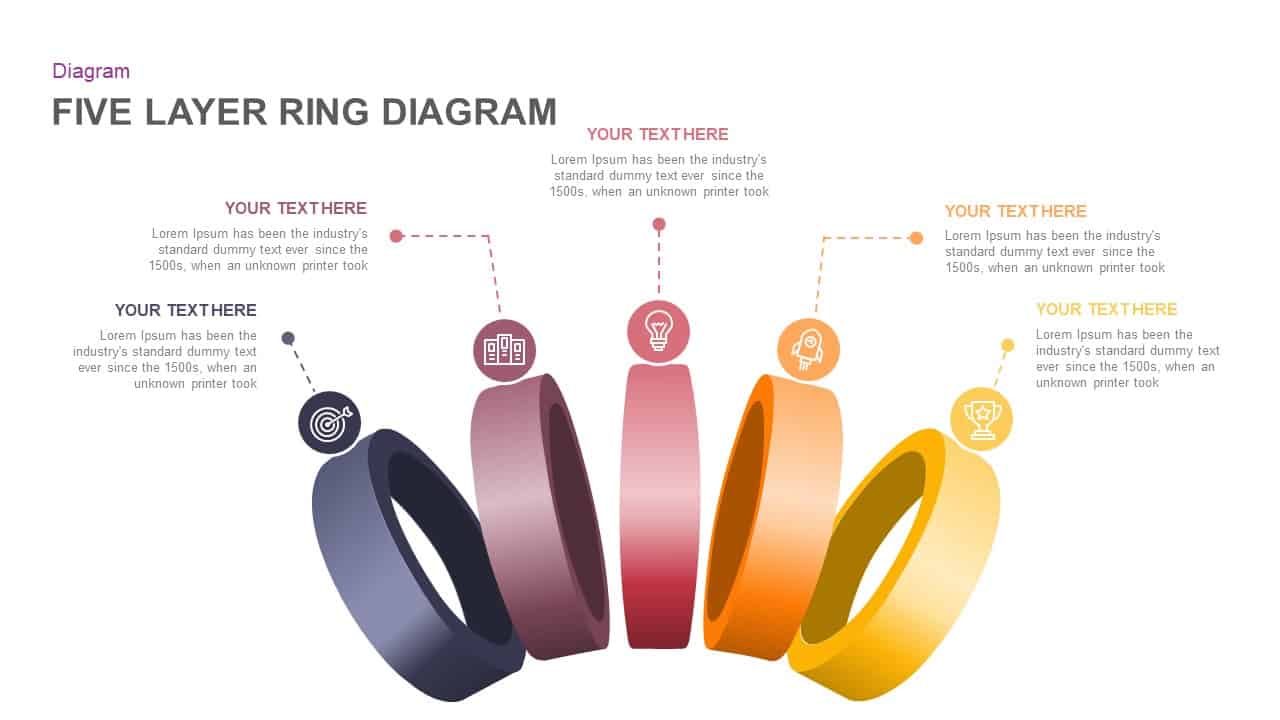
Five Layer Circular Ring Diagram Template for PowerPoint & Google Slides
Circular
Five Stage Circular Arrow Diagram Template for PowerPoint & Google Slides
Process
Five-Step Circular Process Diagram Template for PowerPoint & Google Slides
Circular
Five-Stage Circular Flow Diagram Template for PowerPoint & Google Slides
Circular
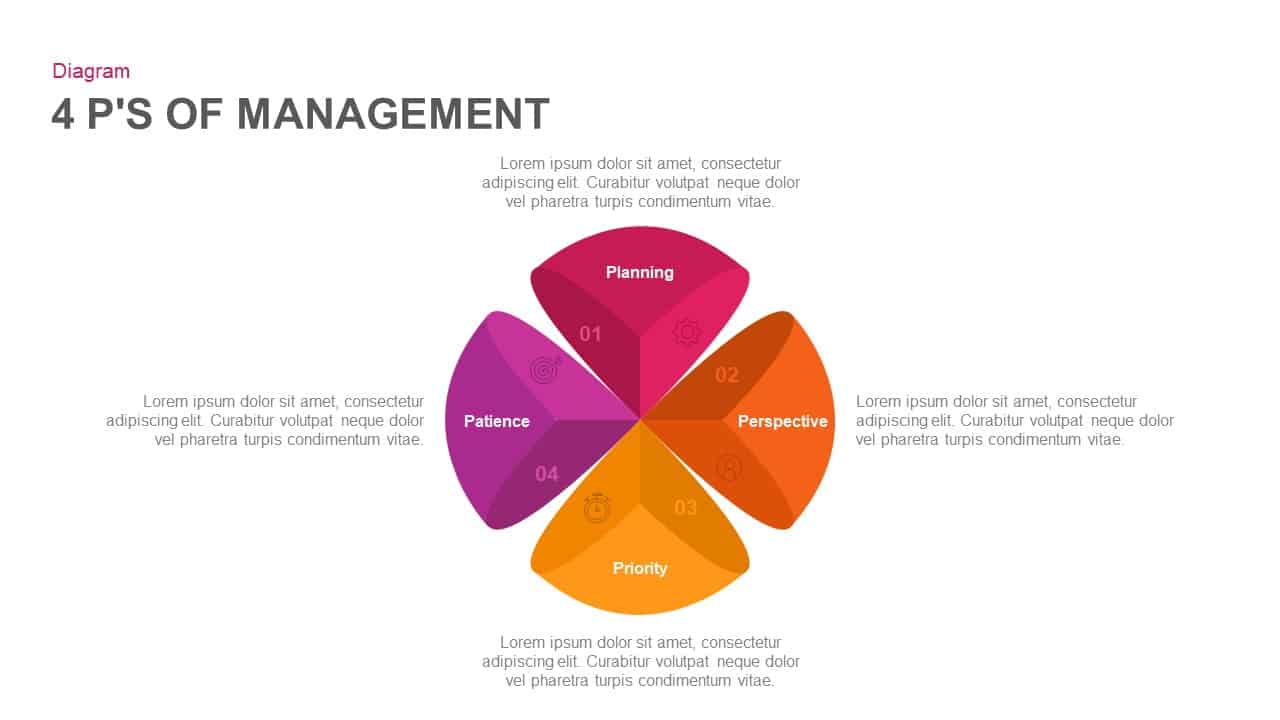
4 Ps of Management Circular Diagram Template for PowerPoint & Google Slides
Circular
Six-Stage Clockwise Circular Diagram Template for PowerPoint & Google Slides
Circular
4 Factors Circular Diagram Infographic Template for PowerPoint & Google Slides
Circular
8 Step Circular Process Flow Diagram Template for PowerPoint & Google Slides
Process
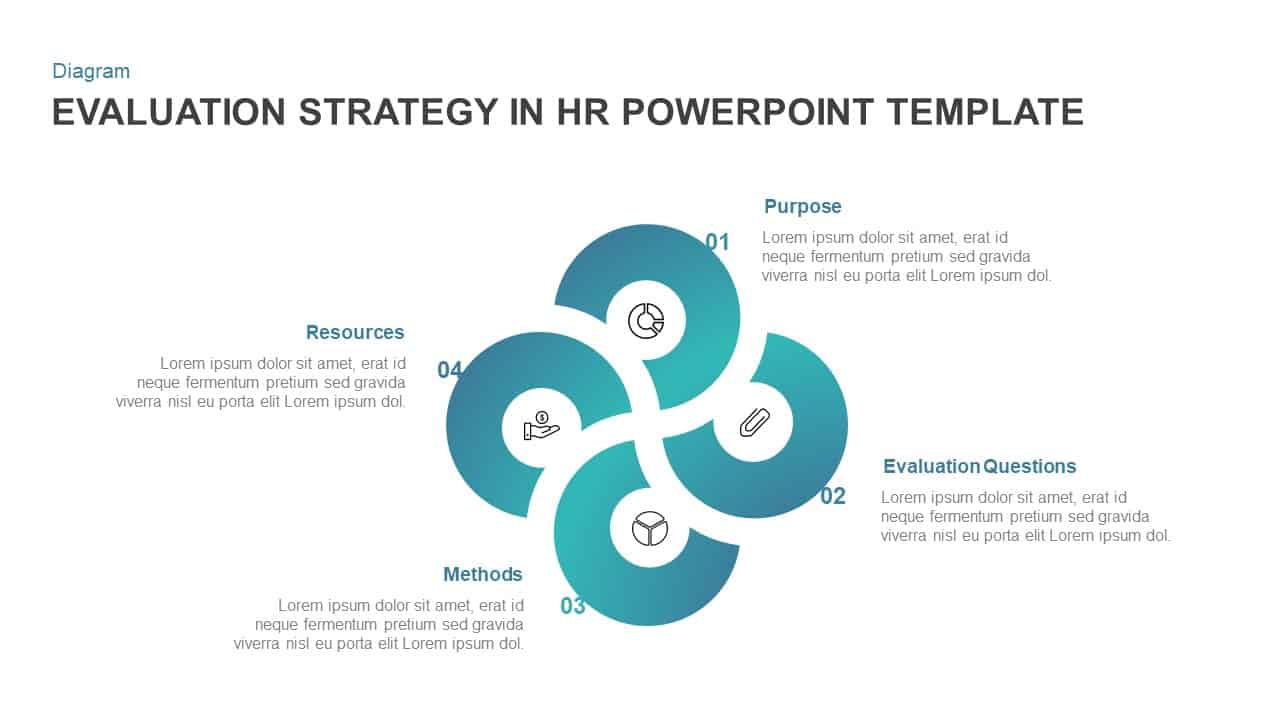
HR Evaluation Strategy Circular Diagram Template for PowerPoint & Google Slides
Circular
Value Chain Circular Process Diagram Template for PowerPoint & Google Slides
Business Models
Six-Stage Circular Flow Diagram Template for PowerPoint & Google Slides
Circular
8-Stage Chevron Circular Diagram Template for PowerPoint & Google Slides
Process
Colorful Circular Puzzle Diagram Template for PowerPoint & Google Slides
Circular
Eight Step Circular Diagram Template for PowerPoint & Google Slides
Circular
6-Part Circular Gear Infographic Diagram Template for PowerPoint & Google Slides
Process

Agile Lifecycle Circular Diagram Template for PowerPoint & Google Slides
Circular
2-8 Step Circular Diagram Template for PowerPoint & Google Slides
Infographics
Circular CRM Process Infographic Diagram Template for PowerPoint & Google Slides
Circular
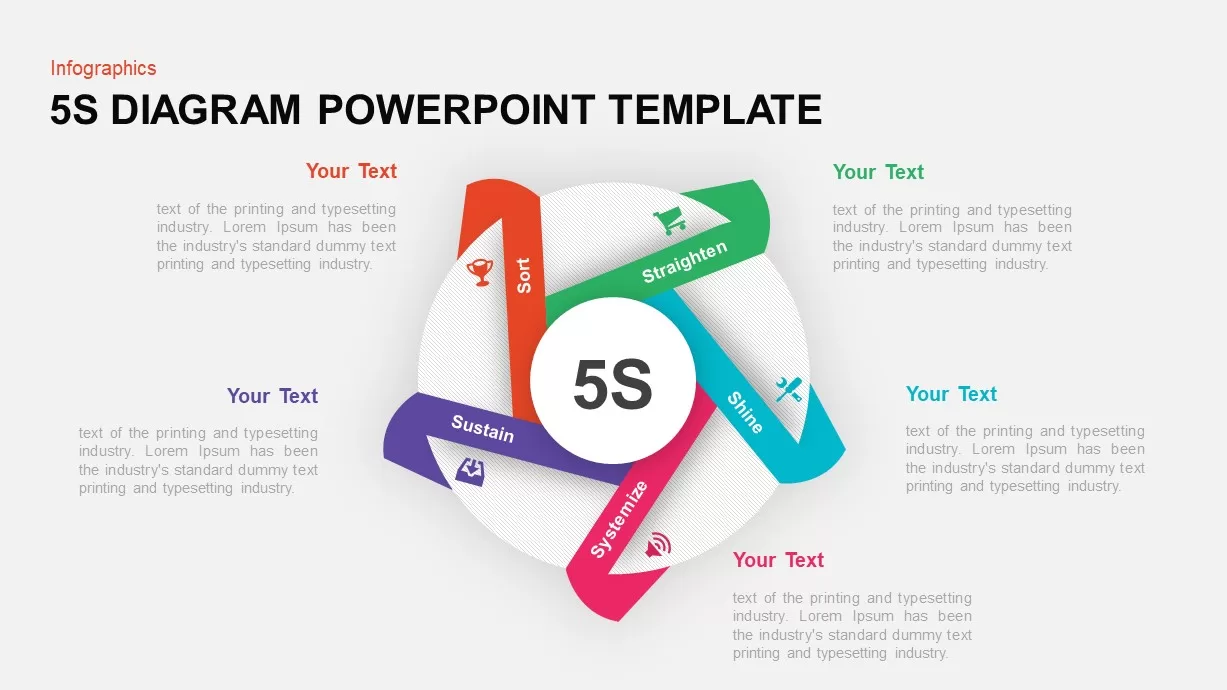
5S Lean Methodology Circular Diagram Template for PowerPoint & Google Slides
Process
4MAT Learning Cycle Circular Diagram Template for PowerPoint & Google Slides
Circular
4-Step Circular PDCA Cycle Diagram Template for PowerPoint & Google Slides
Process
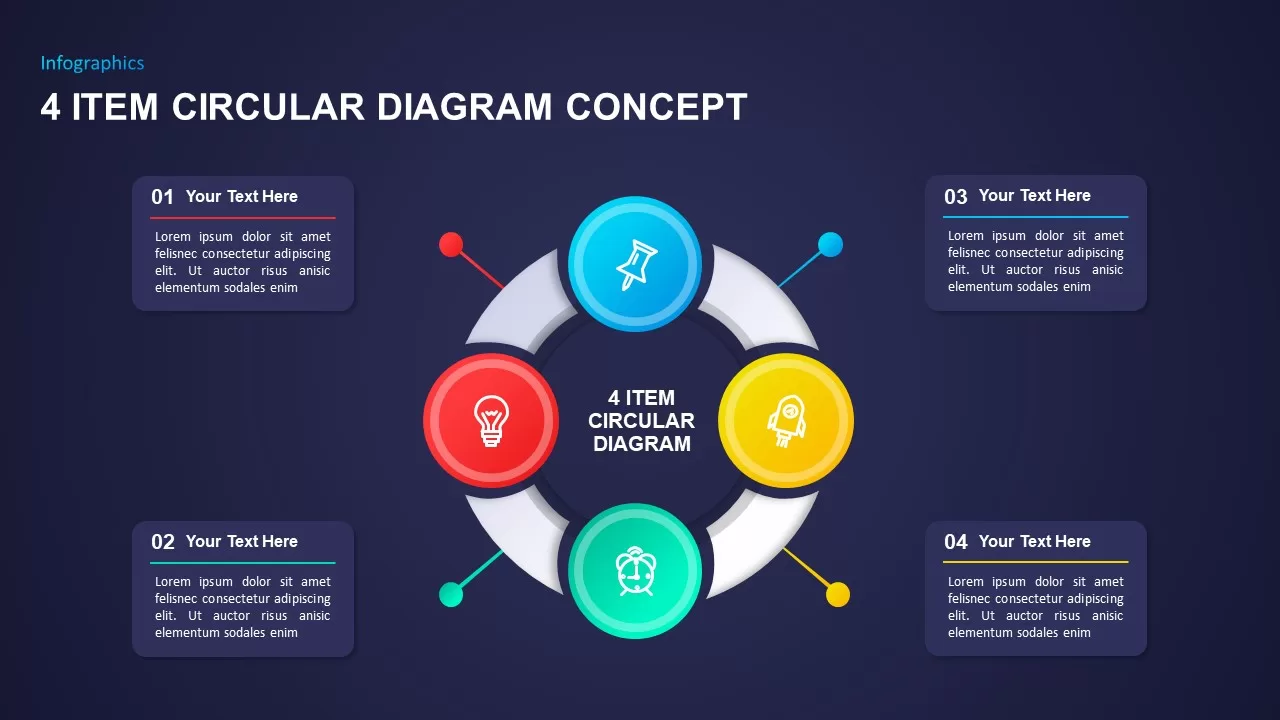
Four-Item Circular Diagram Concept Template for PowerPoint & Google Slides
Circular
8-Step Circular Diagram Infographics Template for PowerPoint & Google Slides
Circular
Circular 3D Cube Six-Segment Diagram Template for PowerPoint & Google Slides
Infographics
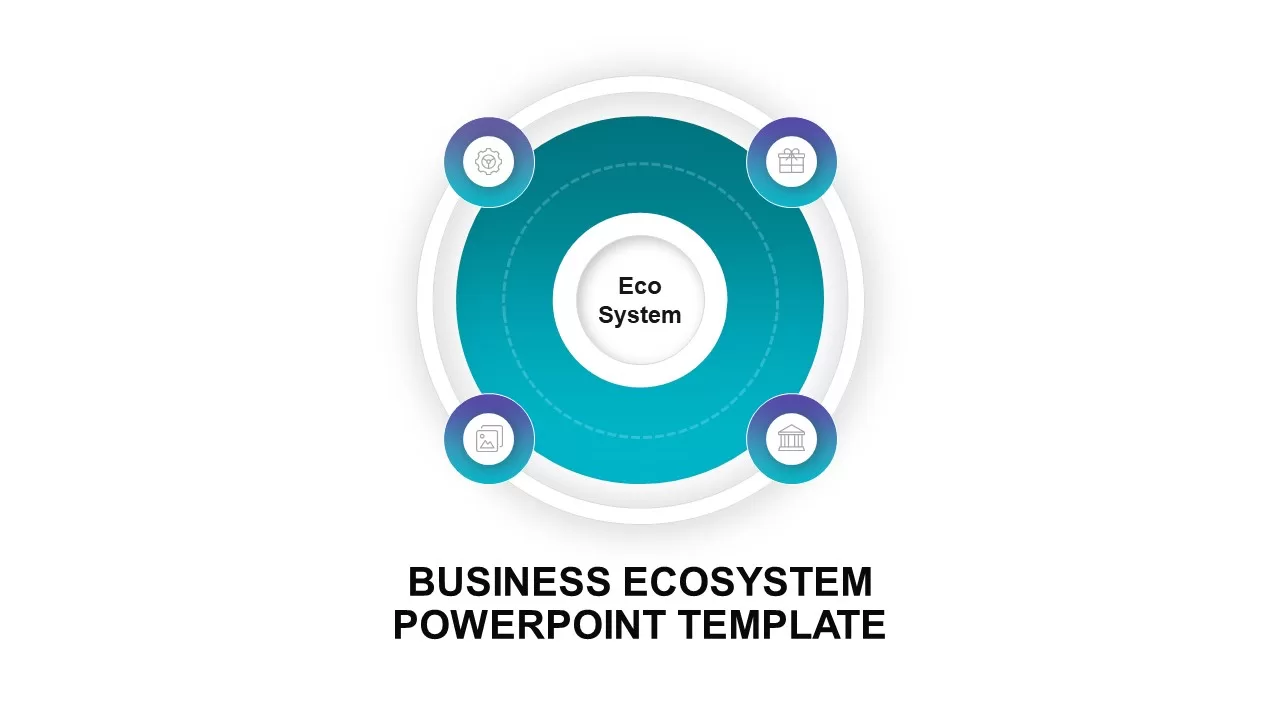
Circular Business Ecosystem Diagram Template for PowerPoint & Google Slides
Business Strategy
Free Circular Multi-Step Flow Chart Diagram Template for PowerPoint & Google Slides
Flow Charts
Free
Concentric Circular Arrow Cycle Diagram Template for PowerPoint & Google Slides
Process
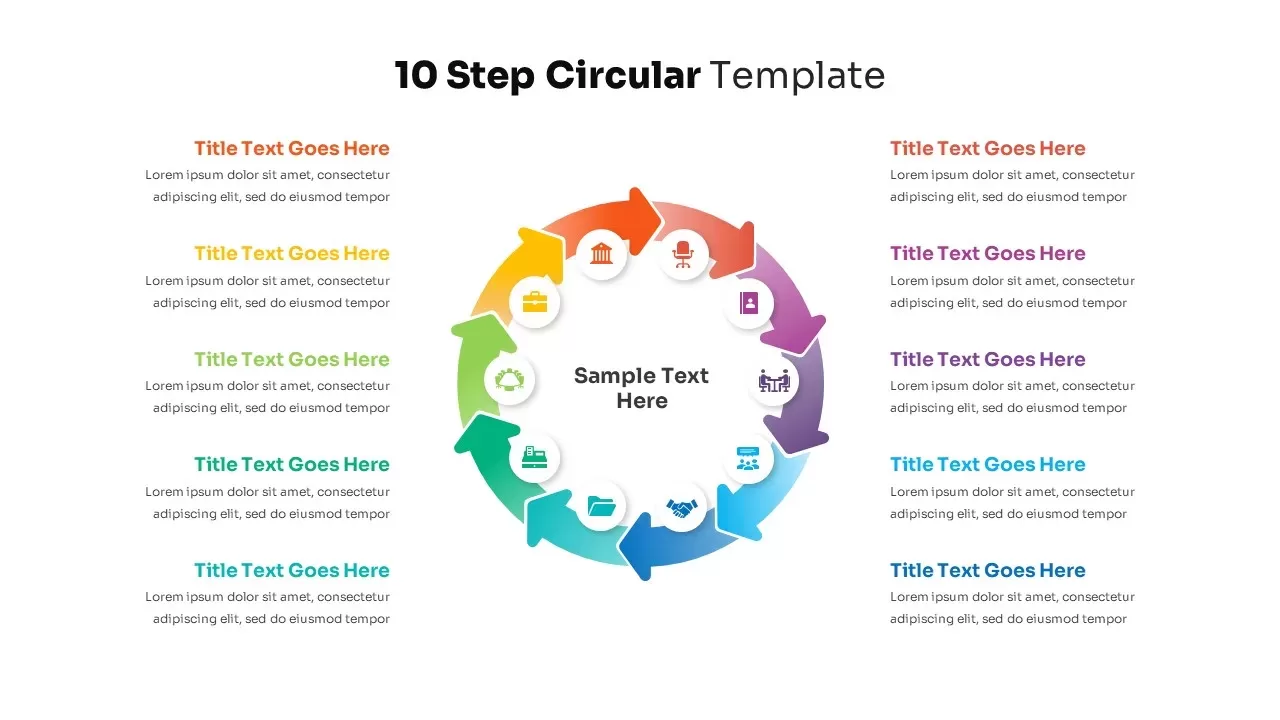
10-Step Circular Process Diagram Template for PowerPoint & Google Slides
Process
10 Step Circular Process Diagram Template for PowerPoint & Google Slides
Circular
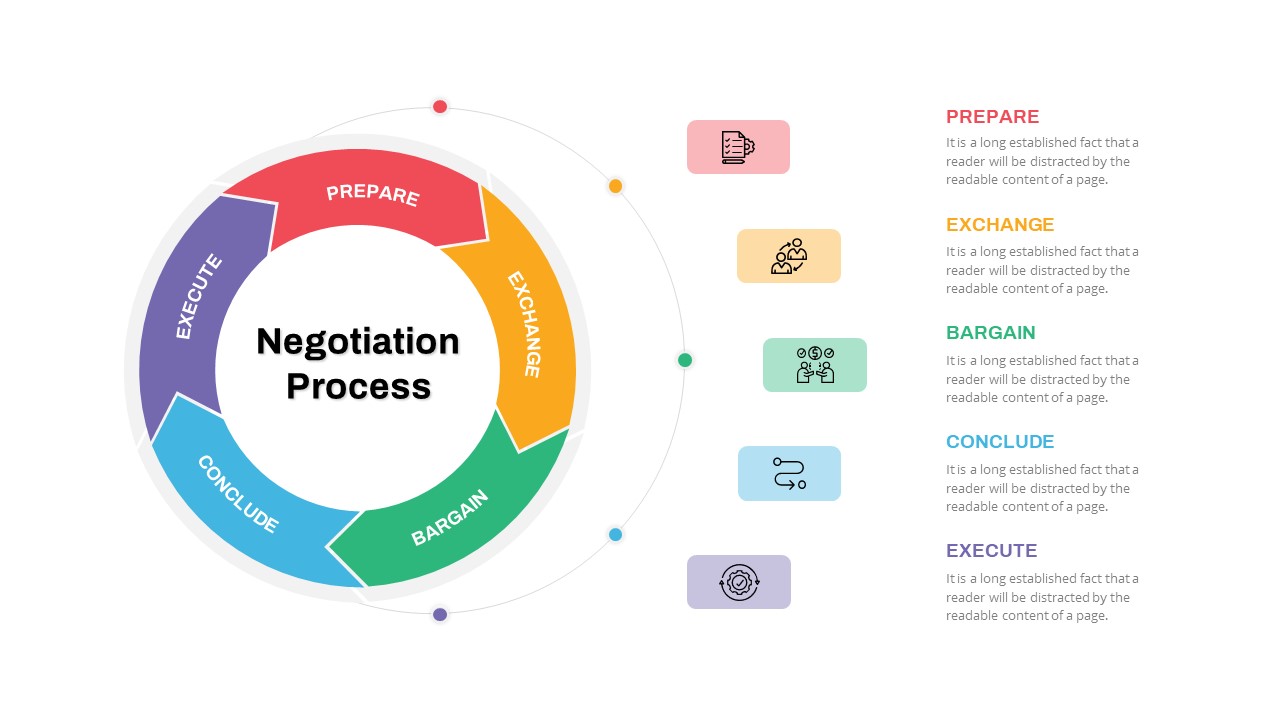
Negotiation Process Circular Diagram Template for PowerPoint & Google Slides
Circular
Release Management Cycle Circular Diagram Template for PowerPoint & Google Slides
Software Development
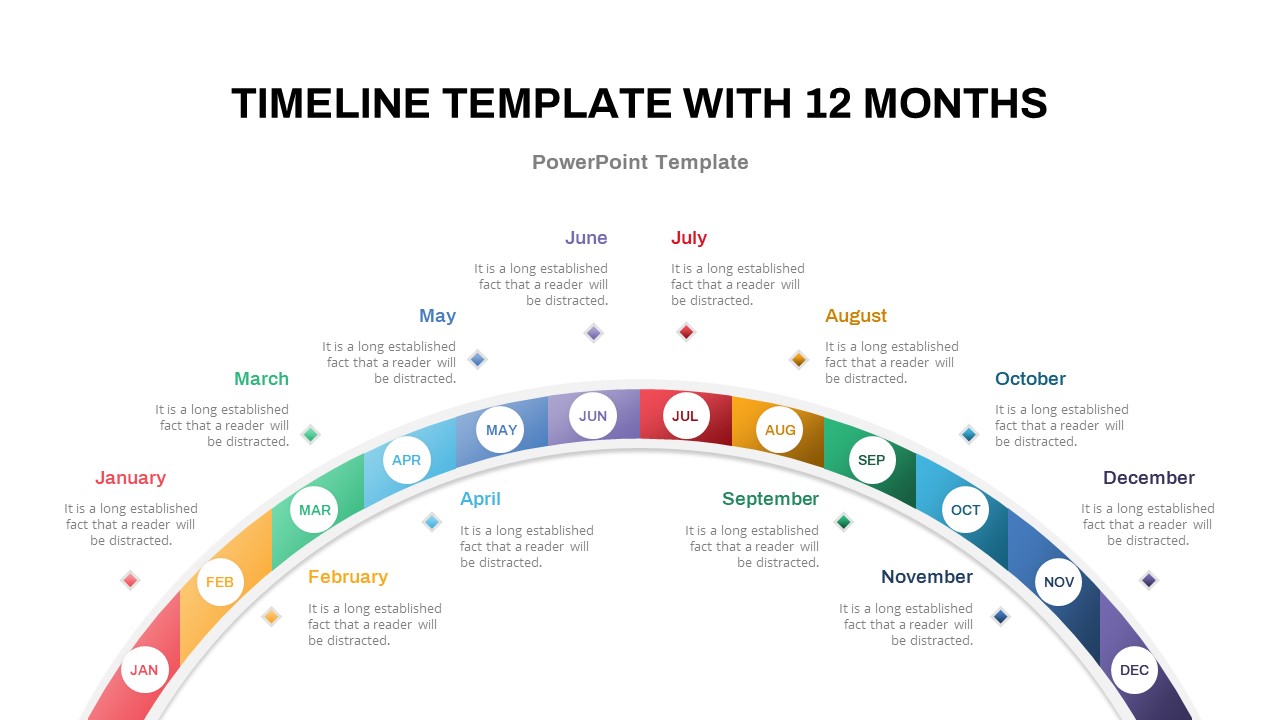
12-Month Semi-Circular Timeline Diagram Template for PowerPoint & Google Slides
Timeline
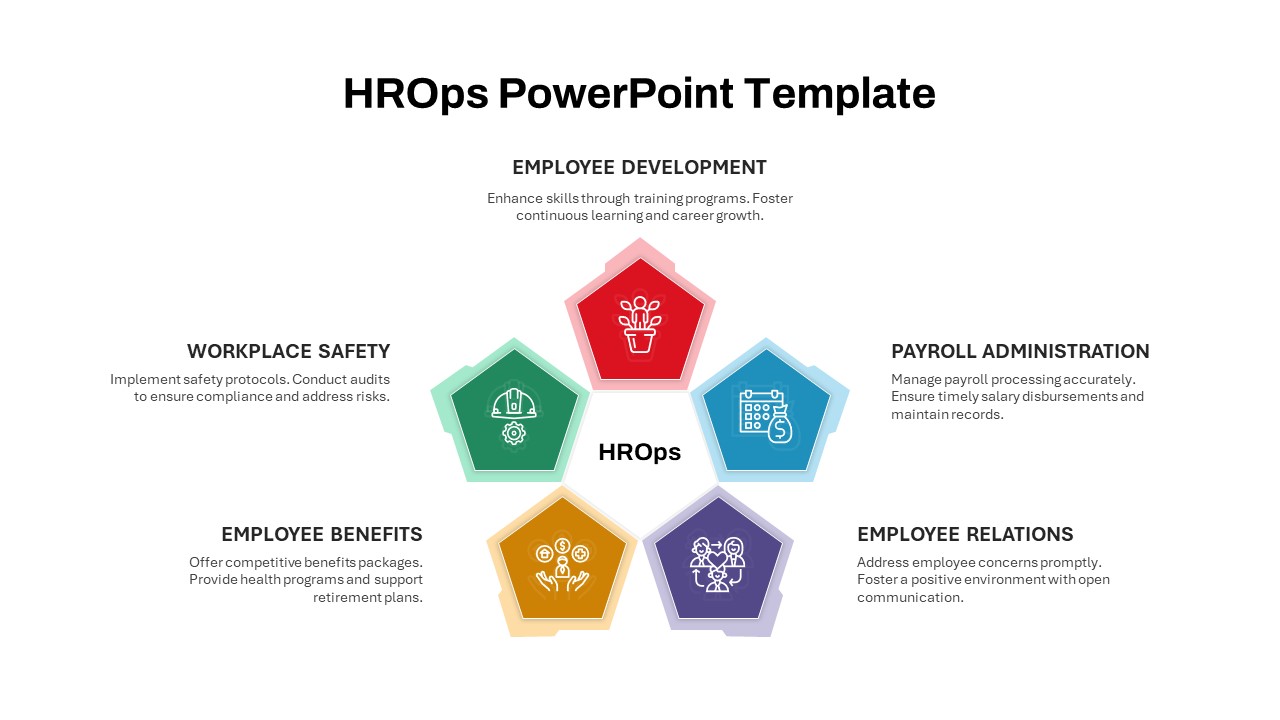
HROps Hub and Spoke Circular Diagram Template for PowerPoint & Google Slides
Circular
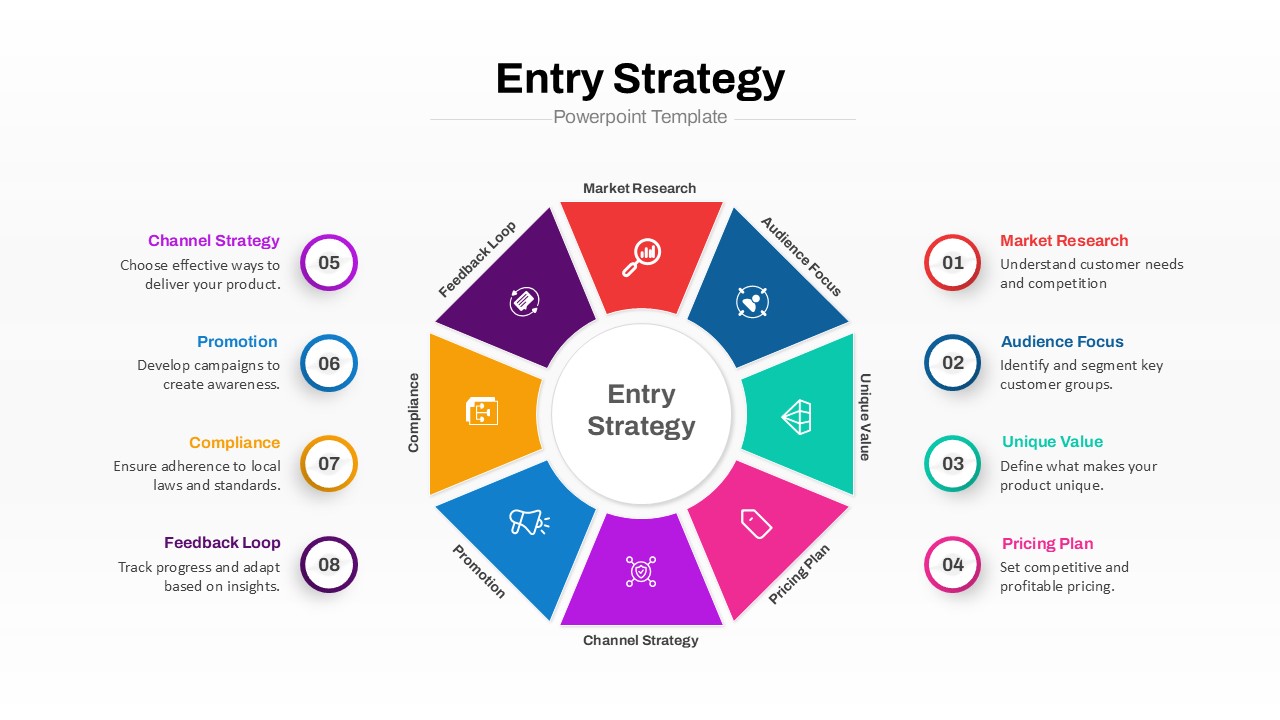
Entry Strategy Circular Diagram Template for PowerPoint & Google Slides
Circular
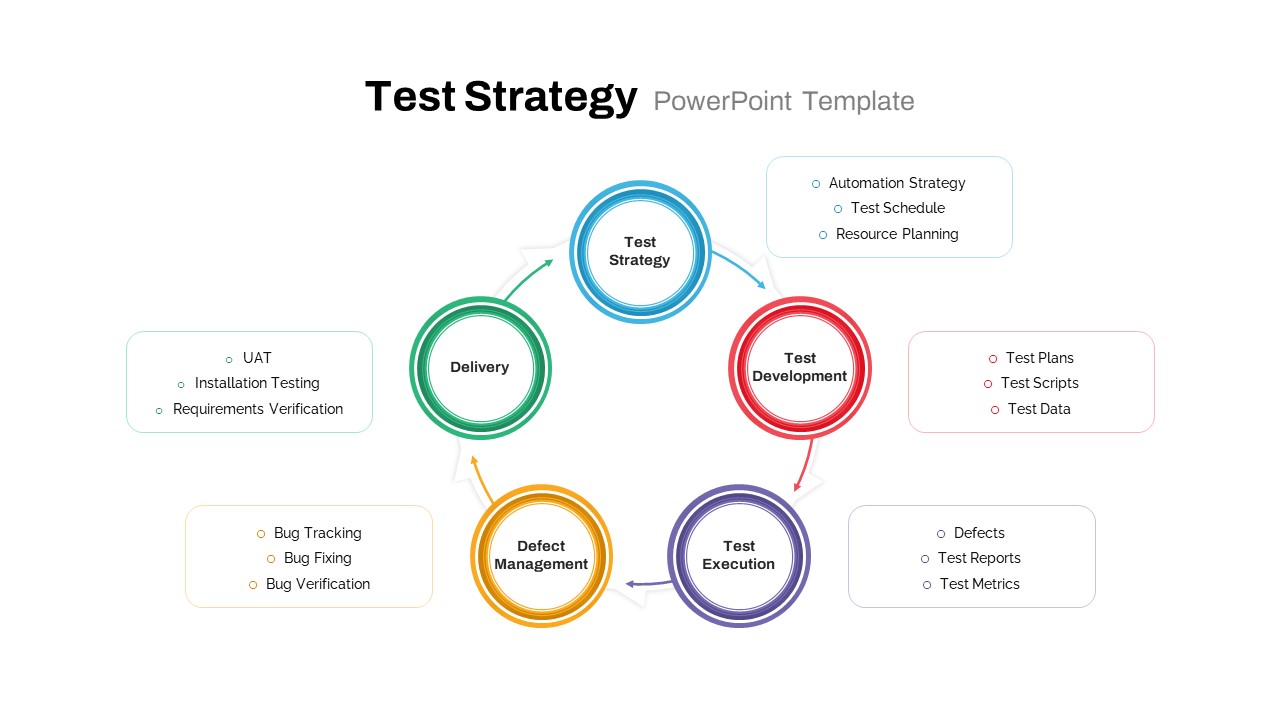
Test Strategy Circular Diagram Template for PowerPoint & Google Slides
Circular
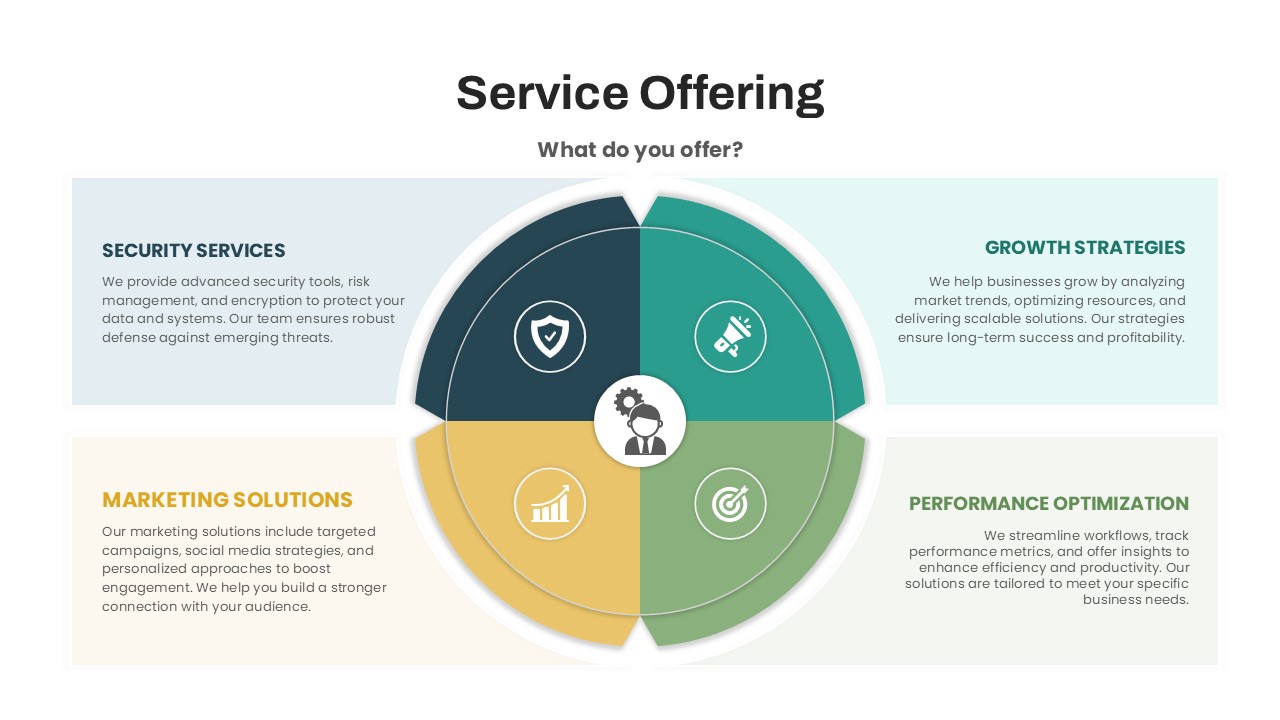
Circular Service Offering Diagram Template for PowerPoint & Google Slides
Circular
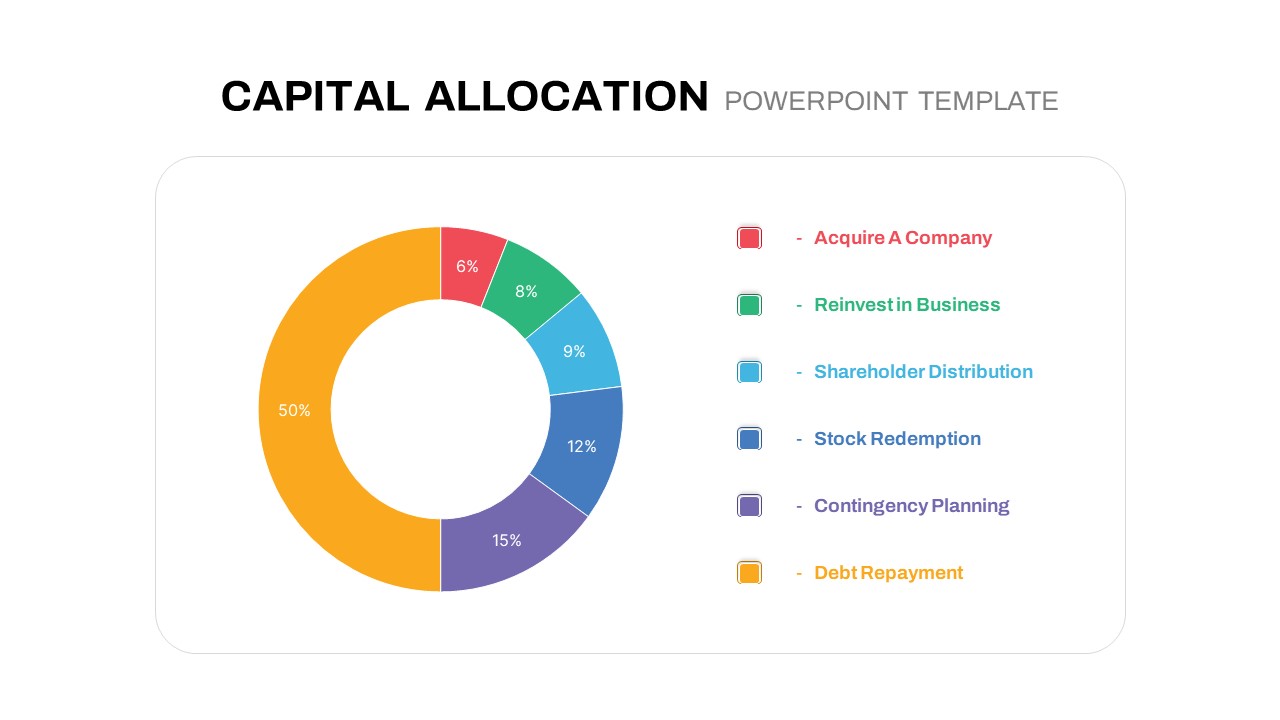
Circular Capital Allocation Diagram Template for PowerPoint & Google Slides
Business Models
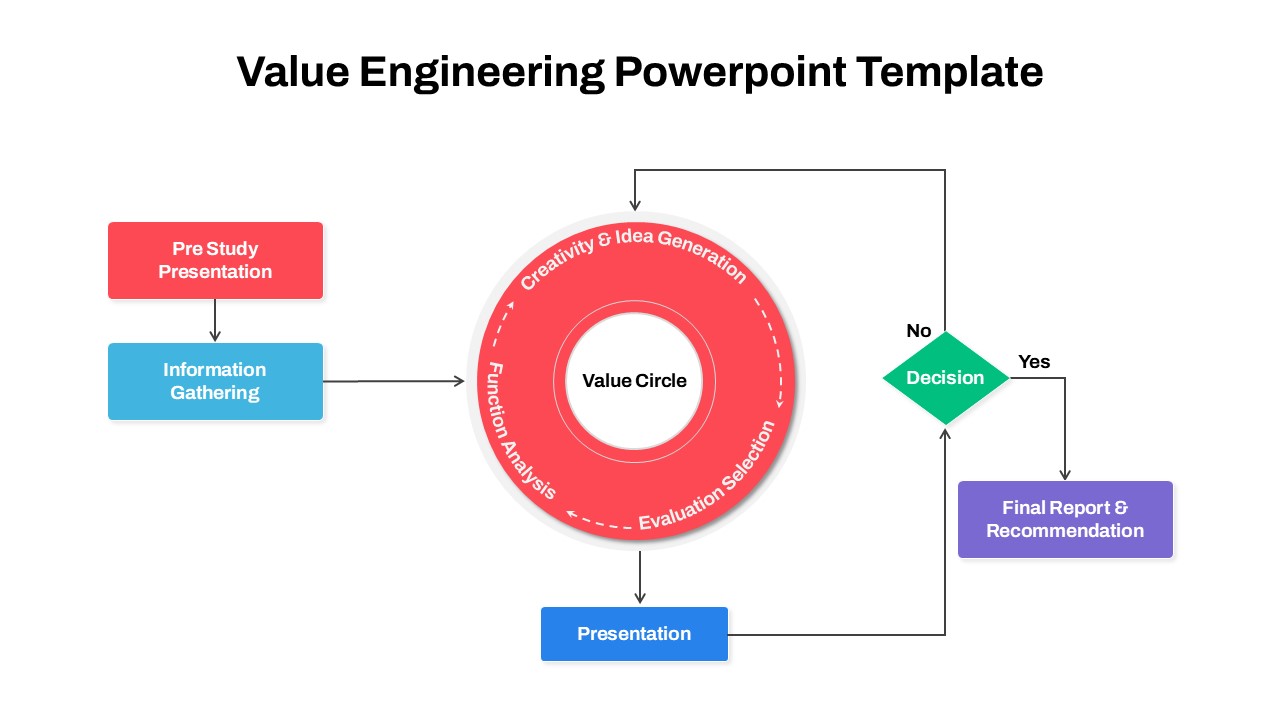
Circular Value Engineering Diagram Template for PowerPoint & Google Slides
Process
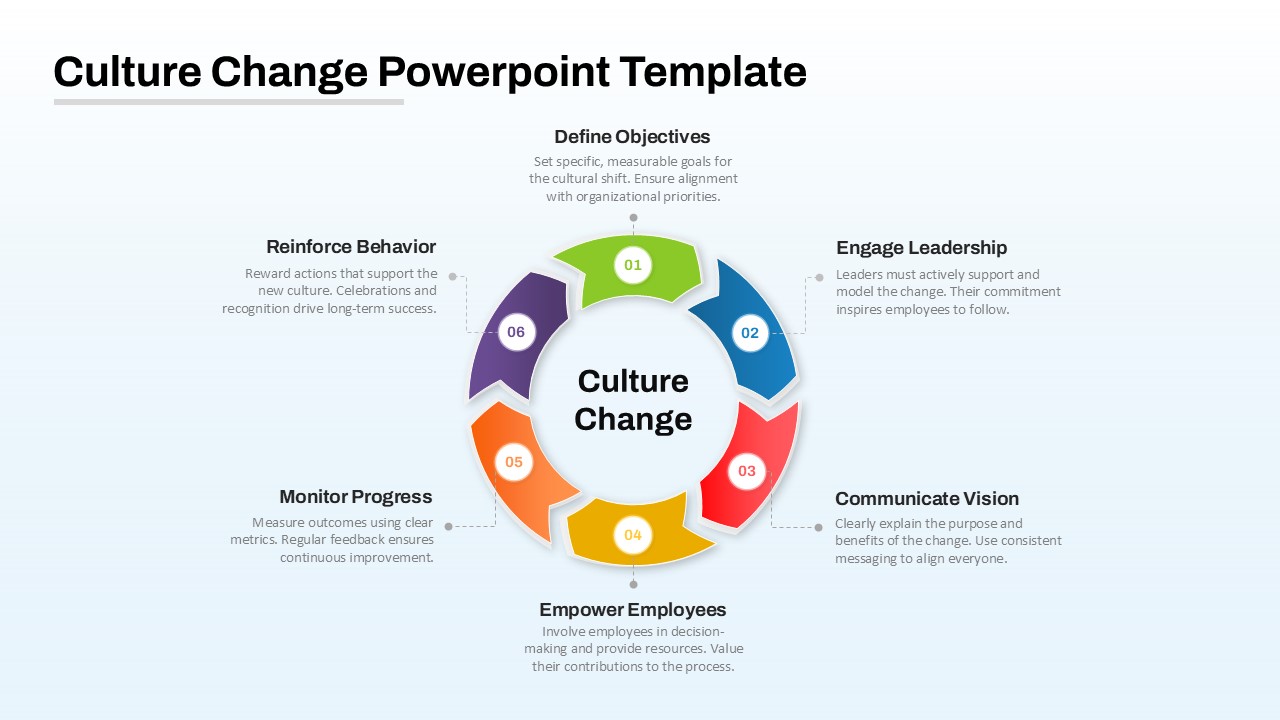
Culture Change Circular Process Diagram Template for PowerPoint & Google Slides
Process
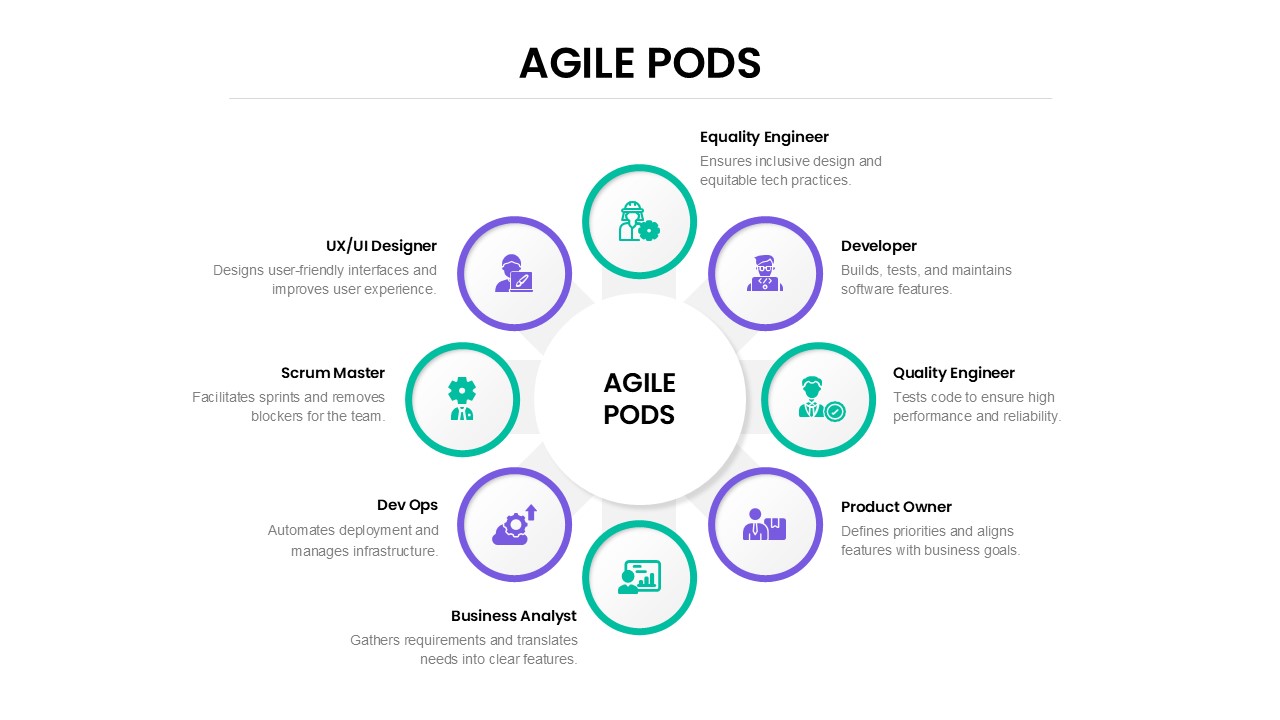
Agile Pods Team Roles Circular Diagram Template for PowerPoint & Google Slides
Circular
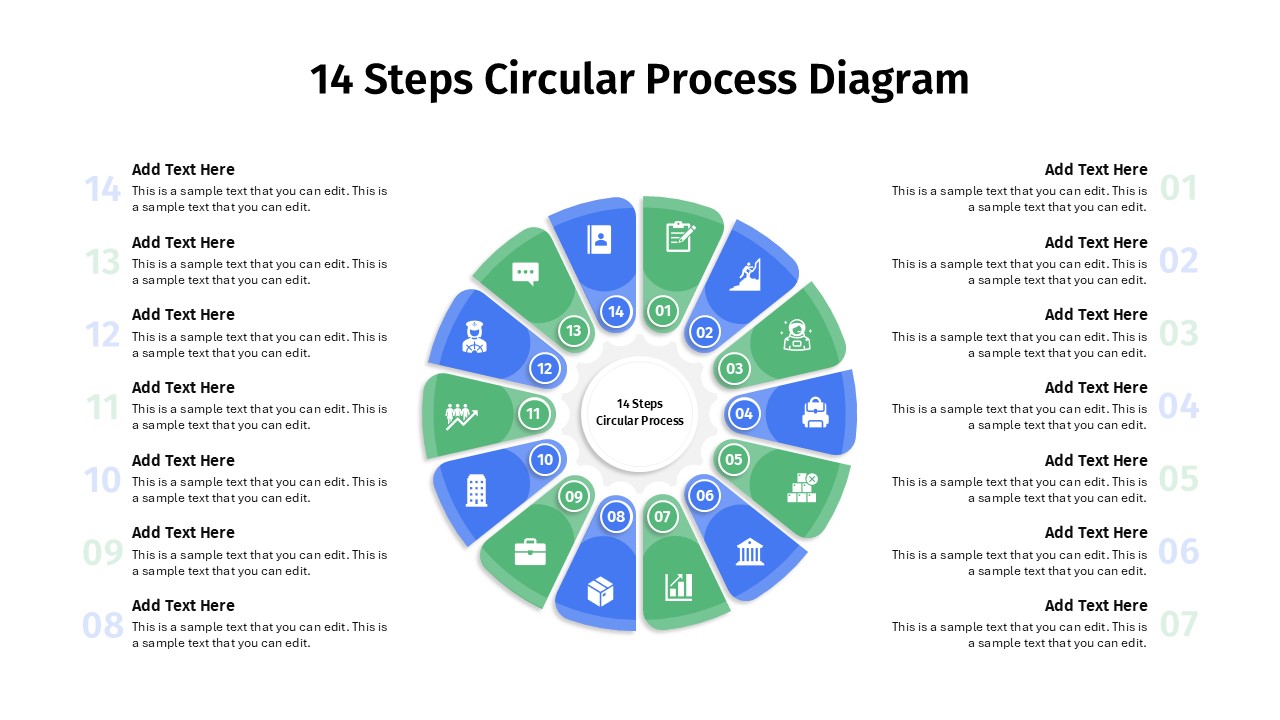
14 Steps Circular Process Diagram Template for PowerPoint & Google Slides
Circular

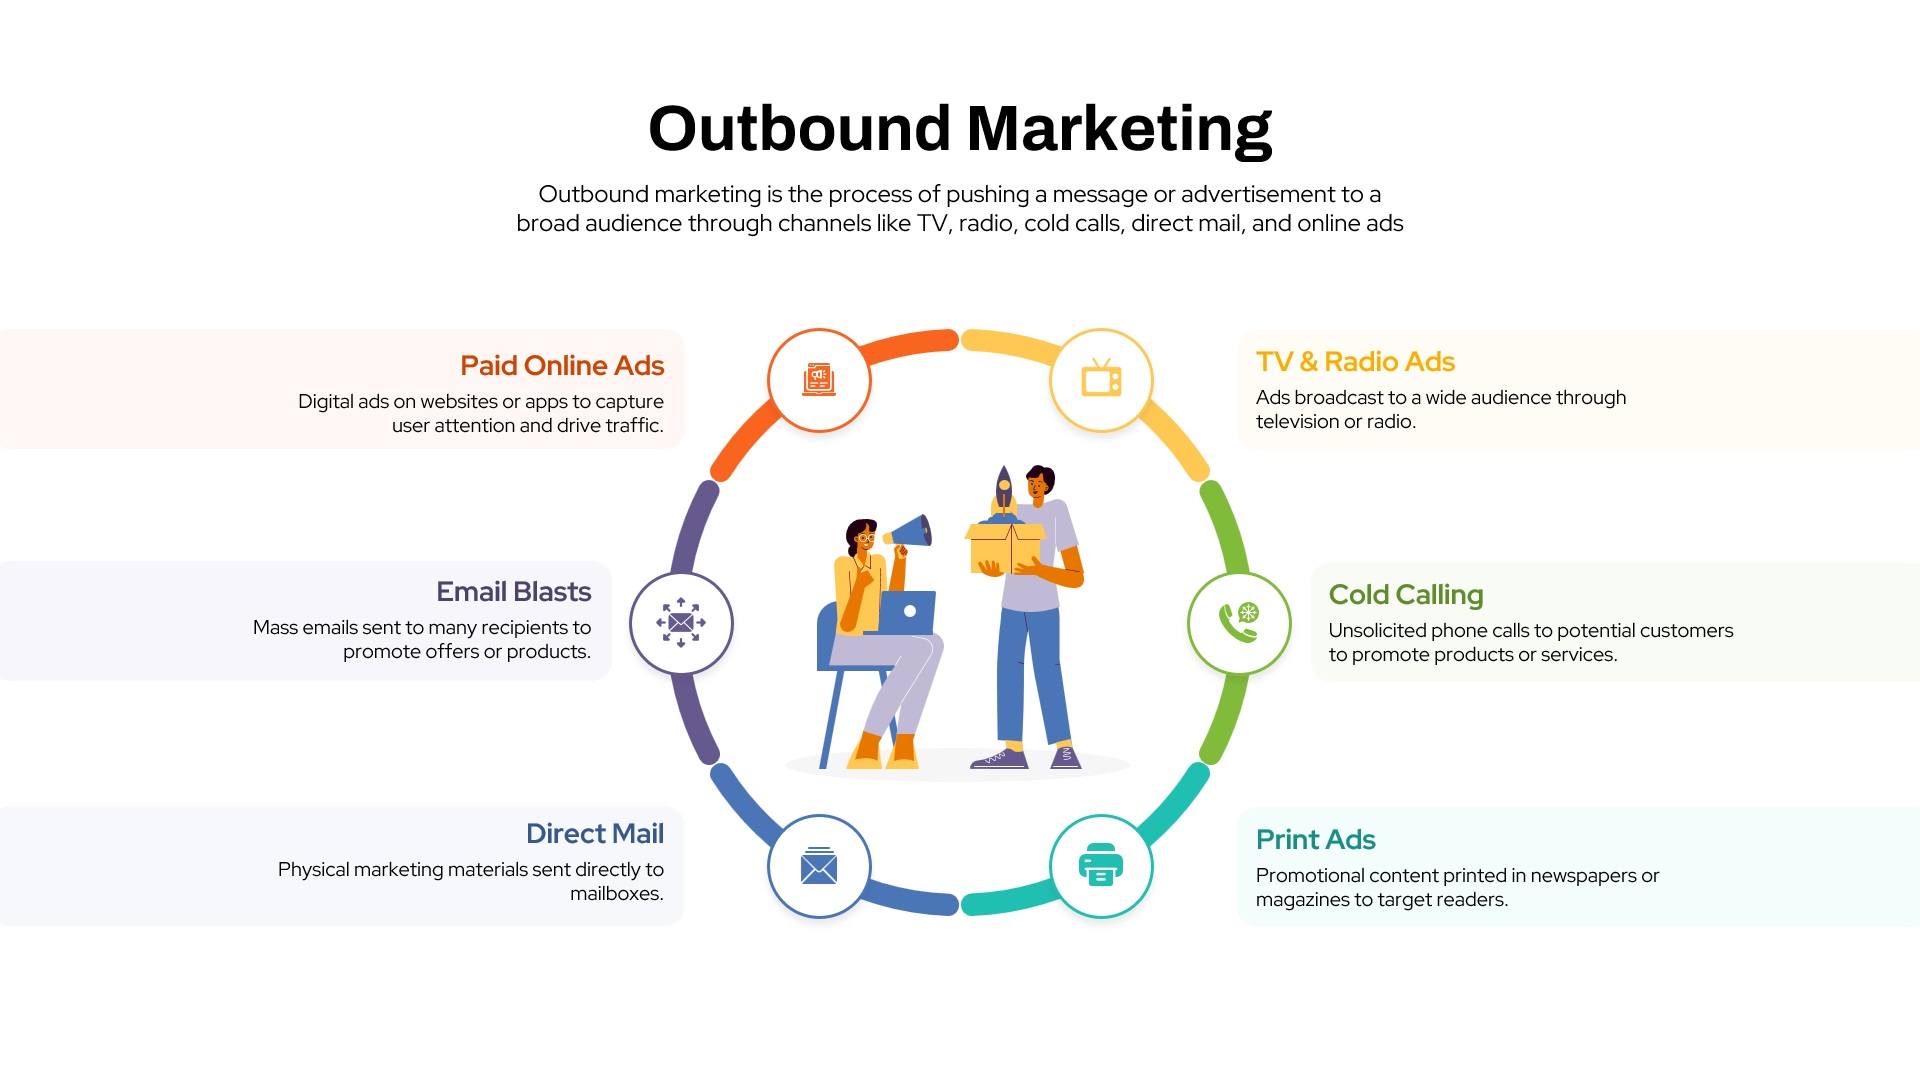
Outbound Marketing Circular Diagram Template for PowerPoint & Google Slides
Advertising
Workload Distribution Circular Diagram Template for PowerPoint & Google Slides
Circular