Business Data Table Template for PowerPoint & Google Slides

Description
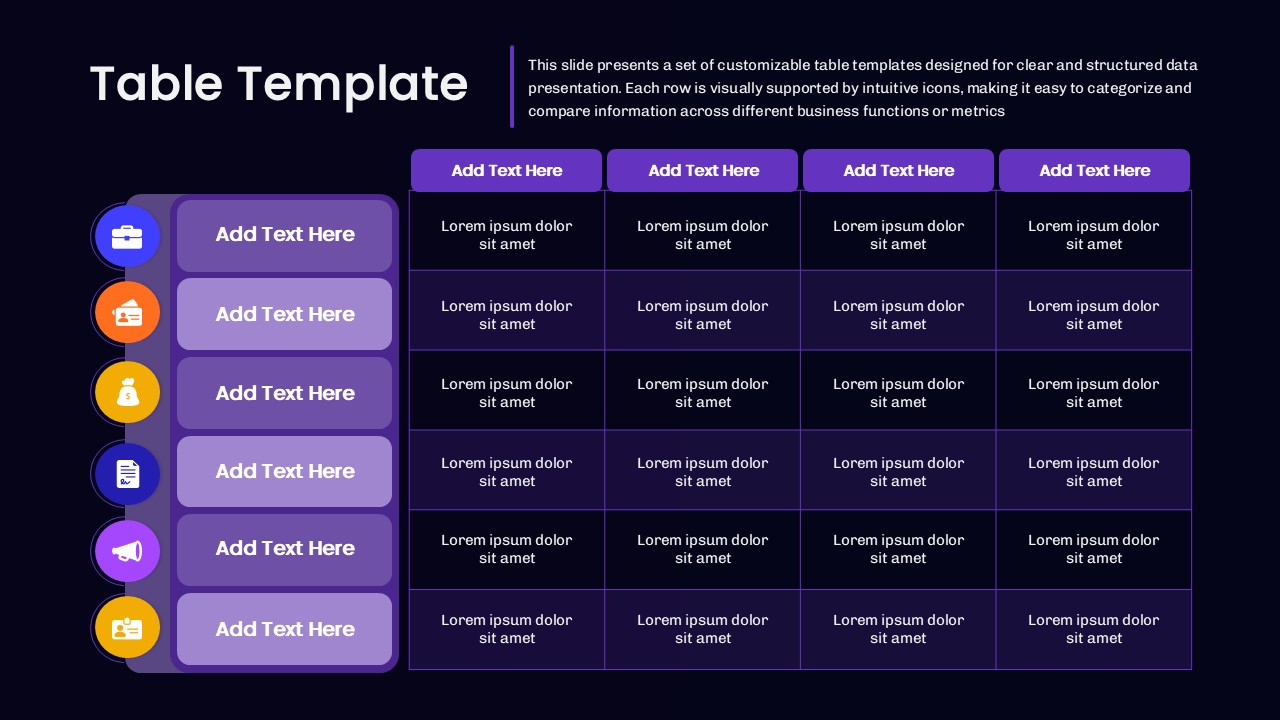
Optimize your data presentations with this intuitive icon-based table slide designed to deliver structured insights at a glance. The left vertical panel highlights up to six customizable icons—and accompanying text placeholders—to categorize rows by department, KPI, or project phase. Six alternating rows and four column headers allow clear organization of metrics, while light purple shading distinguishes every other row for enhanced readability. The bold purple header bars feature descriptive labels ready for titles, and the clean, flat cell borders maintain visual focus on content.
Fully built on master layouts for PowerPoint and Google Slides, this template enables lightning-fast edits without compromising formatting. Simply swap icons with drag-and-drop placeholders, adjust column or row counts, tweak color swatches, or change typography settings to match your brand palette. The slide preserves consistent spacing, alignment, and hierarchy across platforms, eliminating version-control headaches and ensuring flawless rendering on desktop, web, and mobile viewers.
Whether you’re comparing regional sales data, mapping project timelines, presenting budget forecasts, or tracking operational performance, this versatile framework adapts seamlessly to any scenario. Leverage preset shapes and icon libraries for quick visual cues, or integrate custom graphics to elevate contextual storytelling. The slide’s structured grid facilitates data-driven discussions in boardrooms, executive briefings, client pitches, or team workshops, helping teams identify trends, prioritize actions, and achieve alignment with minimal setup effort.
Designed with accessibility in mind, its high-contrast color scheme and clear typography ensure readability across projected screens and remote meetings, making it an essential asset for modern data storytelling and strategic analysis.
Who is it for
Financial analysts, project managers, marketing executives, operations directors, consultants, product owners, and team leads will find this table slide invaluable for presenting comparative metrics, performance reviews, and strategic roadmaps.
Other Uses
Repurpose this layout for budget planning, vendor comparisons, training matrices, resource allocation charts, event schedules, stakeholder mappings, or decision-log tracking to streamline any data-driven presentation.
Login to download this file

Item ID
SB05492Designed By
Naseeba
Related Templates

Colorful Business Data Comparison Table Template for PowerPoint & Google Slides
Table
Six Column Data Table Template for PowerPoint & Google Slides
Table

3D Column Chart with Data Table for PowerPoint & Google Slides
Bar/Column
4 Business Data Infographics Diagram for PowerPoint & Google Slides
Process
Four-Stage Business Planning Table Template for PowerPoint & Google Slides
Business Plan
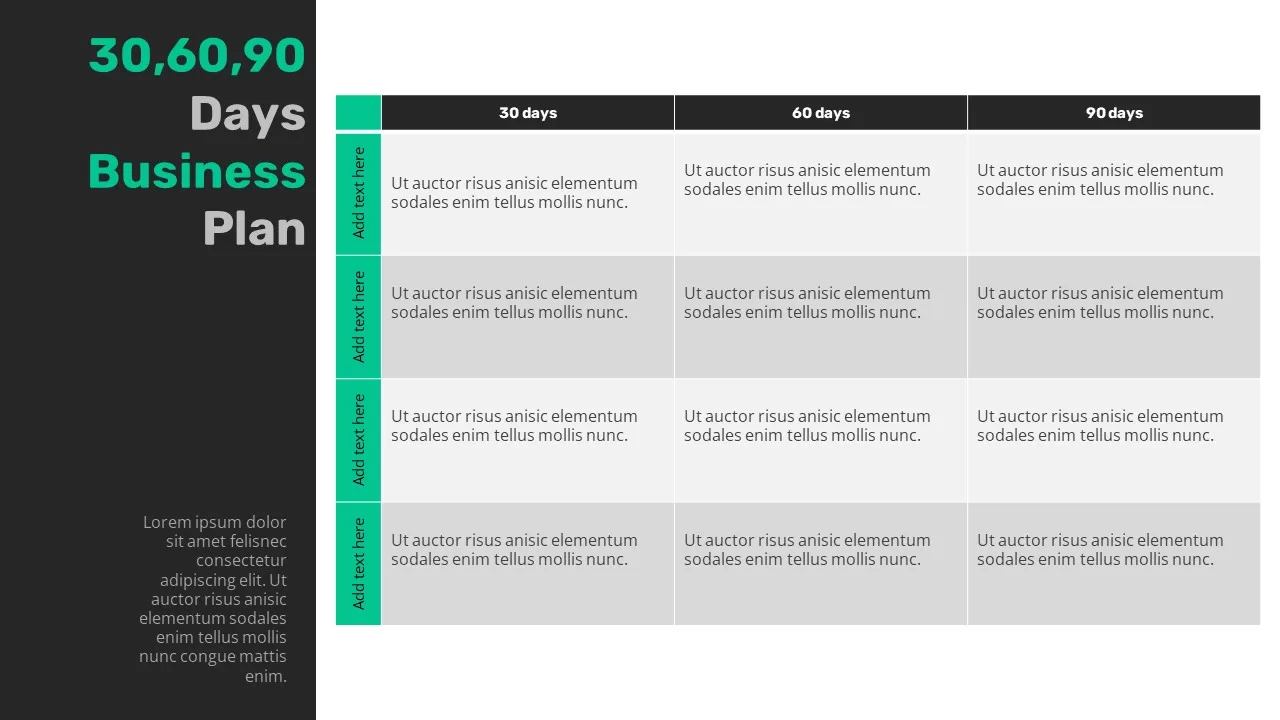
30-60-90 Business Plan Table Template for PowerPoint & Google Slides
Timeline
Data Science PowerPoint Presentation Template for PowerPoint & Google Slides
Pitch Deck
Data Center PowerPoint Template for PowerPoint & Google Slides
Information Technology

Creative data chart analytics template for PowerPoint & Google Slides
Charts
Mobile Data Analysis Chart template for PowerPoint & Google Slides
Charts
World Map Data template for PowerPoint & Google Slides
World Maps
Circle Chart Data template for PowerPoint & Google Slides
Pie/Donut
Creative Data Analysis Bar Chart template for PowerPoint & Google Slides
Bar/Column

Smartphone Data User template for PowerPoint & Google Slides
Charts
Interactive US Population Data Map Slide Template for PowerPoint & Google Slides
World Maps
3D Bar Chart Data Infographics Template for PowerPoint & Google Slides
Bar/Column
3D Stacked Infographic Layers Data Template for PowerPoint & Google Slides
Pyramid
Circle Graph Data Visualization Template for PowerPoint & Google Slides
Circular
Pencil Bar Chart Data Analysis Template for PowerPoint & Google Slides
Bar/Column
3D Cone Chart Data Visualization template for PowerPoint & Google Slides
Bar/Column
Creative Lab Beakers Data Infographic template for PowerPoint & Google Slides
Infographics

Dynamic Data Dashboard Infographic Template for PowerPoint & Google Slides
Bar/Column
Data Analytics Dashboard Design template for PowerPoint & Google Slides
Bar/Column
Gear Pie Diagram Data Visualization Template for PowerPoint & Google Slides
Pie/Donut
Data-Driven Marketing Cycle Diagram Template for PowerPoint & Google Slides
Customer Journey
Tornado Chart Data Comparison Slide Template for PowerPoint & Google Slides
Bar/Column
Bottle Data Percentage Infographic Template for PowerPoint & Google Slides
Infographics
Immigration Data Dashboard Template for PowerPoint & Google Slides
Bar/Column
Leaf Infographic Data Visualization Template for PowerPoint & Google Slides
Infographics
Mobile Infographics Data Visualization Template for PowerPoint & Google Slides
Infographics
Data Management and Analytics Diagram Template for PowerPoint & Google Slides
Circular
Data Migration Life Cycle Curved Diagram Template for PowerPoint & Google Slides
Process
Medical Infographics Data Visualization Template for PowerPoint & Google Slides
Health
DIKW Data to Wisdom Pyramid Model Template for PowerPoint & Google Slides
Pyramid
Data-driven GDP Growth Infographic Pack Template for PowerPoint & Google Slides
Infographics
KPI Dashboard Data Visualization Template for PowerPoint & Google Slides
Bar/Column
KPI Dashboard Data Overview Slide Template for PowerPoint & Google Slides
Bar/Column
North America Data Map Callouts Template for PowerPoint & Google Slides
World Maps
Professional Heatmap Data Visualization Template for PowerPoint & Google Slides
Infographics
Donut Chart Data Breakdown template for PowerPoint & Google Slides
Pie/Donut

Modern Big Data Infographic Deck Template for PowerPoint & Google Slides
Decks
Waffle Chart Data Visualization Template for PowerPoint & Google Slides
Comparison Chart
Layered Data Governance Maturity Model Template for PowerPoint & Google Slides
Process
Free Stacked Column Chart Data Visualization Template for PowerPoint & Google Slides
Bar/Column
Free
Simple Bar Chart Data Visualization Template for PowerPoint & Google Slides
Bar/Column
XY Bubble Chart Data Visualization Template for PowerPoint & Google Slides
Comparison Chart
Simple Area Chart Data Trends Analysis Template for PowerPoint & Google Slides
Comparison Chart
Data Over Time Line Chart template for PowerPoint & Google Slides
Charts
Waterfall Chart Data Visualization Template for PowerPoint & Google Slides
Comparison Chart
Multipurpose Spline Chart Data Trend Template for PowerPoint & Google Slides
Bar/Column
Editable Africa Map Infographic Data Template for PowerPoint & Google Slides
World Maps
UK Counties Map Data Visualization Template for PowerPoint & Google Slides
World Maps
Advanced Data Flow Diagram Pack Template for PowerPoint & Google Slides
Flow Charts
Interactive Jump Line Data Chart Template for PowerPoint & Google Slides
Comparison Chart
Segmented Scatter Chart Data Visualization Template for PowerPoint & Google Slides
Business Strategy
Free Big Data Network Visualization Template for PowerPoint & Google Slides
Circular
Free
Syria Regional Data Map Infographic Template for PowerPoint & Google Slides
World Maps
Data Analysis Bar Chart with Insights Template for PowerPoint & Google Slides
Bar/Column
Free
Data Lake Hub-and-Spoke Diagram Template for PowerPoint & Google Slides
Cloud Computing
ETL Data Pipeline Workflow Diagram Template for PowerPoint & Google Slides
Process
Data Privacy template for PowerPoint & Google Slides
Information Technology
Data Protection Strategies template for PowerPoint & Google Slides
Information Technology
Comprehensive Data & AI Capability Model Template for PowerPoint & Google Slides
AI
Data Flywheel Strategy template for PowerPoint & Google Slides
Business
Data Privacy and Compliance in ML template for PowerPoint & Google Slides
Technology
Data-Driven AI in Insurance Infographic Template for PowerPoint & Google Slides
Circular
AI and Data Ecosystem Map Template for PowerPoint & Google Slides
AI
Data Studio Insights template for PowerPoint & Google Slides
Business Report
Data Protection & Encryption in the Cloud Overview template for PowerPoint & Google Slides
Cloud Computing
Customer Data Platform Workflow Diagram Template for PowerPoint & Google Slides
Information Technology
Data-Driven Marketing Lifecycle Diagram Template for PowerPoint & Google Slides
Process
Data-Driven Decision Making overview template for PowerPoint & Google Slides
Business
First Party Data Overview Template for PowerPoint & Google Slides
Business
Data Governance Roles Pyramid Diagram Template for PowerPoint & Google Slides
Pyramid
Data Gap Analysis Template for PowerPoint & Google Slides
Business
Mobile User Data Analysis Infographic for PowerPoint & Google Slides
Process
Bar Data Chart Slide for PowerPoint & Google Slides
Bar/Column
Weekly Data Chart Slide for PowerPoint & Google Slides
Comparison Chart

Cone Data Chart for PowerPoint & Google Slides
Charts
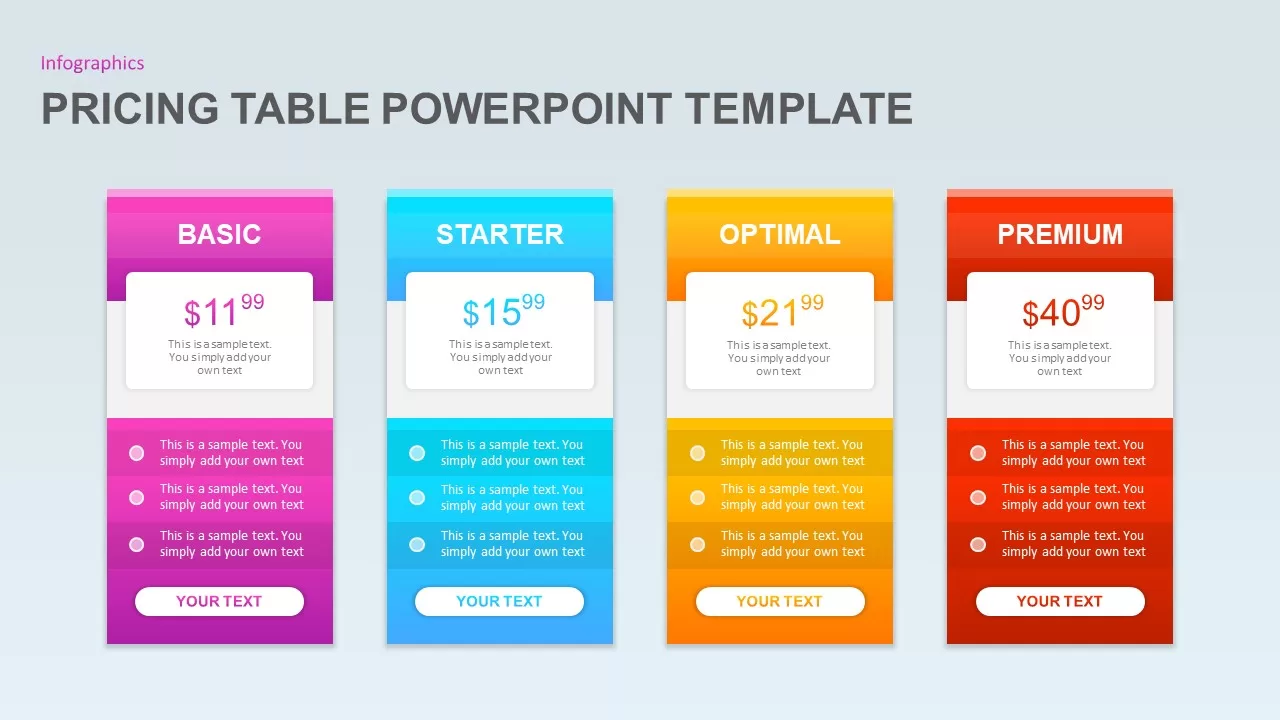
Pricing Table PowerPoint Template for PowerPoint & Google Slides
Infographics
Simple Comparison Table Template for PowerPoint & Google Slides
Comparison
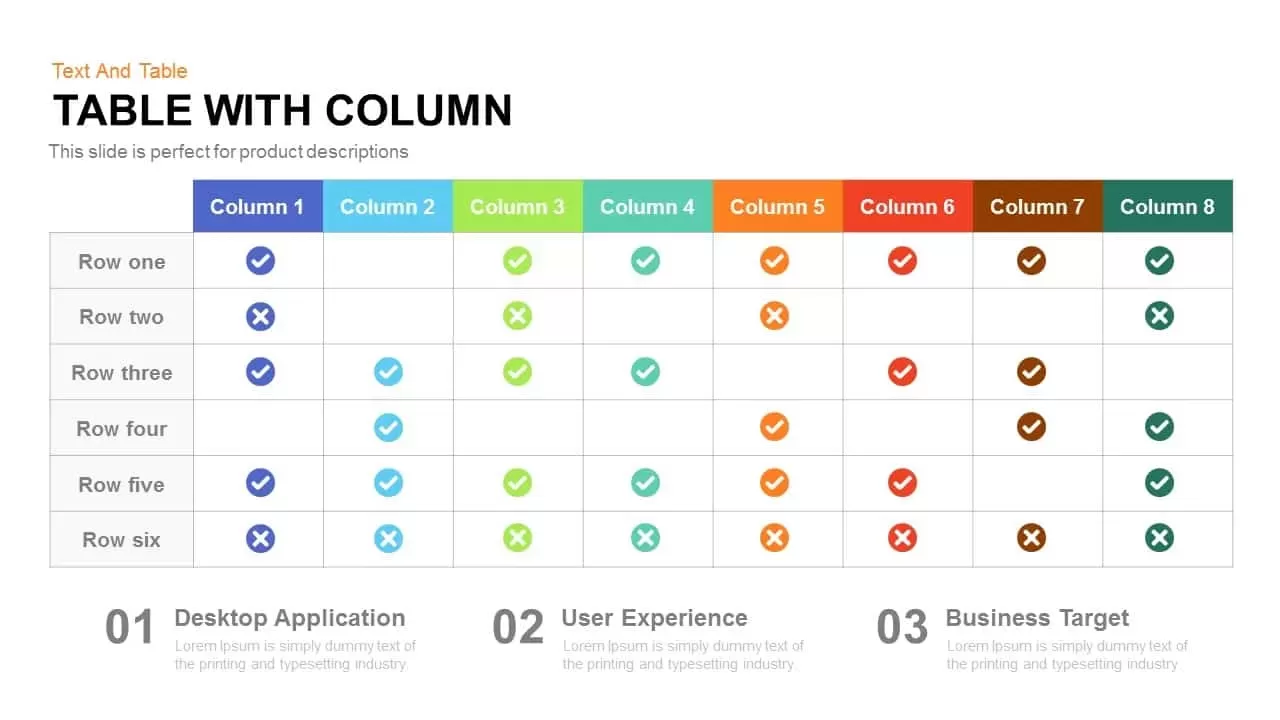
Table with Columns template for PowerPoint & Google Slides
Comparison Chart
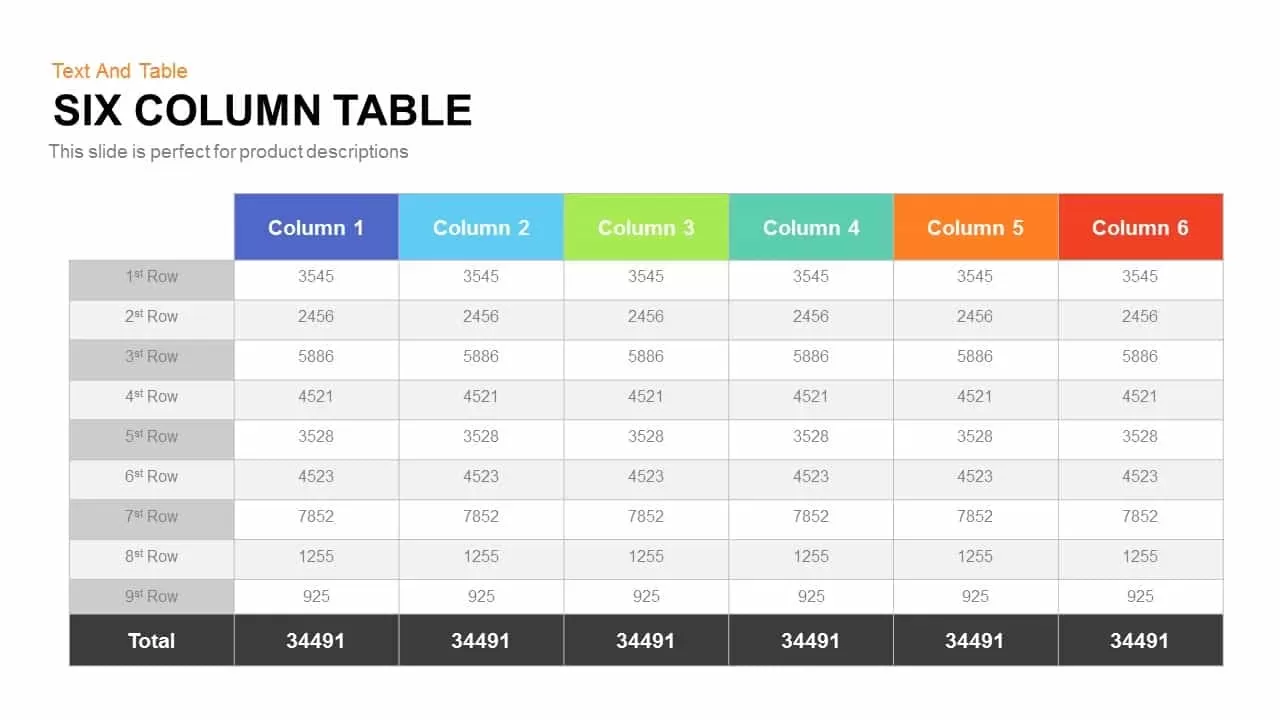
Six Column Table template for PowerPoint & Google Slides
Table
Puzzle-Style SWOT Analysis Table Diagram Template for PowerPoint & Google Slides
SWOT
Eight-Step Colorful Table of Contents Template for PowerPoint & Google Slides
Infographics
Four-Part Table of Contents Infographic Template for PowerPoint & Google Slides
Agenda
Four-Step Table of Contents Presentation Template for PowerPoint & Google Slides
Agenda
Four-Step Agenda Table of Contents Template for PowerPoint & Google Slides
Agenda
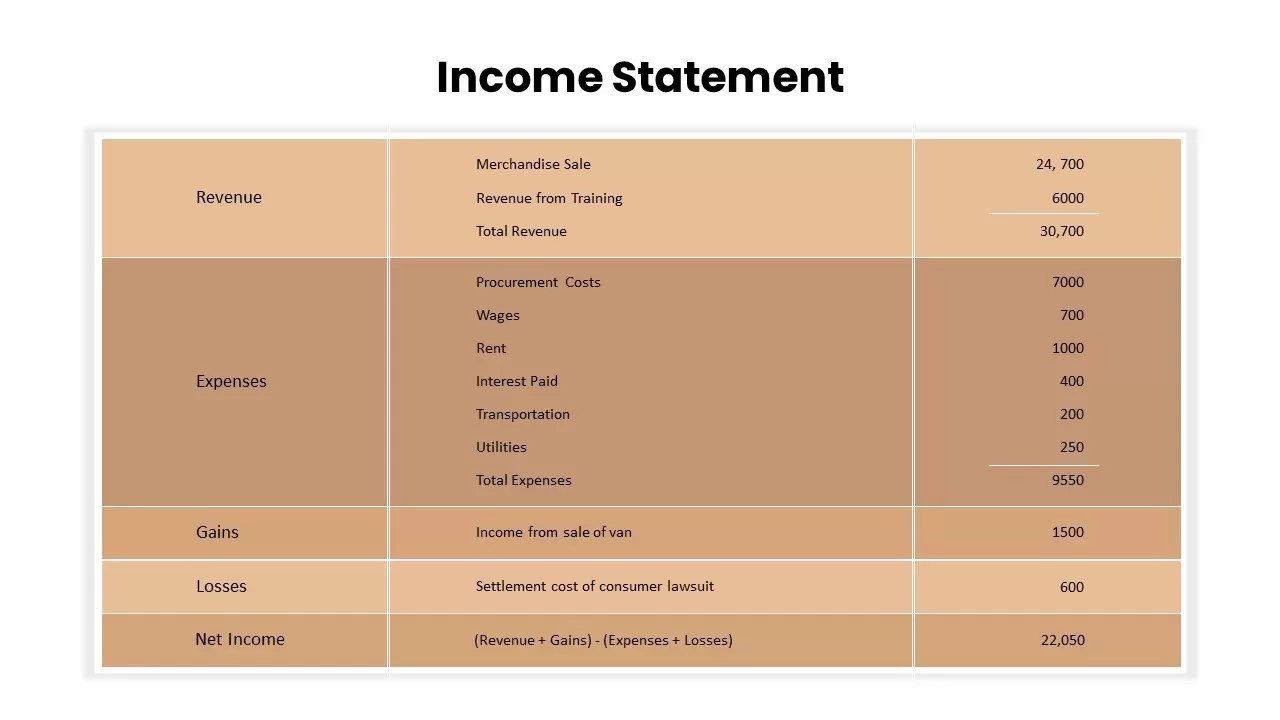
Income Statement Overview Table Template for PowerPoint & Google Slides
Finance
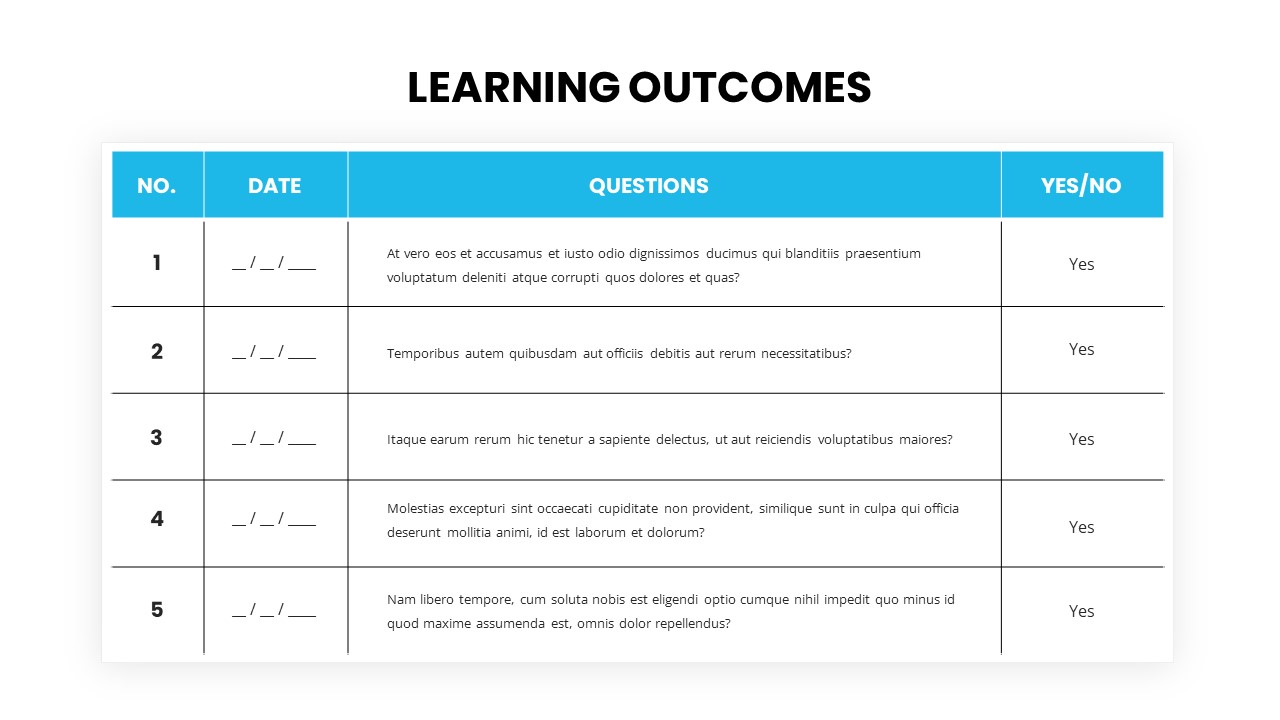
Learning Outcomes table template for PowerPoint & Google Slides
Charts
Comprehensive Resource Planning Table Template for PowerPoint & Google Slides
Project
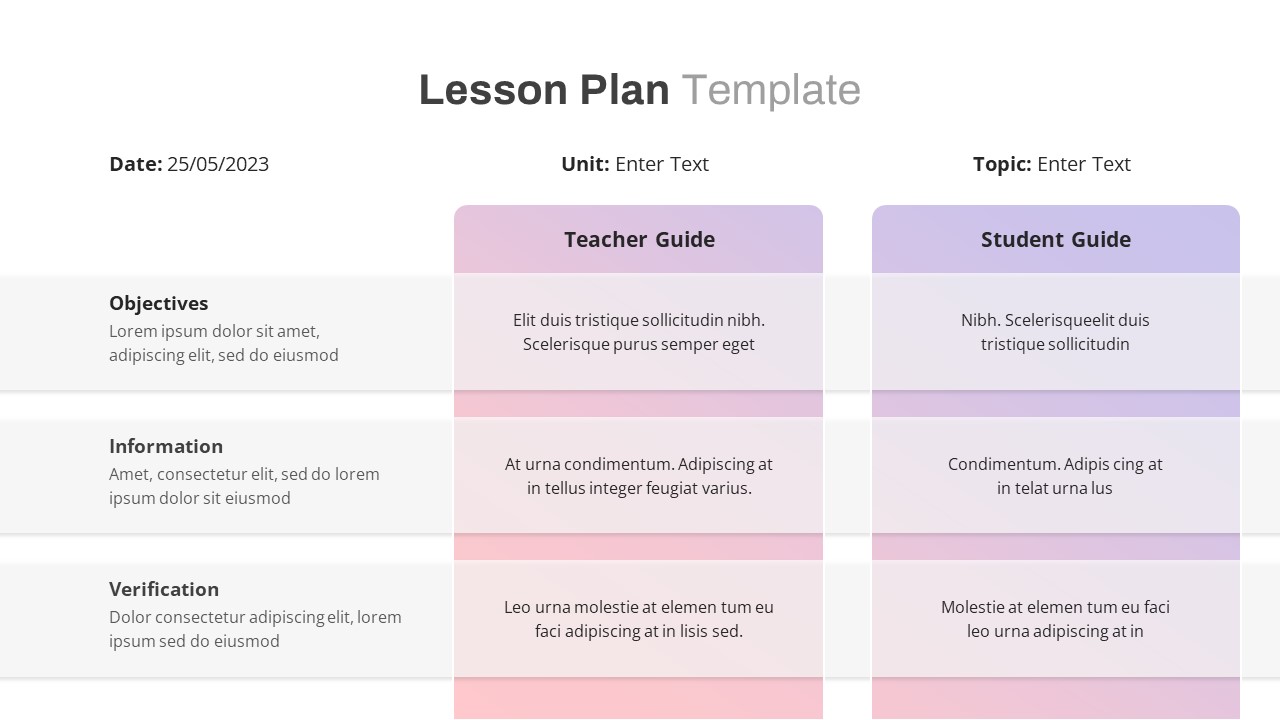
Free Lesson Plan Table Slide Template for PowerPoint & Google Slides
Agenda
Free
Free Minimal Multi-Color Table of Contents Template for PowerPoint & Google Slides
Agenda
Free
Two-Option Bar Chart Comparison Table Template for PowerPoint & Google Slides
Comparison
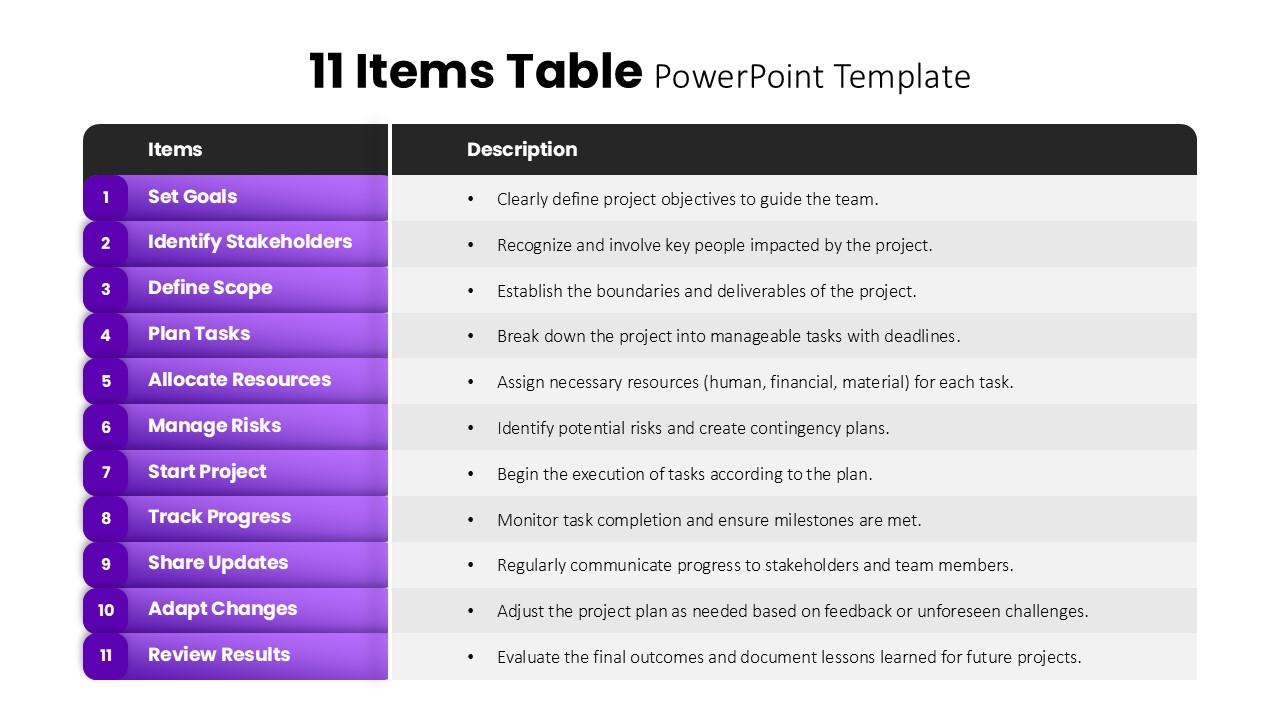
11 Items Table Project Planning Steps template for PowerPoint & Google Slides
Business
Product Feature Comparison Table Template for PowerPoint & Google Slides
Comparison Chart
Project Status Update Dashboard Table Template for PowerPoint & Google Slides
Project Status
Six-Row Multi-Column Table Presentation Template for PowerPoint & Google Slides
Table
Colorful Four-Column Table Layout Template for PowerPoint & Google Slides
Table
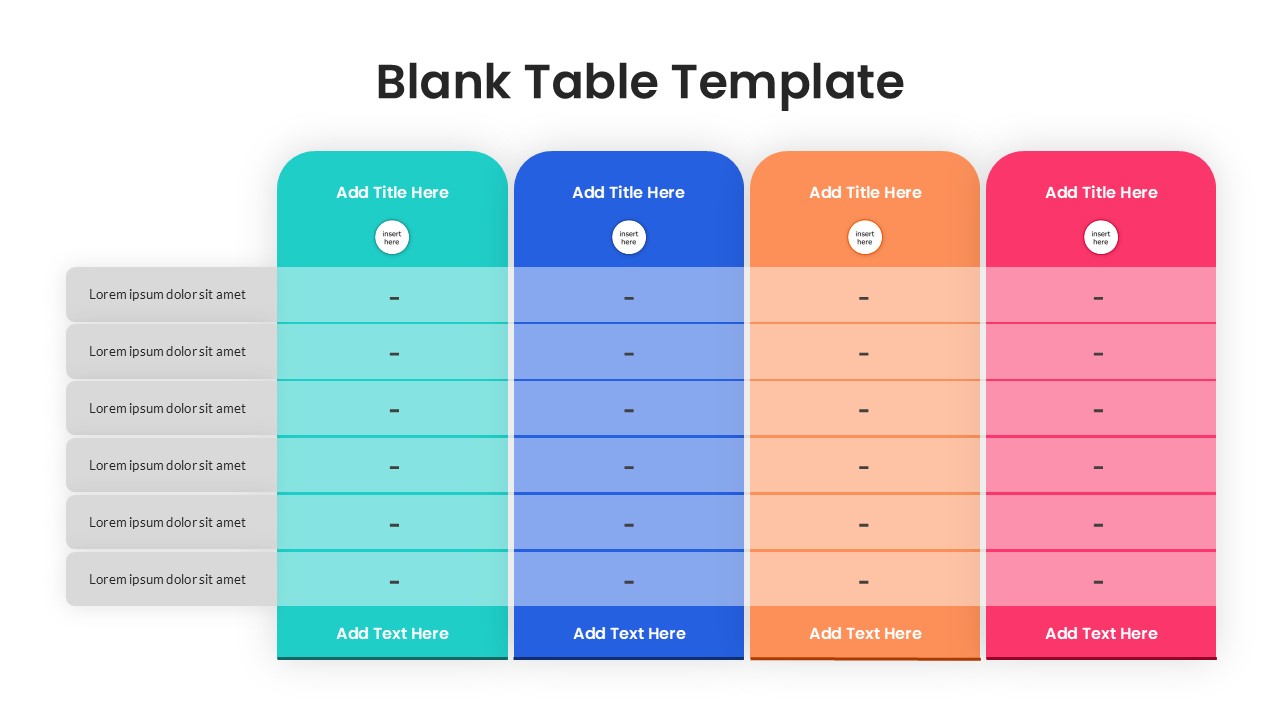
Blank Table Template for PowerPoint & Google Slides
Table