Burke-Litwin Performance and Change Model template for PowerPoint & Google Slides
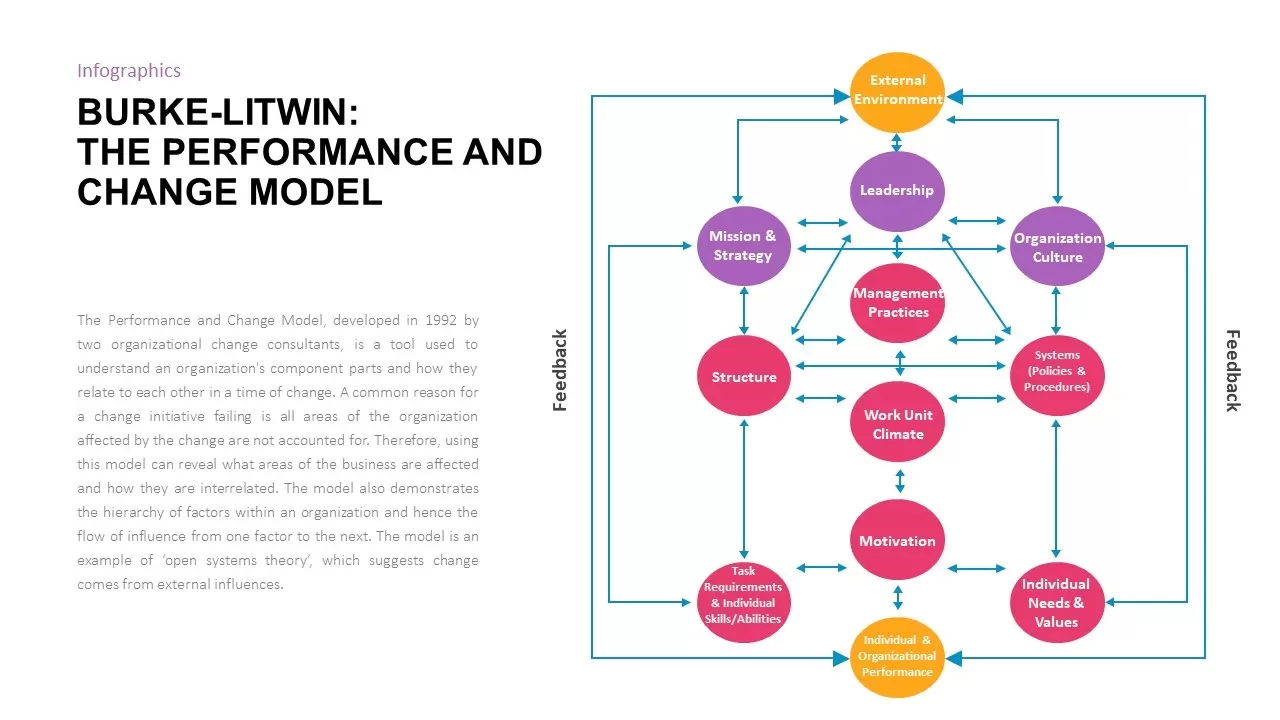
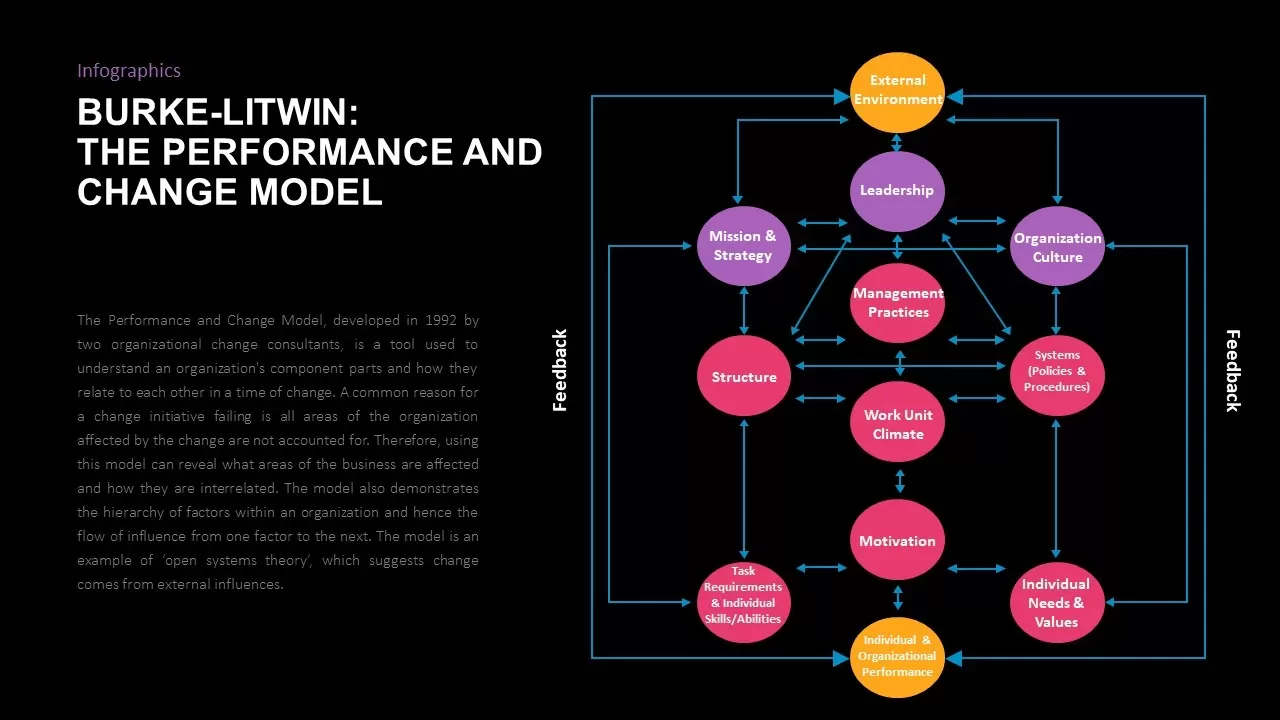

This Burke-Litwin Performance and Change Model infographic is designed to help visualize the interrelationship between various factors that affect organizational performance during periods of change. Developed in 1992, this model identifies key components like leadership, organizational culture, structure, and external environment, demonstrating how changes in one area can influence others. It’s an essential tool for understanding organizational dynamics and improving change management strategies.
The flowchart layout clearly illustrates the model’s components and their feedback loops, offering a clear and engaging way to present complex theories on organizational performance and change. Each factor is color-coded for better visual clarity and can be customized to suit your organization’s specific focus areas or objectives. The diagram is a great way to present change management strategies, analyze organizational structures, or provide a detailed overview of how different organizational factors interact during change processes.
Who is it for
This slide is ideal for organizational development consultants, HR managers, change management professionals, and business leaders focused on driving effective change within their organizations. It’s also beneficial for trainers, coaches, and educators teaching organizational behavior or management theories.
Other Uses
In addition to its use in change management, this model can be adapted for presentations on leadership development, process improvement, organizational strategy, or system dynamics. It’s also useful for workshops or training sessions that focus on understanding organizational behavior or managing complex transitions.
Login to download this file

Item ID
SB02113
Related Templates

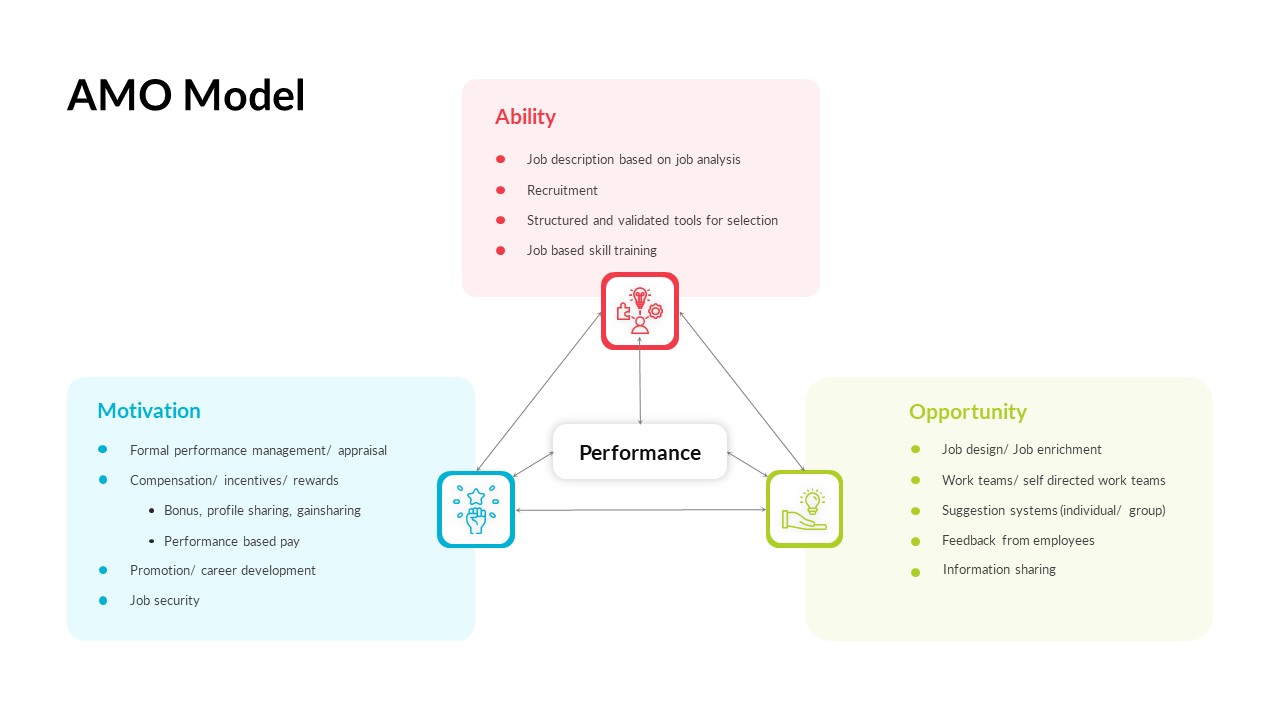
AMO Performance Model Feedback Diagram Template for PowerPoint & Google Slides
Employee Performance
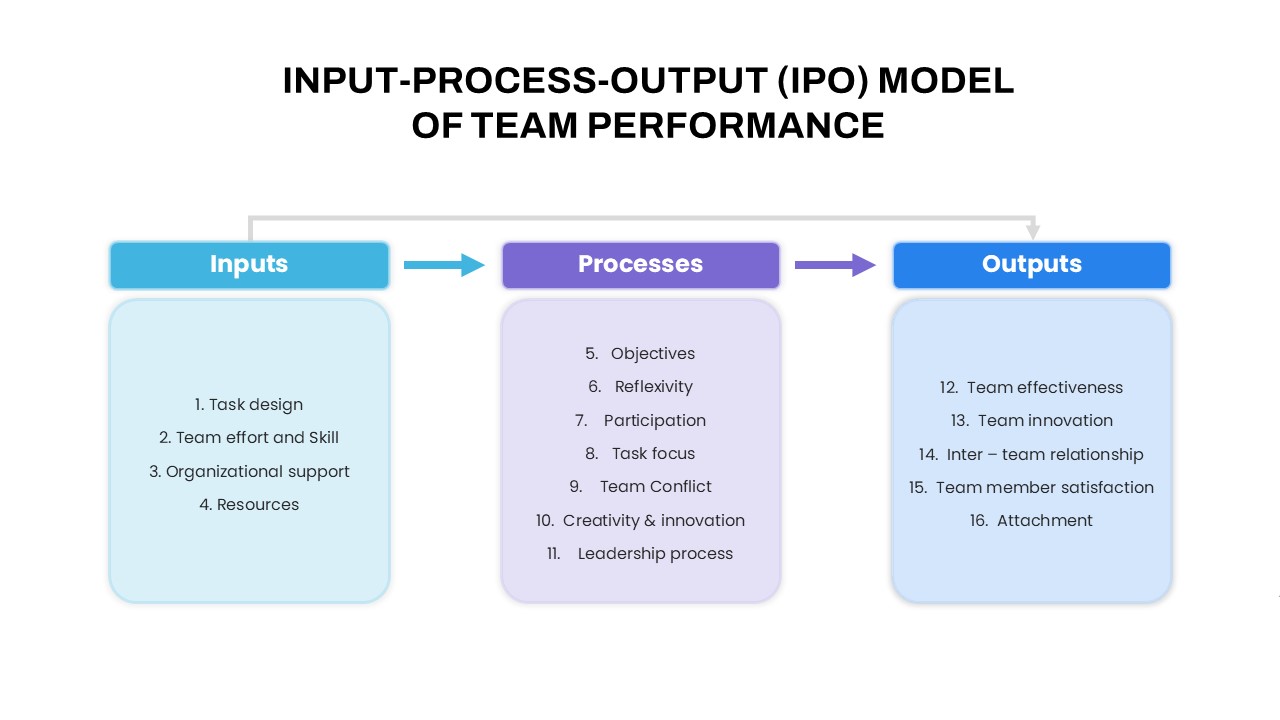
IPO Model of Team Performance for PowerPoint & Google Slides
Process
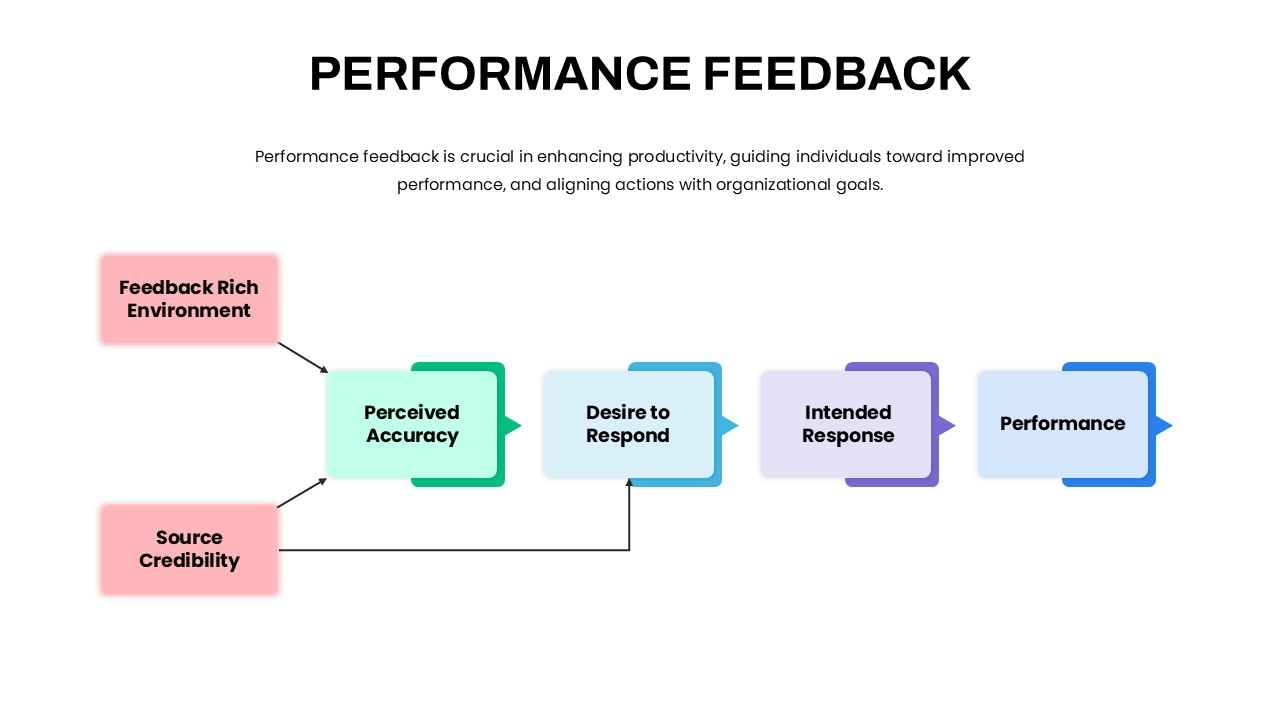
Performance Feedback Model for PowerPoint & Google Slides
Employee Performance

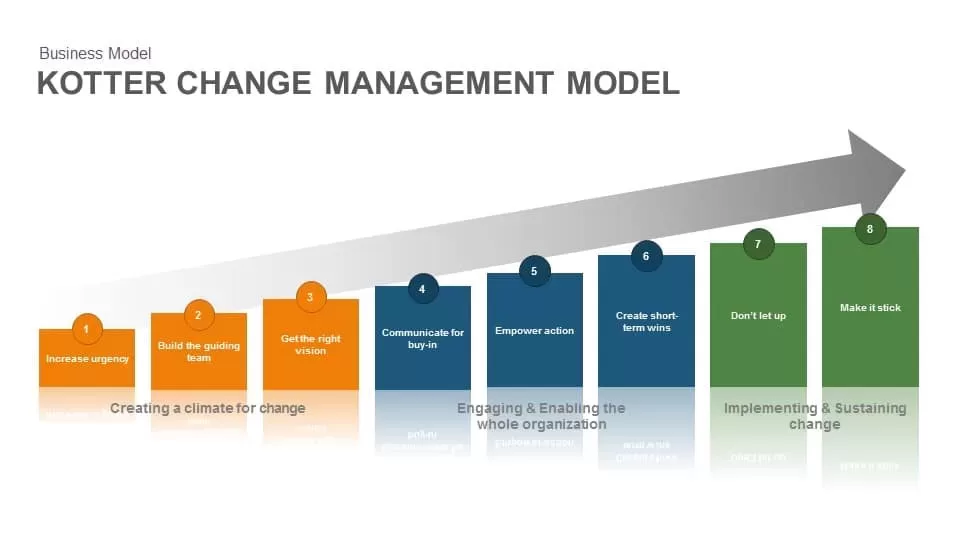
Kotter Change Management Model template for PowerPoint & Google Slides
Business Strategy
Lewin’s Change Model Overview Template for PowerPoint & Google Slides
Gap
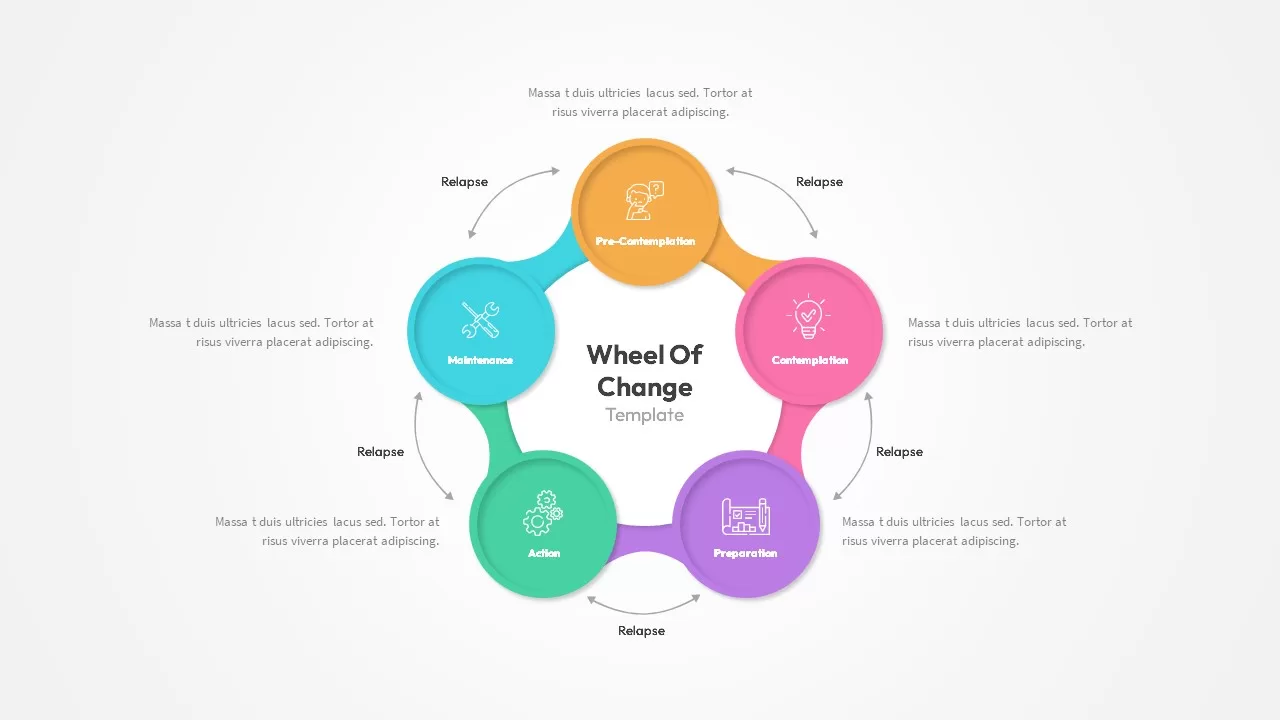
Wheel of Change Model template for PowerPoint & Google Slides
Business Strategy
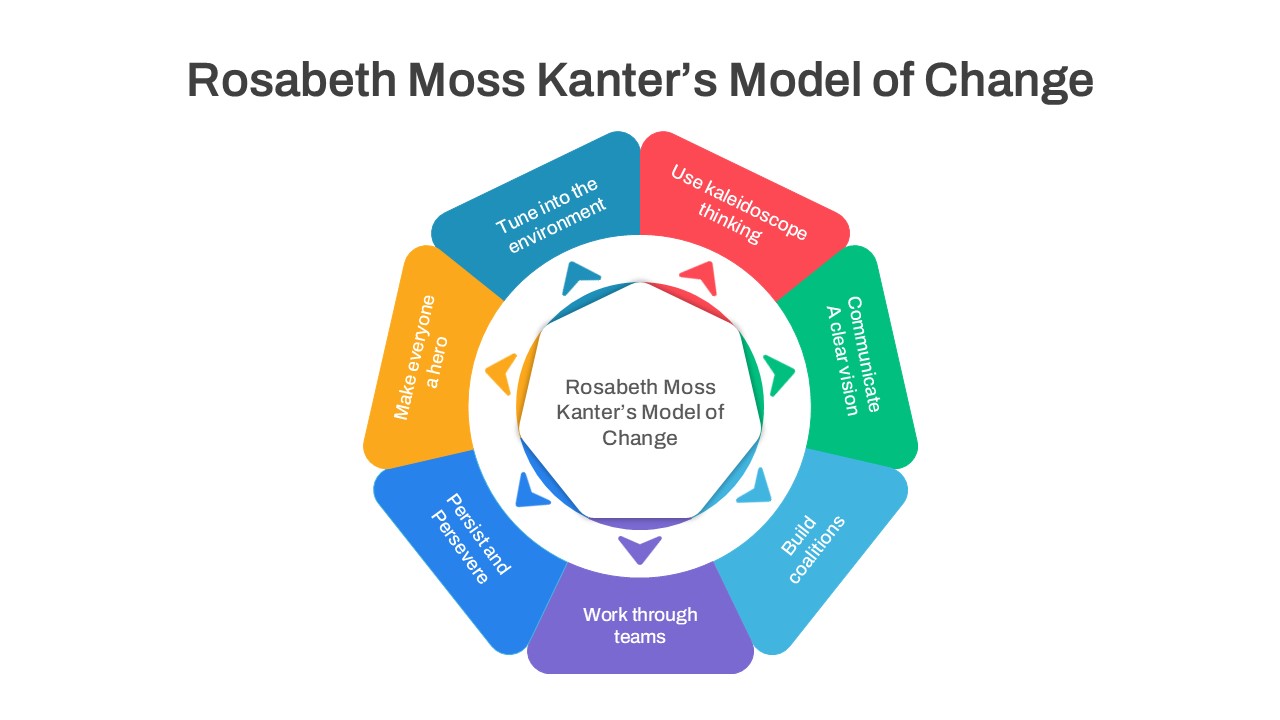
Rosabeth Moss Kanter’s Model of Change Template for PowerPoint & Google Slides
Circular
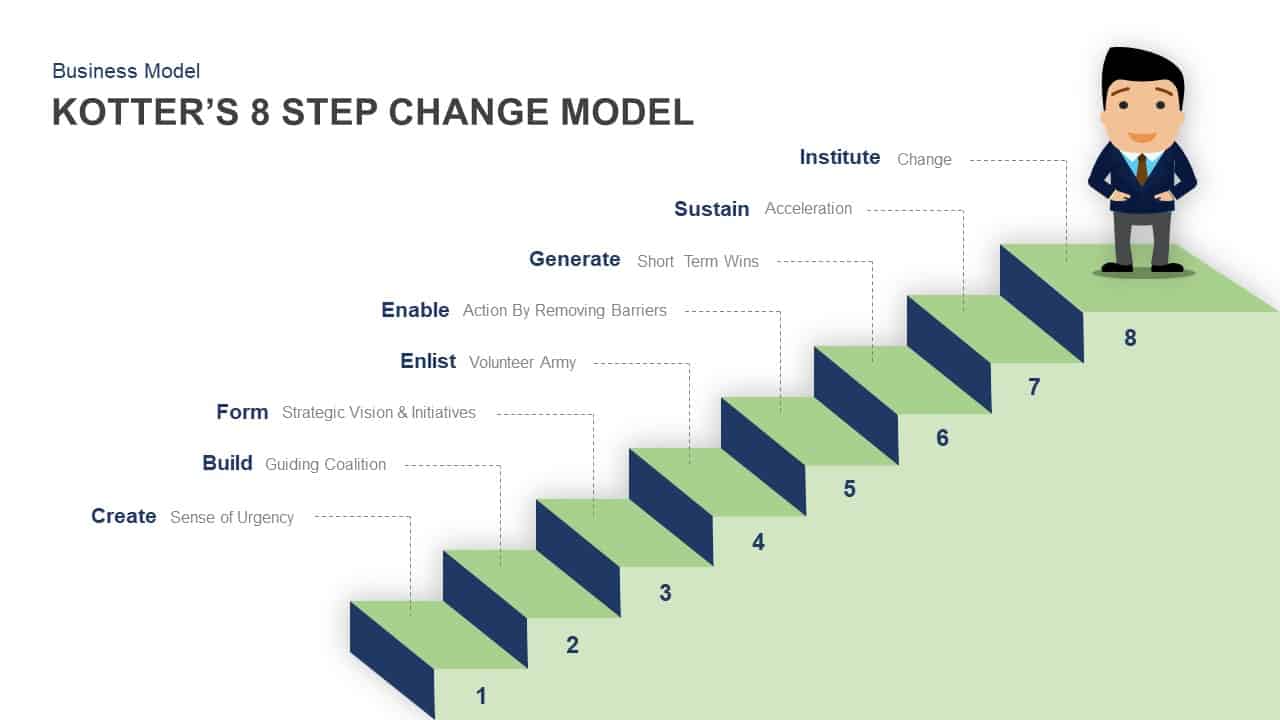
Kotter’s 8 Step Change Model Diagram for PowerPoint & Google Slides
Business Models
Google Ads Optimization & Performance Infographic Template for PowerPoint & Google Slides
Digital Marketing
Profit Performance Trend Chart Template for PowerPoint & Google Slides
Finance
Sales vs Budget Performance Chart Template for PowerPoint & Google Slides
Bar/Column
Website Performance Dashboard template for PowerPoint & Google Slides
Charts
Sales Performance Dashboard template for PowerPoint & Google Slides
Business Report
Performance Review Process Management Cycle template for PowerPoint & Google Slides
Employee Performance
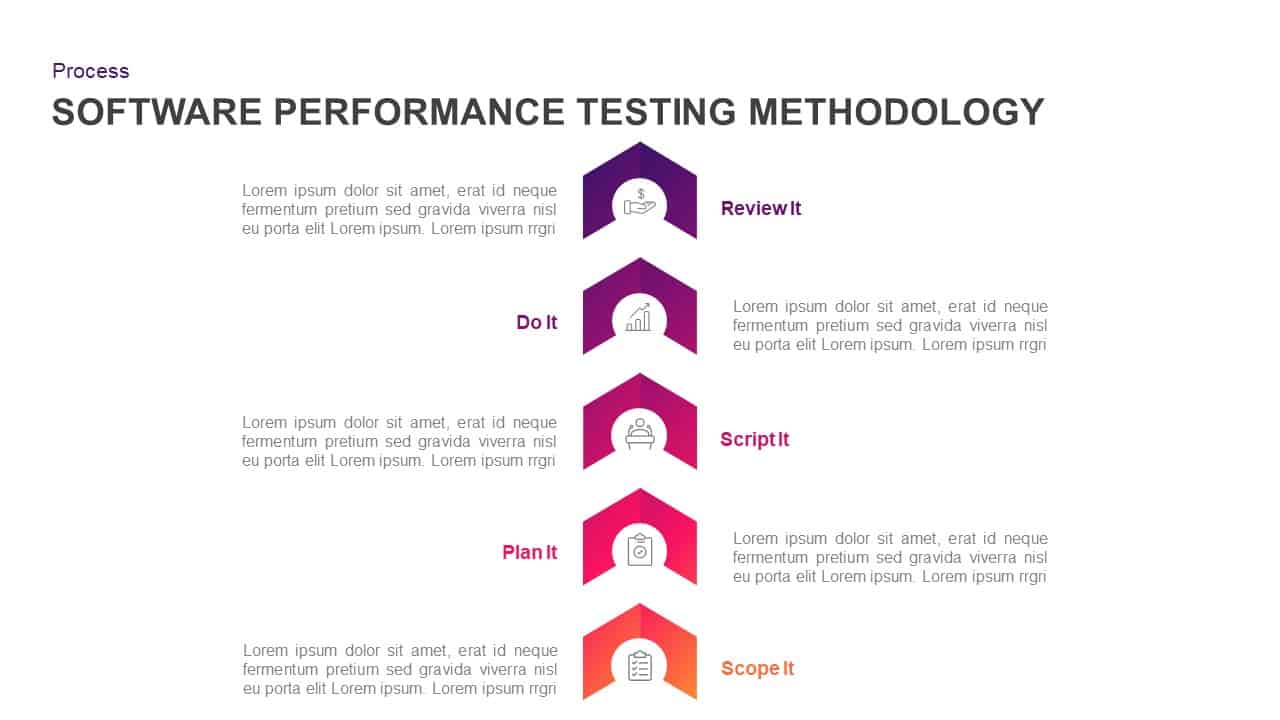
Software Performance Testing Methodology Template for PowerPoint & Google Slides
Process
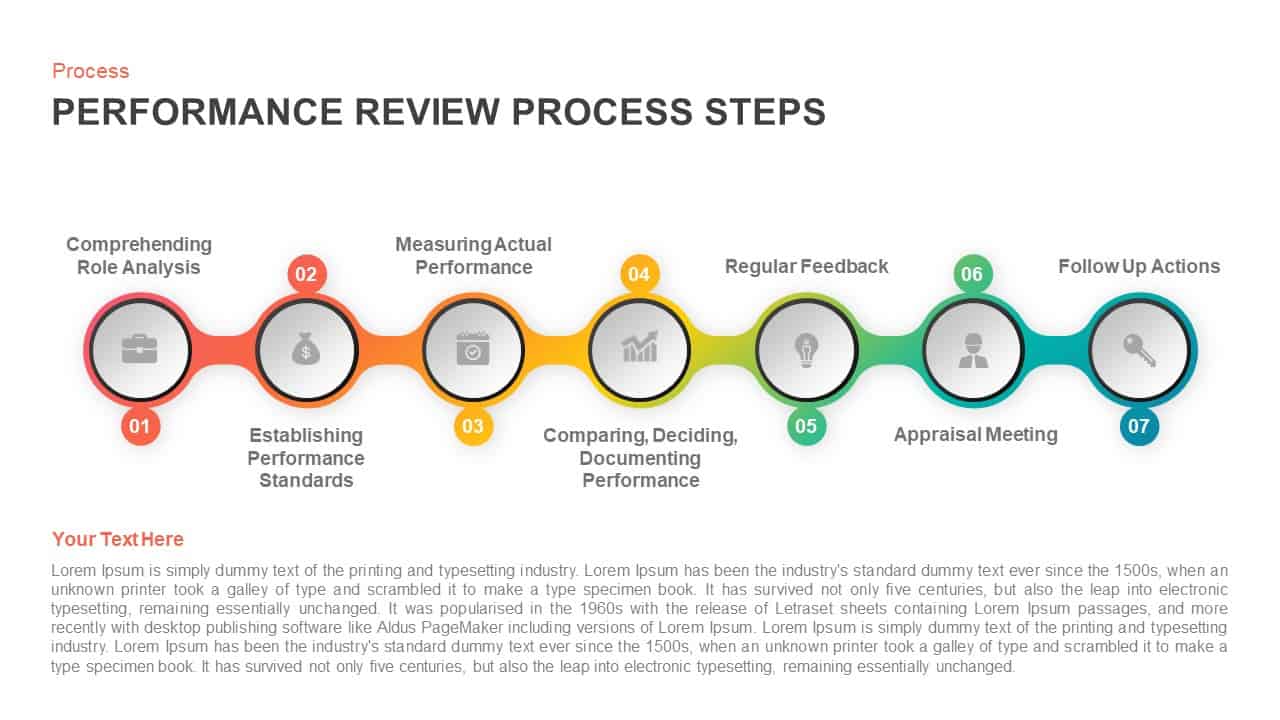
Performance Review Process Steps Template for PowerPoint & Google Slides
Employee Performance
Social Media Performance Dashboard Template for PowerPoint & Google Slides
Bar/Column
Professional Sales Performance Report Template for PowerPoint & Google Slides
Business Report
Performance Review Progress Management Template for PowerPoint & Google Slides
Process
Corporate Performance Management Template for PowerPoint & Google Slides
Pitch Deck
Performance KPI Dashboard Slide Template for PowerPoint & Google Slides
Business Report
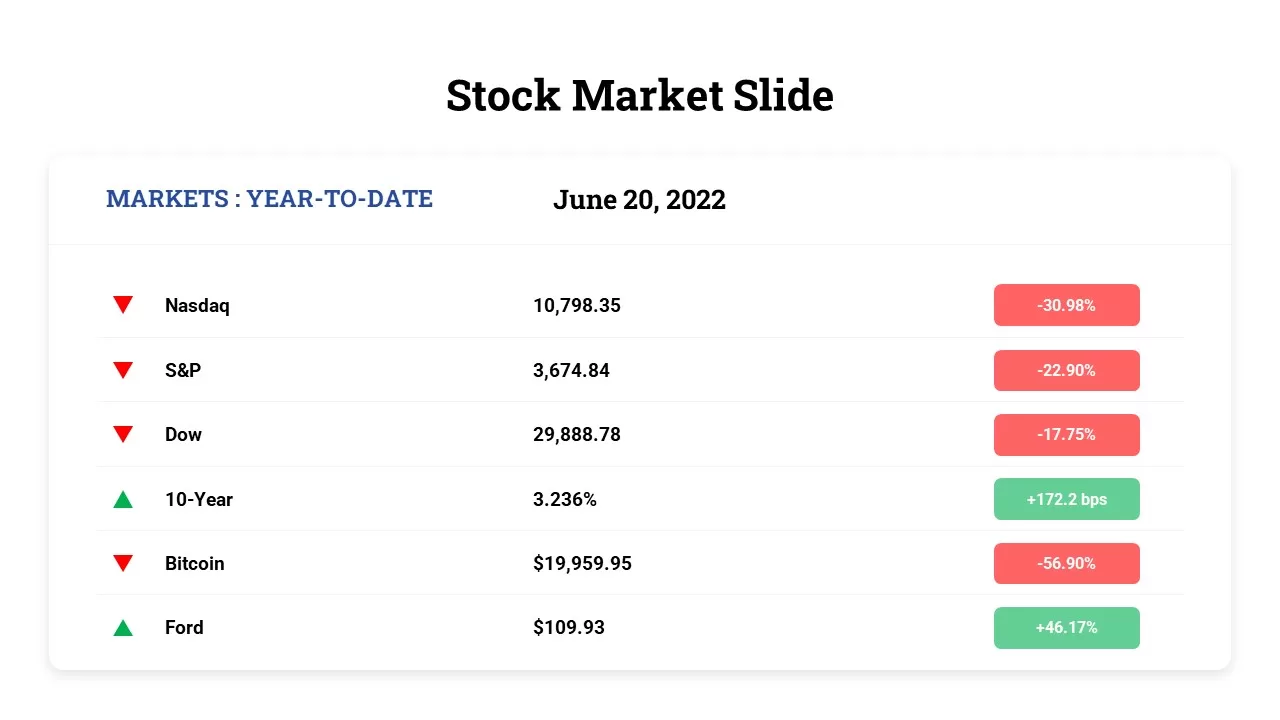
Free Stock Market Performance Overview template for PowerPoint & Google Slides
Finance
Free
9-Box Matrix for Performance & Potential Template for PowerPoint & Google Slides
Employee Performance
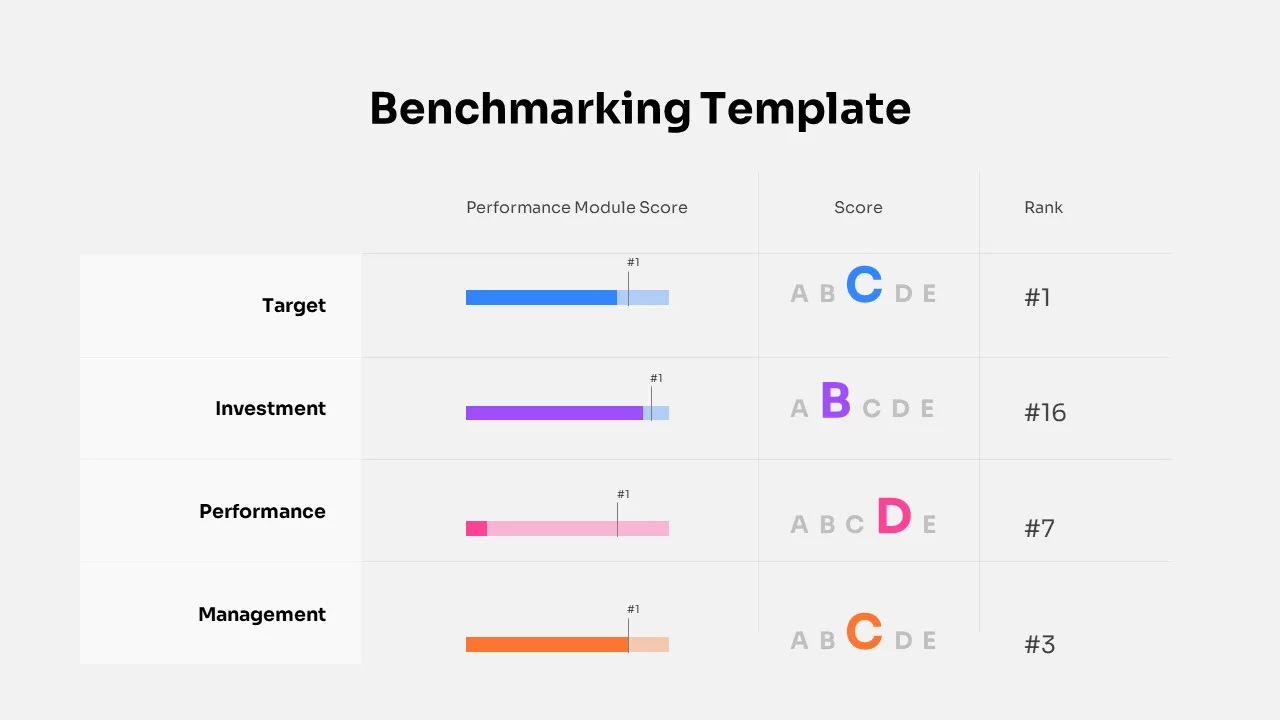
Benchmarking Performance Score Template for PowerPoint & Google Slides
Comparison Chart
Website Performance Monitoring Dashboard Template for PowerPoint & Google Slides
Business Report
Hits and Misses Performance Comparison Template for PowerPoint & Google Slides
Comparison
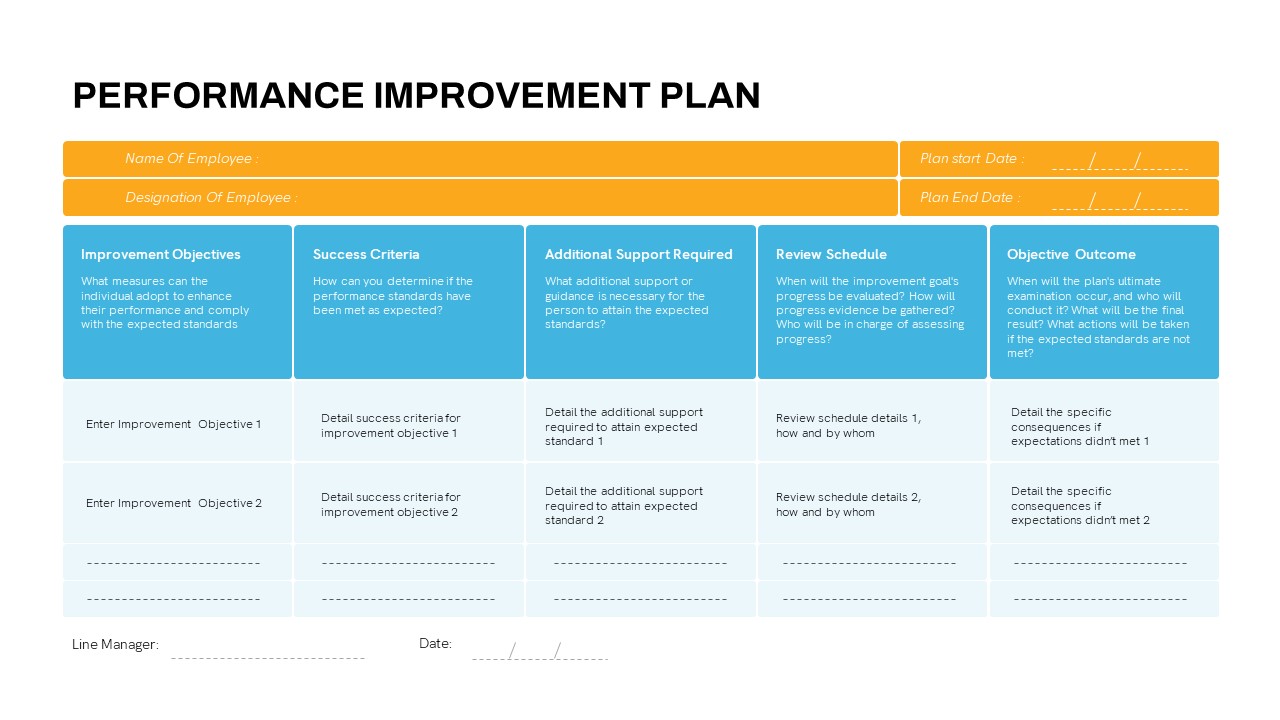
Detailed Performance Improvement Plan Template for PowerPoint & Google Slides
Employee Performance
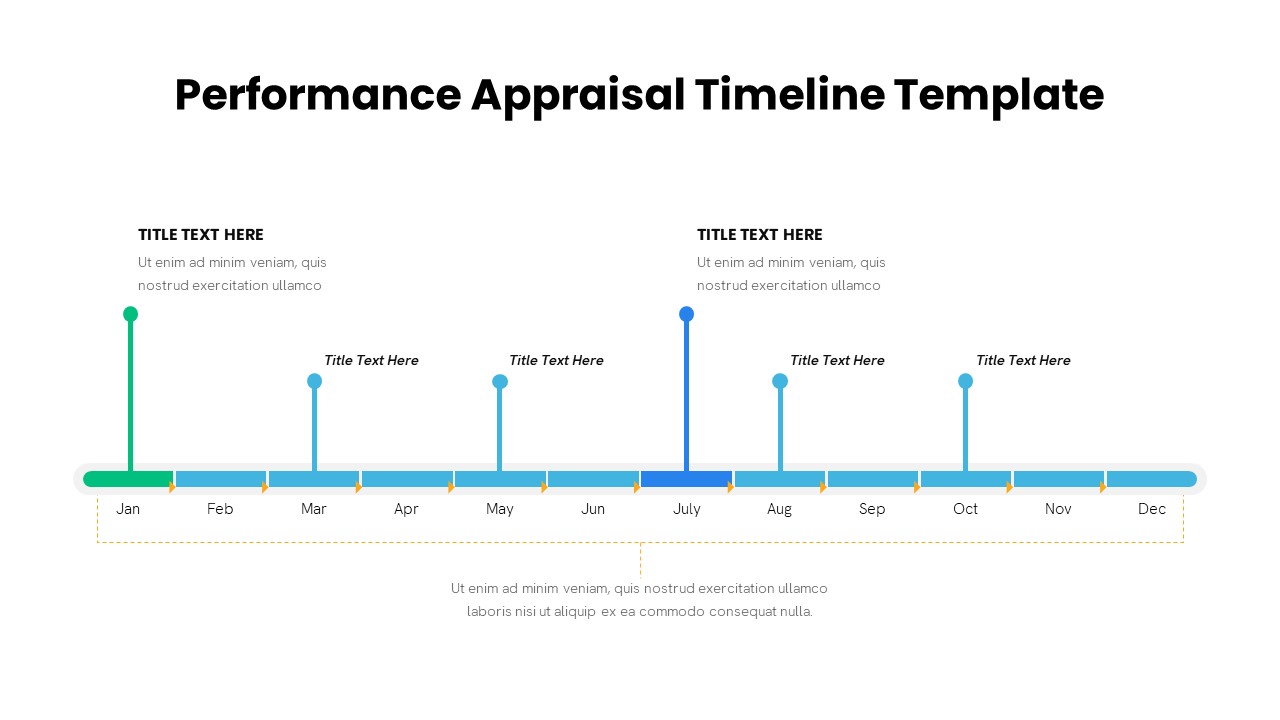
Performance Appraisal Timeline Diagram Template for PowerPoint & Google Slides
Timeline
DevOps KPI Dashboard Performance Metrics Template for PowerPoint & Google Slides
Software Development
Monthly Sales Performance Dashboard Template for PowerPoint & Google Slides
Charts
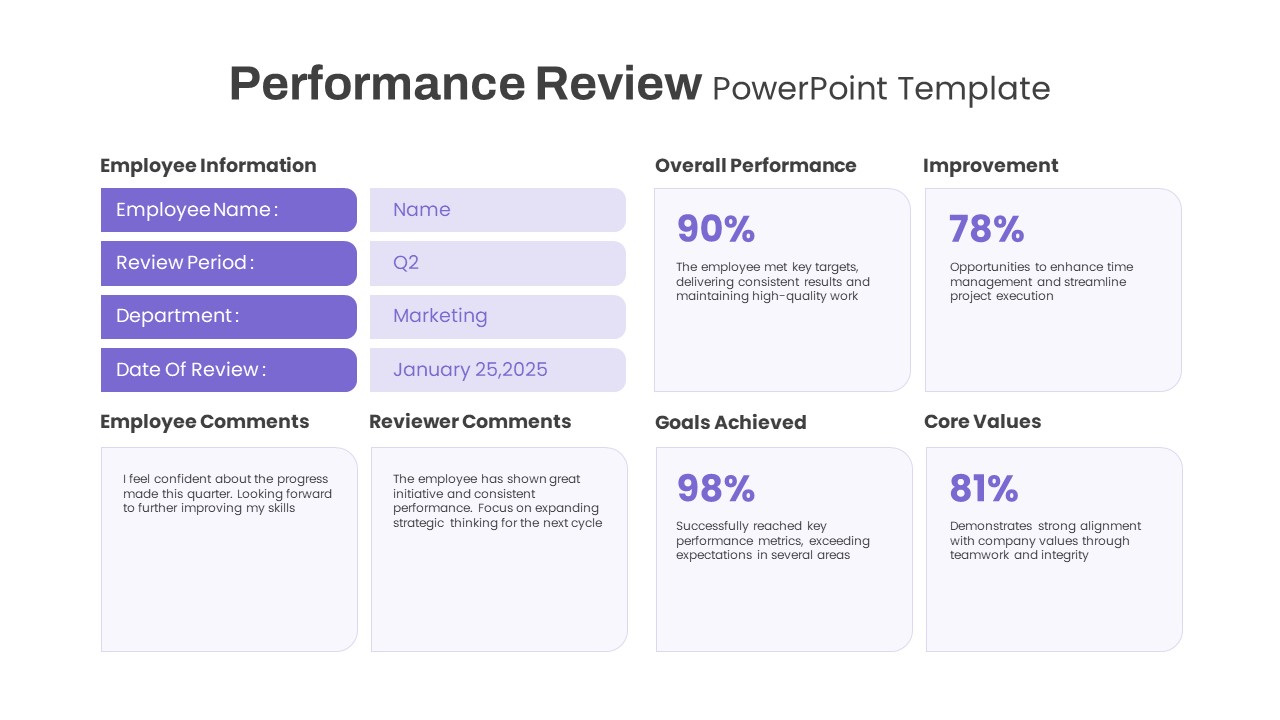
Performance Review template for PowerPoint & Google Slides
Employee Performance
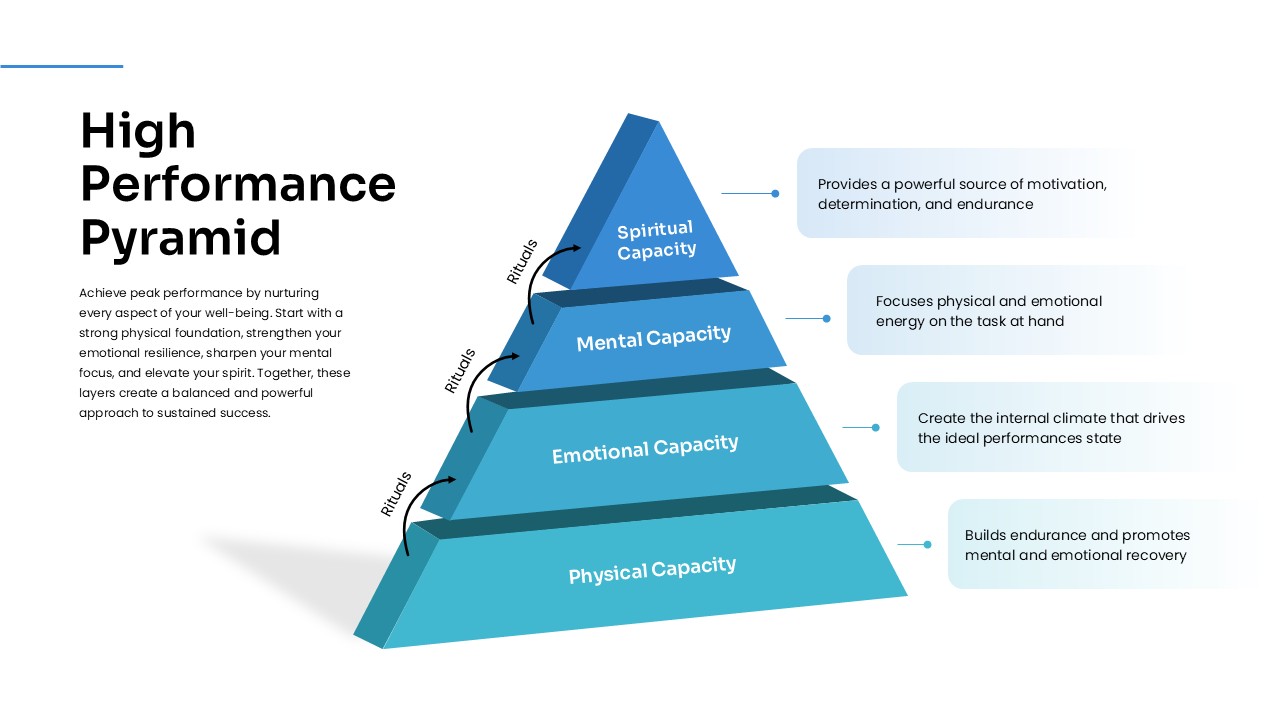
High Performance Pyramid Diagram Template for PowerPoint & Google Slides
Pyramid
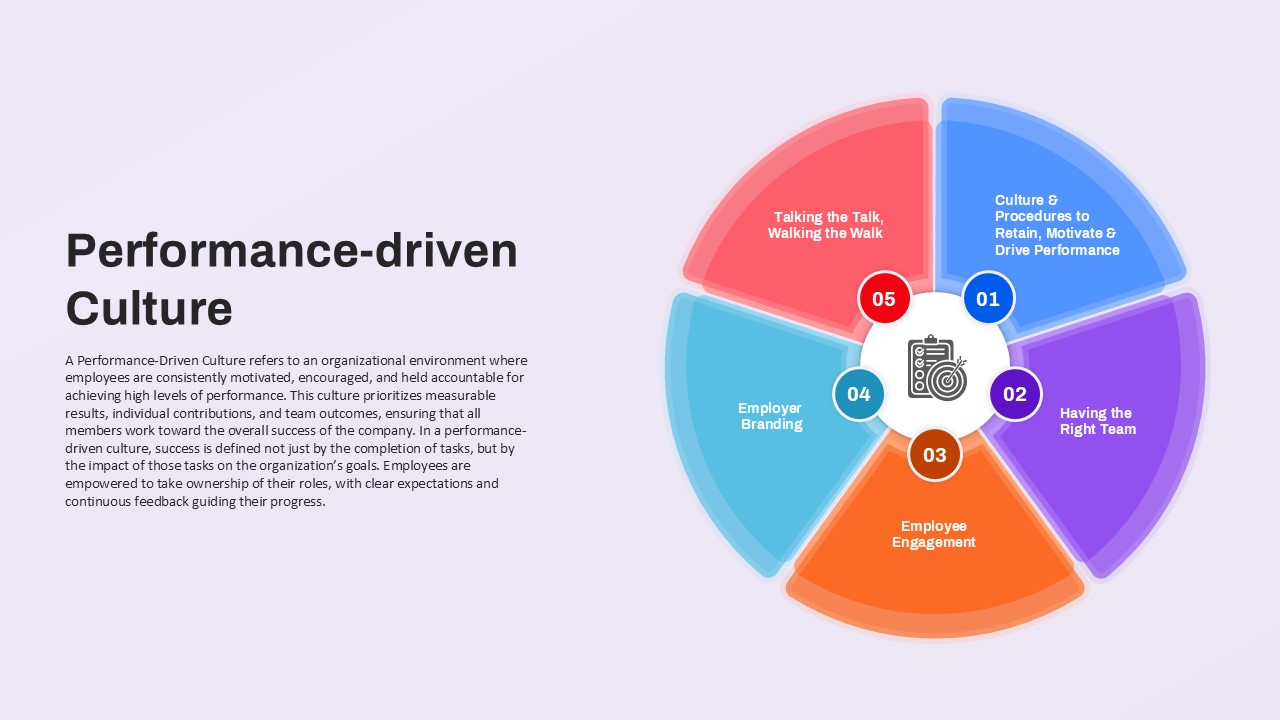
Performance-driven Culture framework template for PowerPoint & Google Slides
Leadership
Employee Performance Metrics Dashboard Template for PowerPoint & Google Slides
Employee Performance
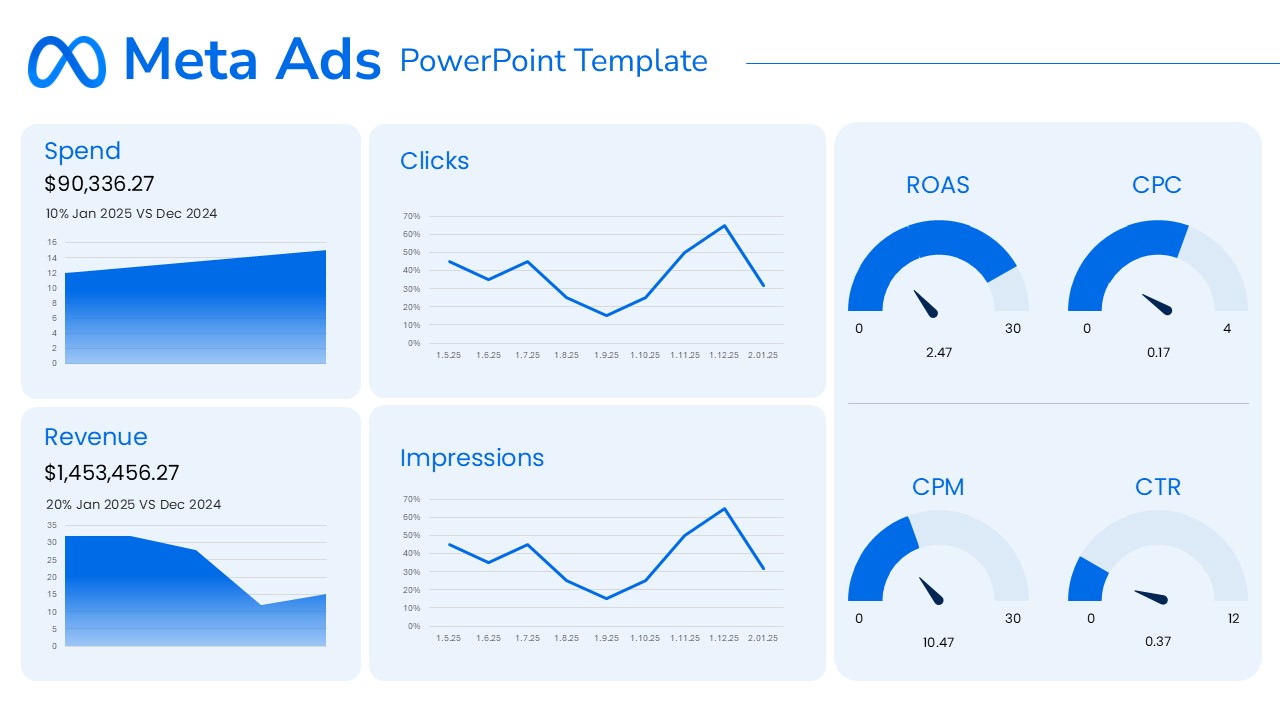
Meta Ads Performance Overview template for PowerPoint & Google Slides
Advertising
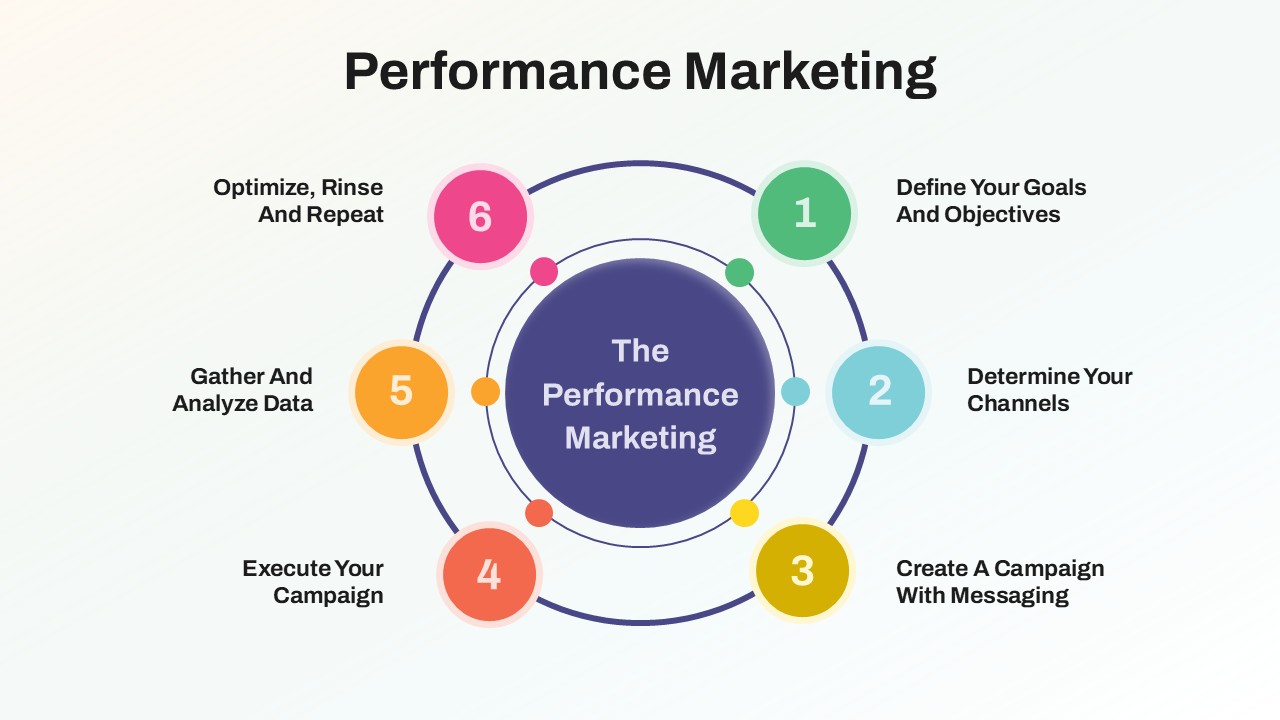
Performance Marketing Strategy template for PowerPoint & Google Slides
Digital Marketing
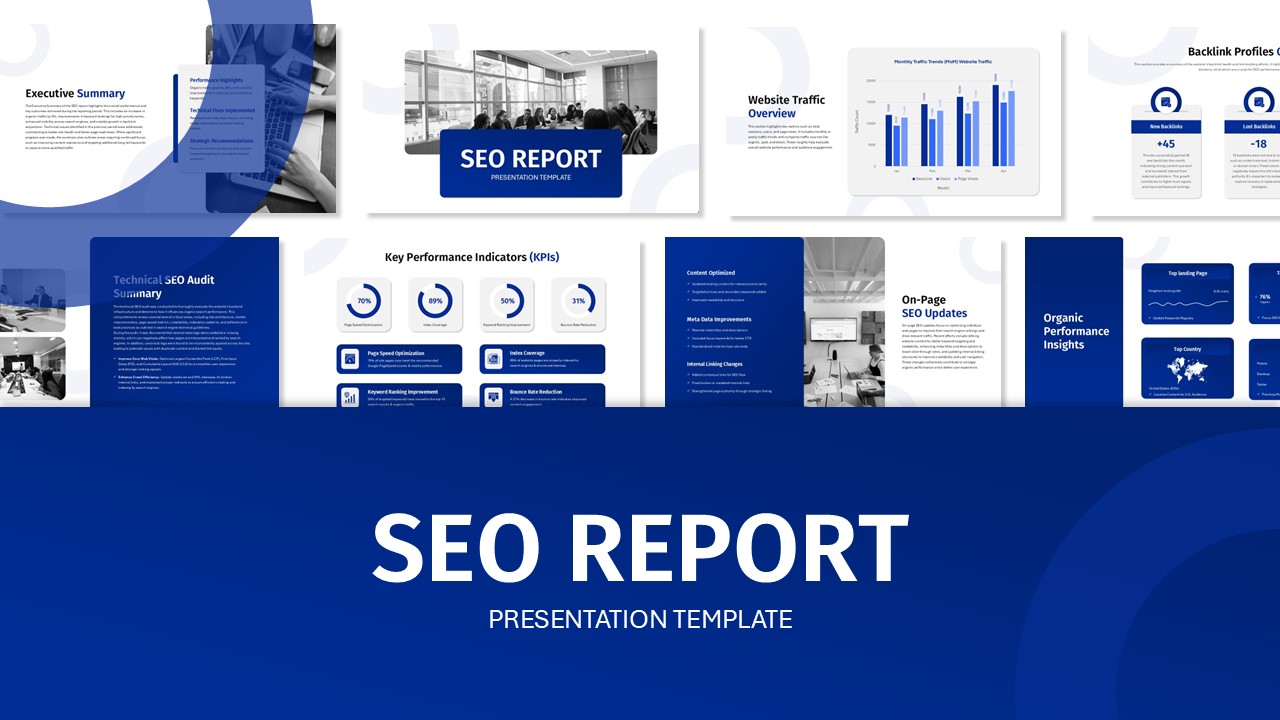
SEO Performance Report Overview template for PowerPoint & Google Slides
Digital Marketing
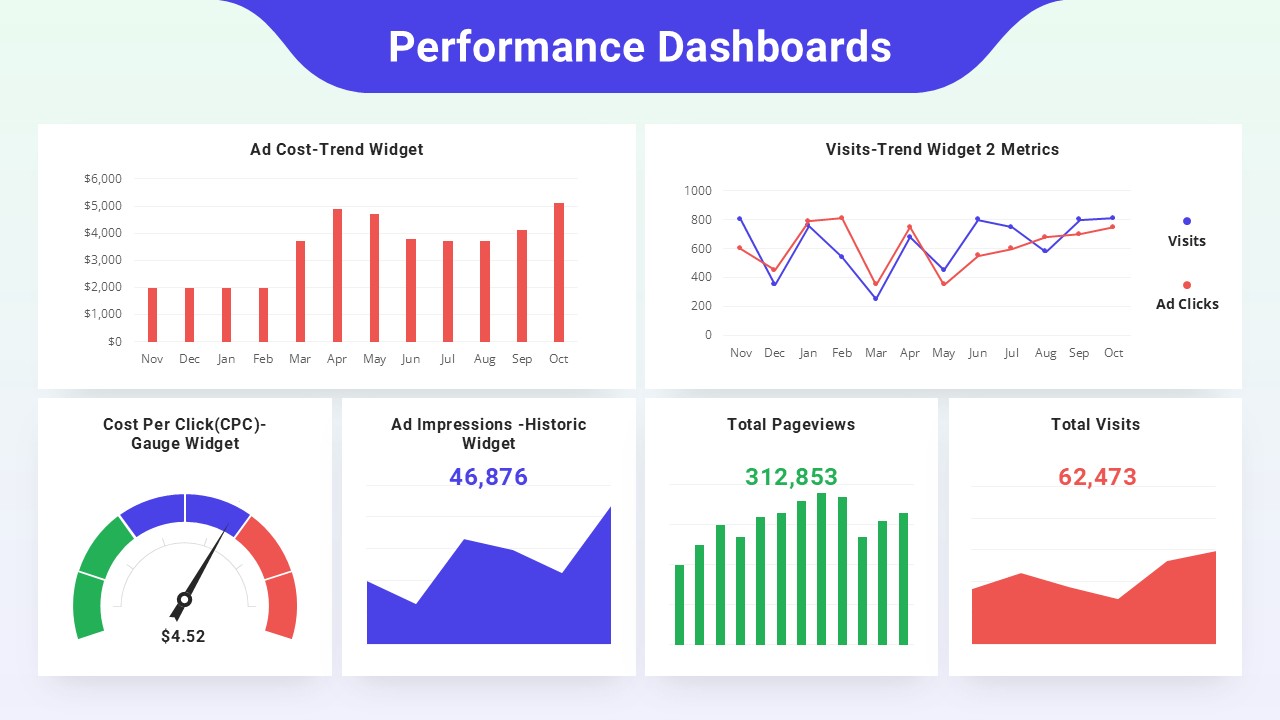
Performance Dashboards Overview Template for PowerPoint & Google Slides
Business Report
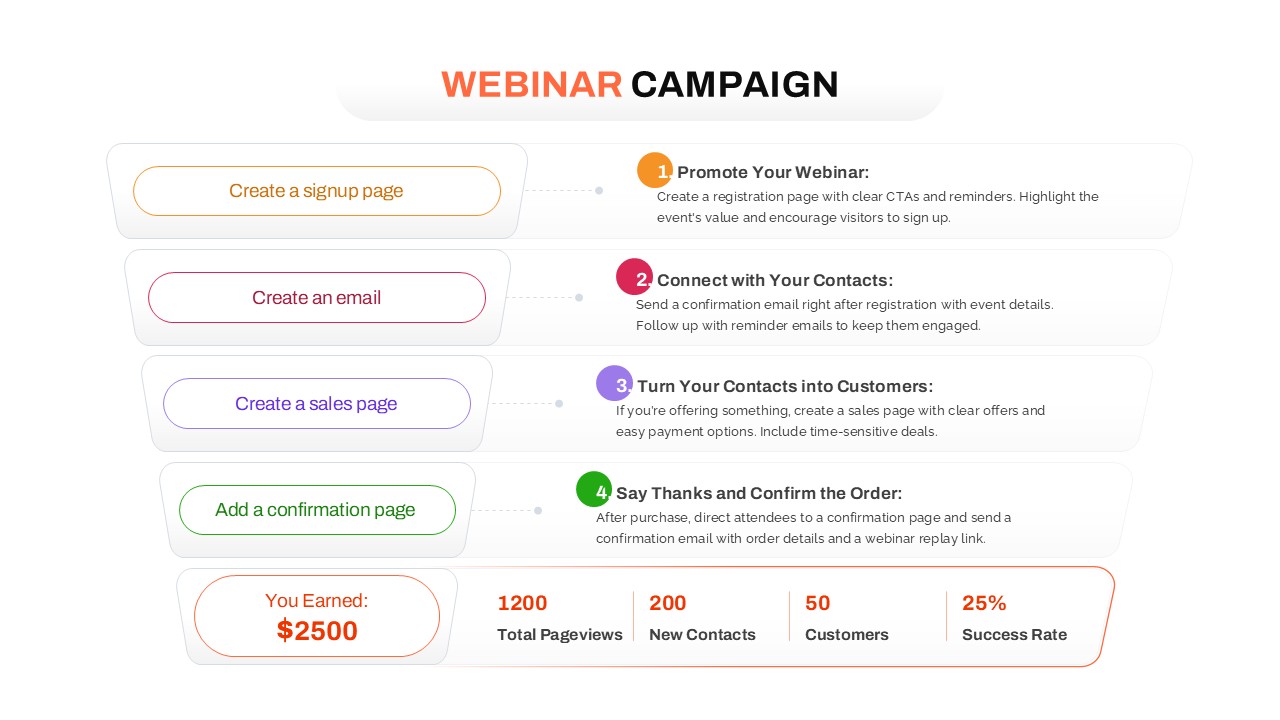
Webinar Campaign Steps and Performance for PowerPoint & Google Slides
Advertising
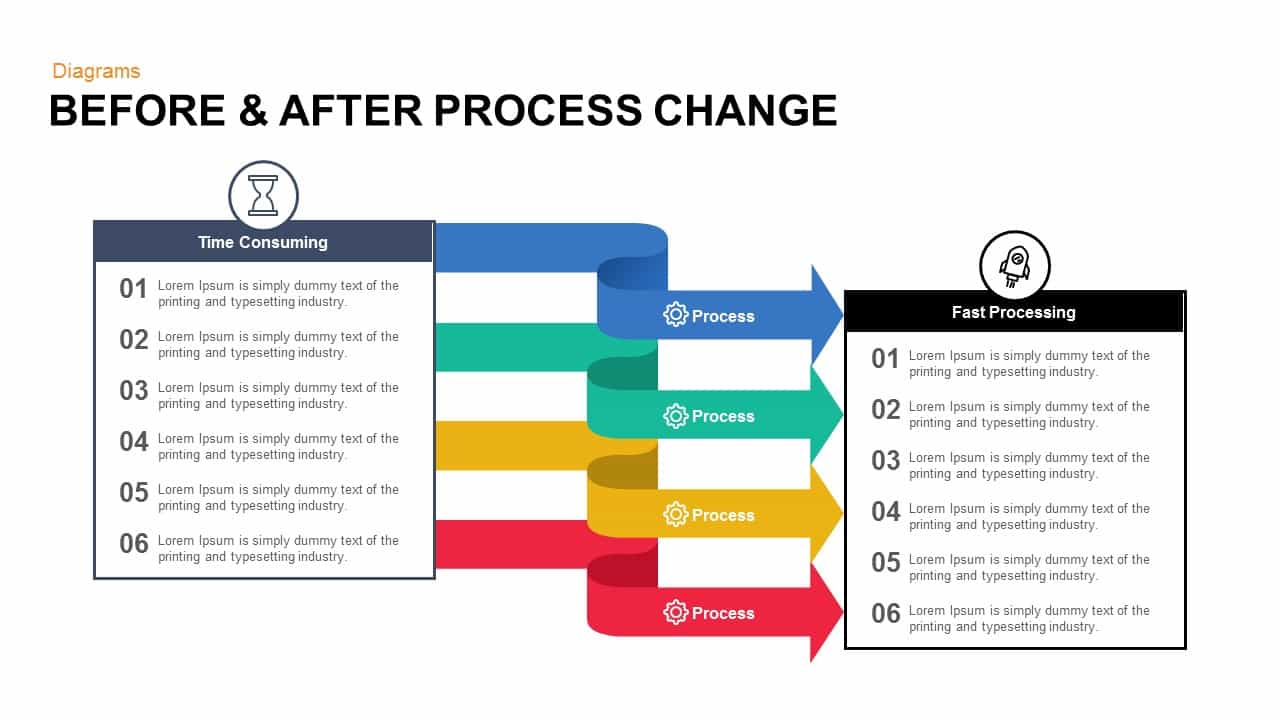
Before & After Process Change template for PowerPoint & Google Slides
Process
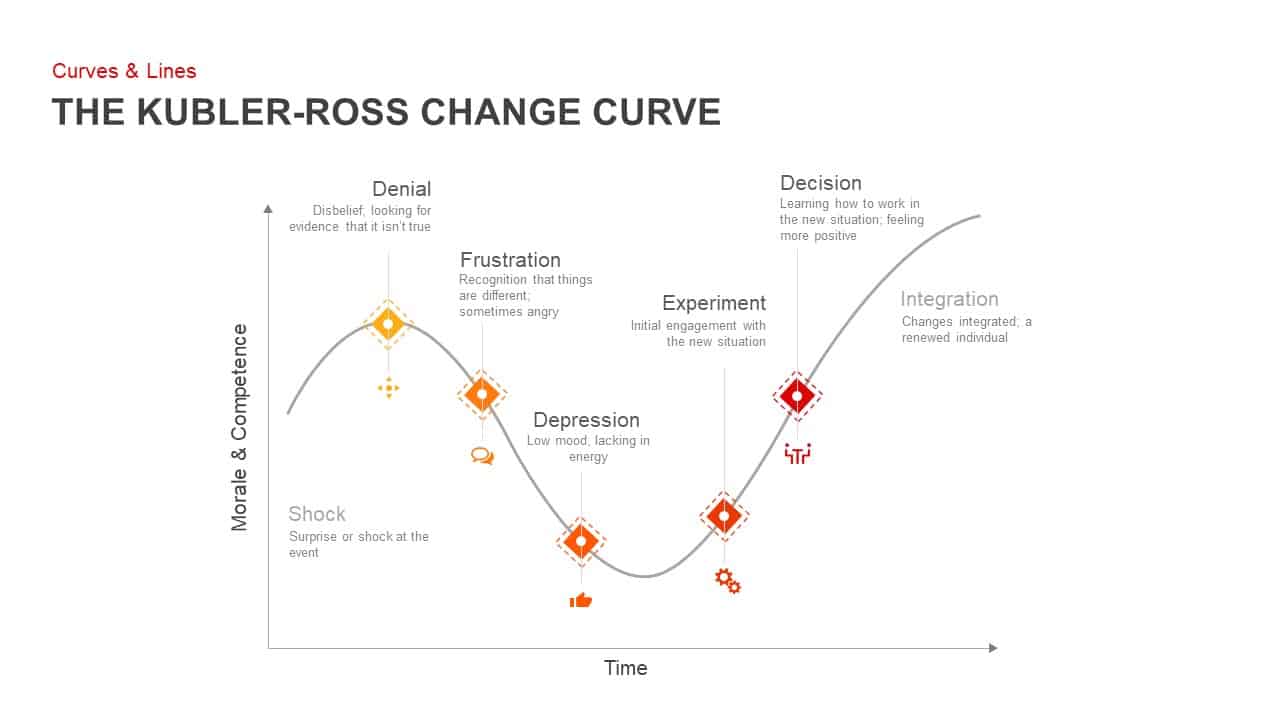
Kubler-Ross Change Curve Diagram Template for PowerPoint & Google Slides
Timeline
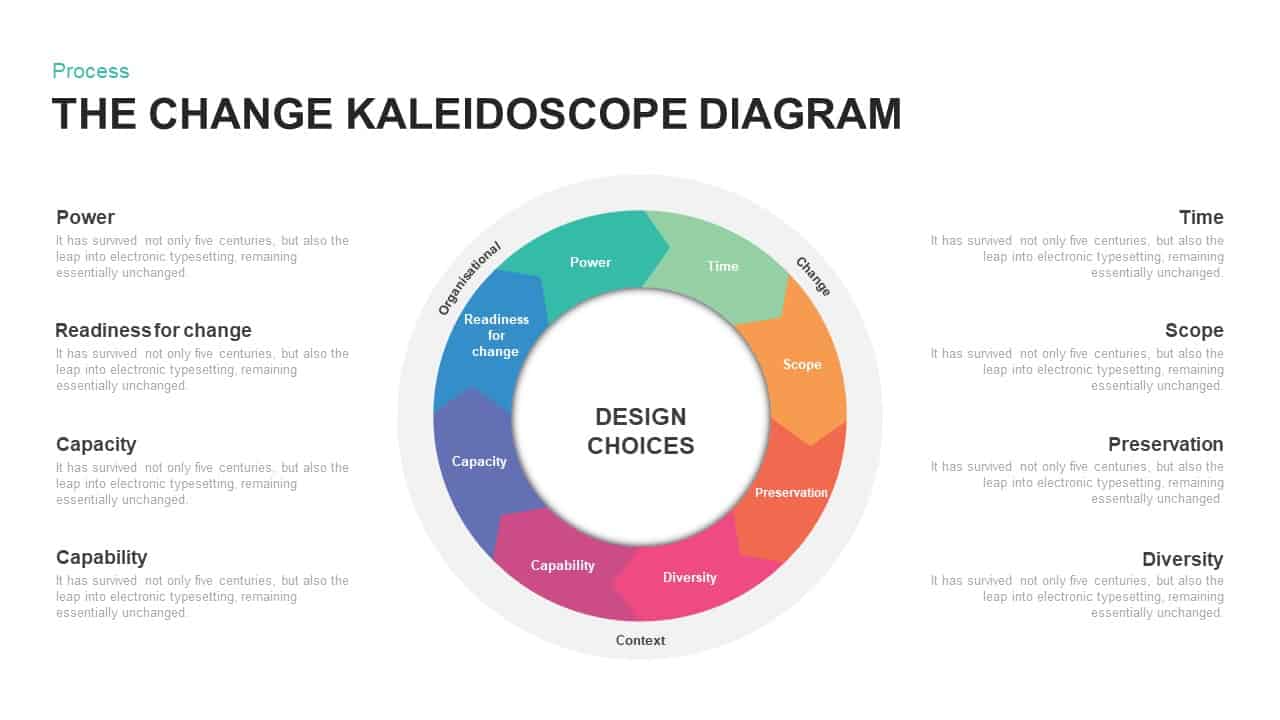
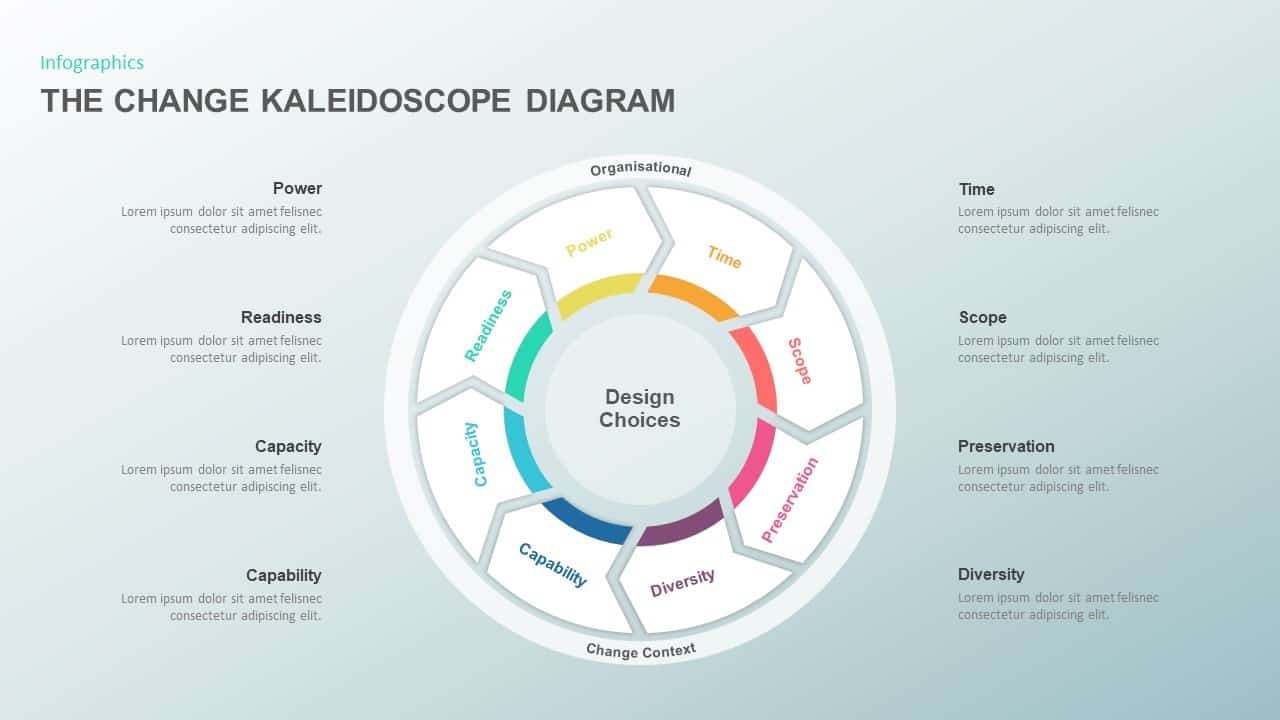
Change Kaleidoscope Process Diagram Template for PowerPoint & Google Slides
Circular
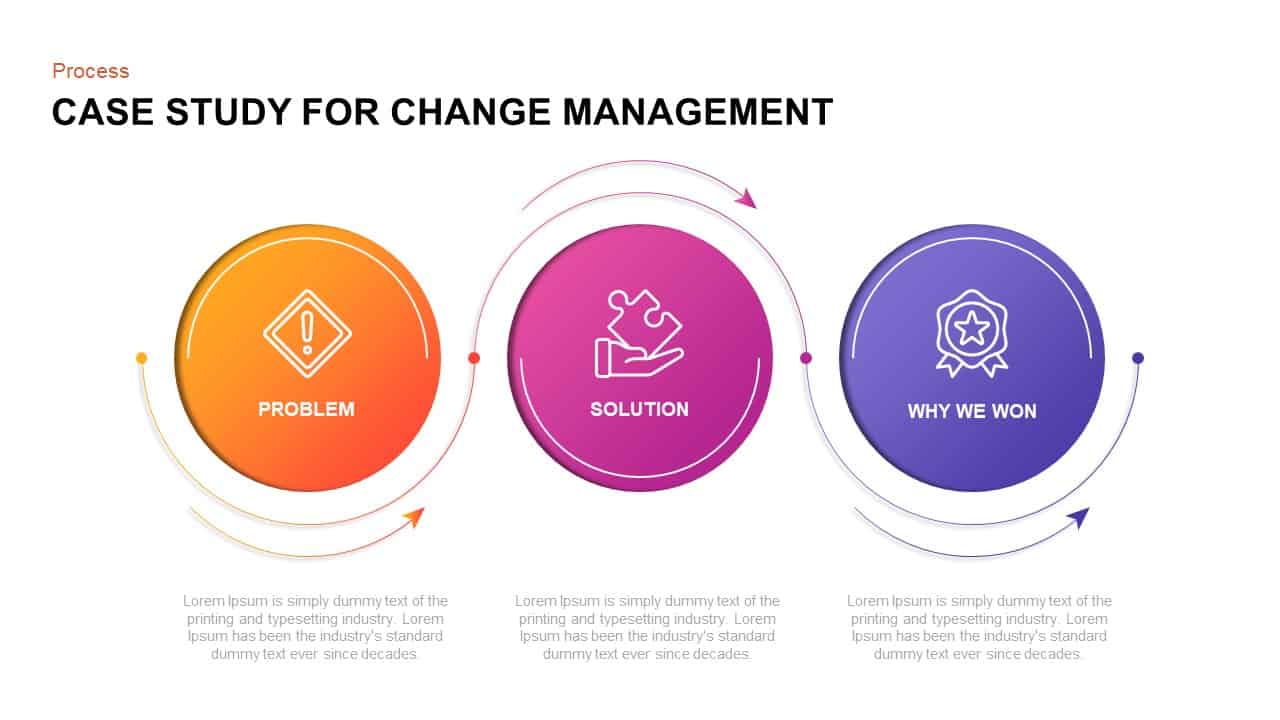
Case Study for Change Management Process Template for PowerPoint & Google Slides
Process
The Change Kaleidoscope Diagram template for PowerPoint & Google Slides
Pitch Deck

Lewin’s Change Management Diagram Template for PowerPoint & Google Slides
Process

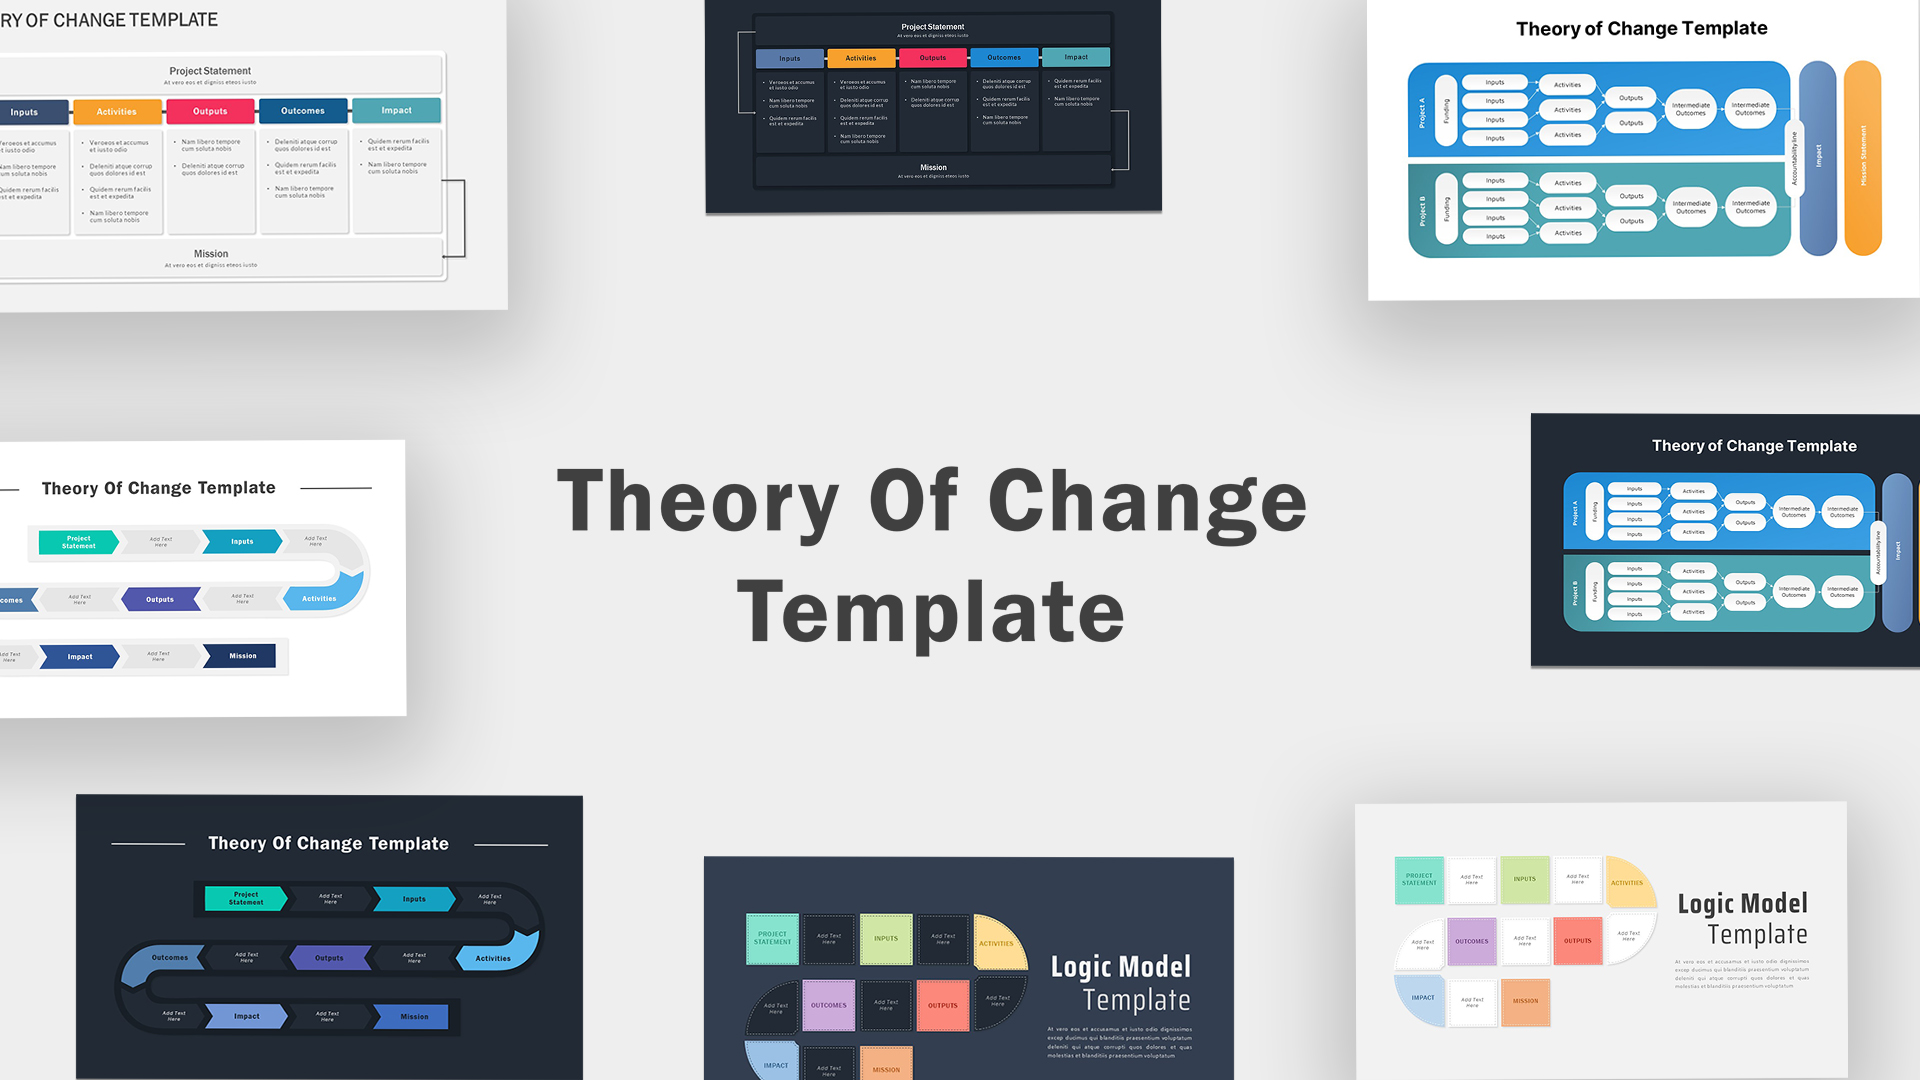
Theory of Change Infographics Pack Template for PowerPoint & Google Slides
Process
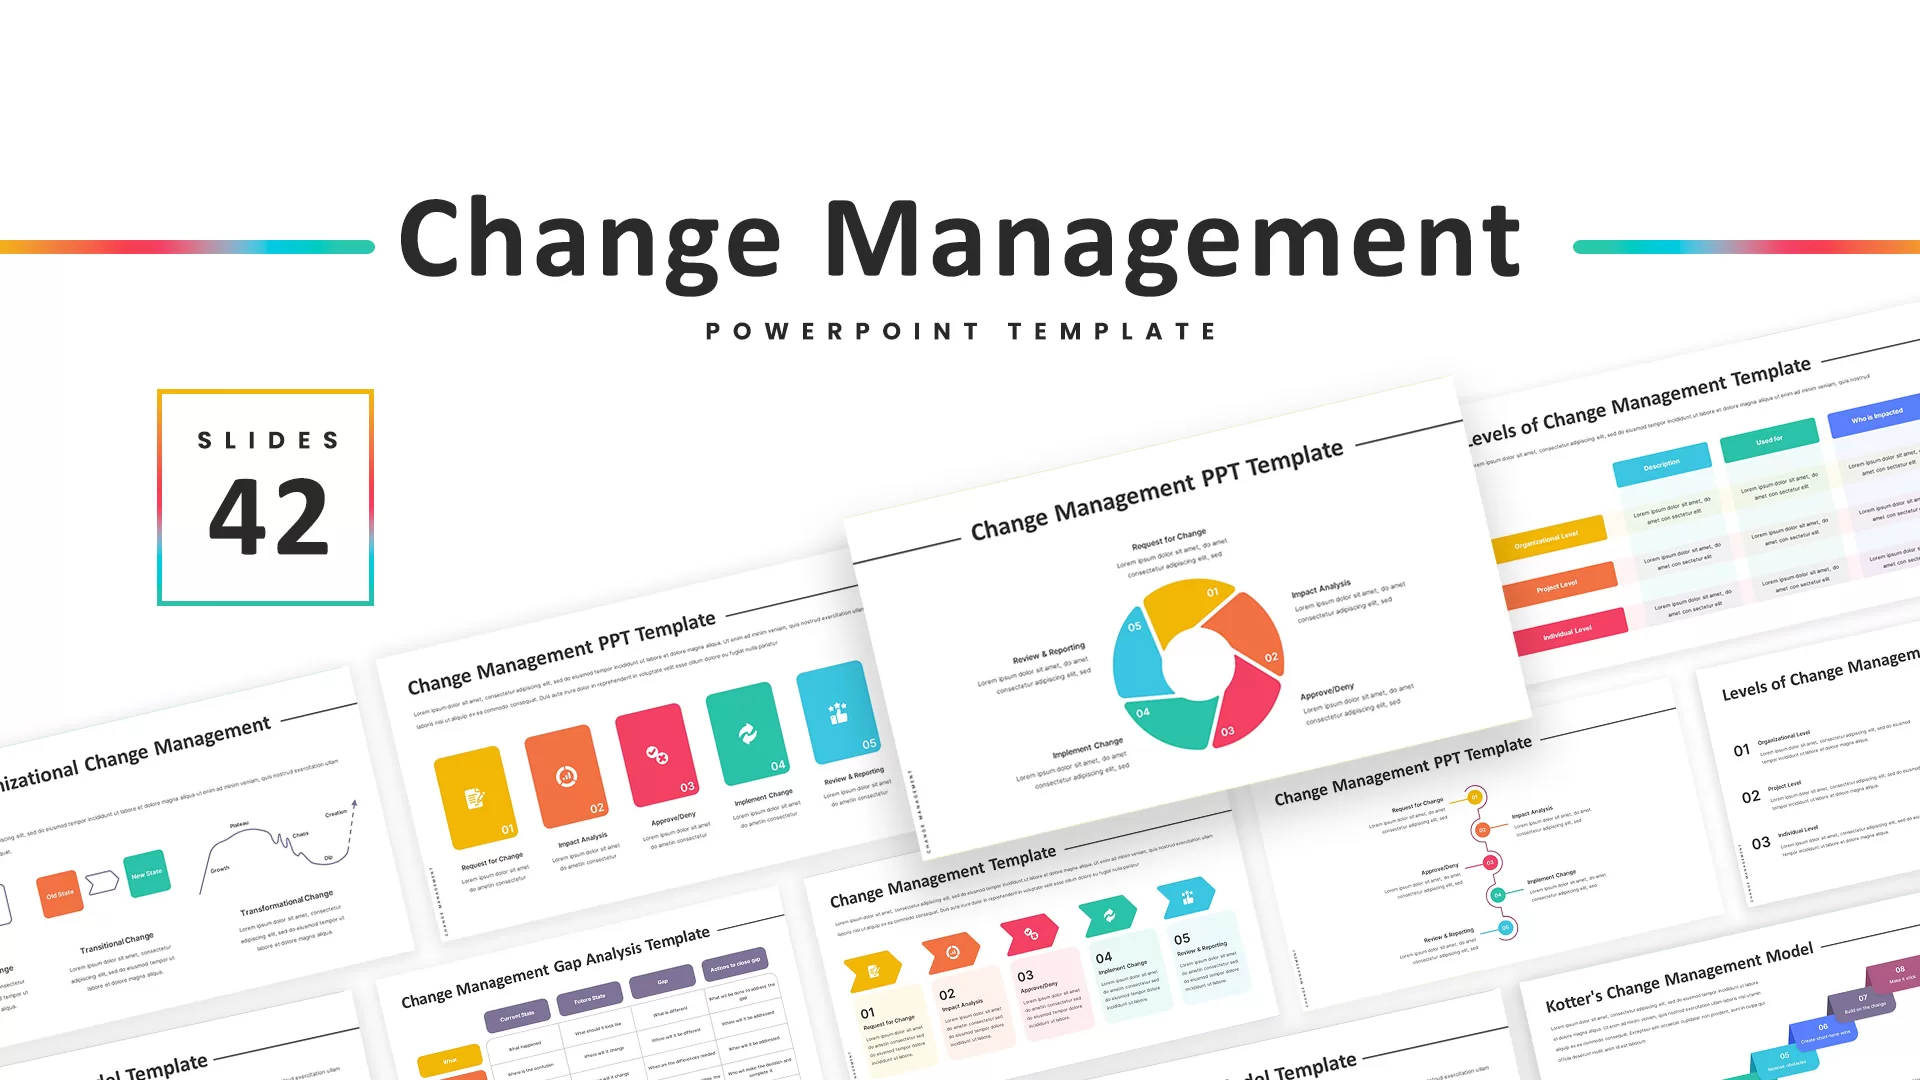
Change Management Infographic Deck Template for PowerPoint & Google Slides
Business Strategy
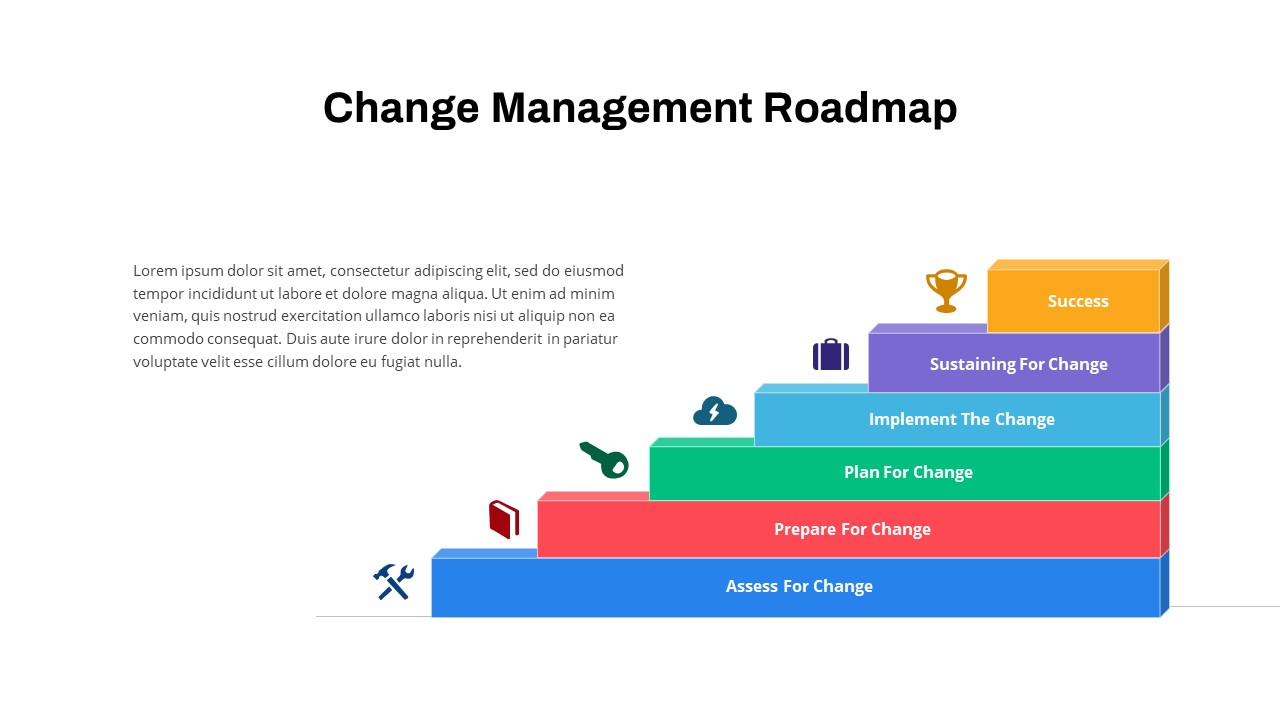
Colorful Change Management Roadmap Template for PowerPoint & Google Slides
Roadmap
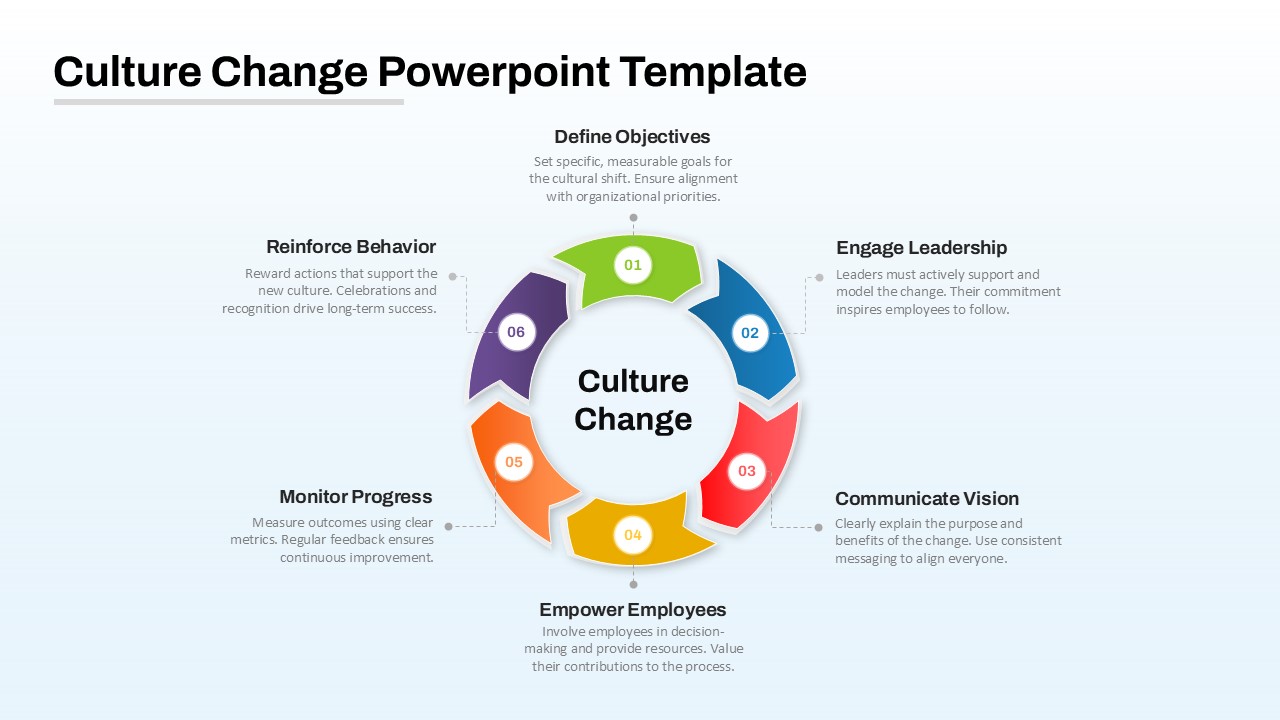
Culture Change Circular Process Diagram Template for PowerPoint & Google Slides
Process
Change Management Process Cycle Diagram Template for PowerPoint & Google Slides
Process

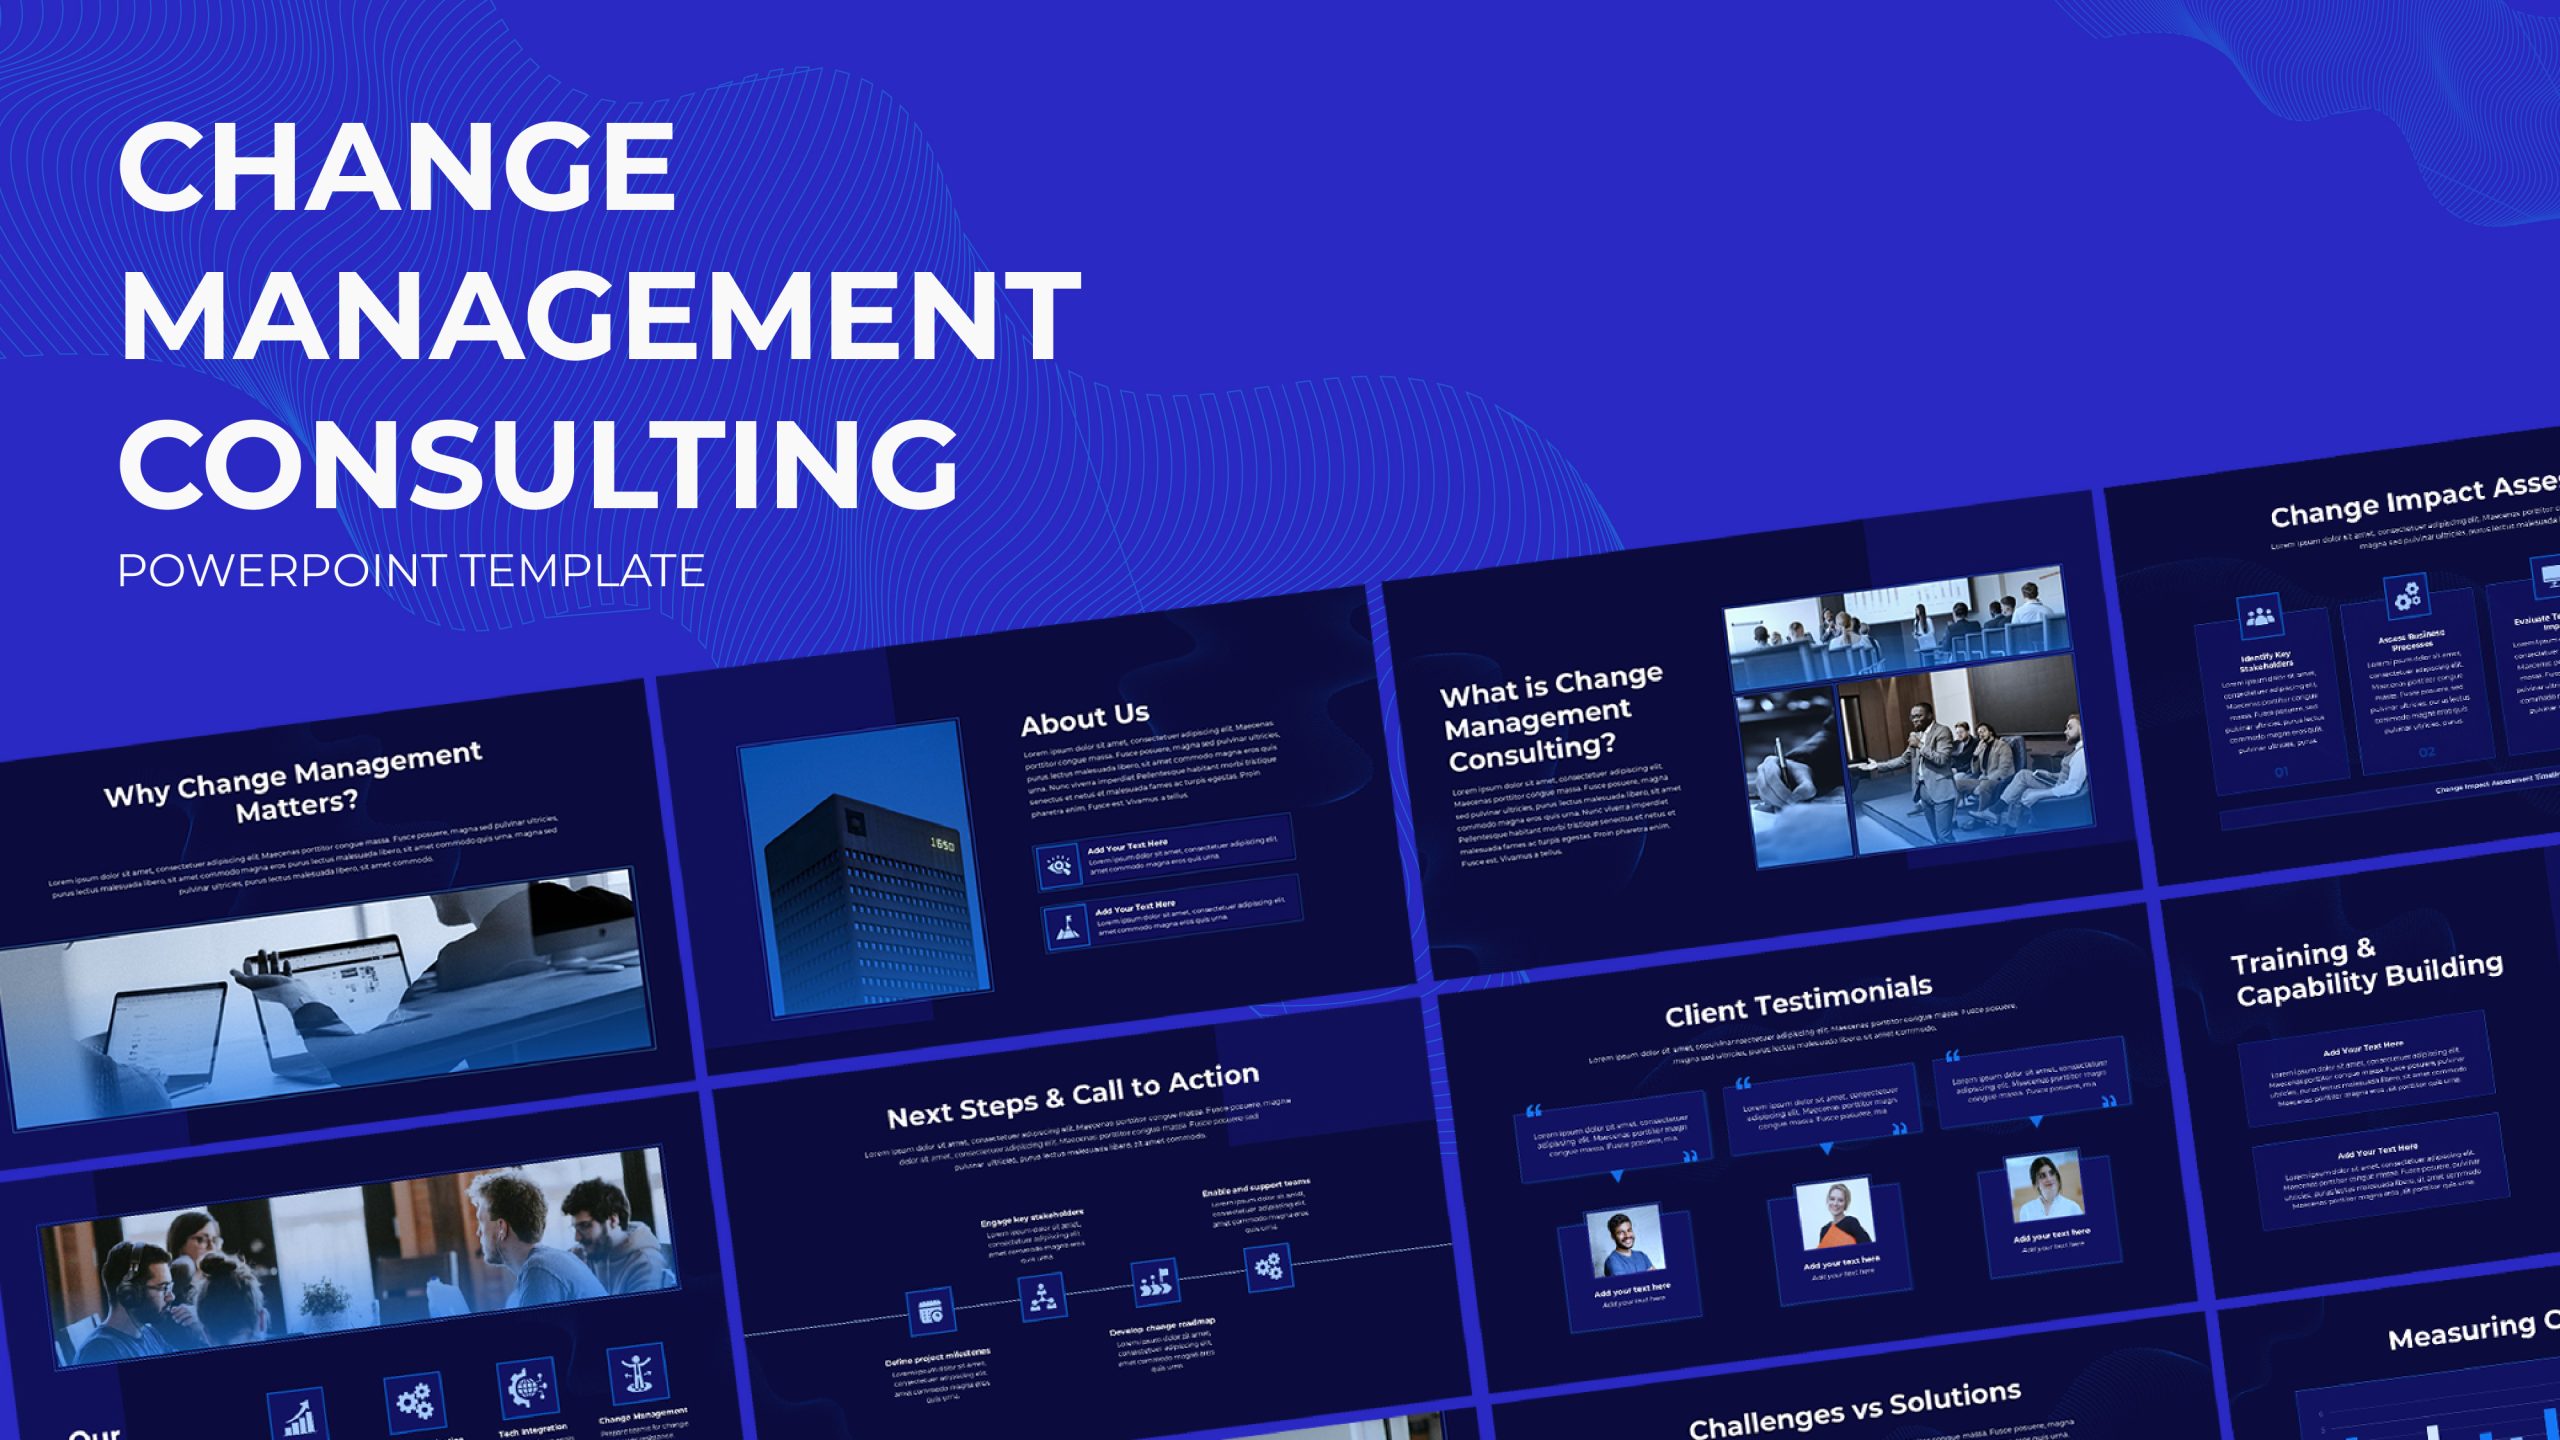
Change Management Consulting template for PowerPoint & Google Slides
Company Profile

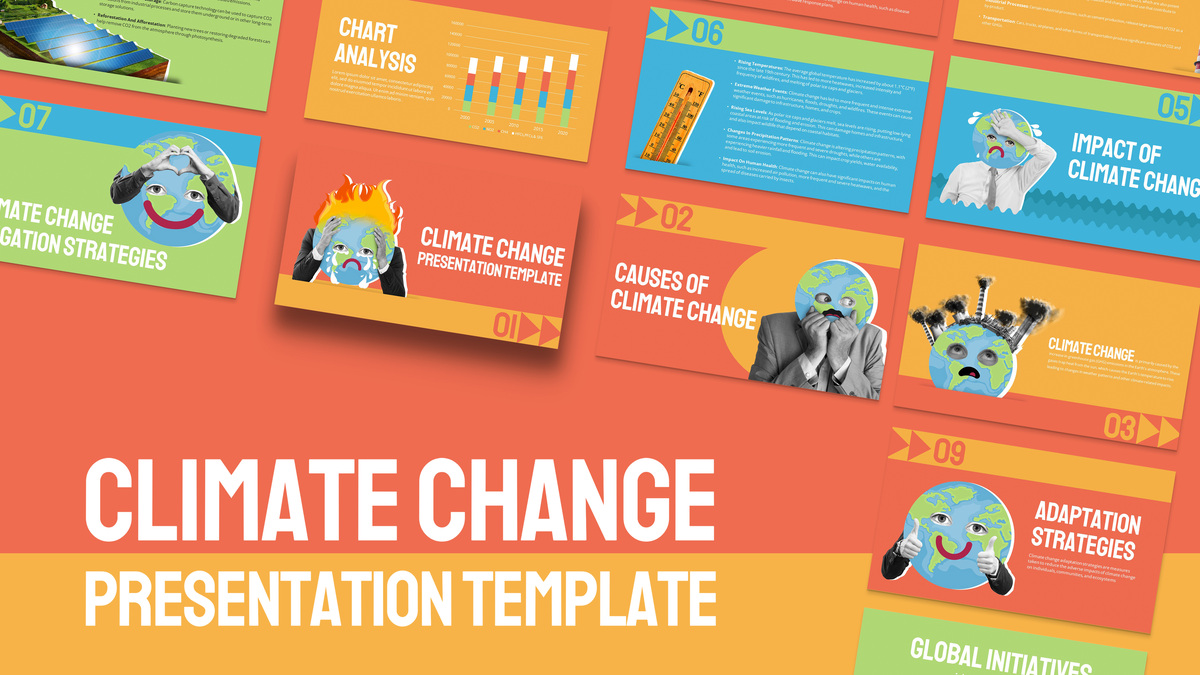
Free Climate Change Awareness Deck for PowerPoint & Google Slides
Decks
Free
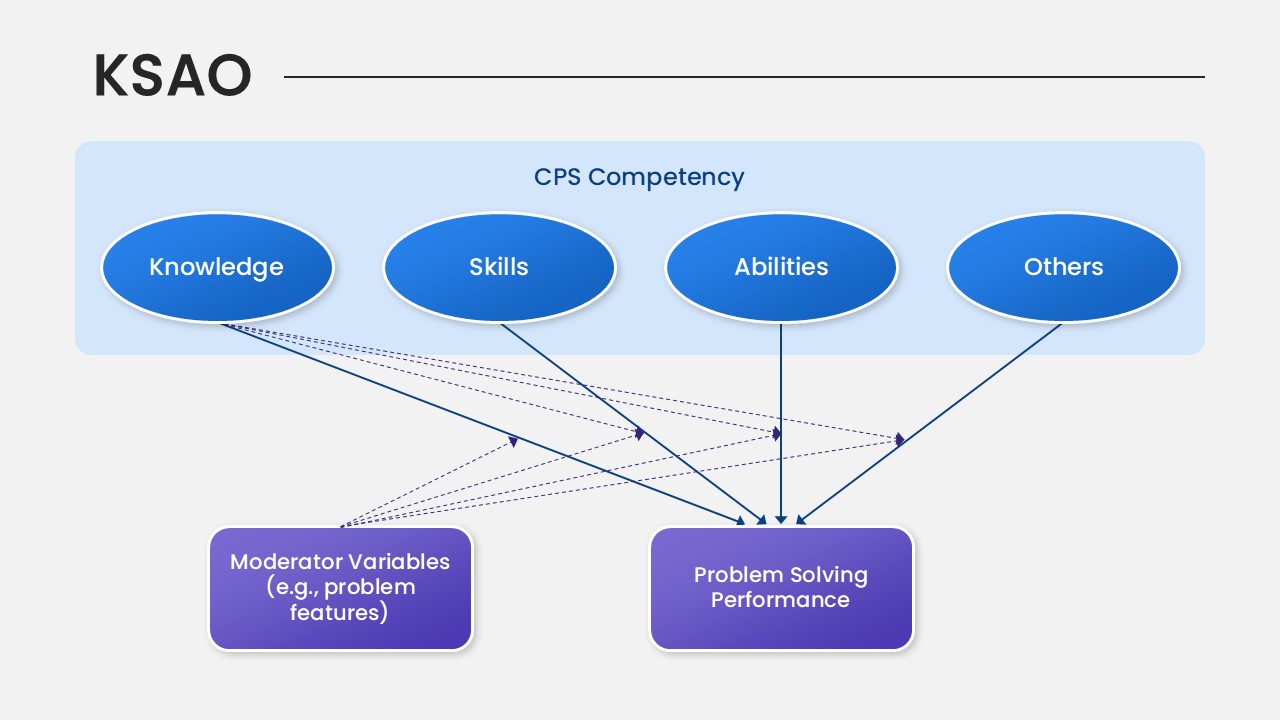
KSAO Model PowerPoint Template for PowerPoint & Google Slides
Business Strategy
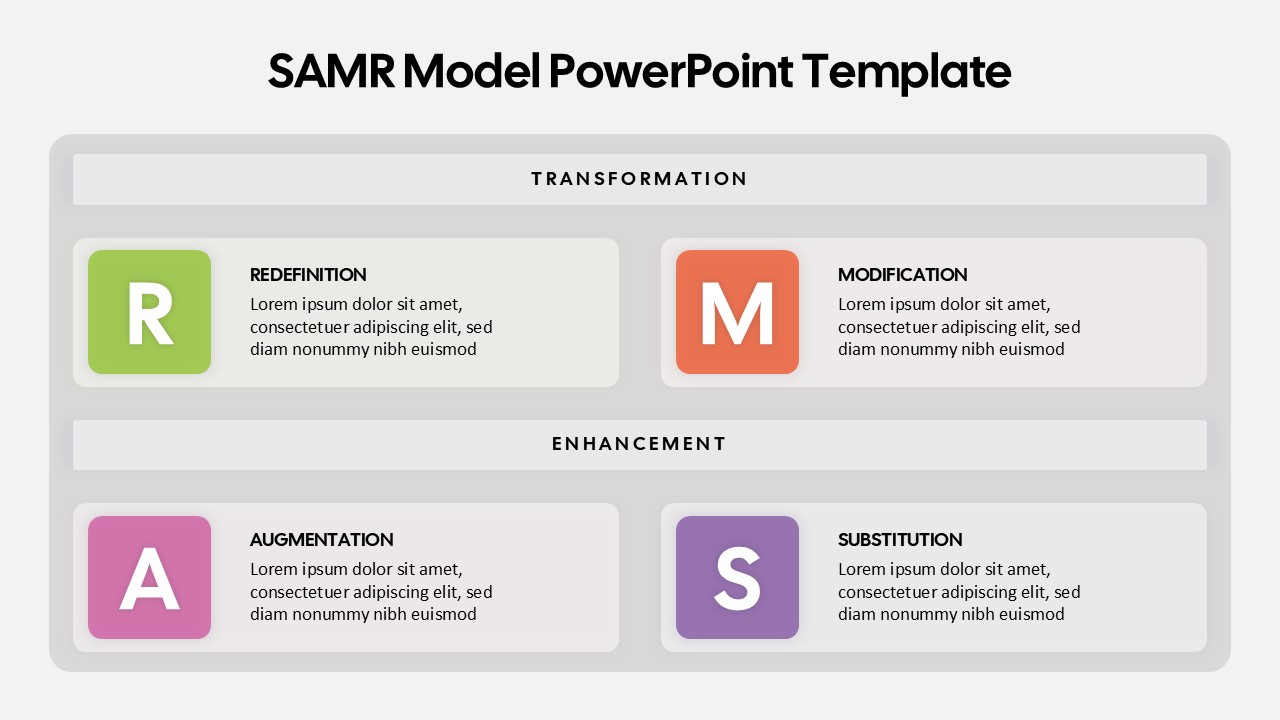
SAMR Model PowerPoint Template for PowerPoint & Google Slides
Business
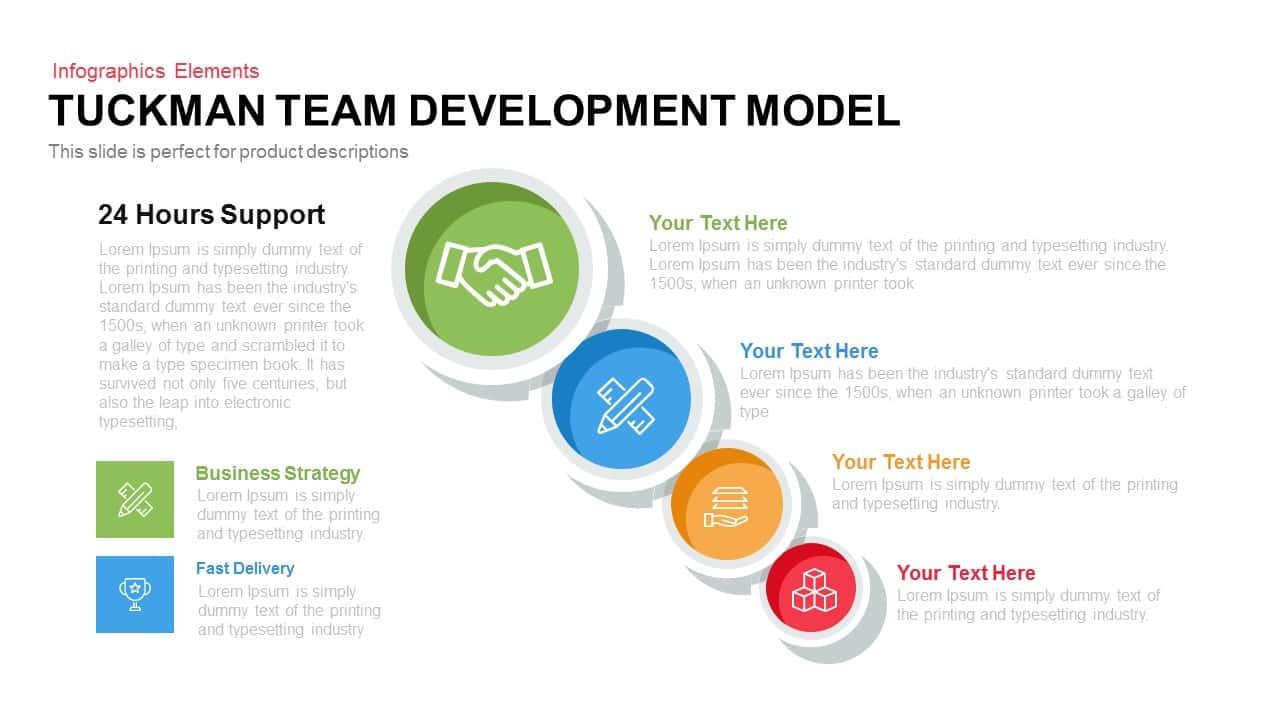
Tuckman Team Model Template for PowerPoint & Google Slides
Infographics
Ansoff Matrix Growth Strategy Model Template for PowerPoint & Google Slides
BCG
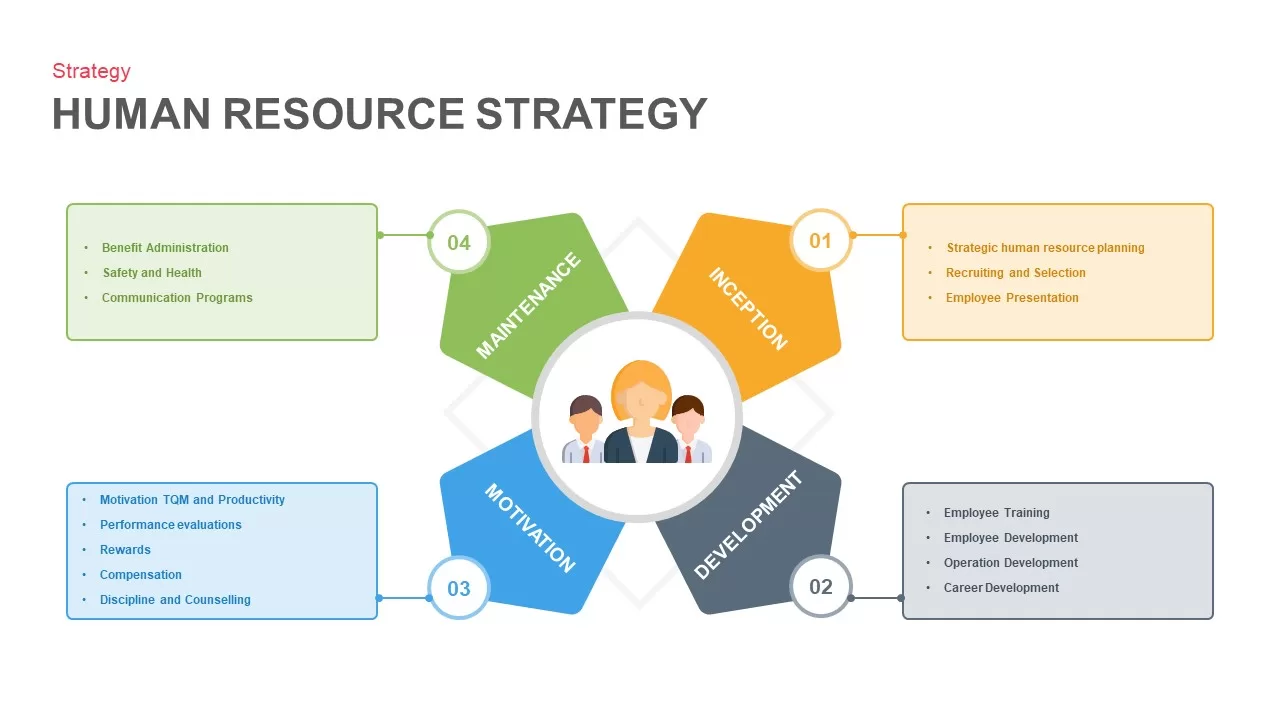
Human Resource Strategy Model Pack Template for PowerPoint & Google Slides
HR

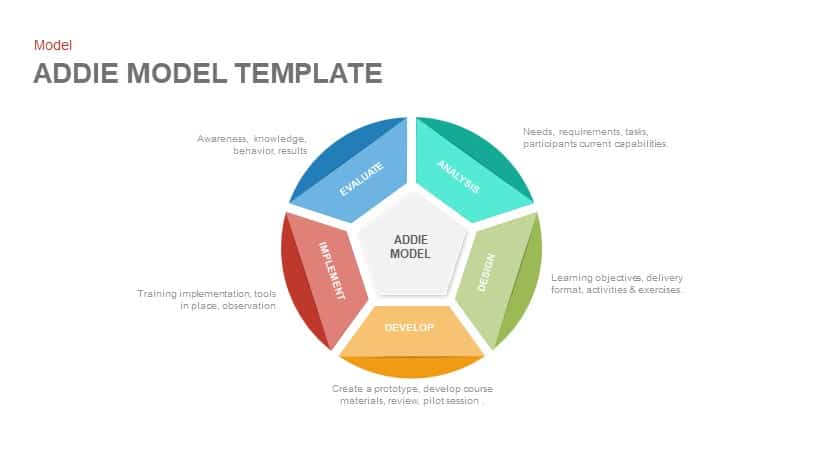
ADDIE Model Instructional Design Template for PowerPoint & Google Slides
Circular
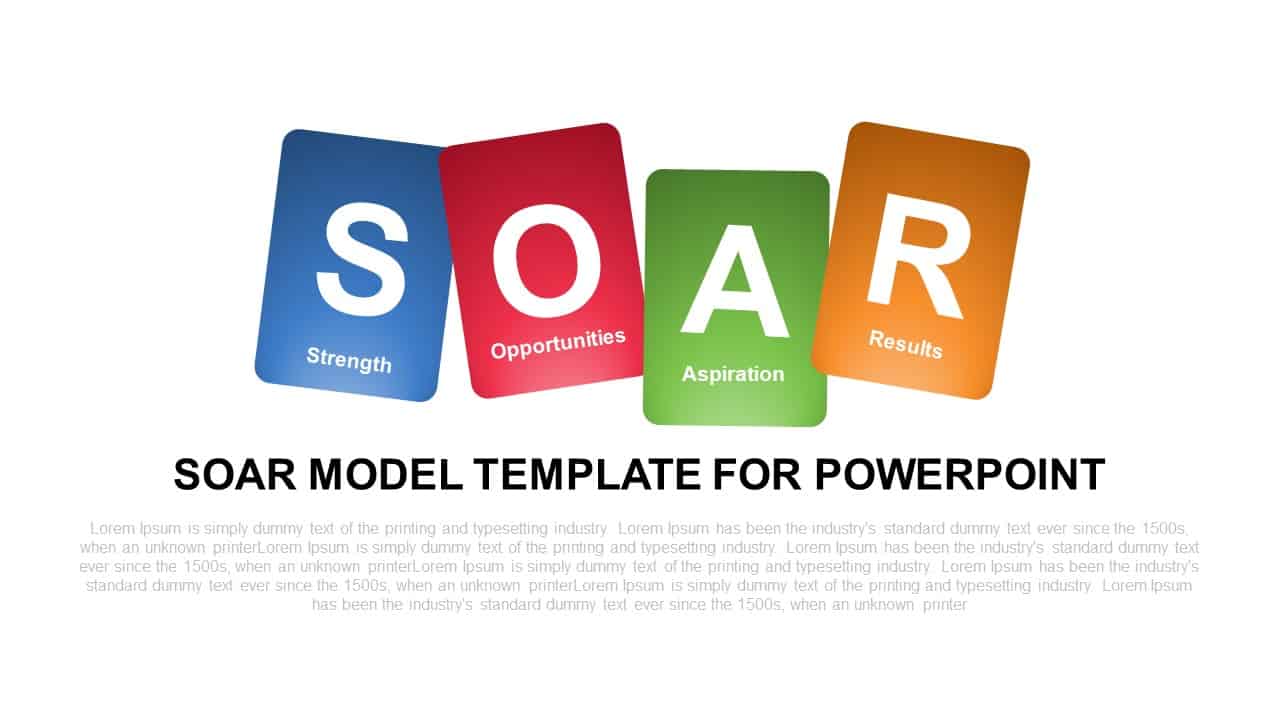
SOAR Strategic Model Card Diagram Template for PowerPoint & Google Slides
Process
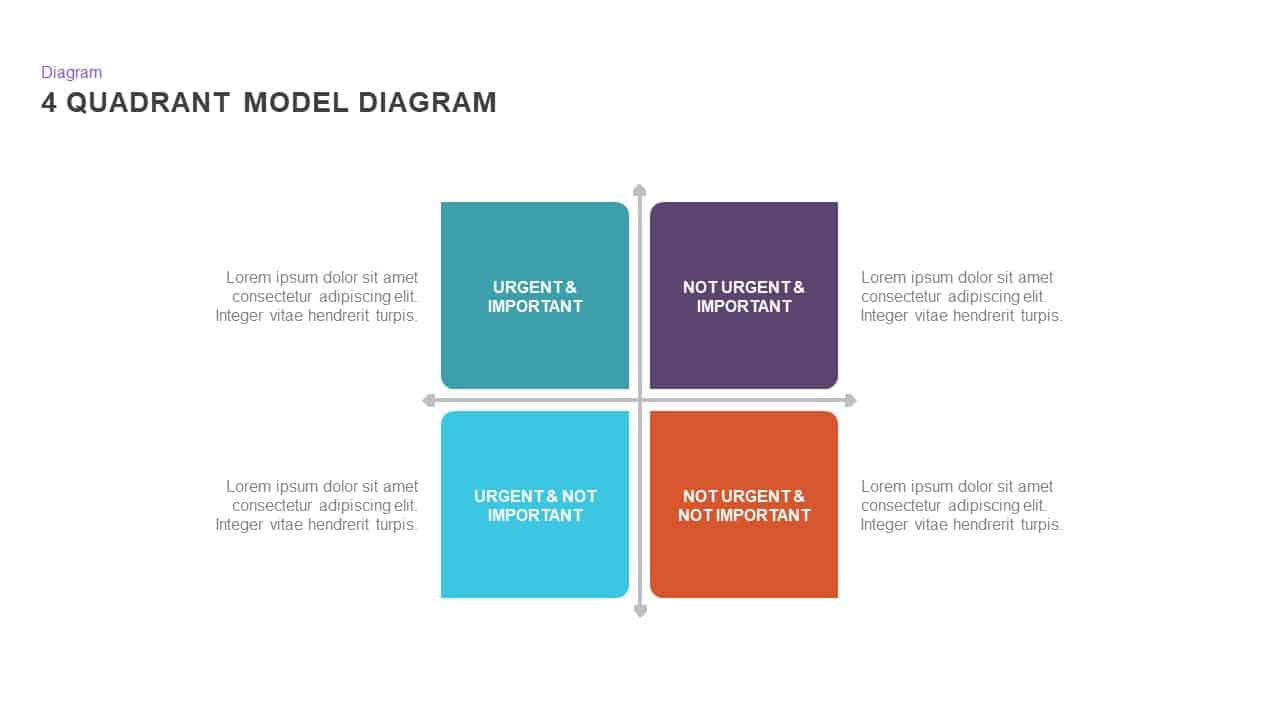
4 Quadrant Model Diagram template for PowerPoint & Google Slides
Process
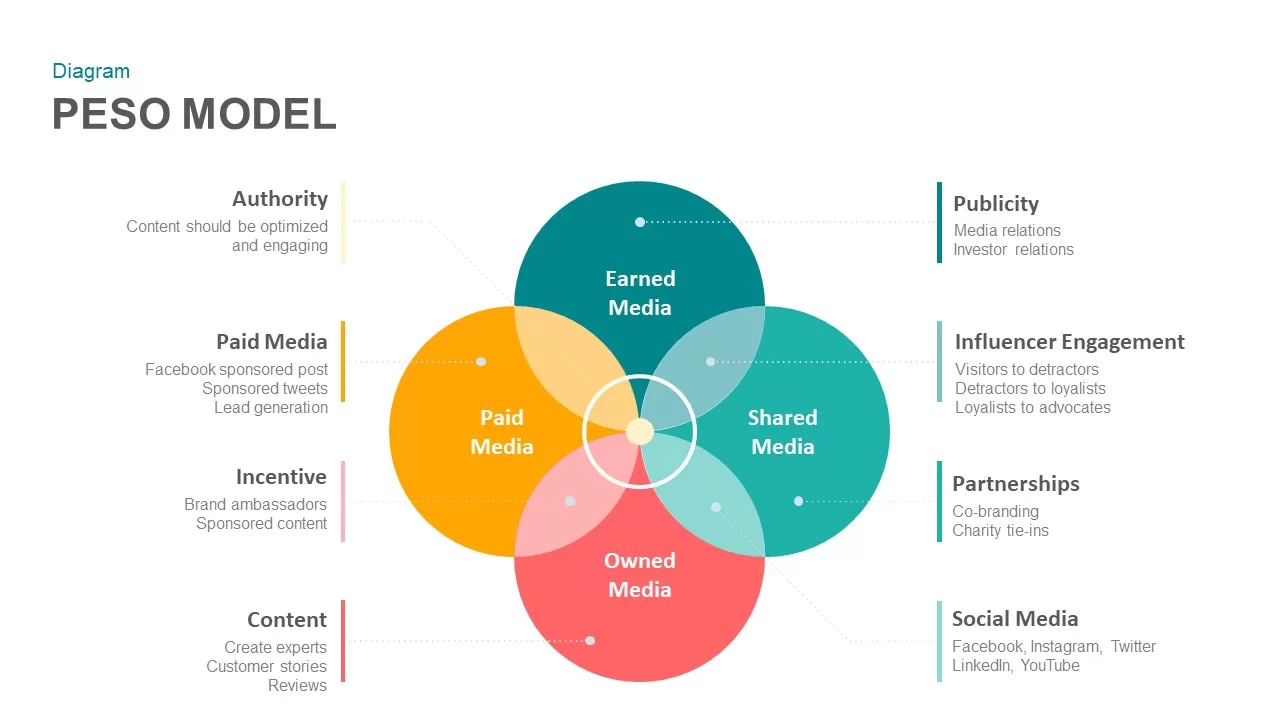
PESO Model Marketing Diagram Template for PowerPoint & Google Slides
Digital Marketing
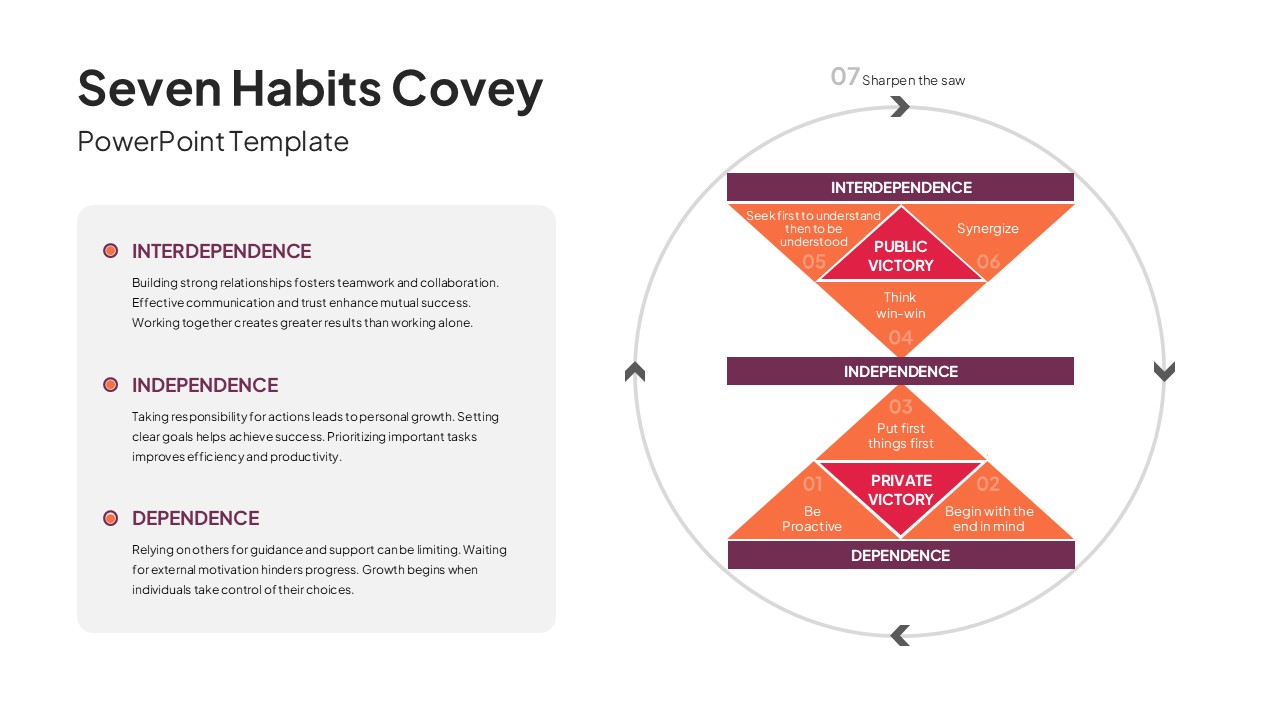
7 Habits of Highly Effective People Covey Model Template for PowerPoint & Google Slides
Leadership
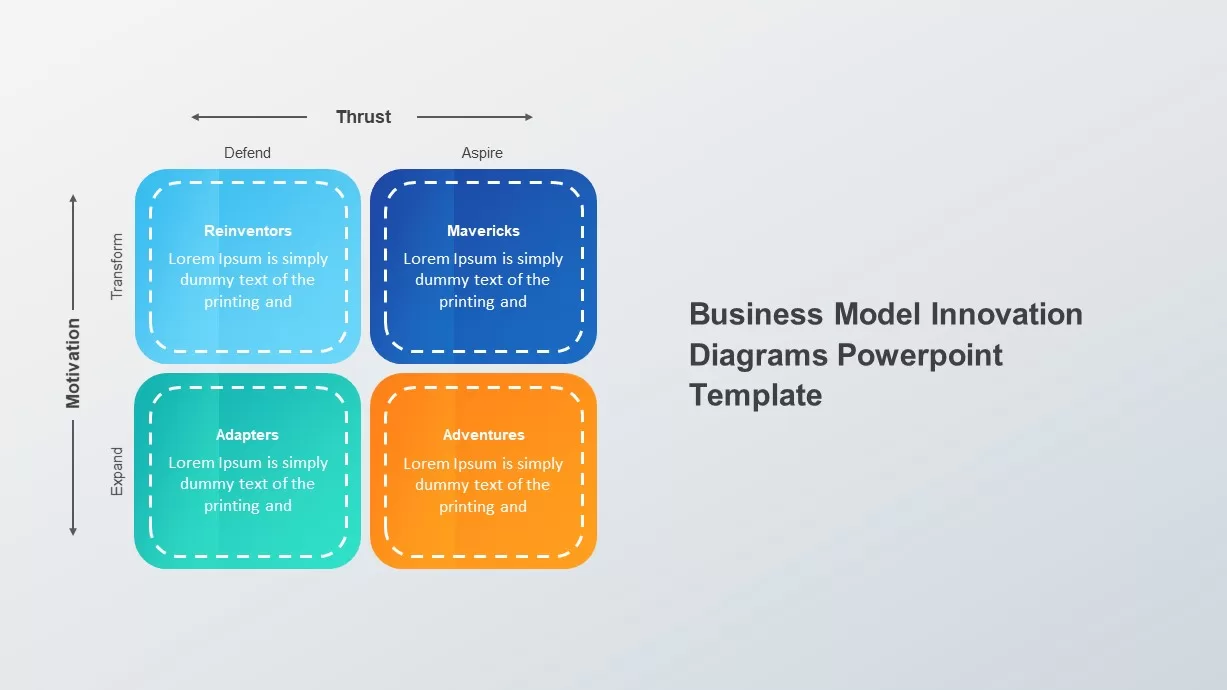
Business Model Innovation Diagrams template for PowerPoint & Google Slides
Process
Four-Phase Maturity Model Diagram Template for PowerPoint & Google Slides
Process
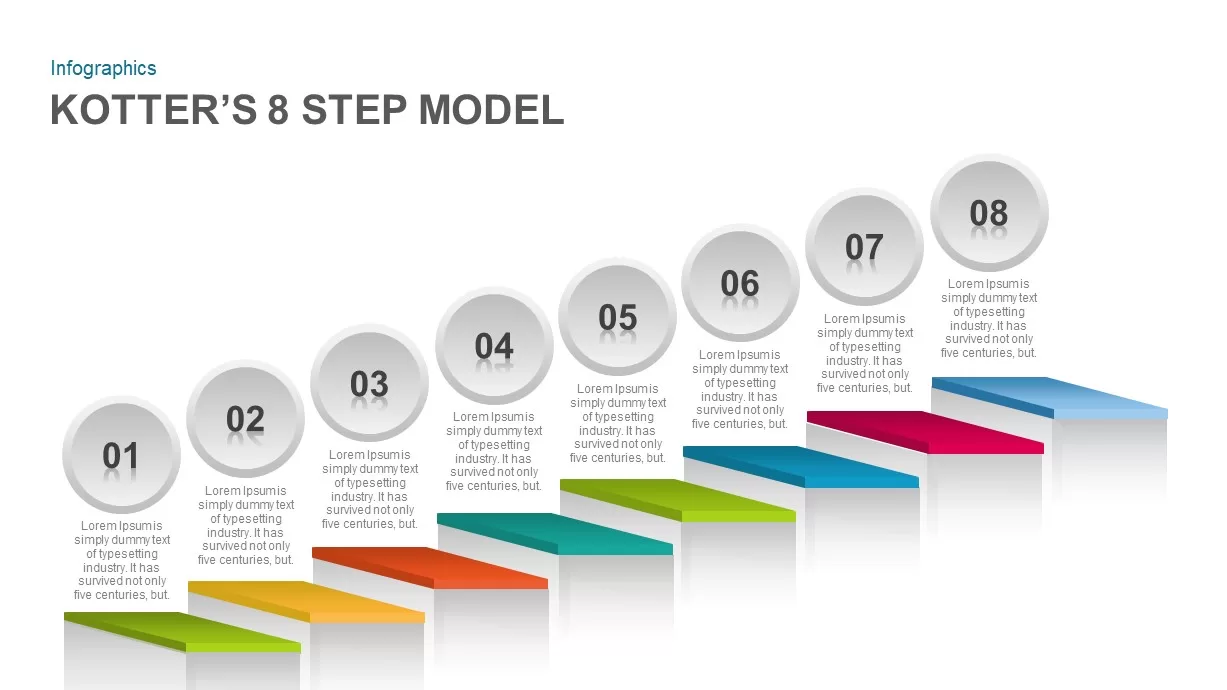
Kotter’s 8-Step Model Infographic Template for PowerPoint & Google Slides
Process
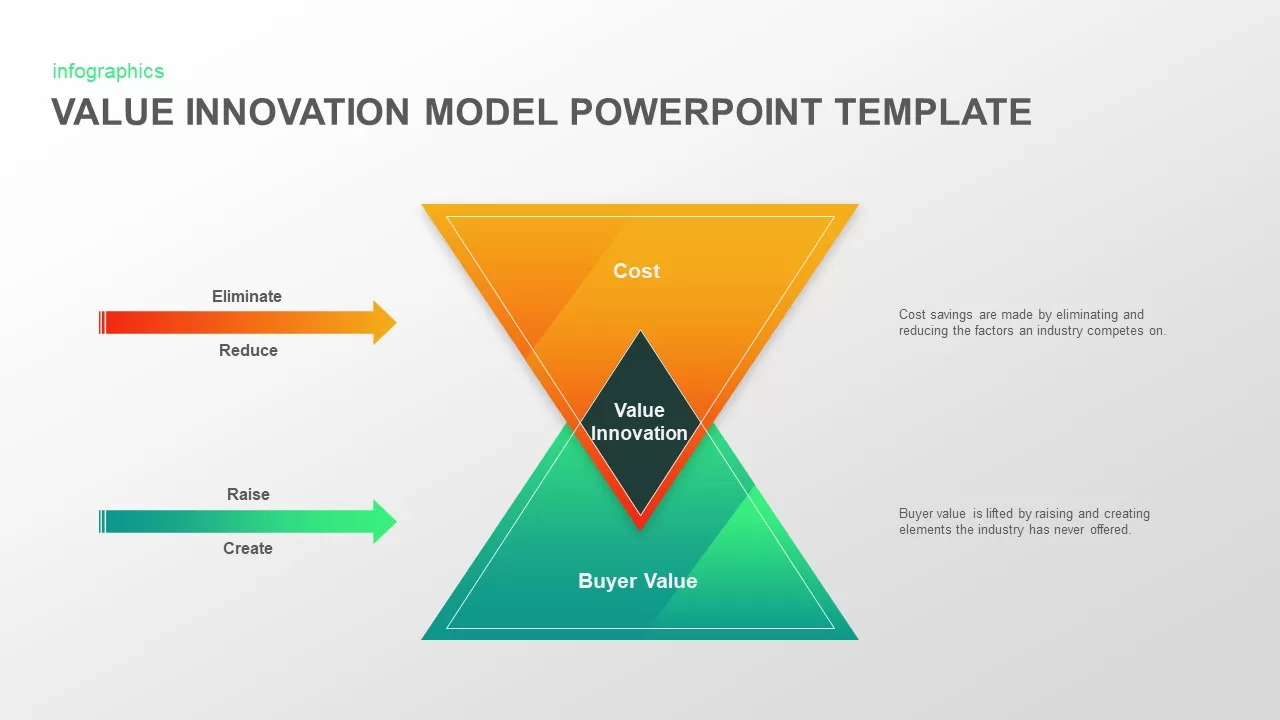
Value Innovation Model PowerPoint & Google Slides Template for Presentations
Business Proposal
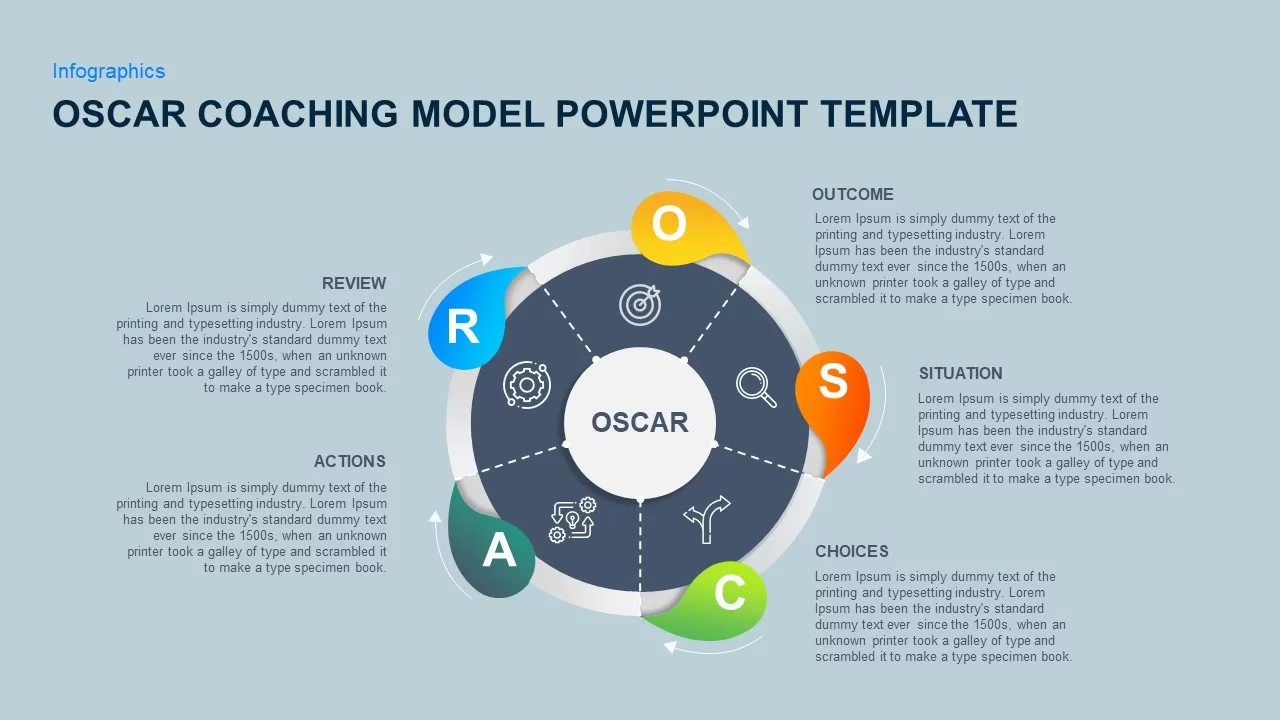
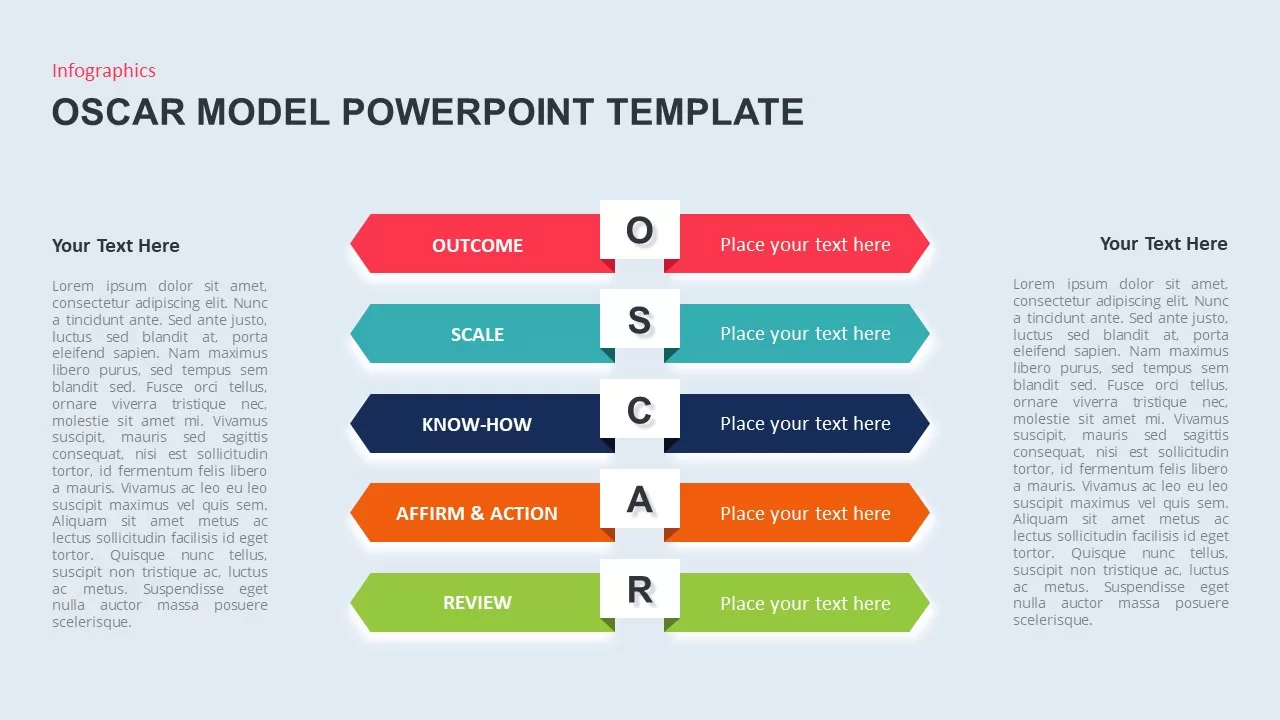
OSCAR Coaching Model Template for PowerPoint & Google Slides
Business Models
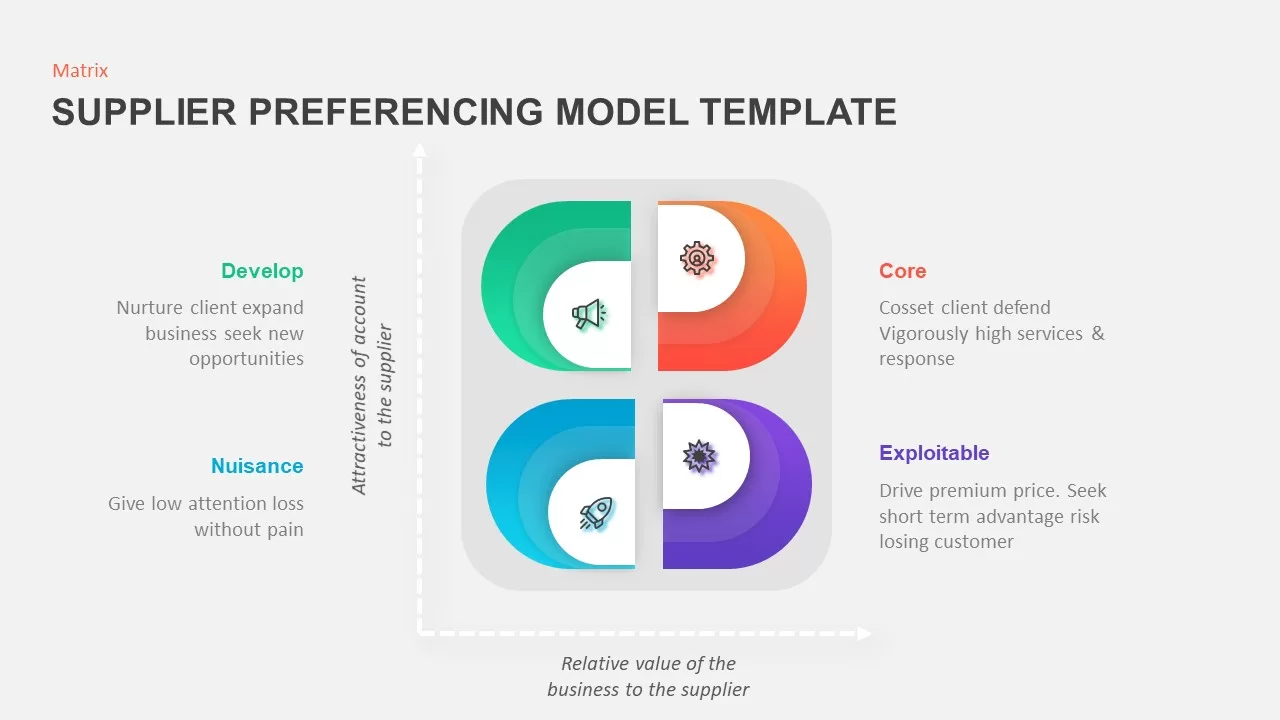
Supplier Preferencing Model Matrix Template for PowerPoint & Google Slides
Business Strategy
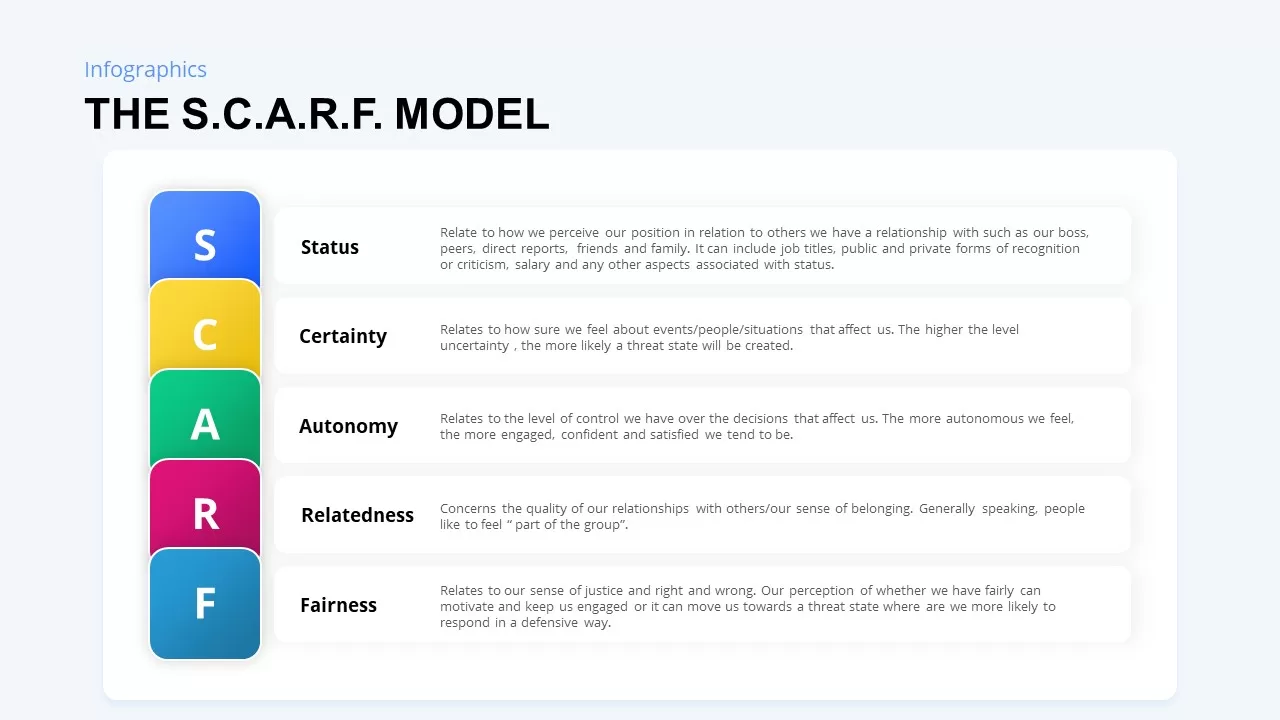
SCARF Model Social Threats & Rewards Template for PowerPoint & Google Slides
Business Strategy
OSCAR Behavior Model Infographic Template for PowerPoint & Google Slides
HR
DIKW Data to Wisdom Pyramid Model Template for PowerPoint & Google Slides
Pyramid
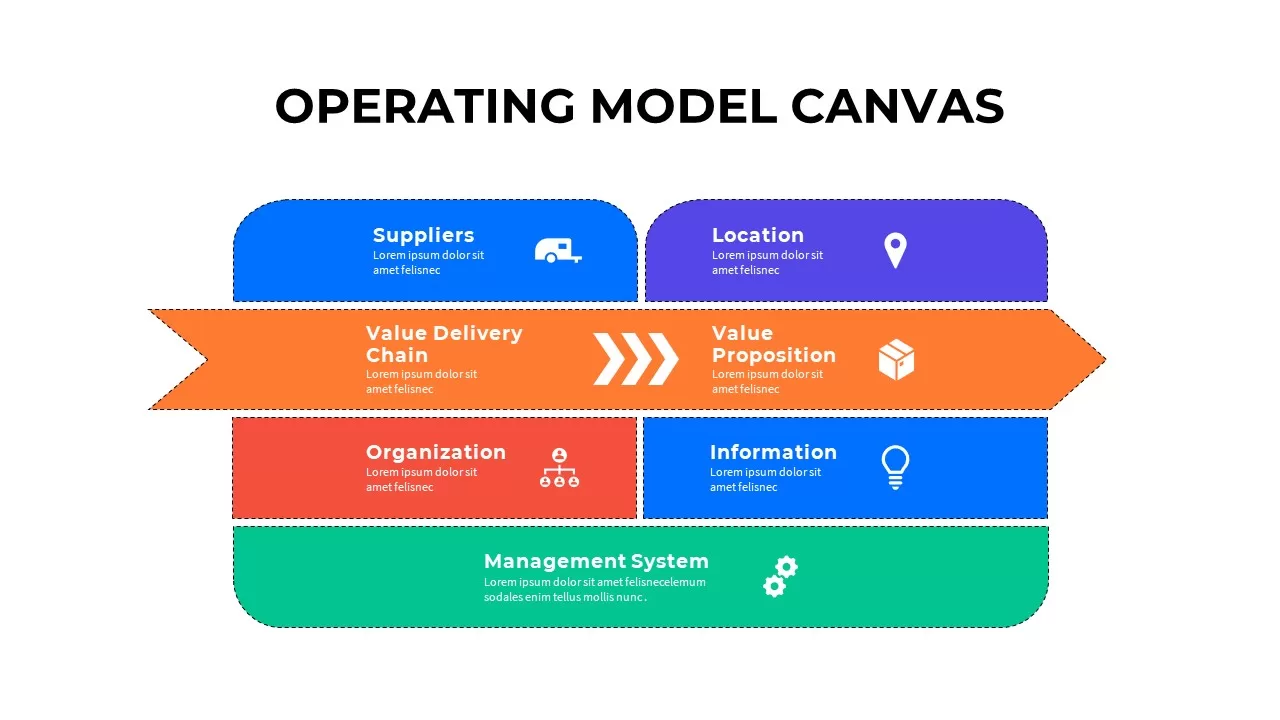
Operating Model Canvas Infographic Template for PowerPoint & Google Slides
Business Models
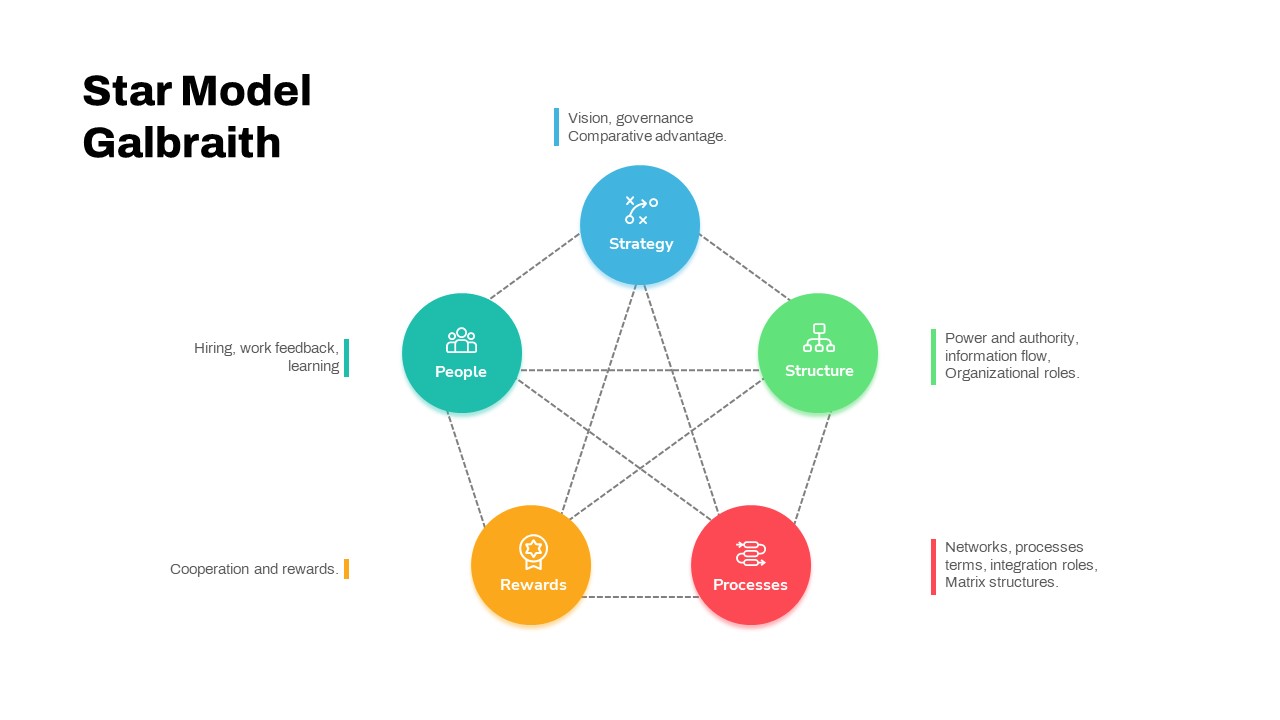
Star Model Galbraith Framework Template for PowerPoint & Google Slides
Business Strategy
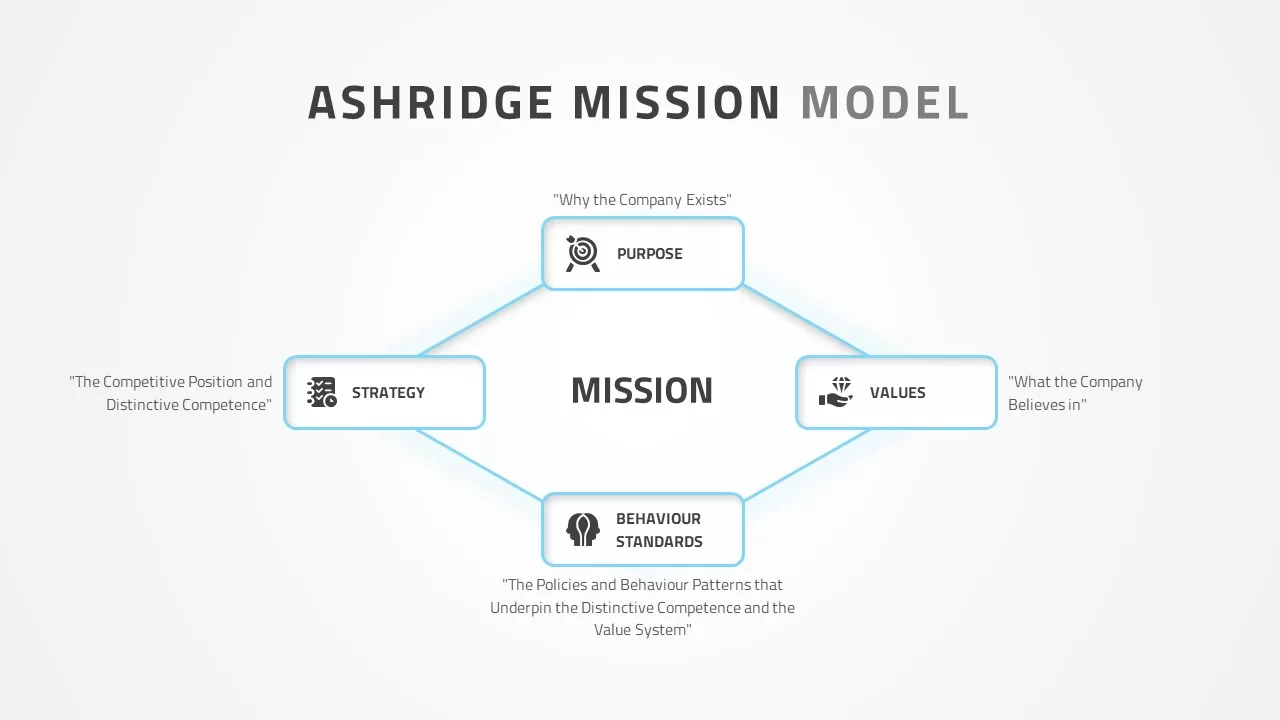
Ashridge Mission Model template for PowerPoint & Google Slides
Competitor Analysis
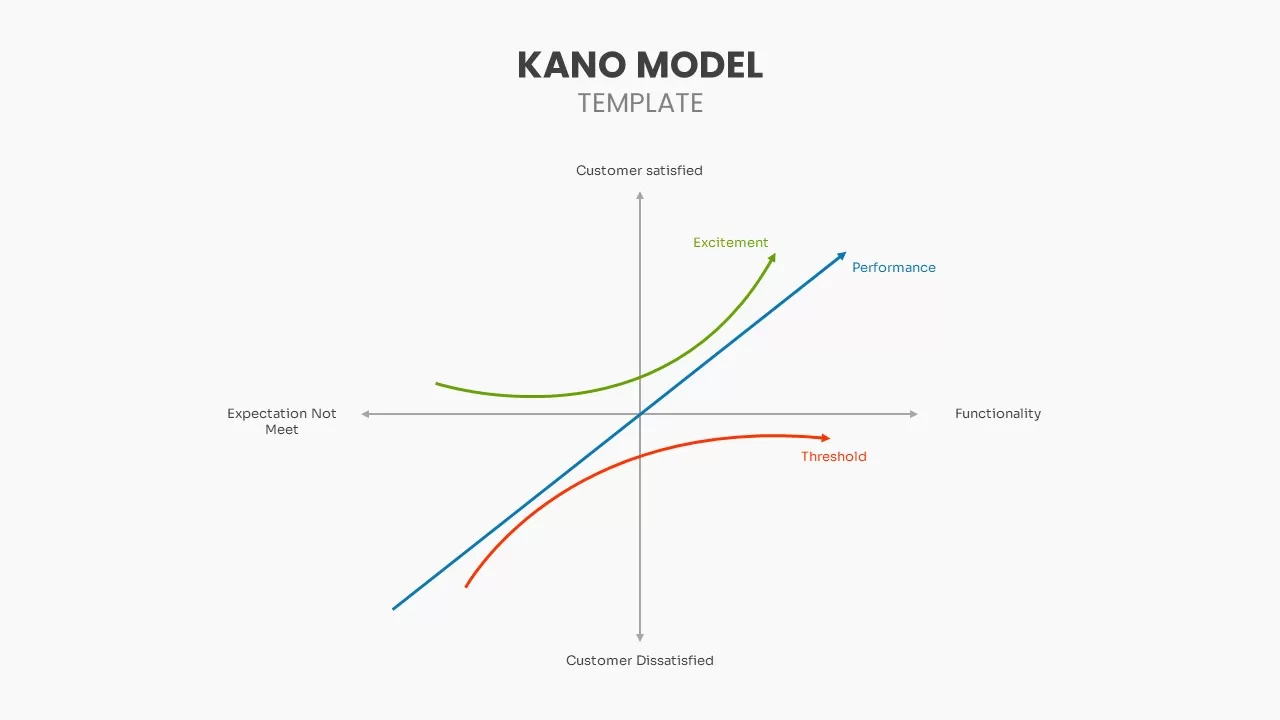
Kano Model template for PowerPoint & Google Slides
Business Strategy
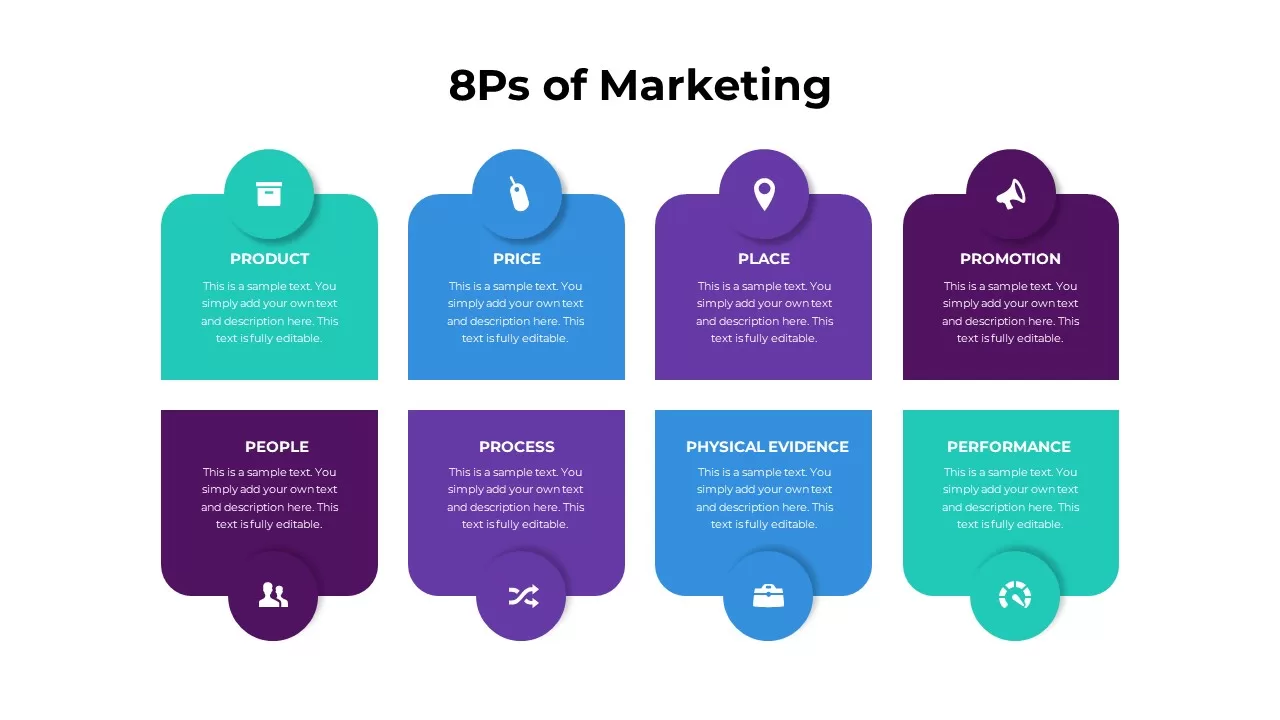
8Ps of Marketing Model Infographic Template for PowerPoint & Google Slides
Marketing
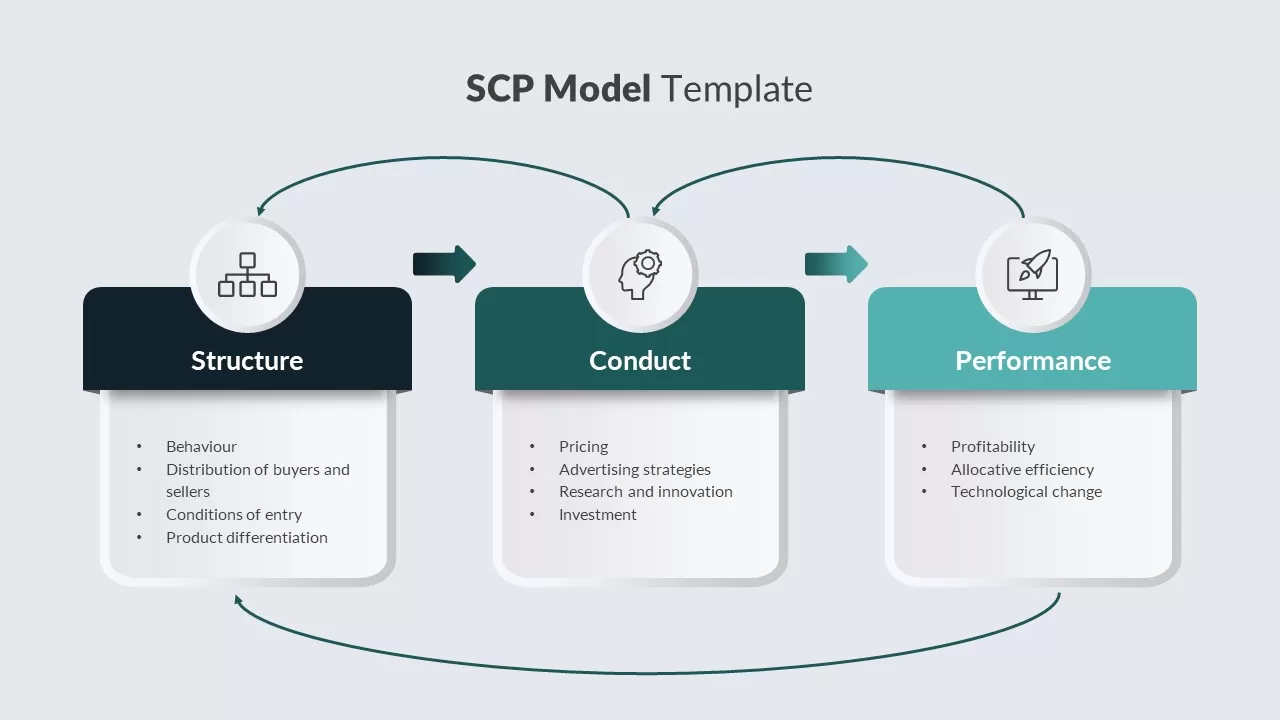
SCP Model Template for PowerPoint & Google Slides
Process
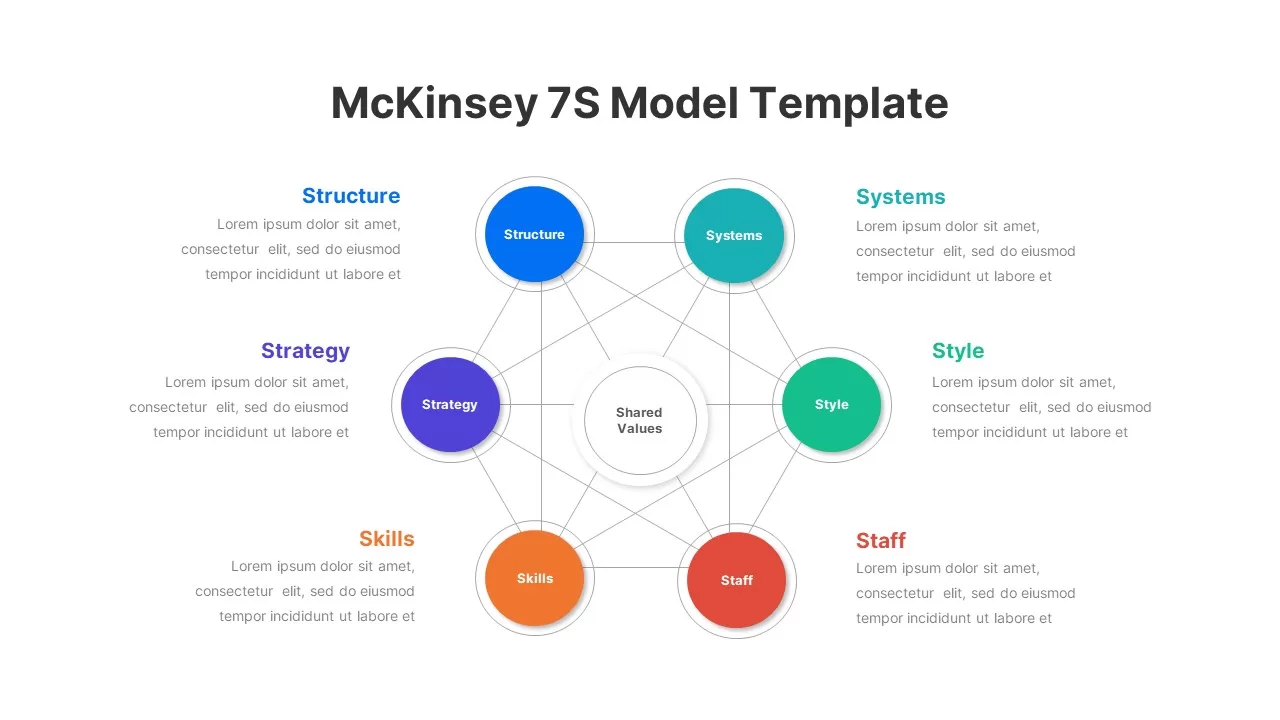
McKinsey 7S Model Strategic Alignment Template for PowerPoint & Google Slides
Circular
Five-Stage Digital Maturity Model Diagram Template for PowerPoint & Google Slides
Process
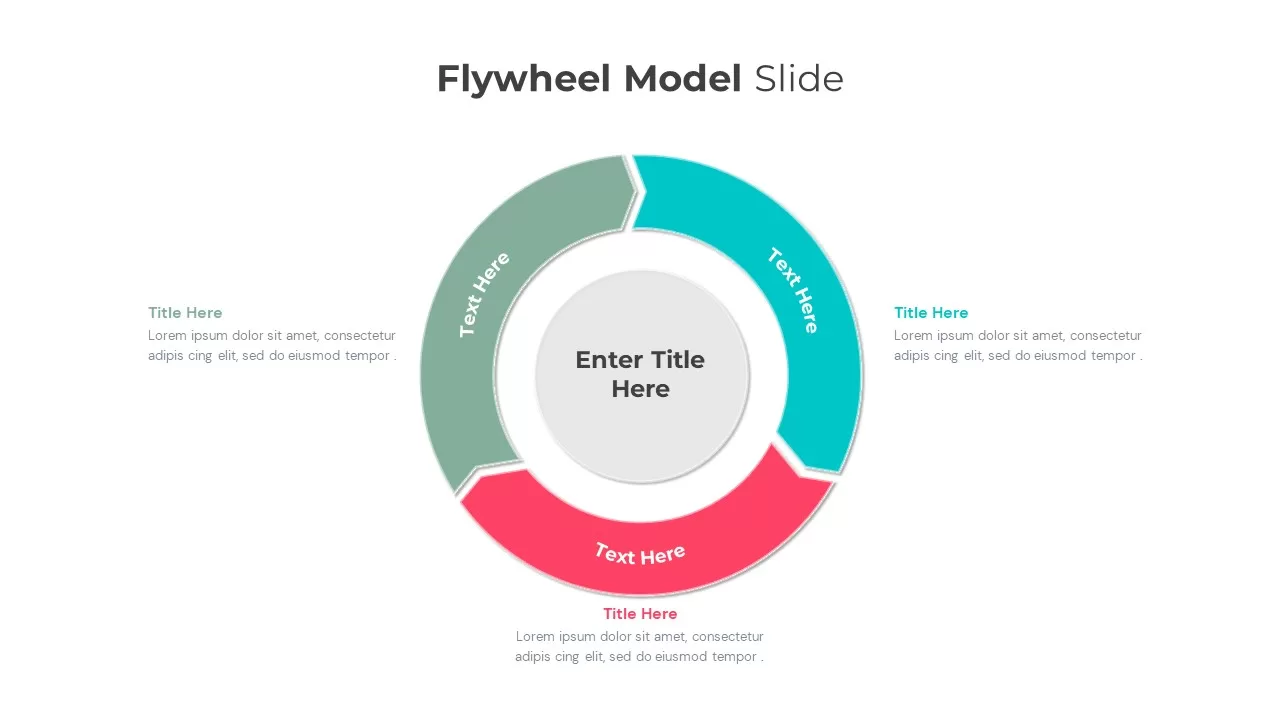
Flywheel Model Infographic Template for PowerPoint & Google Slides
Process
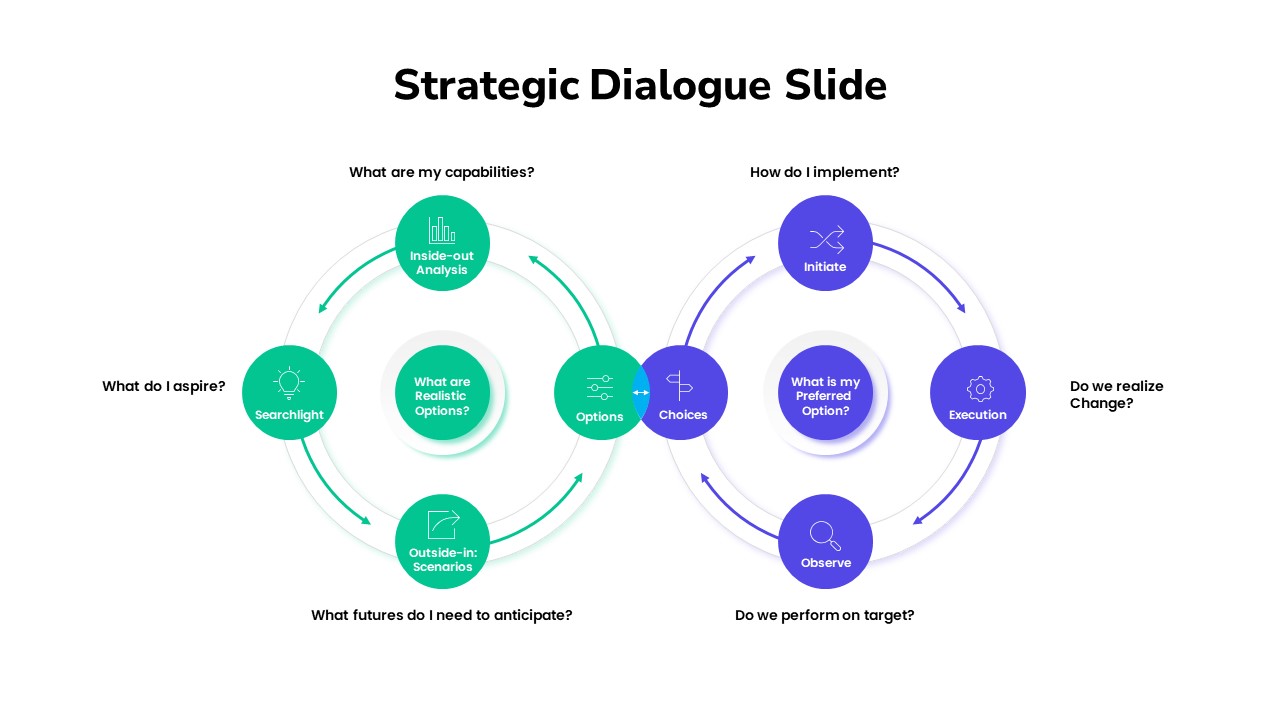
Strategic Dialogue Model Cycle Template for PowerPoint & Google Slides
Circular
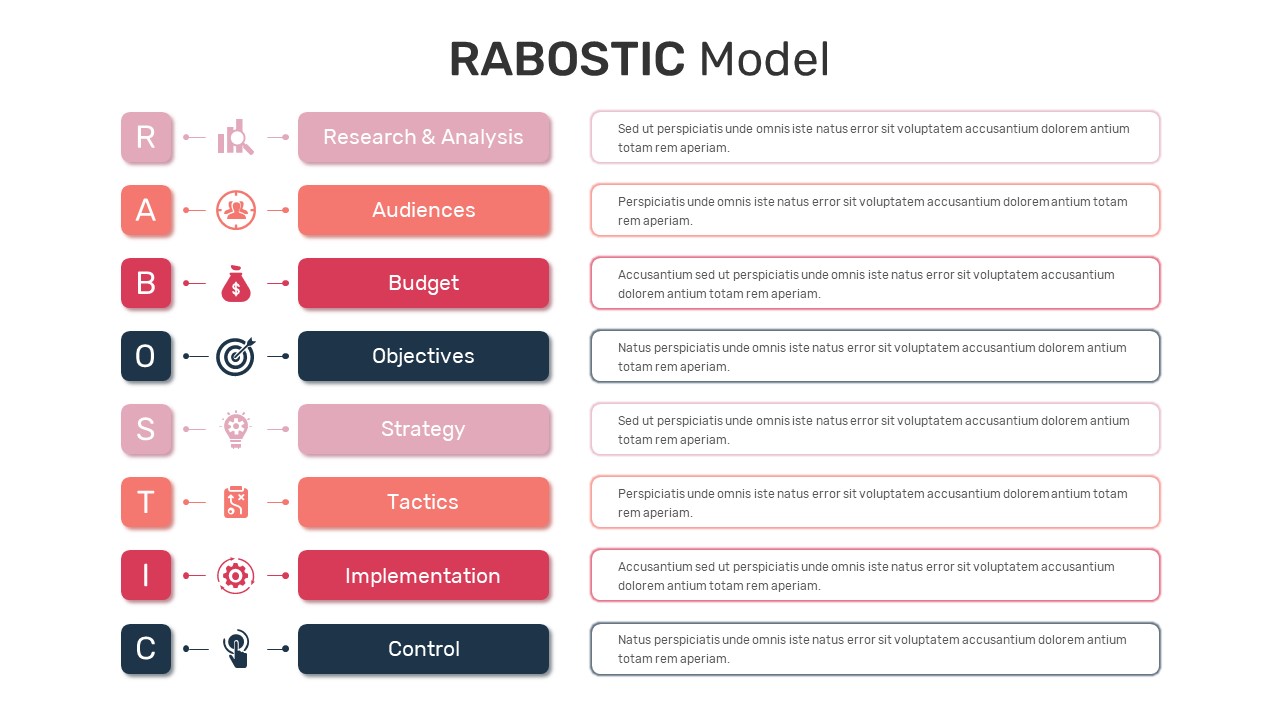
RABOSTIC Marketing Model Process Diagram Template for PowerPoint & Google Slides
Process
Organizational Maturity Model Diagram Template for PowerPoint & Google Slides
Process
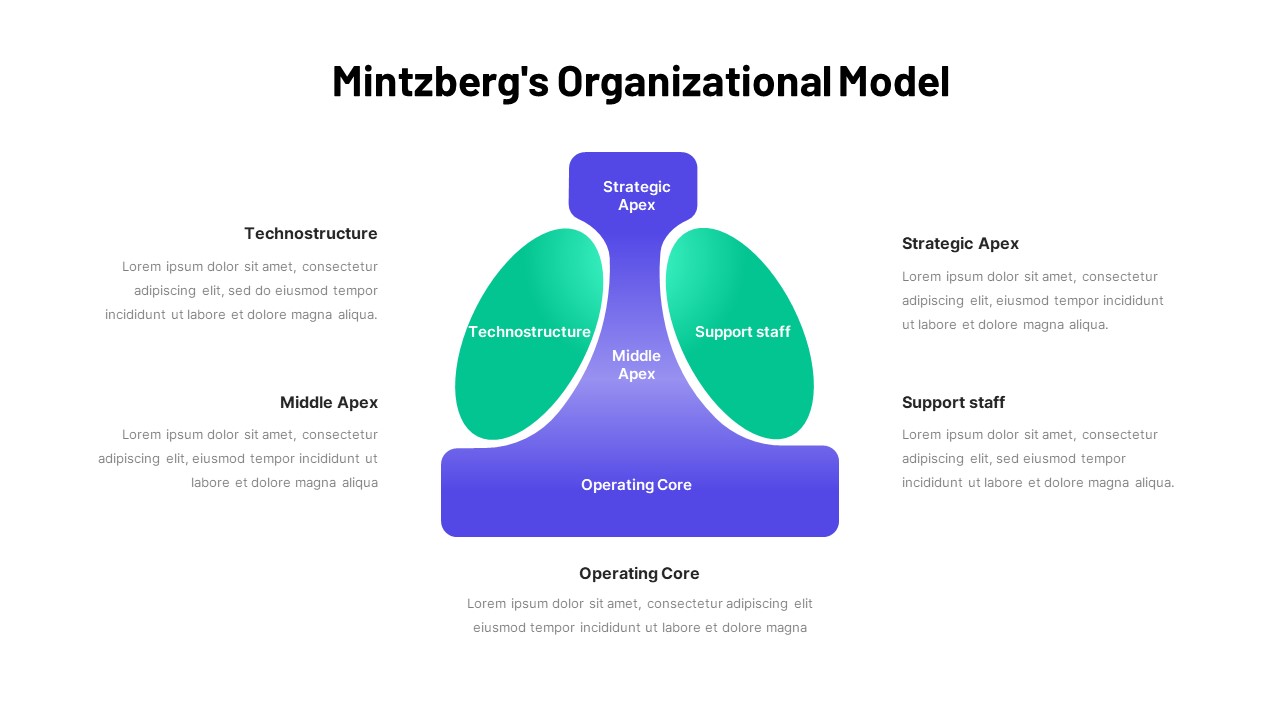
Mintzberg Organizational Model Gradient Template for PowerPoint & Google Slides
Business
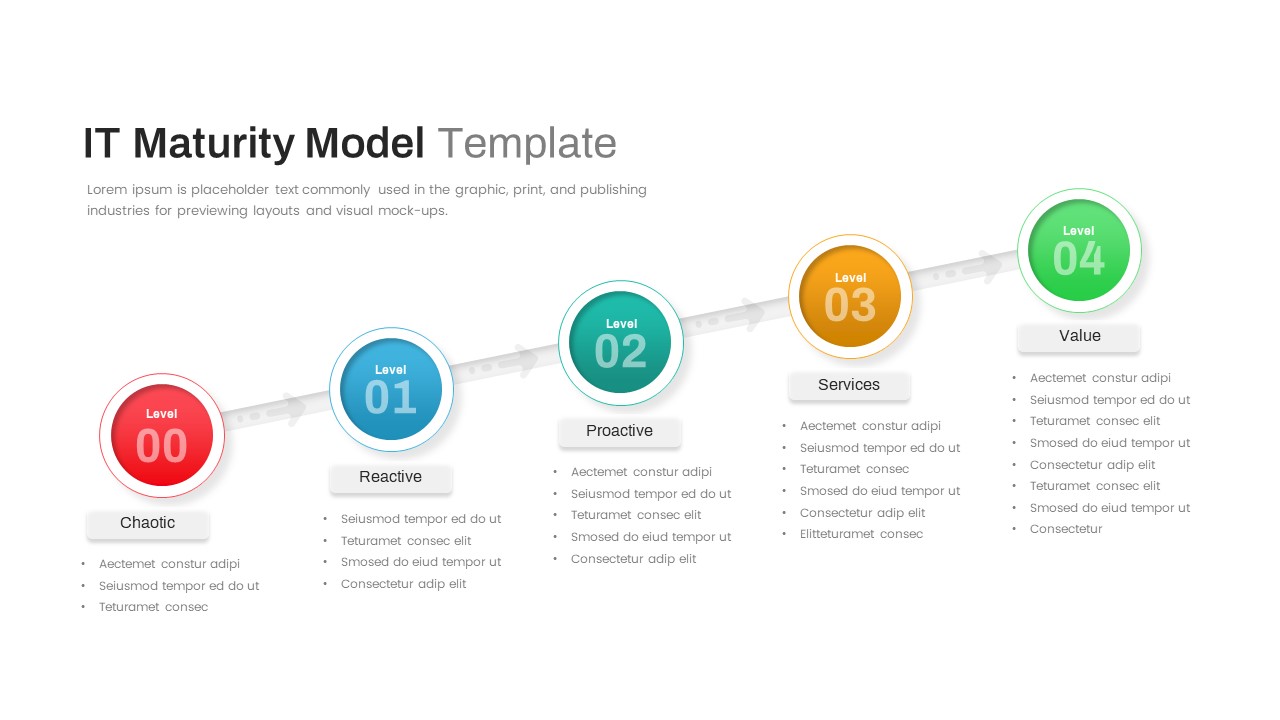
IT Maturity Model with Five Stages Template for PowerPoint & Google Slides
Timeline
Layered Data Governance Maturity Model Template for PowerPoint & Google Slides
Process
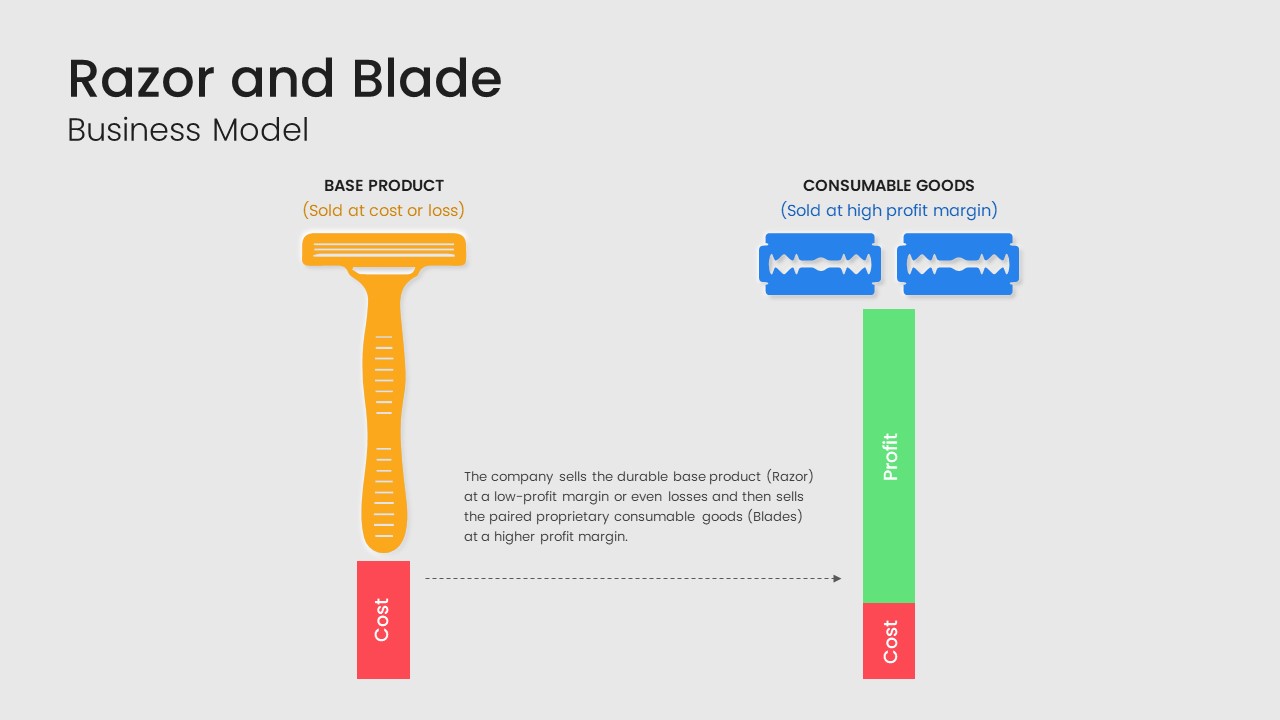
Razor and Blade Business Model Diagram Template for PowerPoint & Google Slides
Business Models
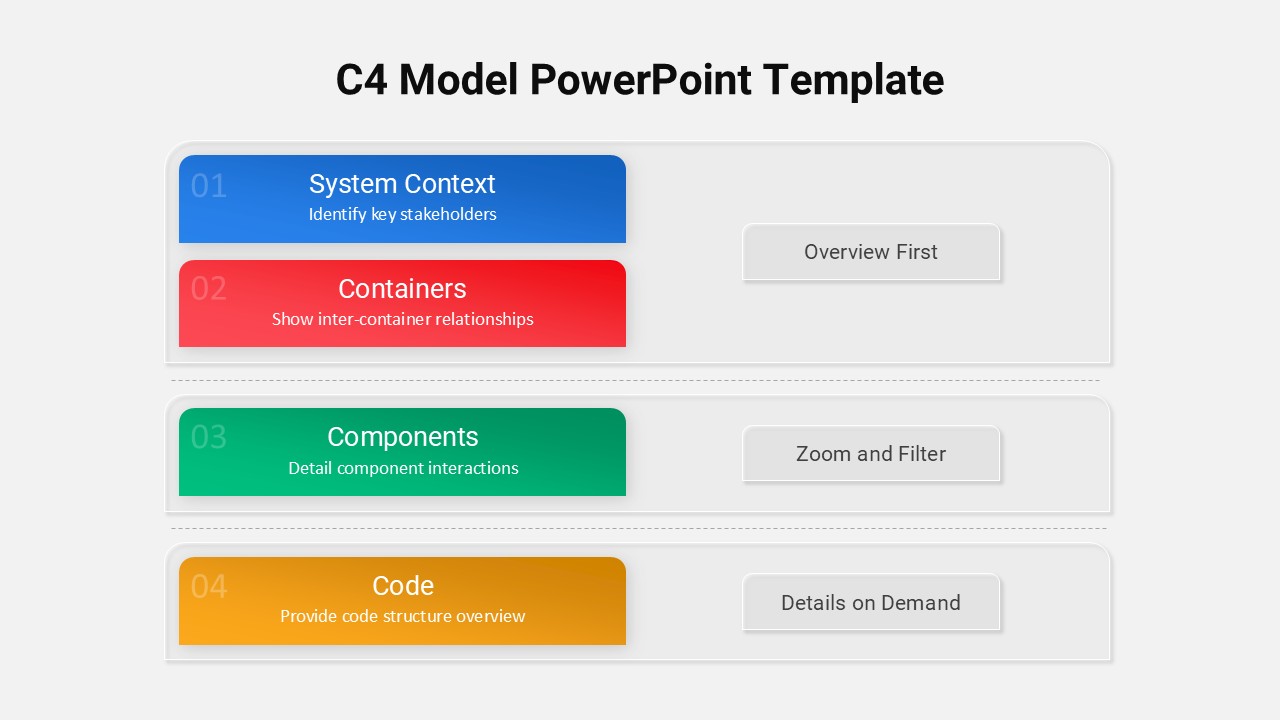
C4 Model Architecture Overview Template for PowerPoint & Google Slides
Software Development
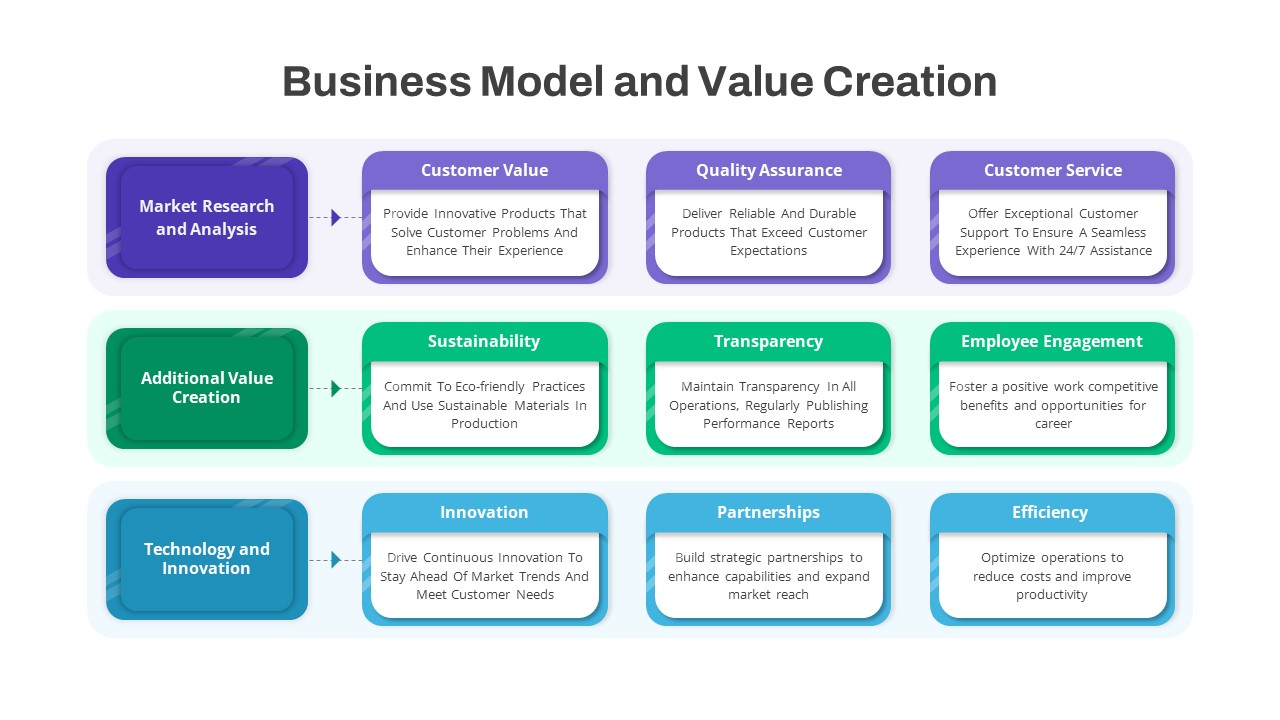
Business Model & Value Creation Template for PowerPoint & Google Slides
Process
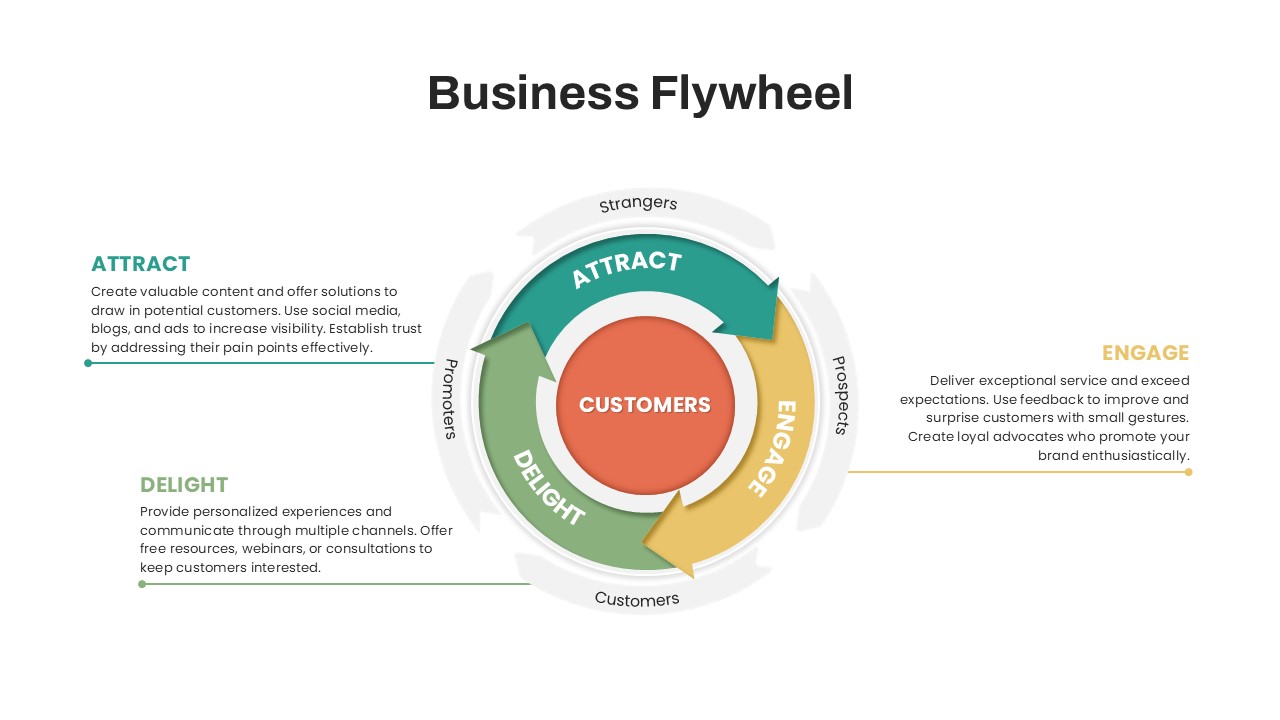
Business Flywheel Lifecycle Model Template for PowerPoint & Google Slides
Circular
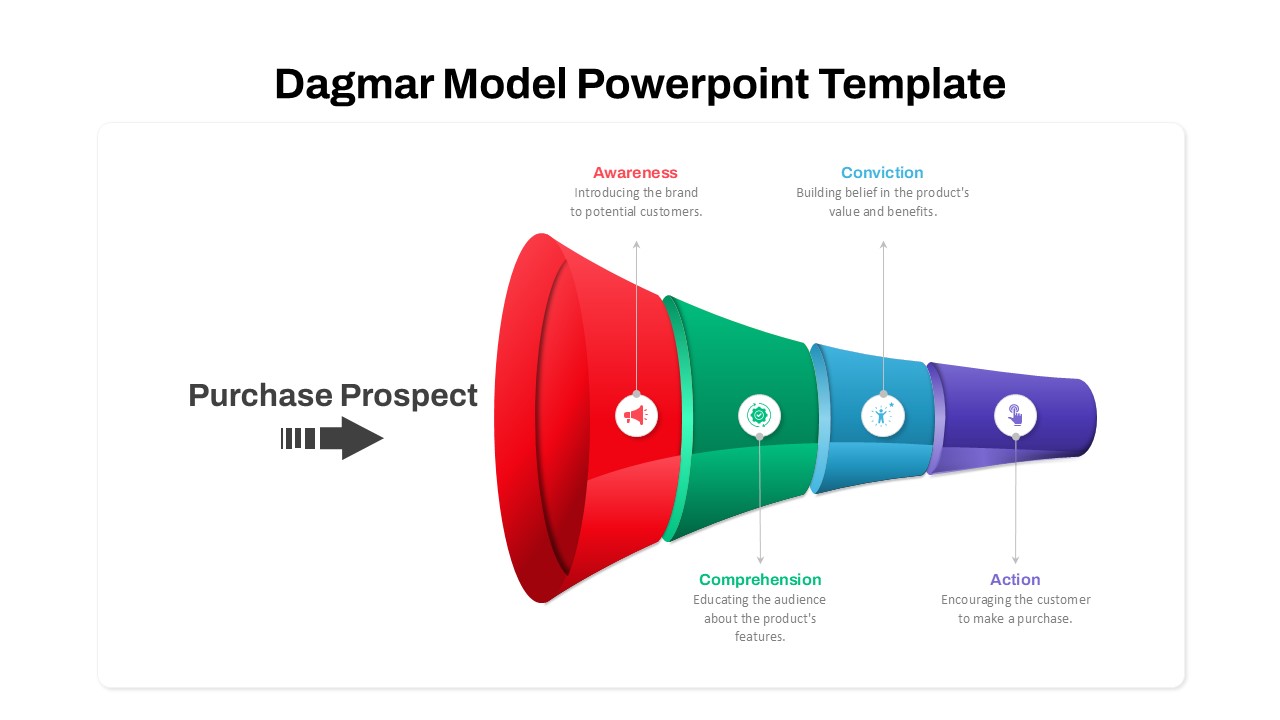
Dagmar Model Marketing Funnel Diagram Template for PowerPoint & Google Slides
Funnel
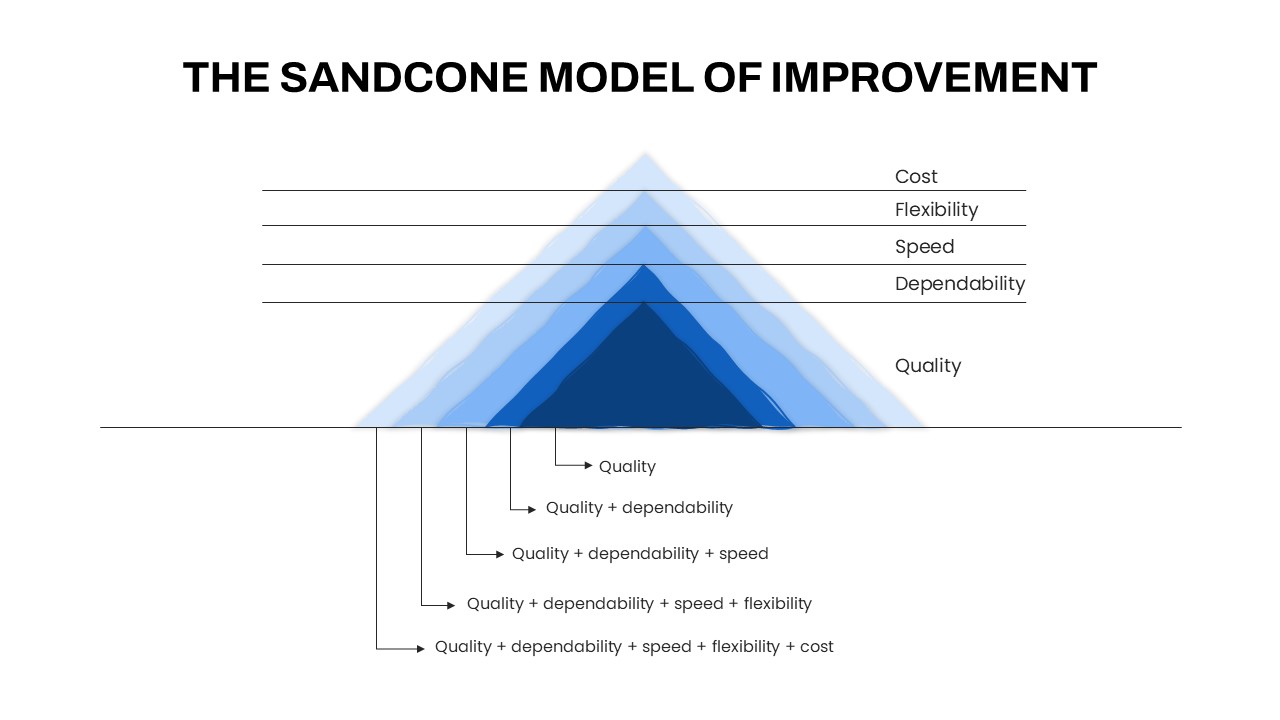
Sandcone Model of Improvement Diagram Template for PowerPoint & Google Slides
Pyramid
Seeds Growth Cycle Business Model Template for PowerPoint & Google Slides
Process
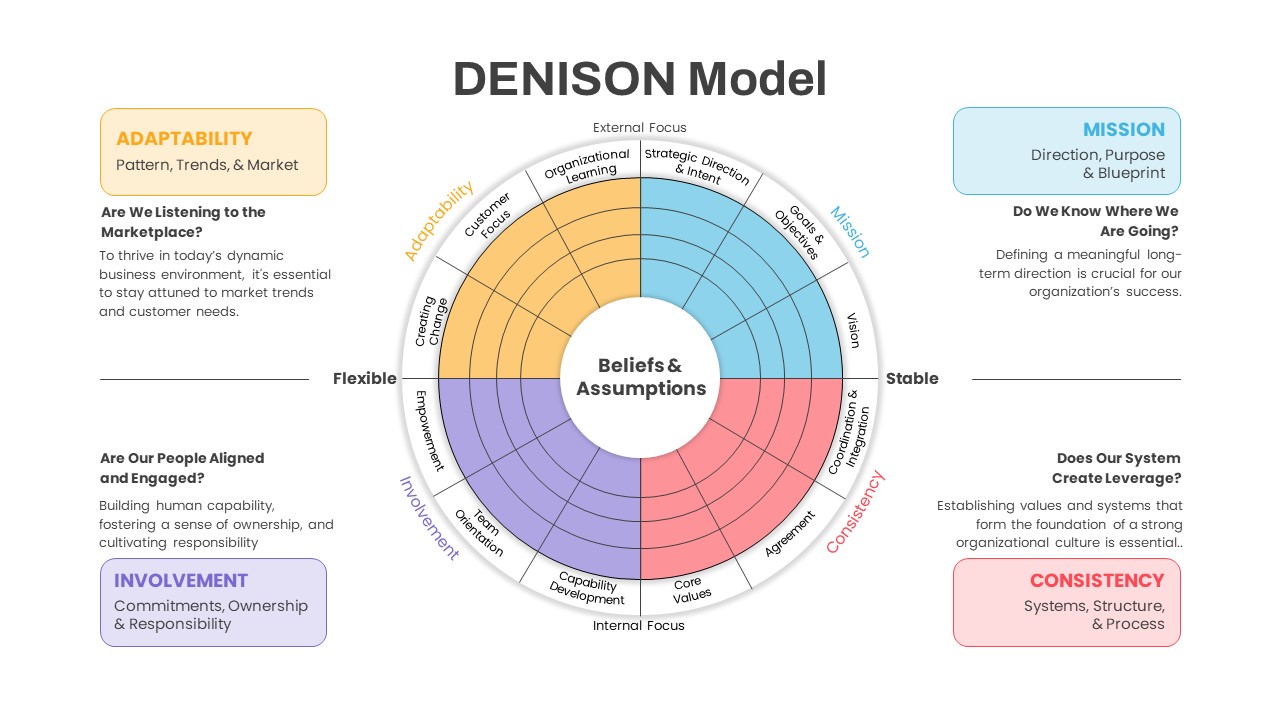
Denison Culture Model Wheel template for PowerPoint & Google Slides
Leadership
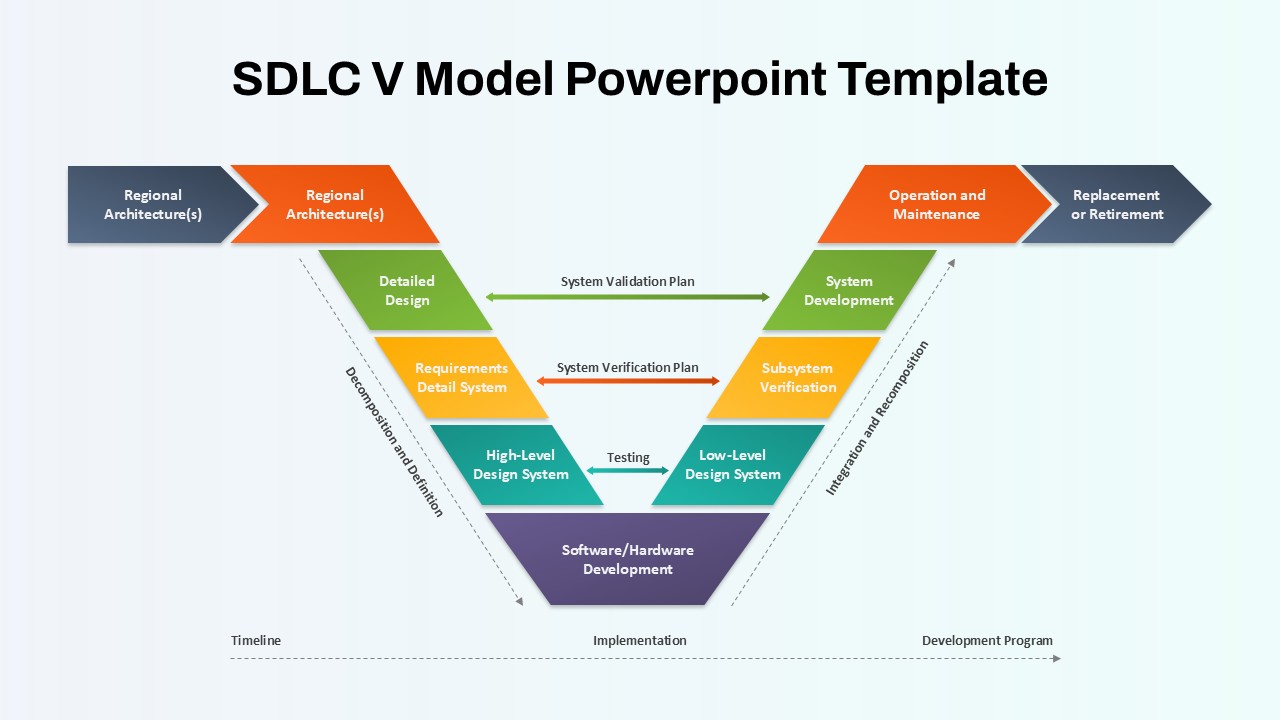
SDLC V Model Lifecycle Diagram Template for PowerPoint & Google Slides
Process
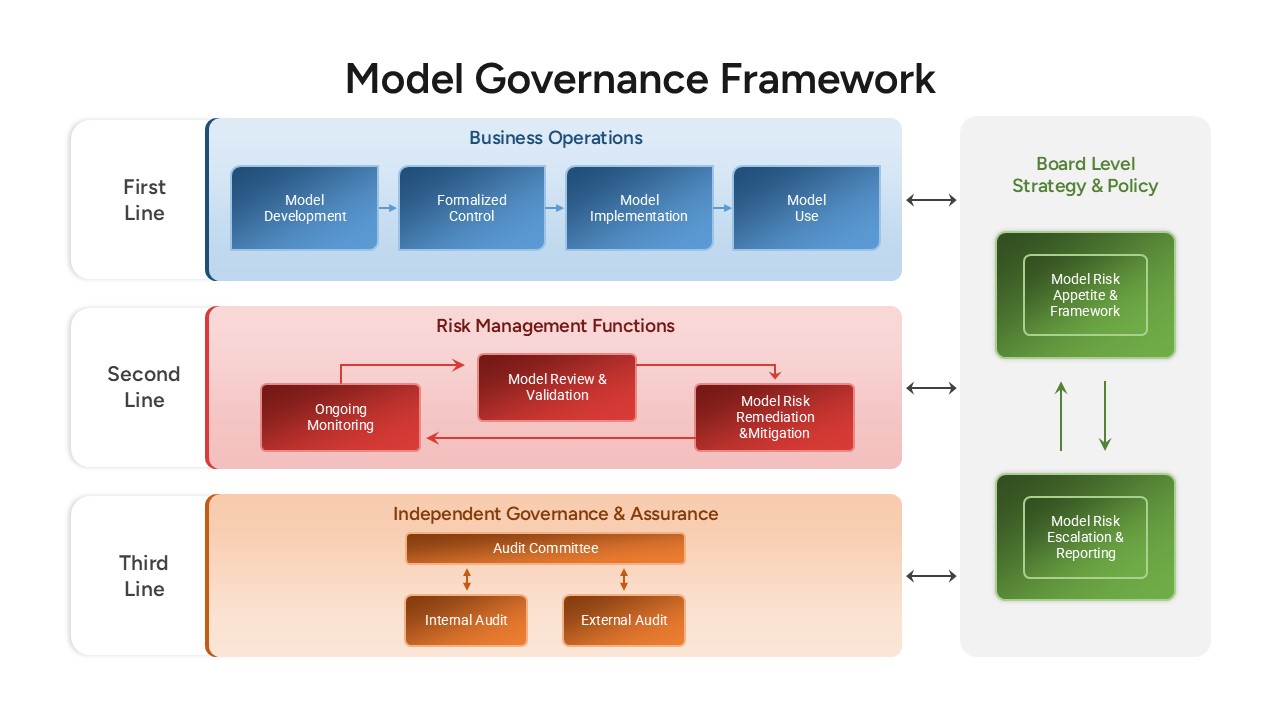
Model Governance Framework Template for PowerPoint & Google Slides
Risk Management
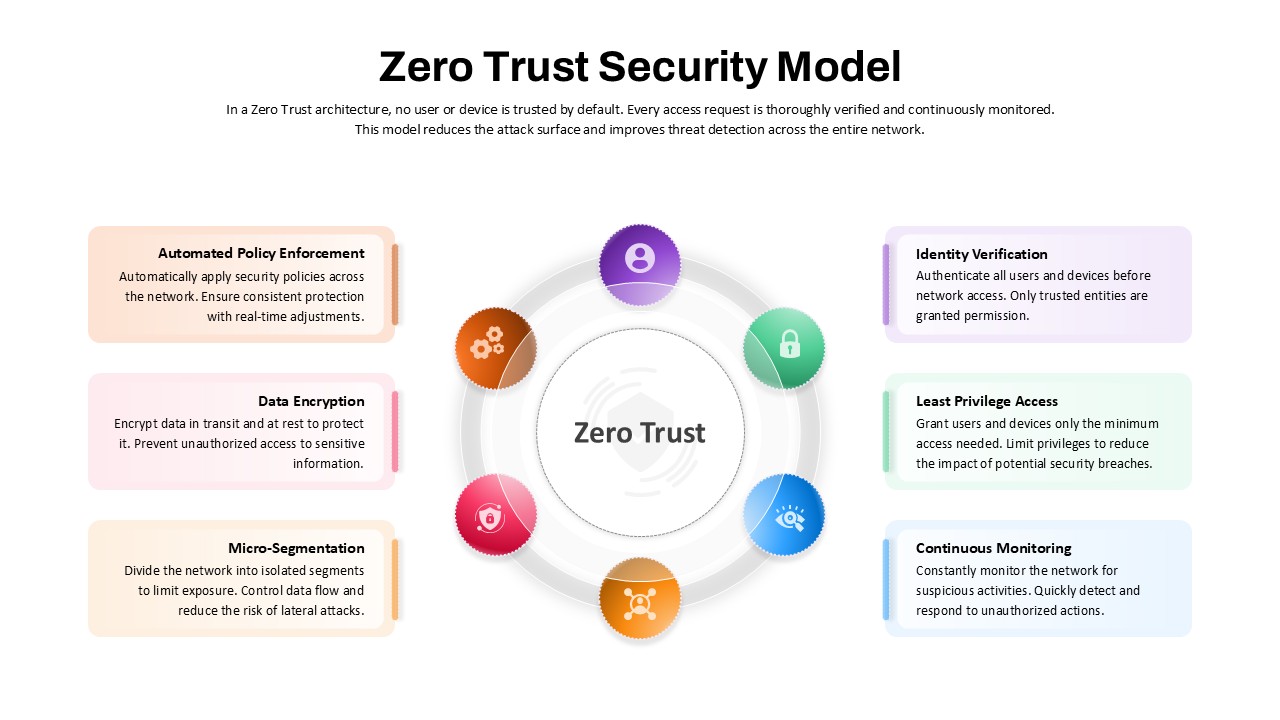
Zero Trust Security Model Overview template for PowerPoint & Google Slides
Risk Management
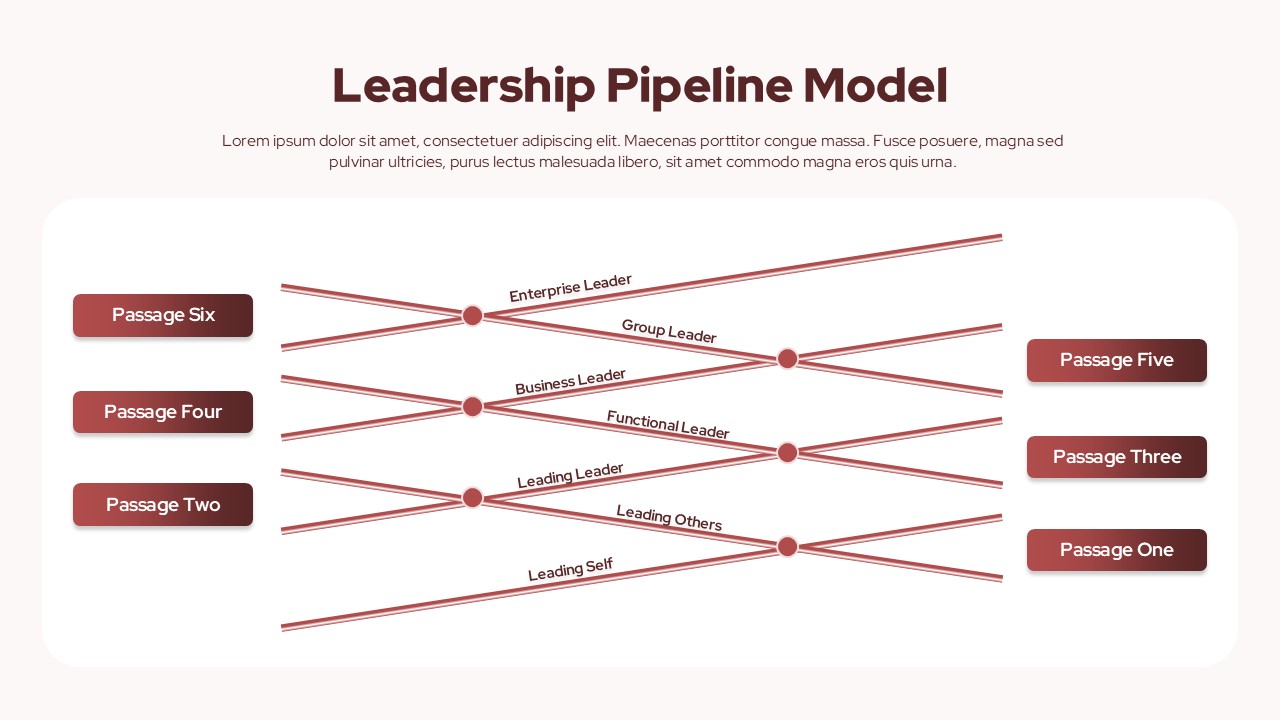
Leadership Pipeline Model Overview template for PowerPoint & Google Slides
Leadership
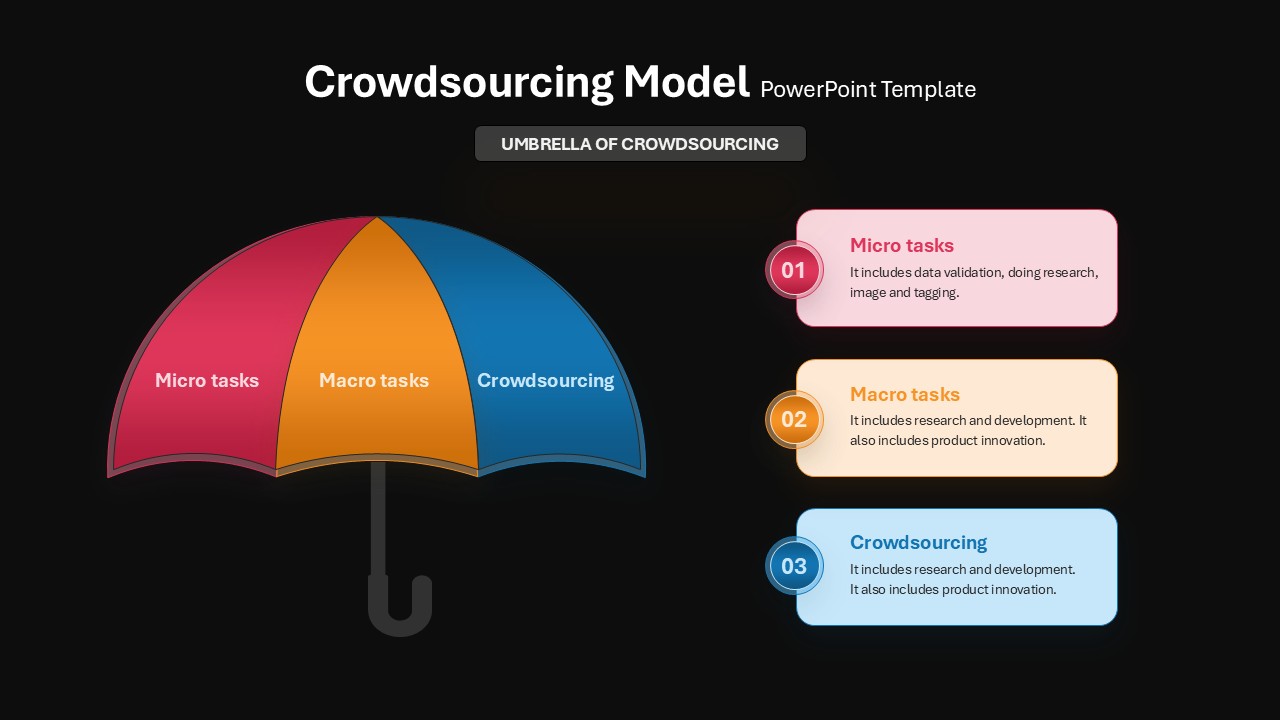
Crowdsourcing Model Umbrella & Process Template for PowerPoint & Google Slides
Infographics
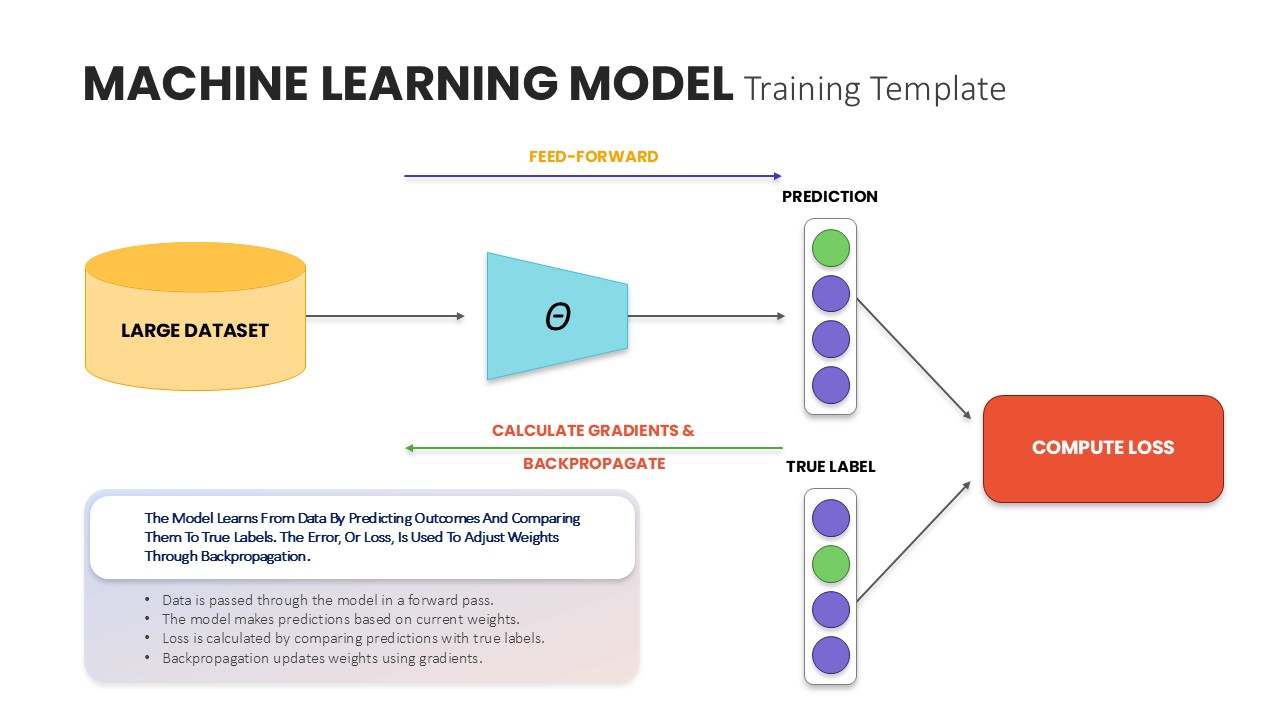
Machine Learning Model Training Template for PowerPoint & Google Slides
Machine Learning