Bowtie Diagram Prevention & Recovery Template for PowerPoint & Google Slides

Description
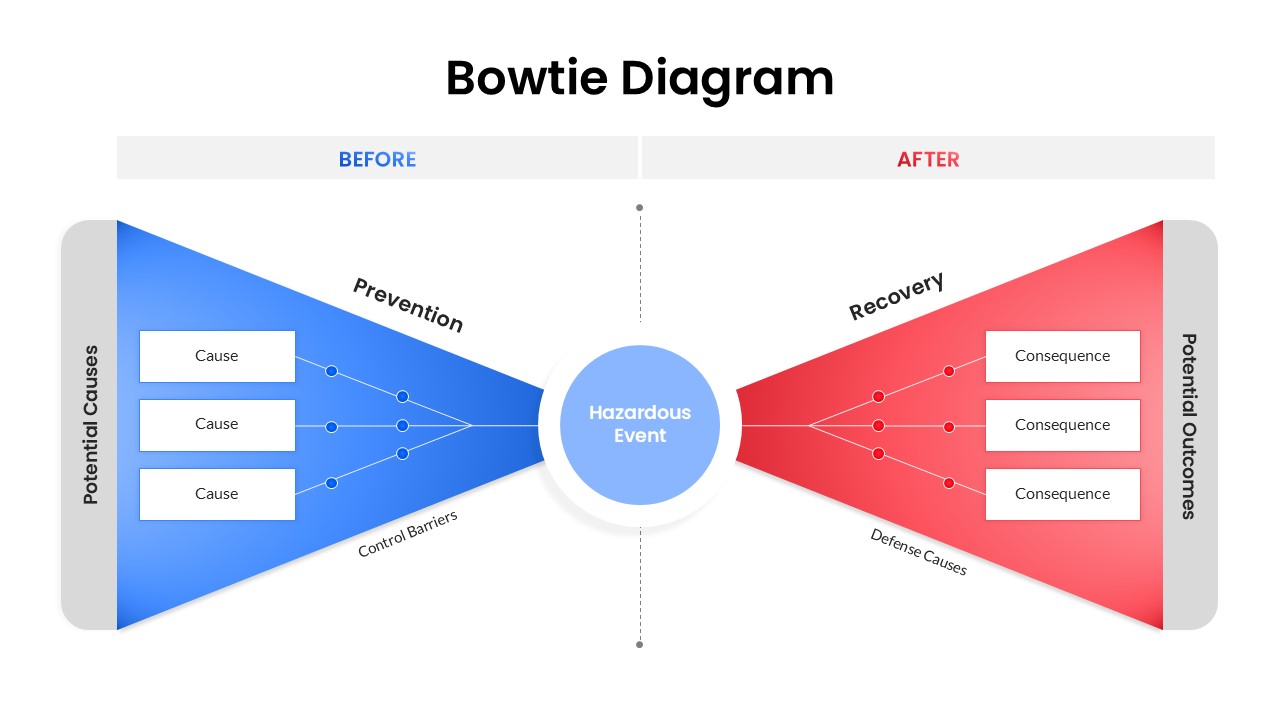
Visualize risk management with this Bowtie Diagram slide template, designed for PowerPoint & Google Slides. The layout features a central “Hazardous Event” circle flanked by two color-coded bowtie wings—blue for prevention (potential causes and control barriers) and red for recovery (consequences and defense measures). Each wing contains three editable text boxes linked by clean lines, enabling you to map out up to six cause-and-effect pathways at a glance.
Built on a master slide, every element is fully customizable: adjust gradients, swap fonts, and reposition shapes to suit your brand. Alignment guides ensure precision, while placeholder labels let you quickly replace sample text with your own causes, barriers, and outcomes. Compatibility across widescreen and 4:3 formats means your diagram will render crisply on any display. No plugins are required—simply insert the slide into your deck, edit the placeholders, and present with confidence.
Ideal for safety briefings, project-risk reviews, and incident-response workshops, this diagram clarifies complex relationships with visual flair. Use it to demonstrate how preventive controls stop hazards before they occur, and how recovery measures mitigate impact afterward. The intuitive design streamlines stakeholder communication and drives home the importance of both stages in comprehensive risk management.
Who is it for
Safety managers, risk-assessment teams, compliance officers, and operational leaders will benefit from this template when presenting hazard analyses, incident-response plans, or resilience frameworks.
Other Uses
Repurpose this layout for quality-control processes, incident-review debriefs, environmental impact assessments, or any scenario requiring a cause-and-effect visualization with dual-phase controls.
Login to download this file

Item ID
SB05356
Related Templates

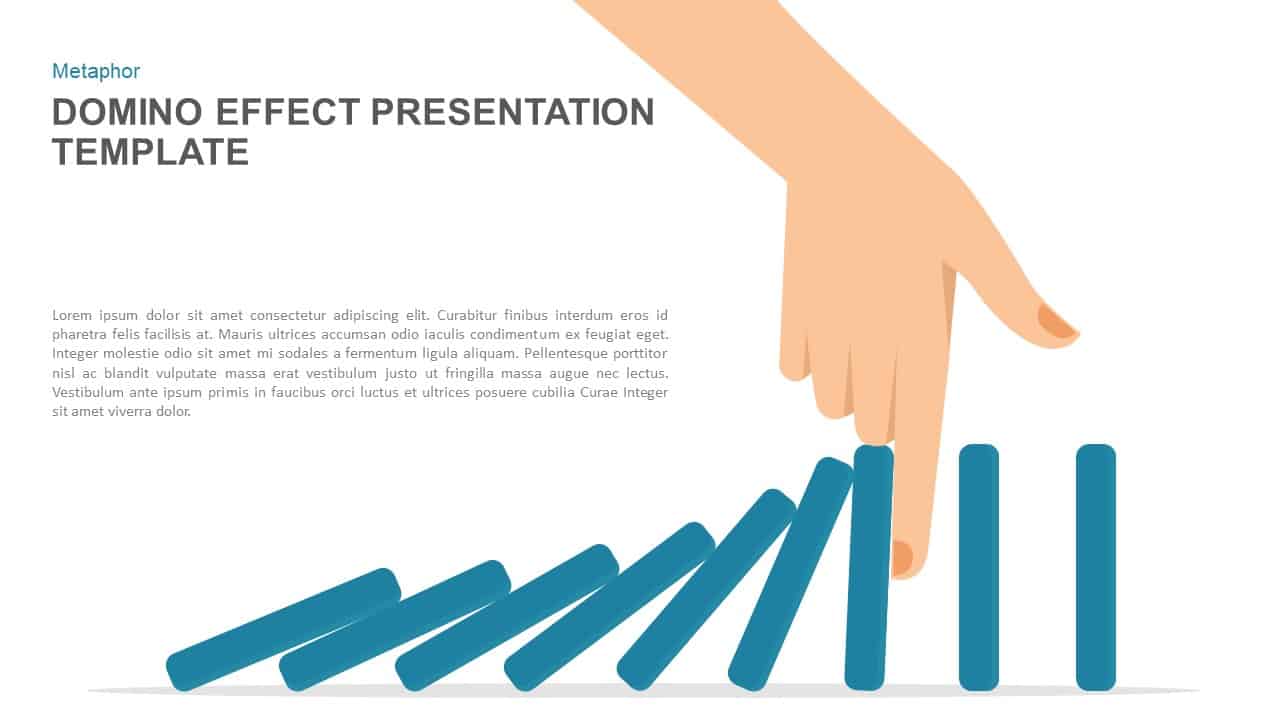
Domino Effect Prevention Presentation Template for PowerPoint & Google Slides
Process
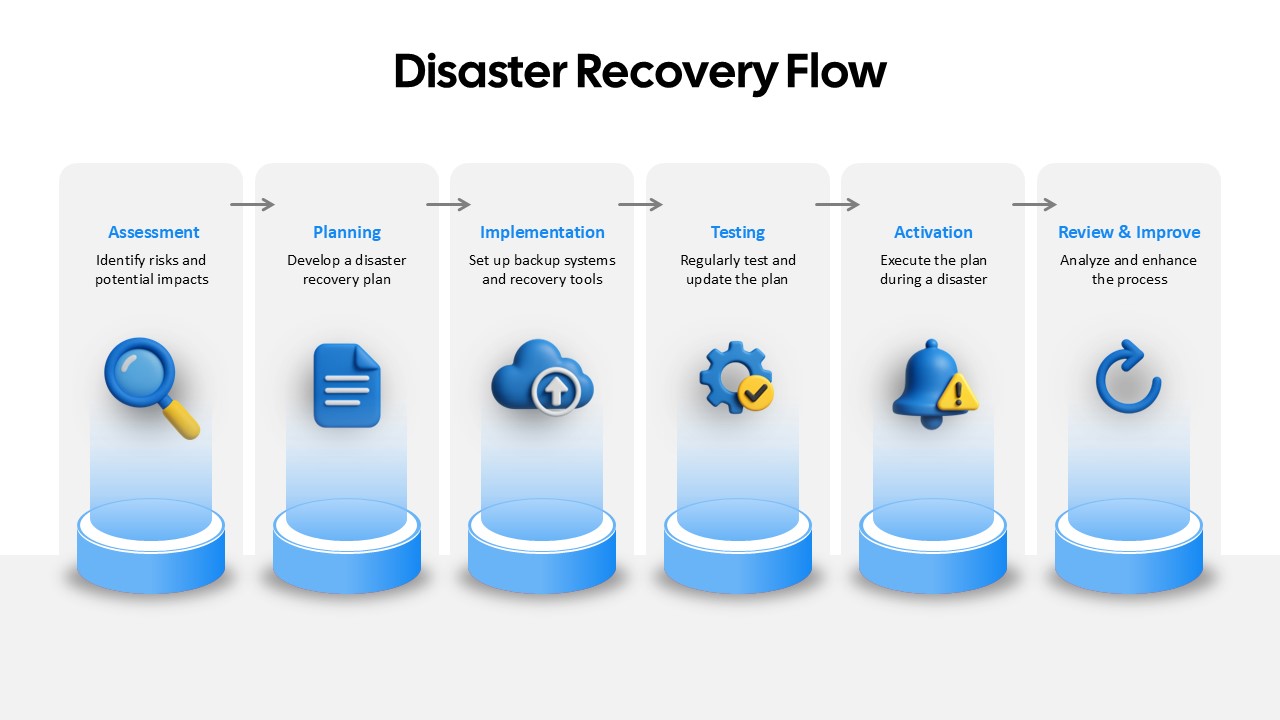
Disaster Recovery Flow Diagram Template for PowerPoint & Google Slides
Process
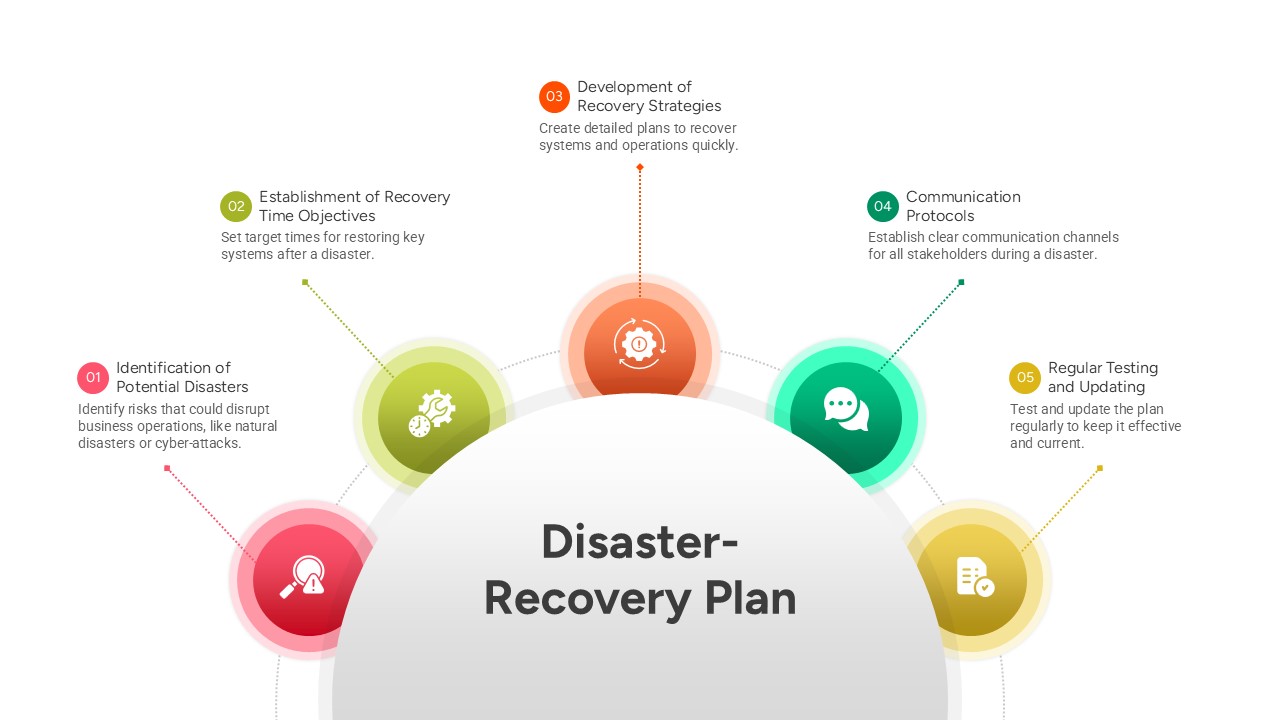
Five-Step Disaster Recovery Plan Template for PowerPoint & Google Slides
Project
Snake Diagram Pack of 8 Slides template for PowerPoint & Google Slides
Process
Gear Process Diagram PowerPoint Template for PowerPoint & Google Slides
Process
Sales Process Workflow Funnel Diagram PowerPoint Template for PowerPoint & Google Slides
Funnel
Puzzle Diagram PowerPoint Template for PowerPoint & Google Slides
Process
Transportation Logistics PowerPoint Diagram template for PowerPoint & Google Slides
Process
Emoji Scale PowerPoint Diagram for PowerPoint & Google Slides
Infographics
4 Step Problem Solving PowerPoint Diagram for PowerPoint & Google Slides
Process
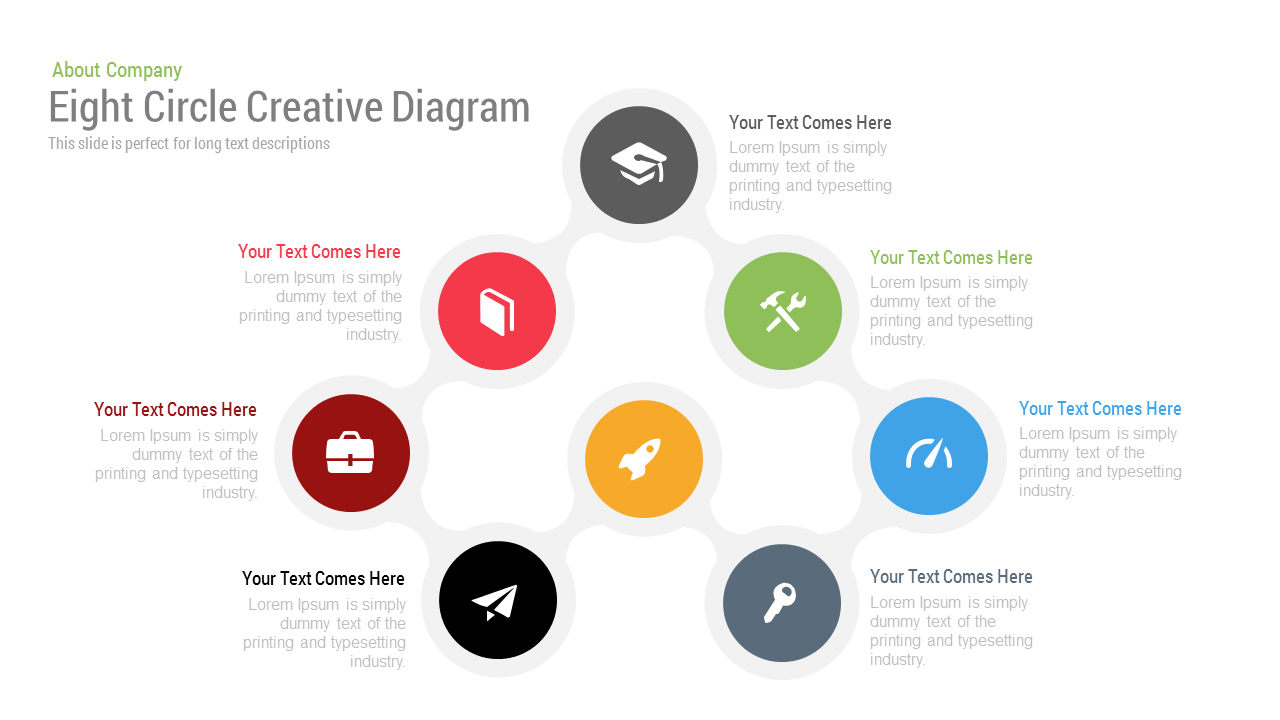
Free Eight Circle Creative Diagram template for PowerPoint & Google Slides
Circular
Free

8 Circular Ring Diagram template for PowerPoint & Google Slides
Infographics
5 Arrow Process Diagram Template for PowerPoint & Google Slides
Infographics
4 Level Funnel Diagram Template for PowerPoint & Google Slides
Funnel
Hexagonal Shapes Infographic Diagram Template for PowerPoint & Google Slides
Process
Four Section Comparison Chart Diagram Template for PowerPoint & Google Slides
Infographics
Section Diagram template for PowerPoint & Google Slides
Circular
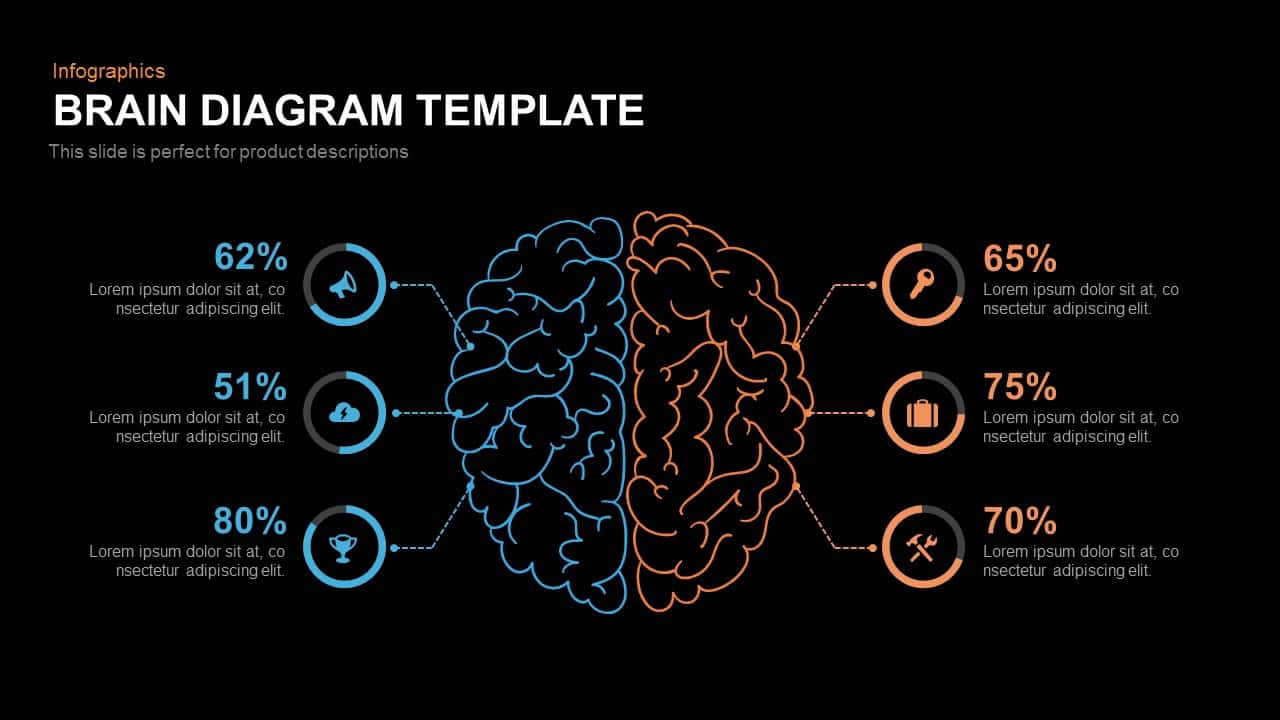
Brain Diagram template for PowerPoint & Google Slides
Mind Maps
Risk Management Mind Map Radial Diagram template for PowerPoint & Google Slides
Mind Maps
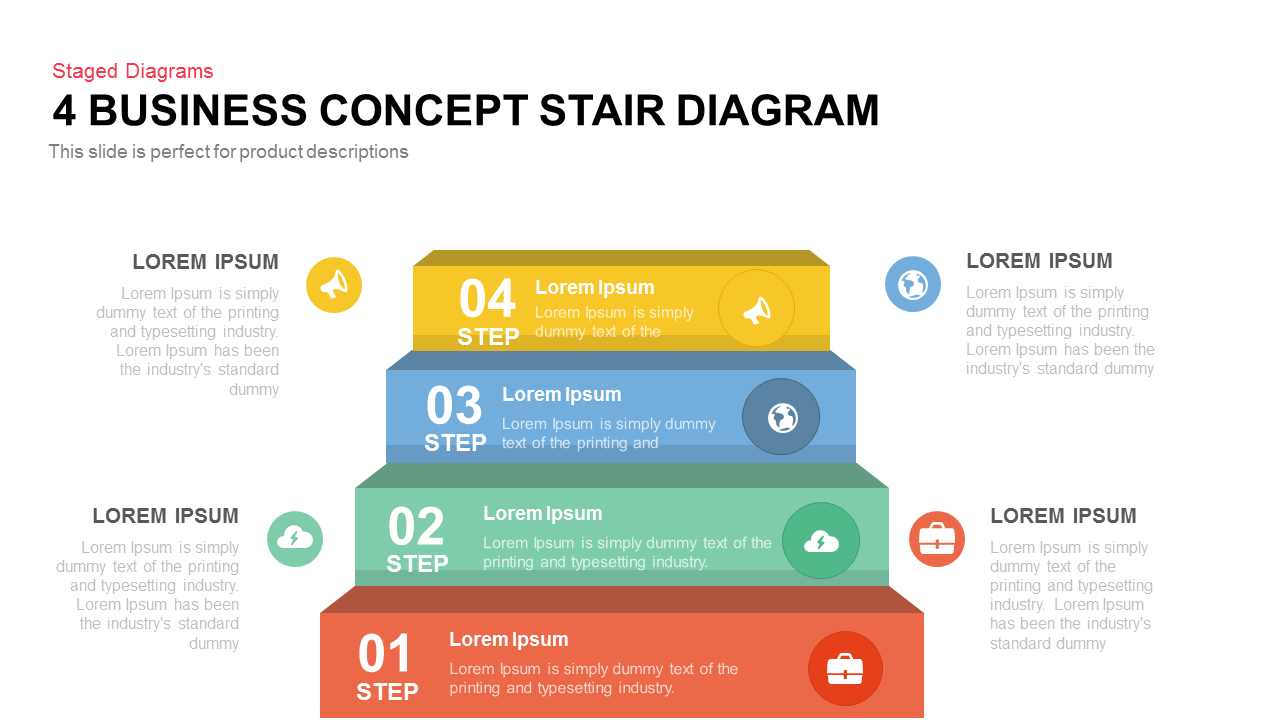
Four-Step Business Staircase Diagram template for PowerPoint & Google Slides
Process
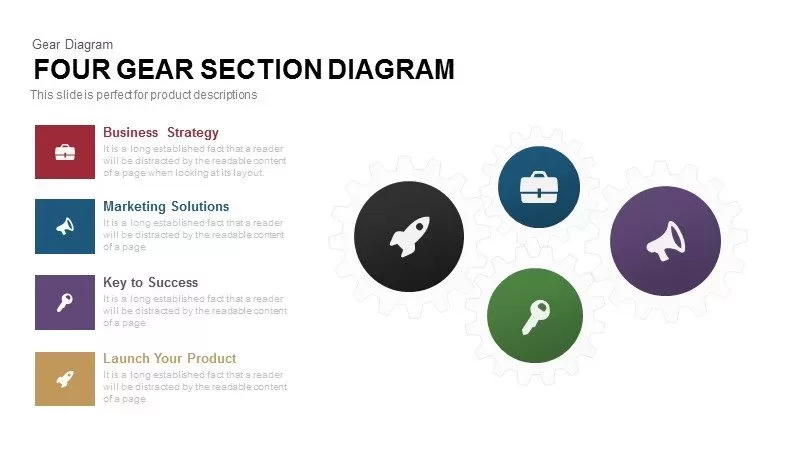
Four Gear Section Diagram Template for PowerPoint & Google Slides
Circular
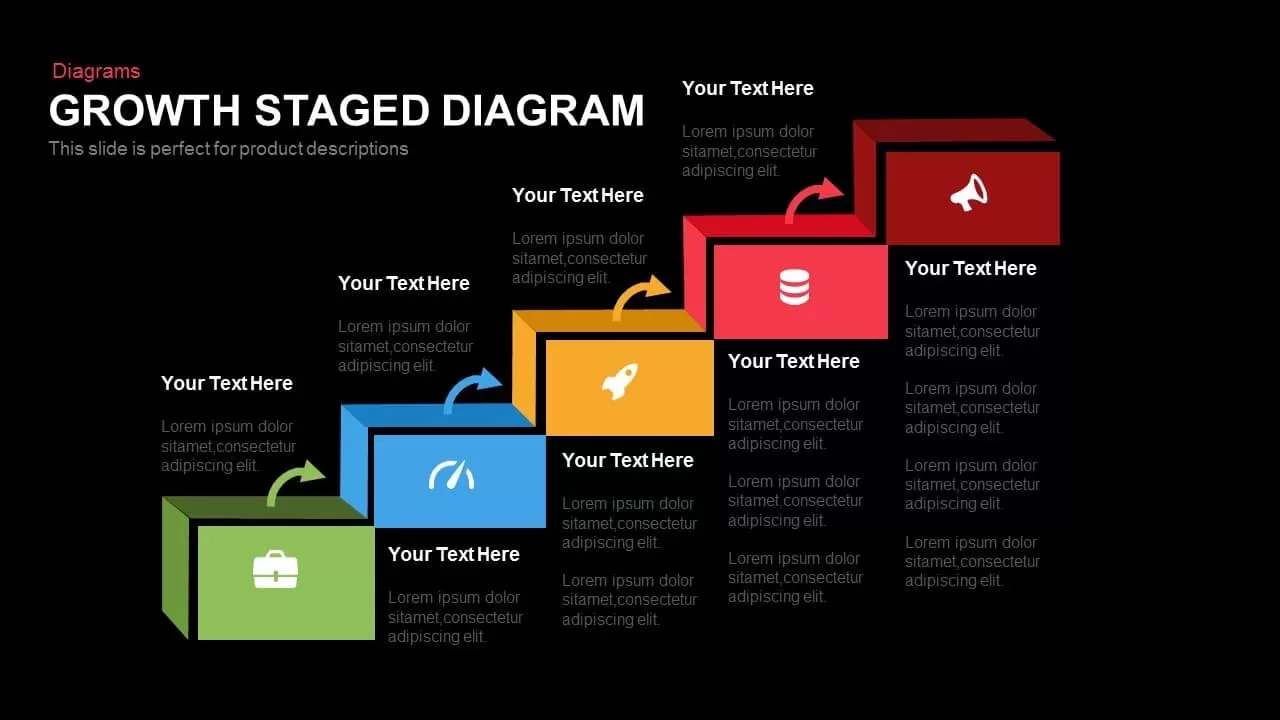
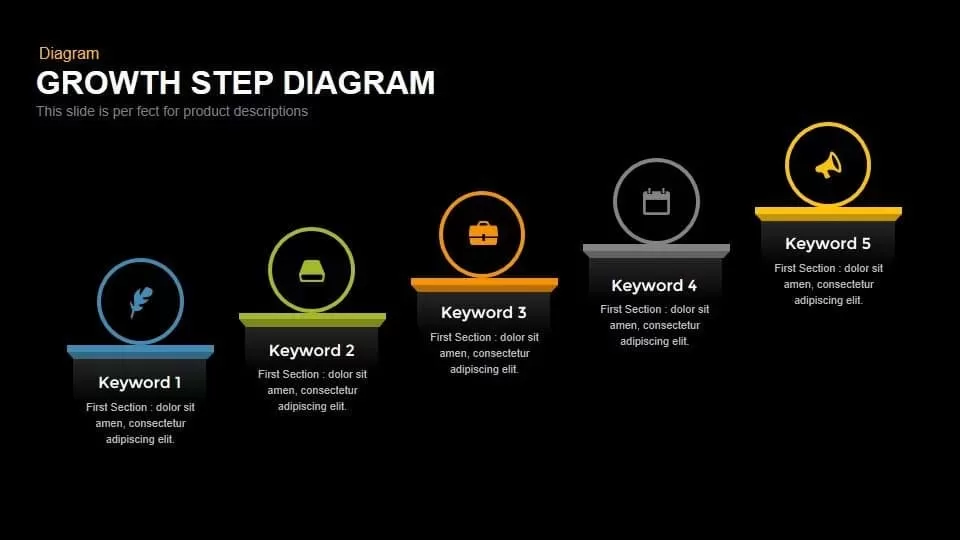
Five-Step Growth Stage Staircase Diagram Template for PowerPoint & Google Slides
Process

Modern Five-Step Growth Diagram Template for PowerPoint & Google Slides
Process
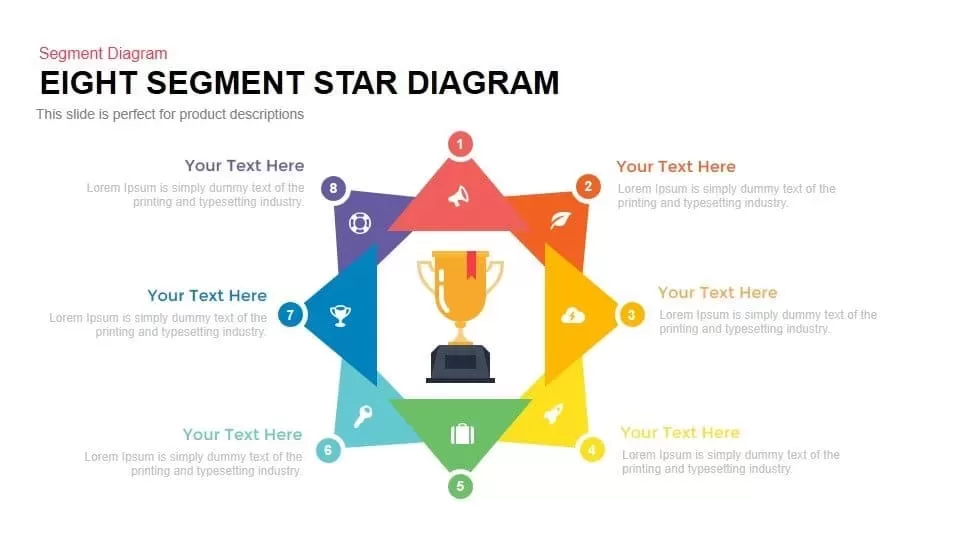
Eight Segment Star Diagram Infographic Template for PowerPoint & Google Slides
Process
Five Arrow Infographics Diagram Template for PowerPoint & Google Slides
Arrow
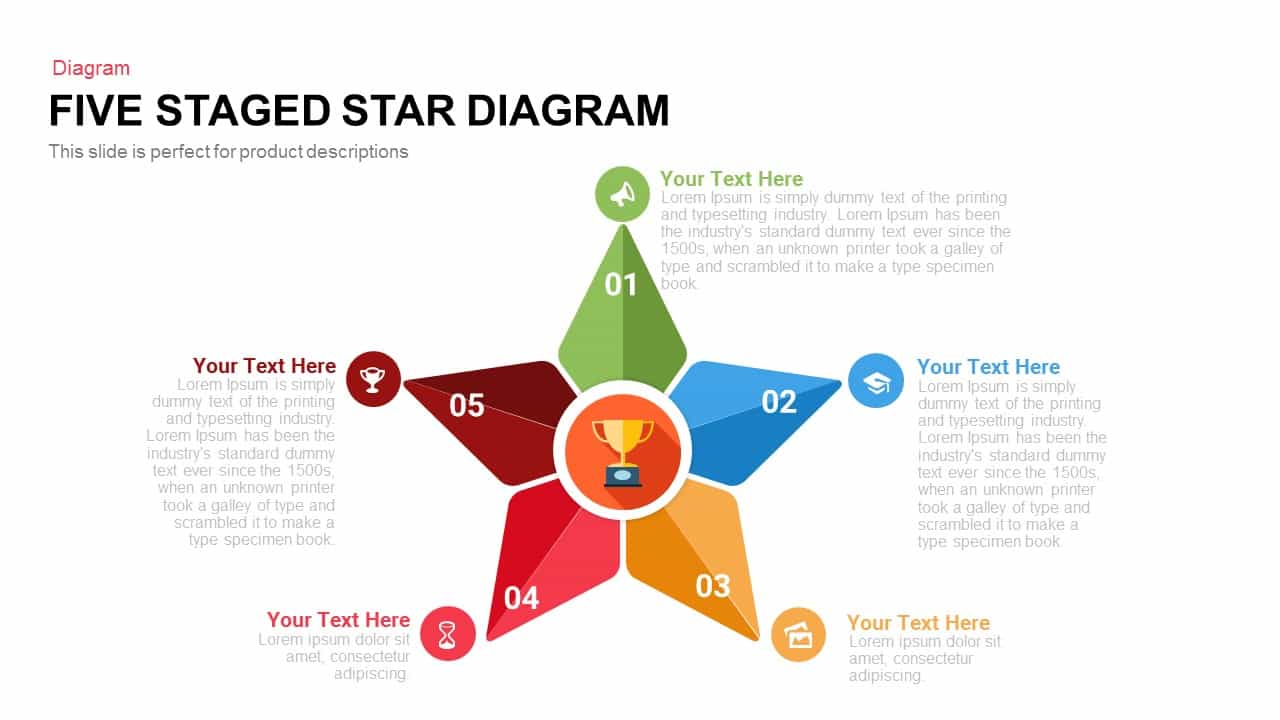
Five-Stage Star Diagram for Milestones Template for PowerPoint & Google Slides
Process
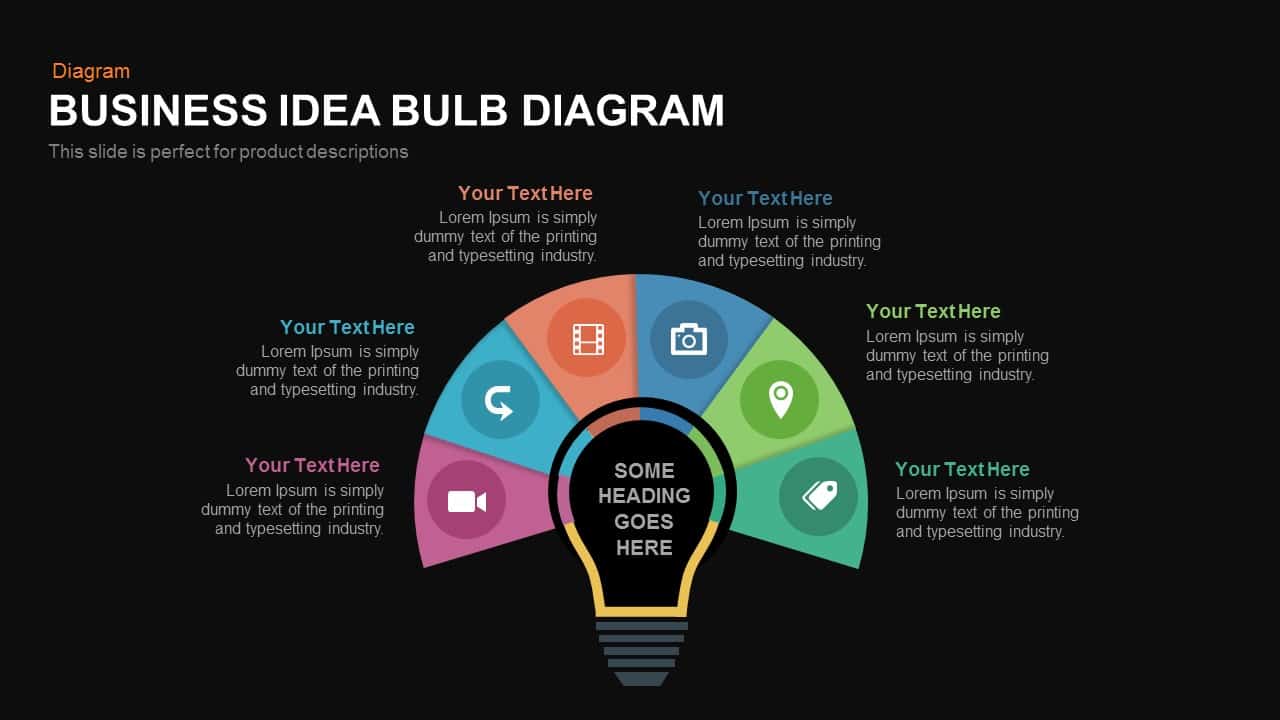
Six-Part Business Idea Bulb Diagram Template for PowerPoint & Google Slides
Circular
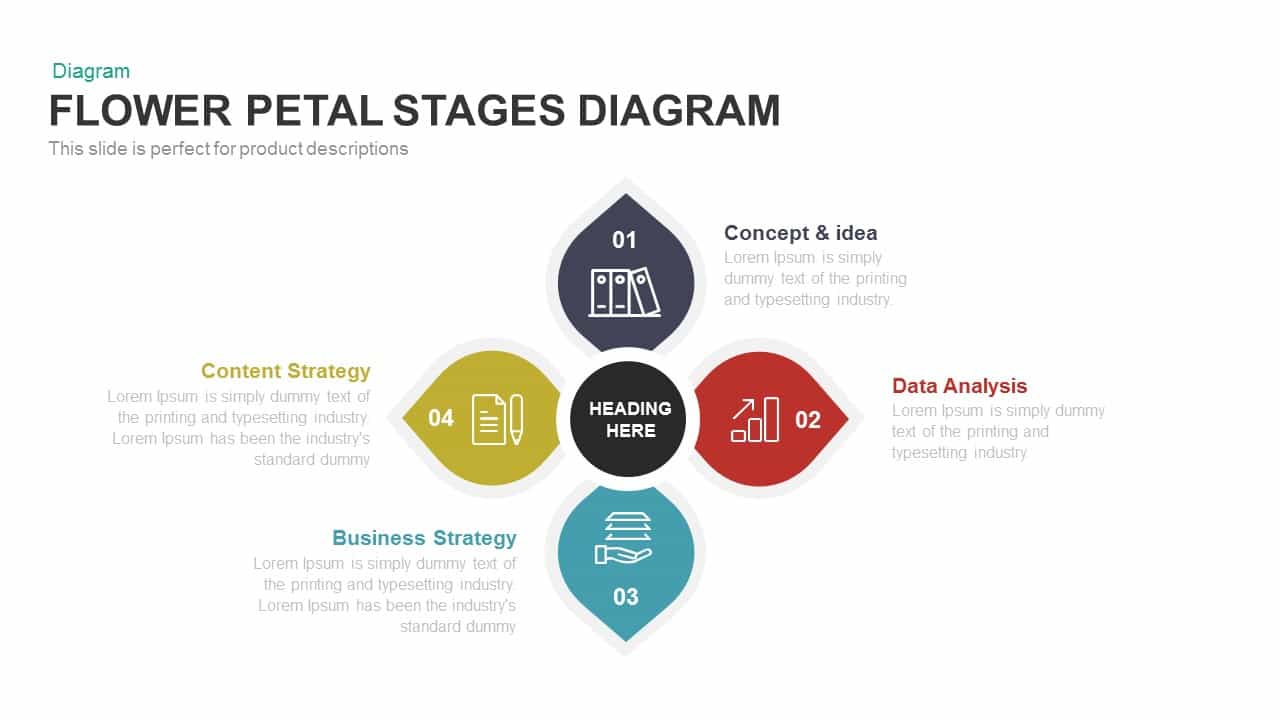
Modern Flower Petal Stages Diagram Template for PowerPoint & Google Slides
Circular
Six-Stage Semi-Circle Diagram with Icons Template for PowerPoint & Google Slides
Circular
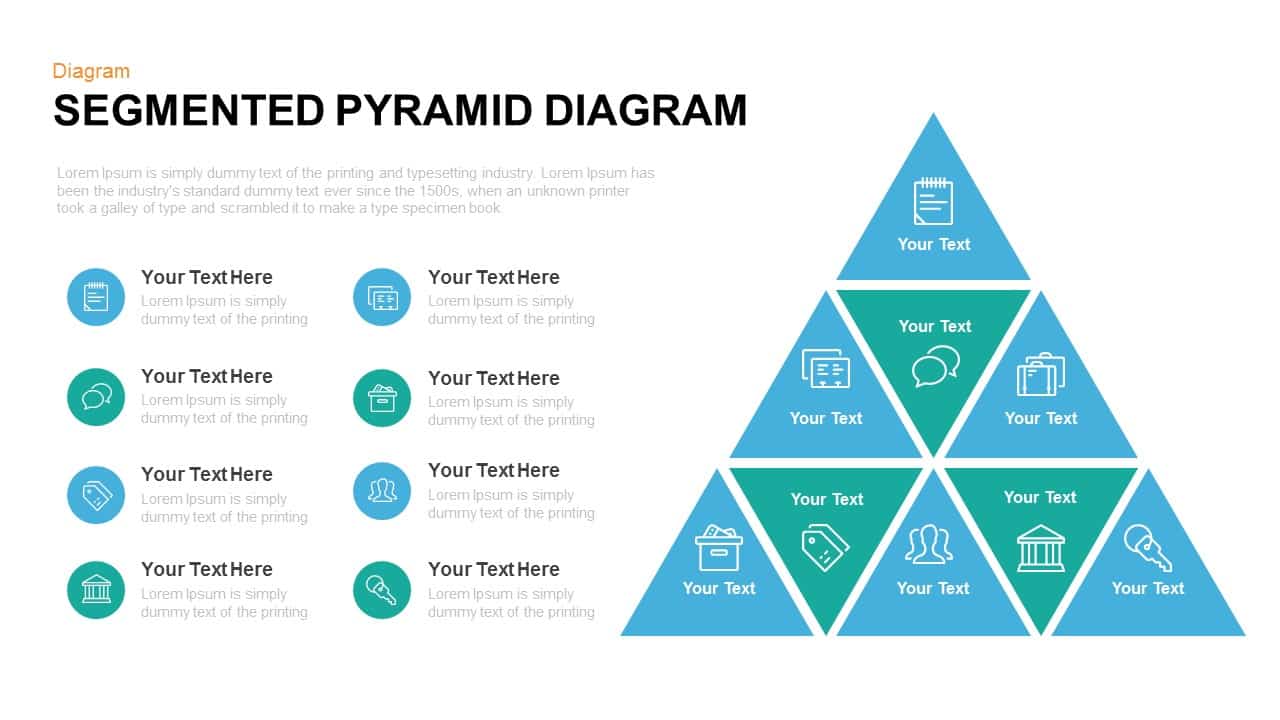
Segmented Pyramid Diagram Infographic Template for PowerPoint & Google Slides
Pyramid
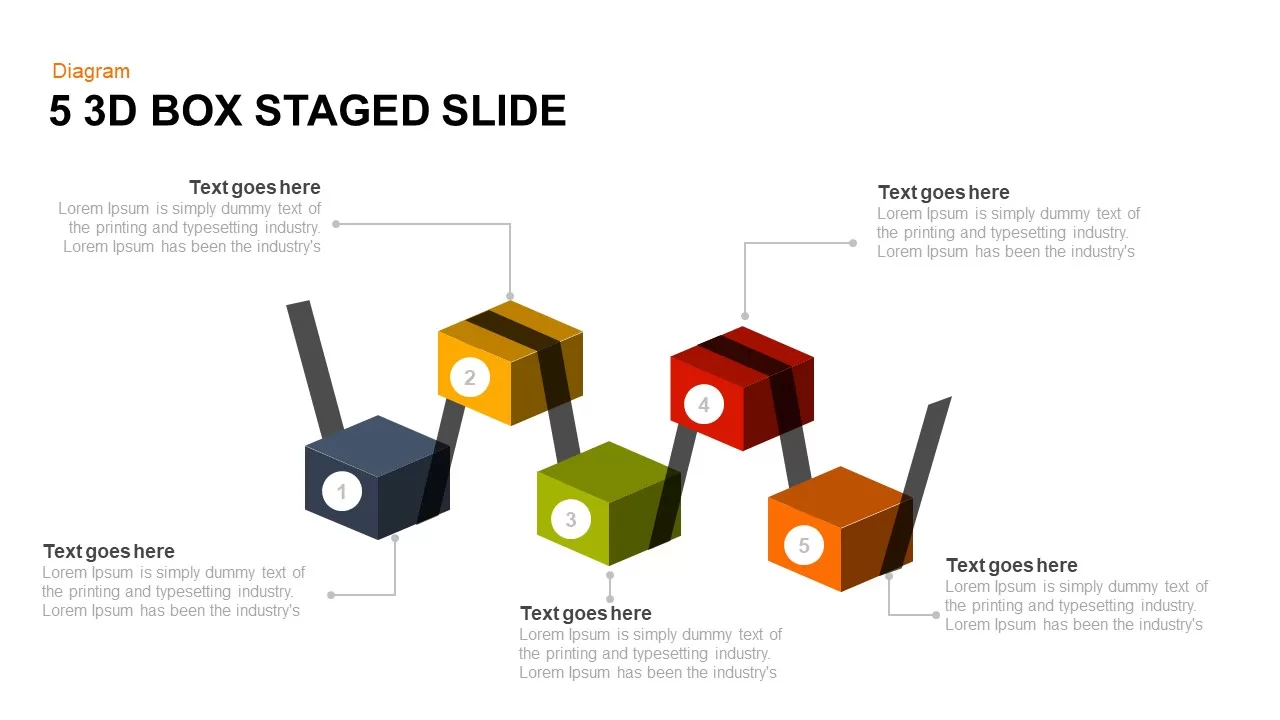
Five-Stage 3D Box Flow Diagram Template for PowerPoint & Google Slides
Process
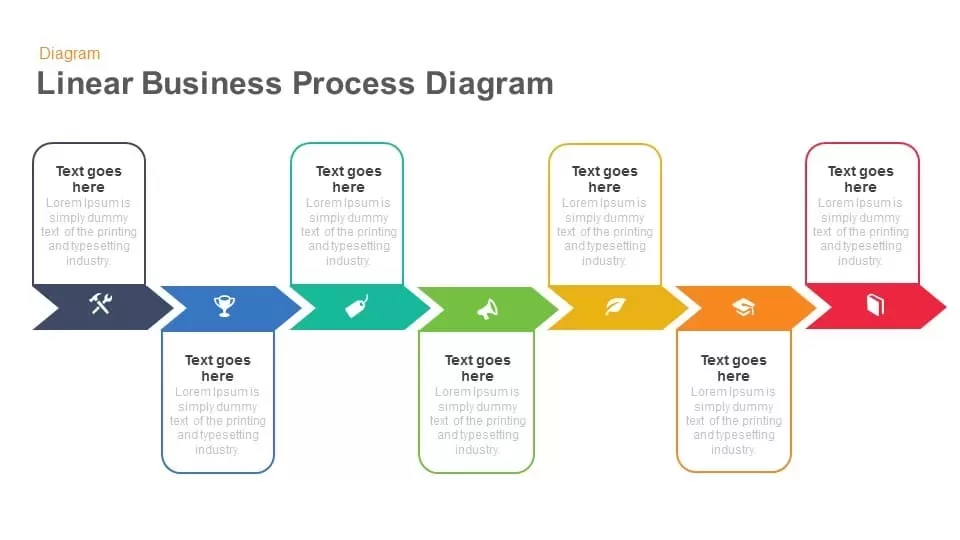
Linear Business Process Diagram template for PowerPoint & Google Slides
Process
Multidirectional Process Diagram template for PowerPoint & Google Slides
Process

Elegant Five Staged Banner Diagram Template for PowerPoint & Google Slides
Process
Cylinder Infographic Diagram template for PowerPoint & Google Slides
Process
Six Staged Circle Diagram template for PowerPoint & Google Slides
Circular
Nine-Stage 3D Funnel Process Diagram Template for PowerPoint & Google Slides
Funnel
Sales Activity Hexagon Process Diagram Template for PowerPoint & Google Slides
Process

Five Stages Pyramid with Ribbons Diagram Template for PowerPoint & Google Slides
Pyramid
PEST Analysis Circular Diagram Template for PowerPoint & Google Slides
PEST
SWOT Analysis Gear Diagram Slide Template for PowerPoint & Google Slides
SWOT
Four-Step Textbox Layout Diagram Template for PowerPoint & Google Slides
Business Report
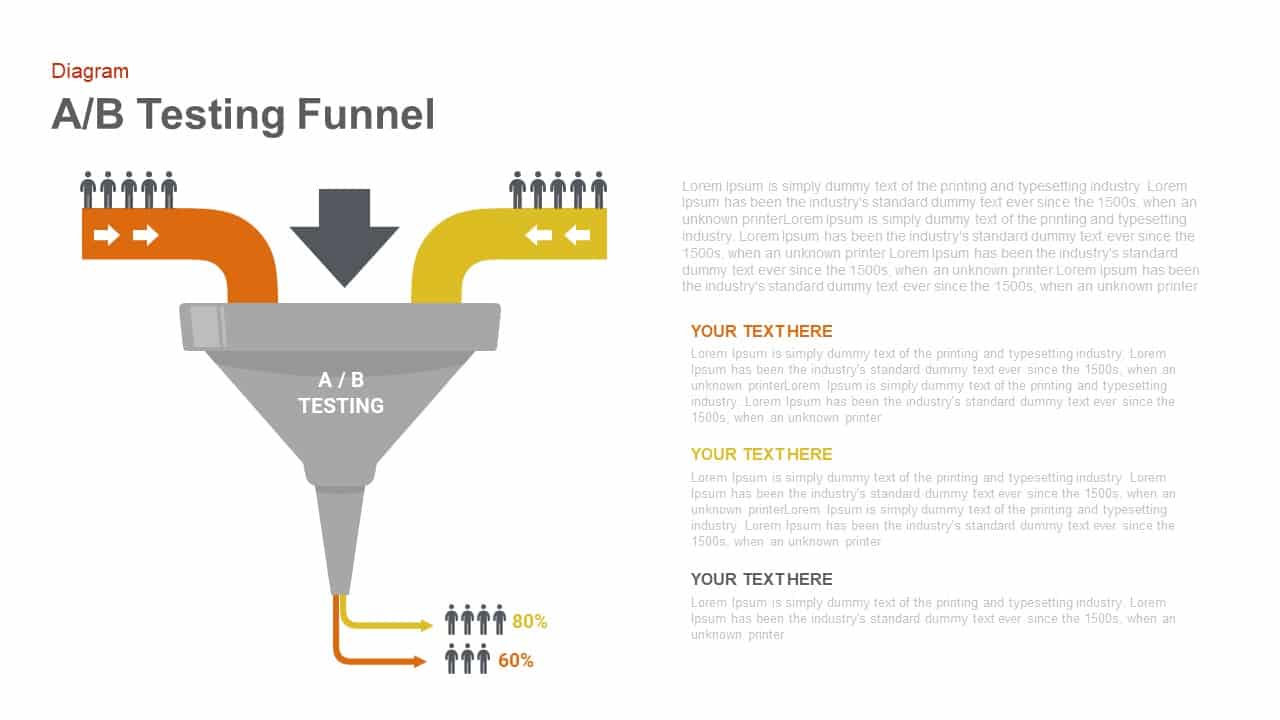
A/B Testing Funnel Diagram Template for PowerPoint & Google Slides
Digital Marketing
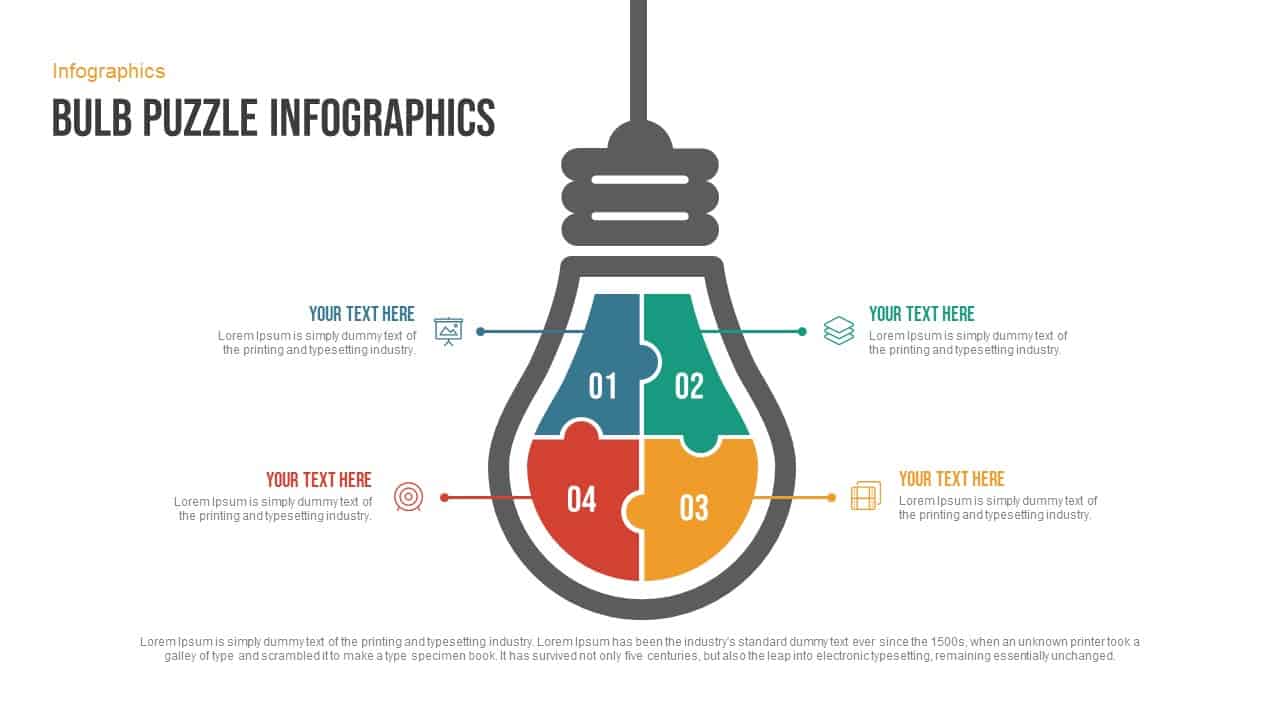
Free Bulb Puzzle Infographics Diagram Template for PowerPoint & Google Slides
Process
Free
Cluster Analysis Infographic Diagram Template for PowerPoint & Google Slides
Business
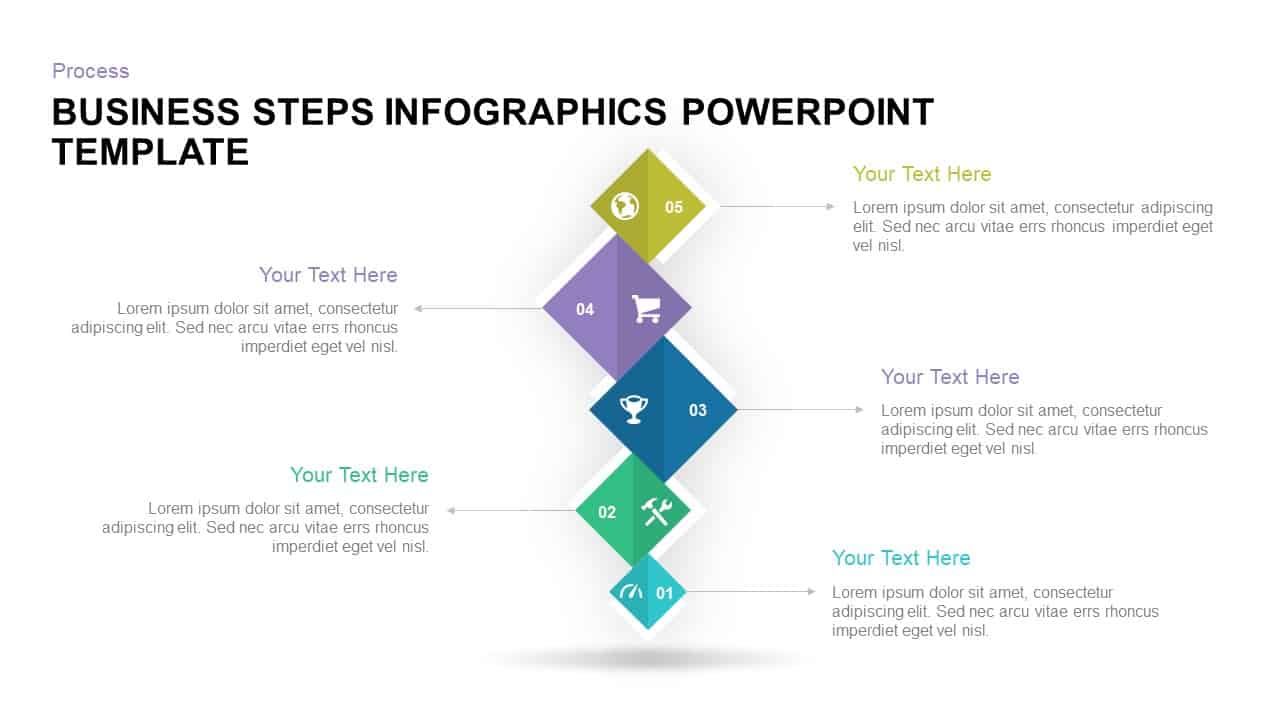
Five-Step Diamond Process Diagram Template for PowerPoint & Google Slides
Process
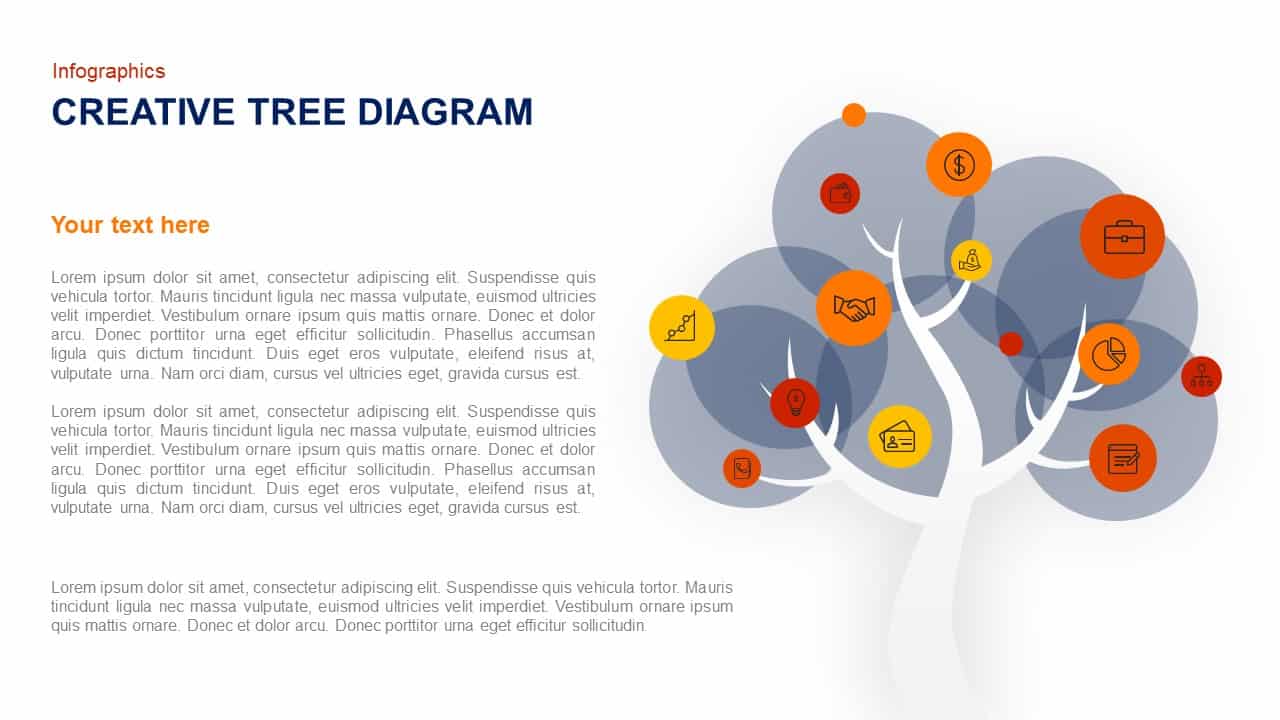
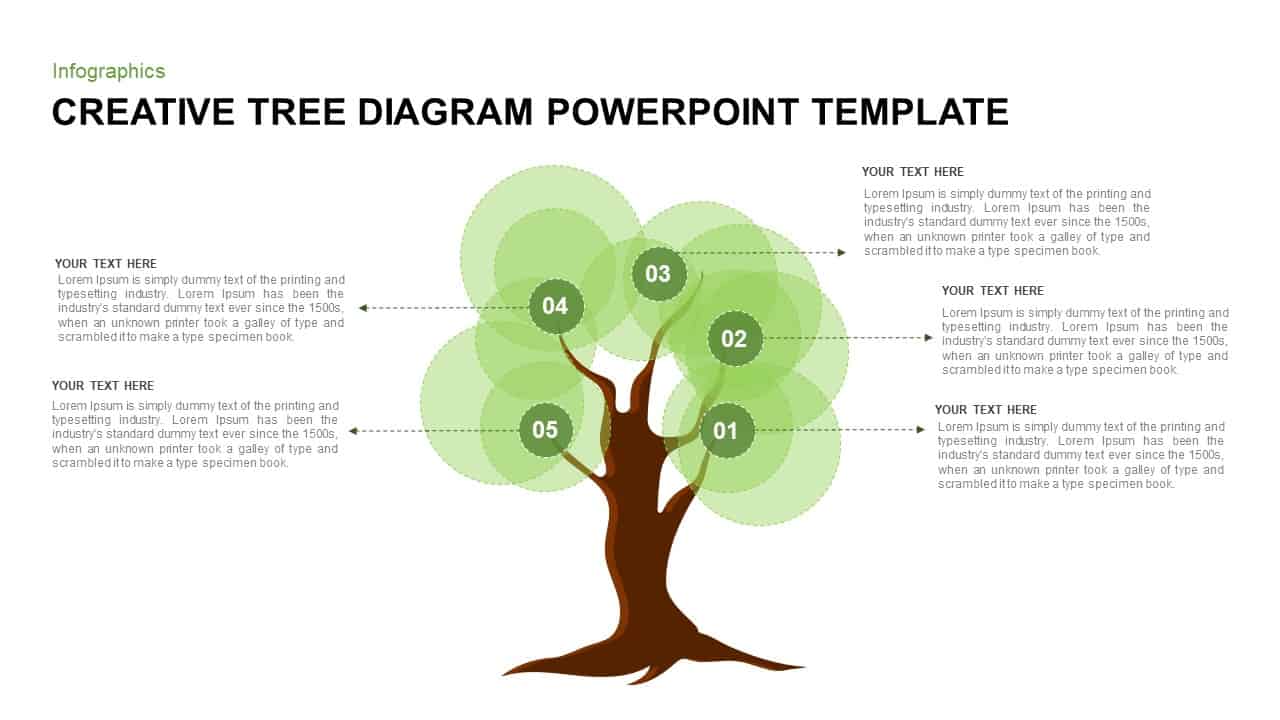
Creative Tree Infographic Diagram Template for PowerPoint & Google Slides
Infographics
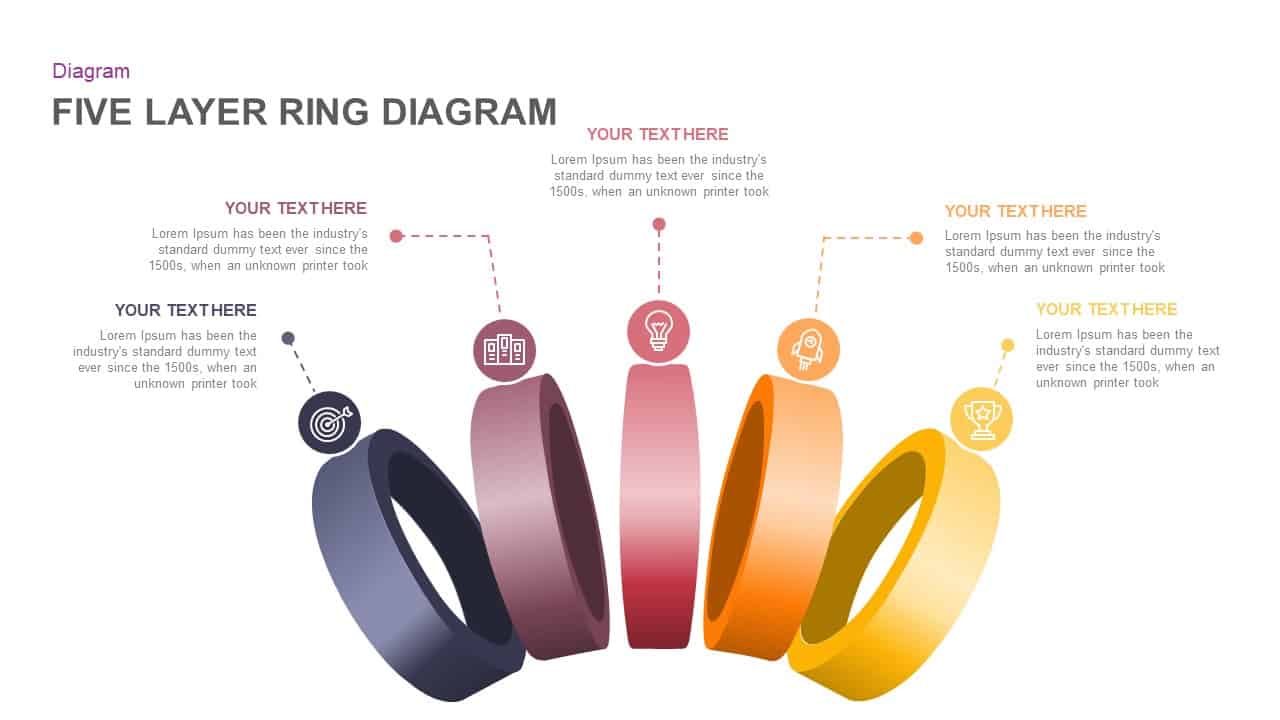
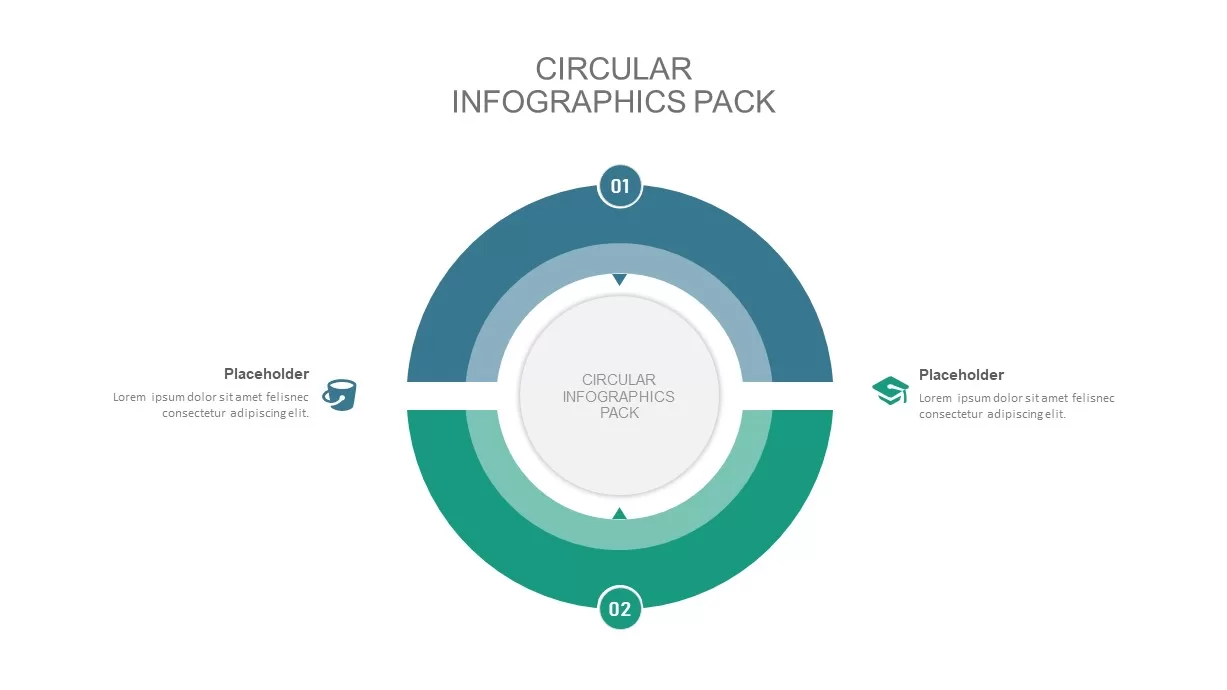
Five Layer Circular Ring Diagram Template for PowerPoint & Google Slides
Circular
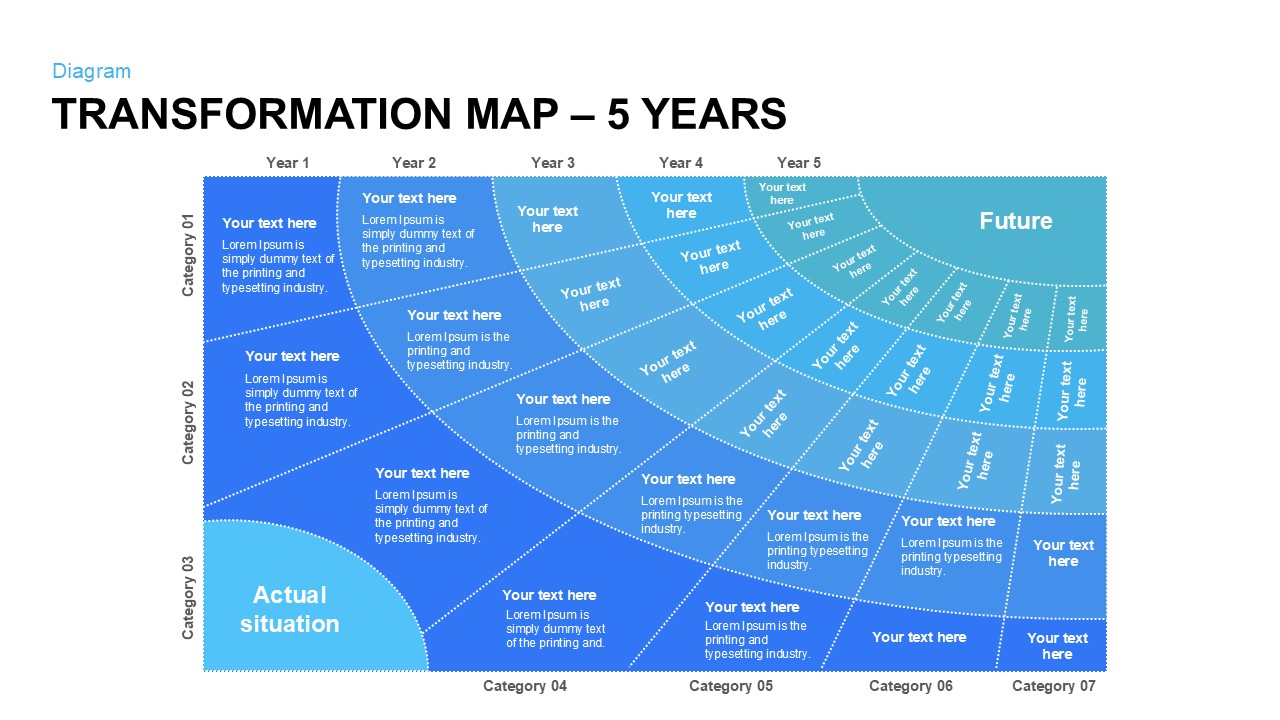
Five-Year Transformation Map Diagram Template for PowerPoint & Google Slides
Process
Five-Stage Circular Flow Diagram Template for PowerPoint & Google Slides
Circular
3D Seven-Stage Process Flow Diagram Template for PowerPoint & Google Slides
Process
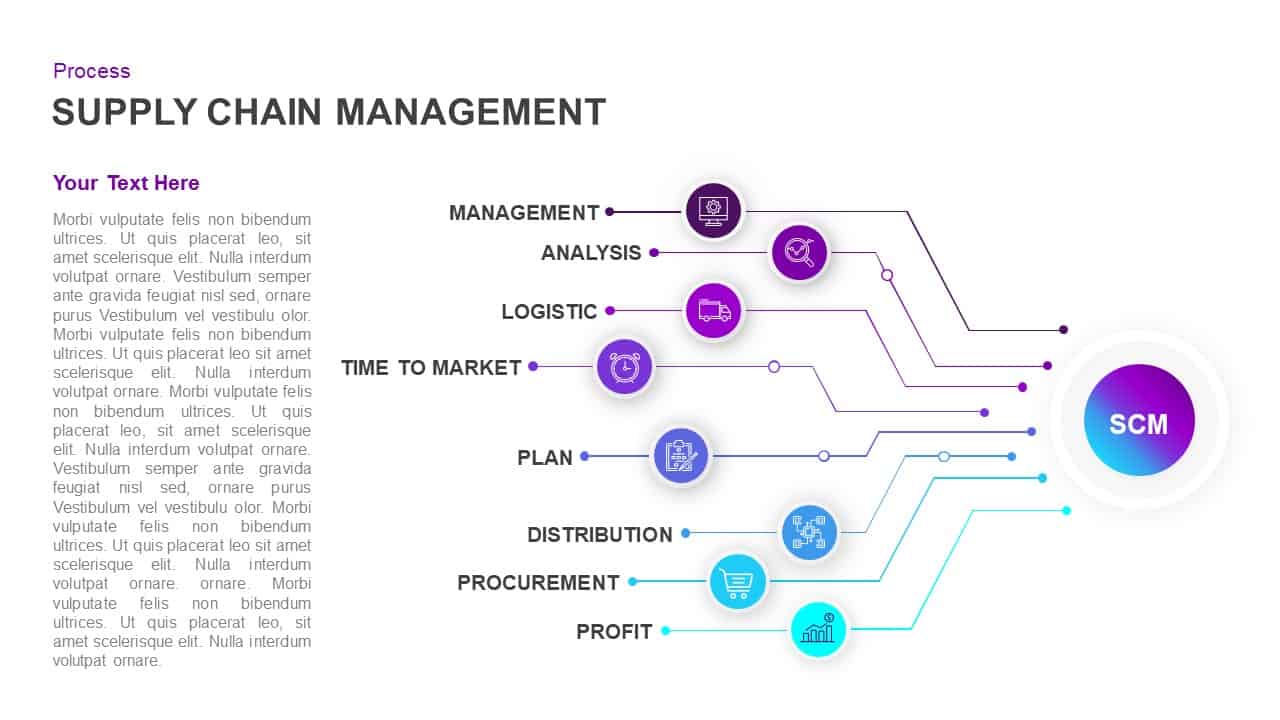
Supply Chain Management Process Diagram Template for PowerPoint & Google Slides
Process
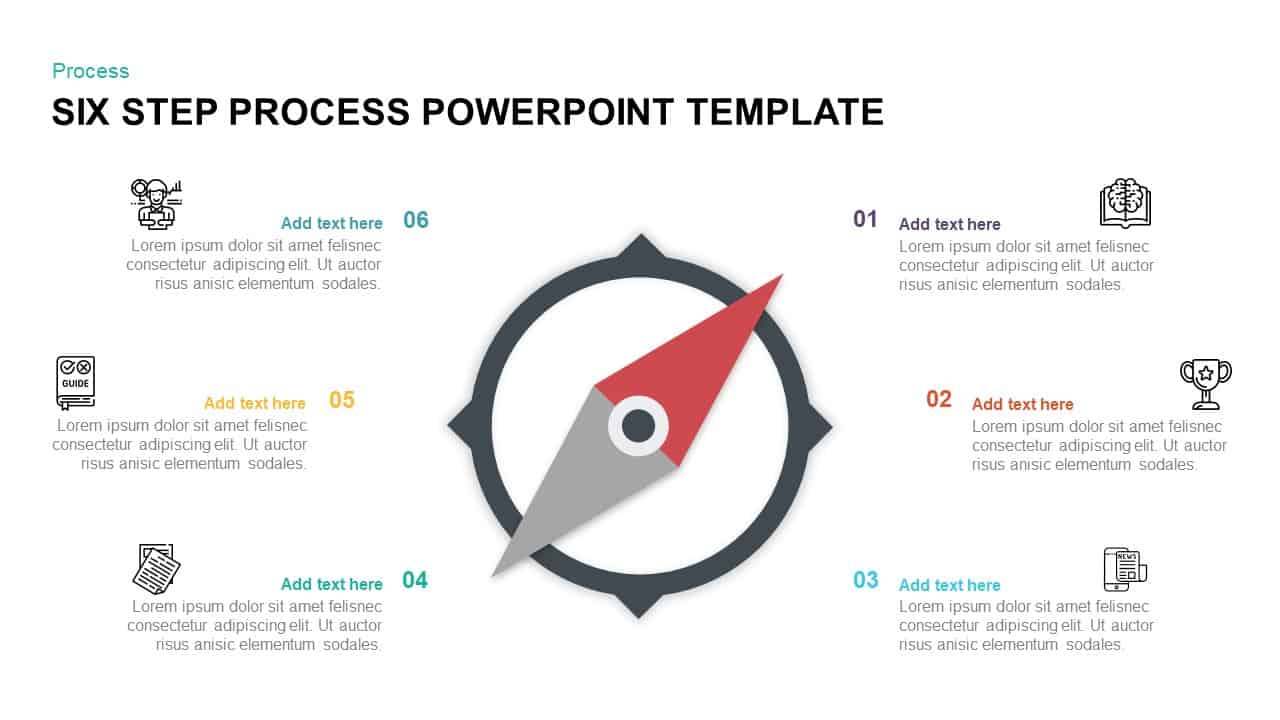
Compass-Themed Six-Step Process Diagram Template for PowerPoint & Google Slides
Process
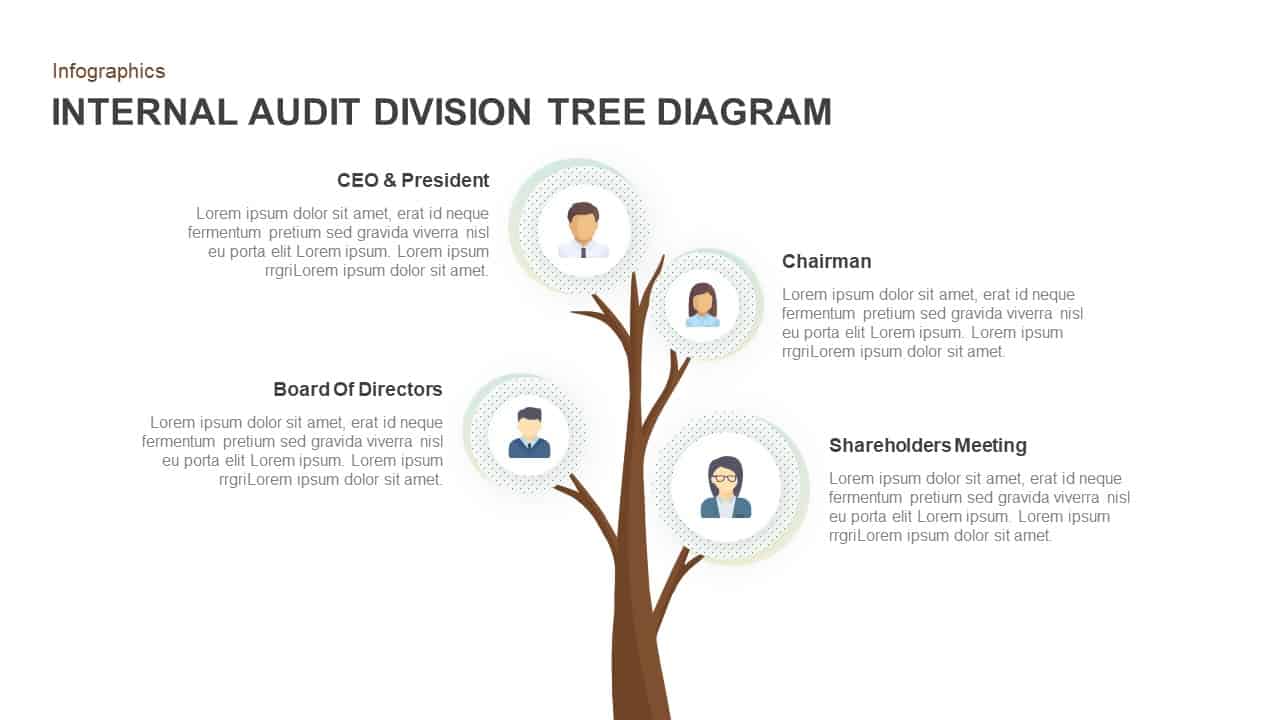
Internal Audit Division Tree Diagram Template for PowerPoint & Google Slides
Org Chart
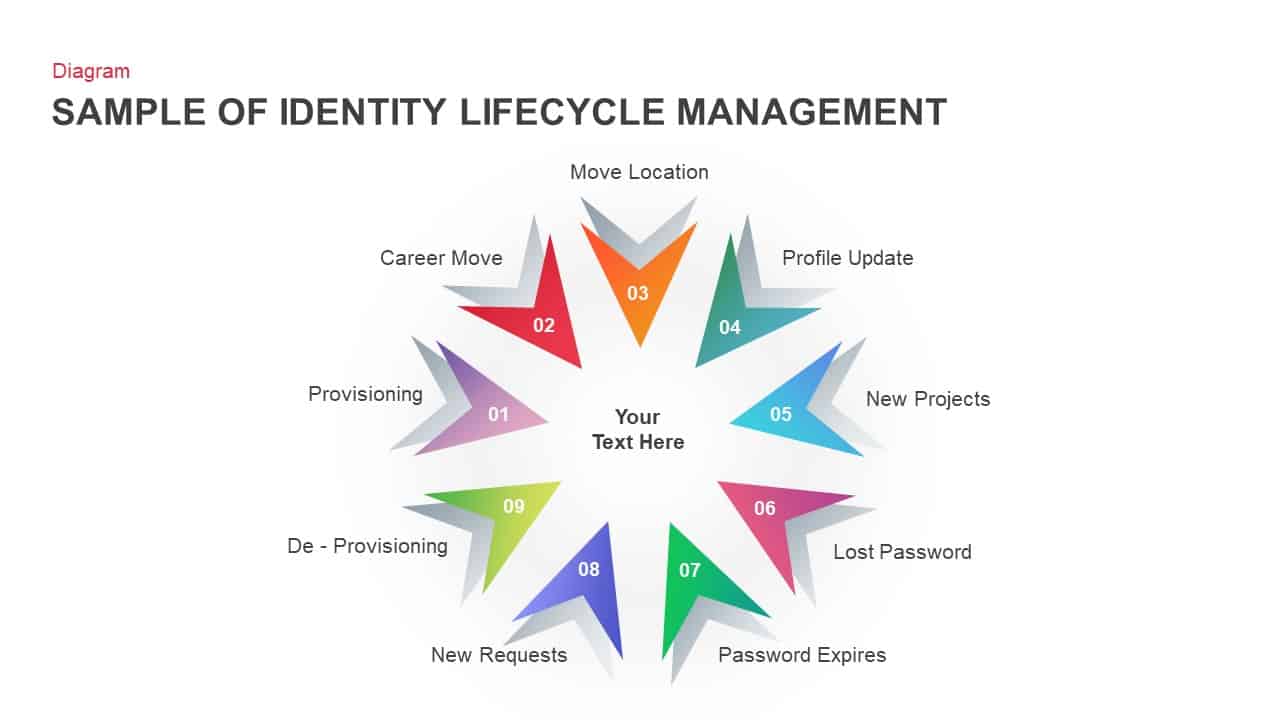
Identity Lifecycle Diagram Template for PowerPoint & Google Slides
Circular
Value Chain Circular Process Diagram Template for PowerPoint & Google Slides
Business Models
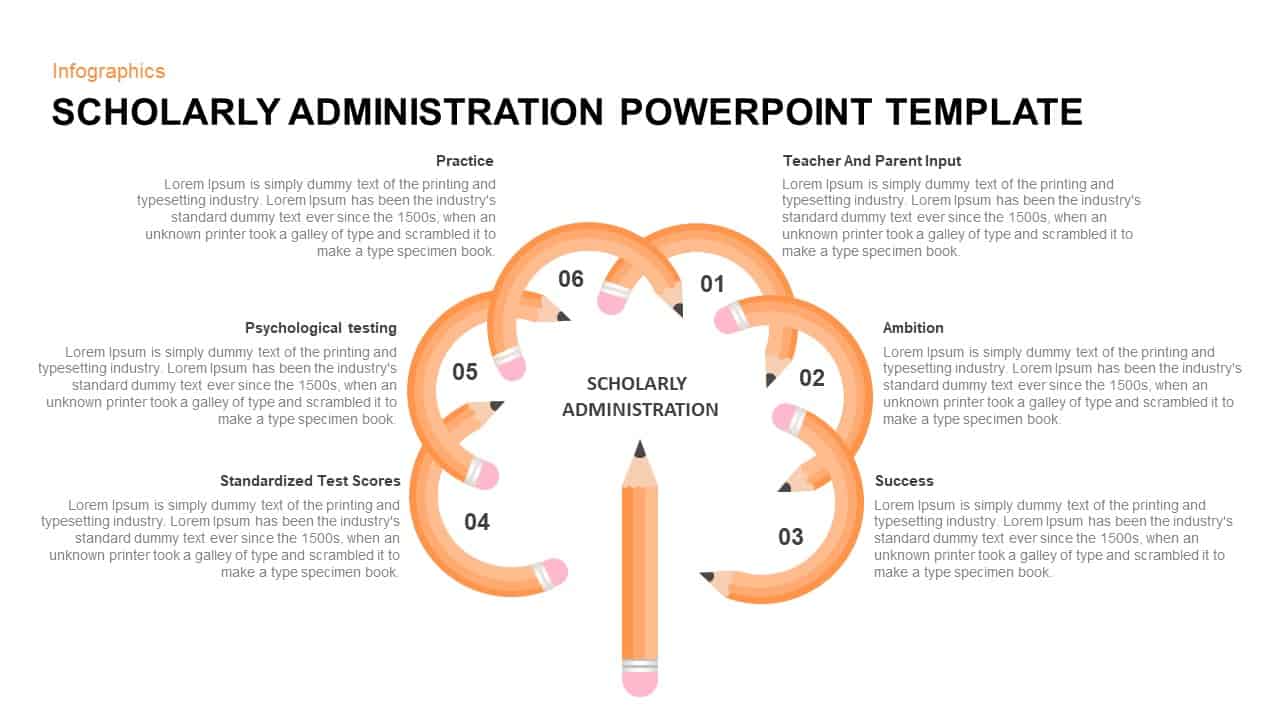
Scholarly Administration Loop Diagram Template for PowerPoint & Google Slides
Process
3D Block Arrow Infographic Diagram Template for PowerPoint & Google Slides
Arrow
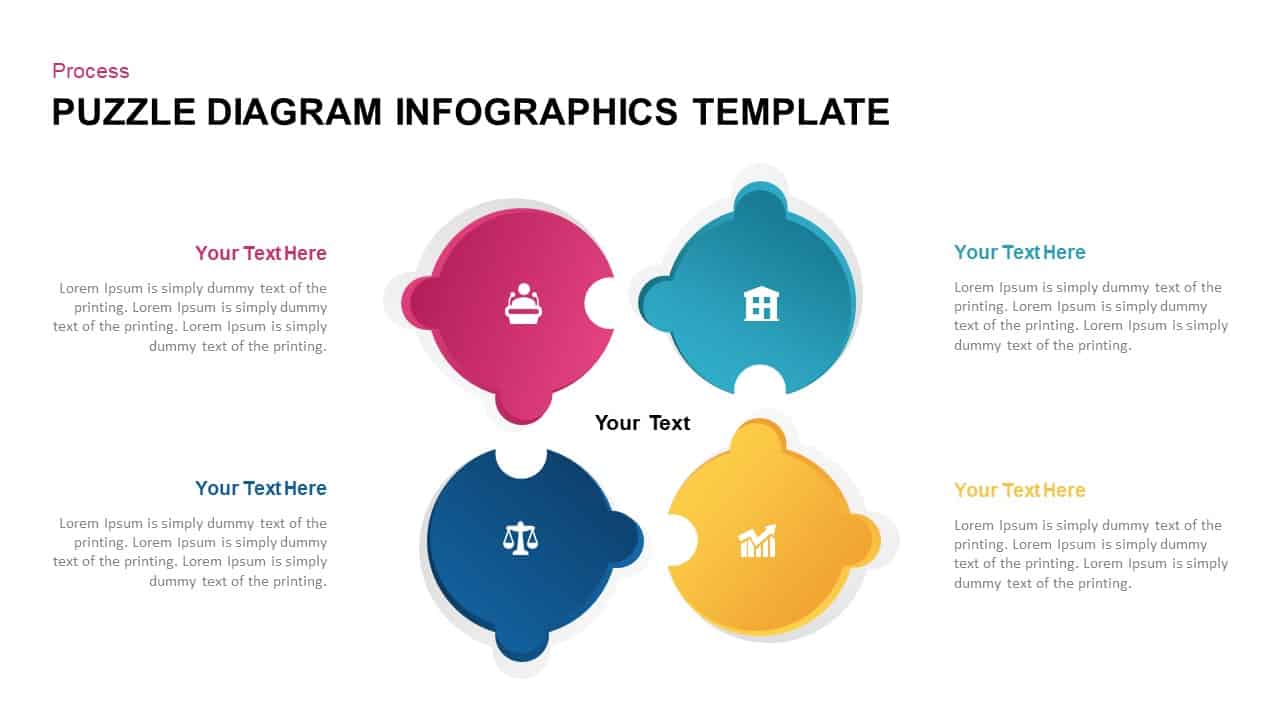
Four-Step Puzzle Diagram Infographic Template for PowerPoint & Google Slides
Process
Creative Tree Diagram template for PowerPoint & Google Slides
Process

2-8 Step Circular Diagram Template for PowerPoint & Google Slides
Infographics
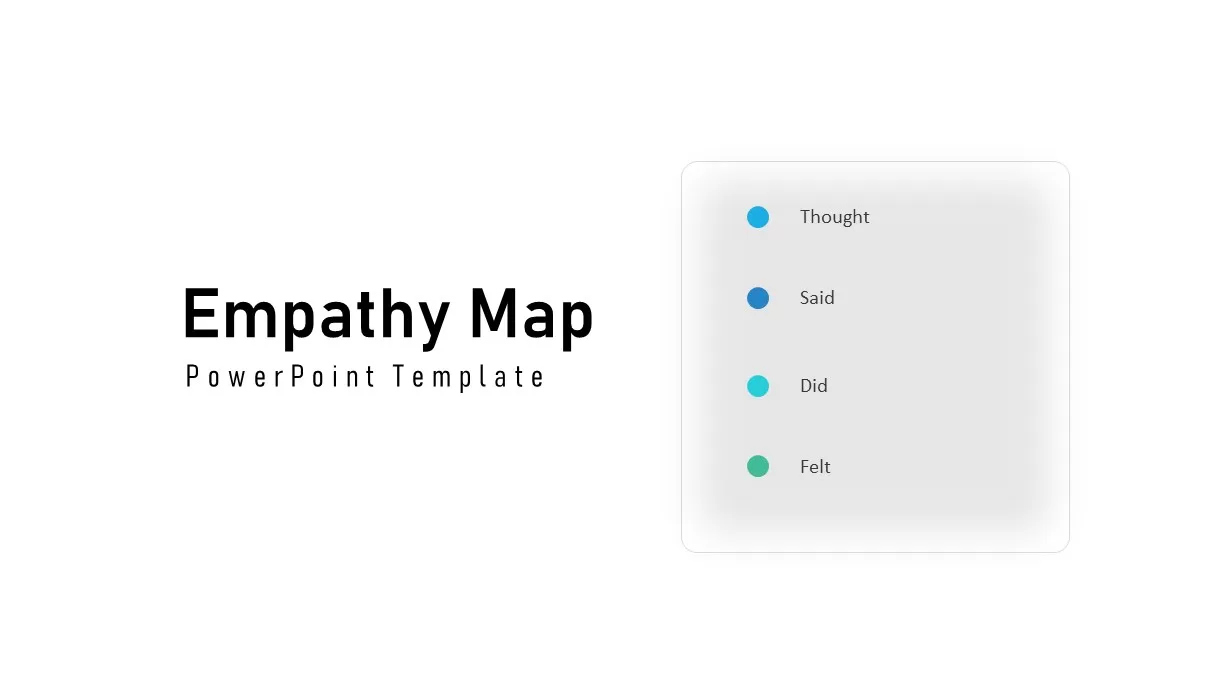
Interactive Empathy Map Diagram Template for PowerPoint & Google Slides
Process
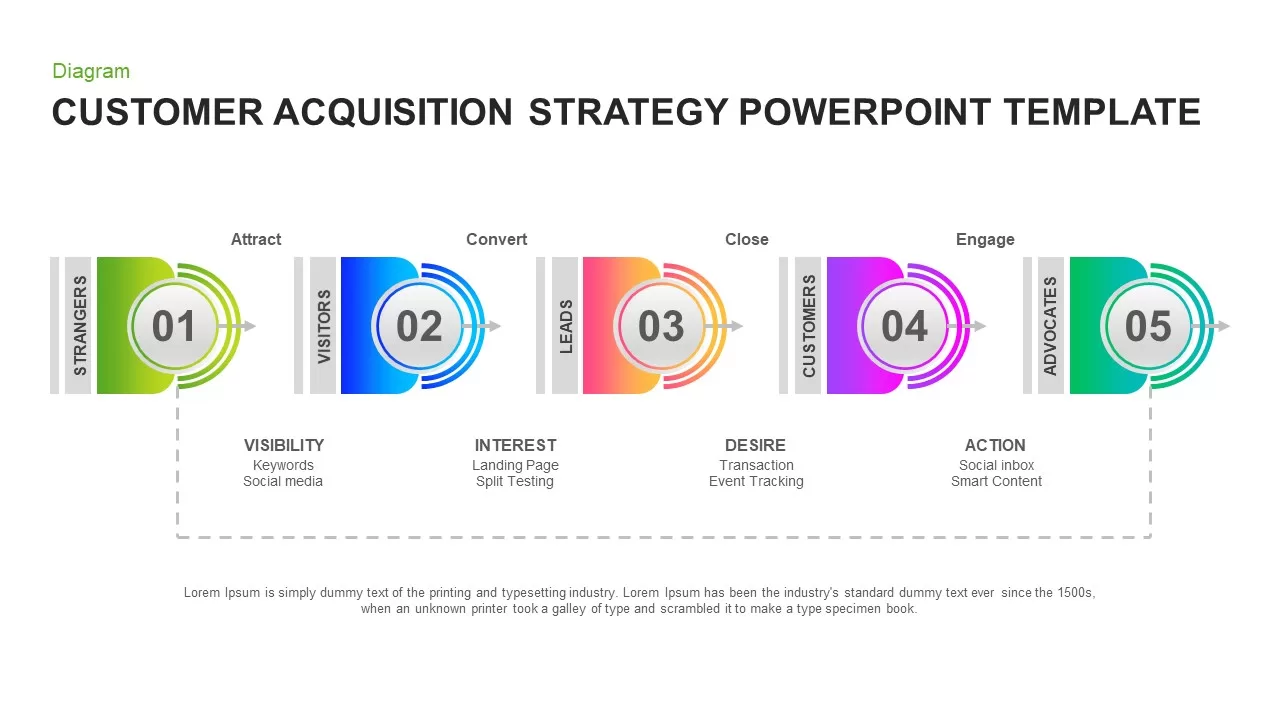
Customer Acquisition Strategy Diagram Template for PowerPoint & Google Slides
Customer Journey
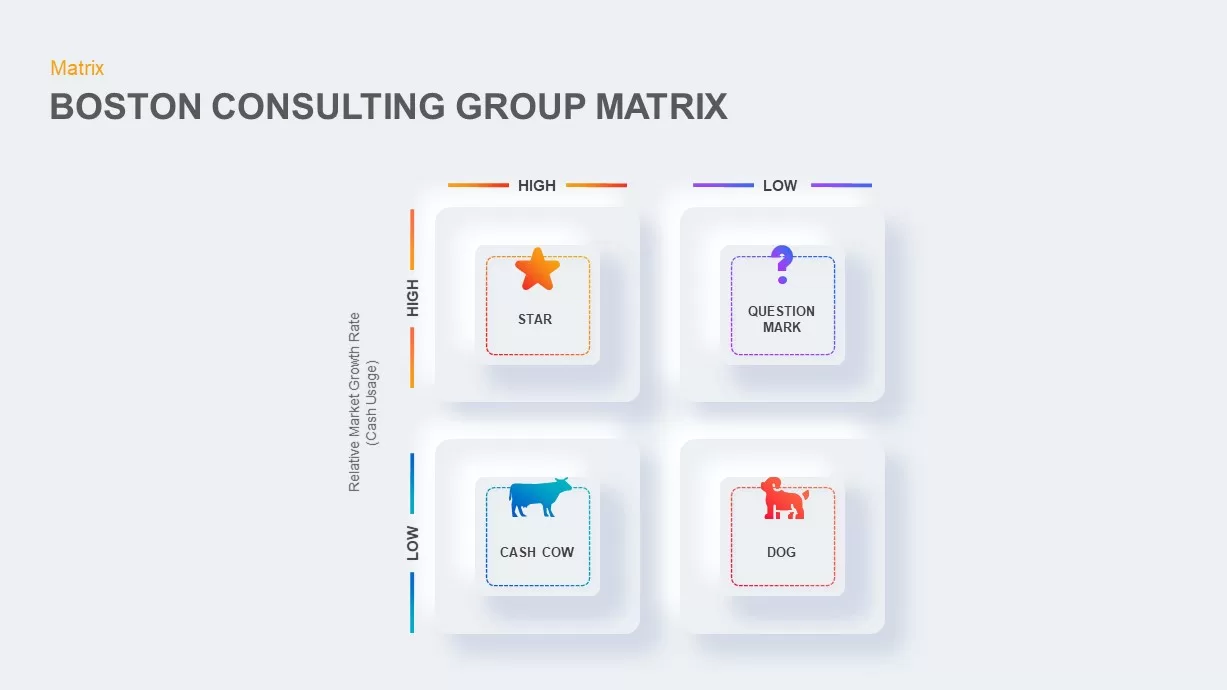
Boston Consulting Group Matrix Diagram Template for PowerPoint & Google Slides
BCG
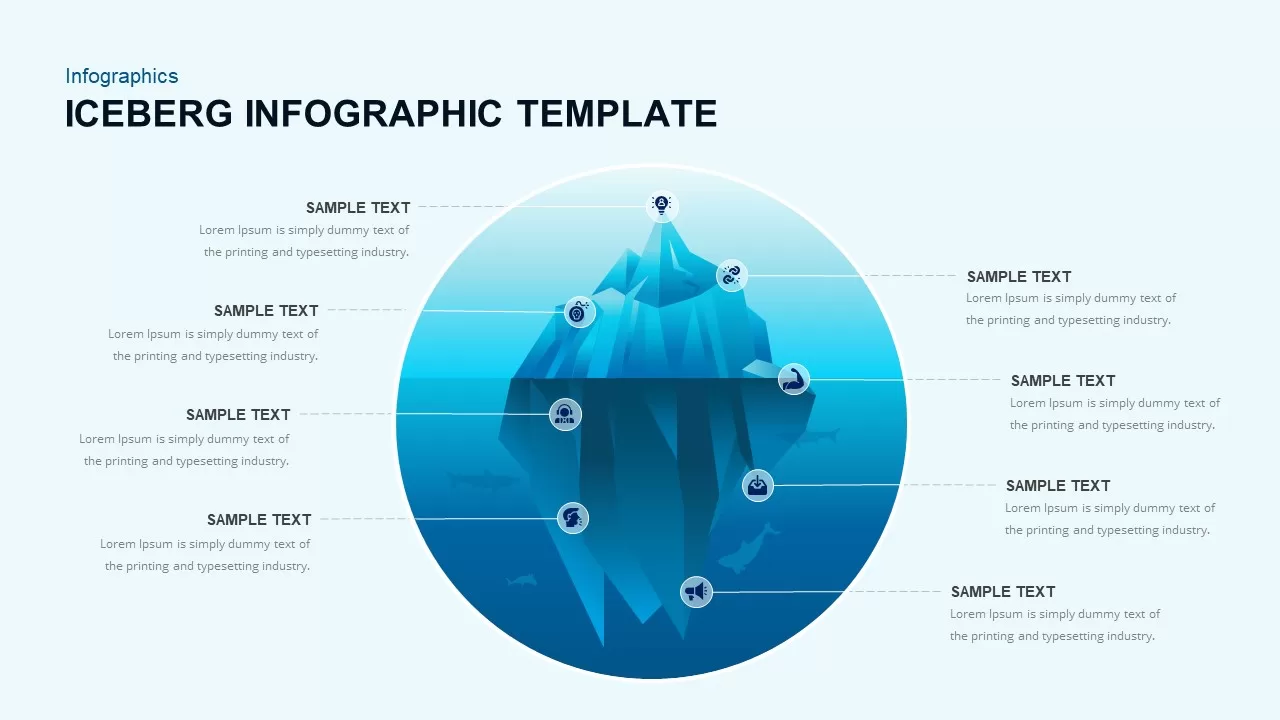
Iceberg Infographic Diagram template for PowerPoint & Google Slides
Opportunities Challenges
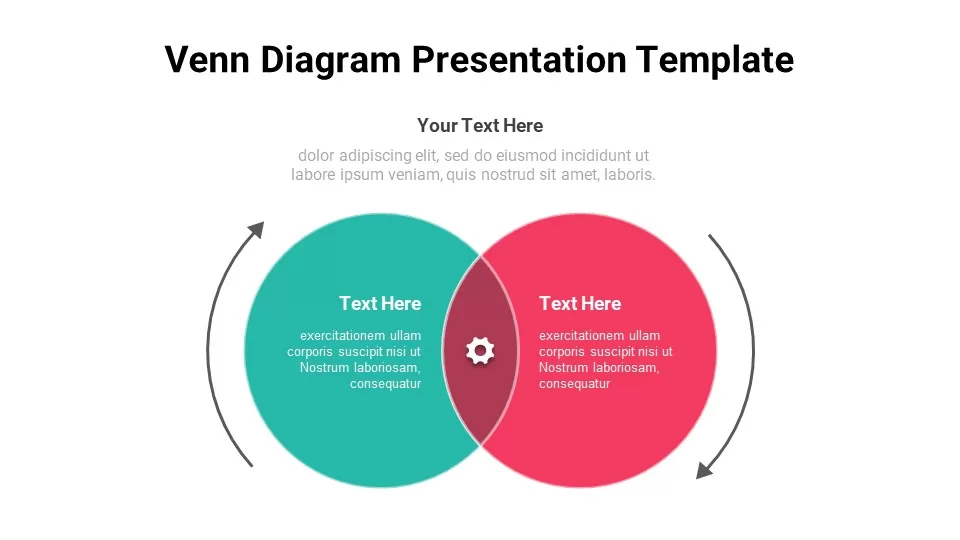
Free Venn Diagram template for PowerPoint & Google Slides
Charts
Free
Concentric Circular Arrow Cycle Diagram Template for PowerPoint & Google Slides
Process
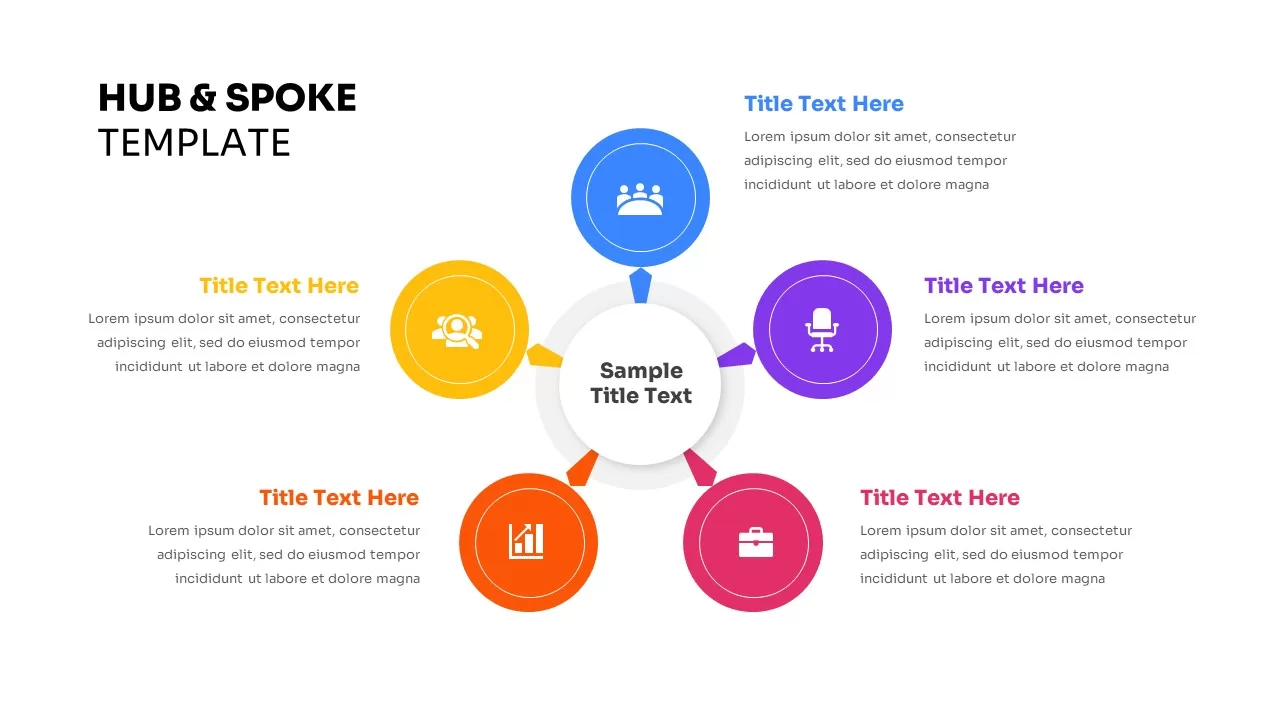
Five-Node Hub and Spoke Diagram Template for PowerPoint & Google Slides
Business Strategy
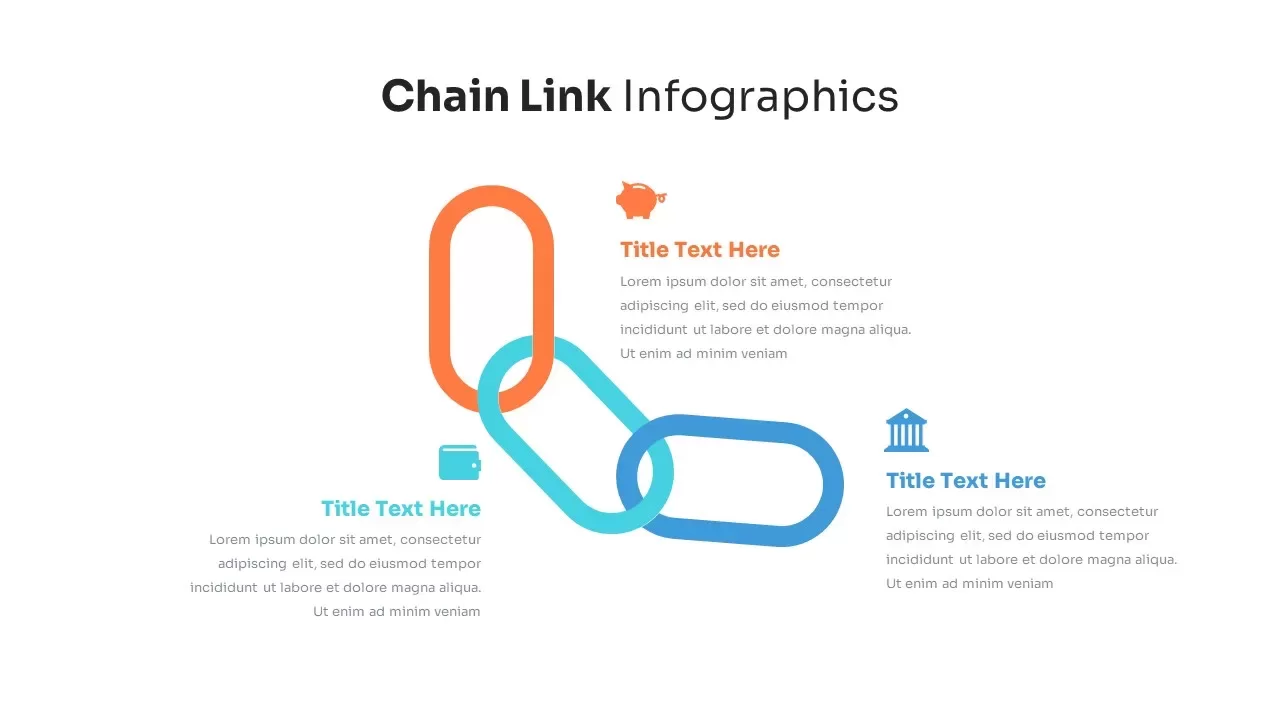
Chain Link Process Infographic Diagram Template for PowerPoint & Google Slides
Process
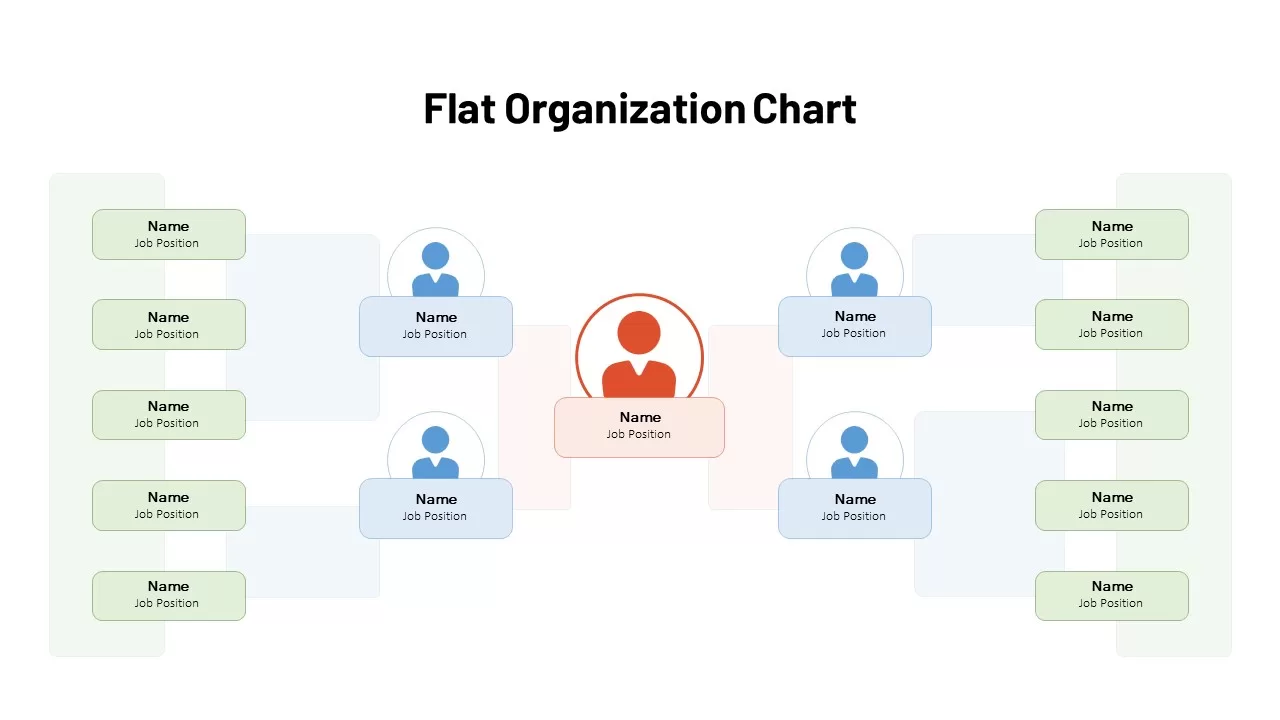
Flat Organization Chart Diagram Template for PowerPoint & Google Slides
Org Chart
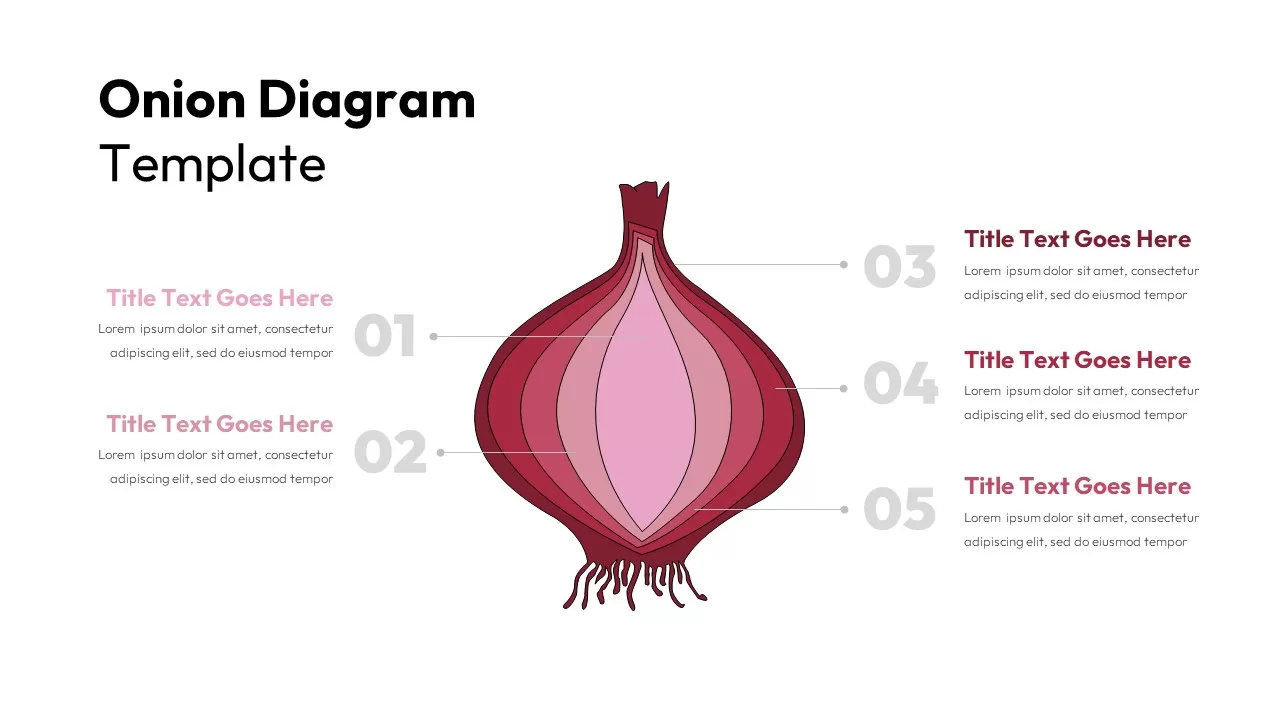
Five-Layer Onion Diagram Infographic Template for PowerPoint & Google Slides
Process
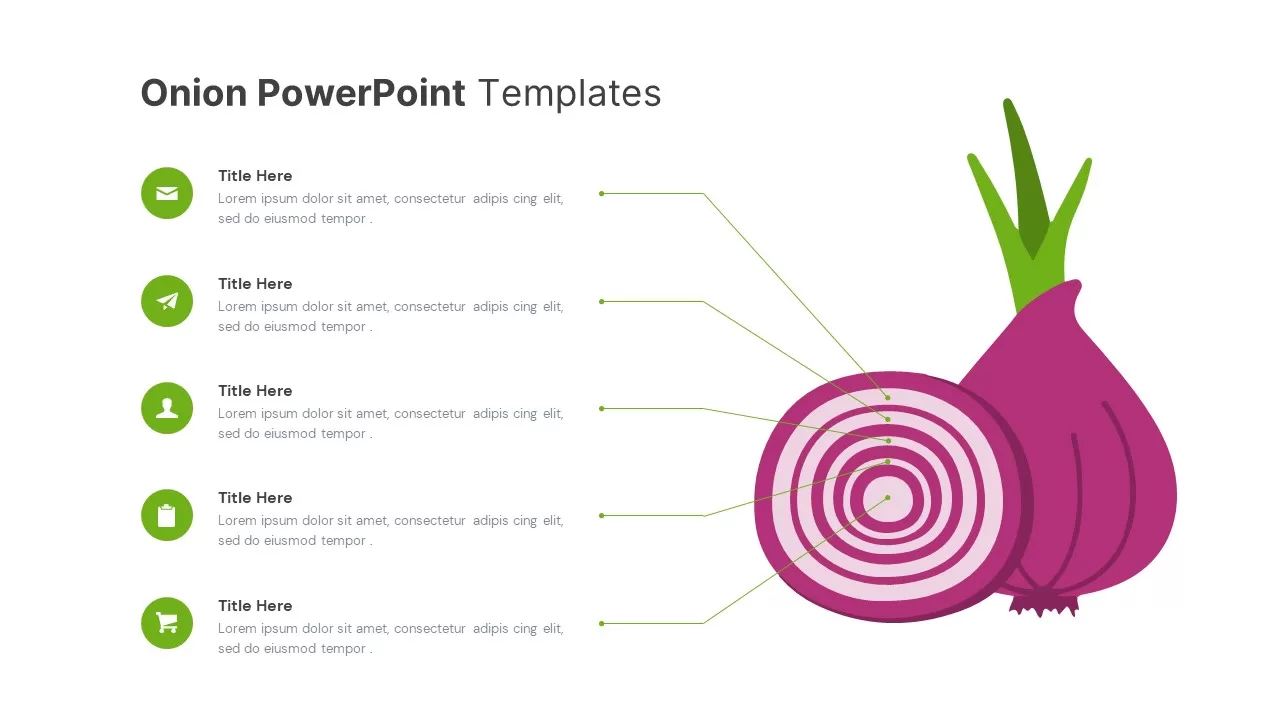
Onion Diagram Callout Template for PowerPoint & Google Slides
Process
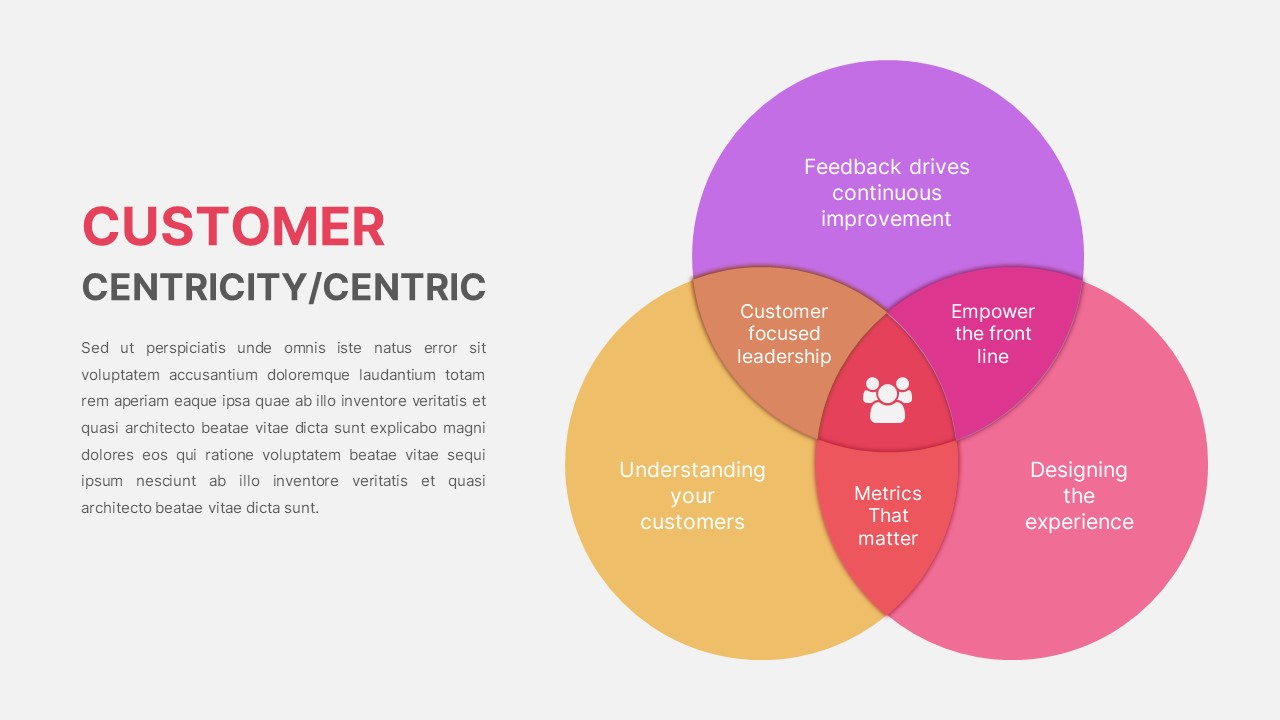
Customer Centricity Venn Diagram template for PowerPoint & Google Slides
Infographics
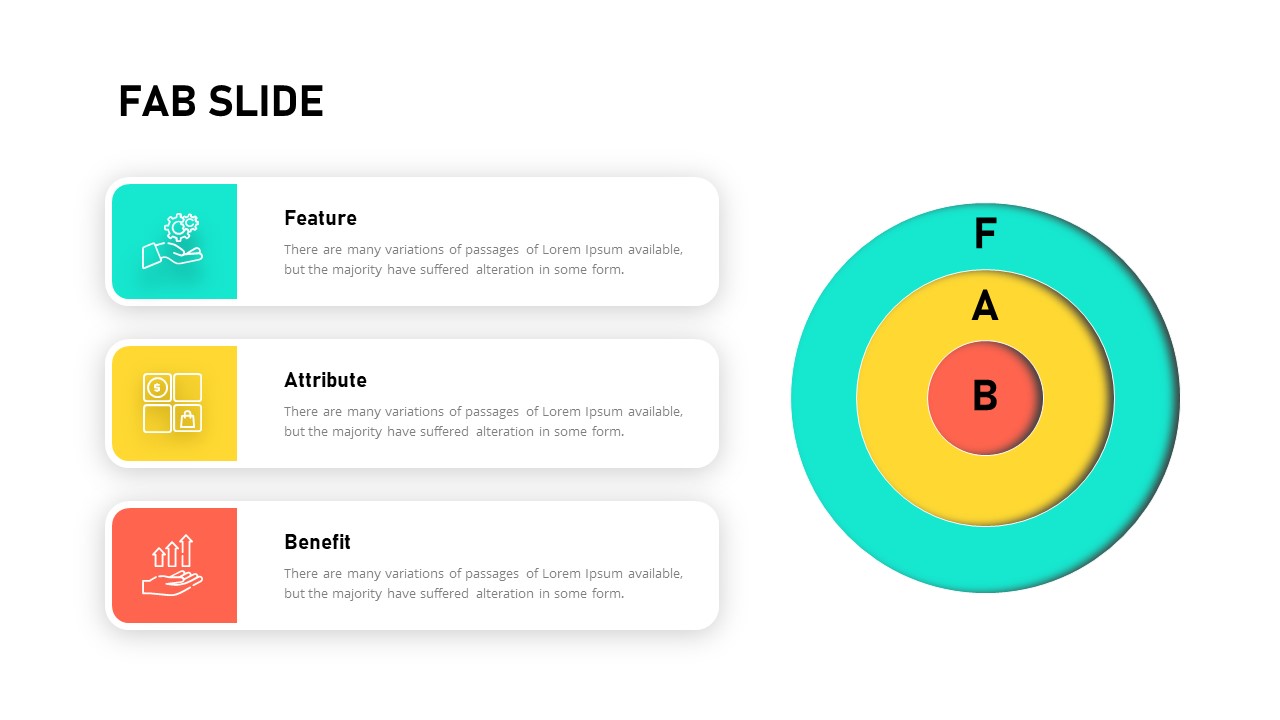
Feature-Attribute-Benefit Diagram Slide Template for PowerPoint & Google Slides
Circular
Three-Stage S Curve Growth Diagram Template for PowerPoint & Google Slides
Process
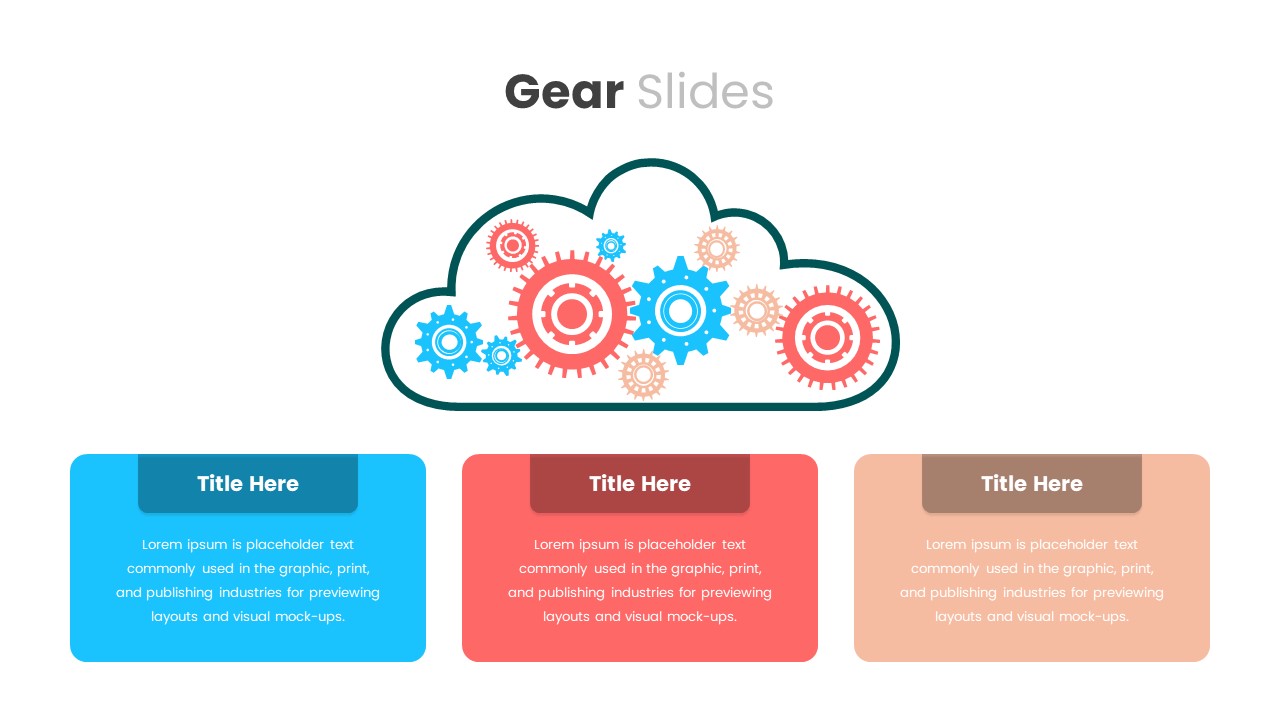
Cloud Gear Automation Diagram Template for PowerPoint & Google Slides
Cloud Computing
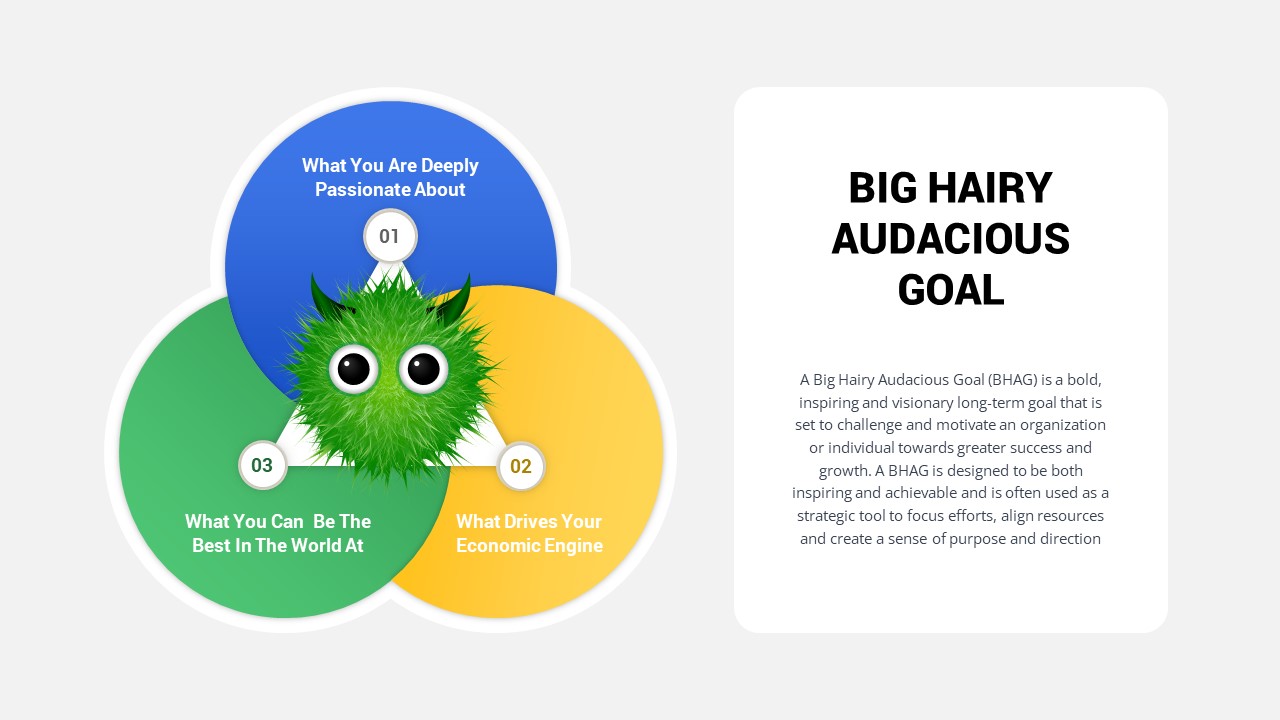
Big Hairy Audacious Goal Venn Diagram Template for PowerPoint & Google Slides
Circular
Professional 6 Circle Venn Diagram Template for PowerPoint & Google Slides
Circular
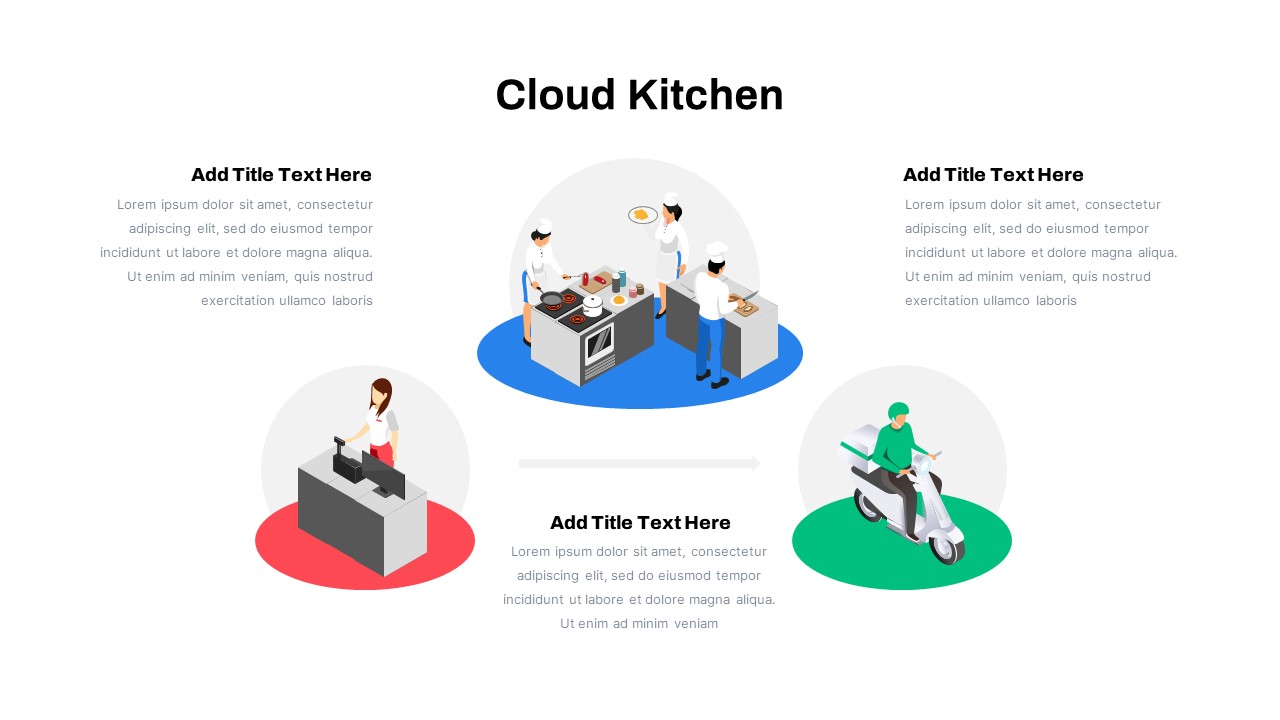
Cloud Kitchen Business Process Diagram Template for PowerPoint & Google Slides
Process
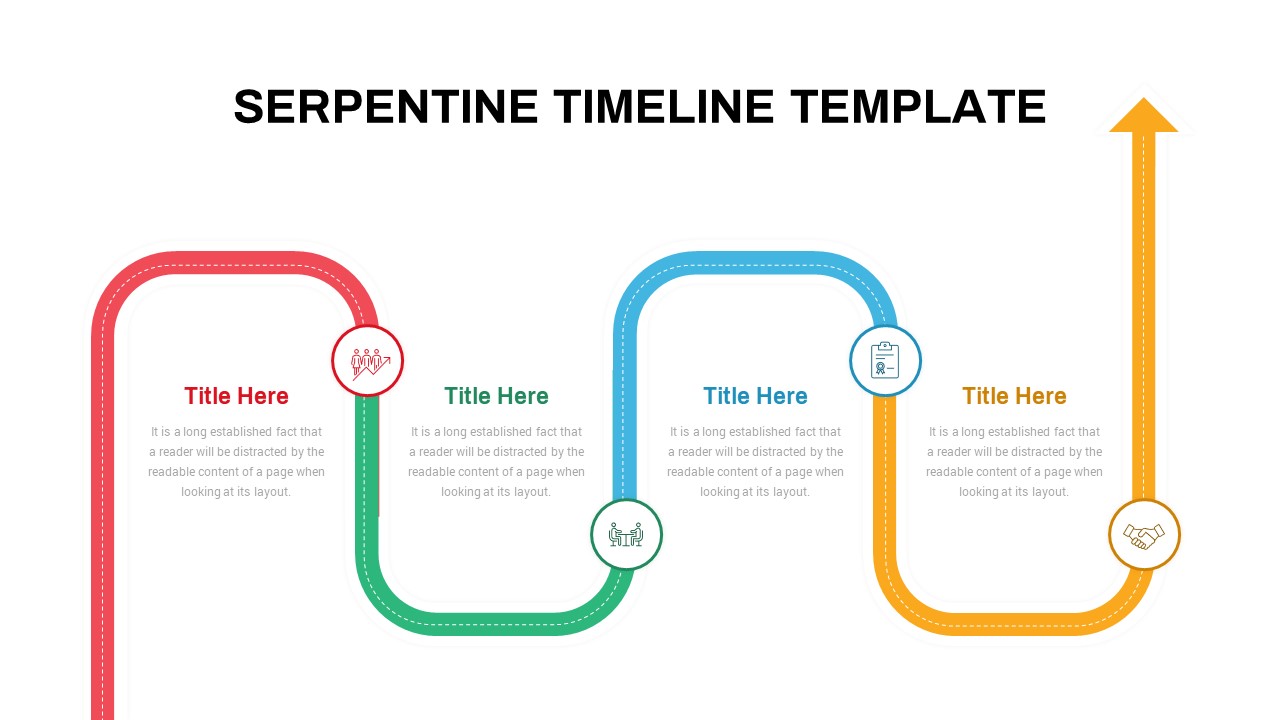
Interactive Serpentine Timeline Diagram Template for PowerPoint & Google Slides
Timeline
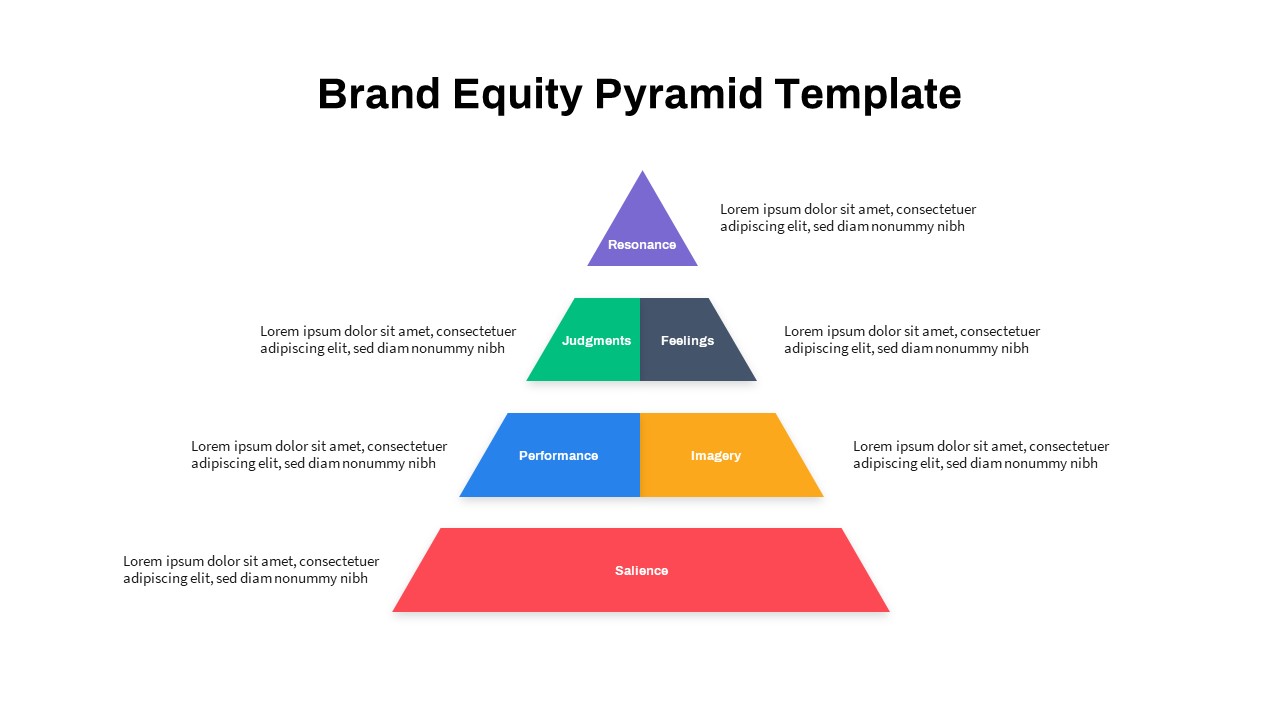
Strategic Brand Equity Pyramid Diagram Template for PowerPoint & Google Slides
Pyramid
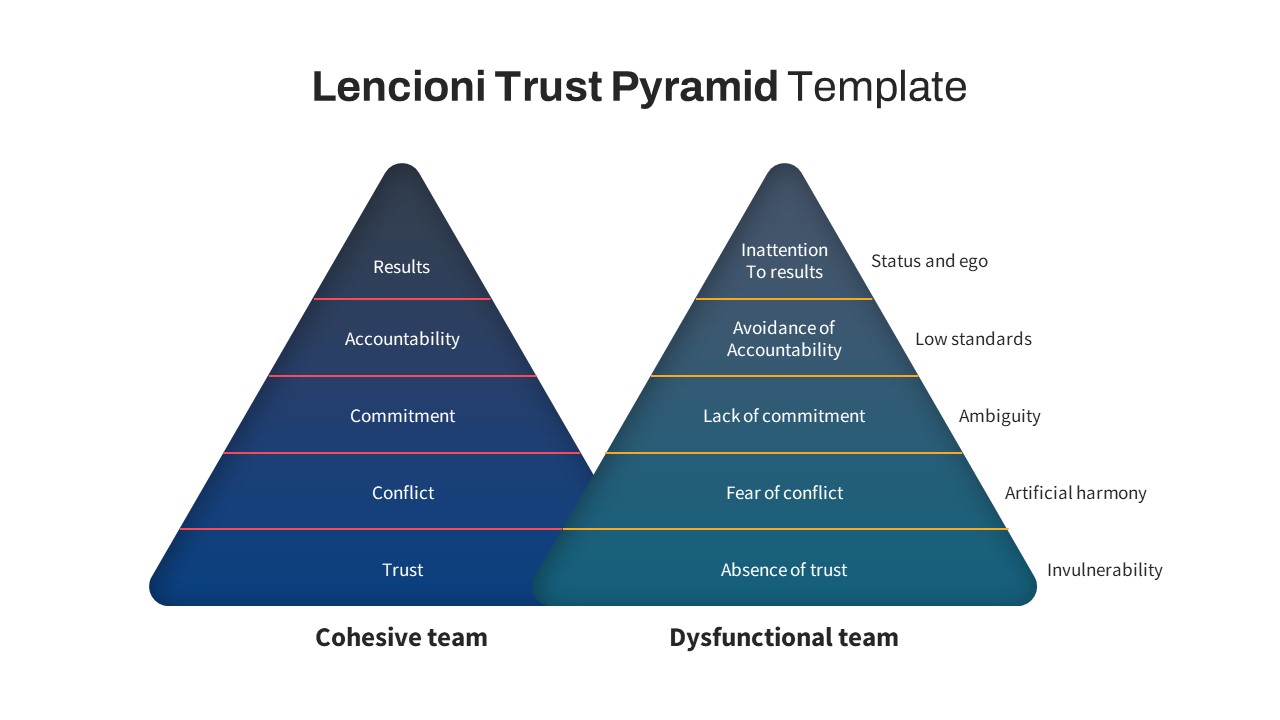
Lencioni Trust Pyramid Diagram Template for PowerPoint & Google Slides
Pyramid
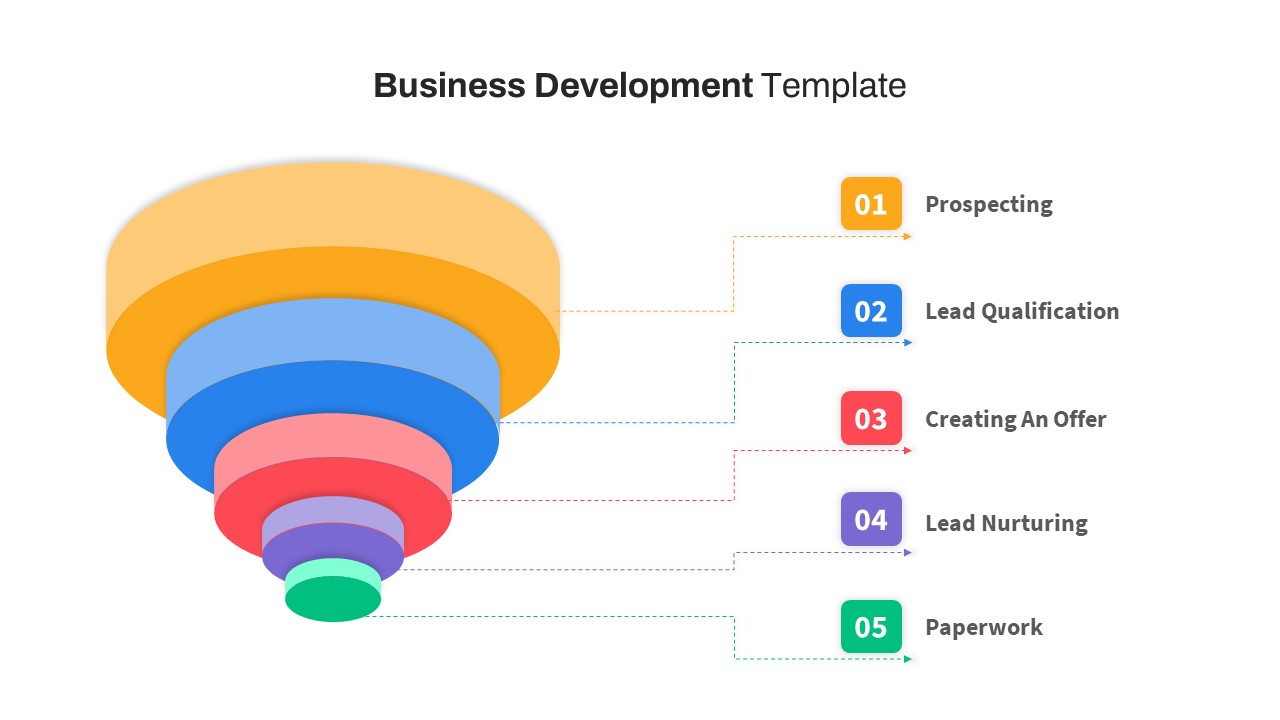
Free Business Development Funnel Diagram Template for PowerPoint & Google Slides
Marketing Funnel
Free
Bubble Chart Scatter, Diagram & Matrix Template for PowerPoint & Google Slides
Comparison Chart
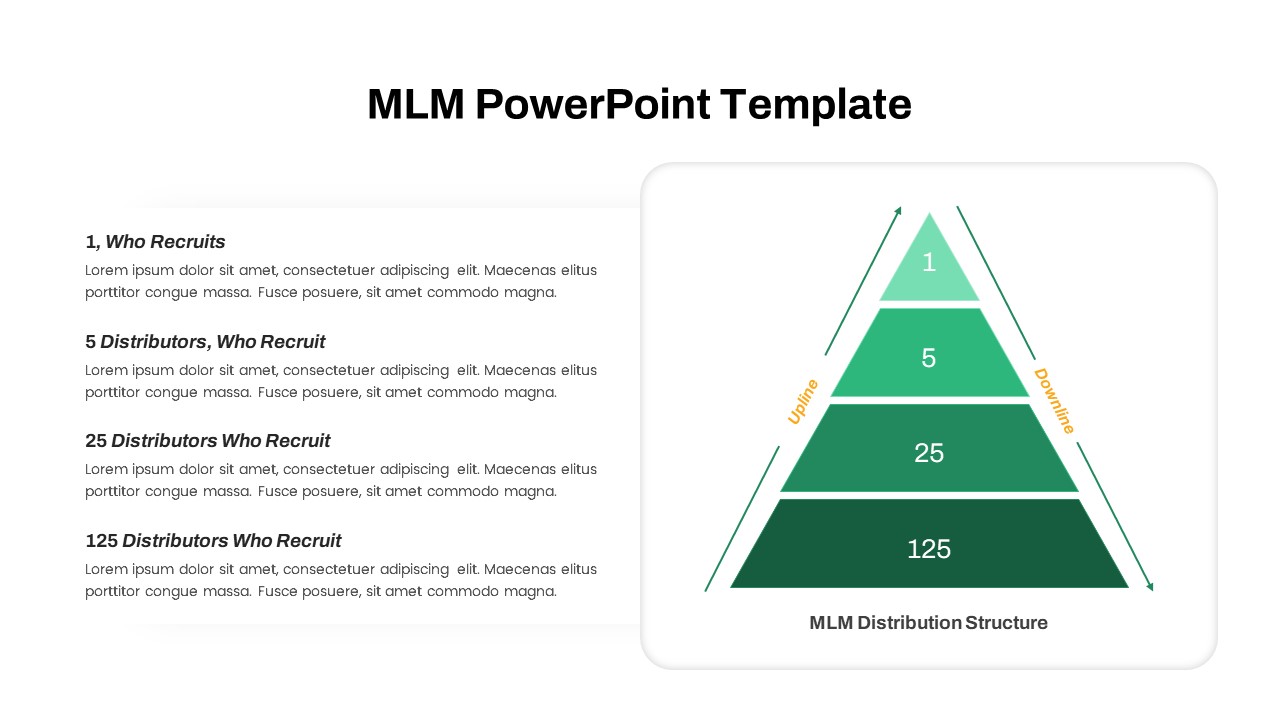
MLM Distribution Pyramid Diagram Template for PowerPoint & Google Slides
Business Models
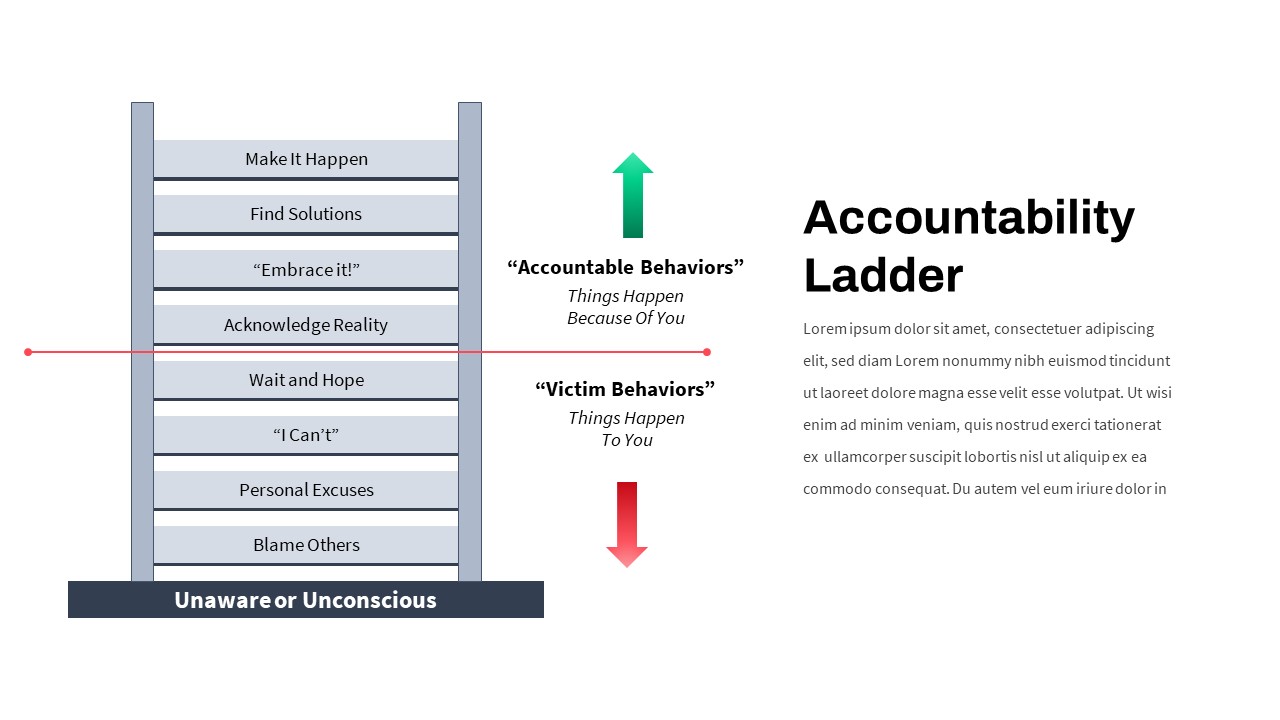
Business Accountability Ladder Diagram Template for PowerPoint & Google Slides
Process
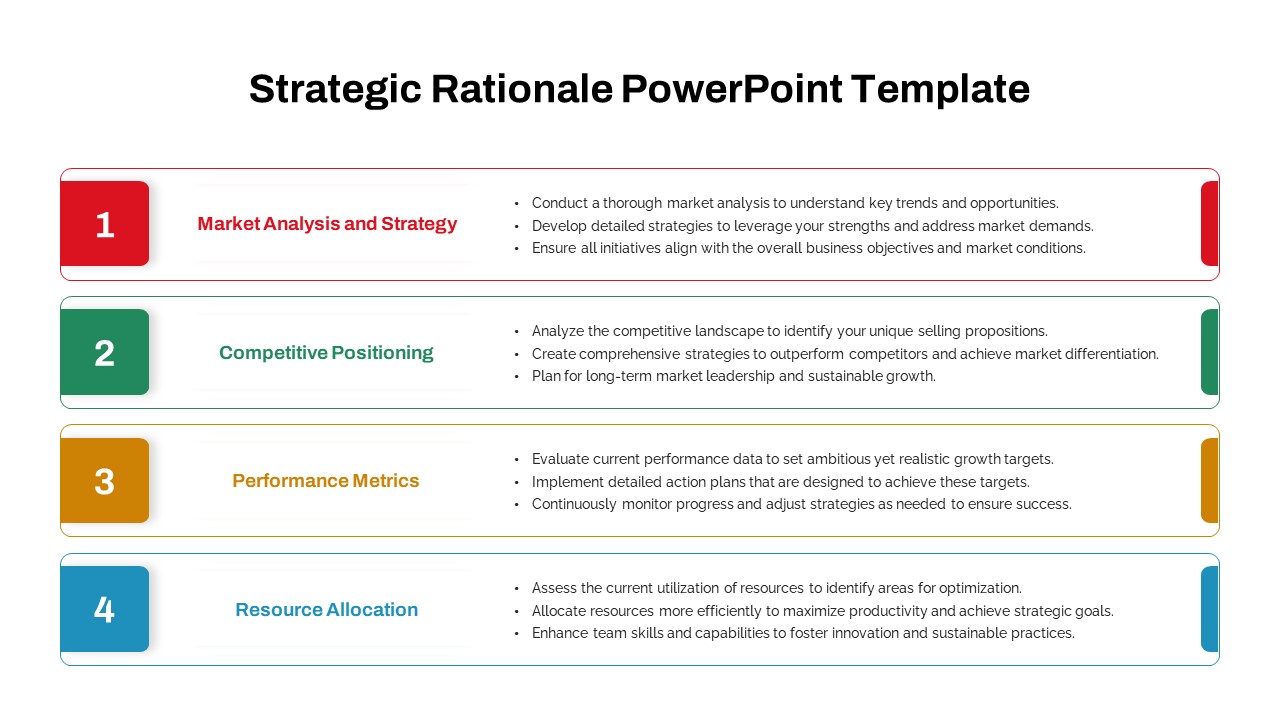
Strategic Rationale Framework Diagram Template for PowerPoint & Google Slides
Process
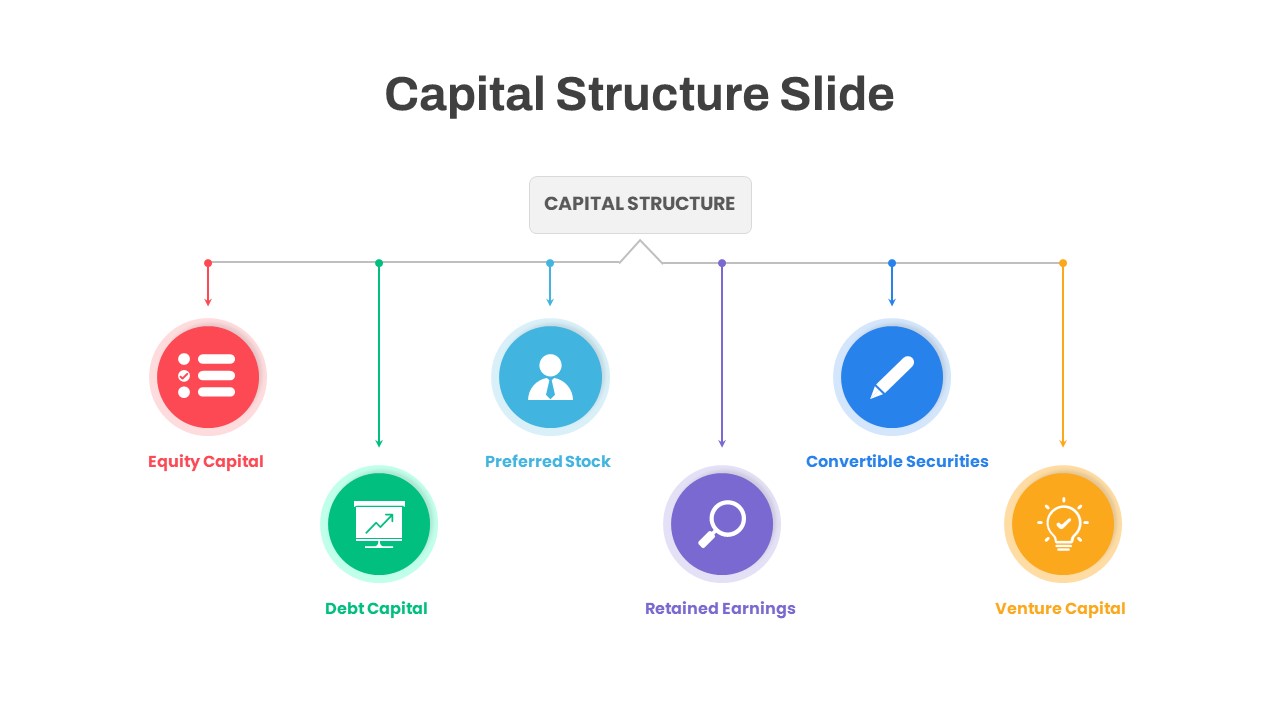
Capital Structure Hub & Spoke Diagram Template for PowerPoint & Google Slides
Process
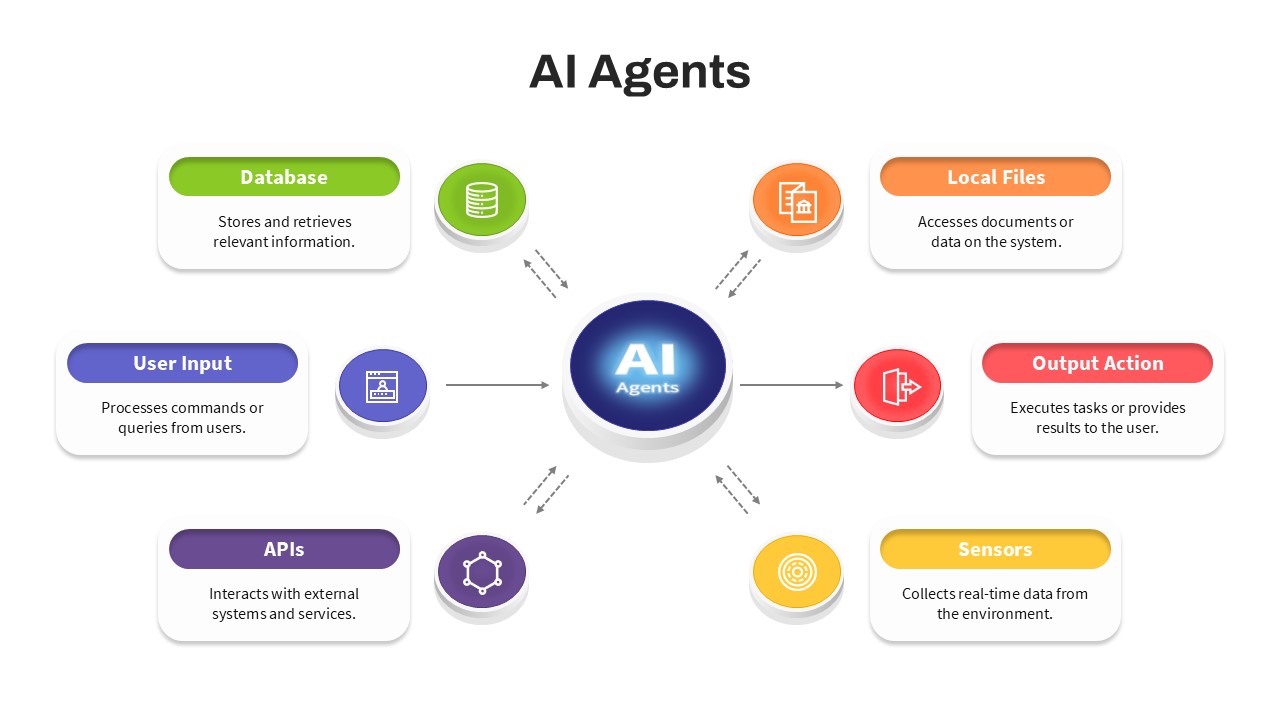
AI Agents Hub and Spoke Diagram Template for PowerPoint & Google Slides
AI
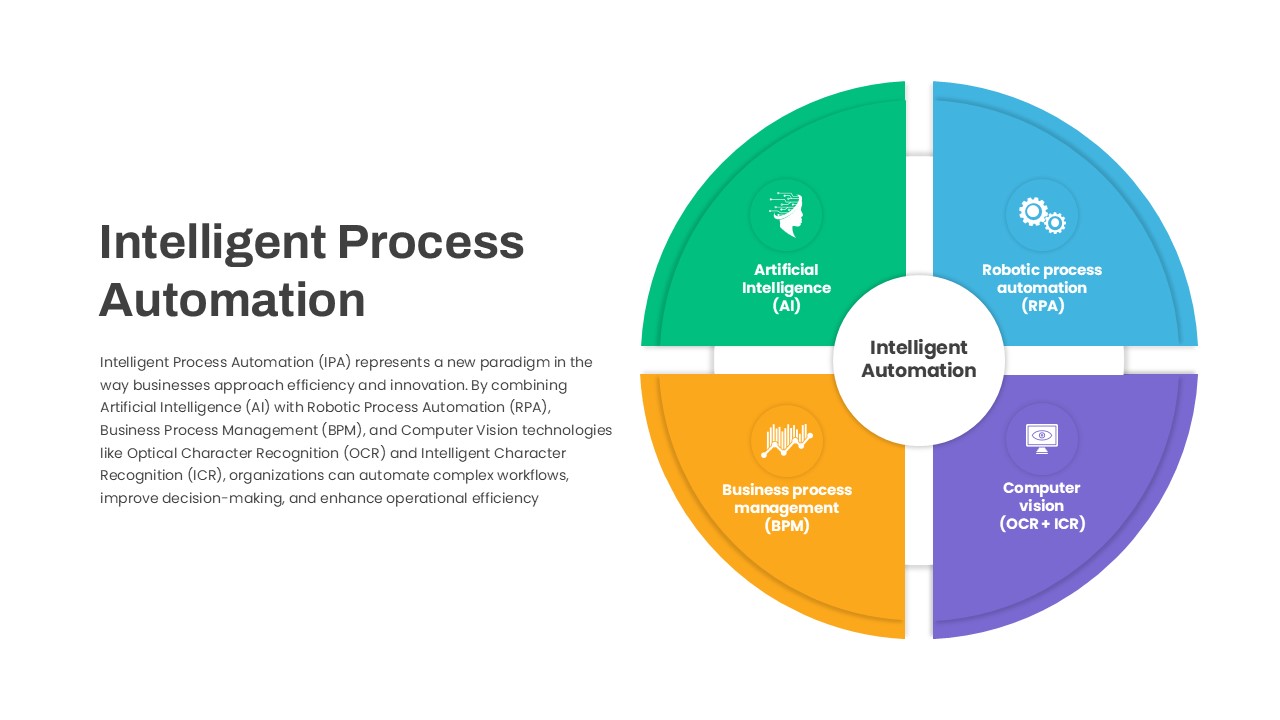
Intelligent Process Automation Diagram Template for PowerPoint & Google Slides
Circular
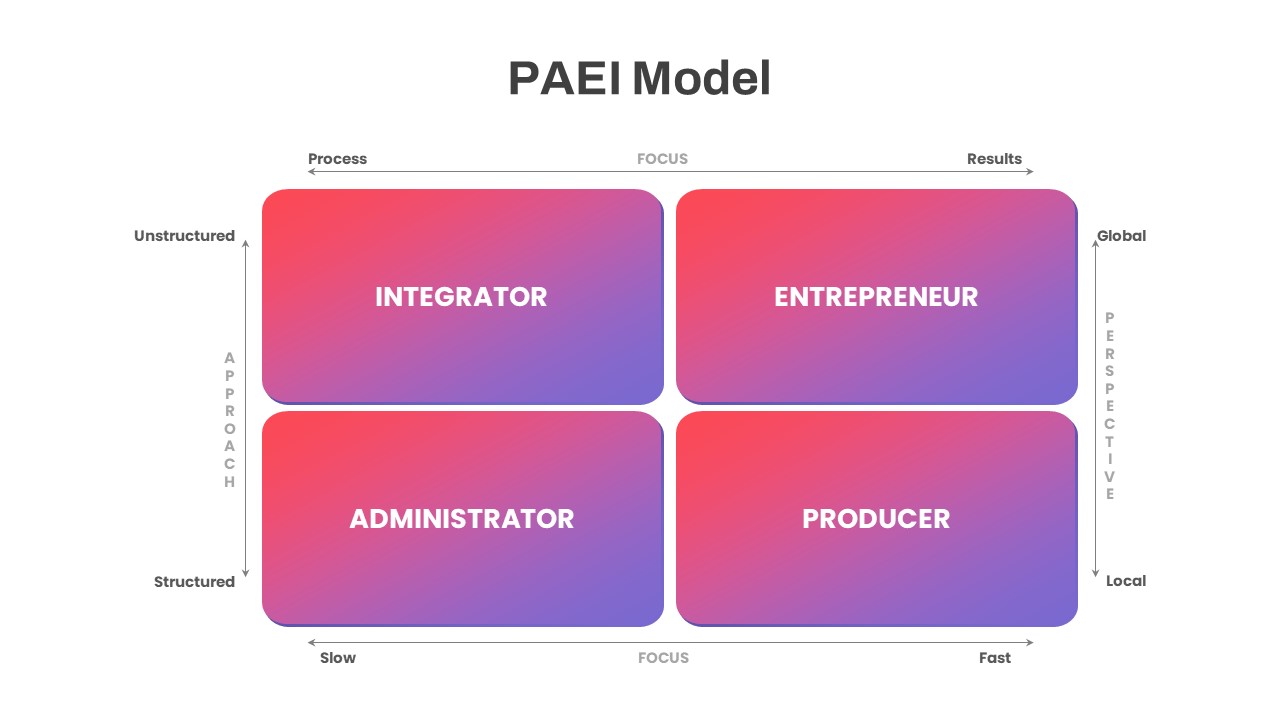
PAEI Leadership Roles 2×2 Matrix Diagram Template for PowerPoint & Google Slides
Business Models
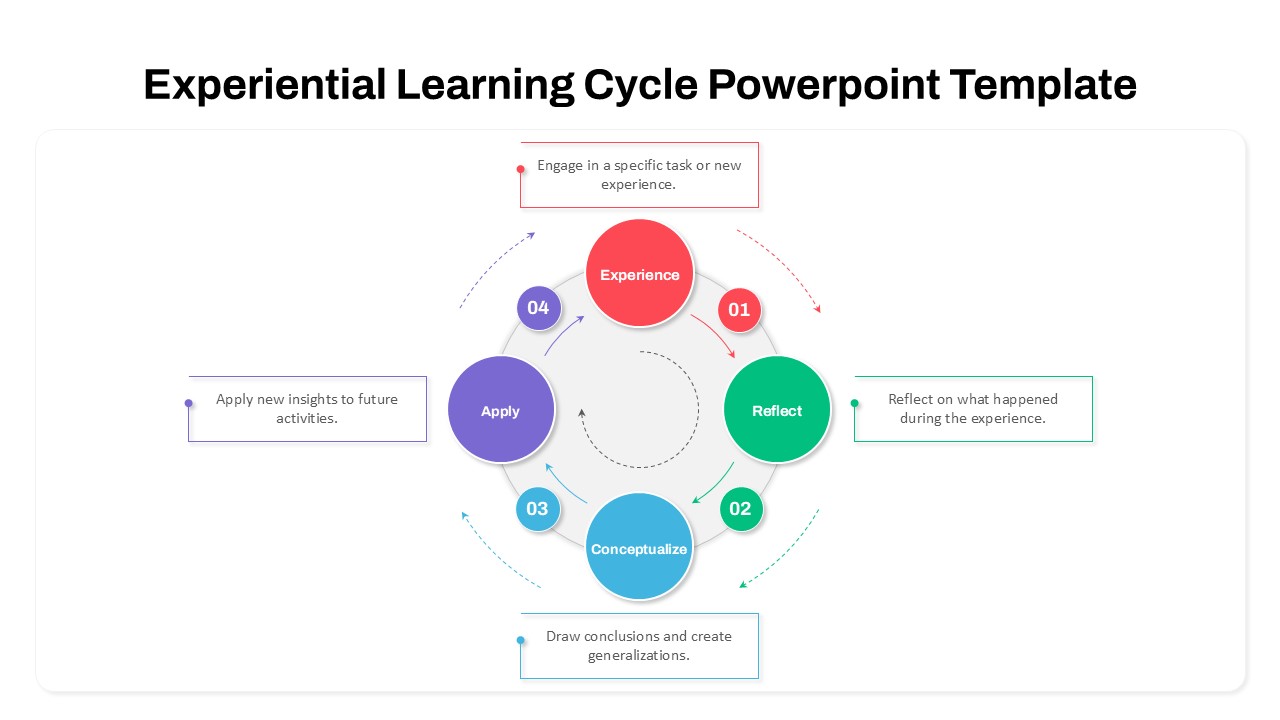
Experiential Learning Cycle Diagram Template for PowerPoint & Google Slides
Circular
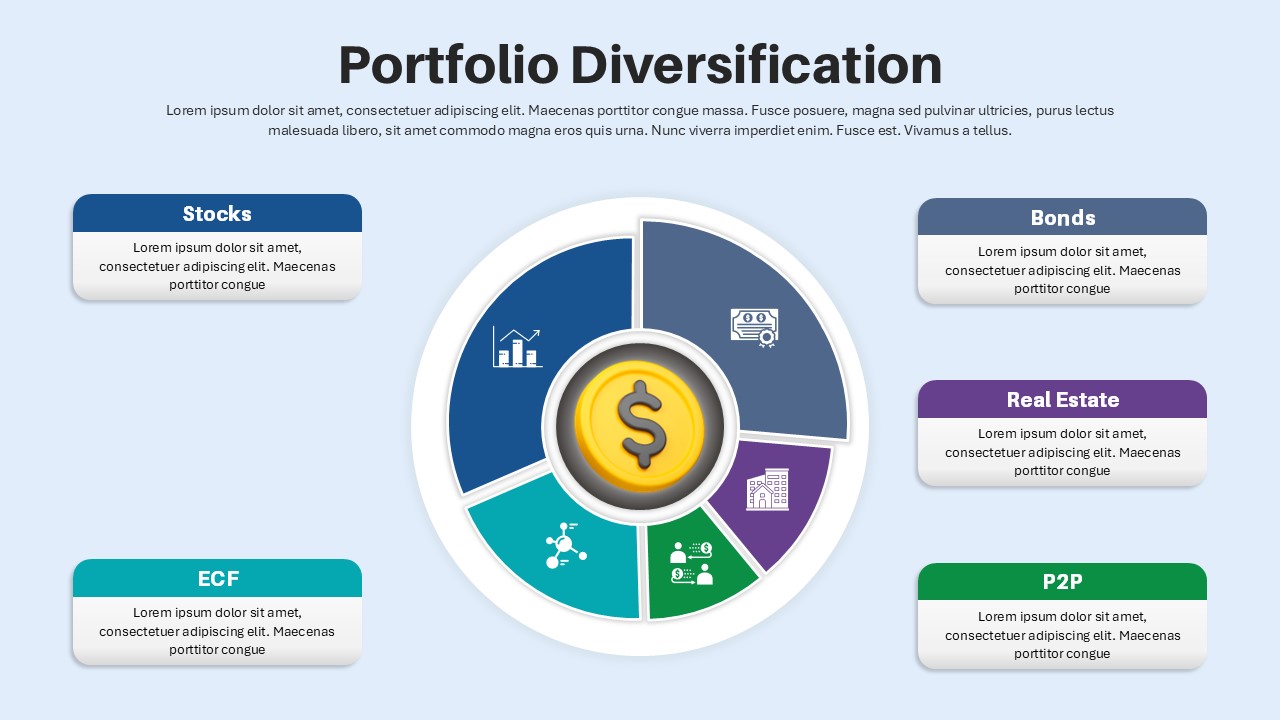
Portfolio Diversification Diagram Template for PowerPoint & Google Slides
Circular
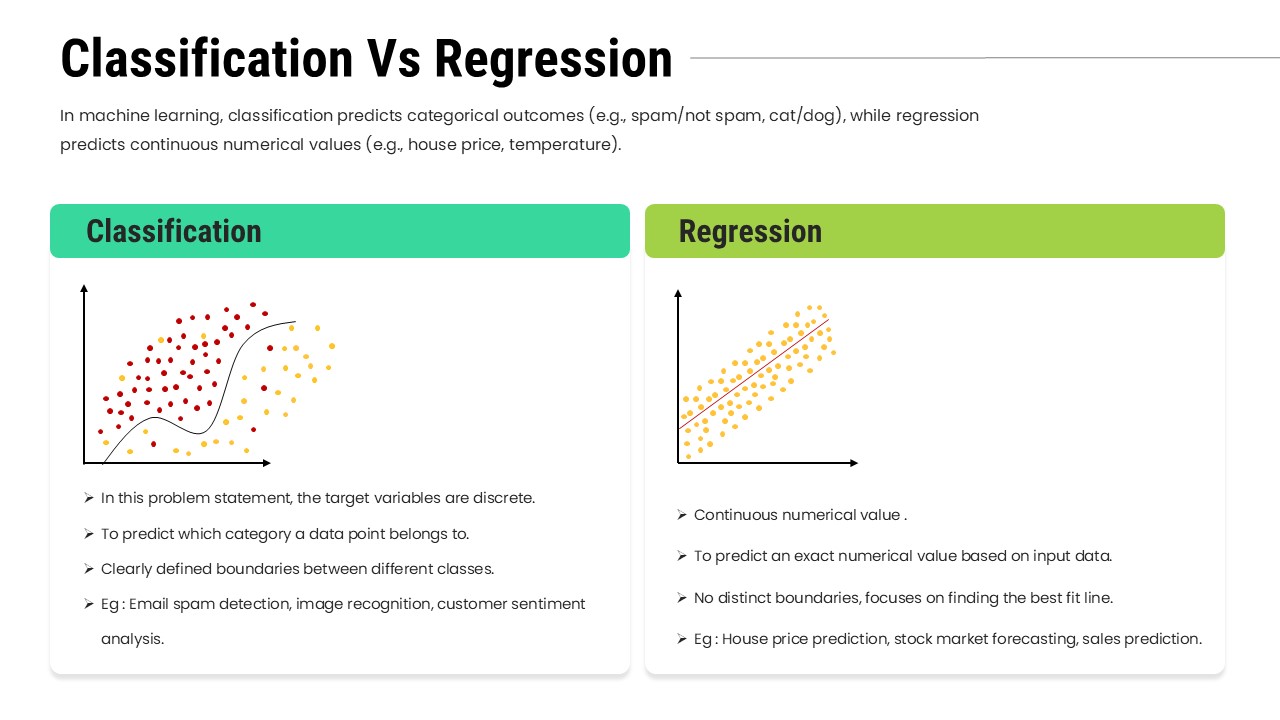
Classification Vs Regression Diagram Template for PowerPoint & Google Slides
Machine Learning
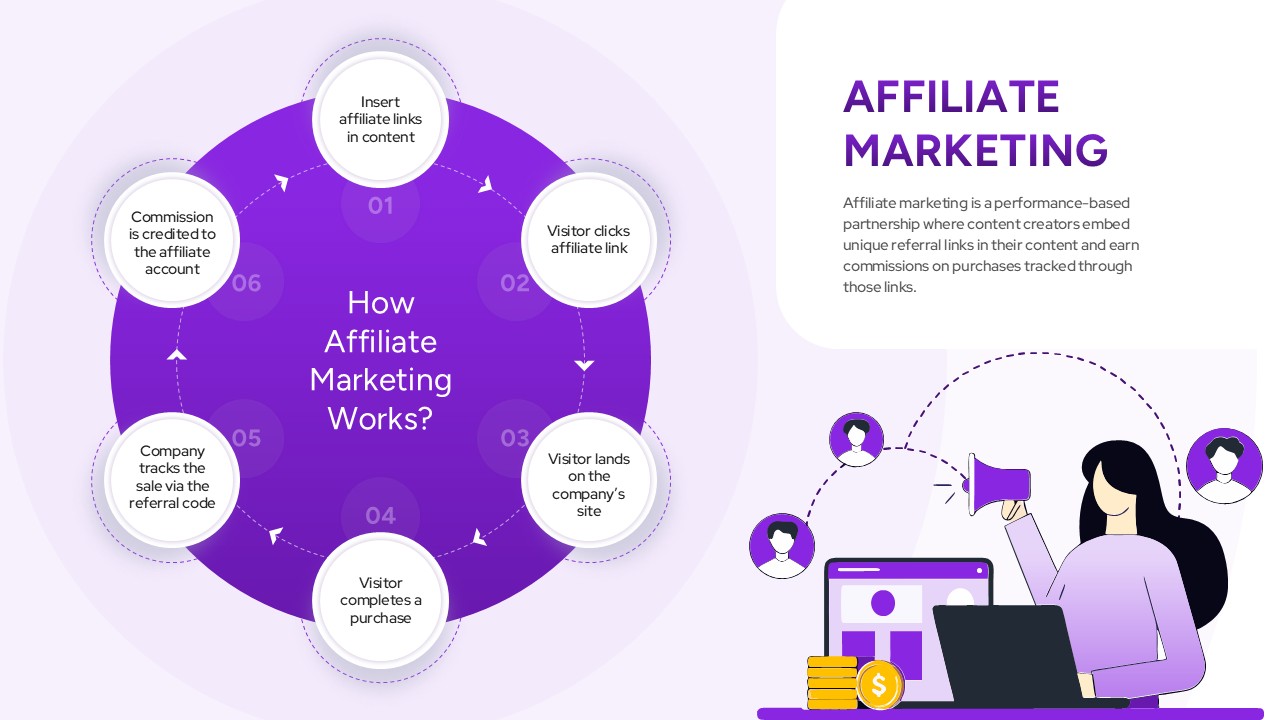
Affiliate Marketing Workflow Diagram Template for PowerPoint & Google Slides
Customer Experience
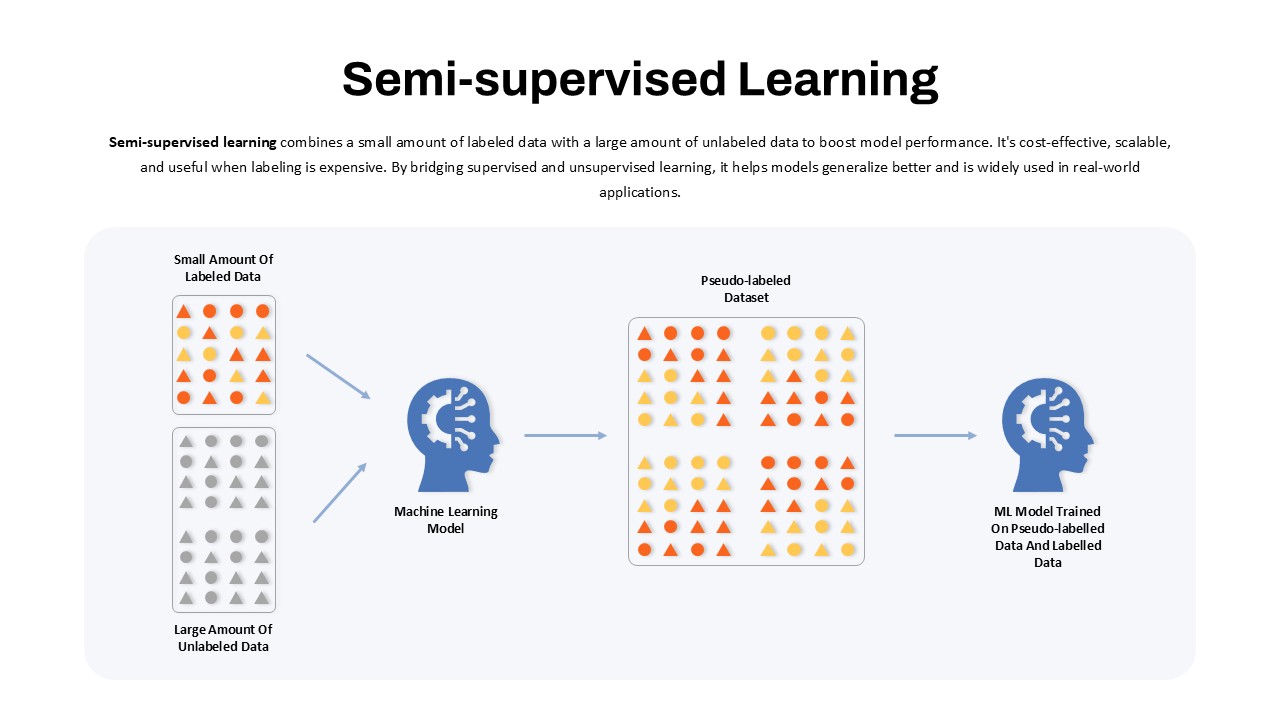
Semi-Supervised Learning Flow Diagram Template for PowerPoint & Google Slides
Machine Learning
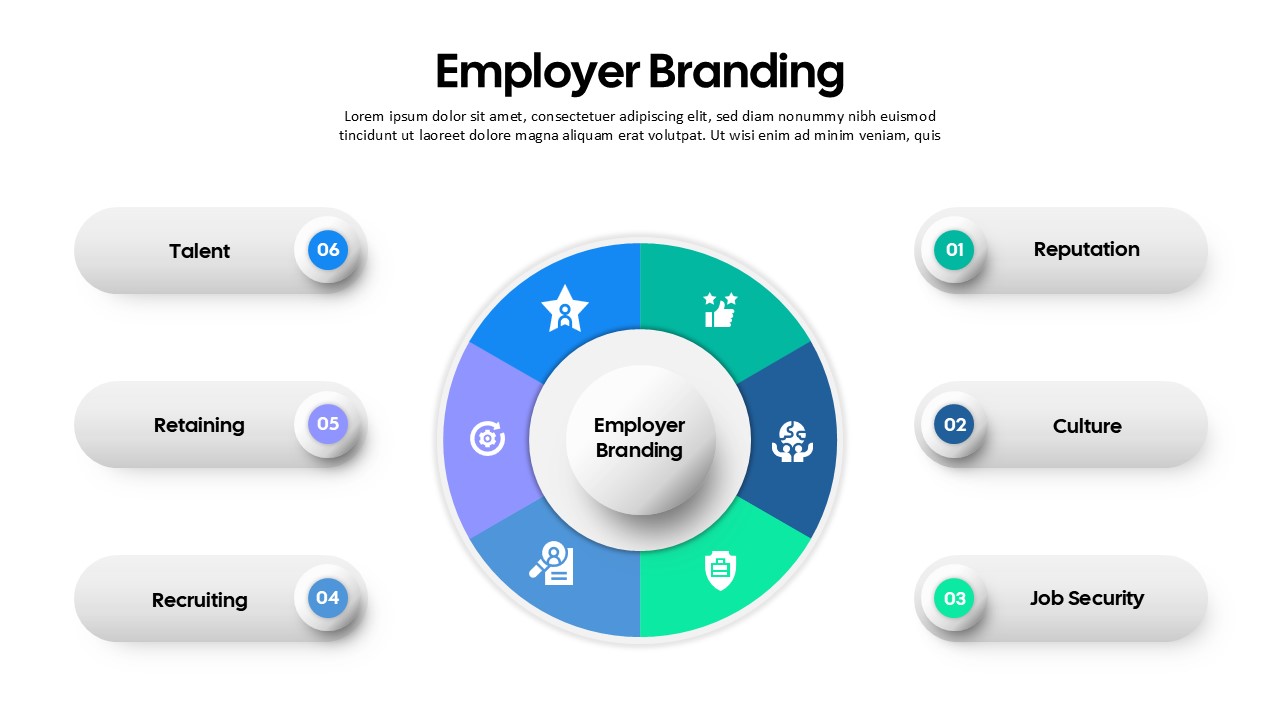
Employer Branding Infographic Diagram Template for PowerPoint & Google Slides
Recruitment
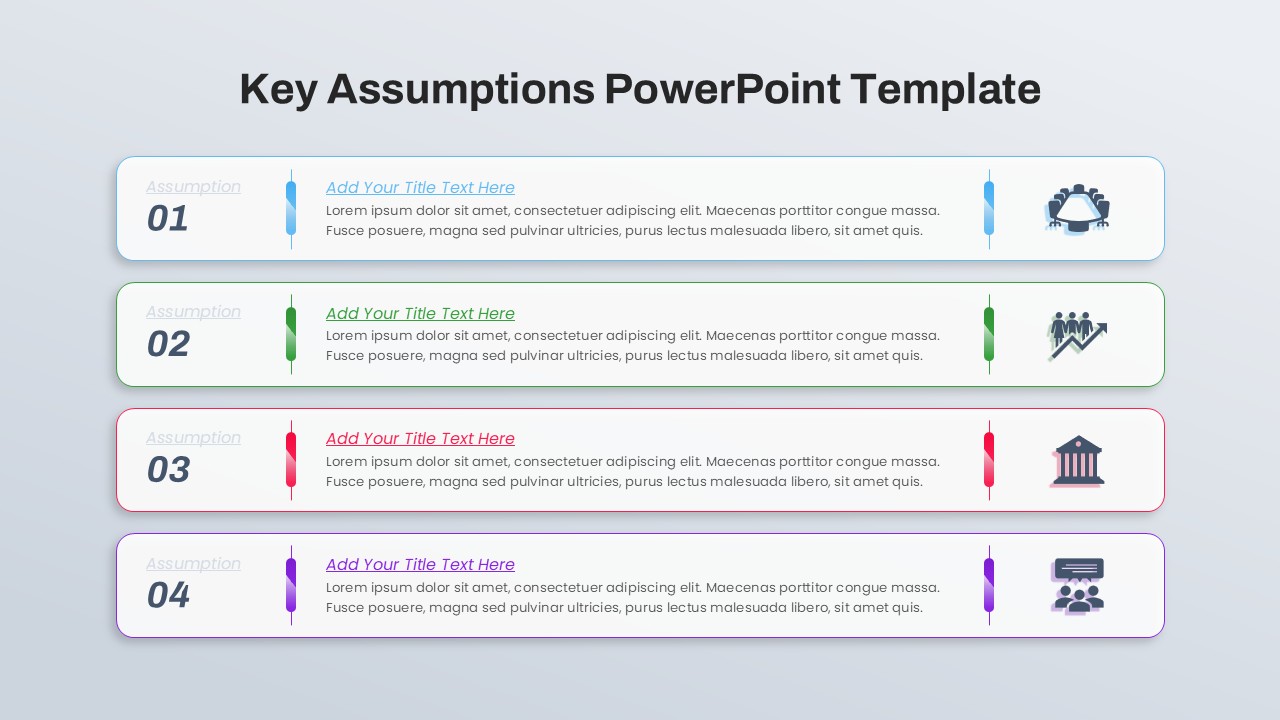
Key Assumptions Horizontal List Diagram Template for PowerPoint & Google Slides
Business Plan
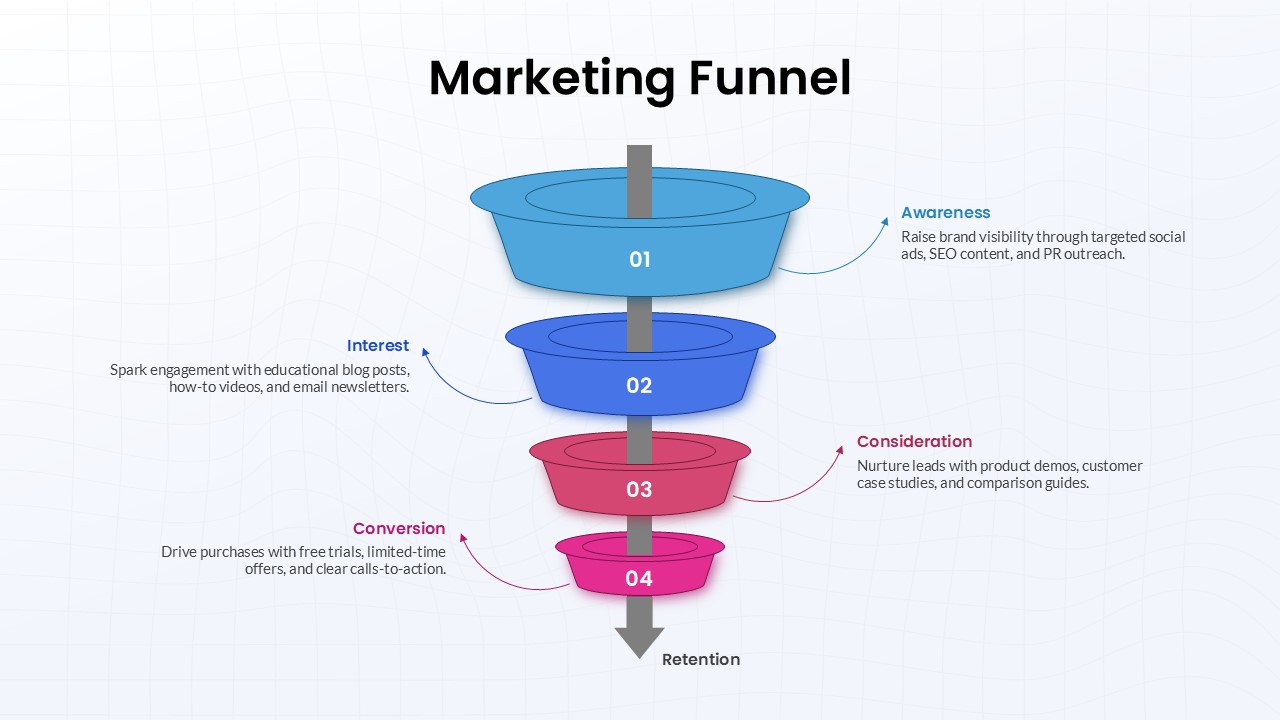
Four-Stage Marketing Funnel Diagram Template for PowerPoint & Google Slides
Marketing Funnel
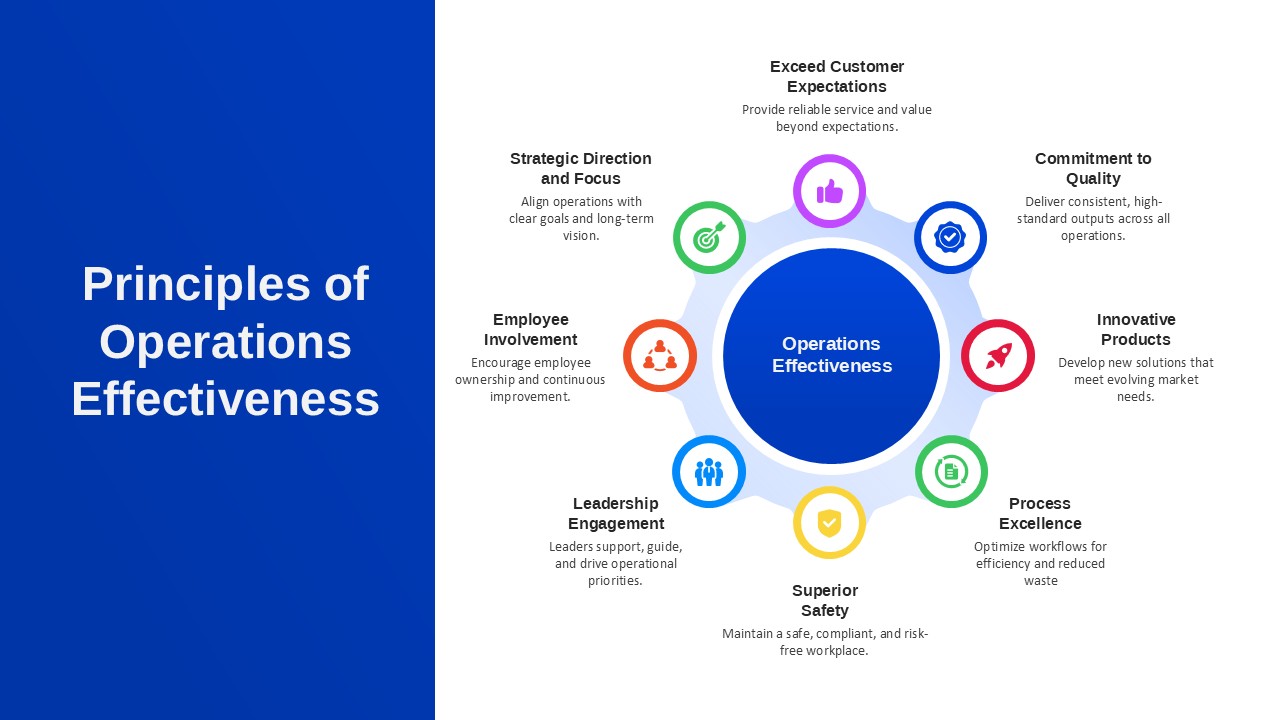
Principles of Operations Effectiveness Circular Diagram Template for PowerPoint & Google Slides
Leadership