AI in Manufacturing Benefits Infographic Template for PowerPoint & Google Slides
Description
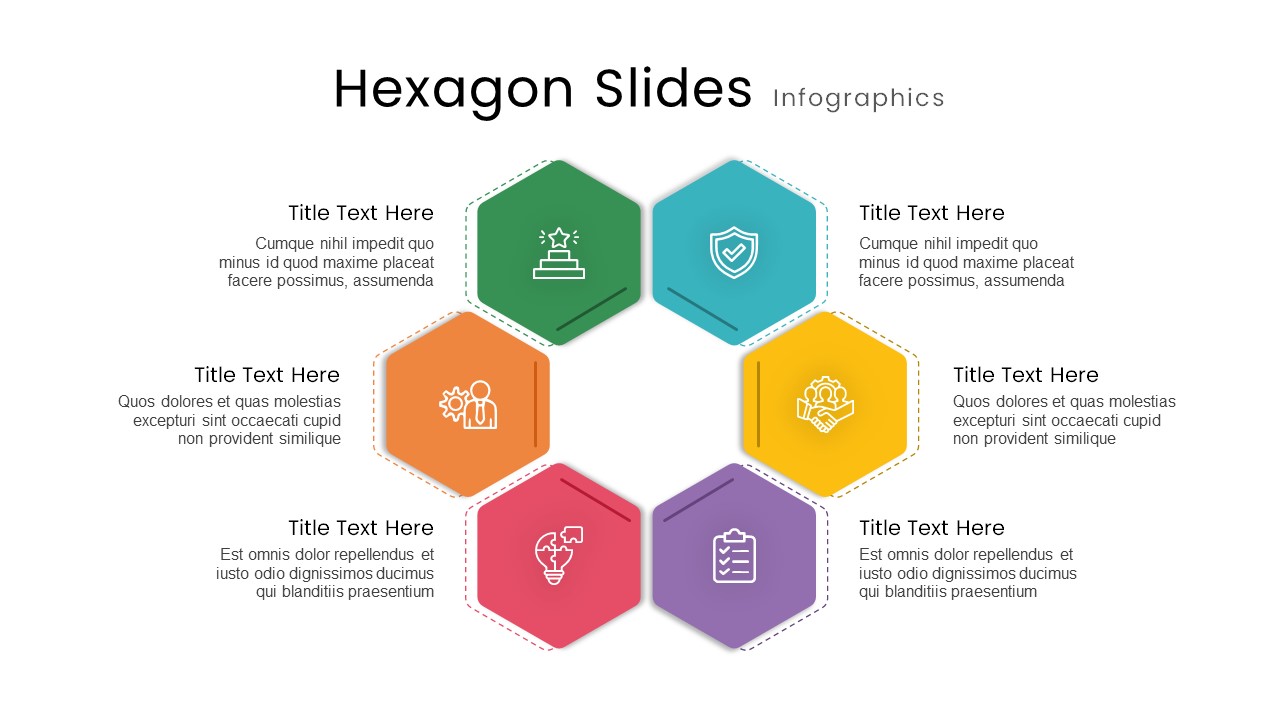
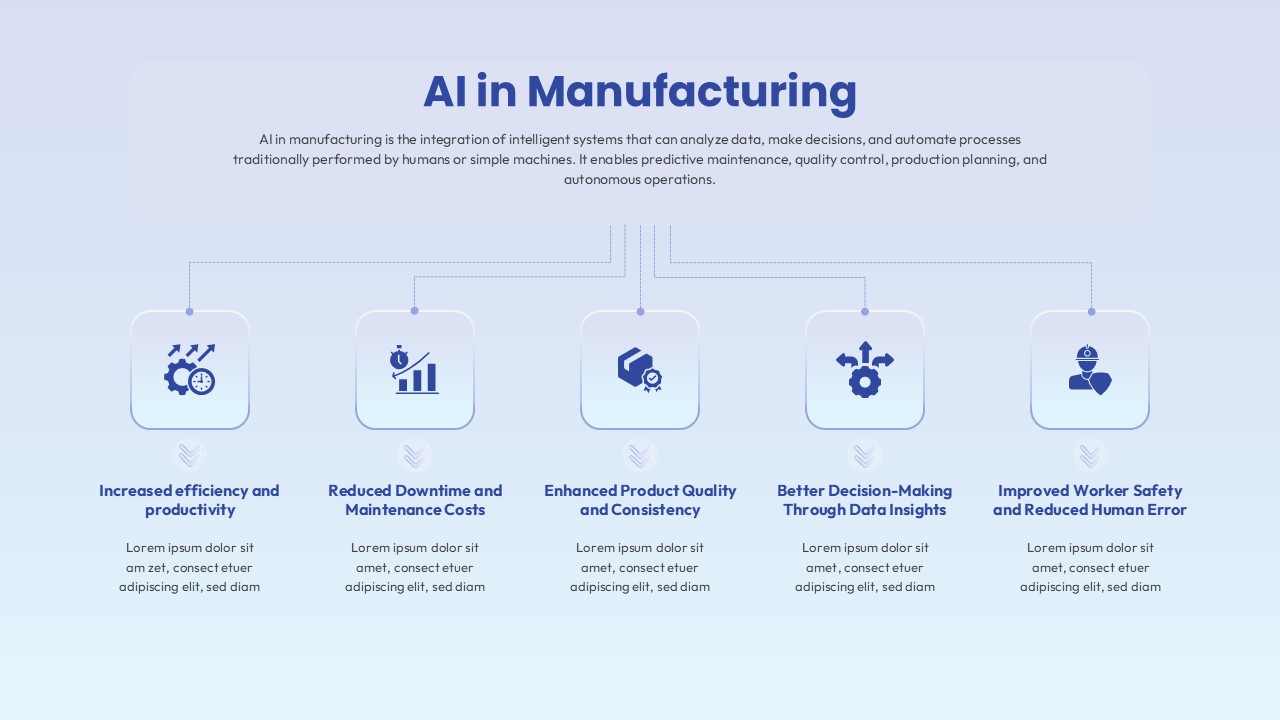
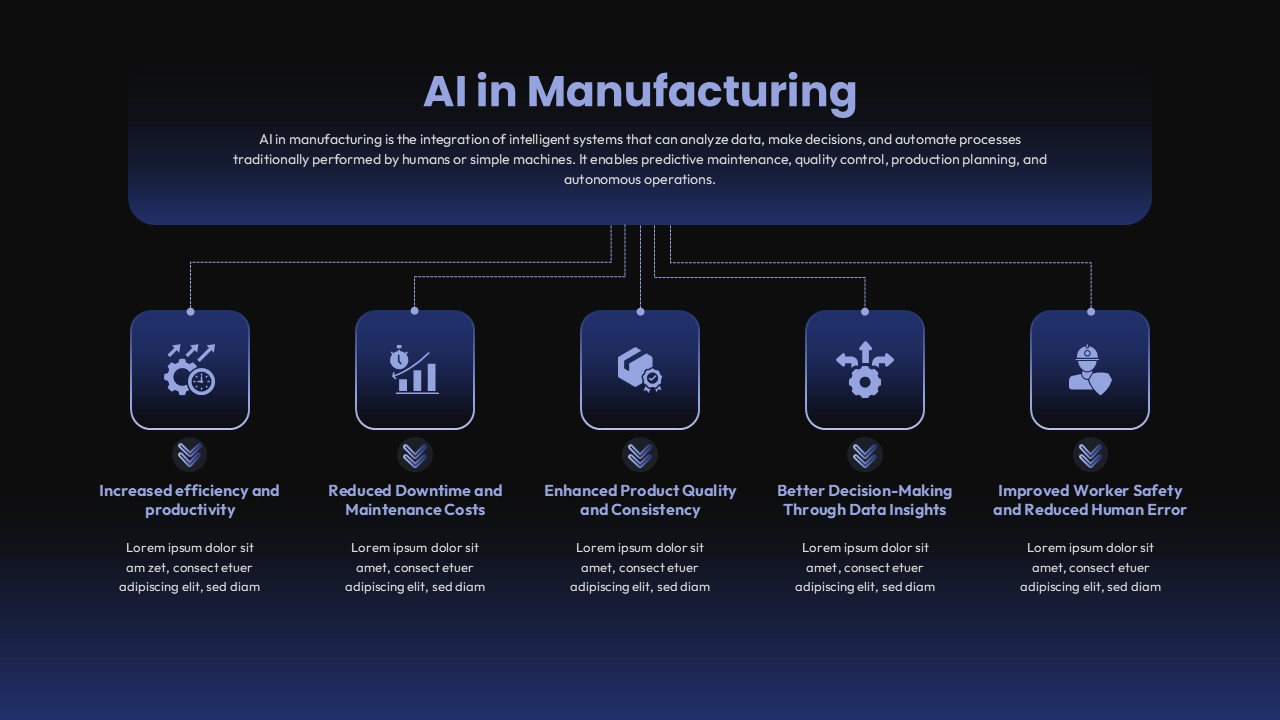
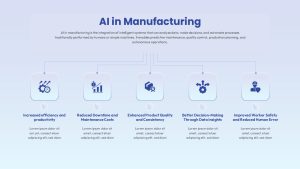
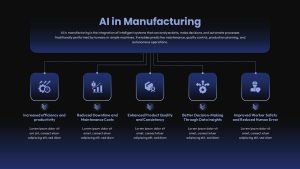
This slide illustrates the key benefits of applying artificial intelligence in manufacturing through a streamlined infographic layout. The main title sits in a gradient-filled header bar, followed by a concise subtitle that defines AI integration for predictive maintenance, quality control, production planning and automation. Below, five evenly spaced icon blocks connect with dashed lines to the header, each depicting a core advantage: Increased efficiency and productivity; Reduced downtime and maintenance costs; Enhanced product quality and consistency; Better decision-making through data insights; and Improved worker safety and reduced human error. Each block features a square container with a gradient blue background and a white icon, accompanied by bold headings and placeholder text, maintaining clarity and visual hierarchy. For additional layouts suited to industrial and operations environments, explore our manufacturing templates tailored for production, supply chain and process improvement presentations.
Engineered for quick customization, the design uses editable master slides and vector icons, allowing you to replace icons, adjust gradient stops, modify text and reposition elements within seconds. Subtle drop shadows and rounded corners create depth, while the balanced spacing and connector lines guide the viewer’s eye from concept to detail. Available in both dark and light theme variants, the slide preserves resolution and alignment across PowerPoint and Google Slides, eliminating formatting issues during collaboration. Its modular structure supports adding or removing benefit blocks, editing lorem ipsum copy with your own descriptions or swapping the heading to reflect any AI-driven framework. Whether you’re presenting at executive briefings, production team workshops or academic conferences, this infographic conveys complex information in a cohesive, visually engaging format.
Use this template to enhance strategic discussions, data-driven justifications and ROI presentations by illustrating how AI impacts throughput, cost savings and safety. Duplicate or hide blocks to showcase additional metrics such as energy optimization or supply chain resilience.
Who is it for
Product managers, operations leaders, process engineers and manufacturing executives will leverage this infographic to communicate AI-driven improvements in efficiency, maintenance, quality control and safety. Data scientists, industrial engineers and executive stakeholders can also use it to align teams on strategic technology initiatives.
Other Uses
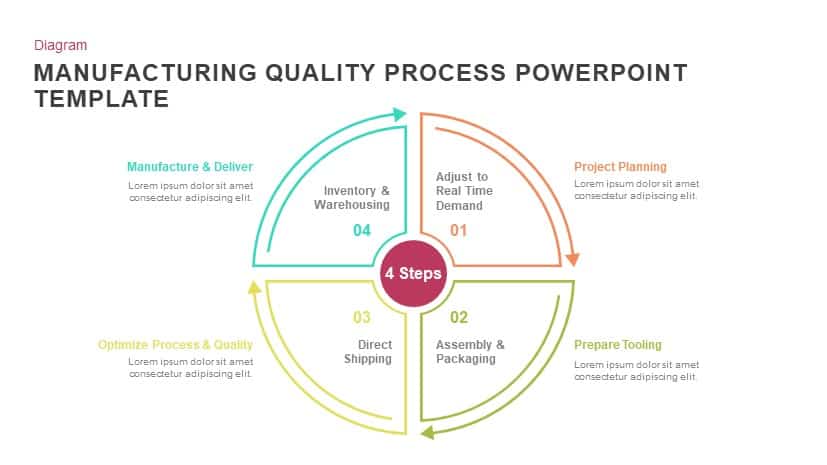
Beyond AI applications, repurpose this slide to outline benefits of digital transformation, Industry 4.0 initiatives or technology adoption frameworks. You can also pair this slide with process frameworks such as the manufacturing quality process template when discussing workflow improvements or operational maturity. For broader strategic and commercial presentations, the manufacturing business deck can help communicate organizational positioning, production capabilities and market outlook.
Login to download this file

Item ID
SB05062Designed By
Krishnapriya
Related Templates

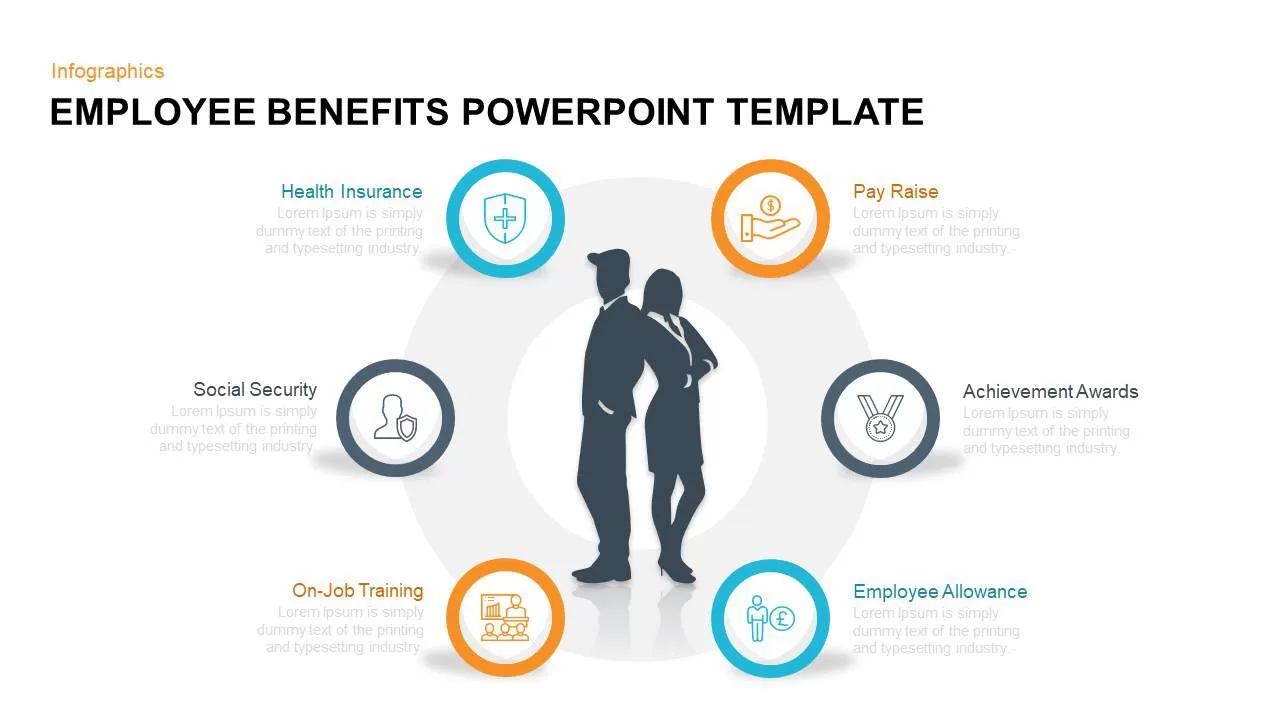
Employee Benefits Hub and Spoke Infographic Template for PowerPoint & Google Slides
HR
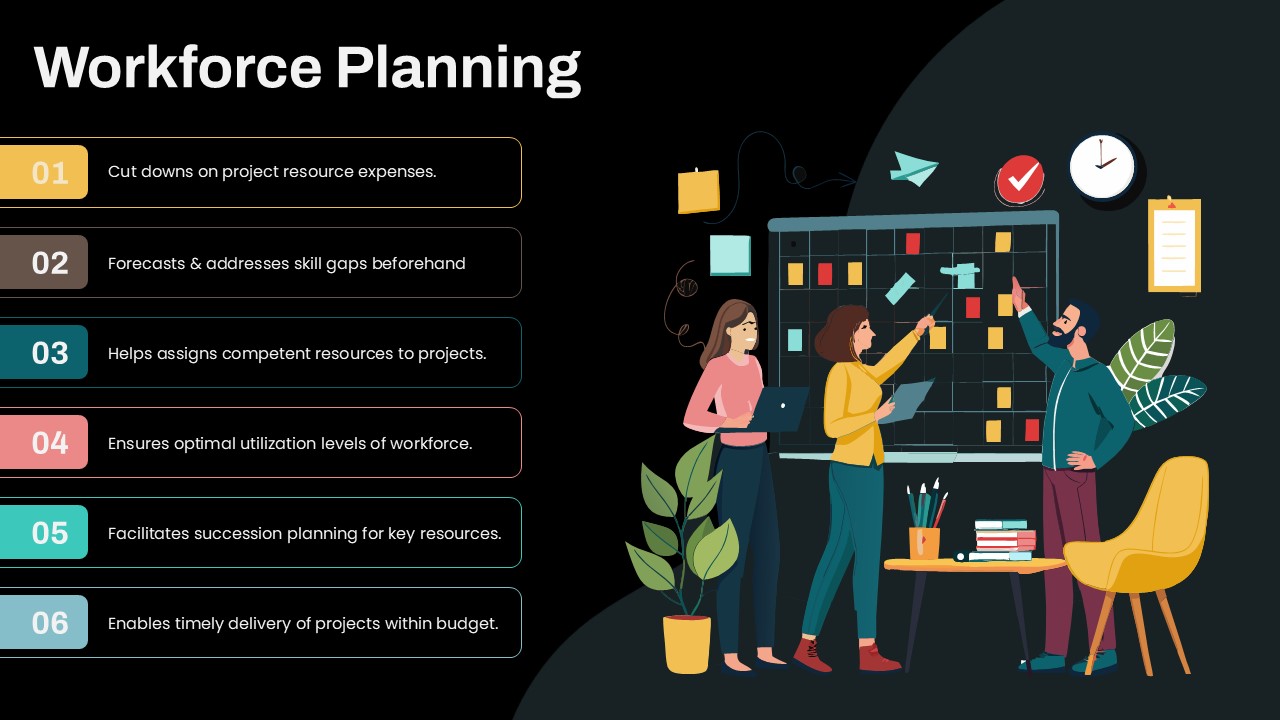
Workforce Planning Benefits Infographic Template for PowerPoint & Google Slides
HR
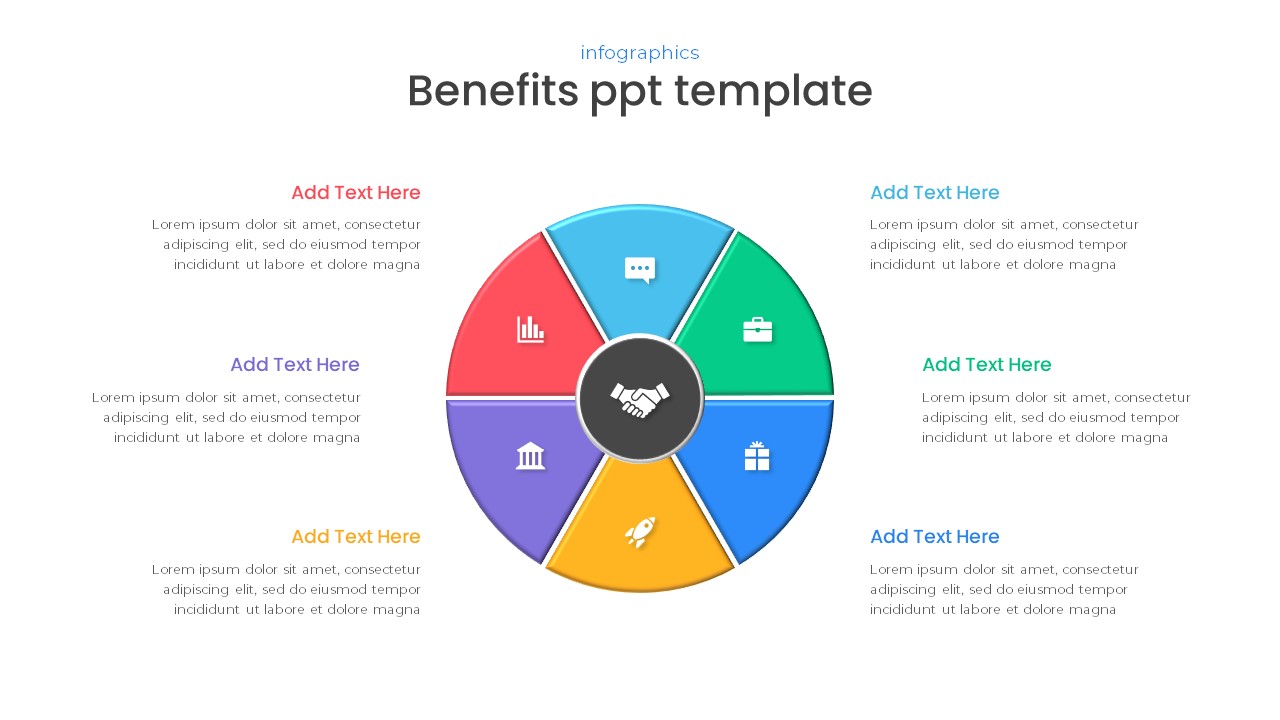
Free Six-Part Hub-and-Spoke Benefits Template for PowerPoint & Google Slides
Circular
Free
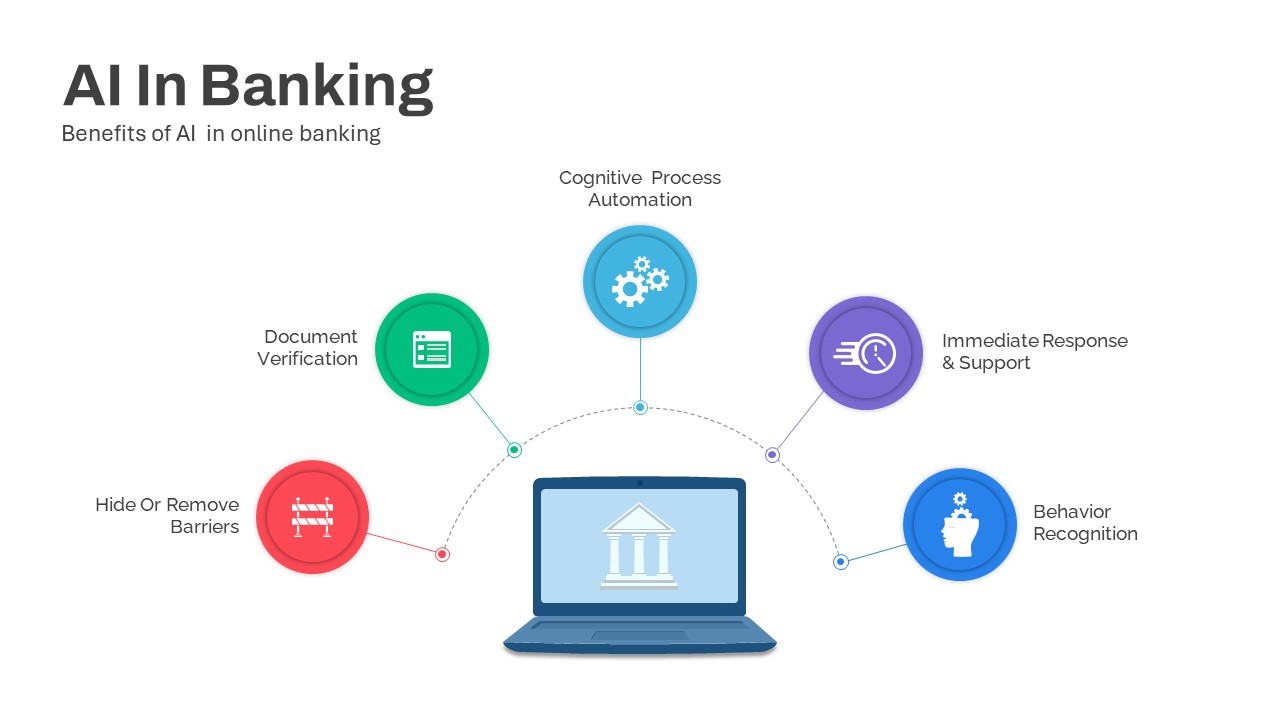
AI Banking Benefits Template for PowerPoint & Google Slides
Circular
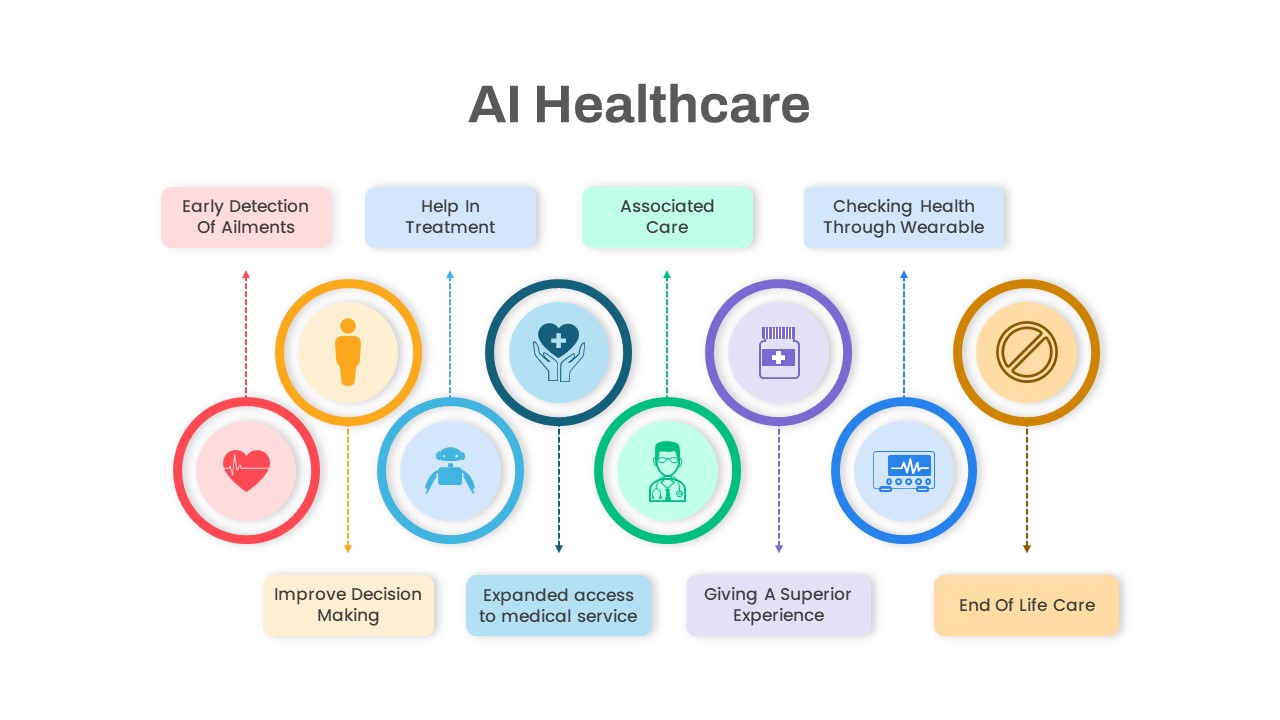
AI Healthcare Benefits Diagram Template for PowerPoint & Google Slides
Health
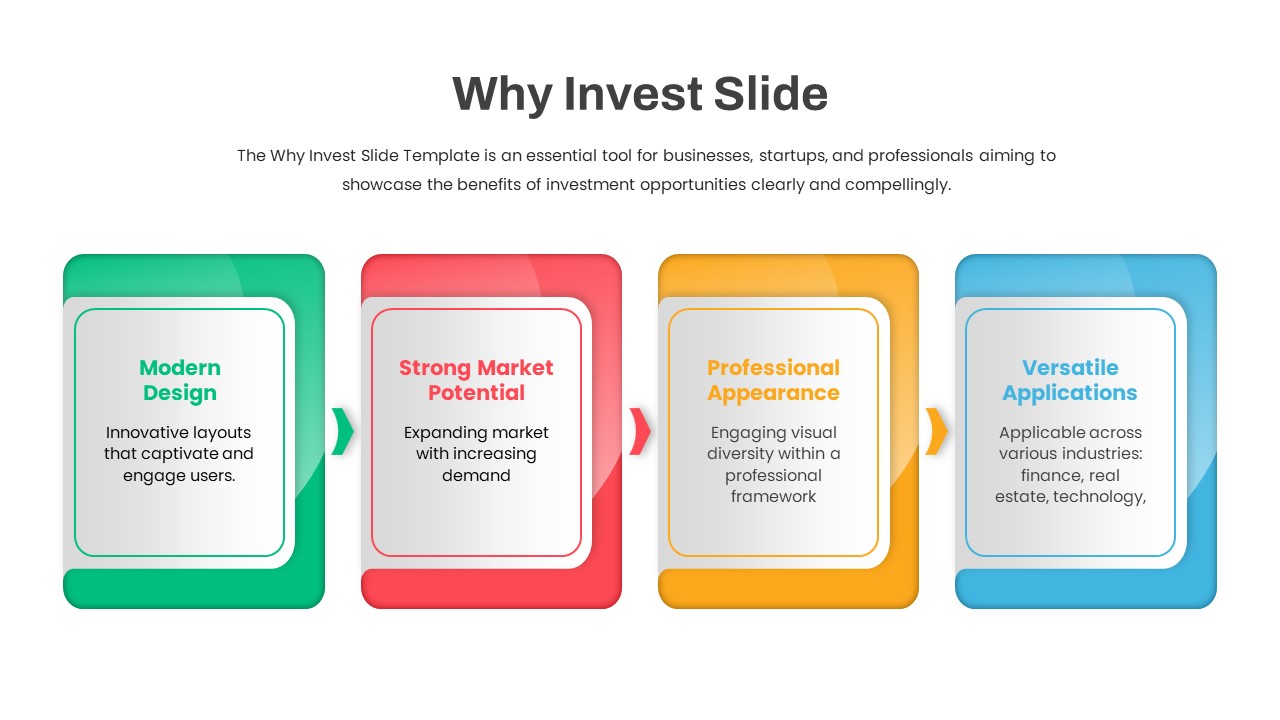
Why Invest Slide Four-Step Benefits Flow Template for PowerPoint & Google Slides
Business Plan
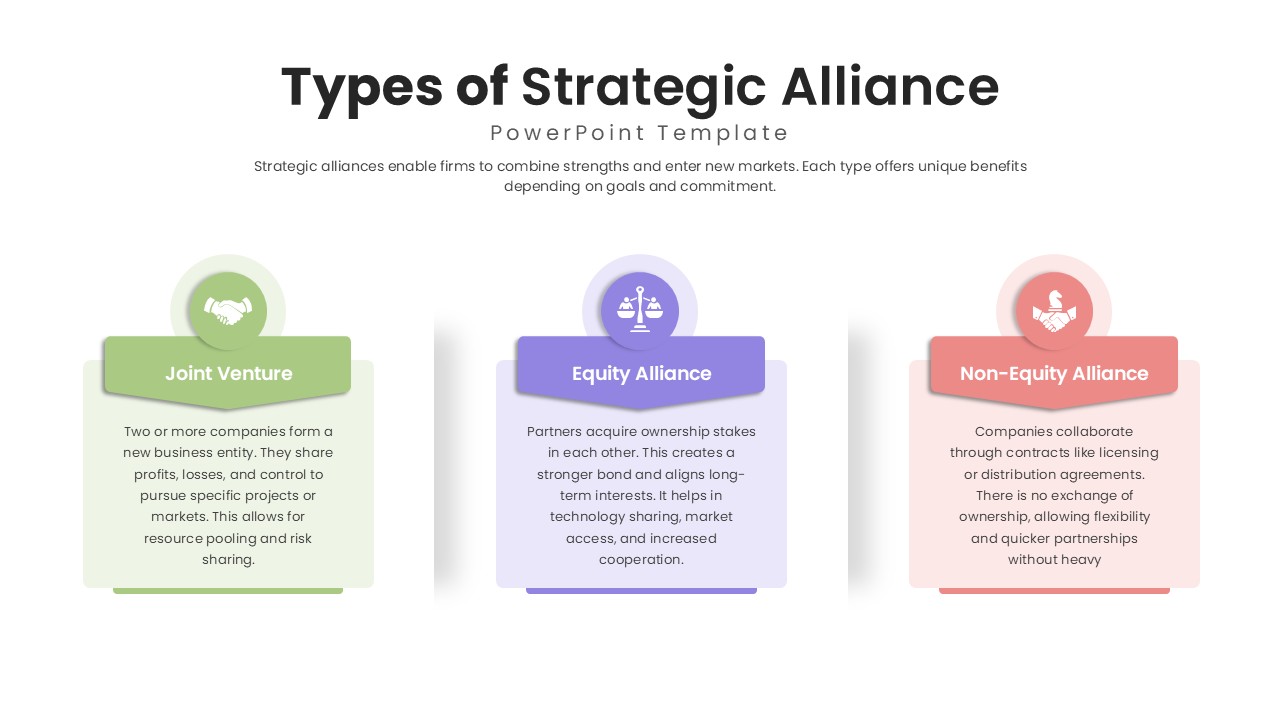
Strategic Alliance Types and Benefits template for PowerPoint & Google Slides
Business Strategy
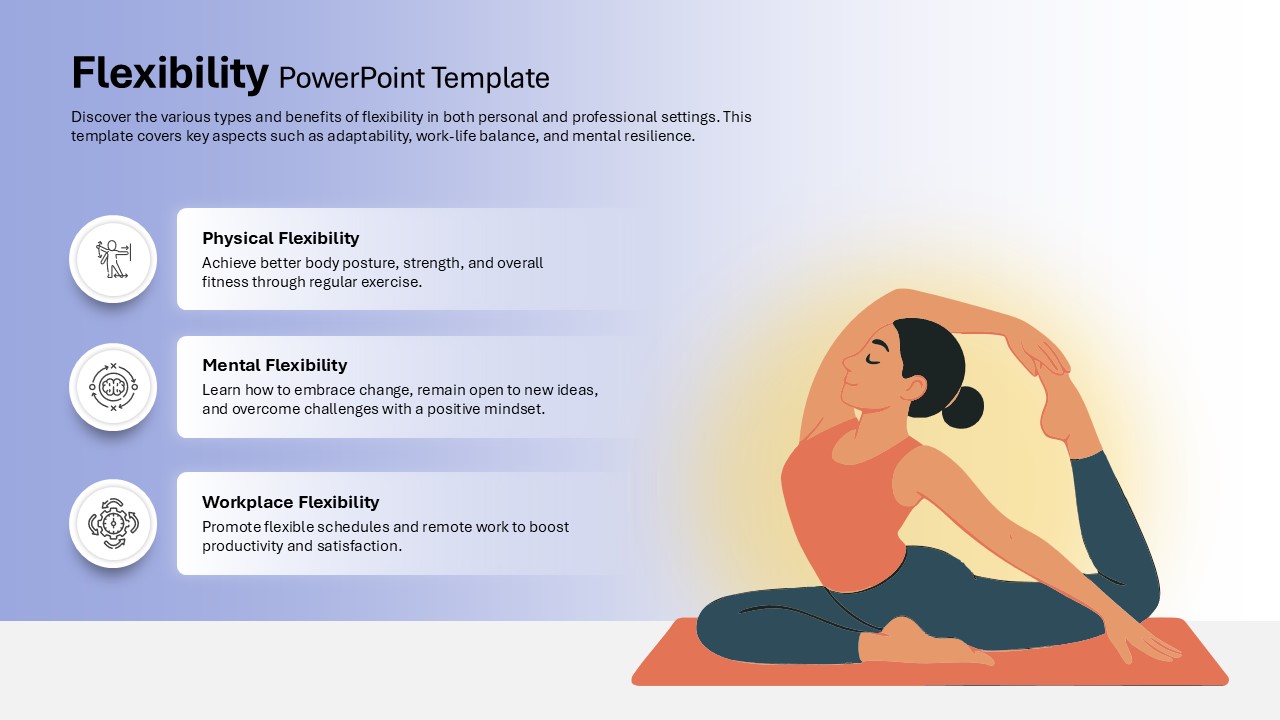
Flexibility Benefits and Types Template for PowerPoint & Google Slides
Comparison
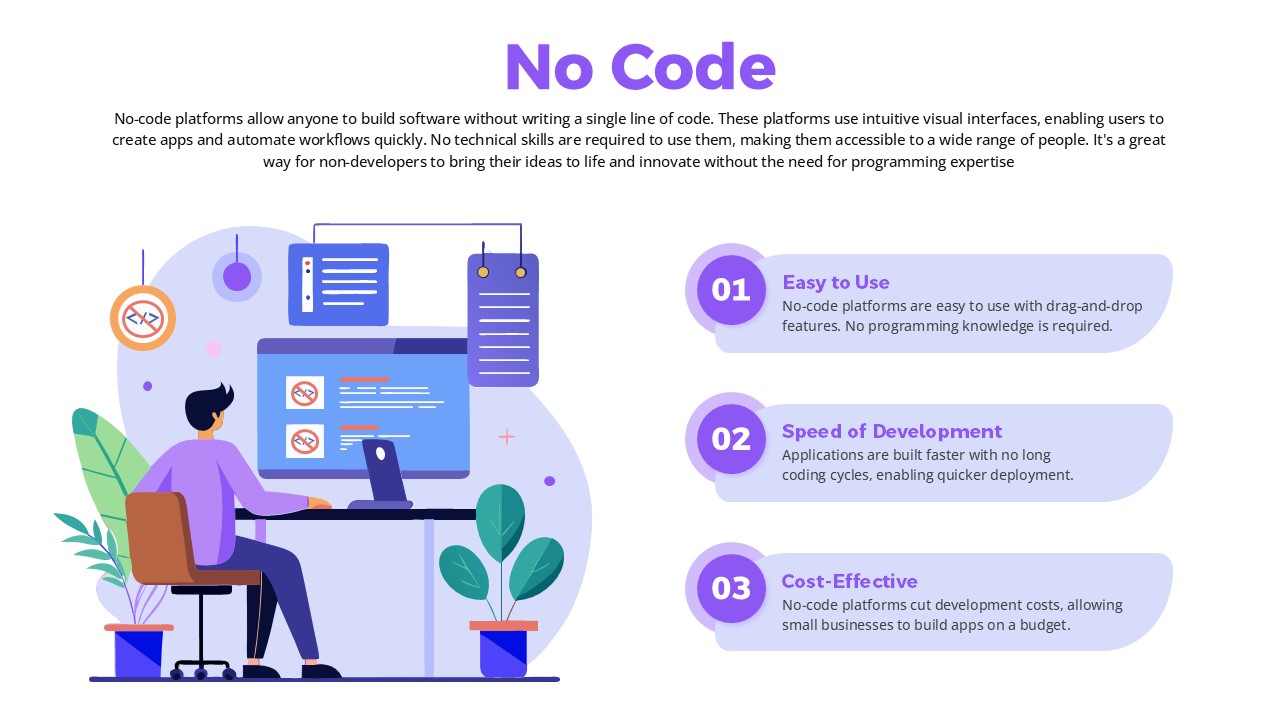
No-Code Overview with 3 Key Benefits Template for PowerPoint & Google Slides
Software Development
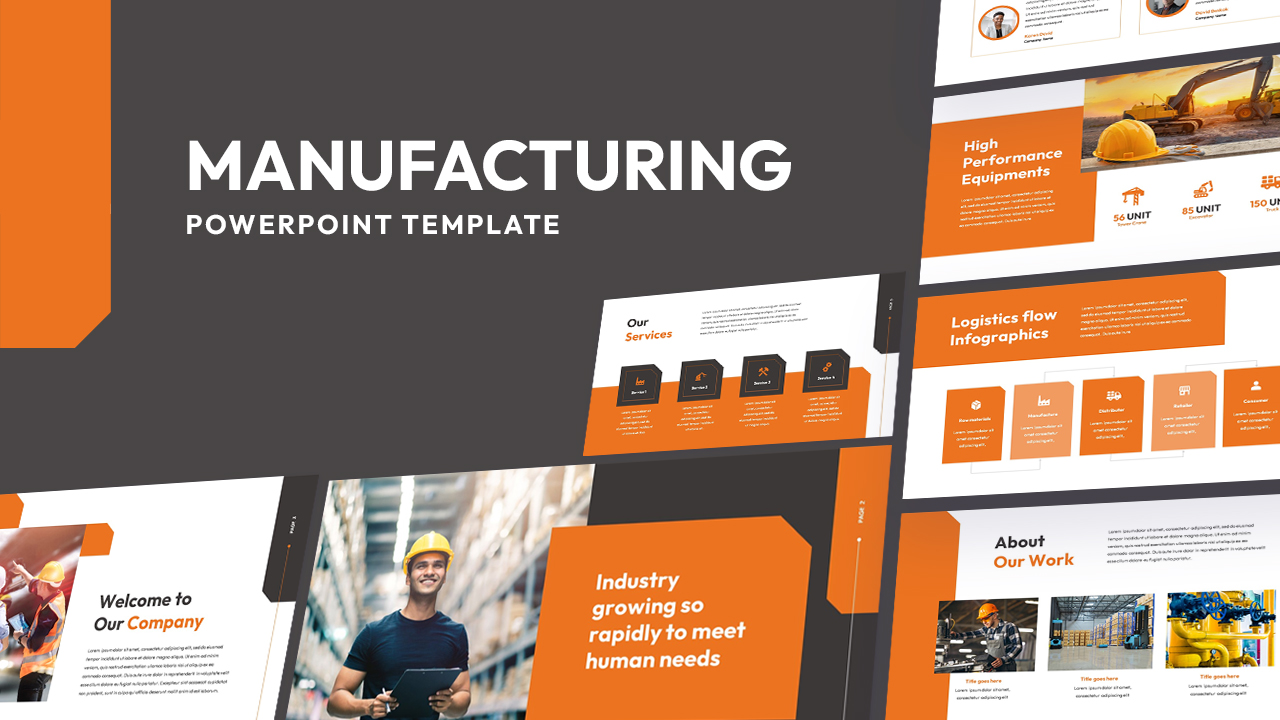
Manufacturing PowerPoint Template for PowerPoint & Google Slides
Business

Manufacturing Quality Process template for PowerPoint & Google Slides
Process
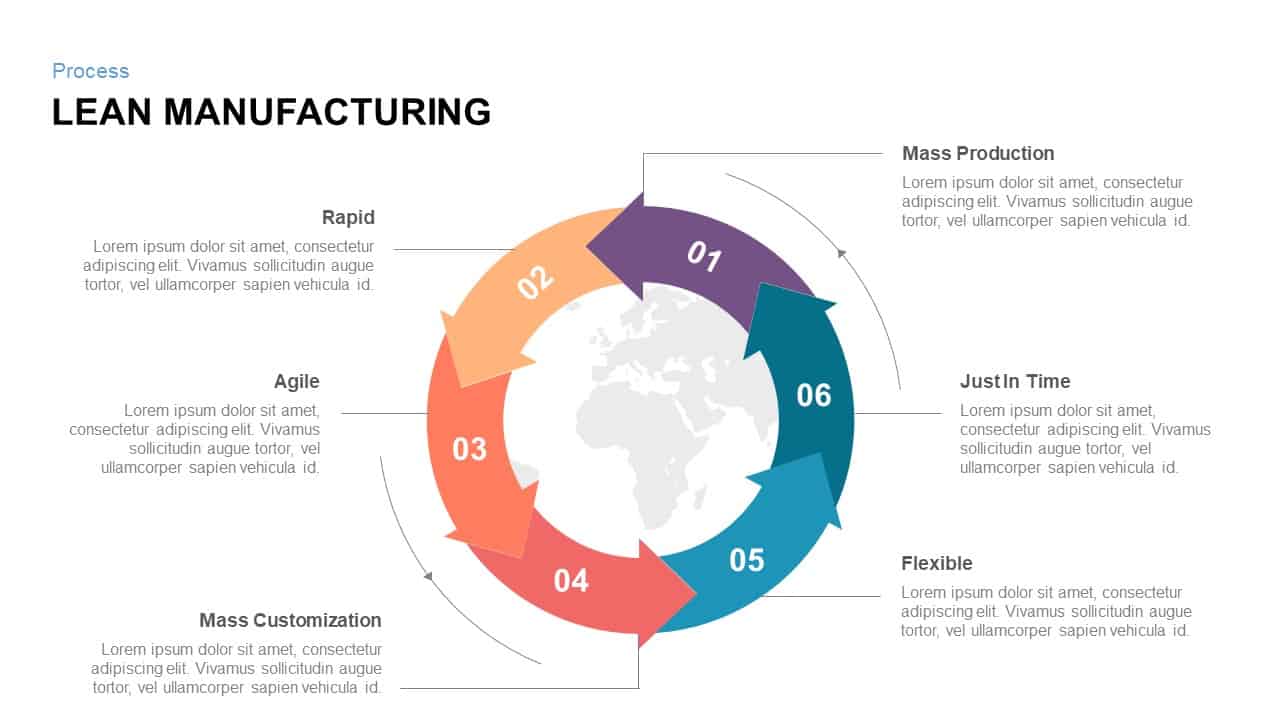
Six-Step Lean Manufacturing Process Template for PowerPoint & Google Slides
Process
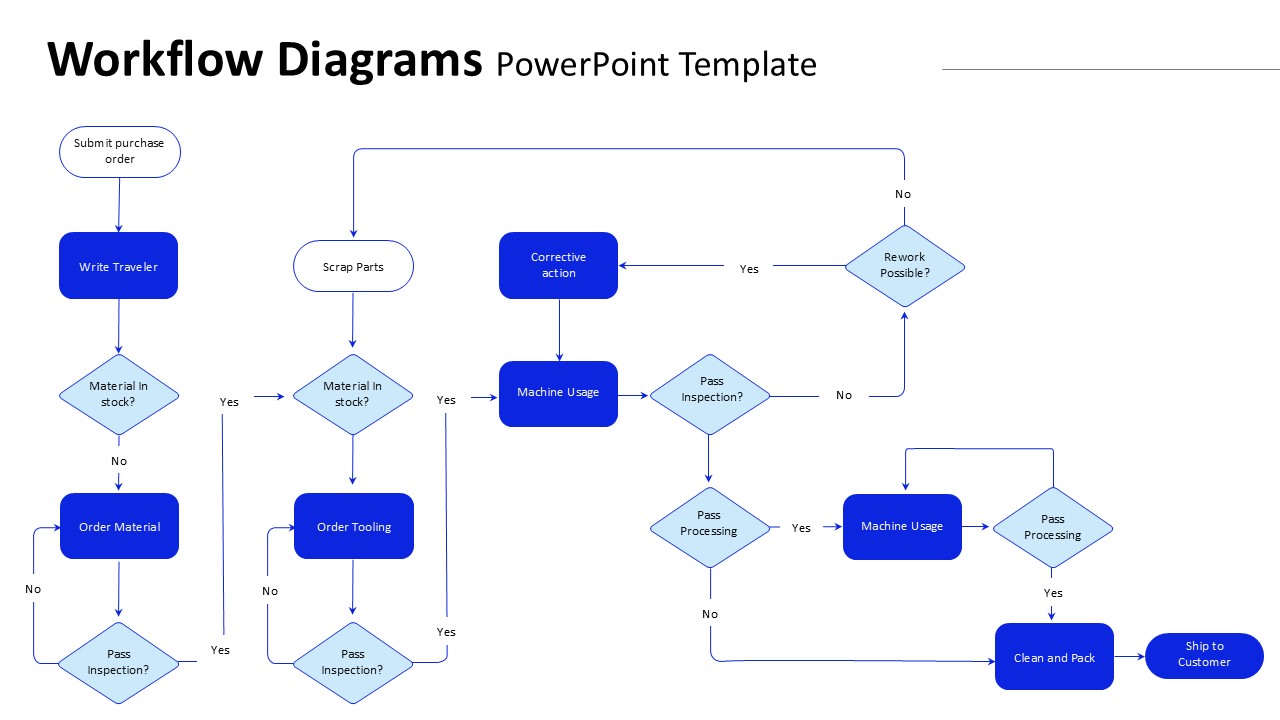
Manufacturing Workflow Diagram Template for PowerPoint & Google Slides
Flow Charts
Manufacturing and Construction Template for PowerPoint & Google Slides
Company Profile
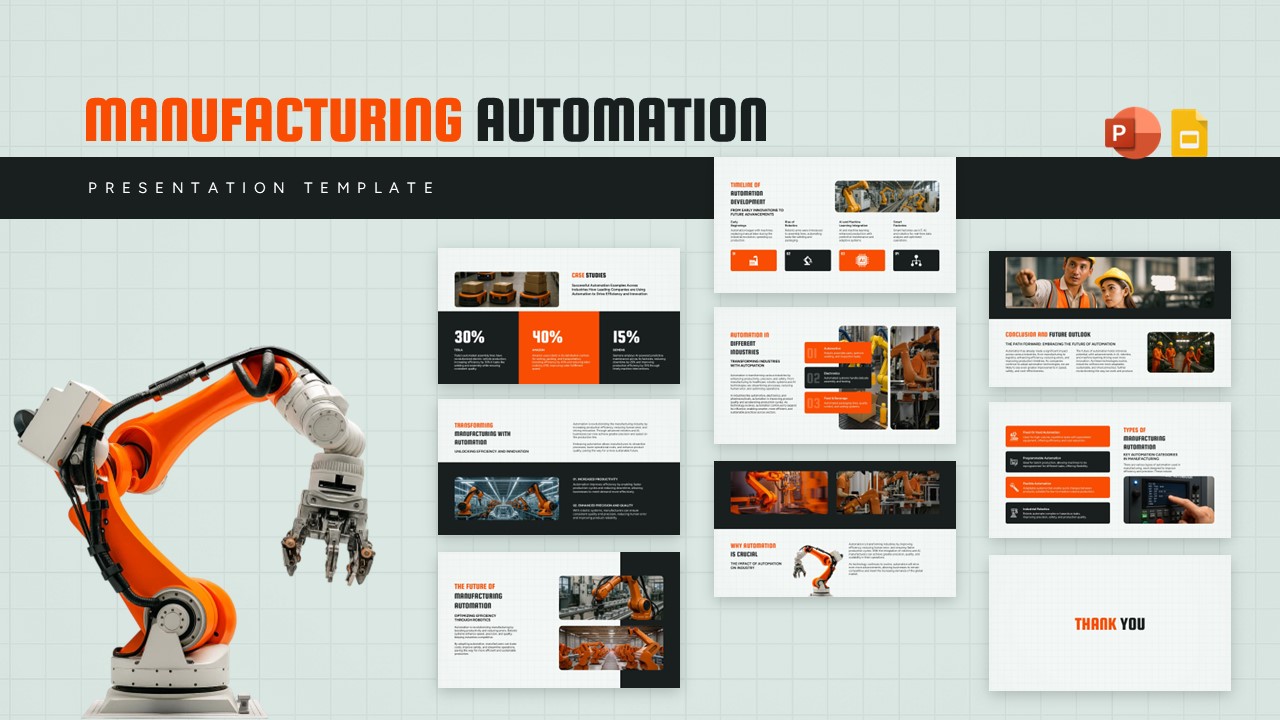
Manufacturing And Automation Presentation Template for PowerPoint & Google Slides
Company Profile
Google Ads Optimization & Performance Infographic Template for PowerPoint & Google Slides
Digital Marketing
SQ3R Study Strategy Infographic Slides Template for PowerPoint & Google Slides
Business Strategy
Six Double Diamond Infographic Slides Template for PowerPoint & Google Slides
Process

Sales Process Infographic Slides Pack Template for PowerPoint & Google Slides
Process
Casino/Poker Chips Infographic Slides template for PowerPoint & Google Slides
Business Strategy
Agenda Infographic Pack of 2 Slides Template for PowerPoint & Google Slides
Agenda
Quad Chart Infographic Pack of 8 Slides Template for PowerPoint & Google Slides
Comparison Chart
Four Options Infographic Slides Template for PowerPoint & Google Slides
Comparison
Game Plan Infographic Slides Pack Template for PowerPoint & Google Slides
Infographics
Teamwork PowerPoint Infographic Template for PowerPoint & Google Slides
Leadership
Kite Infographic PowerPoint Template for PowerPoint & Google Slides
Process
Cladogram Infographic Di Template for PowerPoint & Google Slides Template
Decision Tree
Workflow PowerPoint Process infographic for PowerPoint & Google Slides
Process
Free Infographic Deck PowerPoint Pack for PowerPoint & Google Slides
Infographics
Free
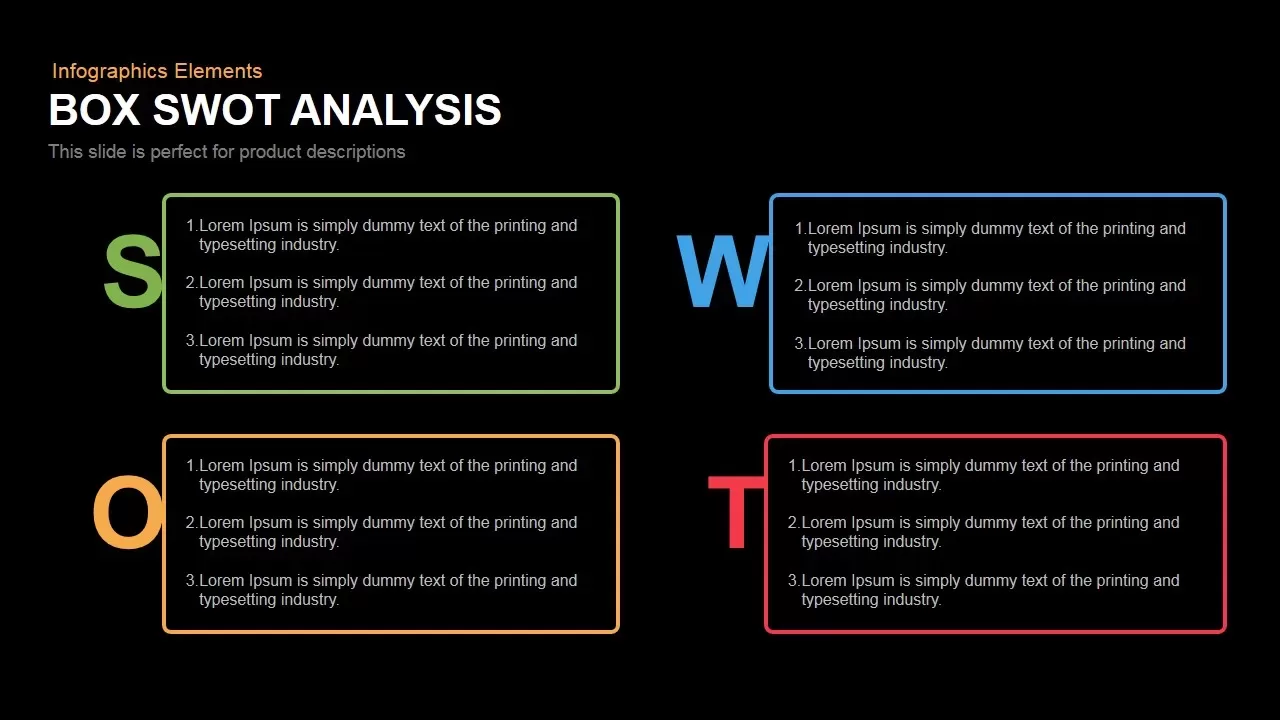
Box SWOT Analysis Infographic Template for PowerPoint & Google Slides
SWOT
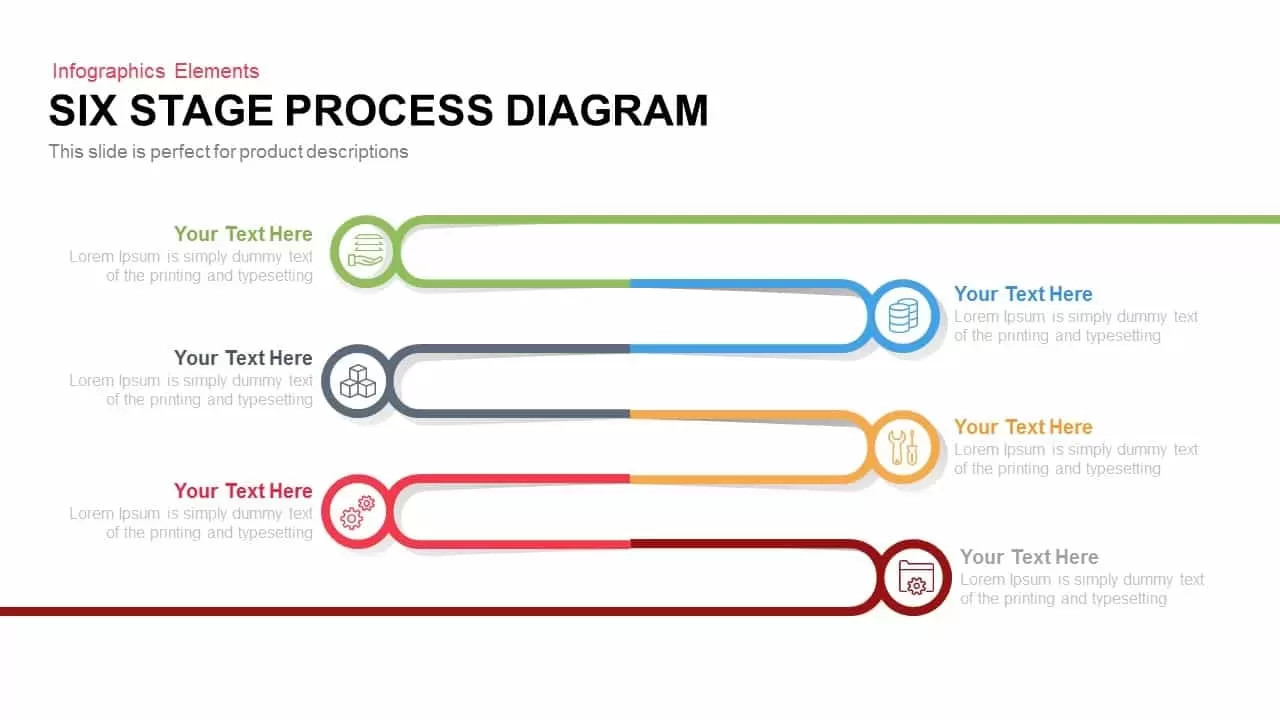
6 Stage Process Diagram Infographic Template for PowerPoint & Google Slides
Process
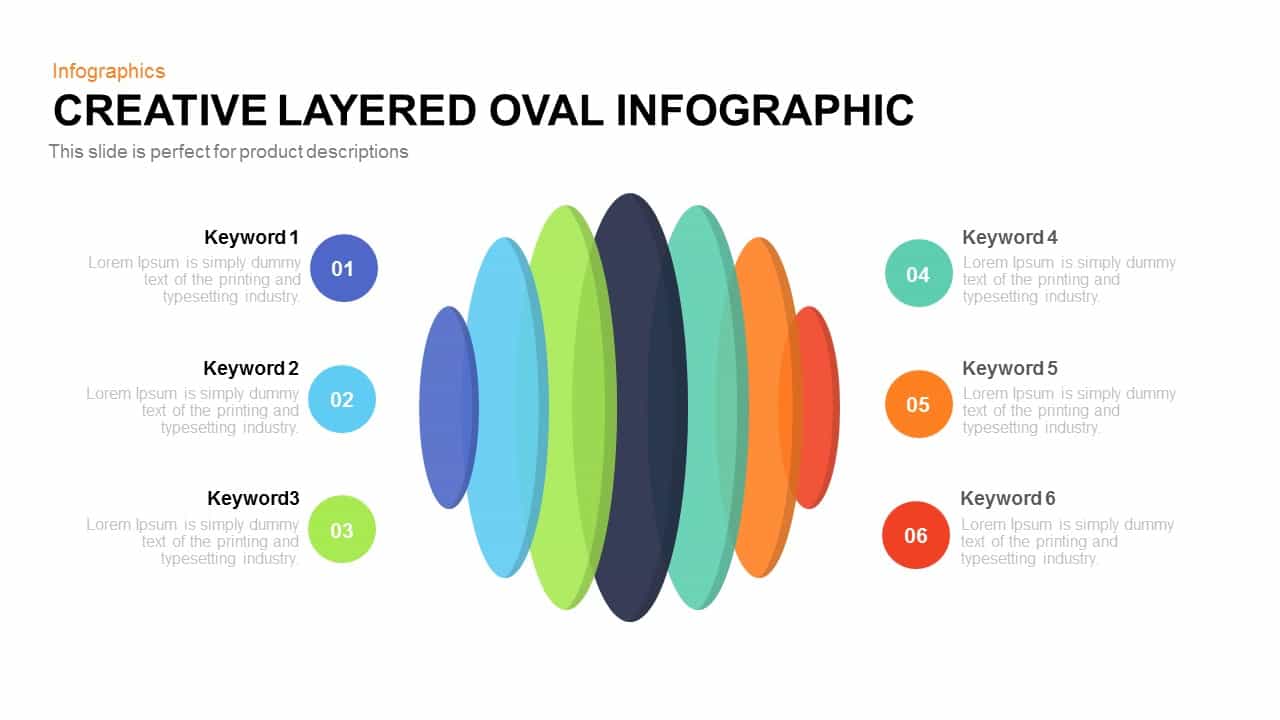
Creative Layered Oval Infographic Diagram Template for PowerPoint & Google Slides
Process
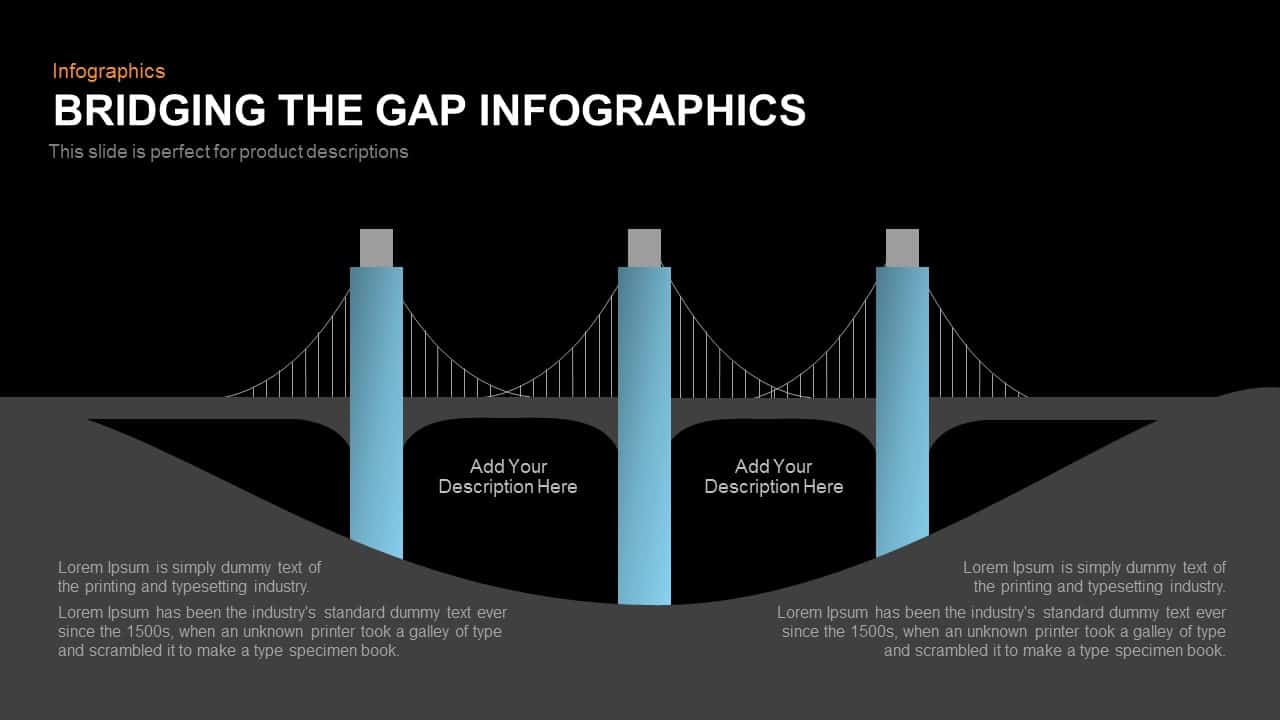
Bridging the Gap Infographic Process template for PowerPoint & Google Slides
Process

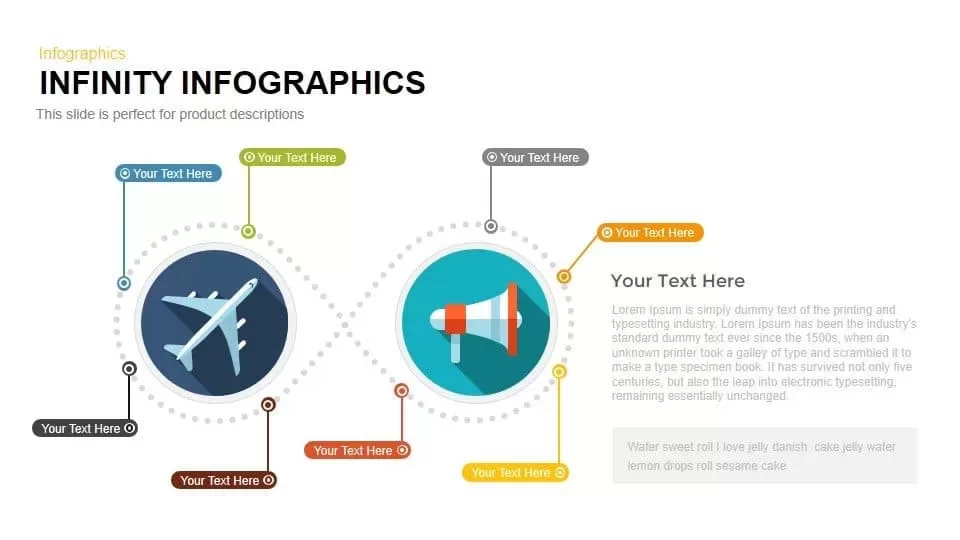
Looped Infinity Infographic Slide Template for PowerPoint & Google Slides
Process
Two Directional Arrow Infographic Template for PowerPoint & Google Slides
Arrow
Colorful Photo Capture Infographic Template for PowerPoint & Google Slides
Advertising
Gender Comparison People Infographic Template for PowerPoint & Google Slides
Comparison

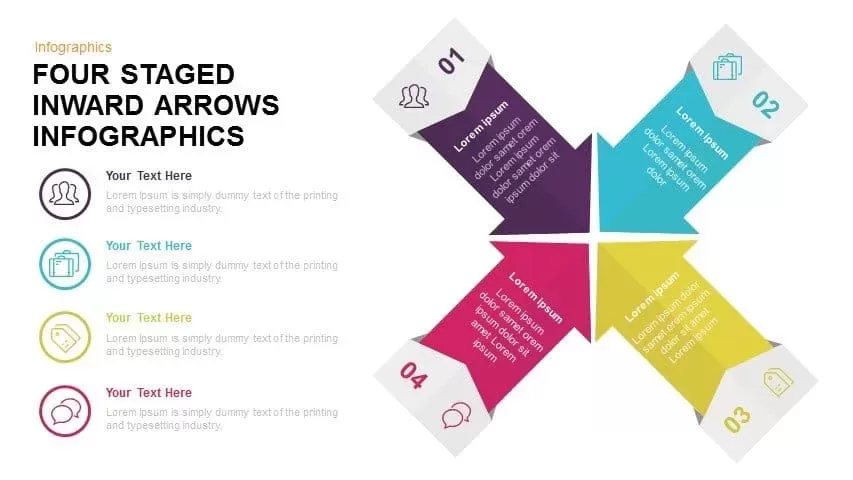
Four Staged Inward Arrows Infographic Template for PowerPoint & Google Slides
Arrow
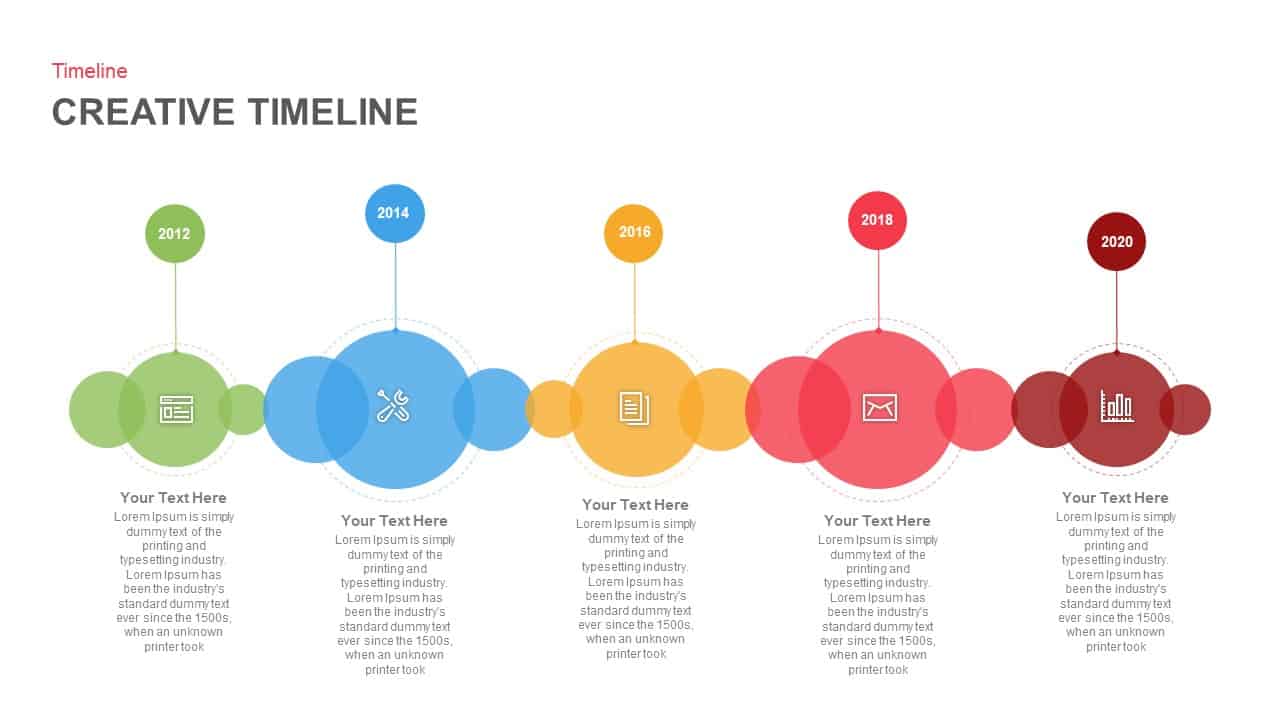
Creative Bubble Timeline Infographic Template for PowerPoint & Google Slides
Timeline
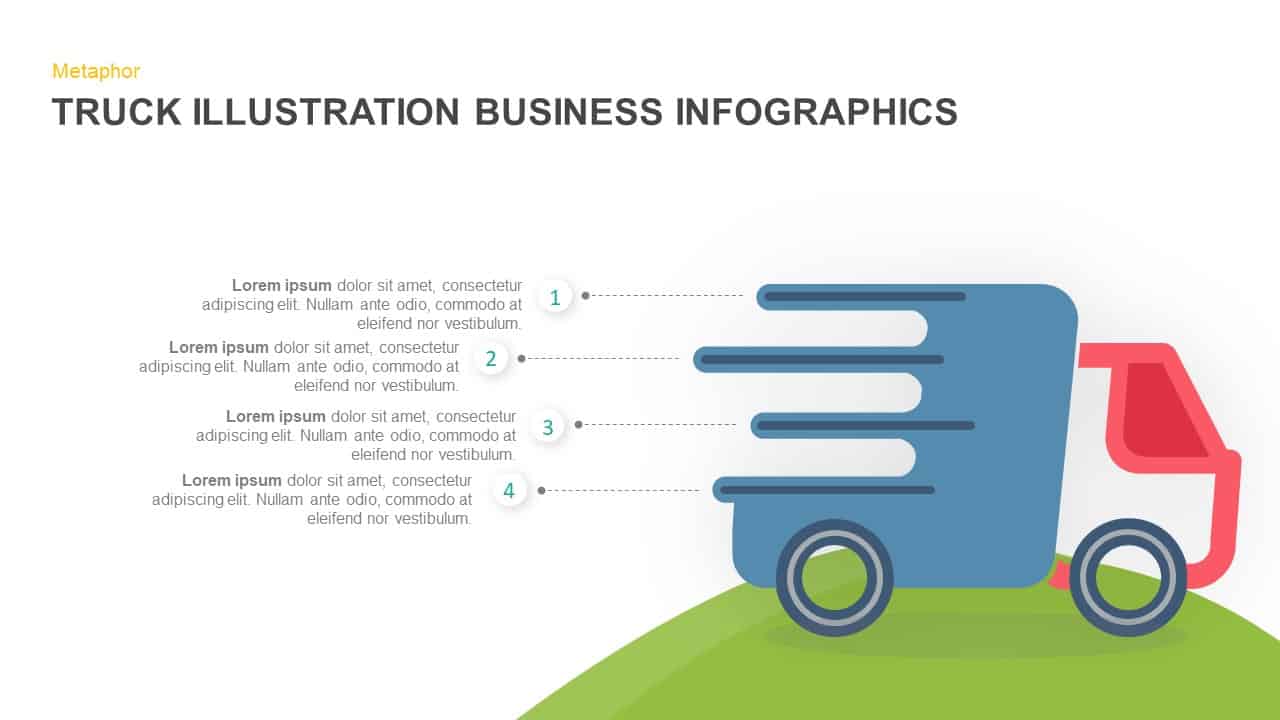
Truck Illustration Infographic Template for PowerPoint & Google Slides
Process
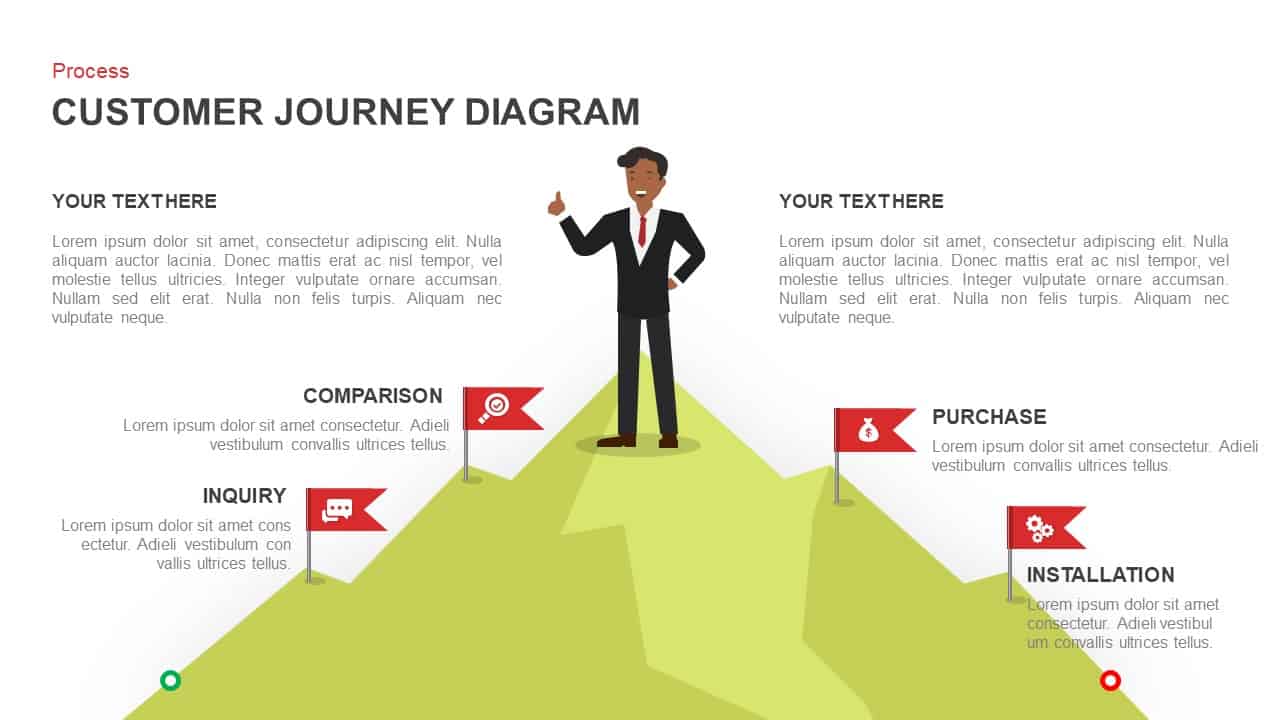
Customer Journey Mountain Infographic Template for PowerPoint & Google Slides
Customer Journey
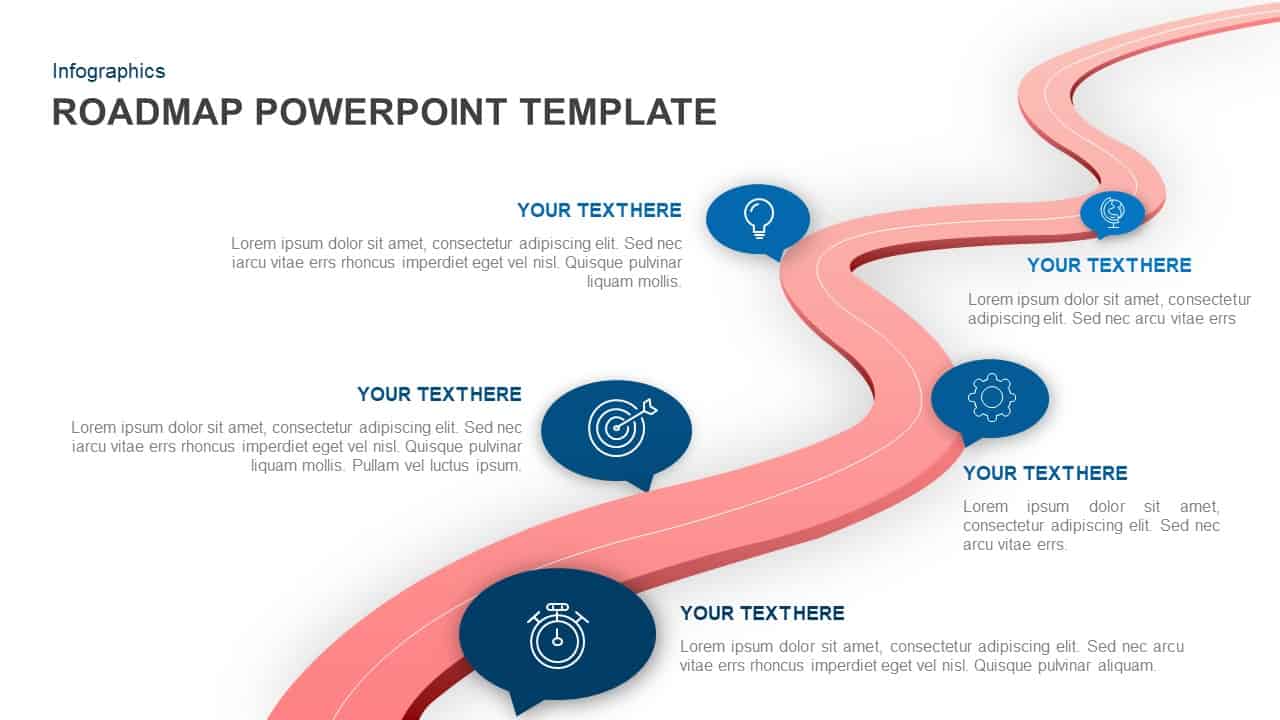
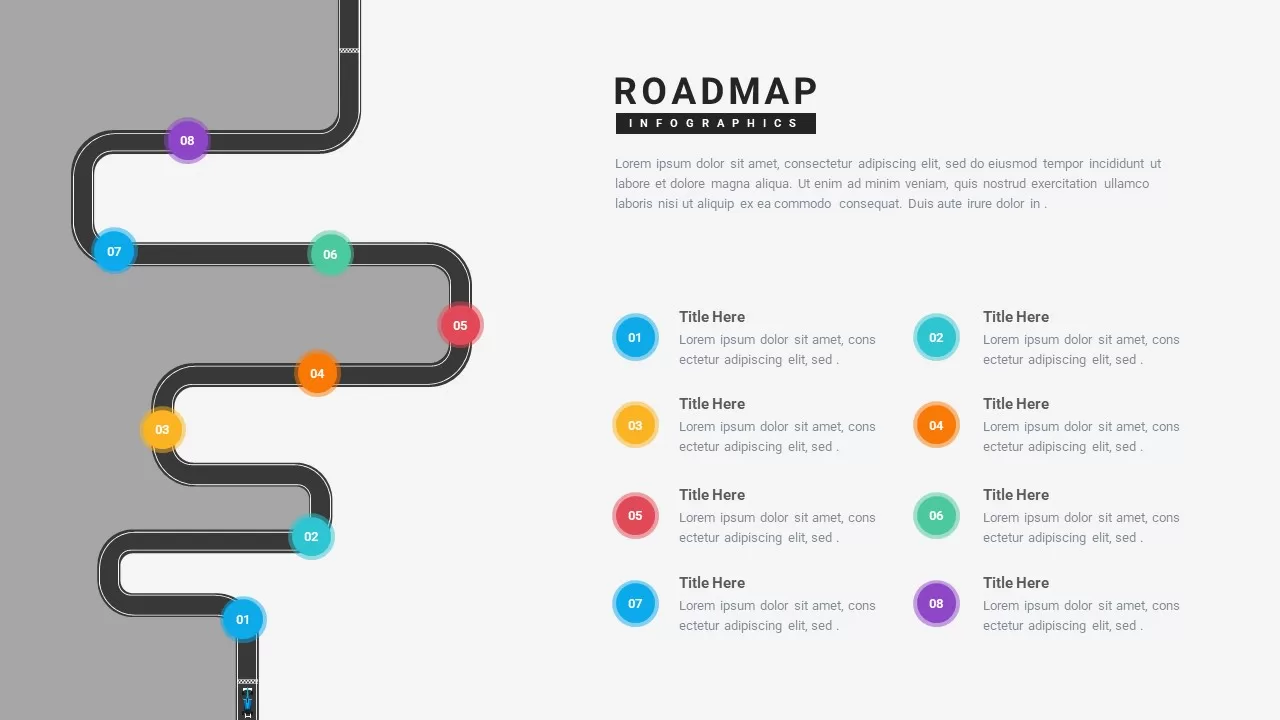
Dynamic Winding Roadmap Infographic Template for PowerPoint & Google Slides
Roadmap

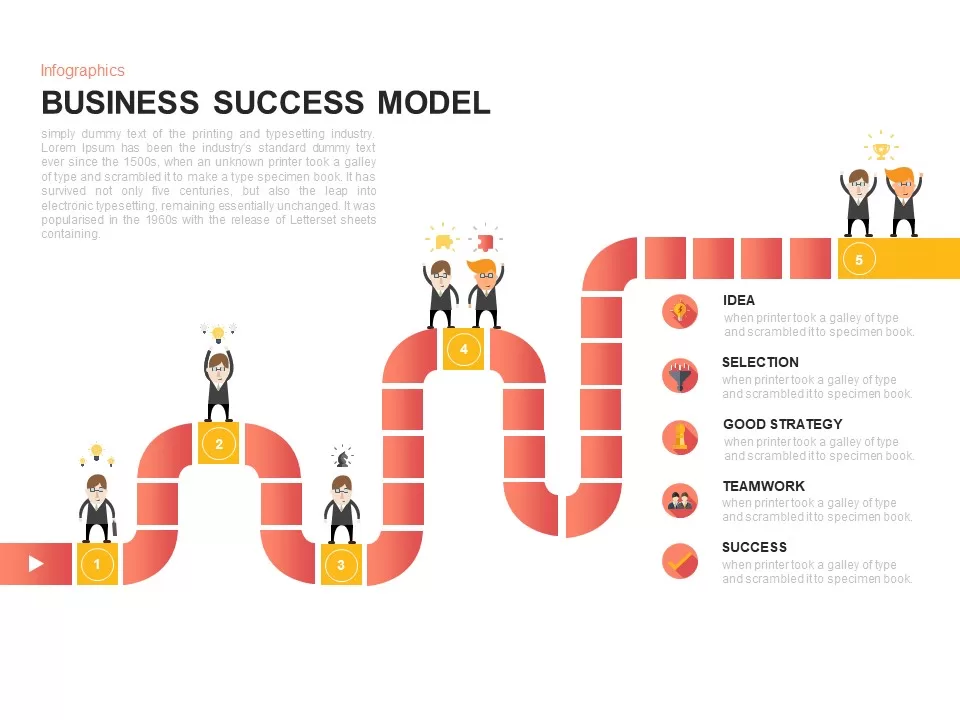
Business Success Model Infographic Template for PowerPoint & Google Slides
Roadmap
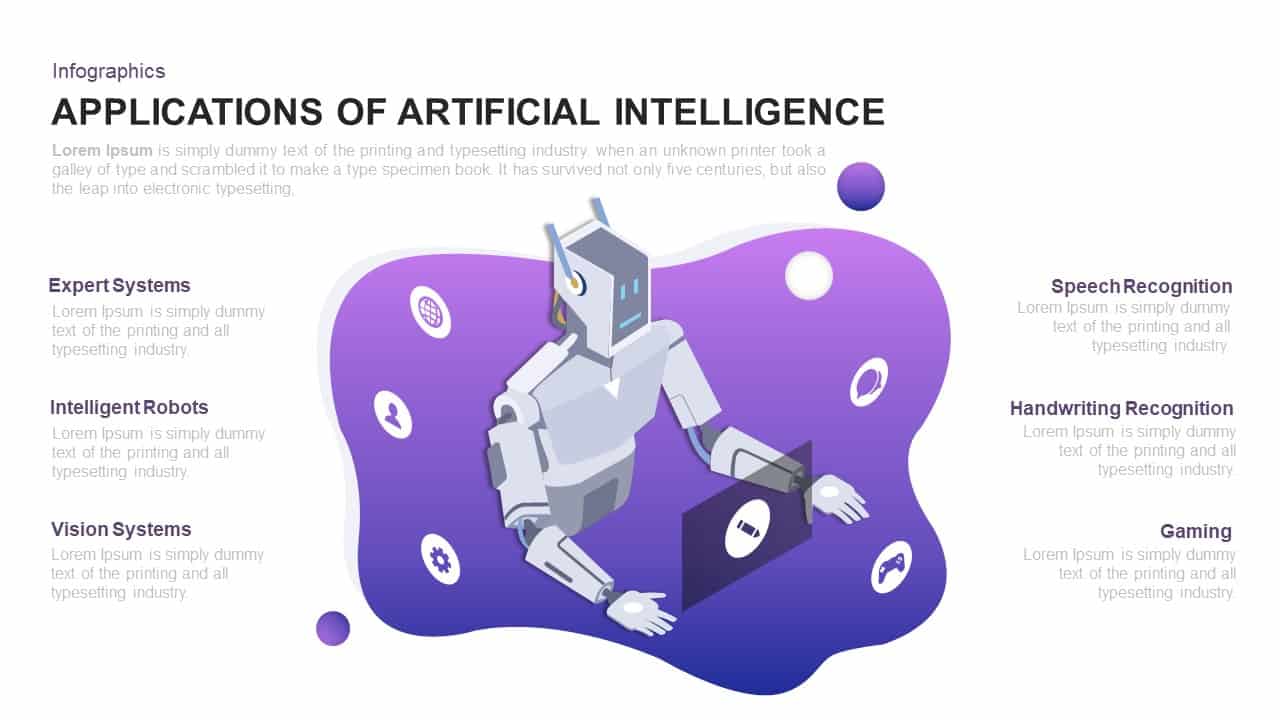
Dynamic AI Applications Infographic Template for PowerPoint & Google Slides
AI
Colorful Mind Map Infographic Template with Icons for PowerPoint & Google Slides
Mind Maps
Dynamic Growth Arrow Step Infographic Template for PowerPoint & Google Slides
Process
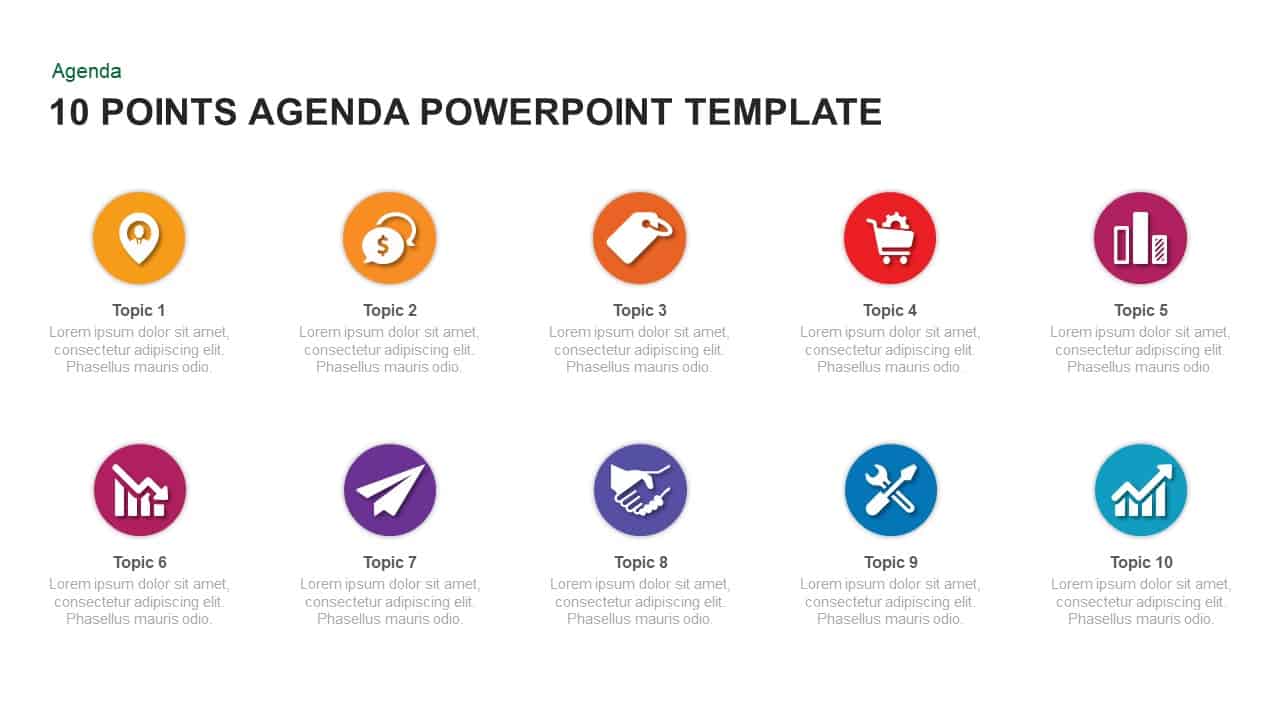
Modern 10-Point Agenda Infographic Template for PowerPoint & Google Slides
Agenda
Four-Stage Circular Diagram Infographic Template for PowerPoint & Google Slides
Circular
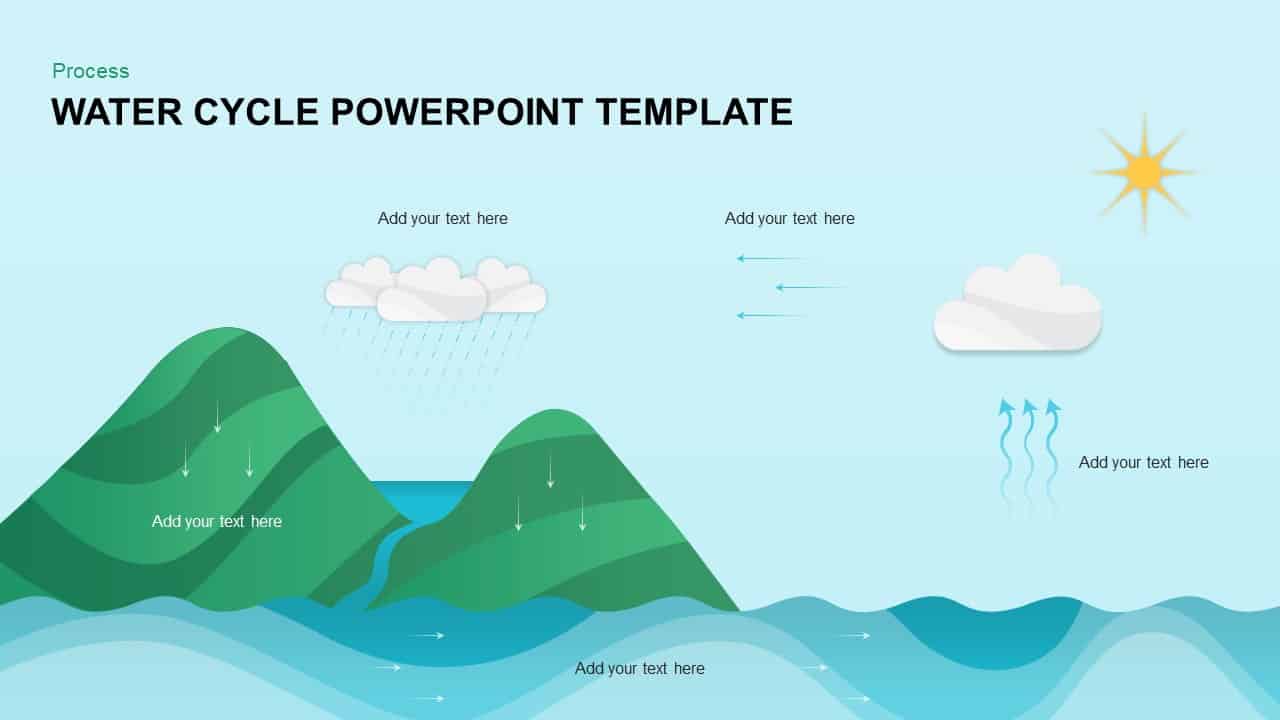
Water Cycle Process Infographic Template for PowerPoint & Google Slides
Process
Circular CRM Process Diagram Infographic Template for PowerPoint & Google Slides
Circular
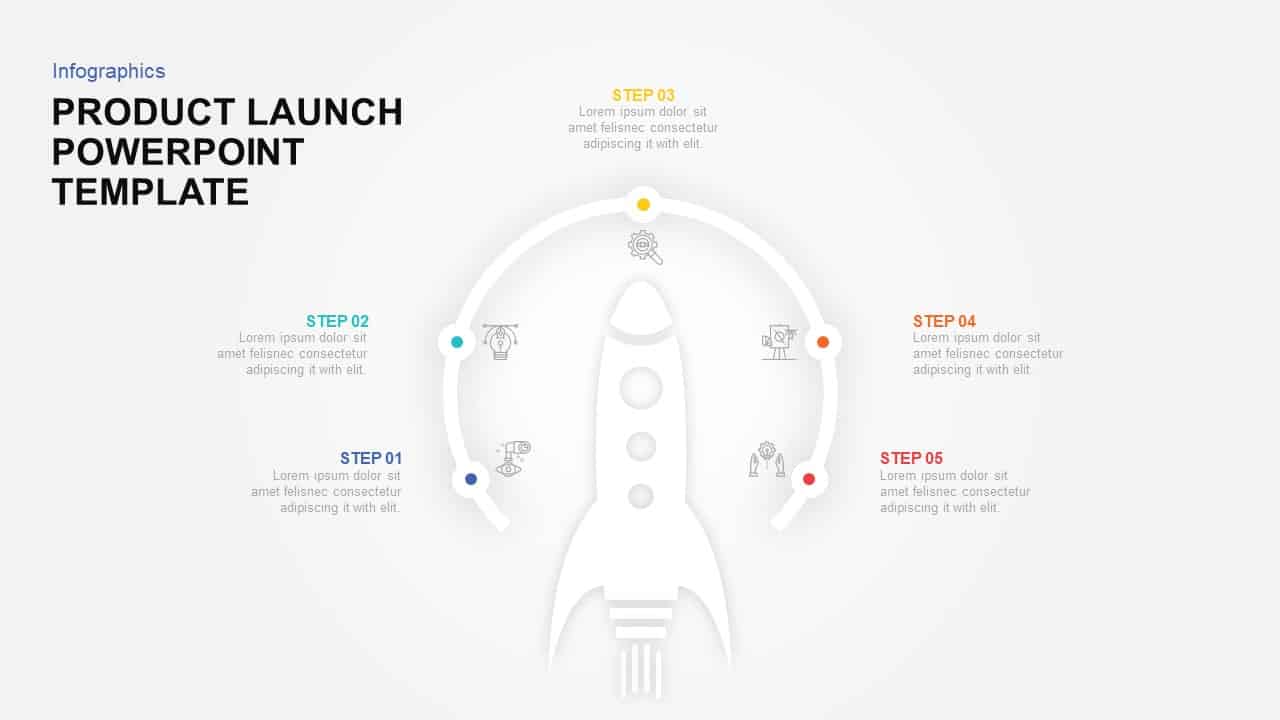
Product Launch 5-Step Rocket Infographic Template for PowerPoint & Google Slides
Process
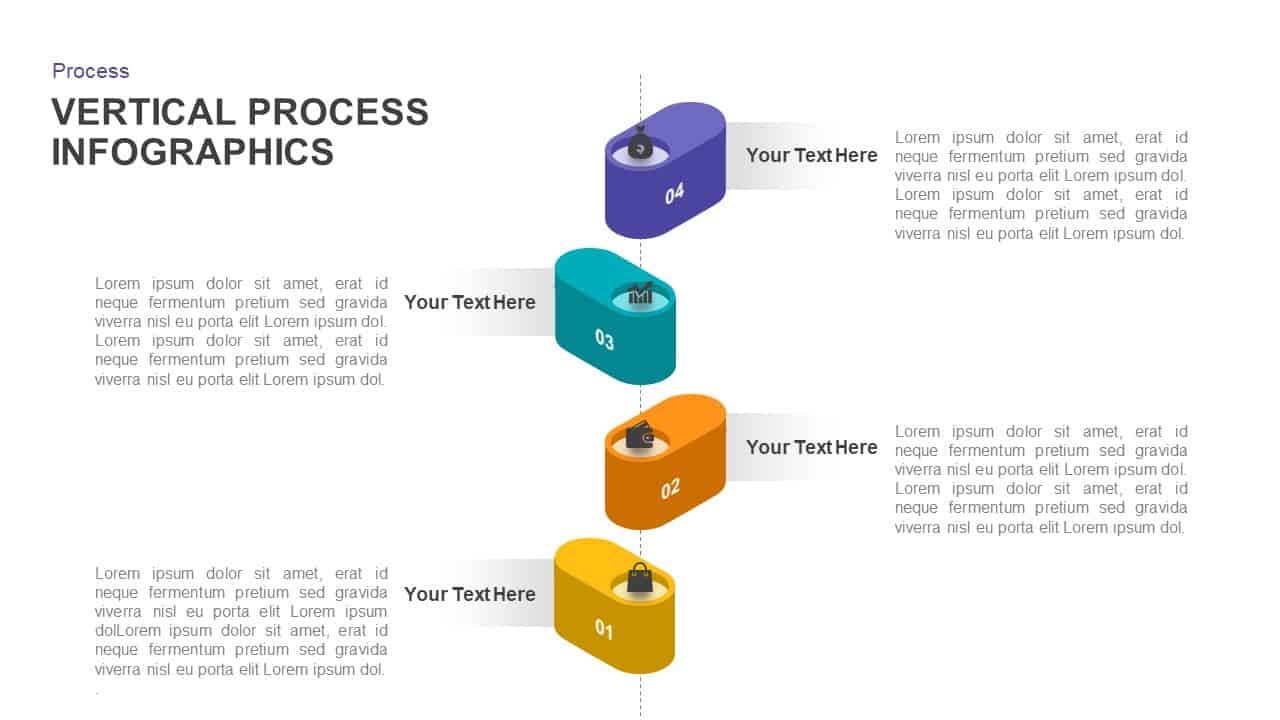
Vertical Four-Step Process Infographic Template for PowerPoint & Google Slides
Process
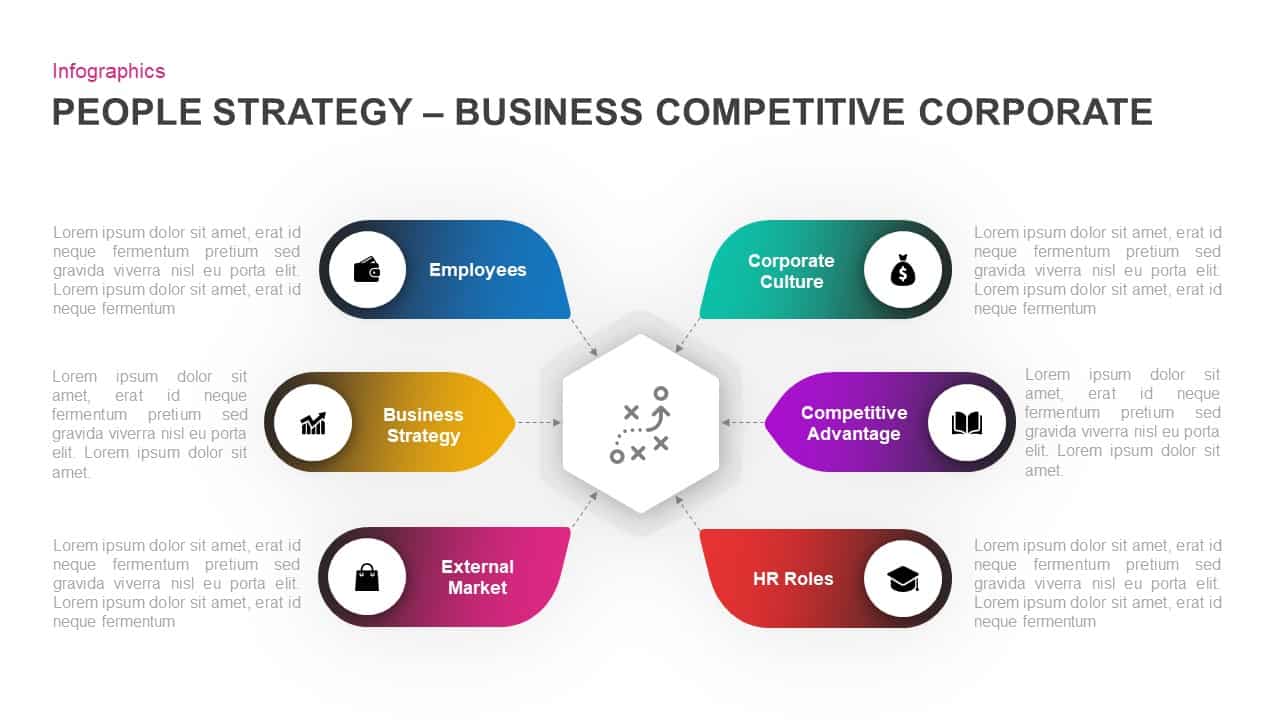
Corporate People Strategy Infographic Template for PowerPoint & Google Slides
Process
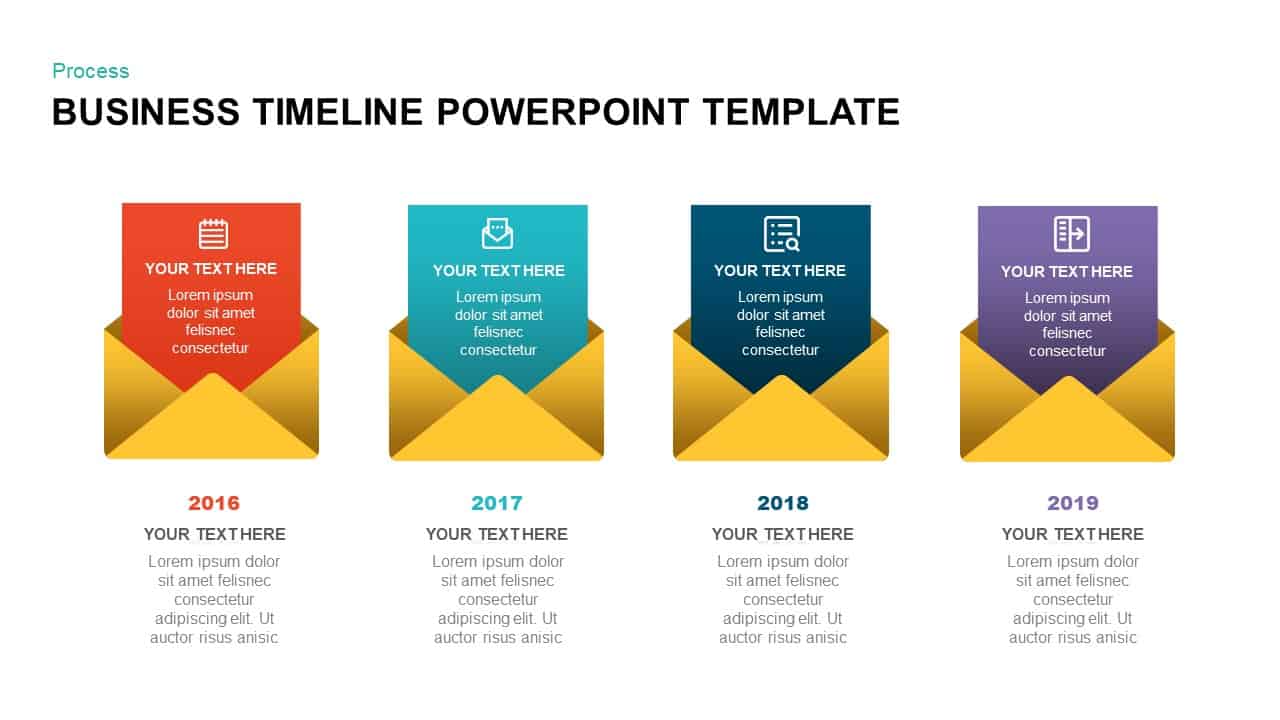
Business Timeline Envelope Infographic Template for PowerPoint & Google Slides
Timeline
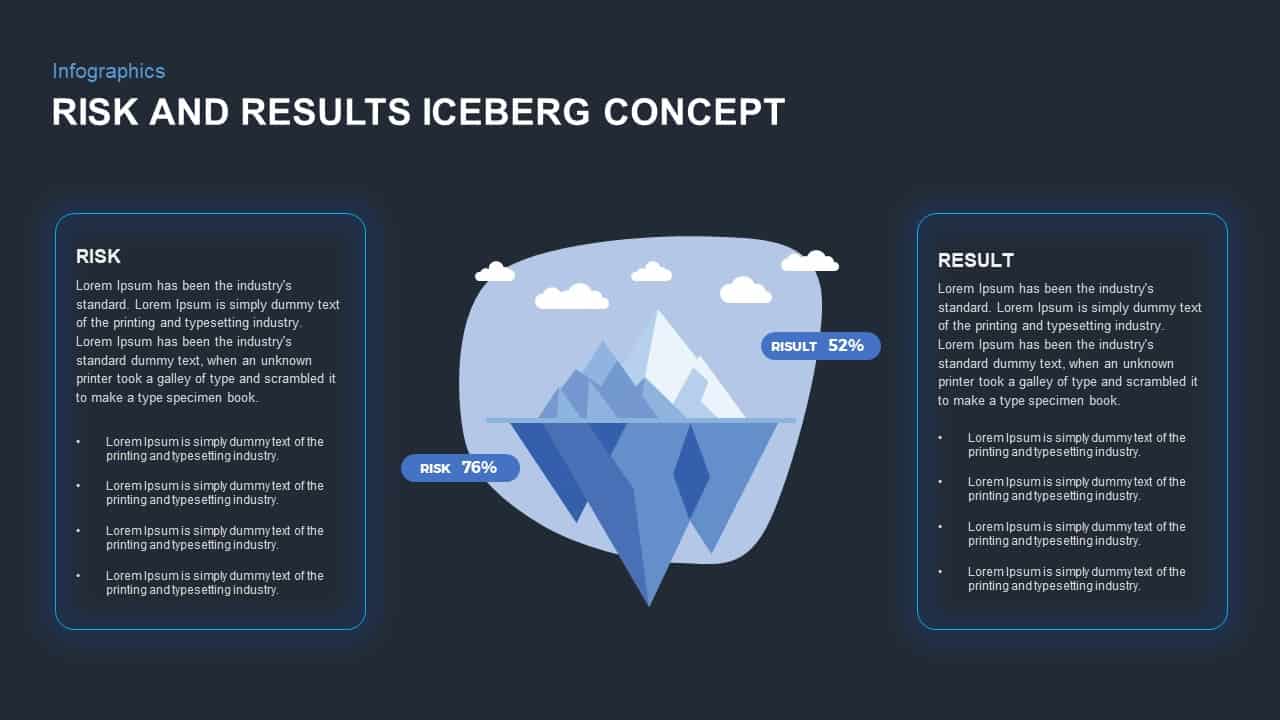
Risk and Results Iceberg Infographic Template for PowerPoint & Google Slides
Comparison
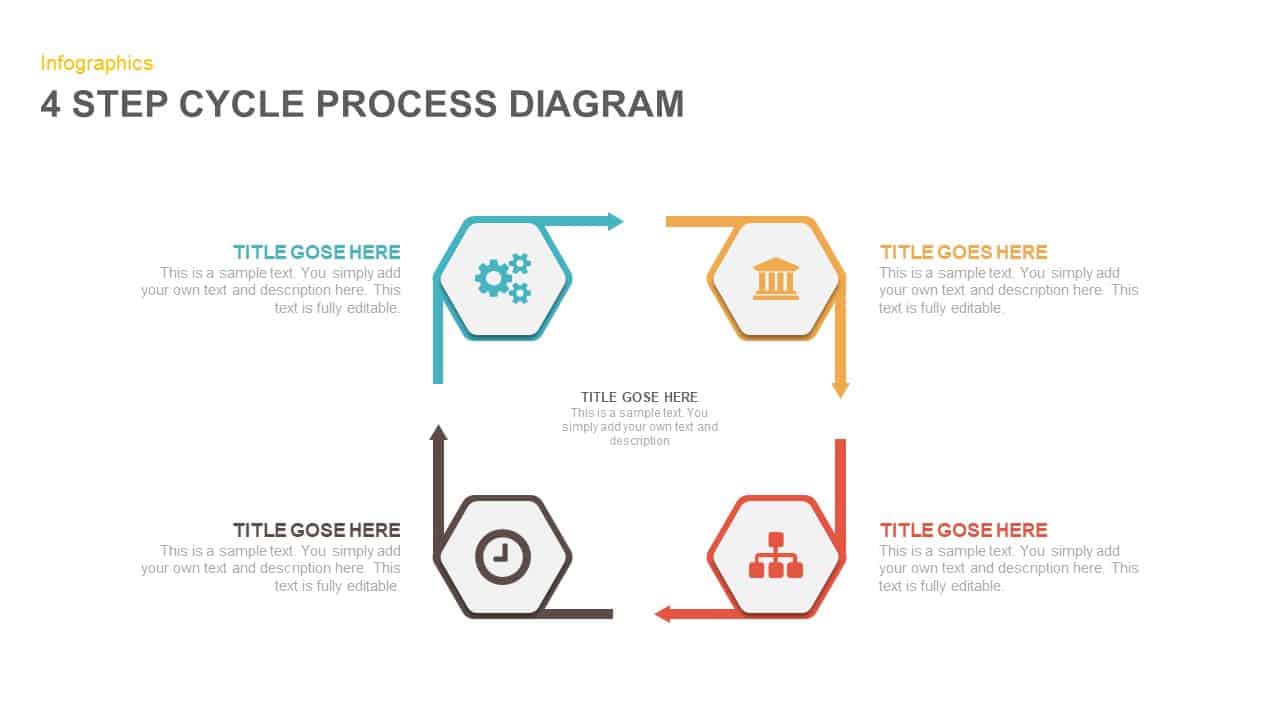
Four-Step Hexagon Process Infographic Template for PowerPoint & Google Slides
Process
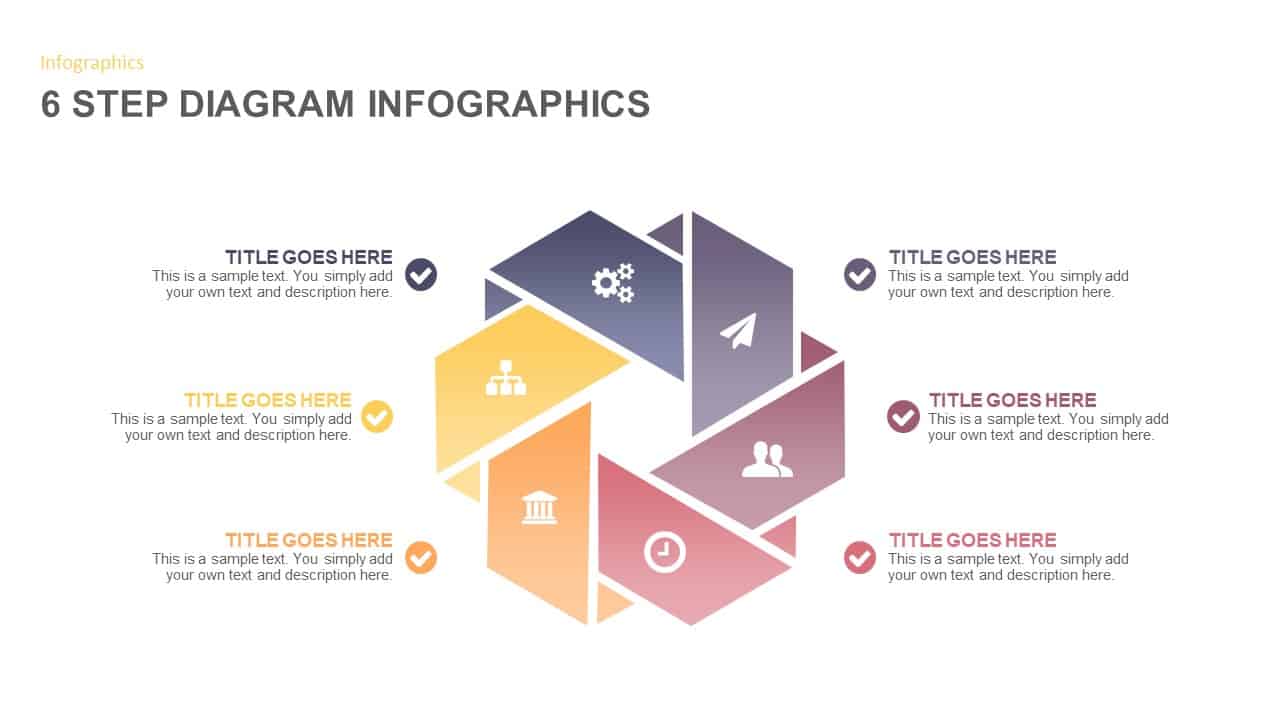
6-Step Circular Diagram Infographic Template for PowerPoint & Google Slides
Circular
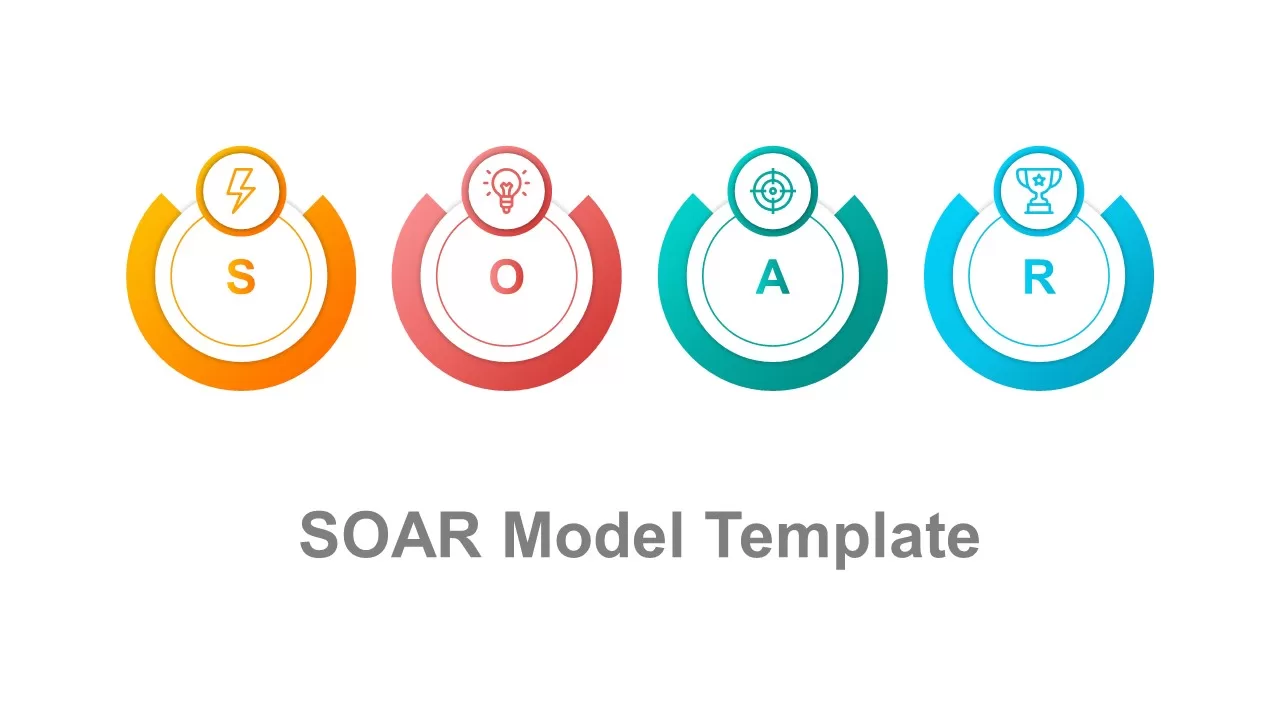
SOAR Strategic Planning Infographic Template for PowerPoint & Google Slides
Process

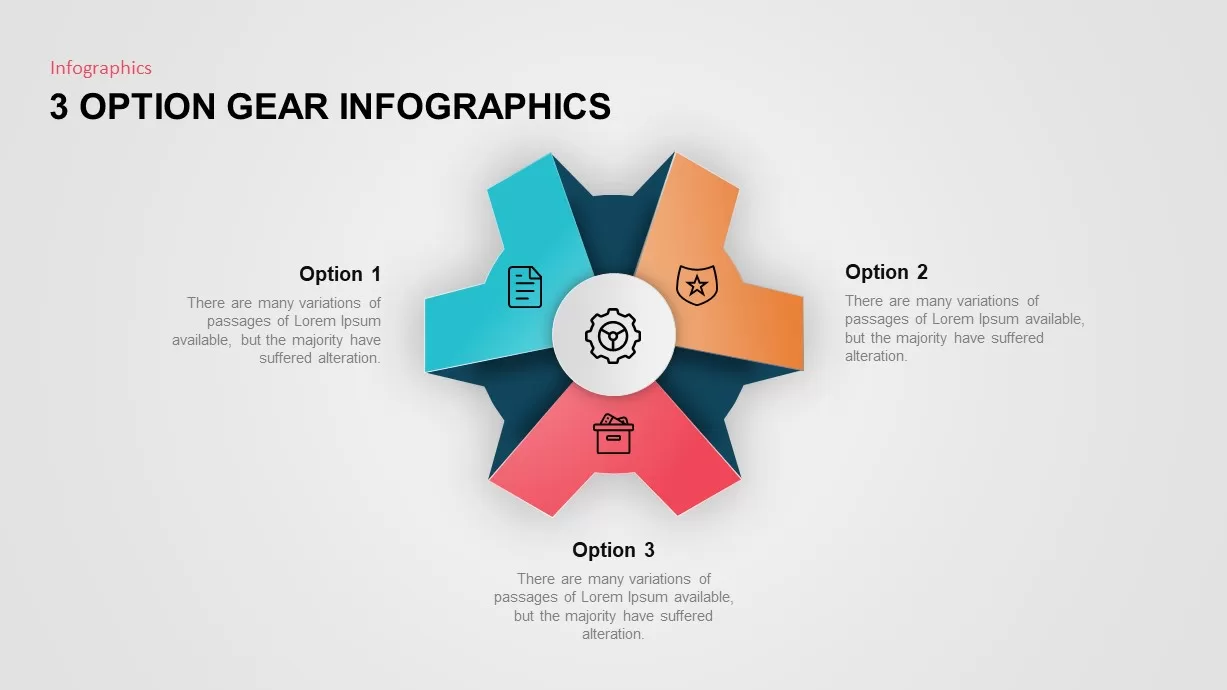
Three-Option Gear Infographic Pro Template for PowerPoint & Google Slides
Process
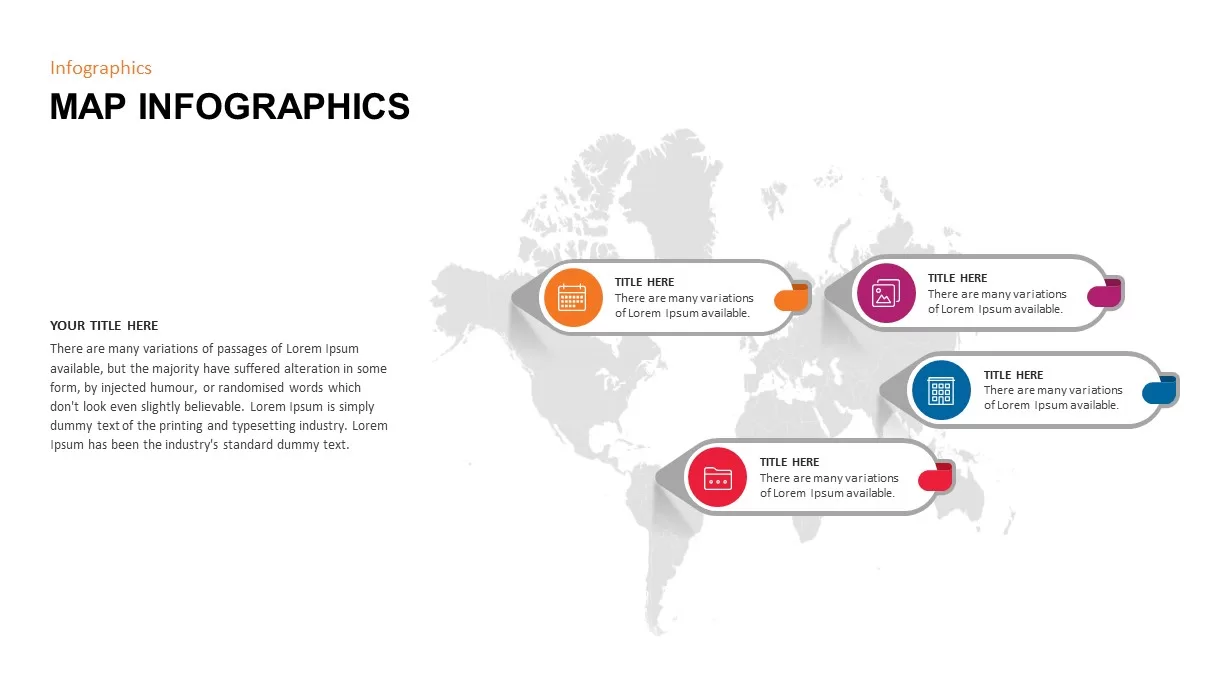
Modern World Map Callout Infographic Template for PowerPoint & Google Slides
World Maps
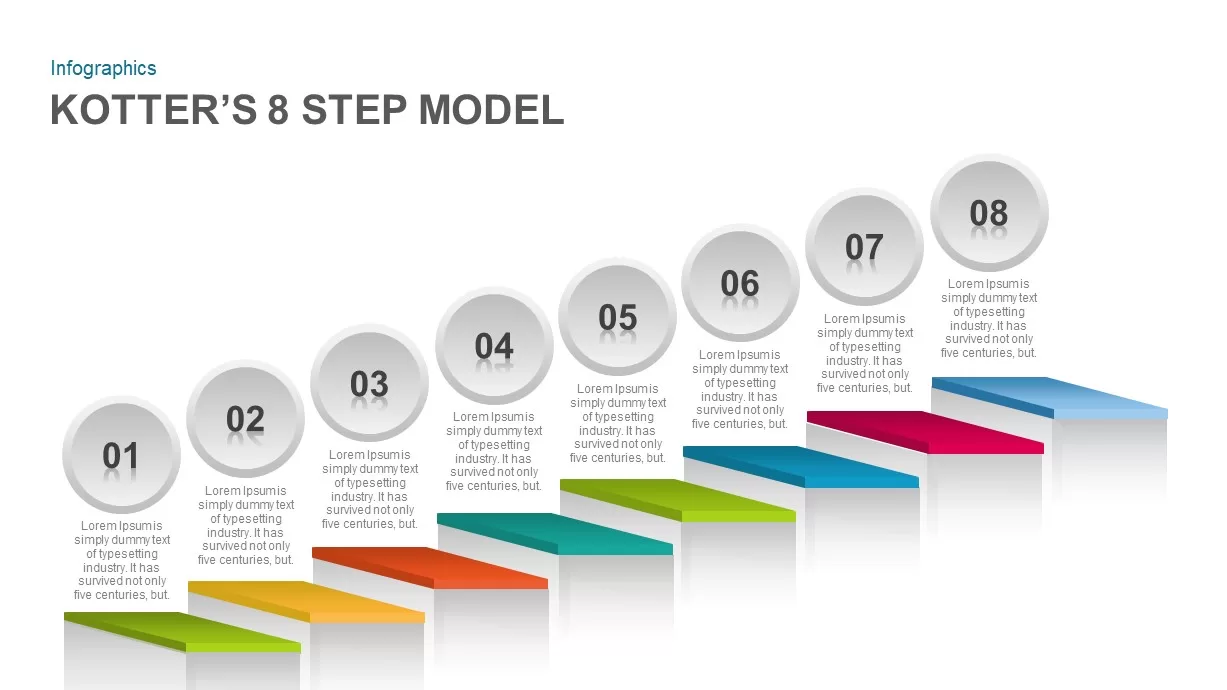
Kotter’s 8-Step Model Infographic Template for PowerPoint & Google Slides
Process
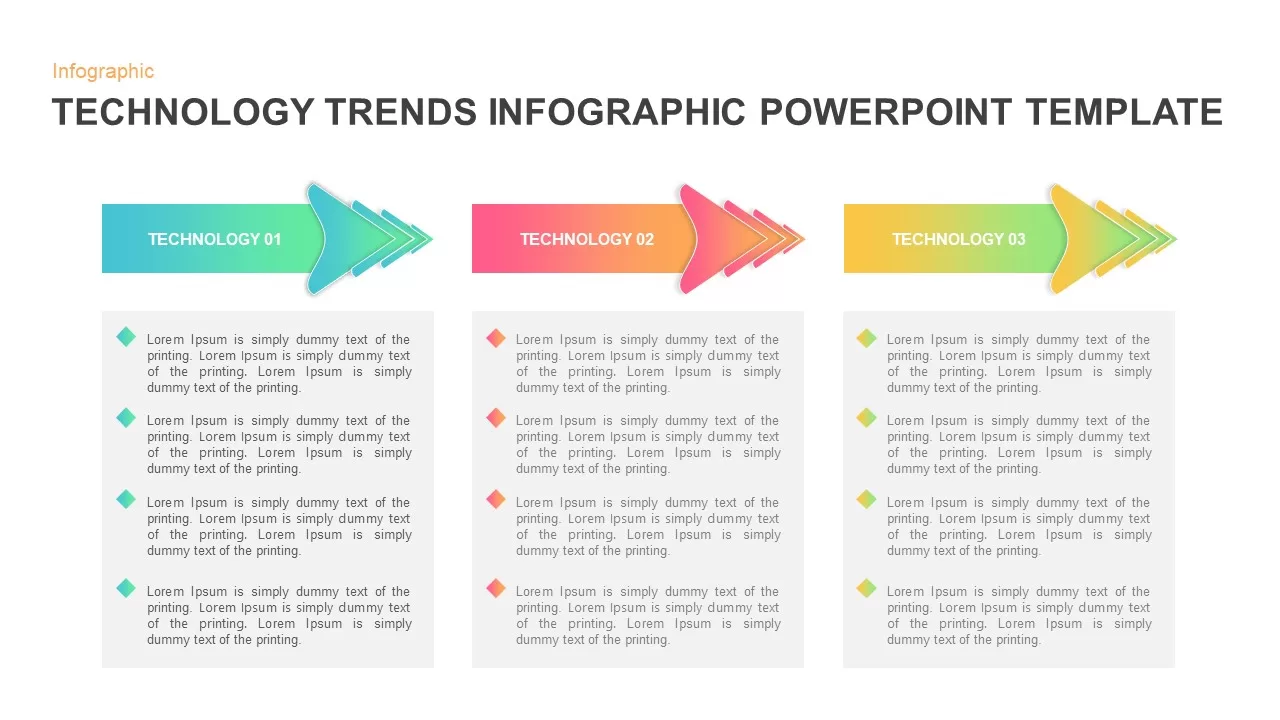
Technology Arrow Infographic Template for PowerPoint & Google Slides
Pitch Deck
Six-Stage Road Map Infographic Timeline Template for PowerPoint & Google Slides
Roadmap
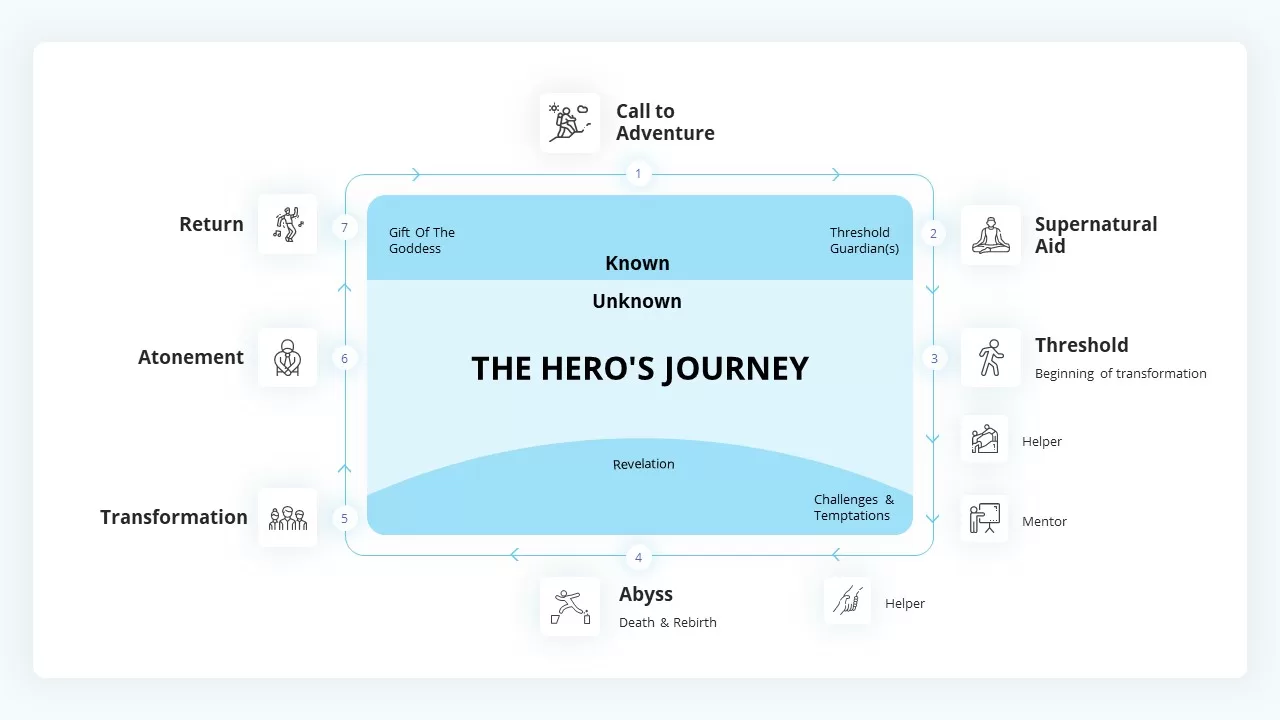
The Hero’s Journey Infographic Framework Template for PowerPoint & Google Slides
Customer Journey
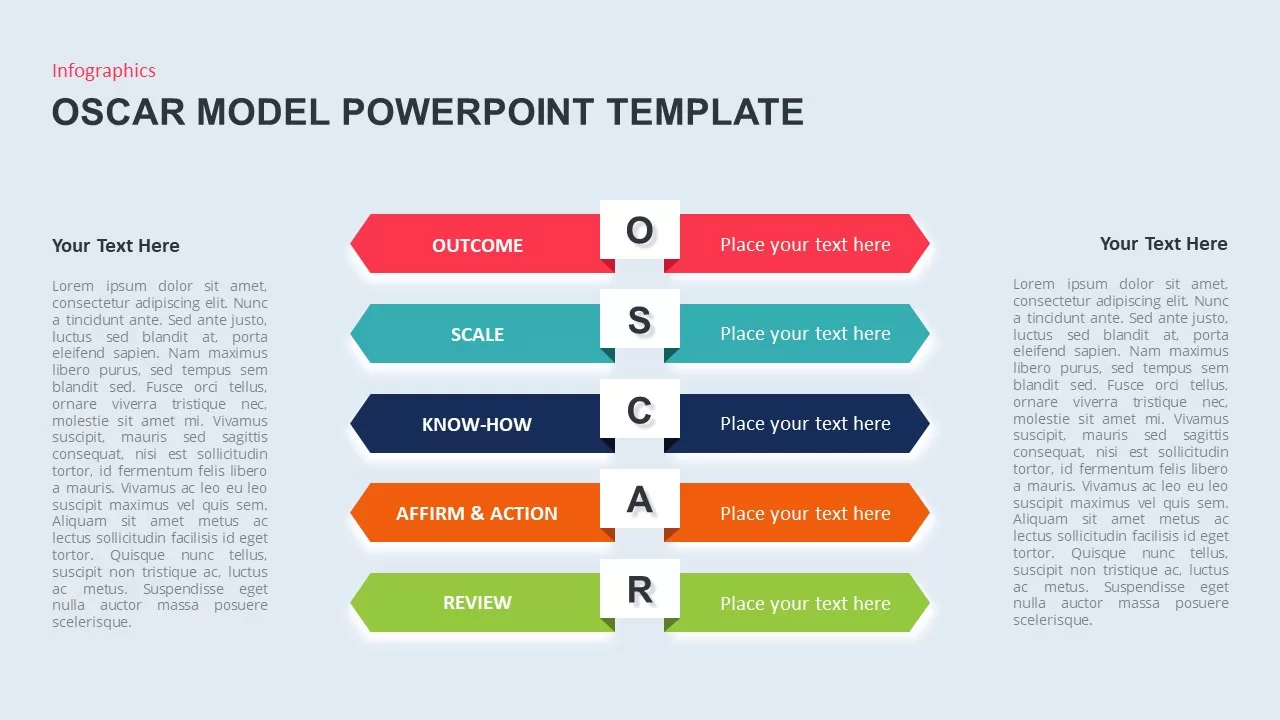
OSCAR Behavior Model Infographic Template for PowerPoint & Google Slides
HR
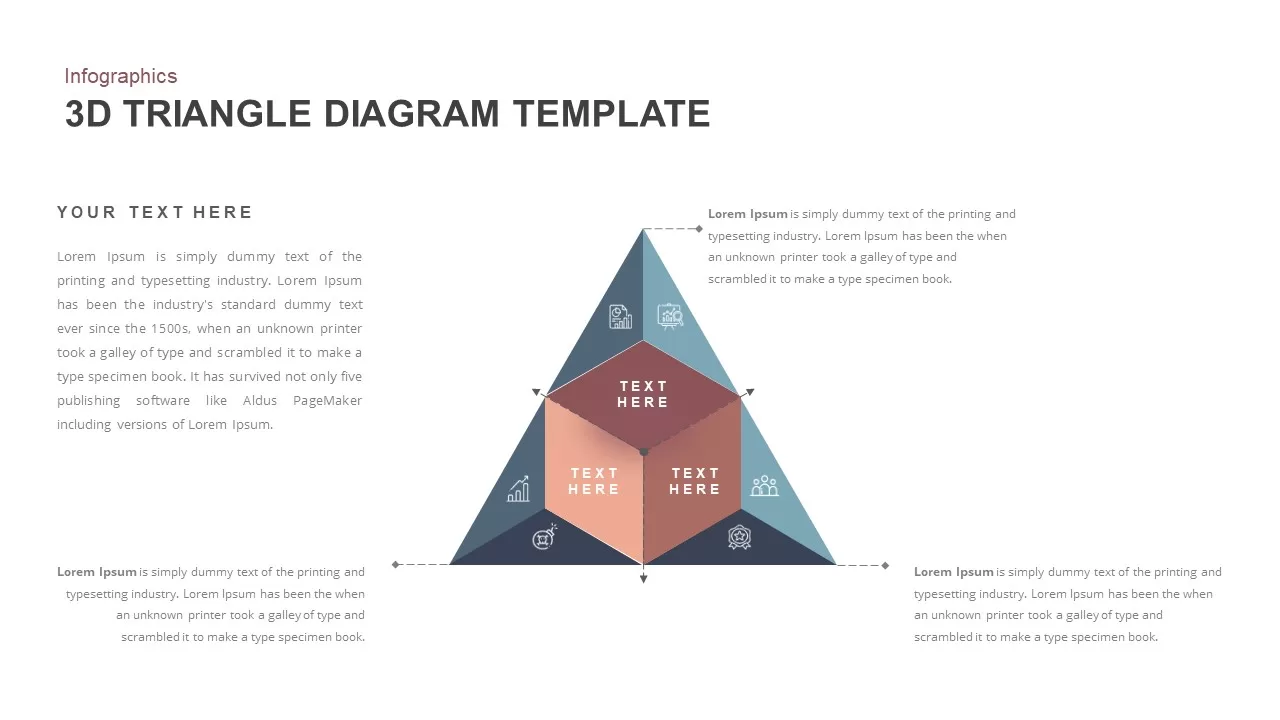
3D Triangle Diagram Infographic Template for PowerPoint & Google Slides
Pyramid
Upward Arrow infographic template for PowerPoint & Google Slides
Infographics
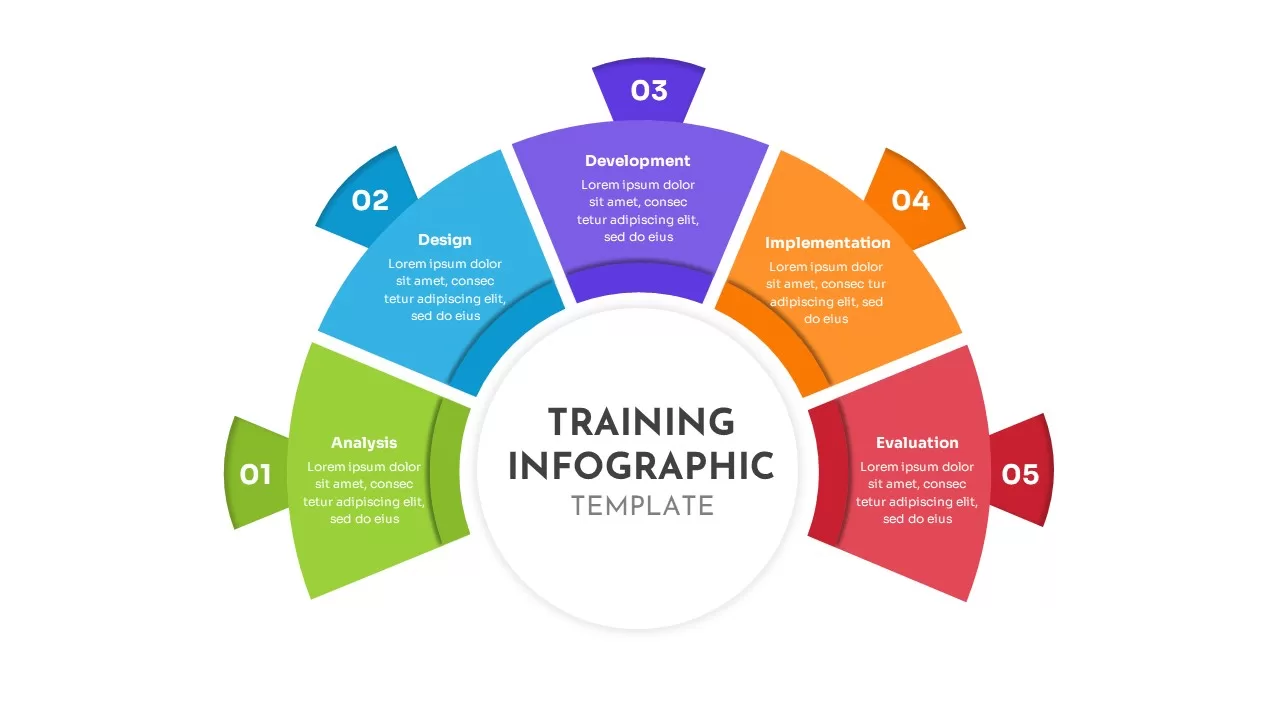
Training Infographic template for PowerPoint & Google Slides
Business
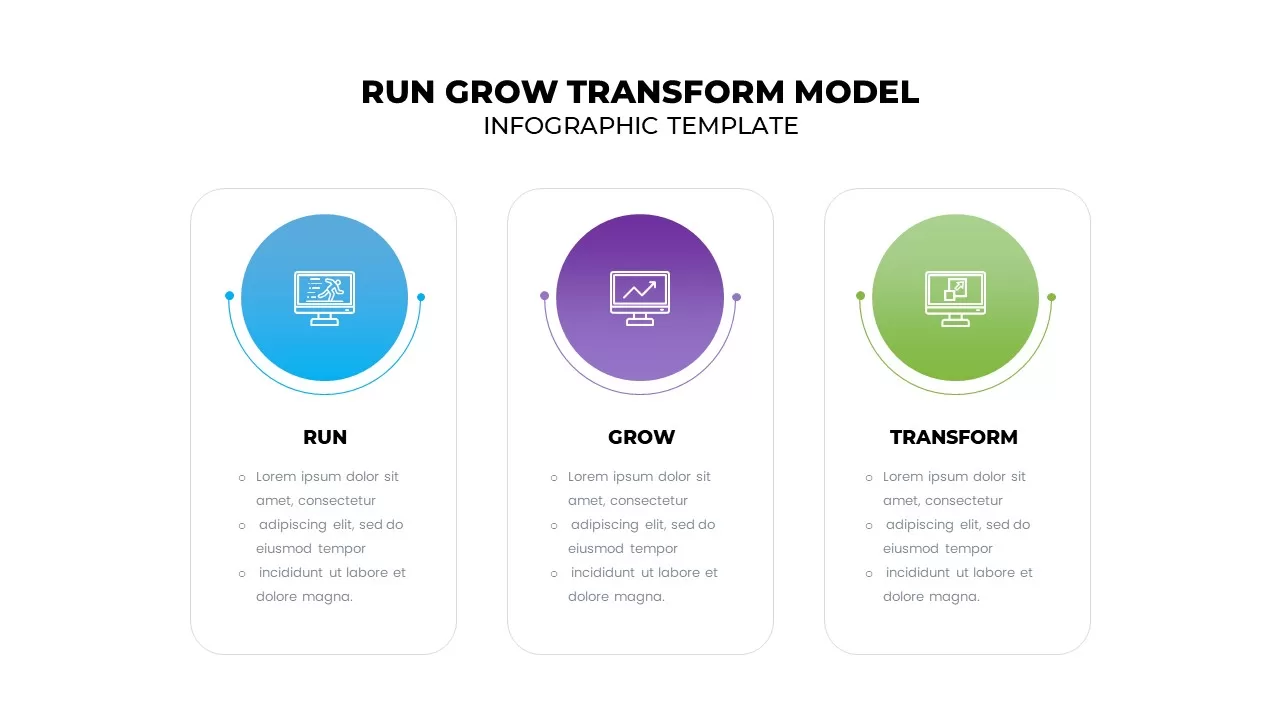
Run Grow Transform Model Infographic Template for PowerPoint & Google Slides
Business
30-60-90 Day Donut Chart Plan Infographic Template for PowerPoint & Google Slides
Timeline
Circular SWOT Analysis Infographic Template for PowerPoint & Google Slides
SWOT
Editable World Map Callout Infographic Template for PowerPoint & Google Slides
World Maps
Eight-Step Winding Roadmap Infographic Template for PowerPoint & Google Slides
Roadmap
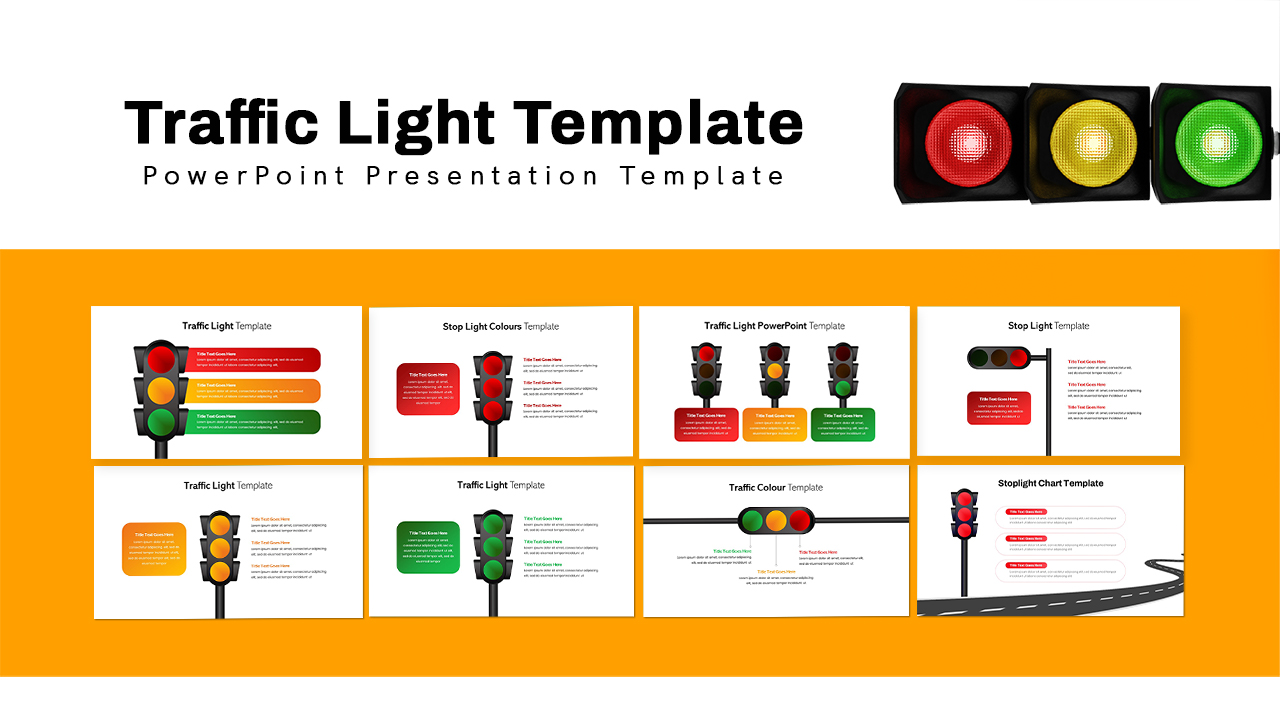
Traffic Light Infographic Pack Template for PowerPoint & Google Slides
Pitch Deck
Multi-Style Flow Infographic Slide template for PowerPoint & Google Slides
Process
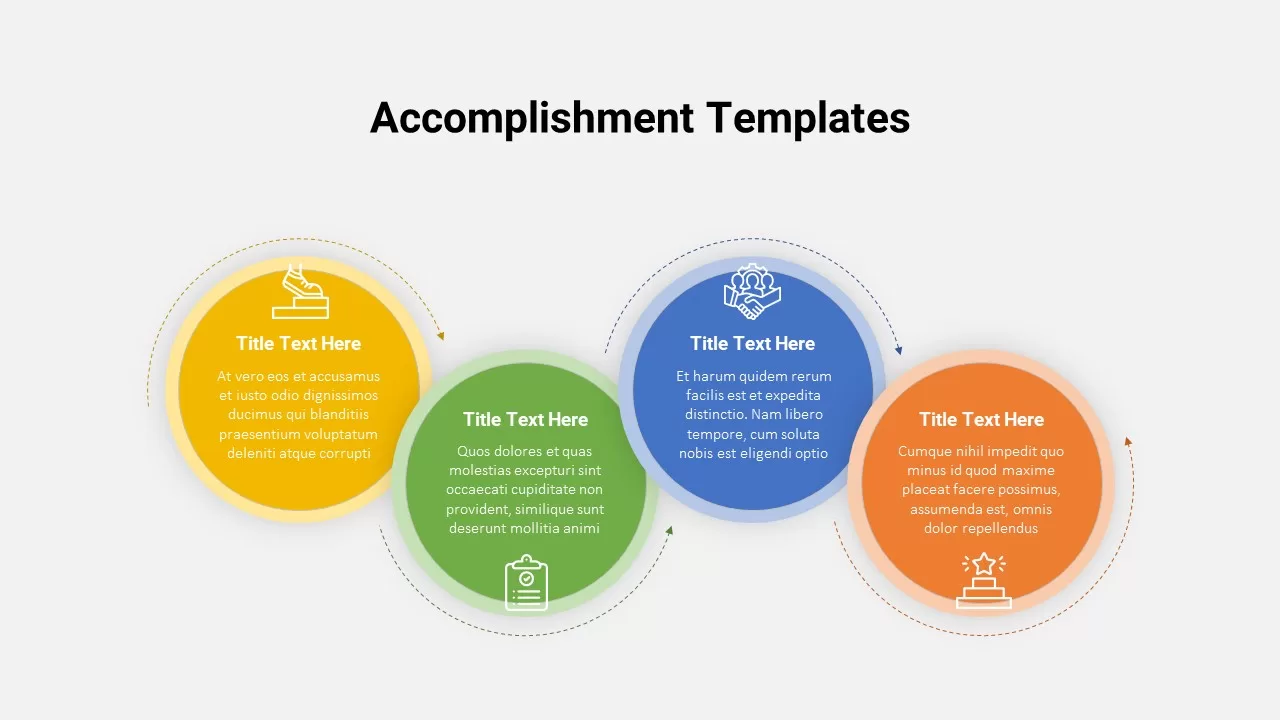
Accomplishment Circular Infographic Template for PowerPoint & Google Slides
Accomplishment
Six-Part Hexagon Infographic Layout Template for PowerPoint & Google Slides
Infographics
Chain Link Process Infographic Diagram Template for PowerPoint & Google Slides
Process
4 Step Methodology Infographic Template for PowerPoint & Google Slides
Process
Statistics Infographic Template for PowerPoint & Google Slides
Bar/Column
Statistics & Global Metrics Infographic Template for PowerPoint & Google Slides
Bar/Column
Dynamic Circular Hub-and-Spoke Infographic Template for PowerPoint & Google Slides
Circular
Professional Drone Infographic Slide Template for PowerPoint & Google Slides
Infographics
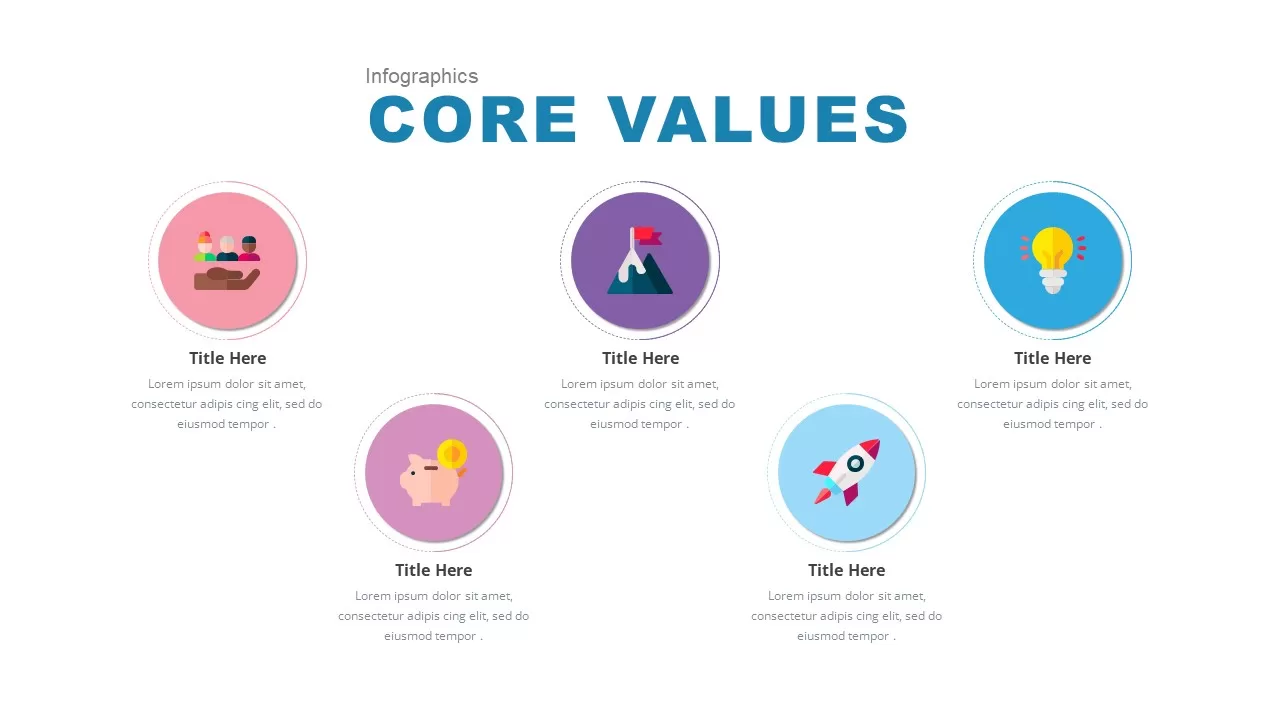
Core Values Infographic Slide Template for PowerPoint & Google Slides
Comparison
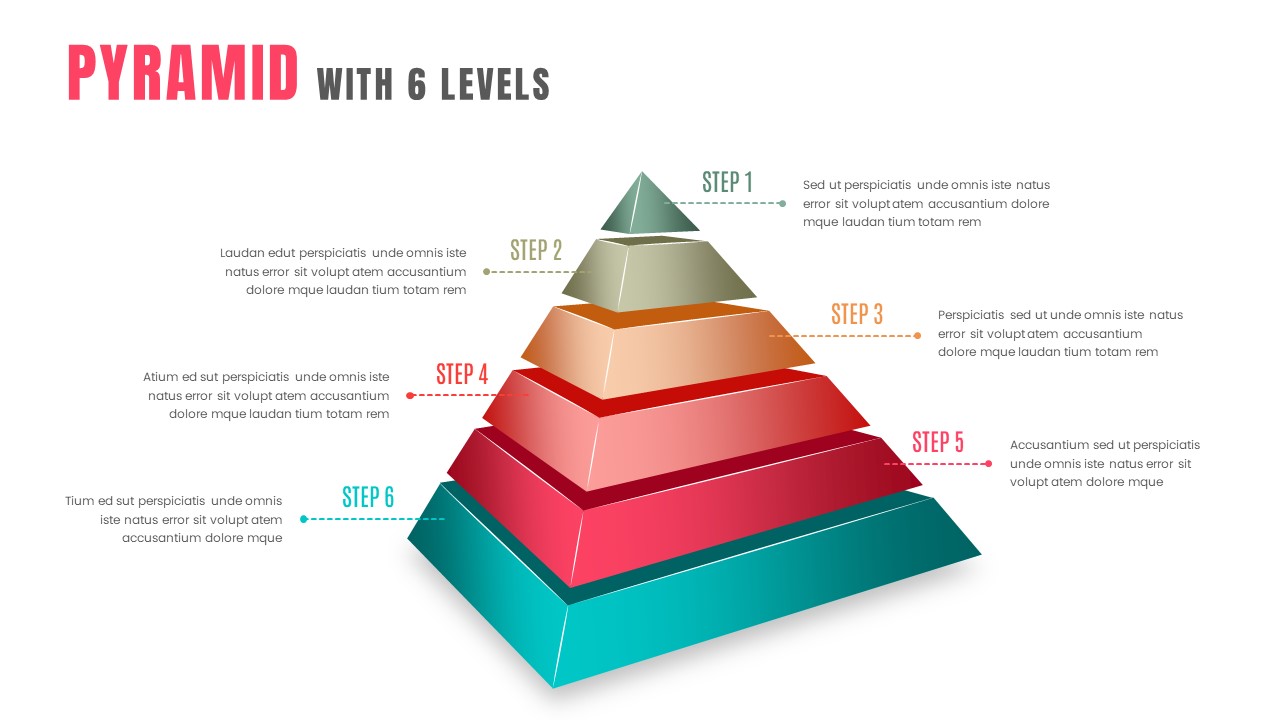
3D Six-Level Pyramid Diagram Infographic Template for PowerPoint & Google Slides
Pyramid
Instagram Infographic Metrics Slide Template for PowerPoint & Google Slides
Marketing
Dynamic Chevron Timeline Infographic Template for PowerPoint & Google Slides
Timeline
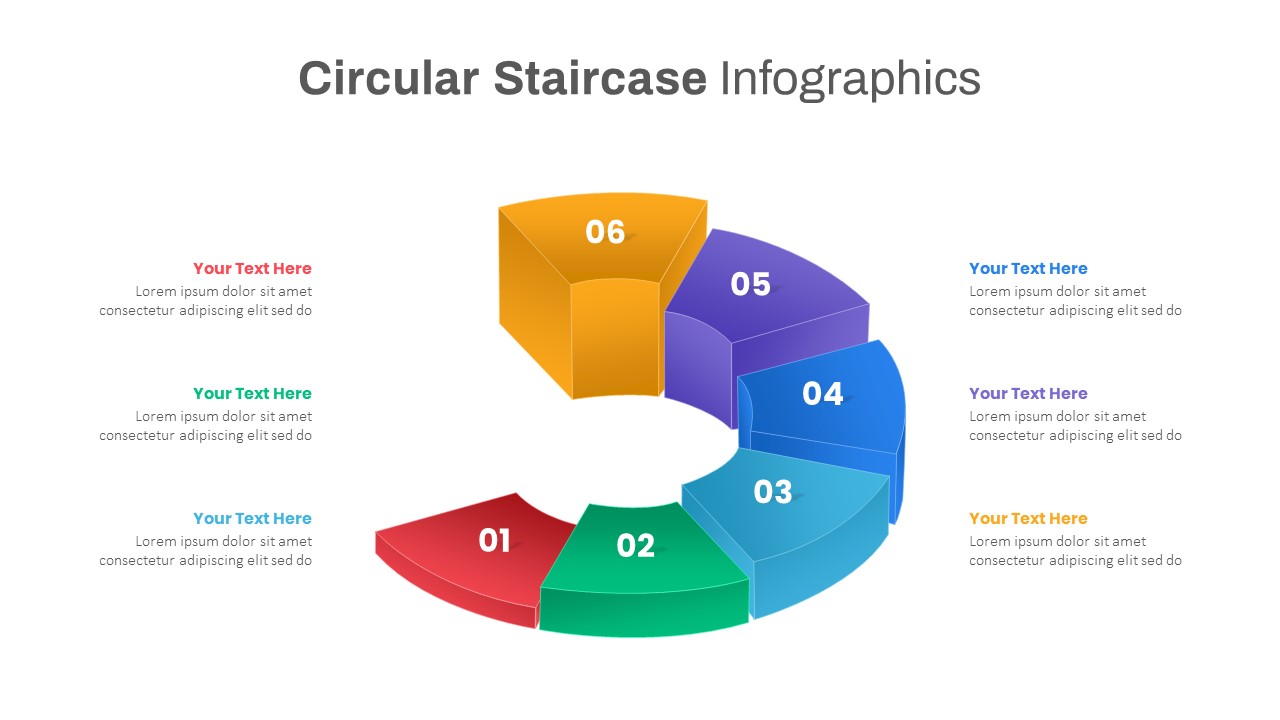
Six-Step Staircase Infographic Template for PowerPoint & Google Slides
Circular
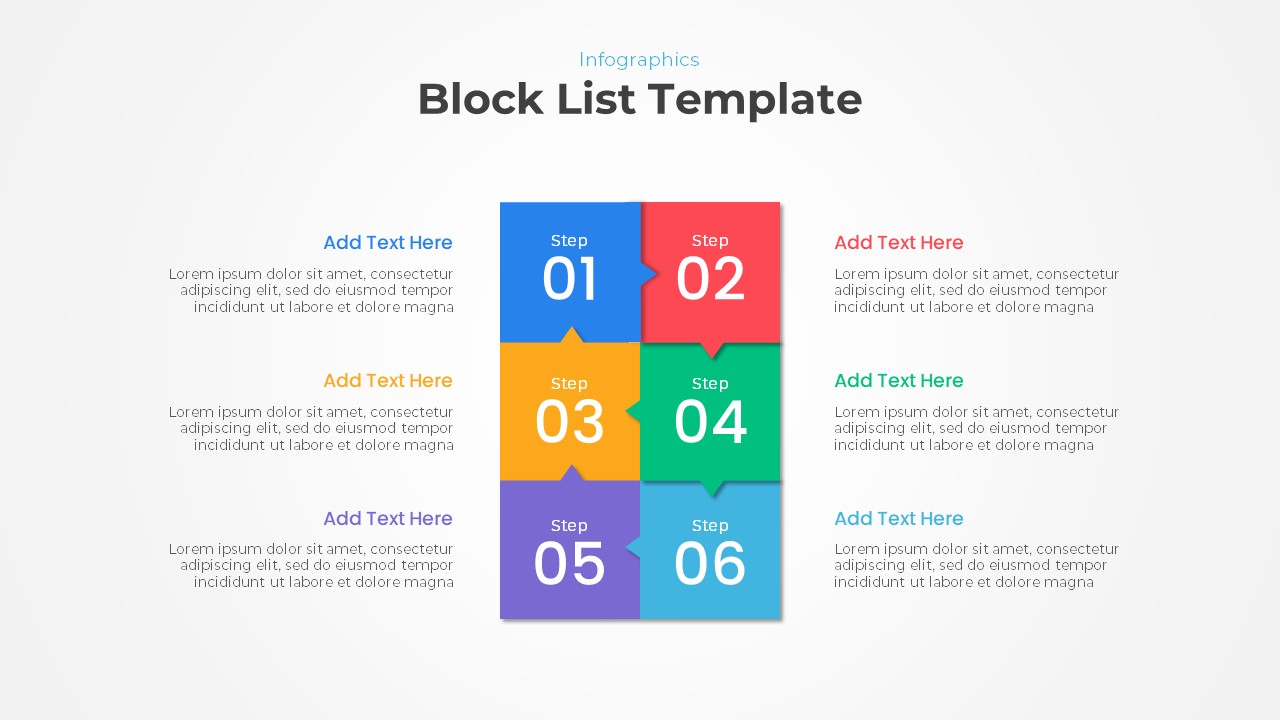
Creative Block List Infographic Template for PowerPoint & Google Slides
Agenda
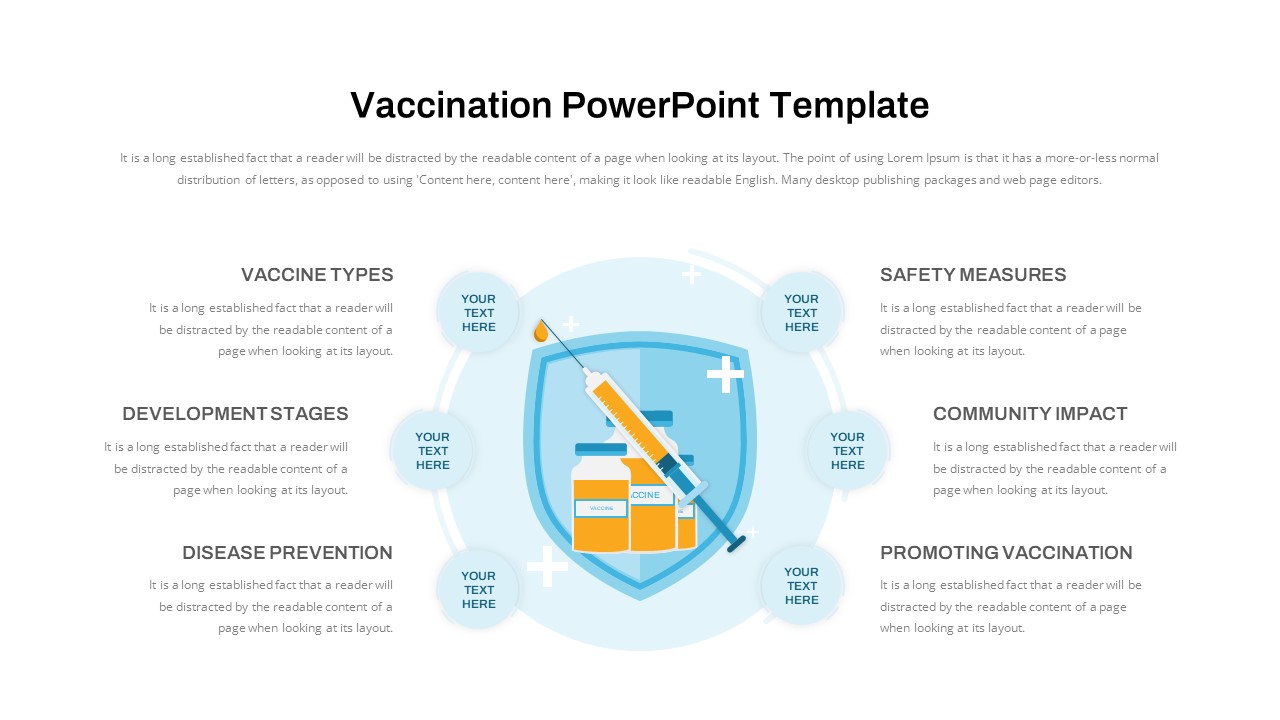
Vaccination Hub-and-Spoke Infographic Template for PowerPoint & Google Slides
Circular
Free Global Warming Infographic Comparison Template for PowerPoint & Google Slides
Comparison Chart
Free
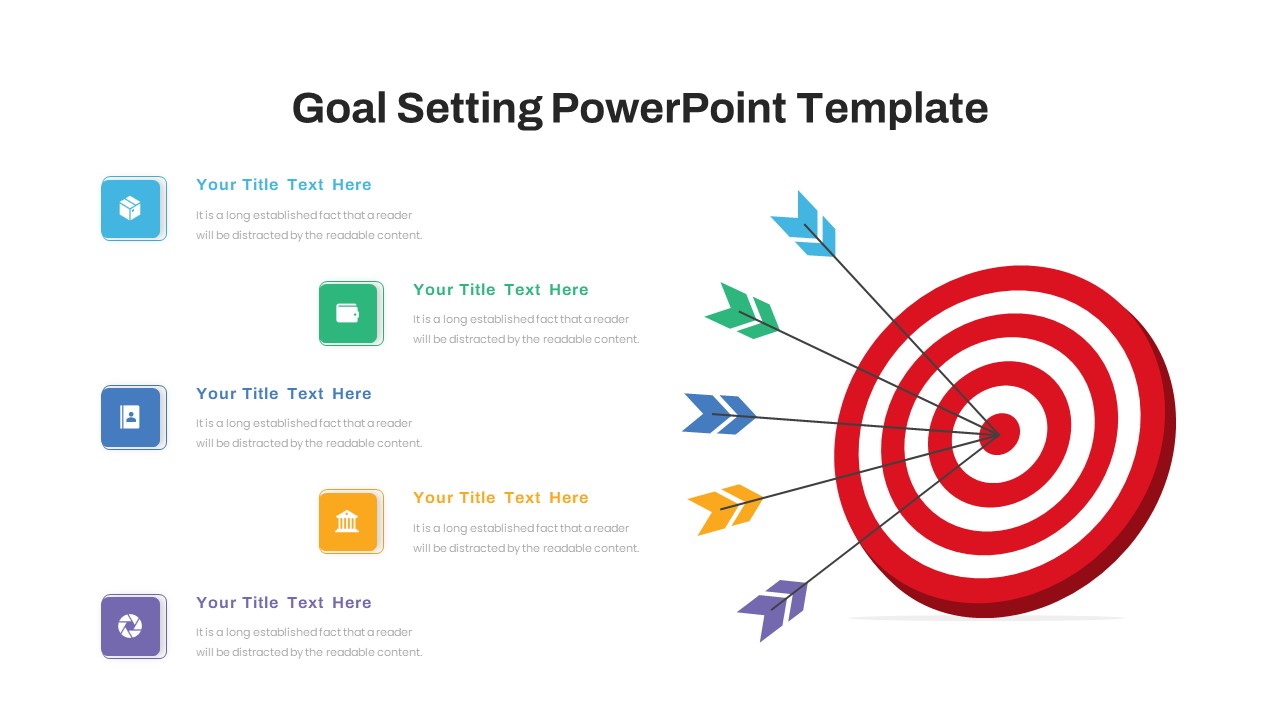
Free Goal Setting Target Infographic Slide Template for PowerPoint & Google Slides
Goals
Free
Editable Ireland Map Infographic Slide Template for PowerPoint & Google Slides
World Maps
Free
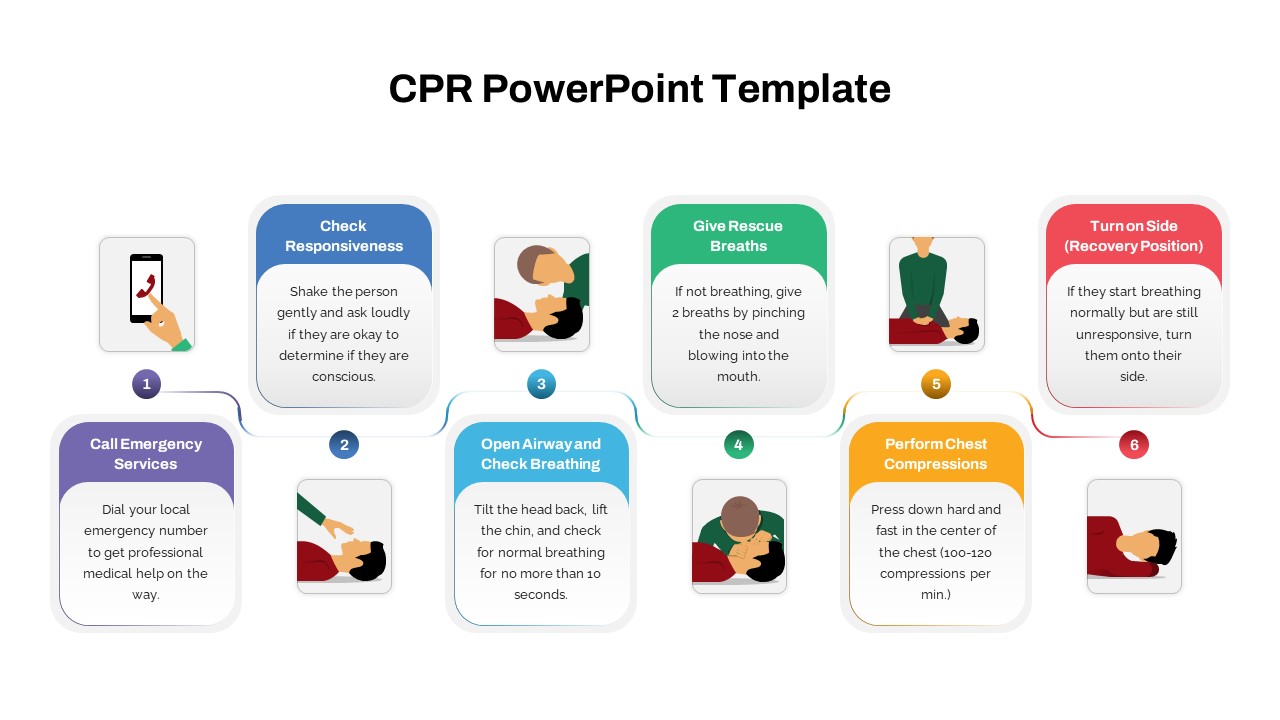
CPR Training Process Infographic Template for PowerPoint & Google Slides
Process
Types of AI Comparison Infographic Template for PowerPoint & Google Slides
AI
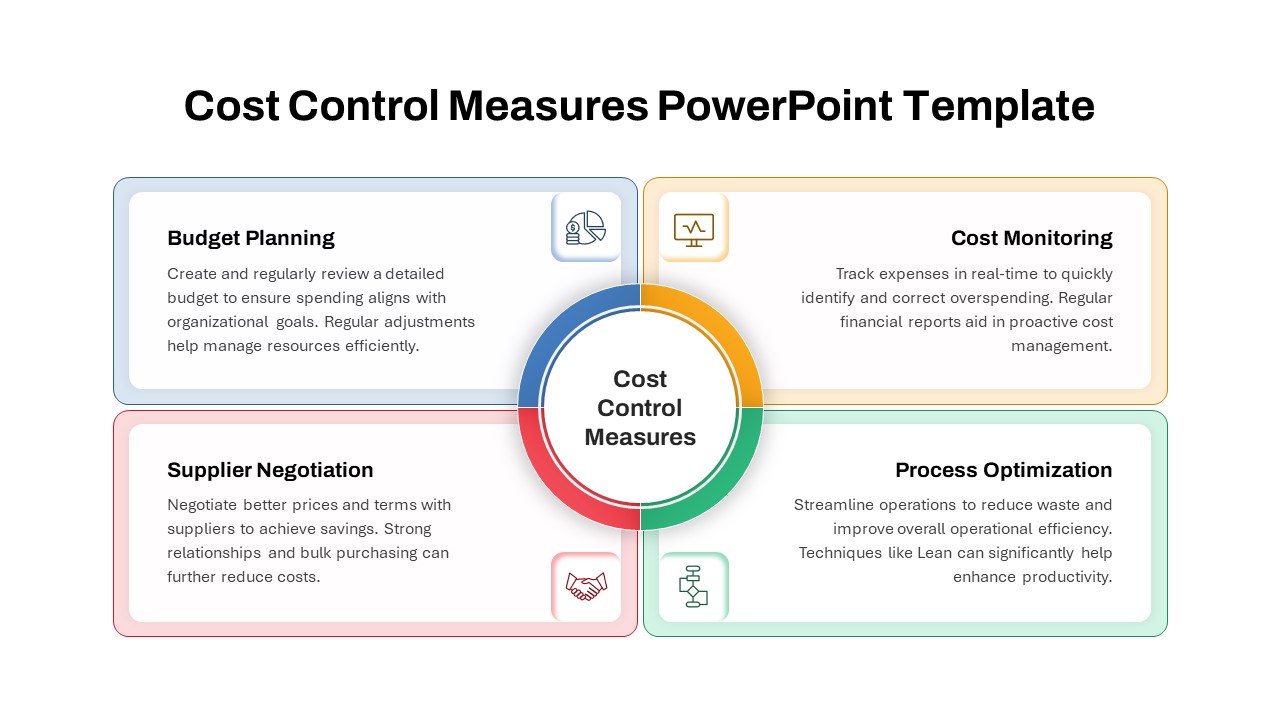
Cost Control Measures Infographic Template for PowerPoint & Google Slides
Circular
Salience Model Venn Diagram Infographic Template for PowerPoint & Google Slides
Circular
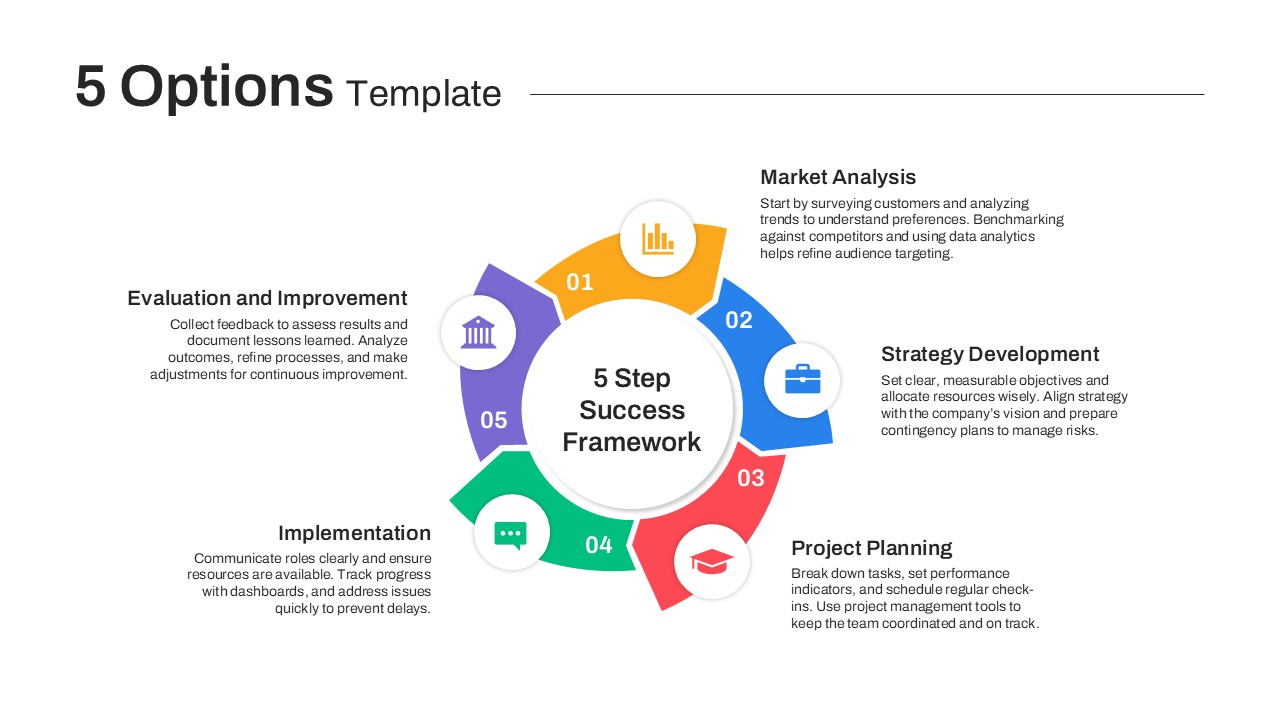
Colorful Five-Option Ribbon Infographic Template for PowerPoint & Google Slides
Process
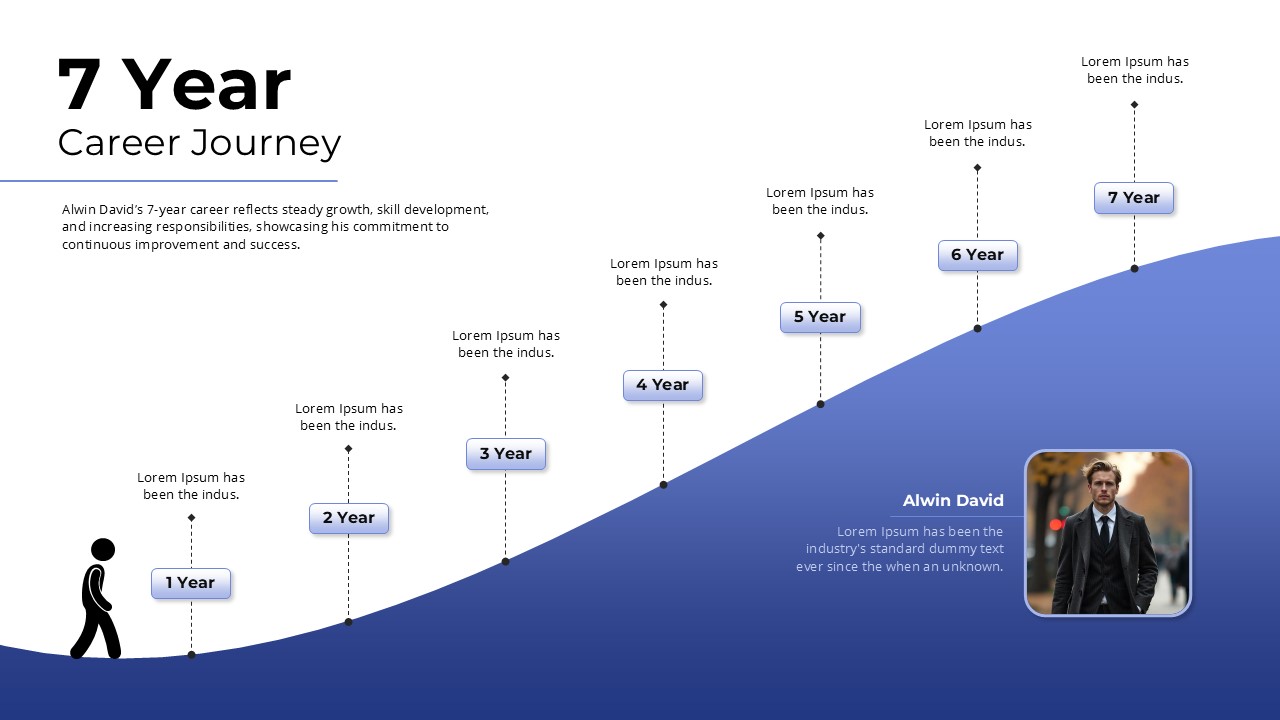
Career Journey Infographic Pack Template for PowerPoint & Google Slides
Timeline
3D Pyramid Column Chart Infographic Template for PowerPoint & Google Slides
Bar/Column