Data-Driven AI in Insurance Infographic Template for PowerPoint & Google Slides


Description
Map the transformative power of AI in insurance with this dynamic circular infographic slide. At its core, a clean white circle highlights “AI in Insurance,” while eight color-coded segments radiate outward to illustrate key applications: real-time underwriting automation, compliance monitoring, personalized policy insights, churn prediction, fraud detection, automated claims processing, customer-service chatbots, and big-data risk assessment. Each segment pairs a distinctive blue or purple icon with a connecting callout box for clear, bite-sized messaging.
Built on fully editable master slides, this template offers one-click adjustments to segment colors, icon styles, and label copy—enabling you to emphasize the AI use cases most relevant to your audience. Lockable guides maintain perfect alignment of ring segments and connectors, while subtle drop shadows create depth without distracting from content. Use the central text placeholder to add a tagline or contextual summary, and adjust segment widths to reflect priority or resource allocation. The minimal white background ensures full contrast and legibility, and the layout scales seamlessly across desktop, tablet, and mobile views.
Optimized for collaborative editing, this slide works flawlessly in both PowerPoint and Google Slides. Swap icons from your own library or leverage the built-in icon set, update color themes to match corporate branding, and duplicate or remove segments to suit any number of AI applications. Whether you’re presenting to C-suite executives, underwriting teams, or technology stakeholders, this infographic slide accelerates your ability to convey complex information with clarity and visual appeal.
Who is it for
Innovation leaders, data scientists, and insurance executives will find this slide ideal for boardroom presentations on digital transformation. Actuaries, process-improvement teams, and technology vendors can also use it to highlight AI capabilities in client proposals.
Other Uses
Repurpose this radial diagram for any circular process or framework: product roadmaps, risk-management workflows, marketing funnels, or technology adoption lifecycles.
Login to download this file

Item ID
SB04921
Related Templates

Data-driven GDP Growth Infographic Pack Template for PowerPoint & Google Slides
Infographics

Data-Driven Marketing Cycle Diagram Template for PowerPoint & Google Slides
Customer Journey
Data-Driven Marketing Lifecycle Diagram Template for PowerPoint & Google Slides
Process
Data-Driven Decision Making overview template for PowerPoint & Google Slides
Business
Data-Driven Sales Strategy Diagram Template for PowerPoint & Google Slides
Marketing
Data-Driven Line Chart Diagram Template for PowerPoint
Comparison Chart
Excel-Driven Gradient Timeline Chart Template for PowerPoint & Google Slides
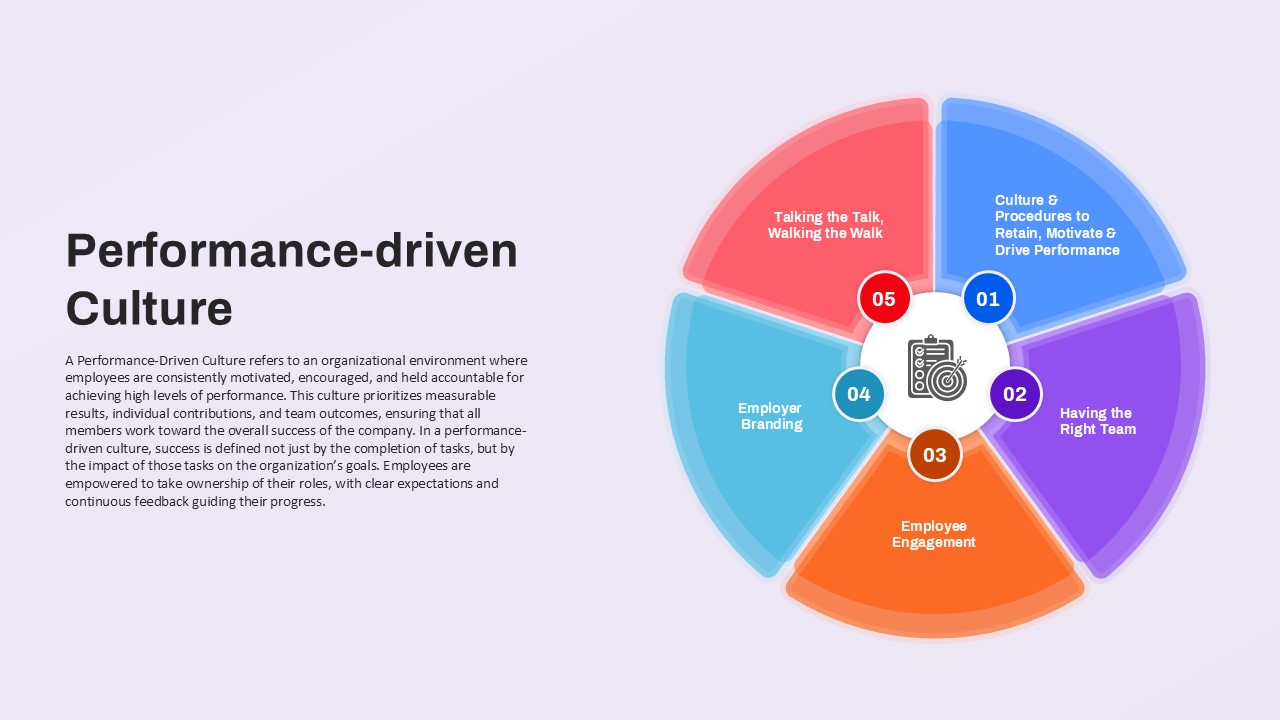
Performance-driven Culture framework template for PowerPoint & Google Slides
Leadership
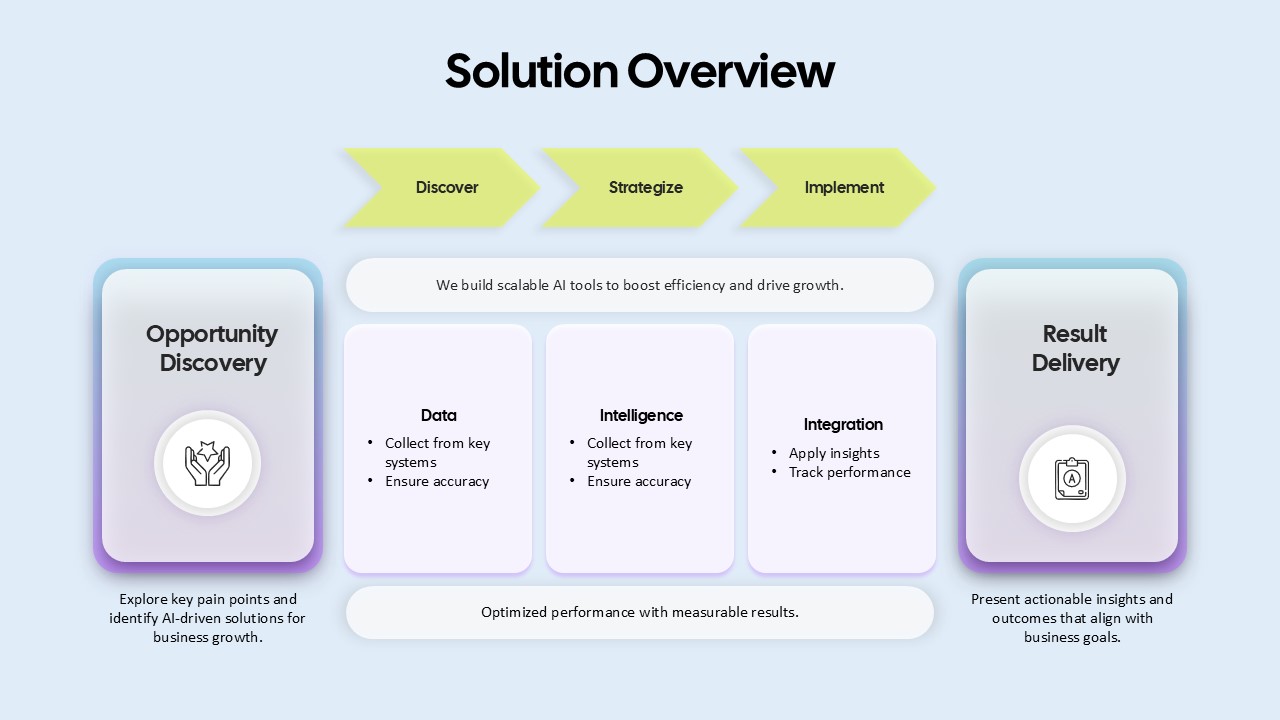
AI-Driven Solution Overview for PowerPoint & Google Slides
AI
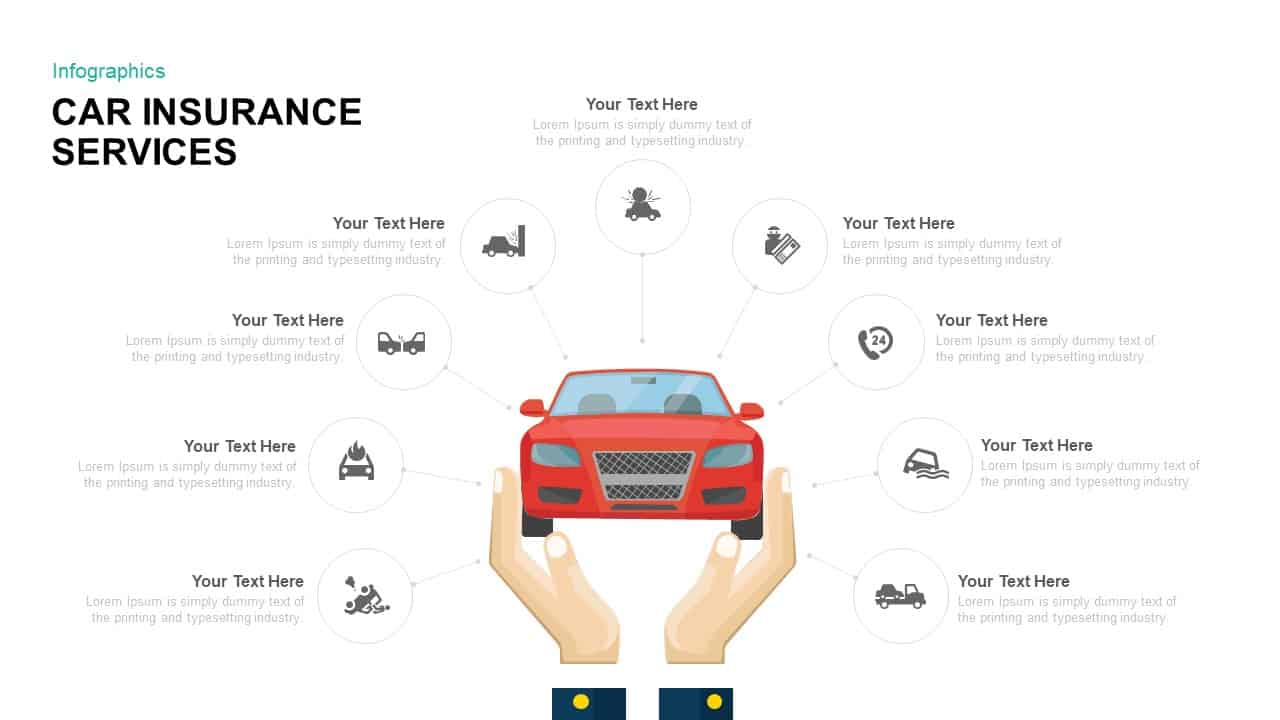
Comprehensive Car Insurance Services Diagram Template for PowerPoint & Google Slides
Business
Health Insurance Presentation Deck Template for PowerPoint & Google Slides
Health
Insurance Corporate Pitch Deck Template for PowerPoint & Google Slides
Pitch Deck

Insurance Presentation for PowerPoint & Google Slides
Business
Insurance Consulting Presentation Deck for PowerPoint & Google Slides
Decks
3D Stacked Infographic Layers Data Template for PowerPoint & Google Slides
Pyramid
Creative Lab Beakers Data Infographic template for PowerPoint & Google Slides
Infographics

Dynamic Data Dashboard Infographic Template for PowerPoint & Google Slides
Bar/Column
Bottle Data Percentage Infographic Template for PowerPoint & Google Slides
Infographics
Leaf Infographic Data Visualization Template for PowerPoint & Google Slides
Infographics
Modern Big Data Infographic Deck Template for PowerPoint & Google Slides
Decks
Editable Africa Map Infographic Data Template for PowerPoint & Google Slides
World Maps
Syria Regional Data Map Infographic Template for PowerPoint & Google Slides
World Maps
Mobile User Data Analysis Infographic for PowerPoint & Google Slides
Process
Data Science PowerPoint Presentation Template for PowerPoint & Google Slides
Pitch Deck
Data Center PowerPoint Template for PowerPoint & Google Slides
Information Technology
Creative data chart analytics template for PowerPoint & Google Slides
Charts
Mobile Data Analysis Chart template for PowerPoint & Google Slides
Charts
World Map Data template for PowerPoint & Google Slides
World Maps
Circle Chart Data template for PowerPoint & Google Slides
Pie/Donut
Creative Data Analysis Bar Chart template for PowerPoint & Google Slides
Bar/Column

Smartphone Data User template for PowerPoint & Google Slides
Charts
Interactive US Population Data Map Slide Template for PowerPoint & Google Slides
World Maps
3D Bar Chart Data Infographics Template for PowerPoint & Google Slides
Bar/Column
Circle Graph Data Visualization Template for PowerPoint & Google Slides
Circular
Pencil Bar Chart Data Analysis Template for PowerPoint & Google Slides
Bar/Column
3D Cone Chart Data Visualization template for PowerPoint & Google Slides
Bar/Column
Data Analytics Dashboard Design template for PowerPoint & Google Slides
Bar/Column
Gear Pie Diagram Data Visualization Template for PowerPoint & Google Slides
Pie/Donut
Tornado Chart Data Comparison Slide Template for PowerPoint & Google Slides
Bar/Column
Immigration Data Dashboard Template for PowerPoint & Google Slides
Bar/Column
Mobile Infographics Data Visualization Template for PowerPoint & Google Slides
Infographics
Data Management and Analytics Diagram Template for PowerPoint & Google Slides
Circular
Data Migration Life Cycle Curved Diagram Template for PowerPoint & Google Slides
Process
Medical Infographics Data Visualization Template for PowerPoint & Google Slides
Health
DIKW Data to Wisdom Pyramid Model Template for PowerPoint & Google Slides
Pyramid
KPI Dashboard Data Visualization Template for PowerPoint & Google Slides
Bar/Column
KPI Dashboard Data Overview Slide Template for PowerPoint & Google Slides
Bar/Column
North America Data Map Callouts Template for PowerPoint & Google Slides
World Maps
Professional Heatmap Data Visualization Template for PowerPoint & Google Slides
Infographics
Donut Chart Data Breakdown template for PowerPoint & Google Slides
Pie/Donut
Waffle Chart Data Visualization Template for PowerPoint & Google Slides
Comparison Chart
Layered Data Governance Maturity Model Template for PowerPoint & Google Slides
Process
Free Stacked Column Chart Data Visualization Template for PowerPoint & Google Slides
Bar/Column
Free
Simple Bar Chart Data Visualization Template for PowerPoint & Google Slides
Bar/Column
XY Bubble Chart Data Visualization Template for PowerPoint & Google Slides
Comparison Chart
Simple Area Chart Data Trends Analysis Template for PowerPoint & Google Slides
Comparison Chart
Data Over Time Line Chart template for PowerPoint & Google Slides
Charts
Waterfall Chart Data Visualization Template for PowerPoint & Google Slides
Comparison Chart
Multipurpose Spline Chart Data Trend Template for PowerPoint & Google Slides
Bar/Column
UK Counties Map Data Visualization Template for PowerPoint & Google Slides
World Maps
Advanced Data Flow Diagram Pack Template for PowerPoint & Google Slides
Flow Charts
Interactive Jump Line Data Chart Template for PowerPoint & Google Slides
Comparison Chart
Segmented Scatter Chart Data Visualization Template for PowerPoint & Google Slides
Business Strategy
Free Big Data Network Visualization Template for PowerPoint & Google Slides
Circular
Free
Data Analysis Bar Chart with Insights Template for PowerPoint & Google Slides
Bar/Column
Free
Data Lake Hub-and-Spoke Diagram Template for PowerPoint & Google Slides
Cloud Computing
ETL Data Pipeline Workflow Diagram Template for PowerPoint & Google Slides
Process
Data Privacy template for PowerPoint & Google Slides
Information Technology
Data Protection Strategies template for PowerPoint & Google Slides
Information Technology
Comprehensive Data & AI Capability Model Template for PowerPoint & Google Slides
AI
Data Flywheel Strategy template for PowerPoint & Google Slides
Business
Data Privacy and Compliance in ML template for PowerPoint & Google Slides
Technology
AI and Data Ecosystem Map Template for PowerPoint & Google Slides
AI
Data Studio Insights template for PowerPoint & Google Slides
Business Report
Data Protection & Encryption in the Cloud Overview template for PowerPoint & Google Slides
Cloud Computing
Customer Data Platform Workflow Diagram Template for PowerPoint & Google Slides
Information Technology
First Party Data Overview Template for PowerPoint & Google Slides
Business
Data Governance Roles Pyramid Diagram Template for PowerPoint & Google Slides
Pyramid
Business Data Table Template for PowerPoint & Google Slides
Table
Colorful Business Data Comparison Table Template for PowerPoint & Google Slides
Table
Six Column Data Table Template for PowerPoint & Google Slides
Table
Data Gap Analysis Template for PowerPoint & Google Slides
Business
Bar Data Chart Slide for PowerPoint & Google Slides
Bar/Column
Weekly Data Chart Slide for PowerPoint & Google Slides
Comparison Chart

3D Column Chart with Data Table for PowerPoint & Google Slides
Bar/Column

Cone Data Chart for PowerPoint & Google Slides
Charts
4 Business Data Infographics Diagram for PowerPoint & Google Slides
Process
Clustered Column Chart Data Analysis Template for PowerPoint
Bar/Column
Free Data Analytics Dashboard Template for PowerPoint
Charts
Free
Google Ads Optimization & Performance Infographic Template for PowerPoint & Google Slides
Digital Marketing
SQ3R Study Strategy Infographic Slides Template for PowerPoint & Google Slides
Business Strategy
Six Double Diamond Infographic Slides Template for PowerPoint & Google Slides
Process
Sales Process Infographic Slides Pack Template for PowerPoint & Google Slides
Process
Casino/Poker Chips Infographic Slides template for PowerPoint & Google Slides
Business Strategy
Agenda Infographic Pack of 2 Slides Template for PowerPoint & Google Slides
Agenda
Quad Chart Infographic Pack of 8 Slides Template for PowerPoint & Google Slides
Comparison Chart
Four Options Infographic Slides Template for PowerPoint & Google Slides
Comparison
Game Plan Infographic Slides Pack Template for PowerPoint & Google Slides
Infographics
Teamwork PowerPoint Infographic Template for PowerPoint & Google Slides
Leadership
Kite Infographic PowerPoint Template for PowerPoint & Google Slides
Process