3D Four Arrow Infographics Diagram Template for PowerPoint & Google Slides
Description
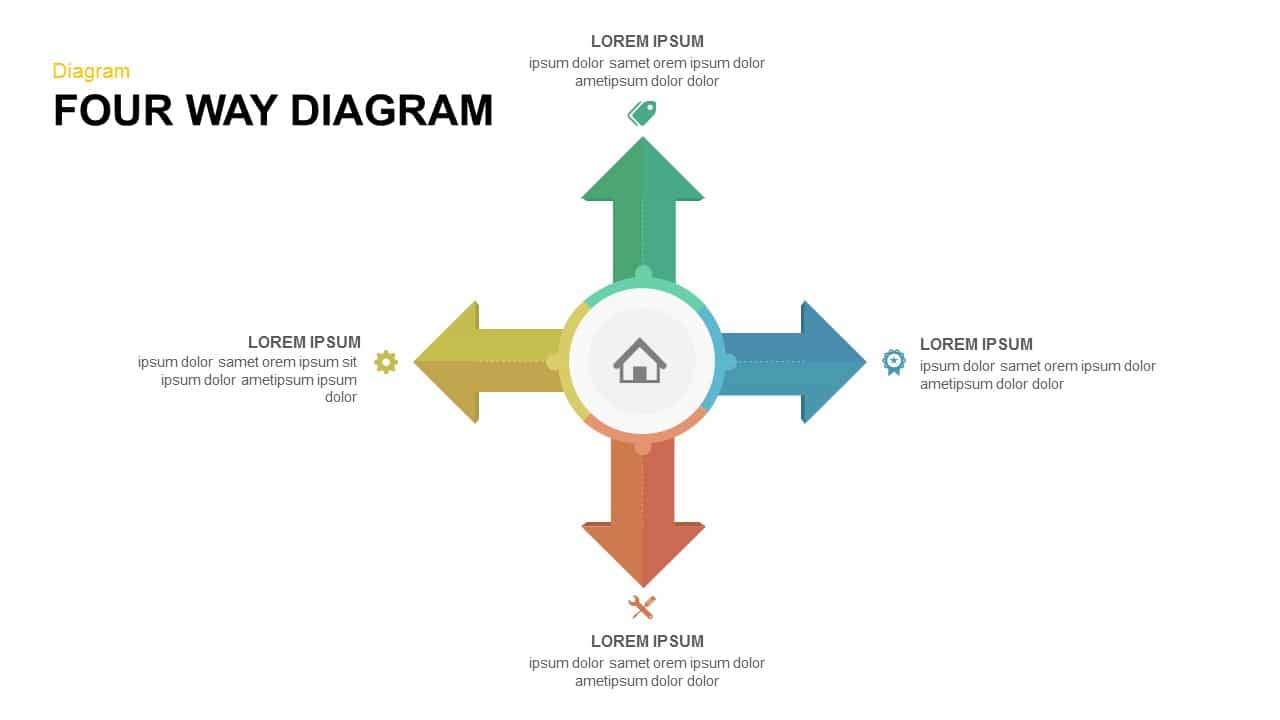
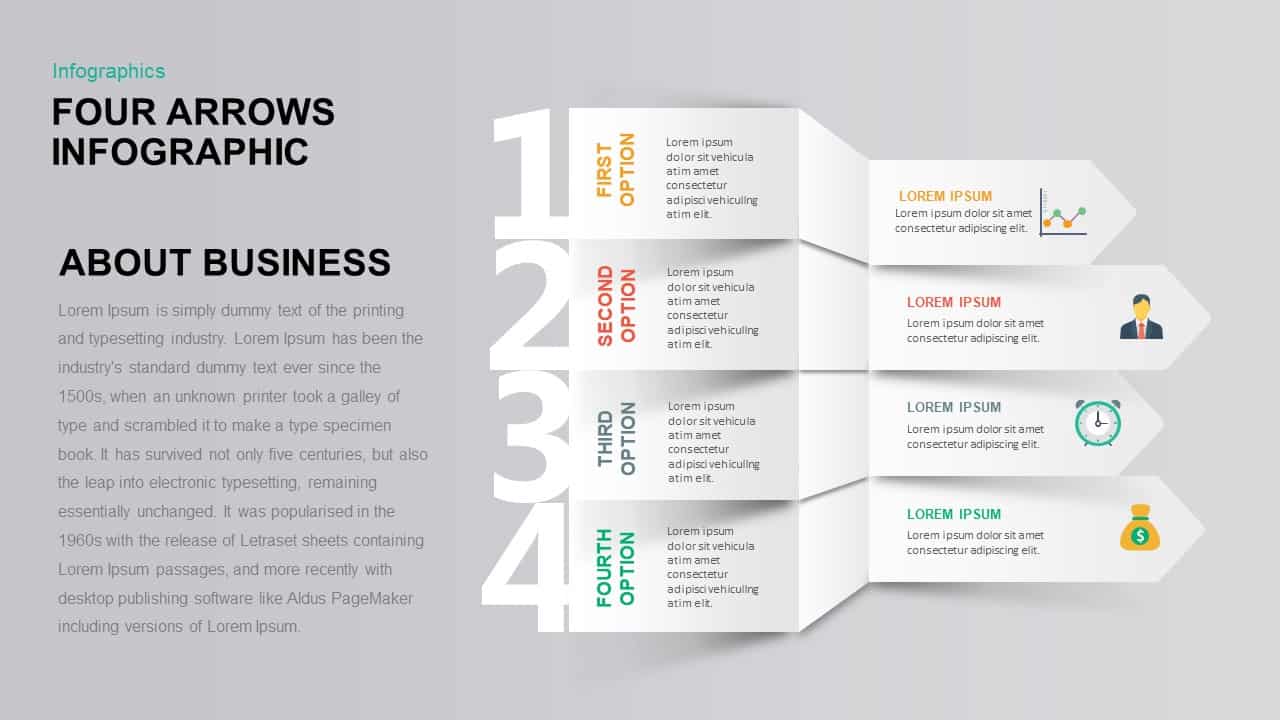
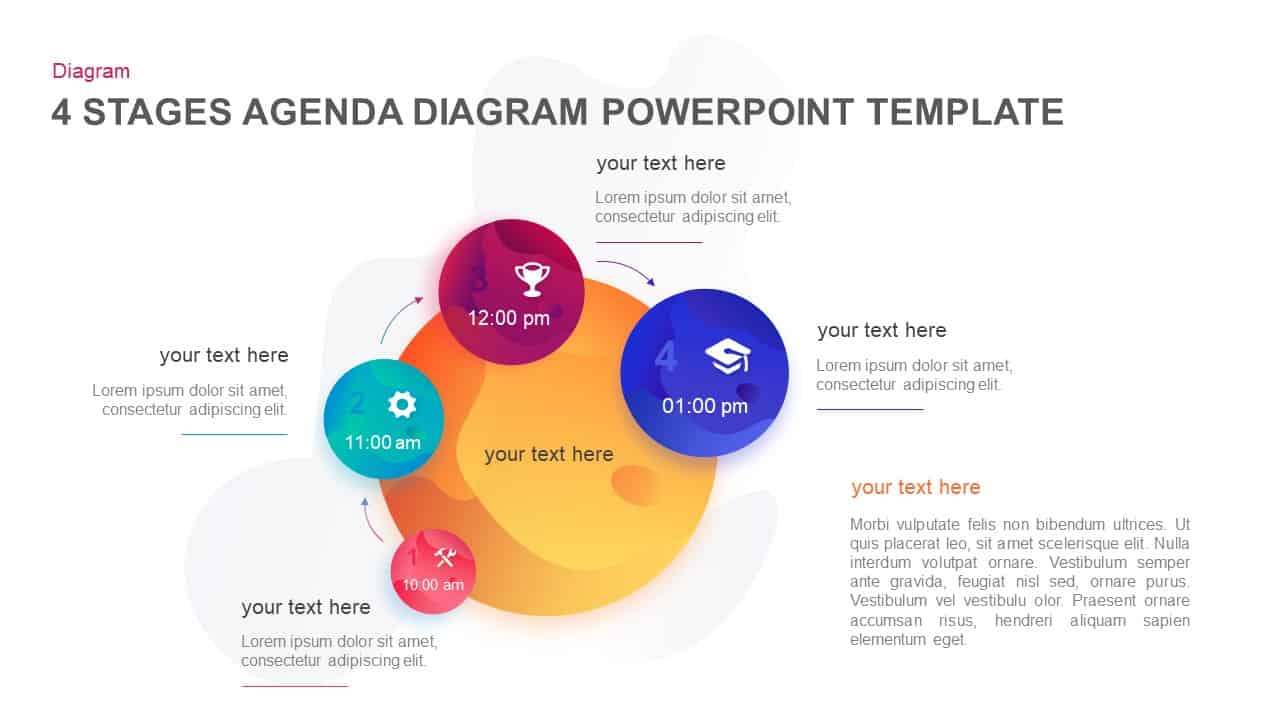
Leverage this dynamic 3D four-arrow infographic slide to present multi-faceted processes, strategic frameworks, or product comparisons with professional flair. At the center, four volumetric arrow segments converge to form a unified diagram, each rendered in distinct accent hues—blue, yellow, red, and green—with beveled edges and strategic shading to reinforce the three-dimensional effect. Each arrow features an icon placeholder at its head—such as handshake, pencil, folder, and award symbols—linked via subtle dotted lines to adjacent text blocks that support concise headlines and detailed descriptions. The dark canvas enhances contrast, ensuring each arrow stands out, while the clean sans-serif typography maintains readability and aligns with corporate branding guidelines.
Built on fully editable master slides, this template empowers users to customize every element in seconds. Swap out color palettes to match company themes, replace icons with your own symbols, or adjust segment angles to suit alternative layouts. Use alignment guides to add or remove arrow segments, extend the radial spine, or adapt the slide for additional data points. The slide supports both 16:9 and 4:3 aspect ratios, preserving layout integrity across screens, projectors, and printouts. For interactive presentations, apply entrance animations to each arrow and icon, guiding audience attention sequentially through complex information flows. Whether you are outlining project milestones, illustrating decision pathways, or comparing product features, this 3D four-arrow infographic slide offers unmatched flexibility and visual impact. Master slide controls ensure consistent styling across your deck, streamlining theme updates and accelerating slide creation. Discover more versatile arrow templates to simplify multi-step presentations and process visualization.
The centralized design also supports data labels, percentage callouts, or numeric indicators for quantifiable results at a glance. Easily integrate your metrics by inserting text boxes or icons within each arrow segment, enabling presenters to display KPIs, performance benchmarks, or risk assessments directly on the infographic.
Who is it for
Project managers, process engineers, and consultants will leverage this slide to map workflows, illustrate decision branches, or compare product features with clarity and impact. Marketing teams and strategists can adapt it to showcase campaign phases or customer journeys.
Other Uses
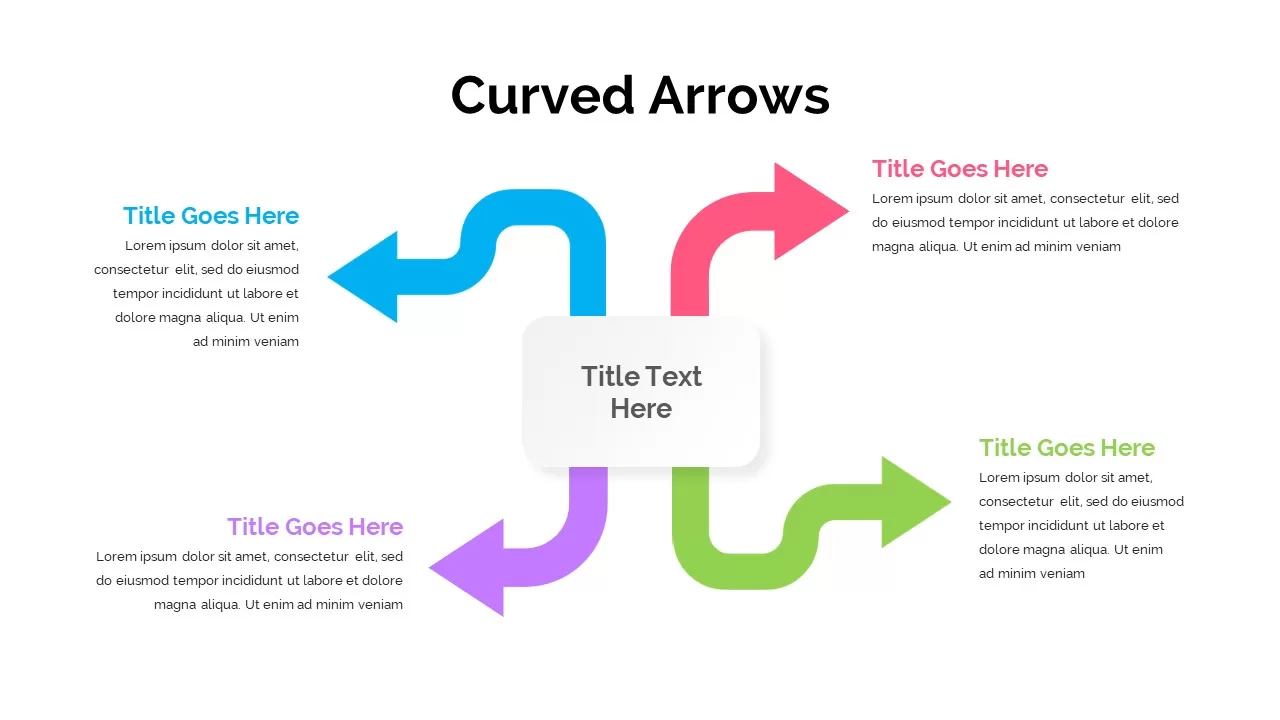
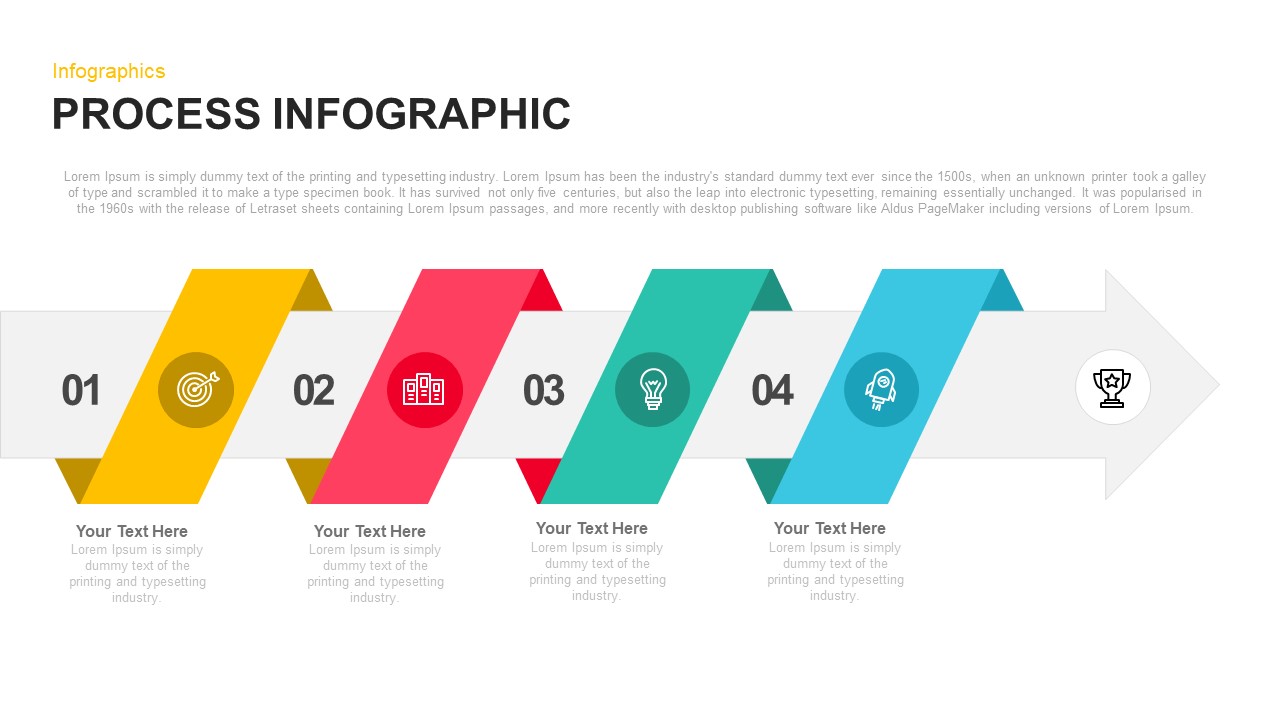
Repurpose this infographic for product roadmaps, training modules, or strategic frameworks. Combine it with the four-step arrow process infographic template for a clear multi-directional workflow view, or use the arrow timeline infographic to depict sequential milestones over time. Replace arrow icons with metrics or timeline markers to visualize KPIs, milestone achievements, or resource allocation cycles across any project.
Login to download this file

Item ID
SB00106
Related Templates

Four Arrow Square Infographics Template for PowerPoint & Google Slides
Arrow
Four Swoosh Arrow Infographics template for PowerPoint & Google Slides
Arrow
3D Four-Directional Arrow Infographics Template for PowerPoint & Google Slides
Arrow

Four Directional Arrow Diagram Template for PowerPoint & Google Slides
Arrow
Four-Way Directional Arrow Diagram Template for PowerPoint & Google Slides
Arrow
Four-Section Arrow Infographic Diagram Template for PowerPoint & Google Slides
Arrow
Four-Point Arrow Cycle Diagram Template for PowerPoint & Google Slides
Arrow

Four-Staged Business Arrow Diagram Template for PowerPoint & Google Slides
Process
Four-Arrow Curved Hub-and-Spoke Diagram Template for PowerPoint & Google Slides
Arrow
Hand-Drawn Four-Step Curved Arrow Diagram Template for PowerPoint & Google Slides
Arrow
Four-Step Curved Arrow Diagram Template for PowerPoint & Google Slides
Arrow
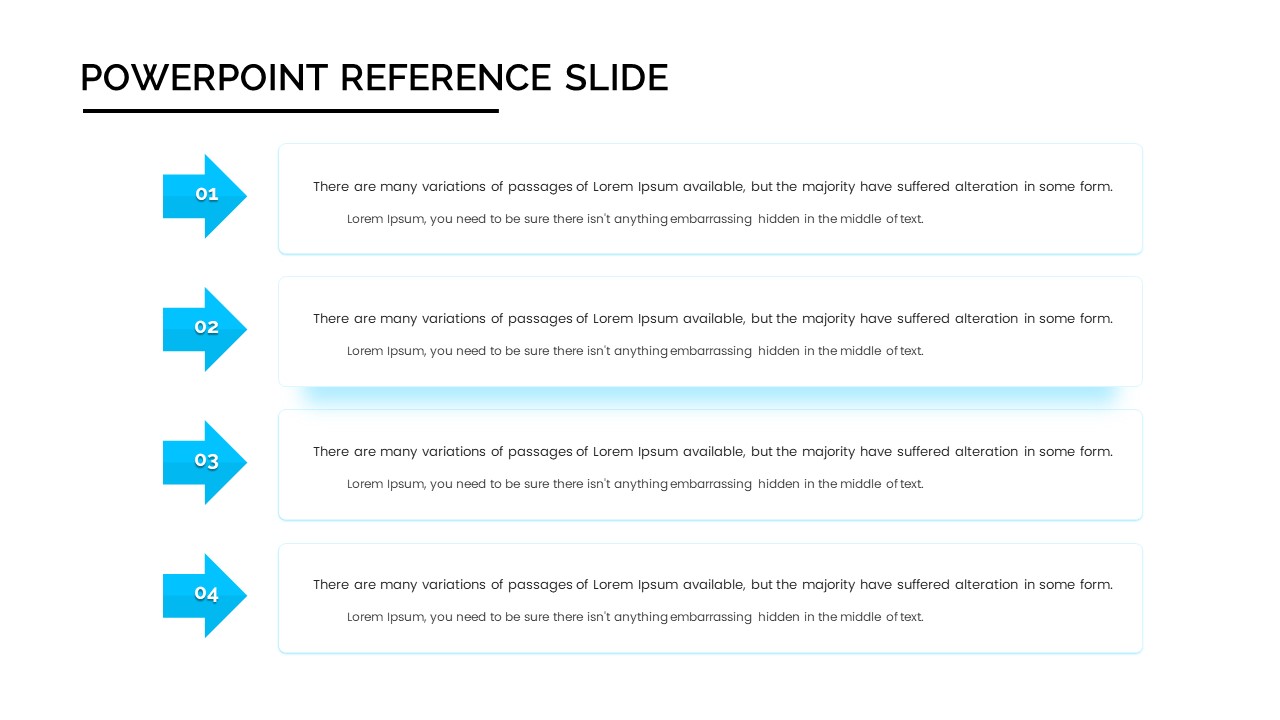
Four-Step Arrow Reference Diagram Slide Template for PowerPoint & Google Slides
Arrow
Four-Step Arrow Process Infographic Template for PowerPoint & Google Slides
Arrow
Four-Option 4-Step Arrow Infographic Template for PowerPoint & Google Slides
Arrow
Four-Step Curved Arrow Process Template for PowerPoint & Google Slides
Process
Four-Segment Circular Arrow Cycle Template for PowerPoint & Google Slides
Circular
Four-Stage Circle Arrow Infographic Template for PowerPoint & Google Slides
Circular
Four-Stage Circle Arrow Infographic Template for PowerPoint & Google Slides
Circular
Four Section Diagram Infographics template for PowerPoint & Google Slides
Process
Four Step Infographics Diagram for PowerPoint & Google Slides
Process
Five Arrow Infographics Diagram Template for PowerPoint & Google Slides
Arrow
Timeline Arrow Infographics Diagram Template for PowerPoint & Google Slides
Timeline
Four Segment Infographics Element Template for PowerPoint & Google Slides
Comparison
Four-Section Ribbon Infographics Template for PowerPoint & Google Slides
Process

Four-Step Circular Process Infographics Template for PowerPoint & Google Slides
Circular
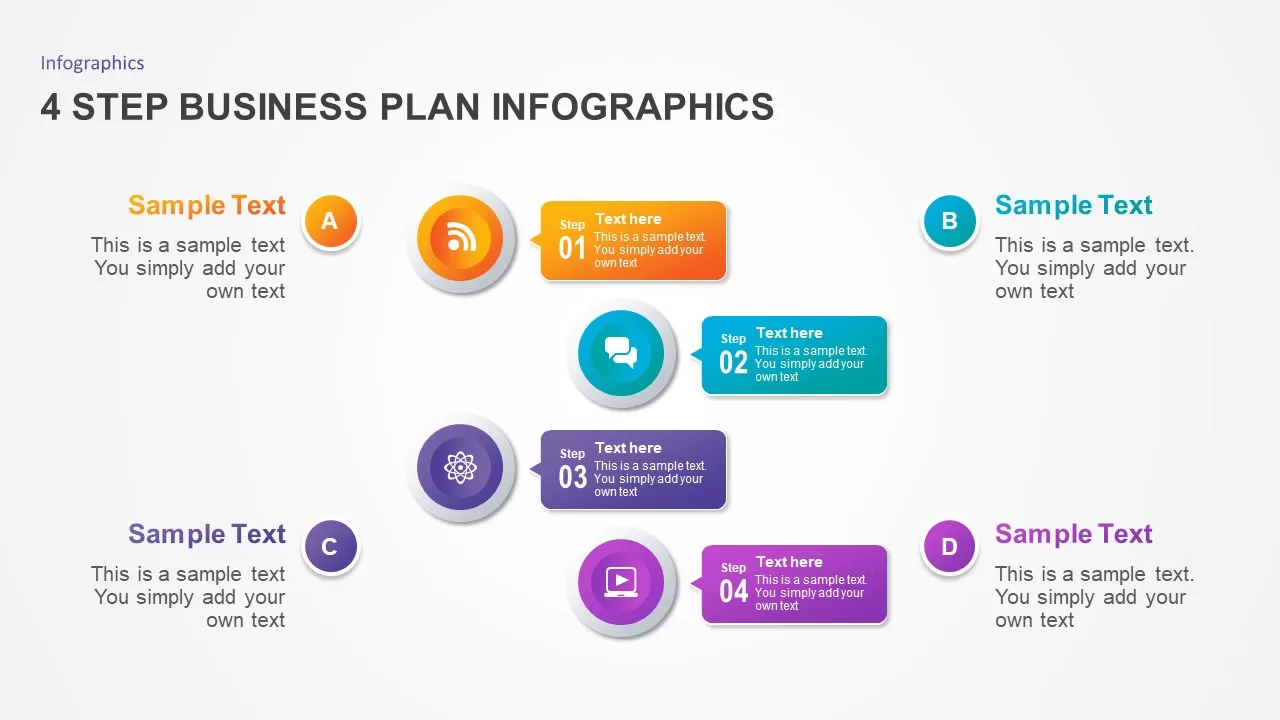
Four-Step Business Plan Infographics Template for PowerPoint & Google Slides
Business Plan
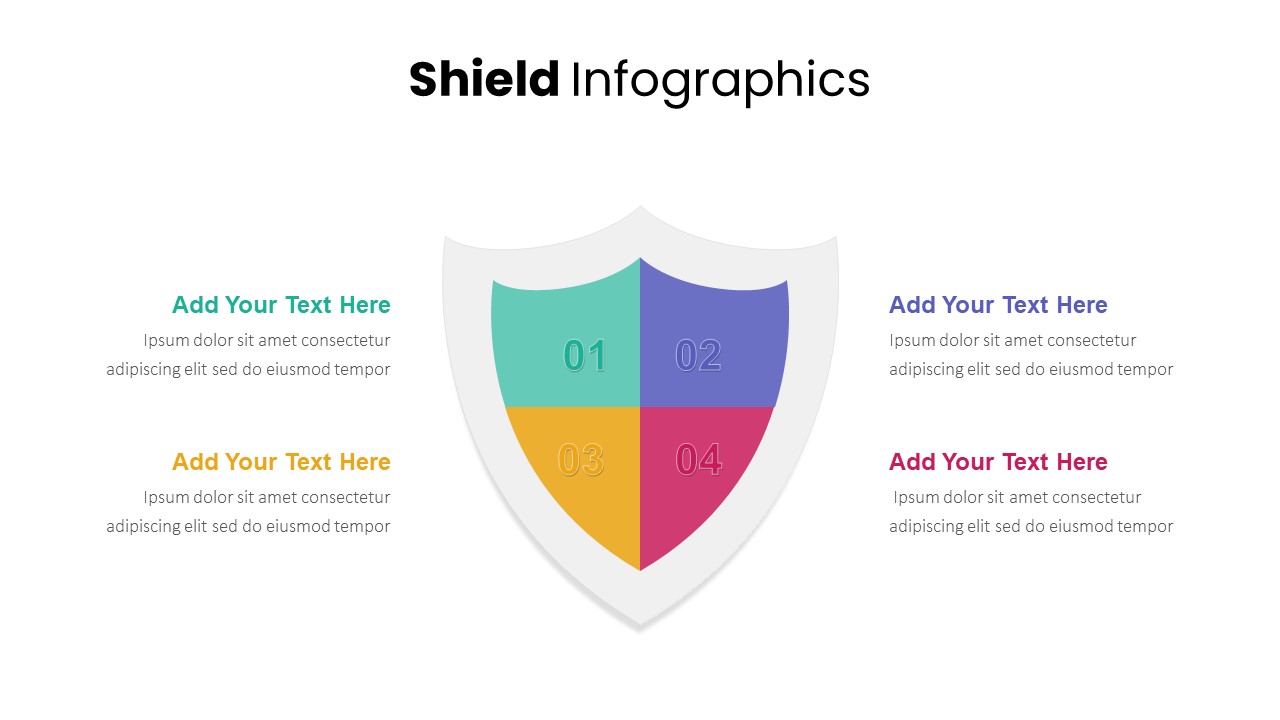
Shield Infographics Four-Part Framework Template for PowerPoint & Google Slides
Process
Arrow Infographics template for PowerPoint & Google Slides
Infographics
3D Arrow Infographics Circular Flow Template for PowerPoint & Google Slides
Arrow
5-Stage Arrow Infographics Process Flow Template for PowerPoint & Google Slides
Arrow

Arrow Step Infographics Workflow Template for PowerPoint & Google Slides
Arrow
Eight-Segment 3D Arrow Infographics Template for PowerPoint & Google Slides
Arrow
Five-Stage Arrow Infographics Timeline Template for PowerPoint & Google Slides
Arrow
Six-Stage Time Arrow Infographics Template for PowerPoint & Google Slides
Arrow
3D Arrow Infographics template for PowerPoint & Google Slides
Arrow
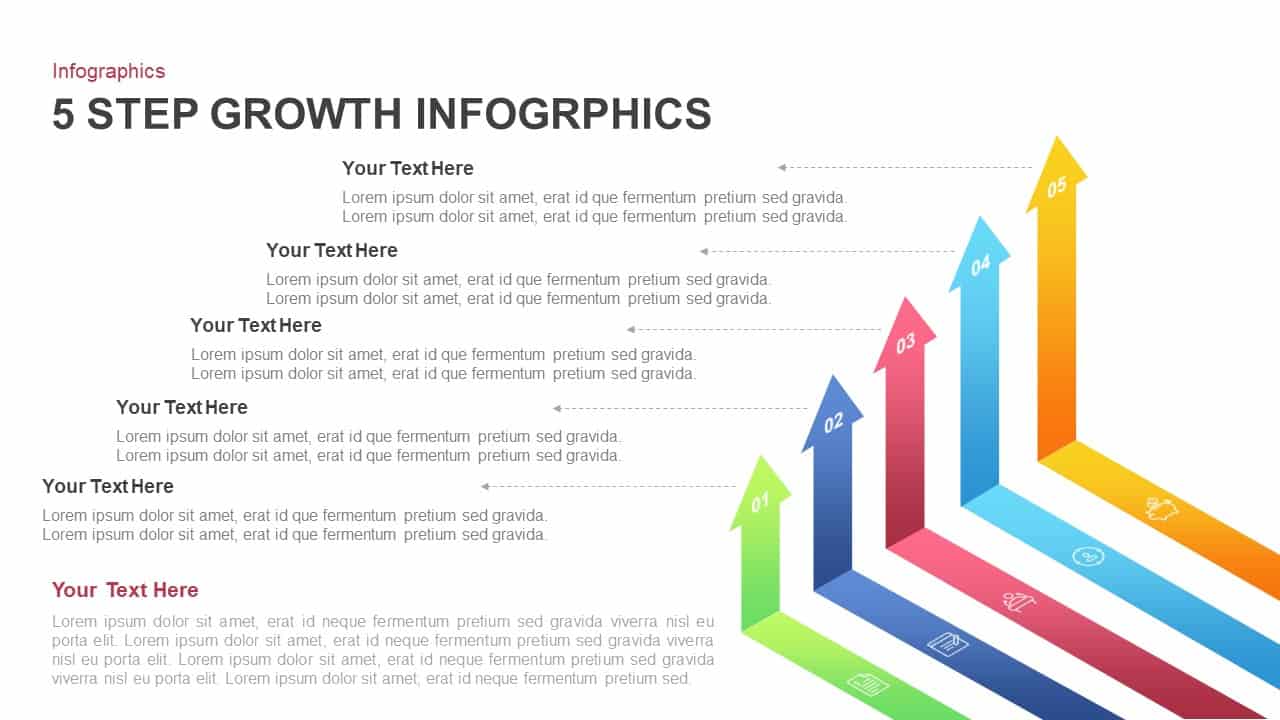
5-Step Growth Arrow Infographics Template for PowerPoint & Google Slides
Arrow
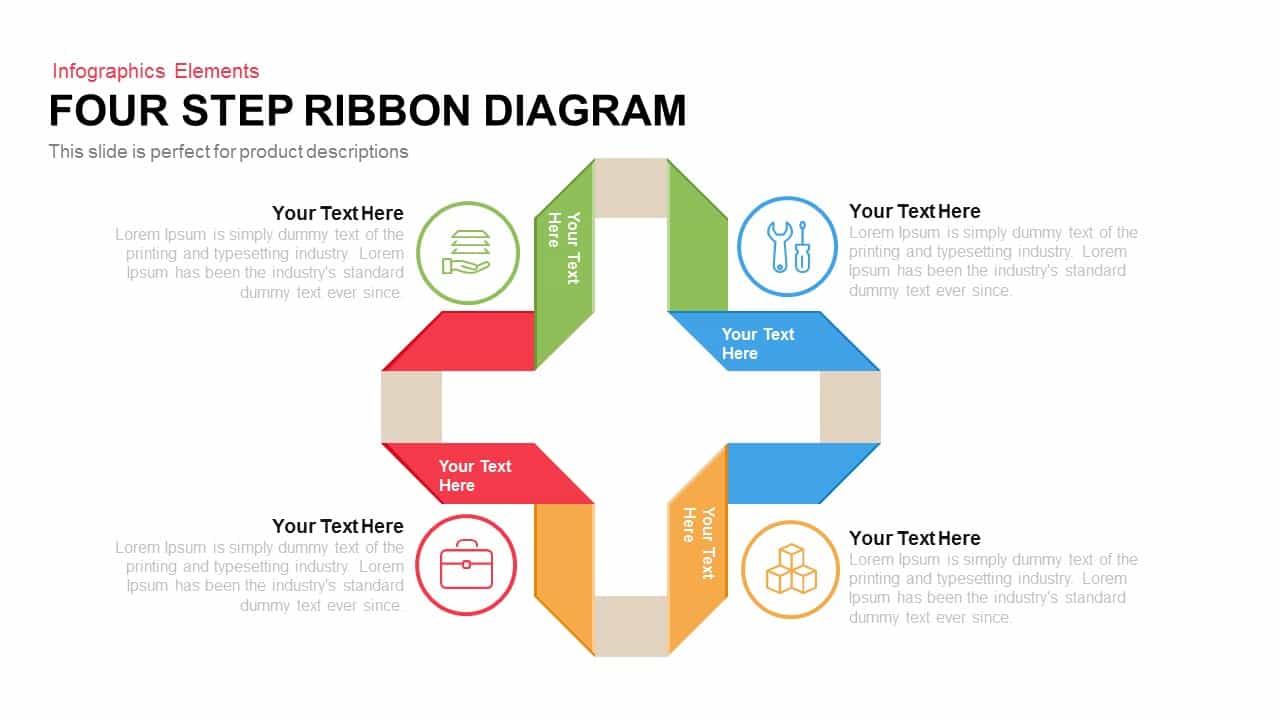
Four Step Ribbon Diagram Template for PowerPoint & Google Slides
Infographics
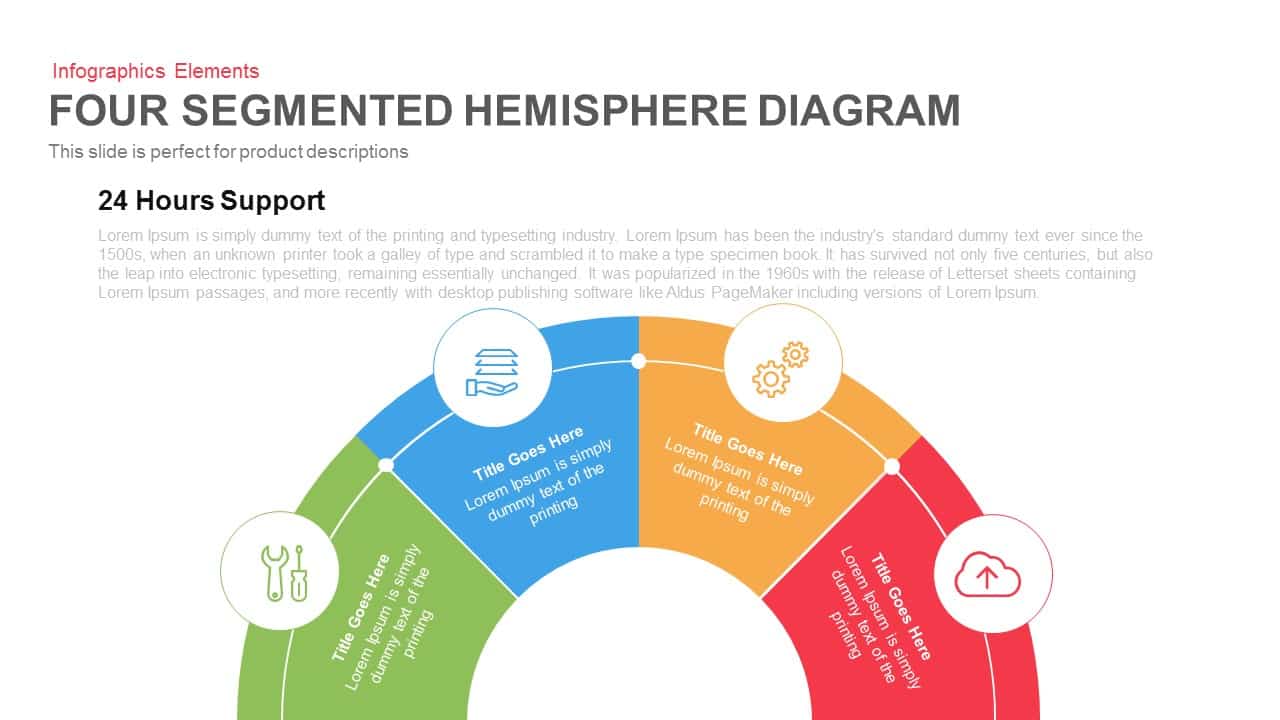
Four Segmented Hemisphere Diagram Template for PowerPoint & Google Slides
Process
Diamond Mind Map Diagram Four Branches Template for PowerPoint & Google Slides
Mind Maps
Four Section Comparison Chart Diagram Template for PowerPoint & Google Slides
Infographics
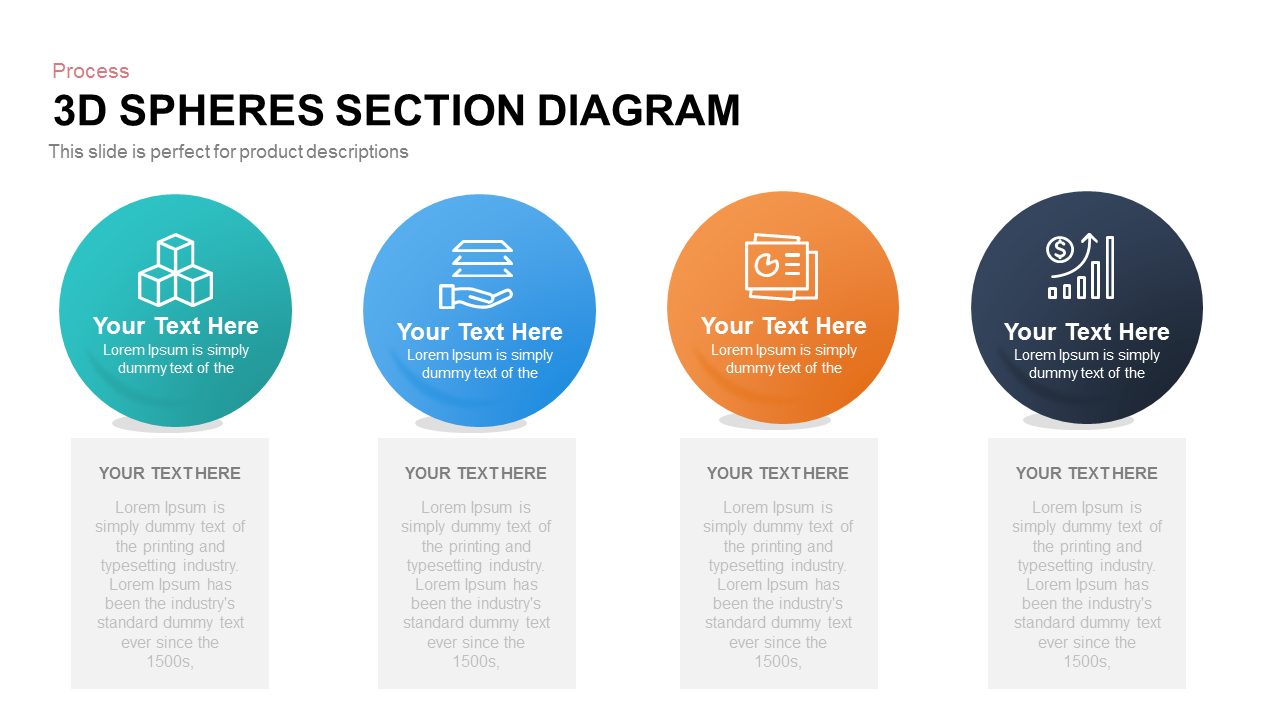
Four-Part 3D Spheres Section Diagram template for PowerPoint & Google Slides
Process
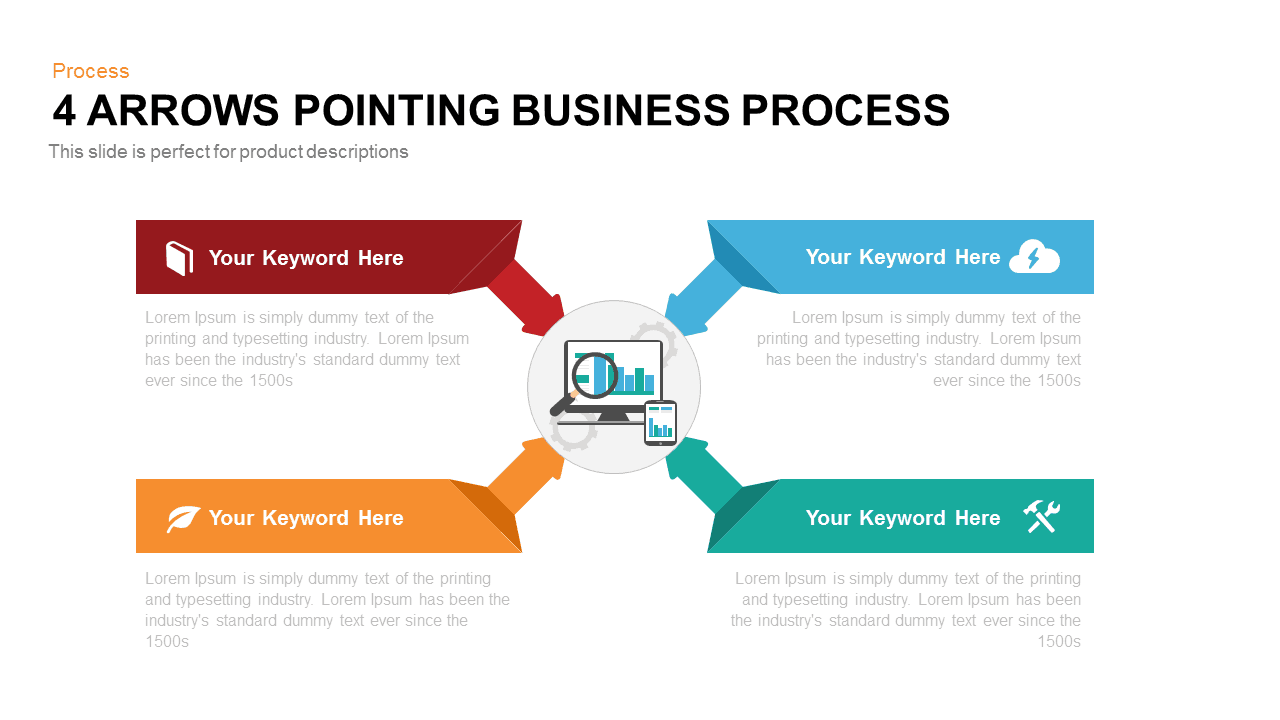
Four Arrows Business Process Diagram template for PowerPoint & Google Slides
Process
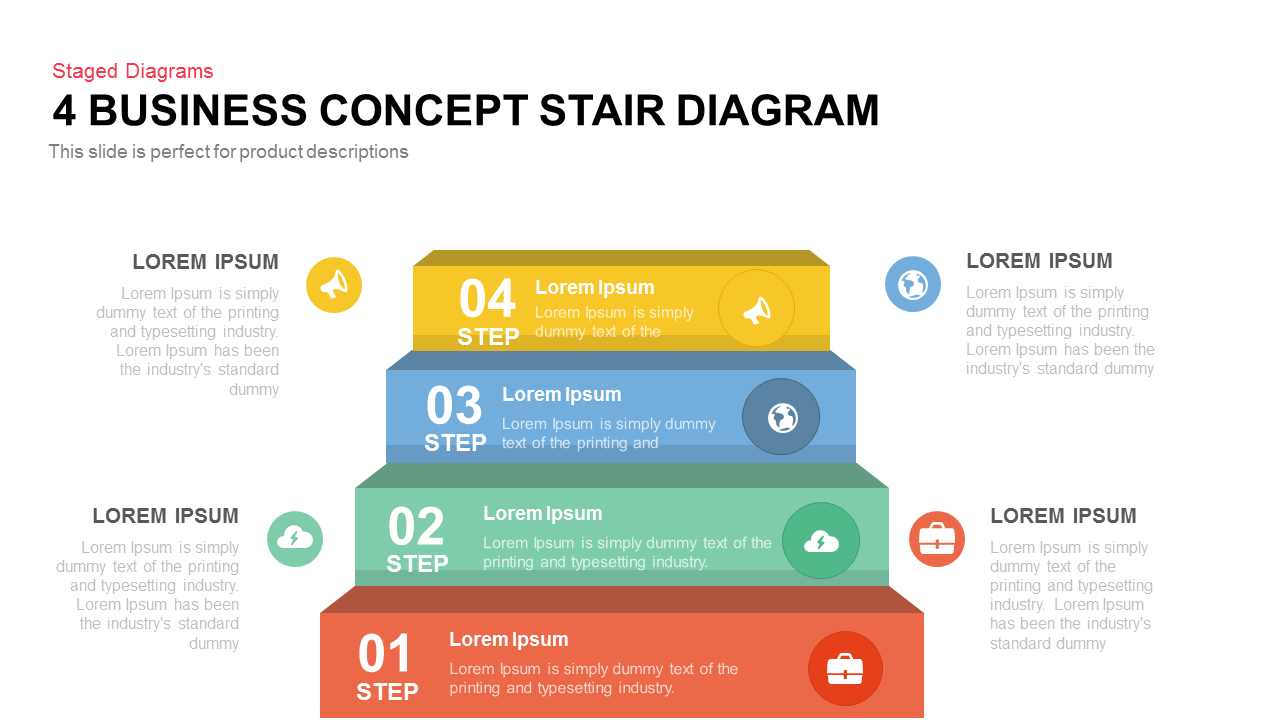
Four-Step Business Staircase Diagram template for PowerPoint & Google Slides
Process

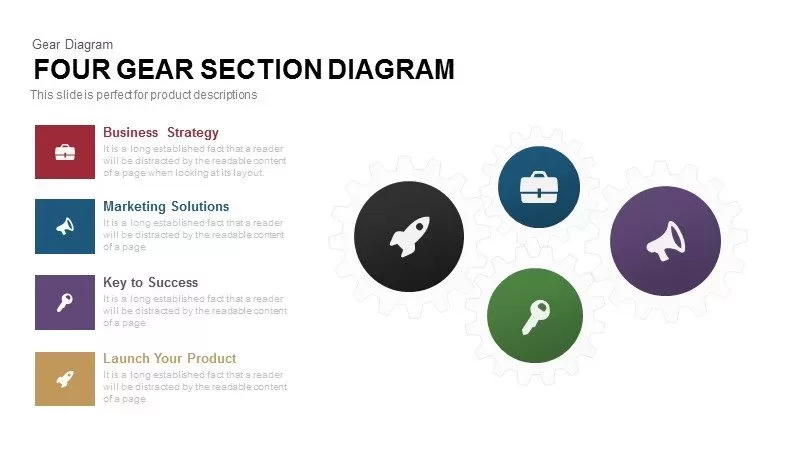
Four Gear Section Diagram Template for PowerPoint & Google Slides
Circular
Four-Circle Venn Process Diagram template for PowerPoint & Google Slides
Process
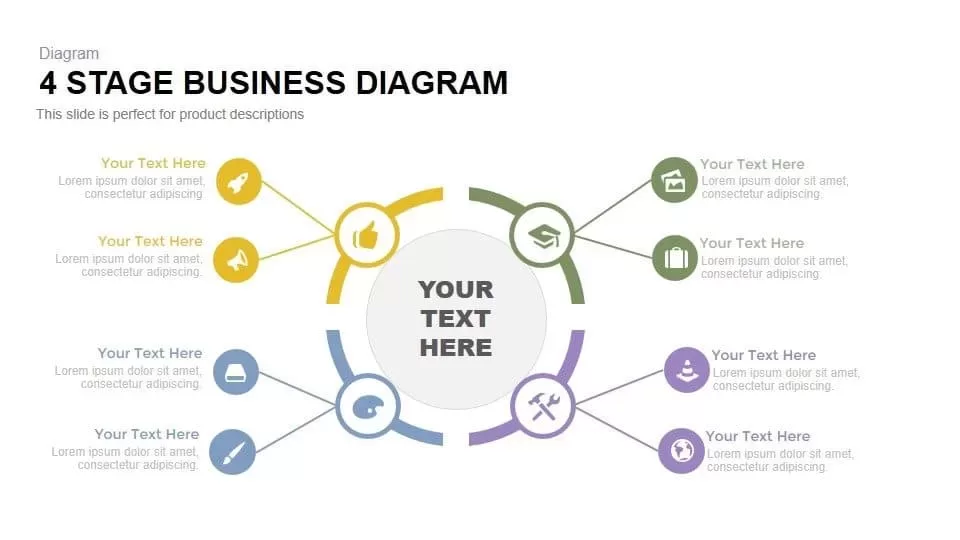
Four-Stage Business Circular Diagram Template for PowerPoint & Google Slides
Process
Pie Segment Diagram Four-Step Process Template for PowerPoint & Google Slides
Pie/Donut
Professional Four-Stage Funnel Diagram Template for PowerPoint & Google Slides
Funnel
Four-Stage Linear Infographic Diagram Template for PowerPoint & Google Slides
Process
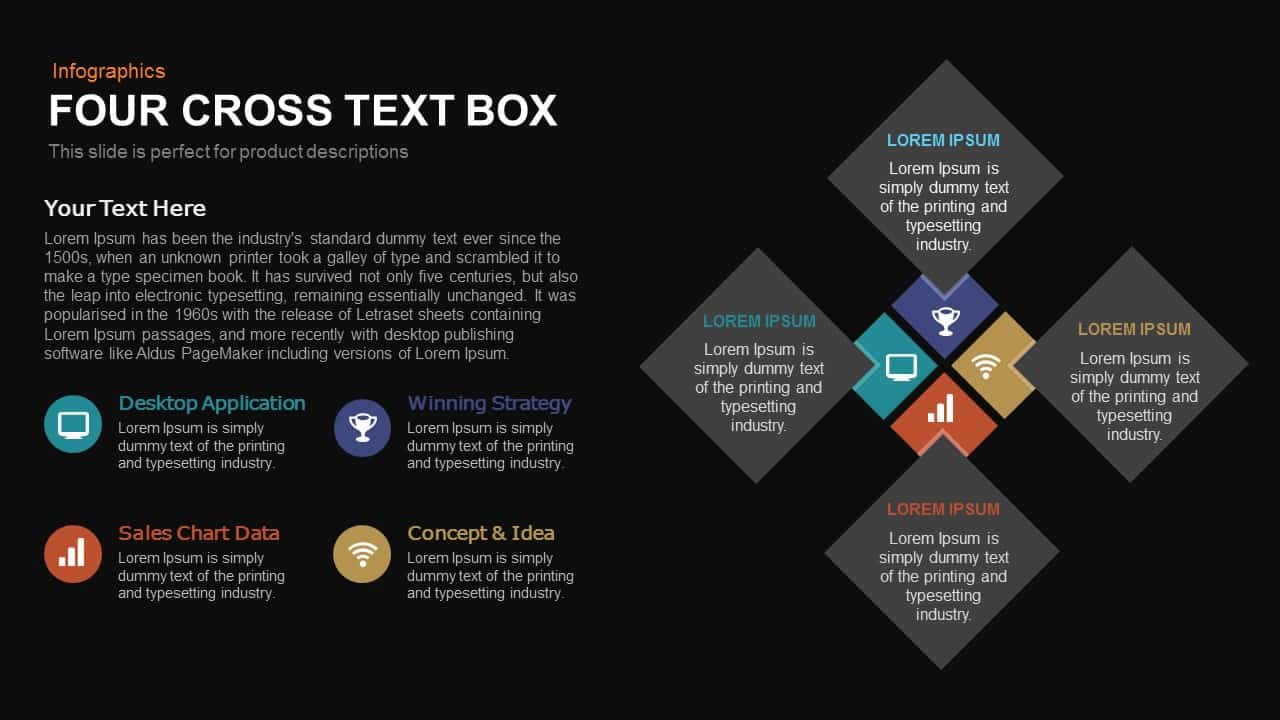
Four-Cross Text Box Diagram Template for PowerPoint & Google Slides
Comparison
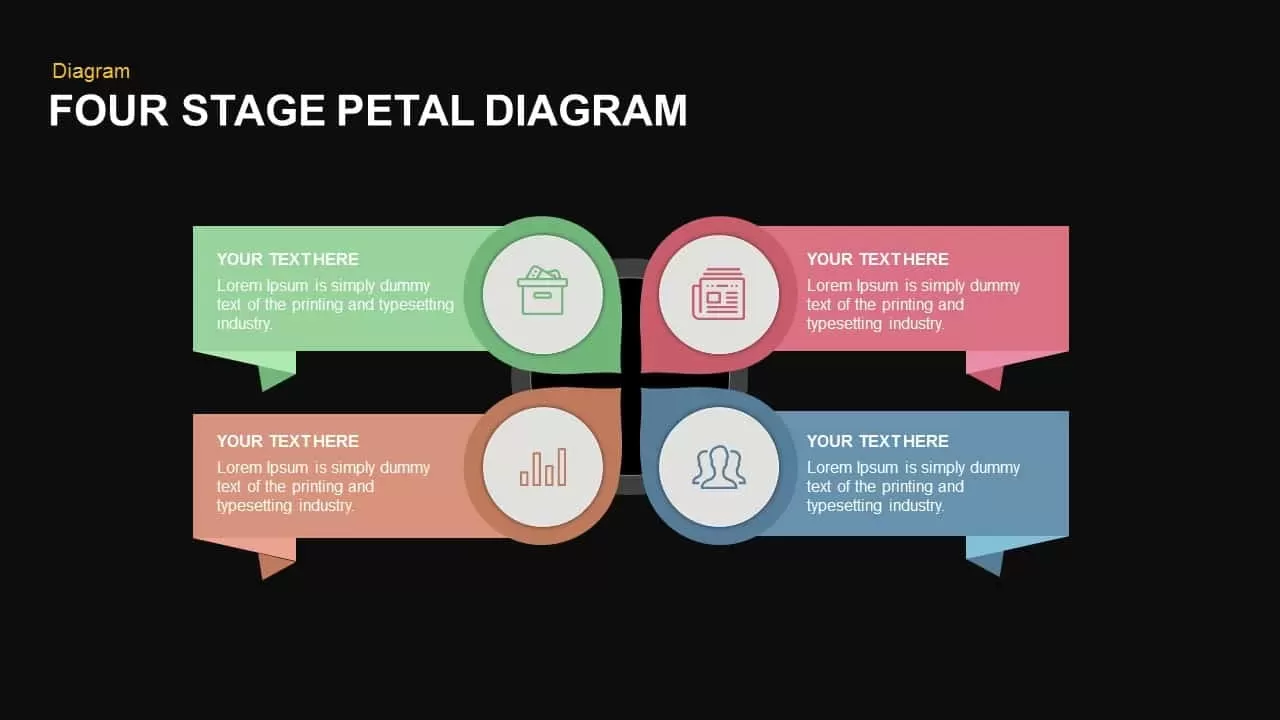
Modern Four-Stage Petal Diagram Template for PowerPoint & Google Slides
Circular
Four and Five-Stage Funnel Diagram Template for PowerPoint & Google Slides
Funnel
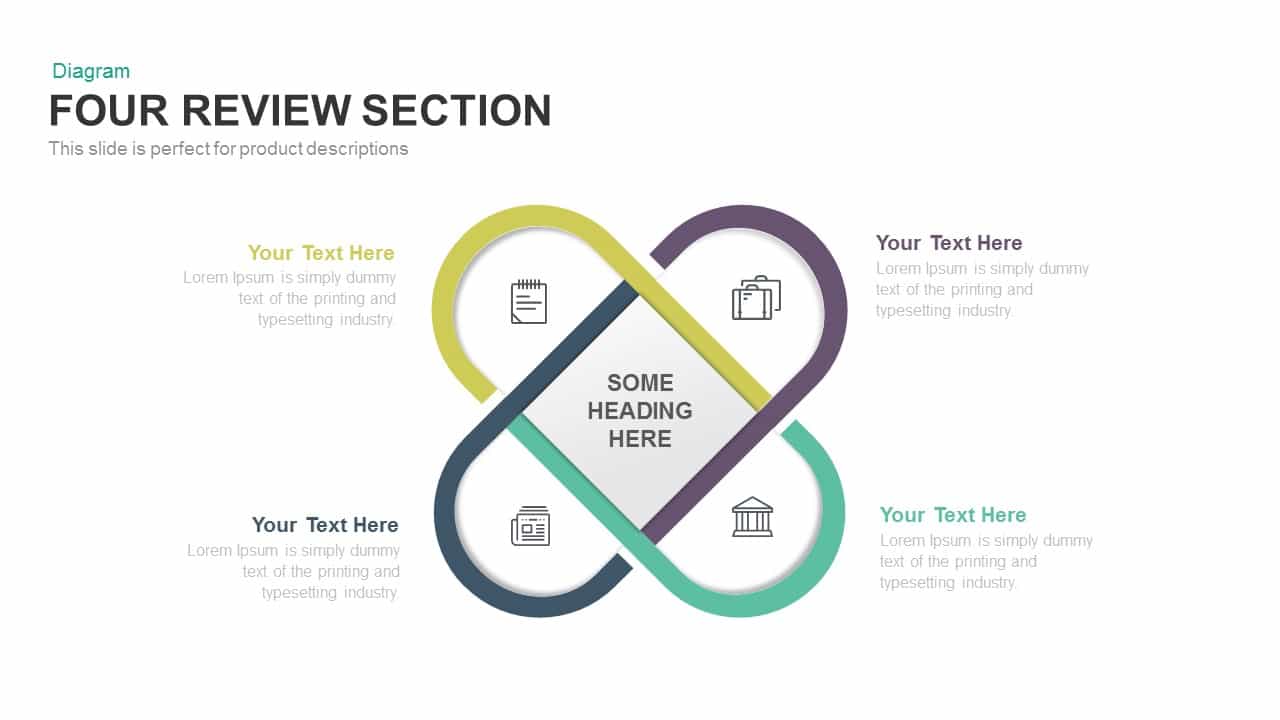
Clean Four-Section Review Diagram Template for PowerPoint & Google Slides
Agenda
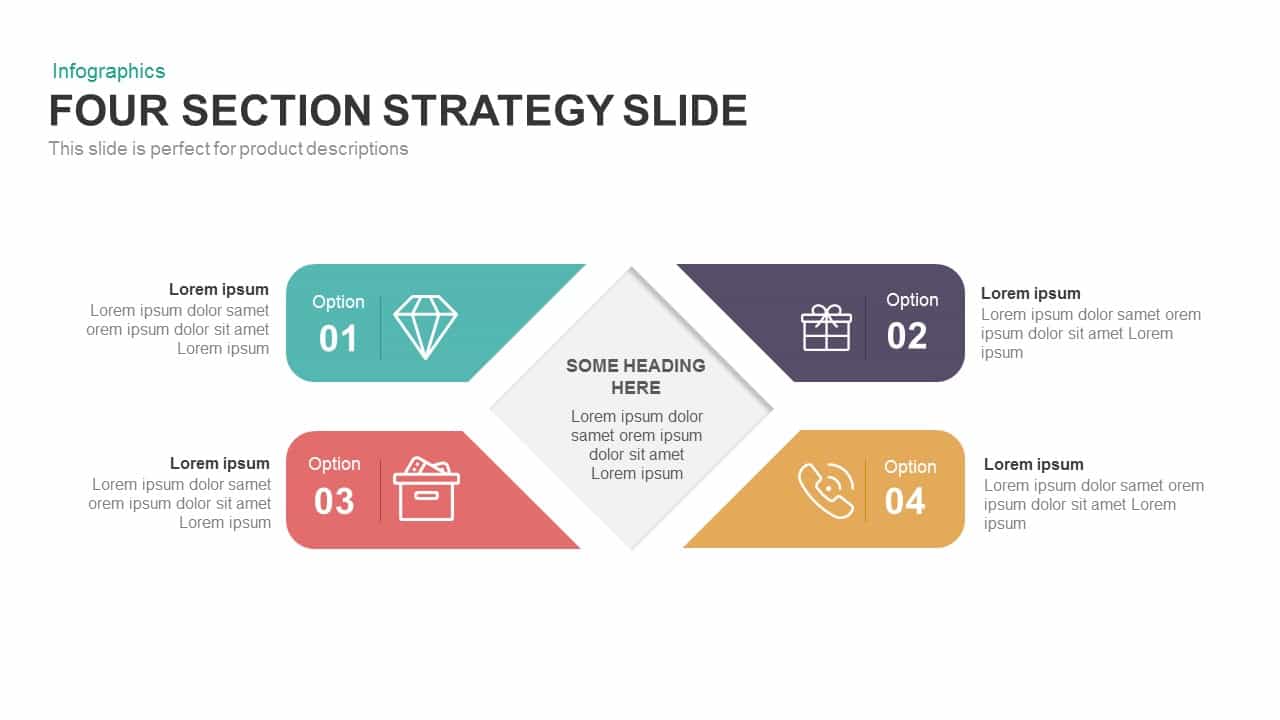
Four-Section Strategy Diagram Slide Template for PowerPoint & Google Slides
Business Strategy
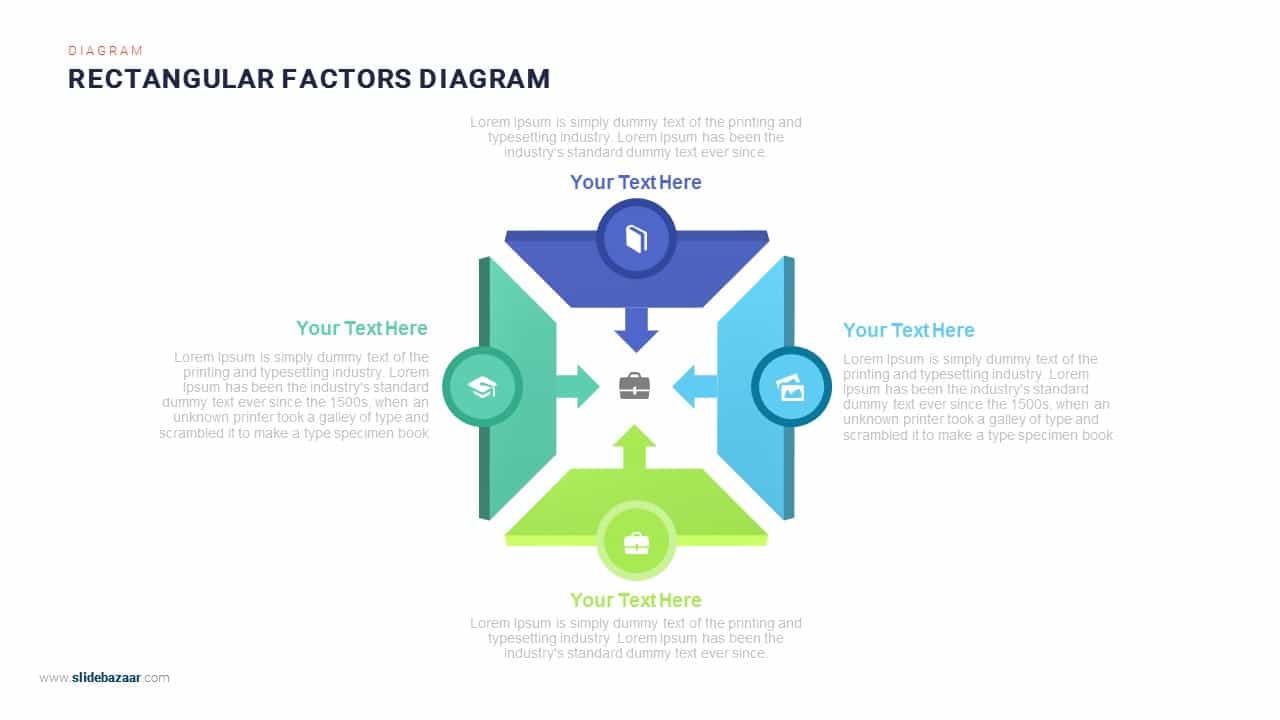
Four-Arrows Rectangular Factors Diagram Template for PowerPoint & Google Slides
Process
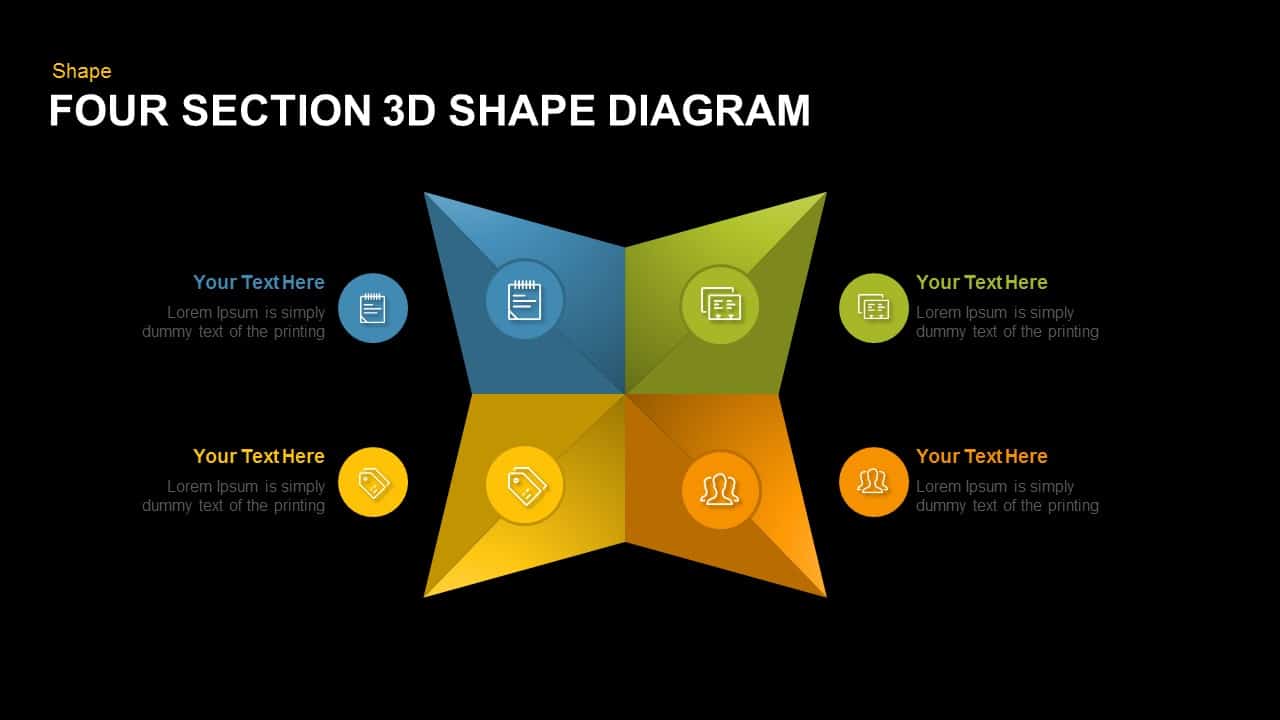
Editable Four-Section 3D Shape Diagram Template for PowerPoint & Google Slides
Comparison
Four-Circle Hub and Spoke Diagram Template for PowerPoint & Google Slides
Process
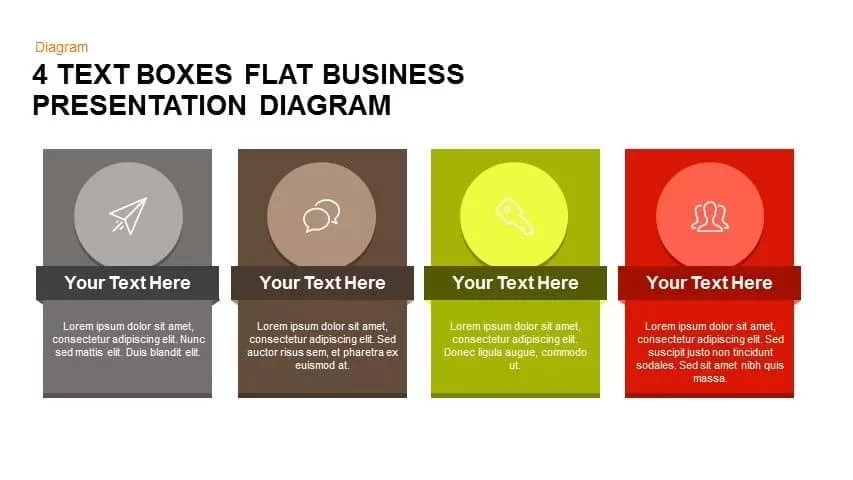
Flat Four-Box Business Layout Diagram Template for PowerPoint & Google Slides
Process
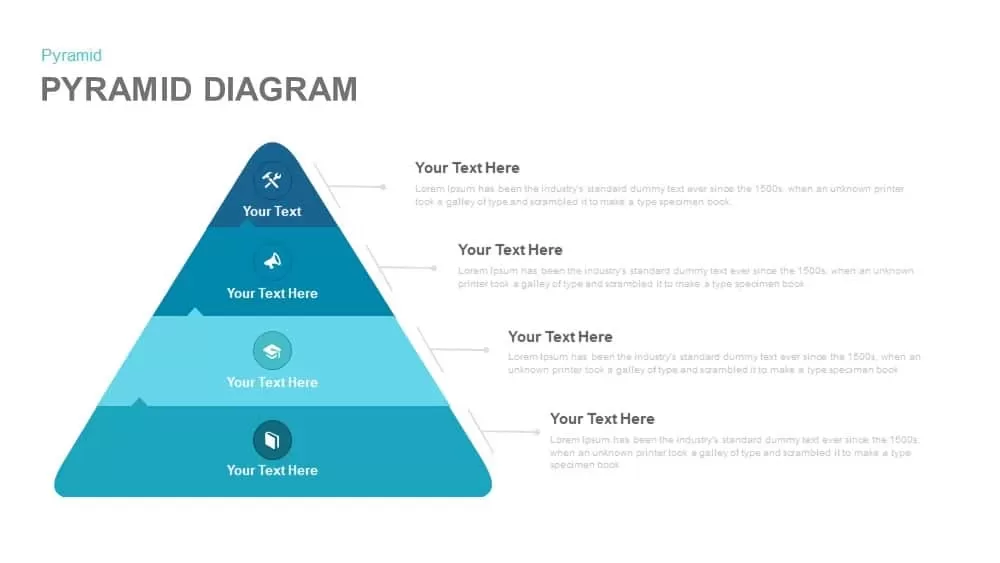
Four-Level Business Pyramid Diagram Template for PowerPoint & Google Slides
Pyramid
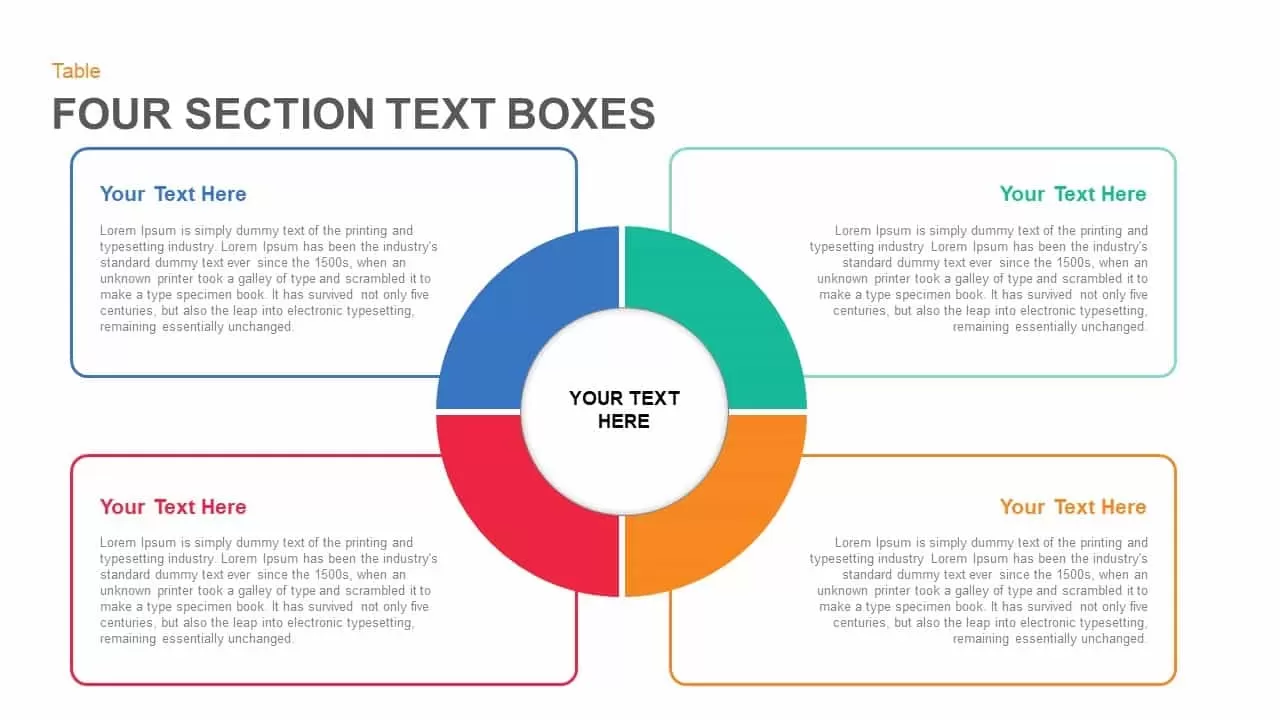
Four Section Circular Text Boxes Diagram Template for PowerPoint & Google Slides
Circular
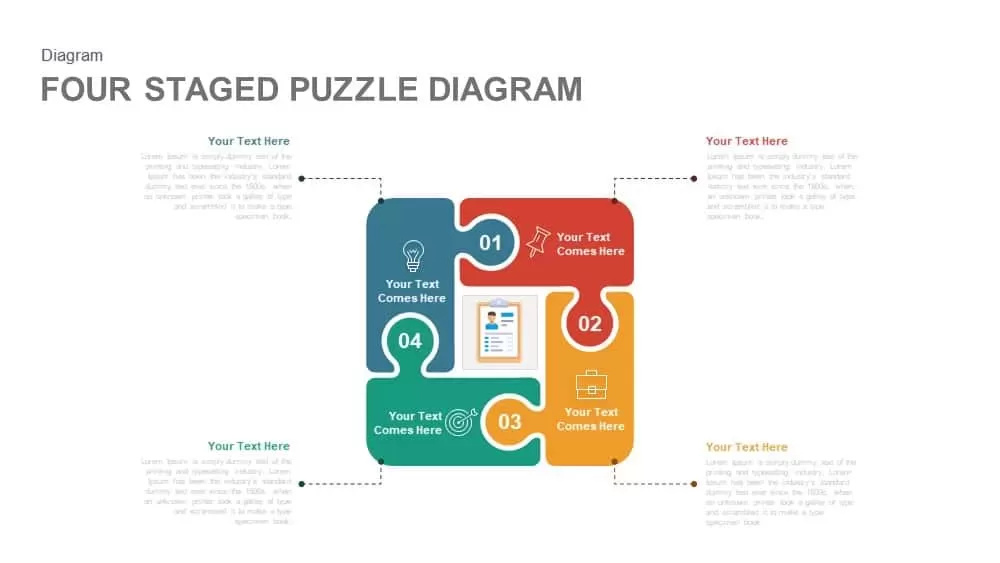
Four-Staged Puzzle Diagram Slide Template for PowerPoint & Google Slides
Process

Four-Plus Process Flow Diagram Template for PowerPoint & Google Slides
Process
Modern Four Stage Gear Diagram Template for PowerPoint & Google Slides
Process
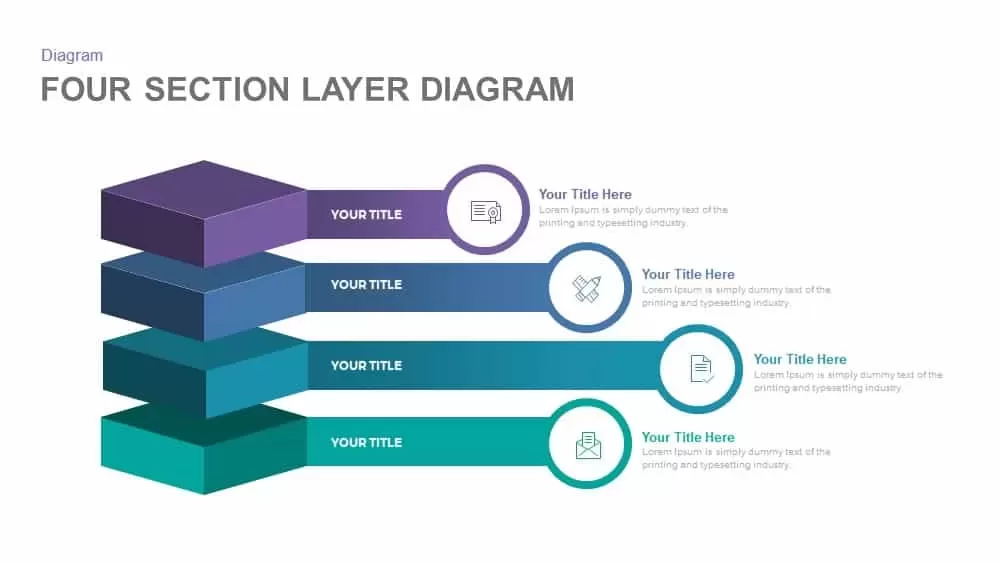
Professional Four-Section Layer Diagram Template for PowerPoint & Google Slides
Process
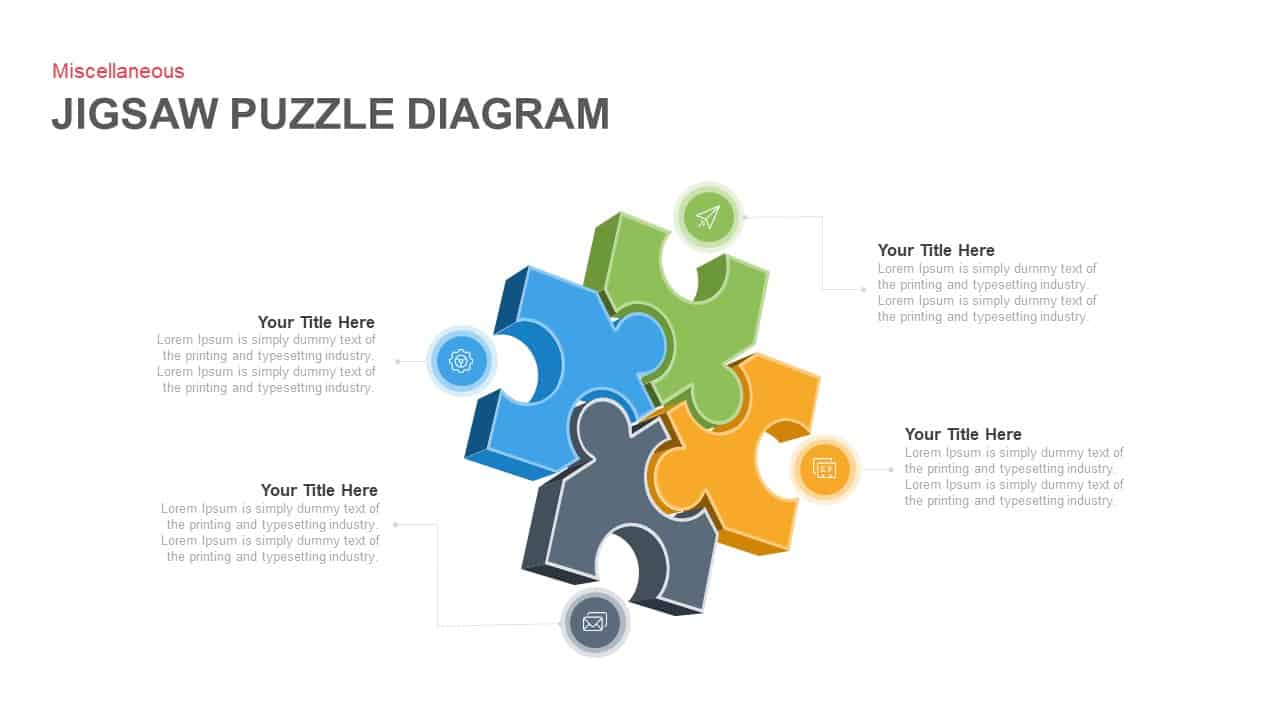
Four-Piece Jigsaw Puzzle Diagram Template for PowerPoint & Google Slides
Process
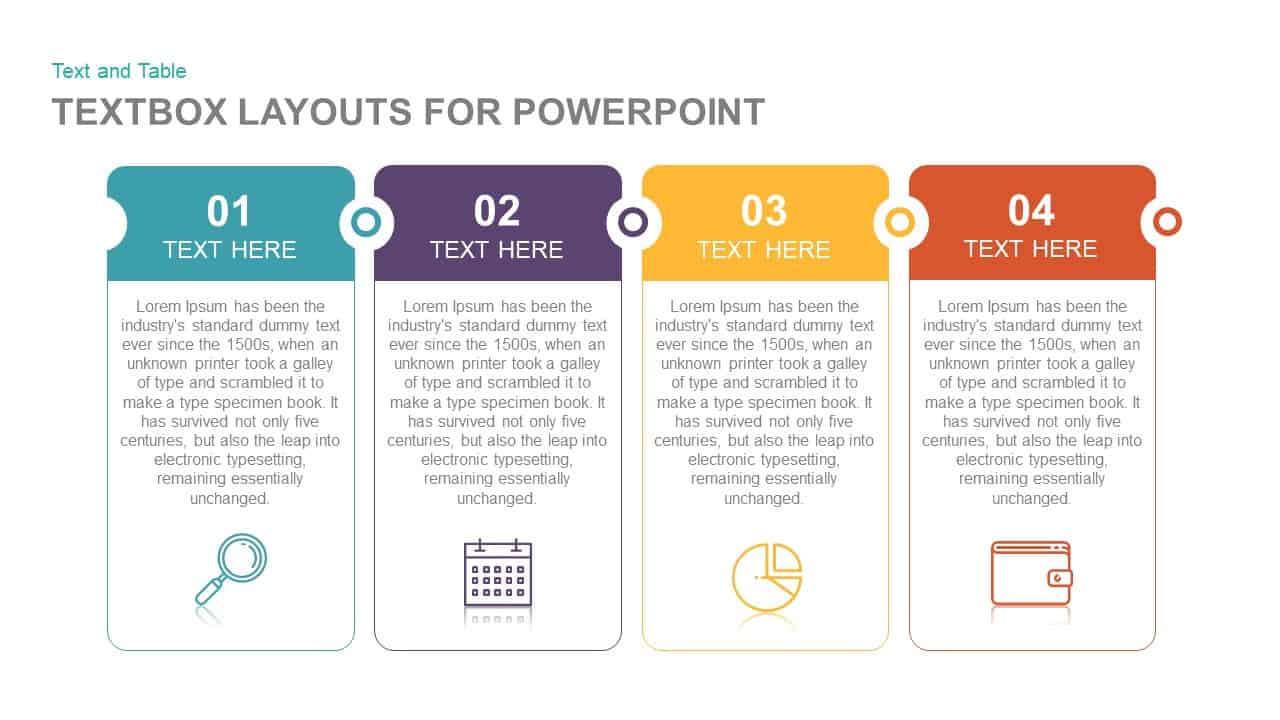
Four-Step Textbox Layout Diagram Template for PowerPoint & Google Slides
Business Report
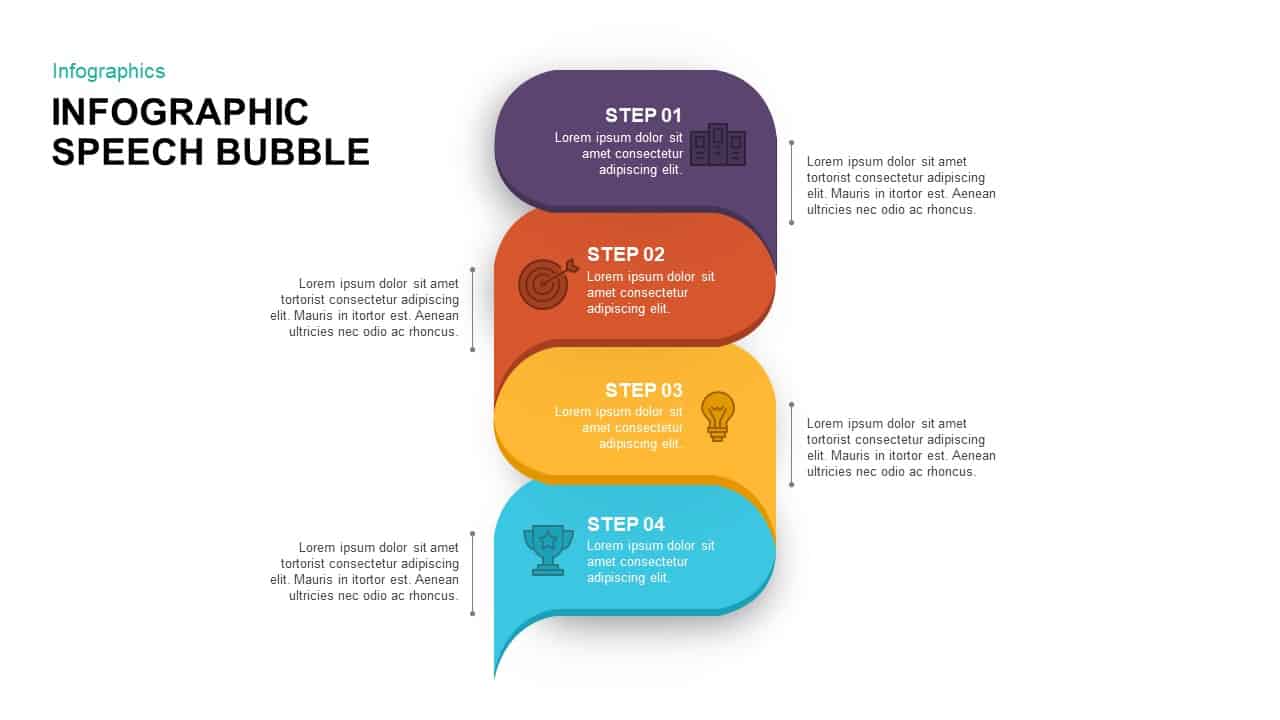
Four-Step Speech Bubble Diagram Template for PowerPoint & Google Slides
Process
Four-Stage Agenda Circle Diagram Slide Template for PowerPoint & Google Slides
Agenda
Four-Stage Circular Diagram Infographic Template for PowerPoint & Google Slides
Circular
Four-Stage Gear Process Diagram Template for PowerPoint & Google Slides
Process
Four-Stage Cycle Process Diagram Template for PowerPoint & Google Slides
Process
Concentric Four-Layer Core Diagram Template for PowerPoint & Google Slides
Circular
Four-Stage Linear Process Flow Diagram Template for PowerPoint & Google Slides
Process
Four-Stage Circular Flow Diagram Template for PowerPoint & Google Slides
Circular
Hand-Held Four-Step Process Diagram Template for PowerPoint & Google Slides
Process
Four-Stage Start-Up Plan Arc Diagram Template for PowerPoint & Google Slides
Process
Four-Stage Funnel Diagram Infographic Template for PowerPoint & Google Slides
Funnel
Four-Step Spiral Funnel Diagram Template for PowerPoint & Google Slides
Funnel
Four-Part SWOT Analysis Diagram Template for PowerPoint & Google Slides
SWOT
Four-Step Puzzle Diagram Infographic Template for PowerPoint & Google Slides
Process
Four-Stage Funnel Diagram Infographic Template for PowerPoint & Google Slides
Funnel
Four Business Structure Types Comparison Diagram Template for PowerPoint & Google Slides
Business Strategy
Four Section Infographic Diagram Template for PowerPoint & Google Slides
Circular
Four-Phase Maturity Model Diagram Template for PowerPoint & Google Slides
Process
Four-Option Cross Infographic Diagram Template for PowerPoint & Google Slides
Comparison
Four-Item Circular Diagram Concept Template for PowerPoint & Google Slides
Circular
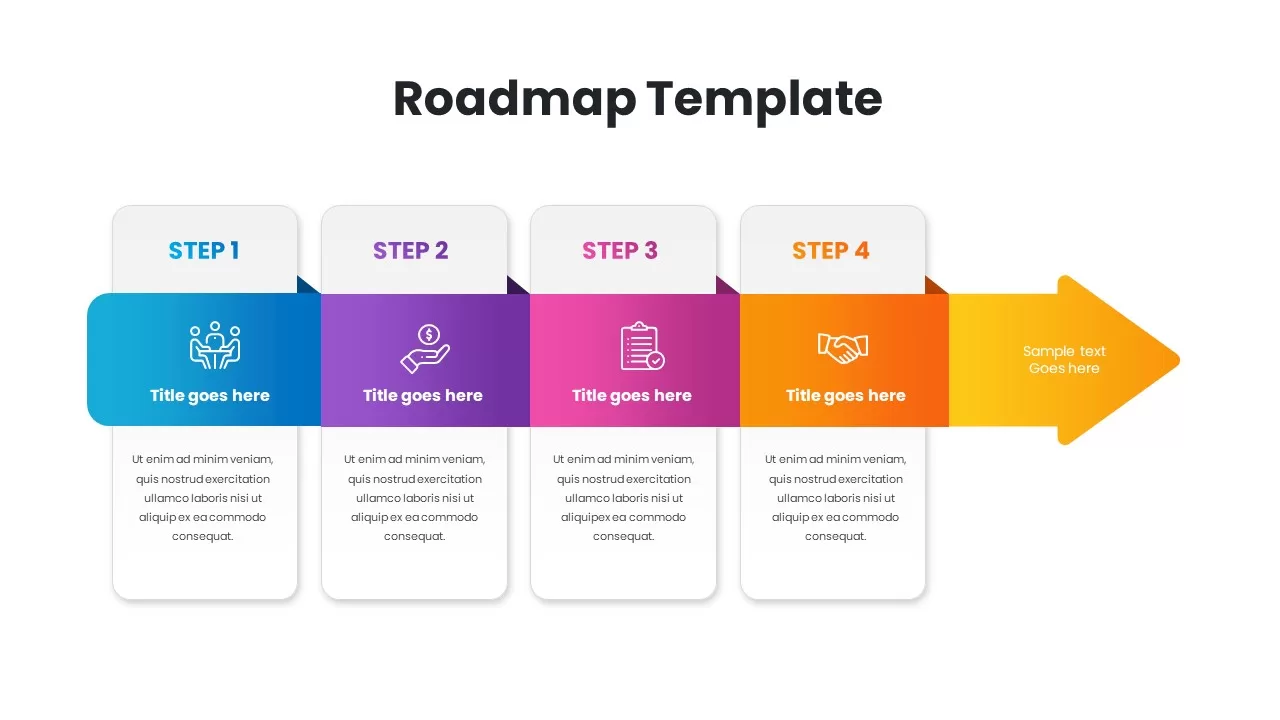
Gradient Four-Step Roadmap Diagram Template for PowerPoint & Google Slides
Roadmap
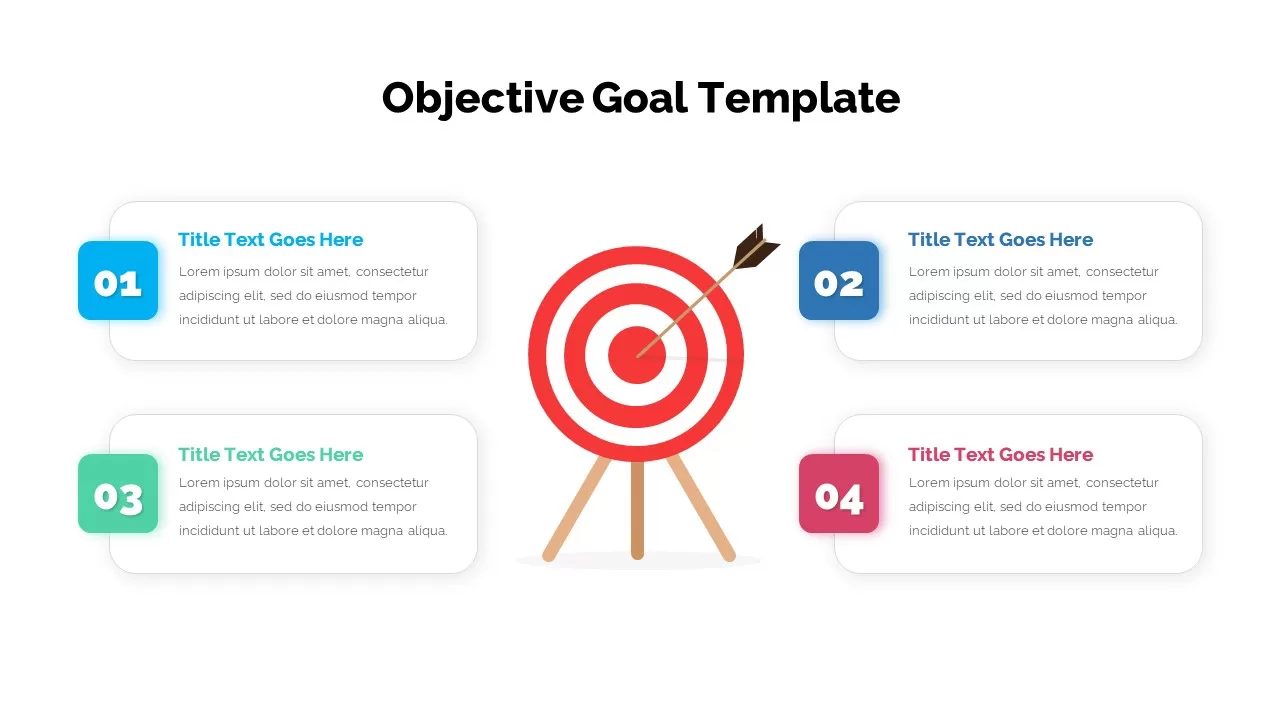
Four-Step Objective Goal Diagram Template for PowerPoint & Google Slides
Goals
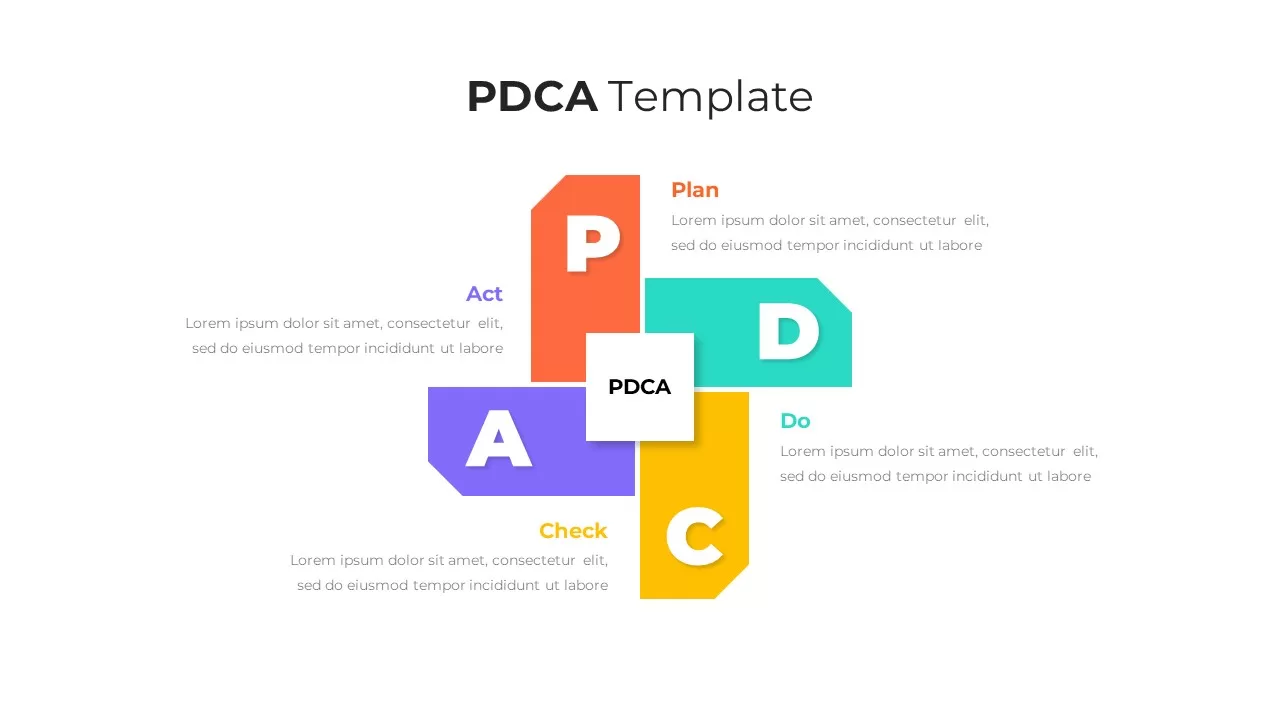
Elegant PDCA Four-Step Process Diagram Template for PowerPoint & Google Slides
Process
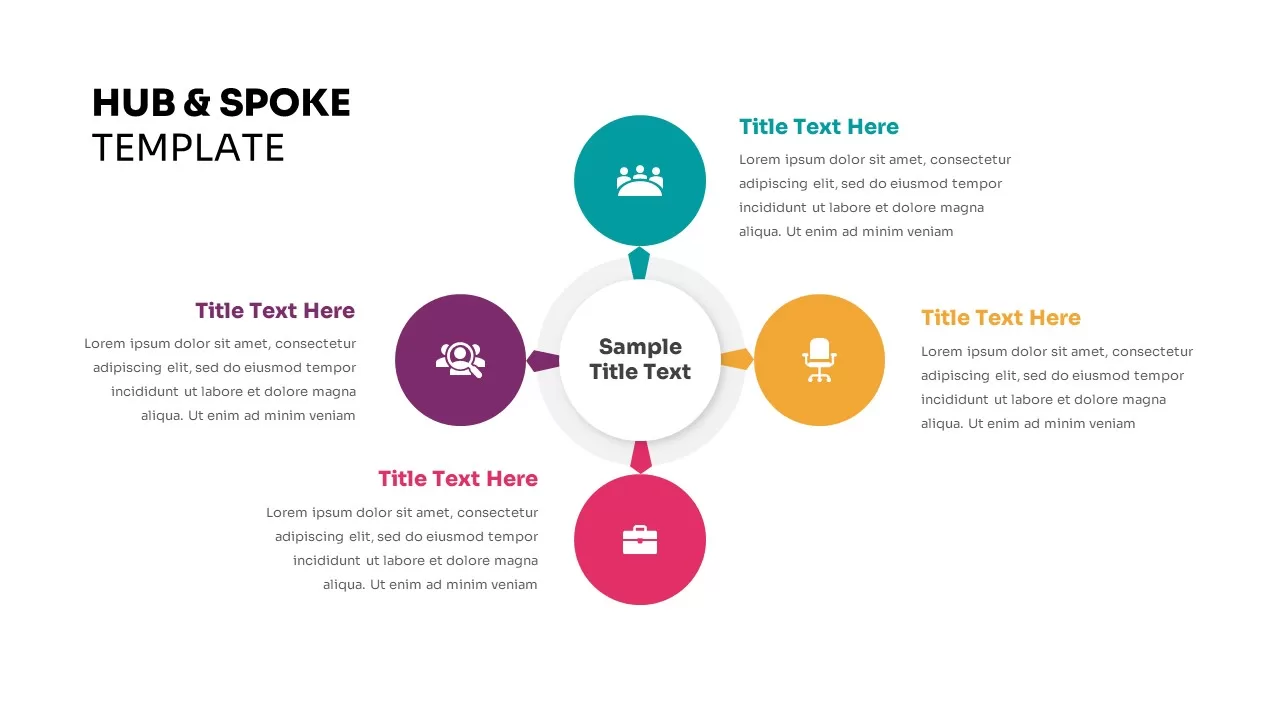
Four-Point Hub and Spoke Diagram Template for PowerPoint & Google Slides
Business Strategy
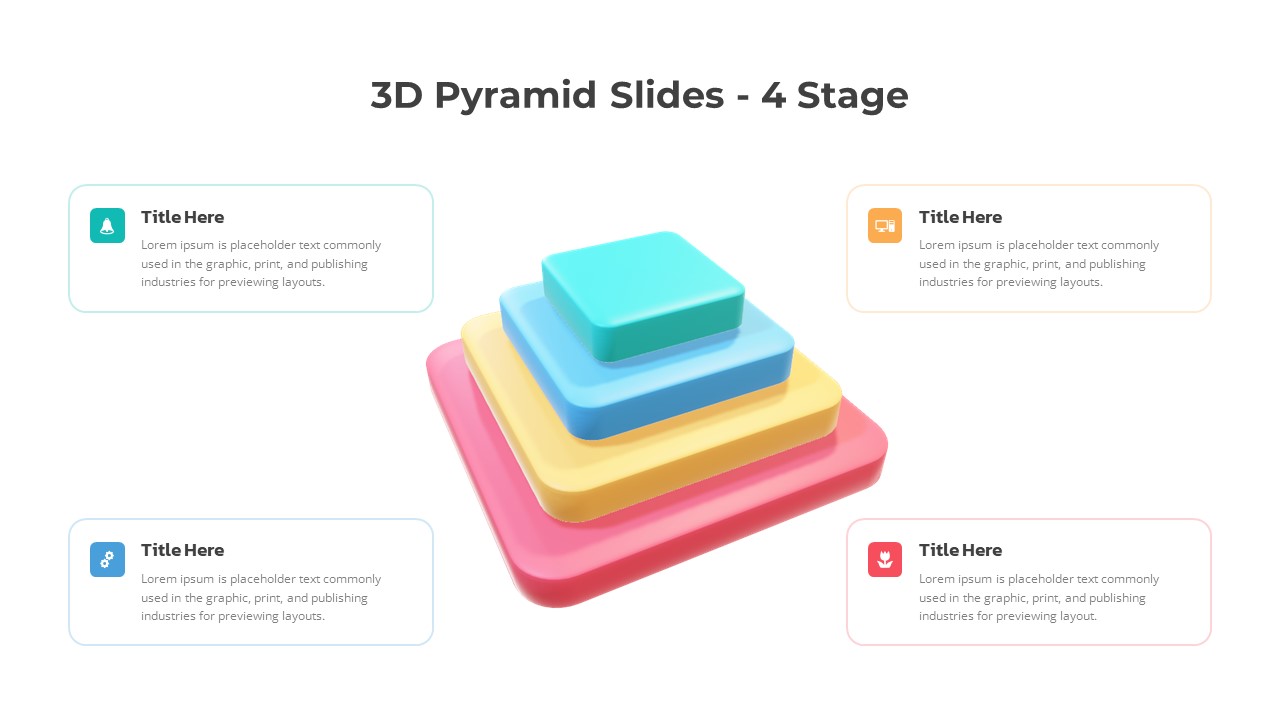
3D Four-Stage Pyramid Diagram Template for PowerPoint & Google Slides
Pyramid
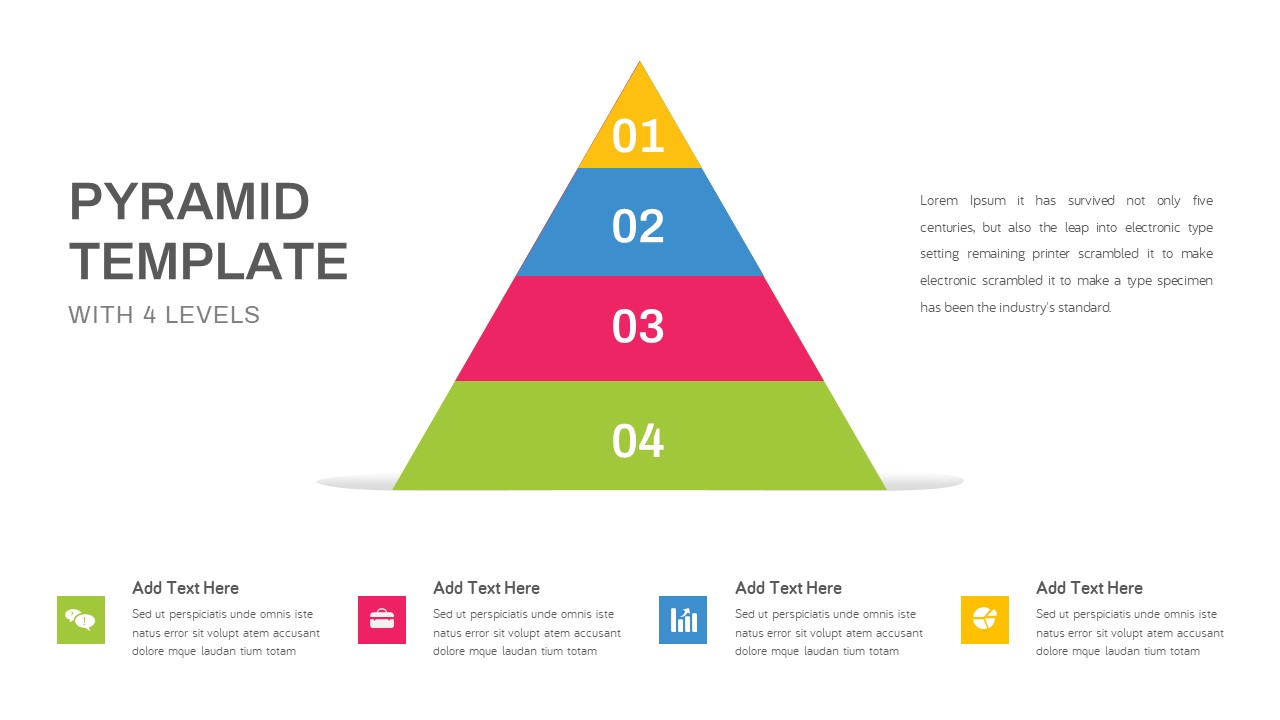
Four-Level Colorful Pyramid Diagram Template for PowerPoint & Google Slides
Pyramid
Modern Four-Level Pyramid Diagram Template for PowerPoint & Google Slides
Pyramid
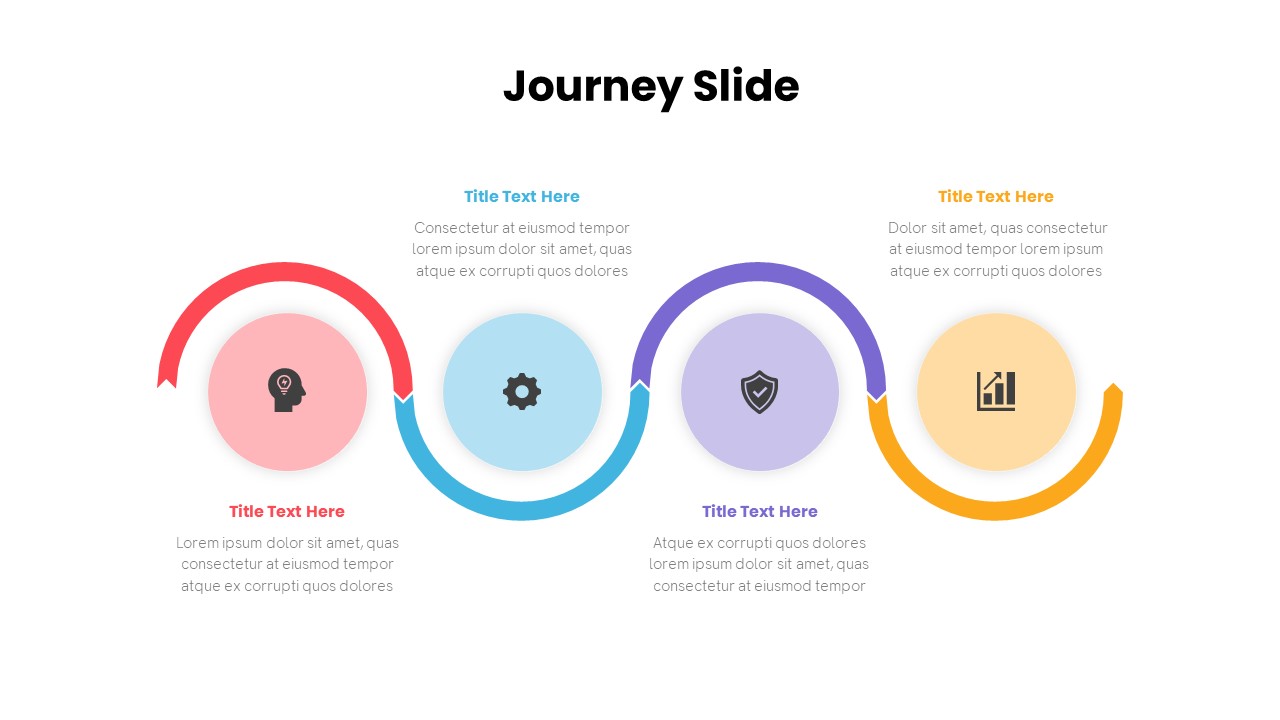
Free Journey Slide with Four Icons Diagram Template for PowerPoint & Google Slides
Process
Free
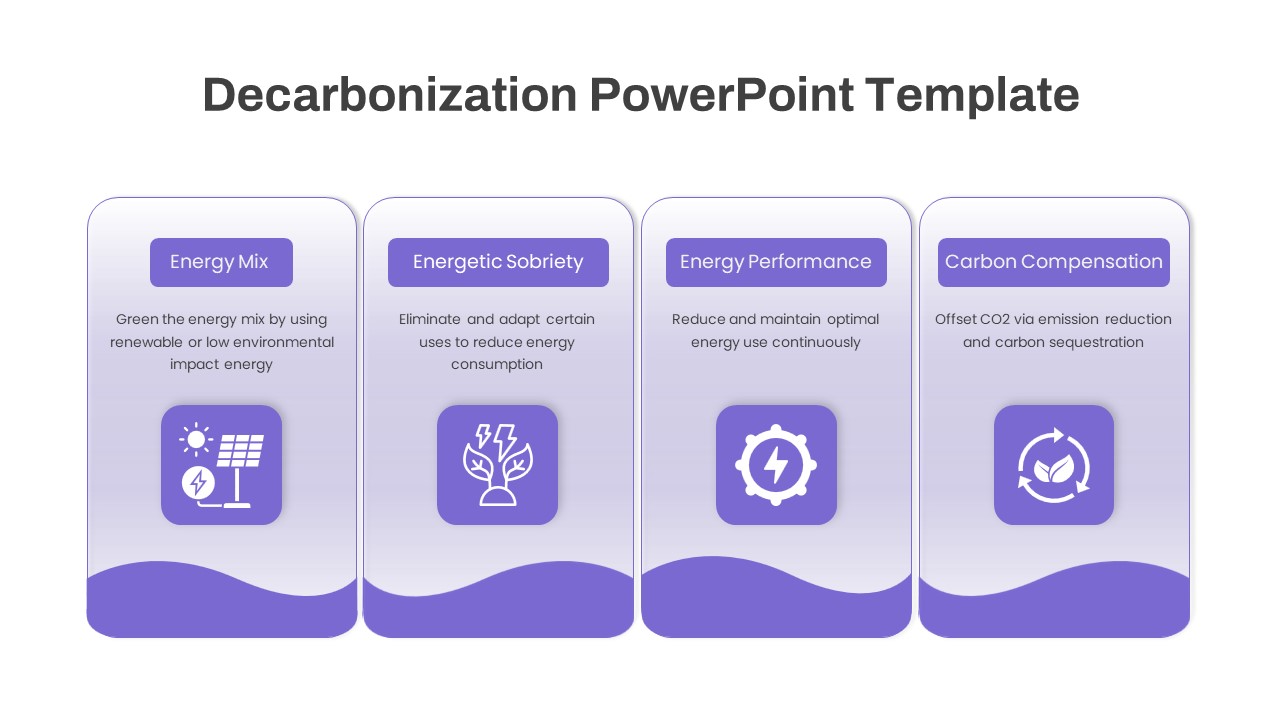
Four-Phase Decarbonization Diagram Template for PowerPoint & Google Slides
Process
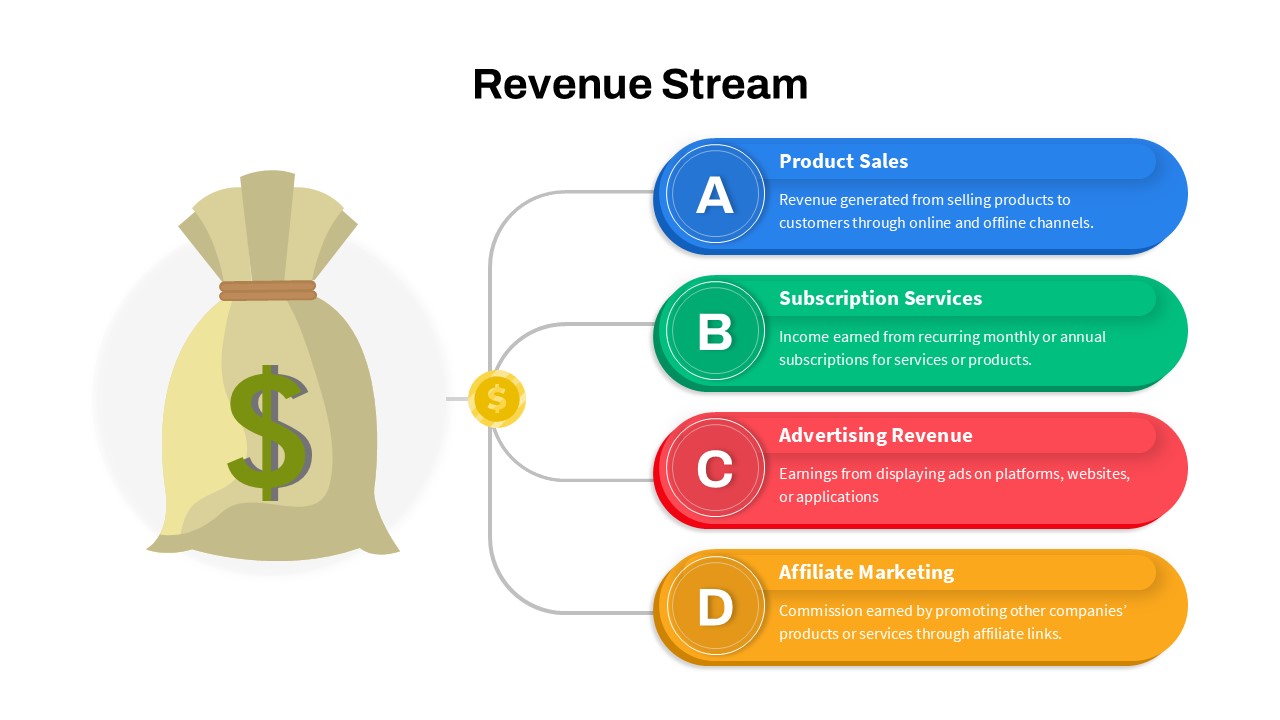
Revenue Streams: Four Channels Diagram Template for PowerPoint & Google Slides
Business Models
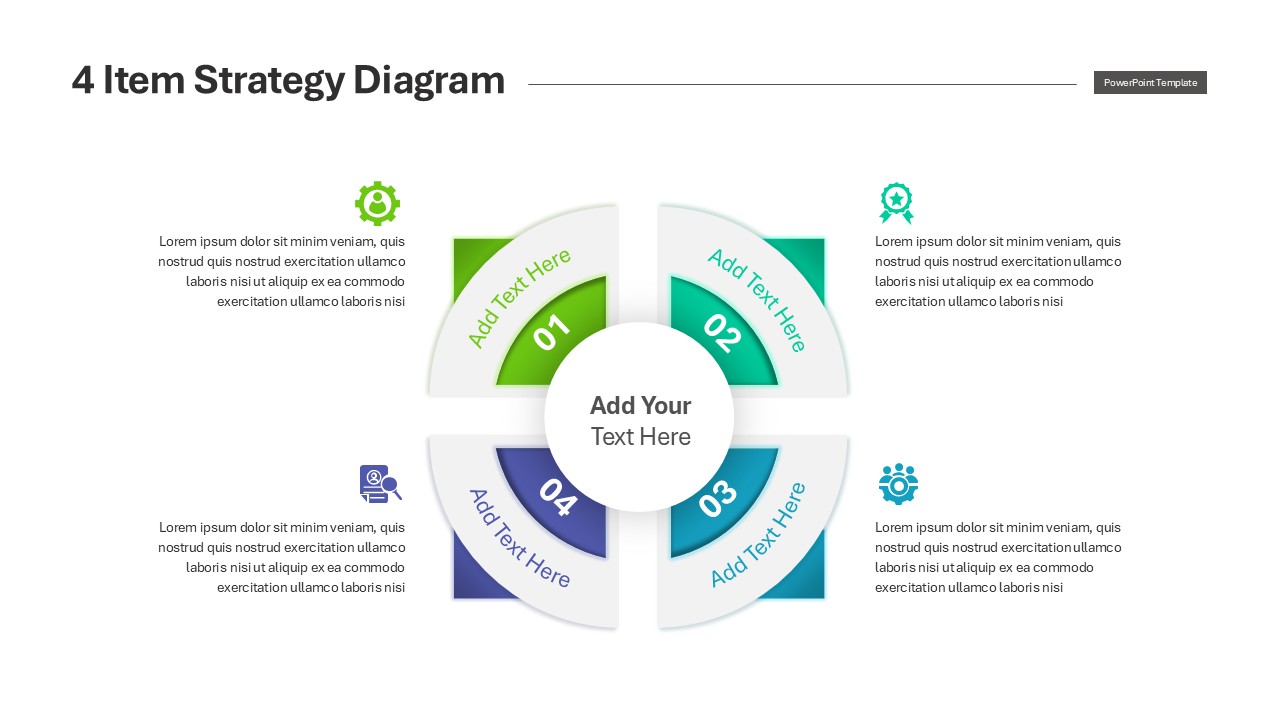
Engaging Four-Option Strategy Diagram Template for PowerPoint & Google Slides
Business Strategy
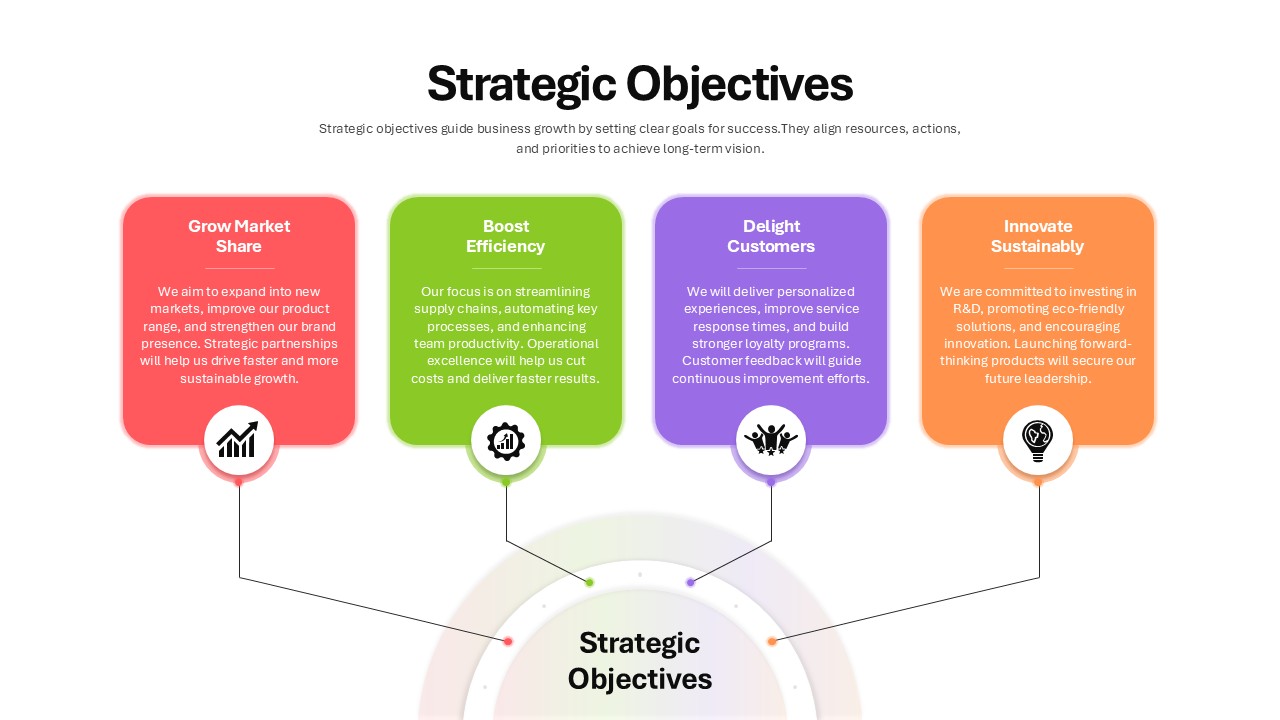
Four Strategic Objectives Radial Diagram Template for PowerPoint & Google Slides
Business Strategy
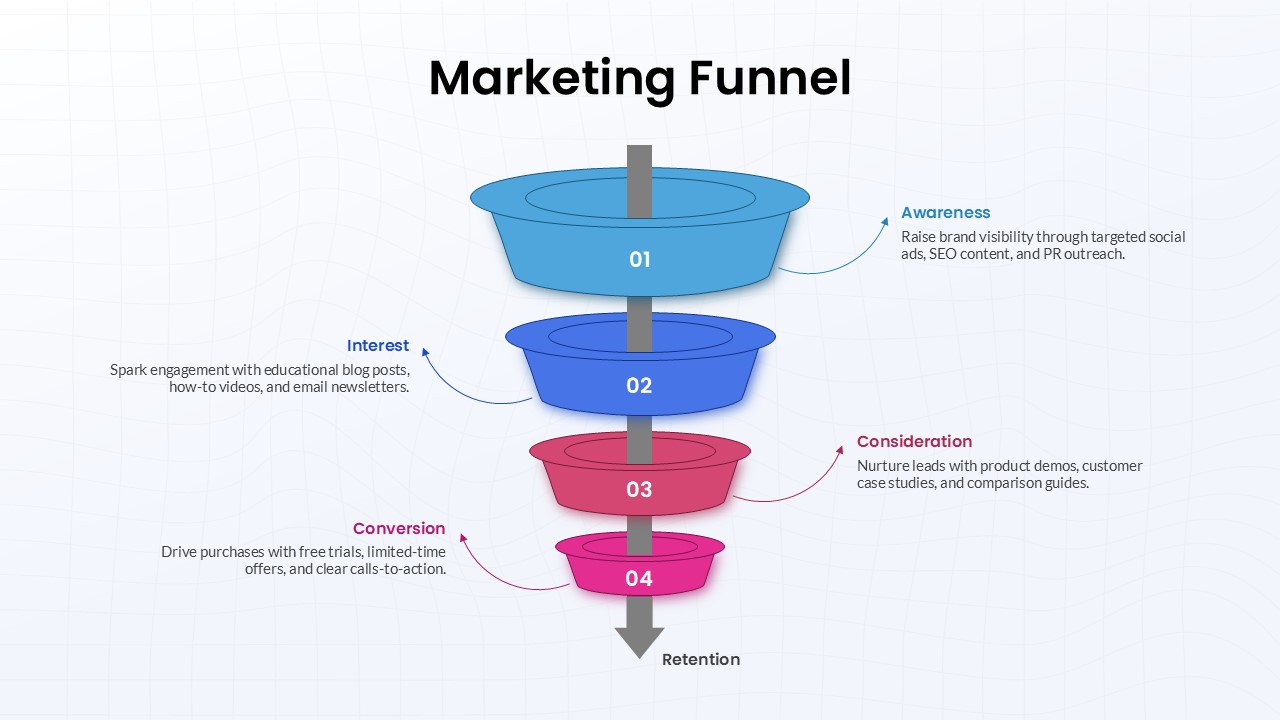
Four-Stage Marketing Funnel Diagram Template for PowerPoint & Google Slides
Marketing Funnel
Four-Level Colorful Pyramid Diagram Template for PowerPoint & Google Slides
Pyramid