Shape Loop Four-Step Infographic Slide Template for PowerPoint & Google Slides
Description
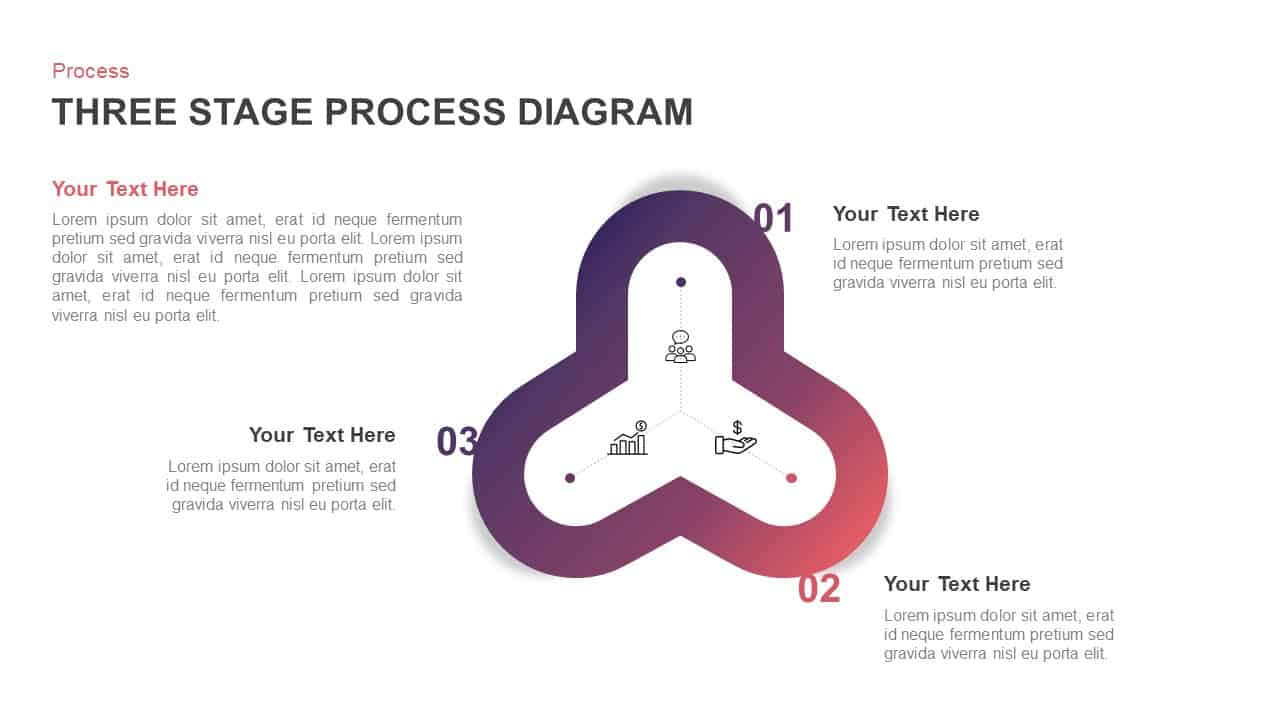
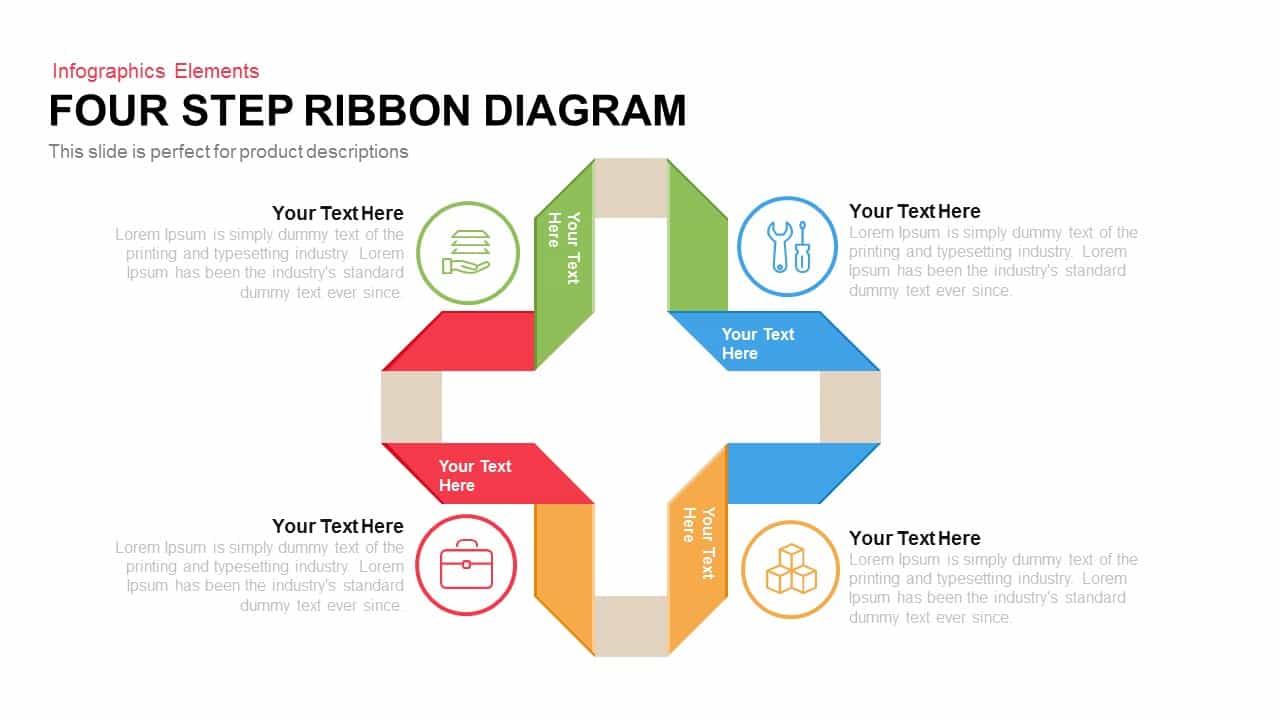
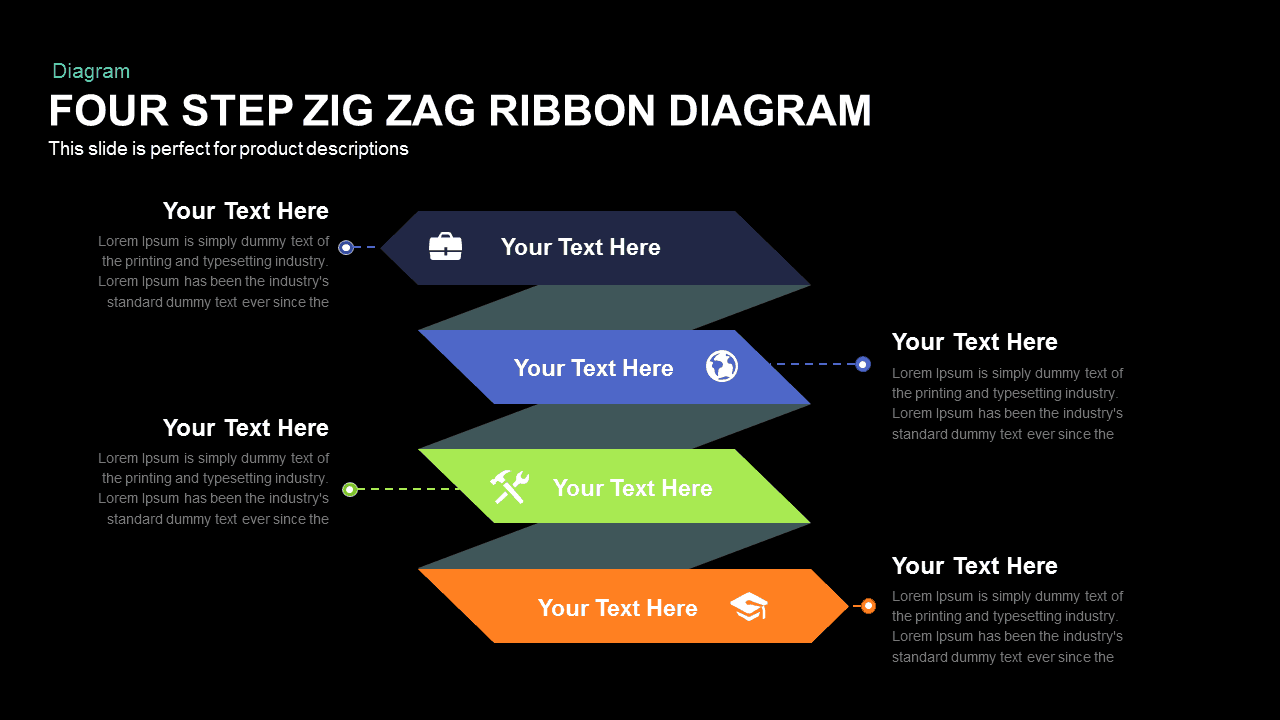
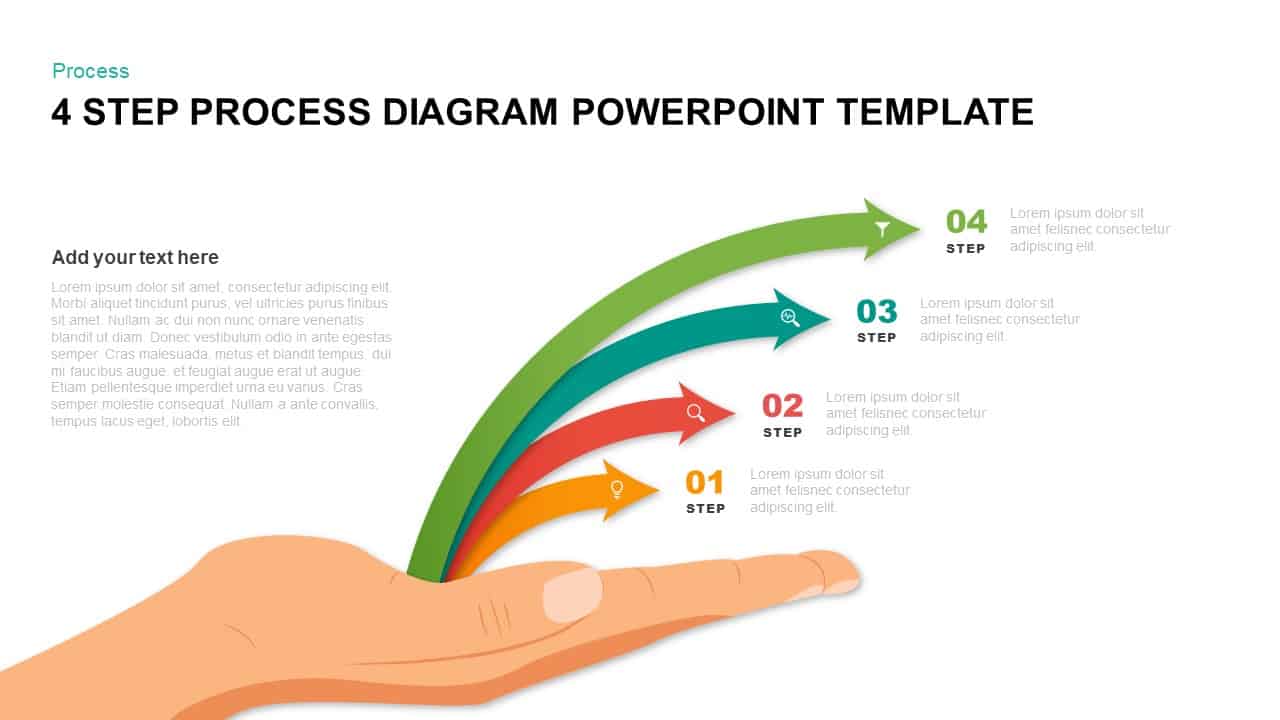
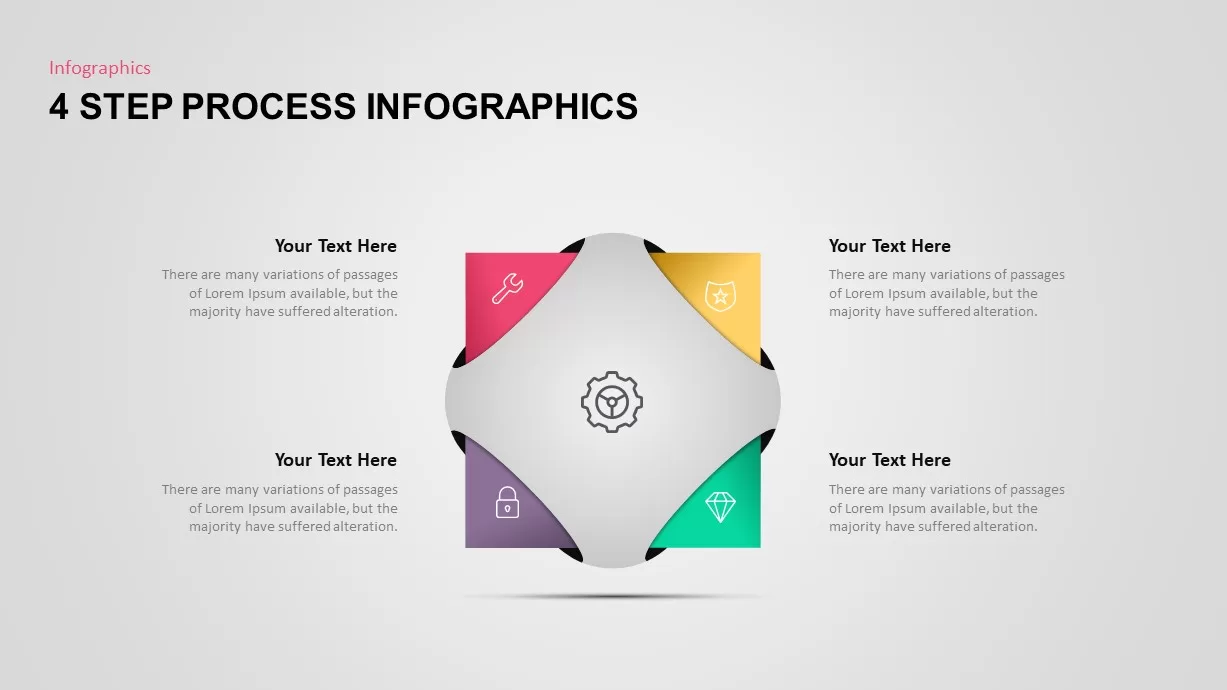
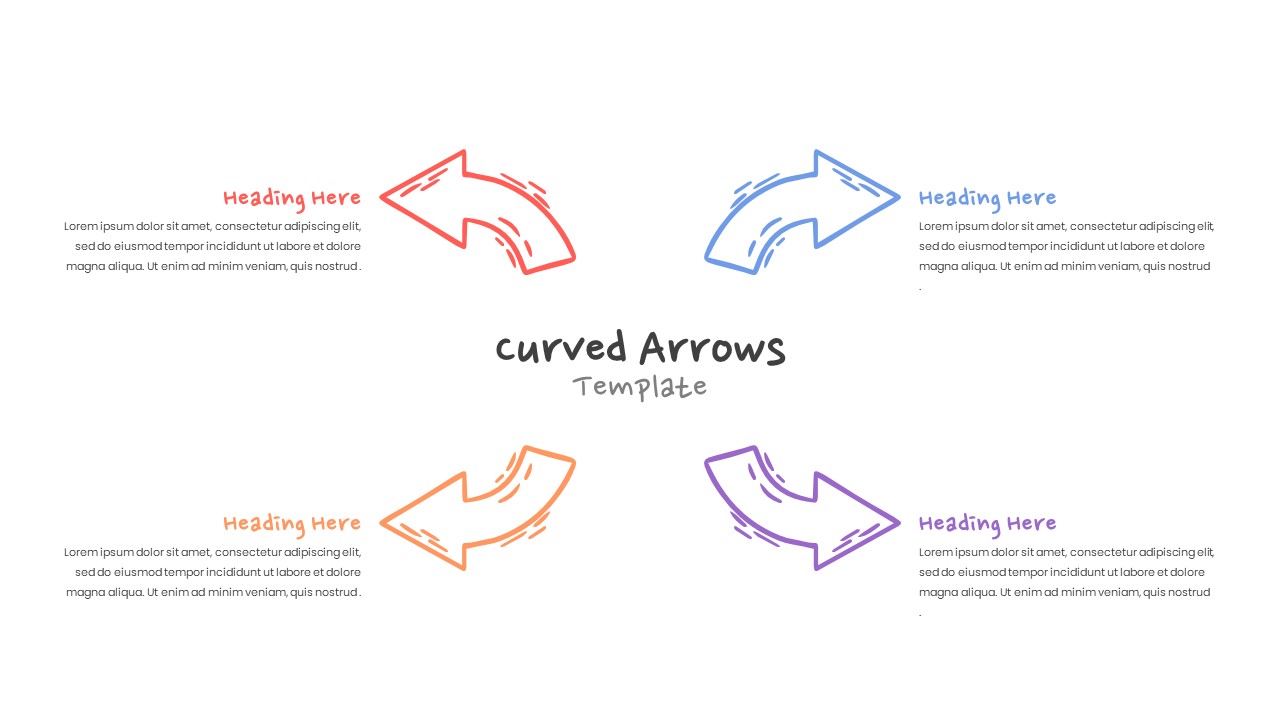
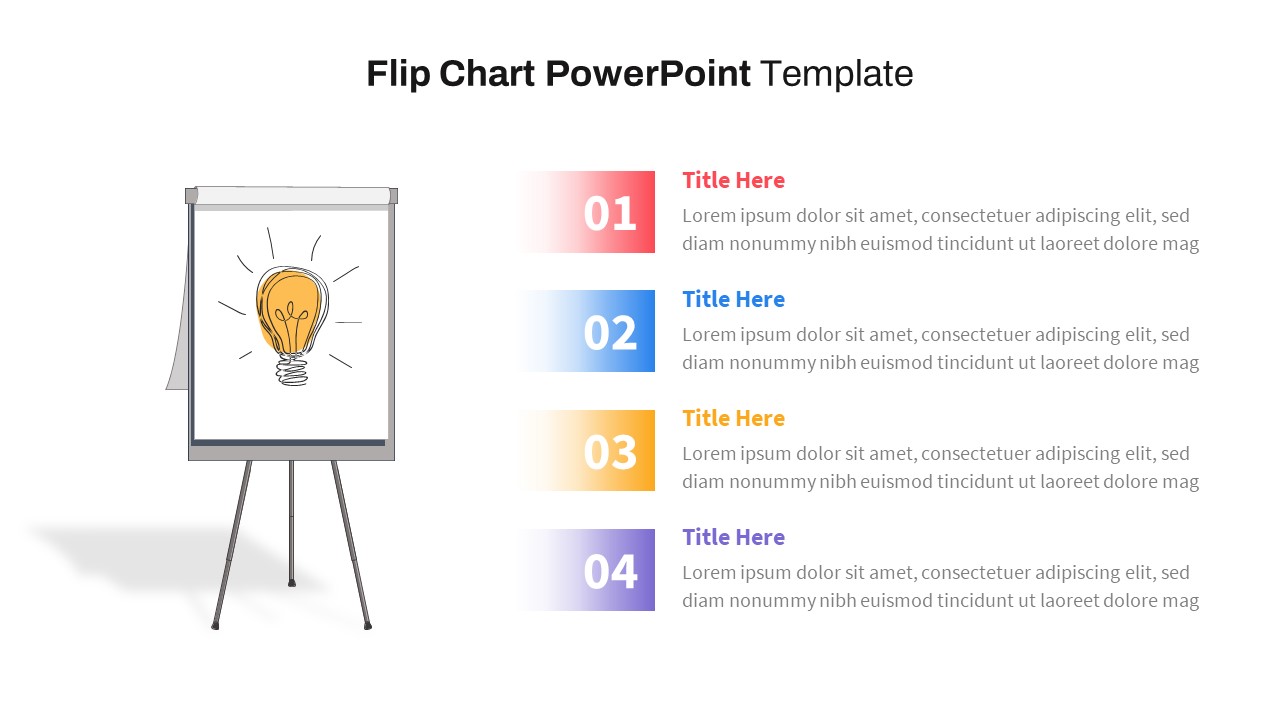
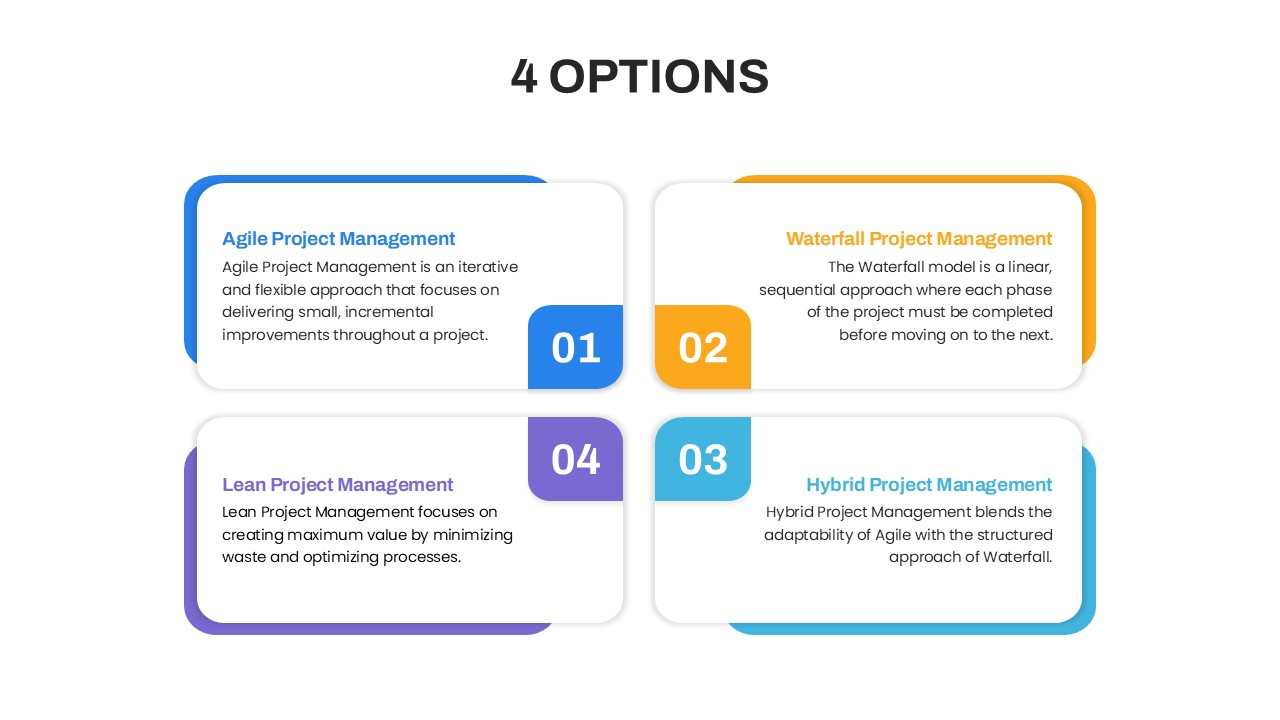
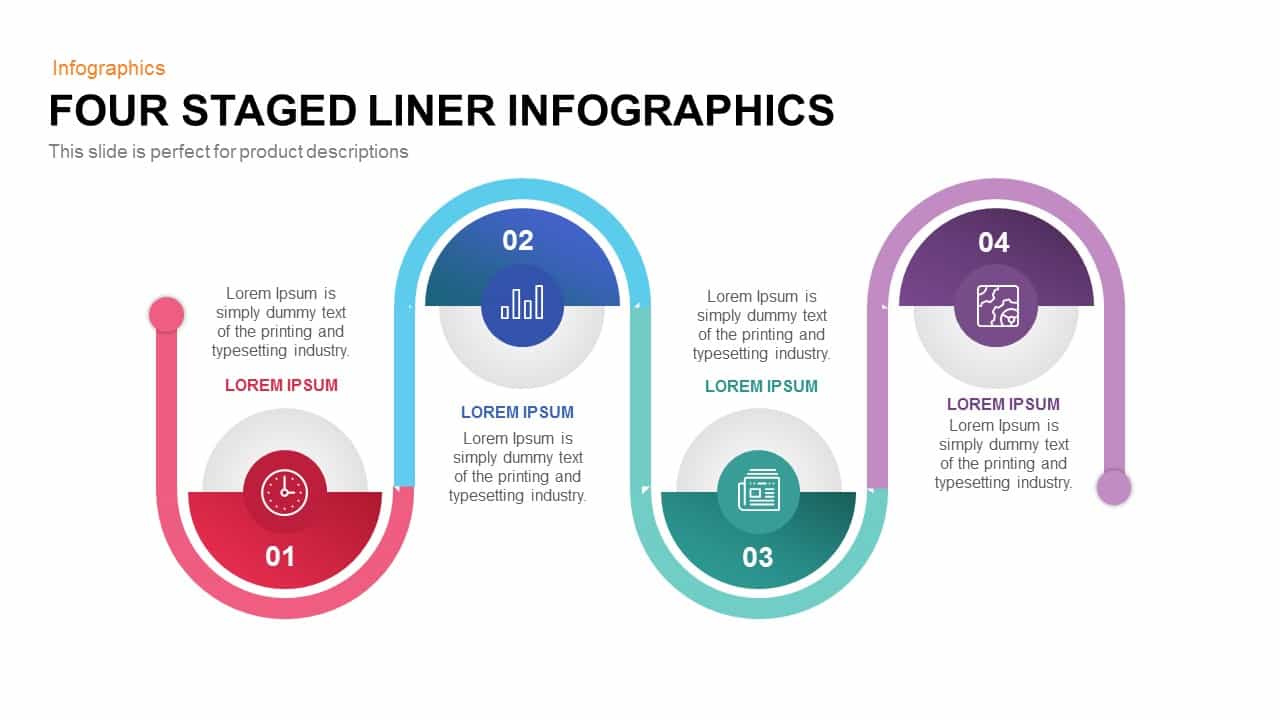
Elevate presentations with this versatile four-step shape loop infographic slide, featuring a continuous ribbon-like triangular design to illustrate sequential processes or cycles. The gradient ribbon shifts between vibrant magenta and pink, guiding the eye through four numbered stages, each represented by clear icons—group connections for stage one, rocket launch for stage two, trophy award for stage three, and chart analytics for stage four. On the left, customizable text placeholders and supporting icon-led bullet points allow concise explanations of each phase, ensuring clarity and cohesion. Fully editable shapes, colors, and icons empower you to adapt content to match brand identity, while the clean white backdrop and minimalistic typography maintain a modern professional aesthetic. Compatible with PowerPoint and Google Slides, this slide leverages master layouts and intuitive drag-and-drop elements for effortless updates and seamless collaboration. Designed for high-resolution displays, the slide maintains crisp visuals on HD and widescreen formats, ensuring readability in virtual or in-person settings. The vector-based ribbons and icons scale without quality loss, and intuitive placeholder fields allow you to swap content in seconds. Ideal for dynamic agendas or summary overviews, this slide streamlines complex information into a coherent visual narrative.
Who is it for
Business analysts, project managers, marketing teams, and consultants seeking to convey process stages, project roadmaps, or cyclical frameworks will benefit from this design. Executive leaders and startup founders can also employ the slide to showcase product lifecycles, strategy roadmaps, or operational workflows with impact.
Other Uses
Beyond four-step workflows, repurpose this loop infographic for risk assessments, training modules, performance reviews, KPI tracking, and stakeholder presentations. Adjust iconography to highlight milestones, resource allocation, or growth metrics. Duplicate the loop to expand stages or rearrange placeholders for comparative analysis, goal mapping, or product launch timelines, making this asset a flexible addition to any corporate or educational deck.
Login to download this file


