Key Cost Indicators Infographic Template for PowerPoint & Google Slides

Description
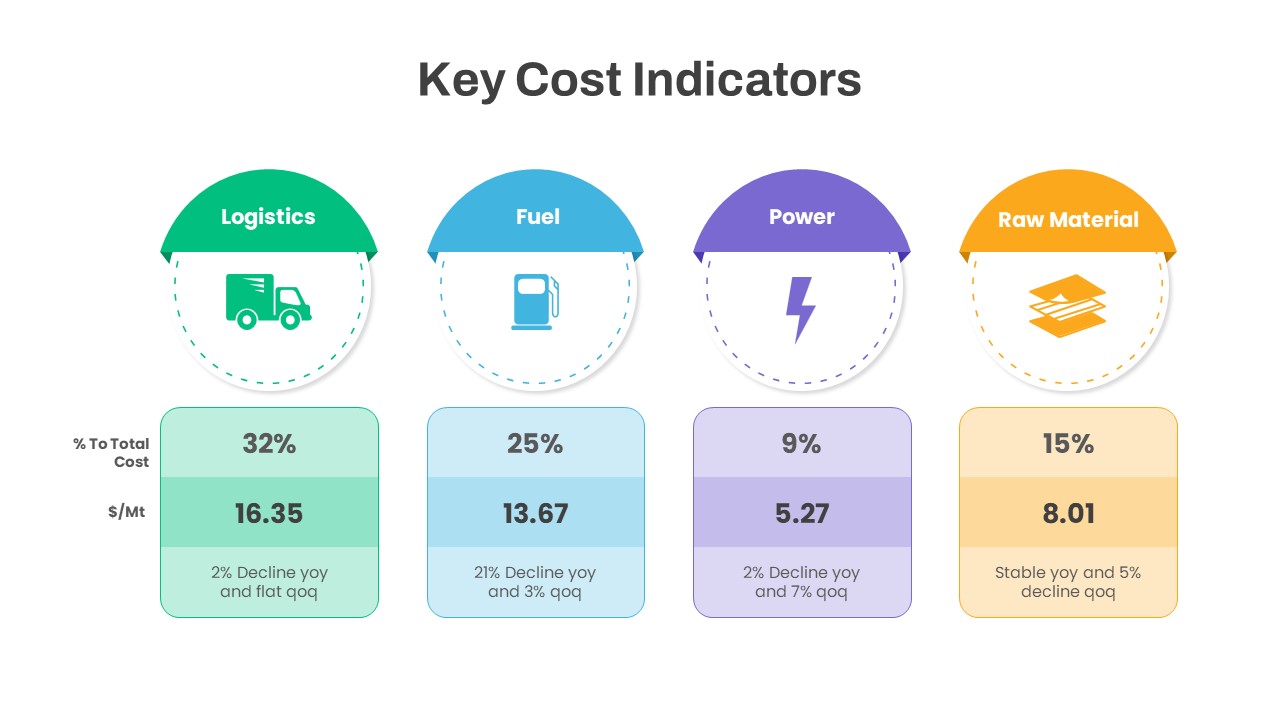
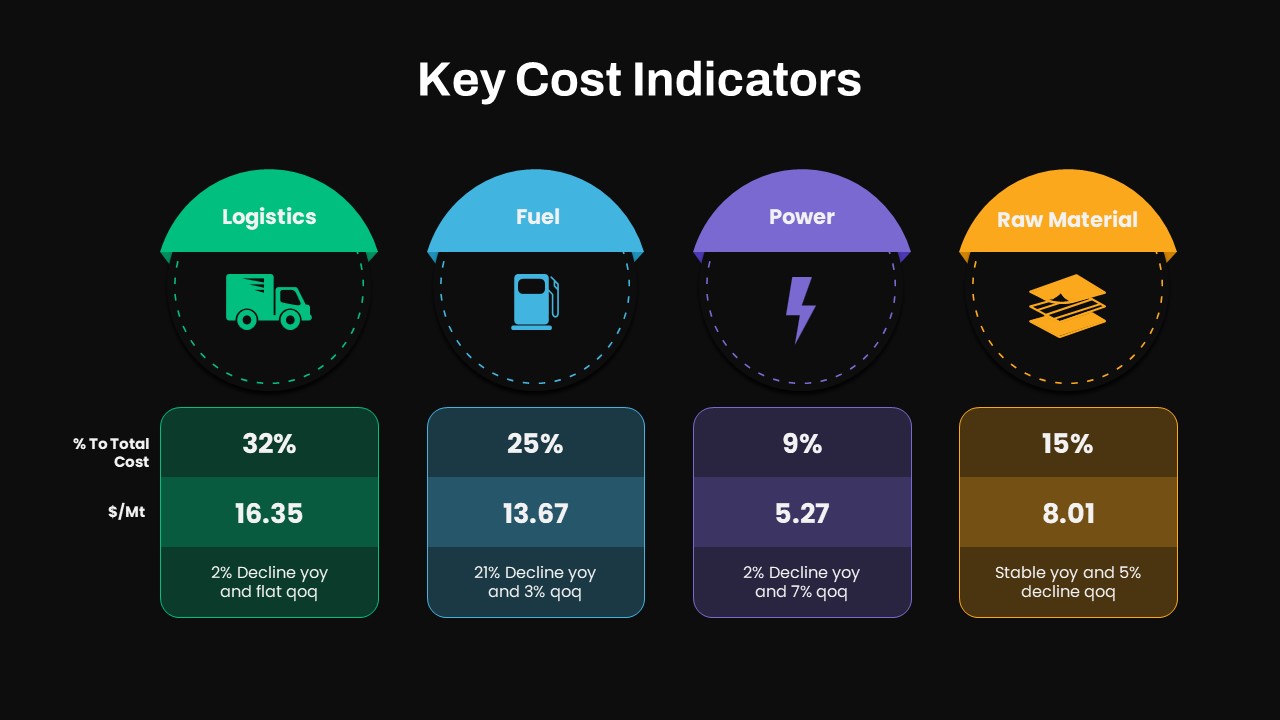
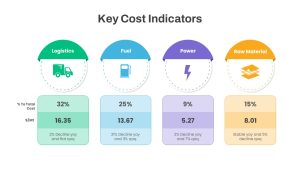
Highlight your top cost drivers with this Key Cost Indicators Infographic Template for PowerPoint & Google Slides. Four color-coded circular icons represent Logistics (green), Fuel (blue), Power (purple), and Raw Material (orange), each paired with editable percentage, unit cost, and trend callouts. The clean layout places icons above shaded data cards—featuring % of total cost, $/Mt values, and YoY/ QoQ notes—enabling you to compare metrics at a glance. Built on a slide with unlocked vector shapes, you can easily swap colors, icons, or figures to fit your brand and data.
Who is it for
Financial analysts, operations managers, and supply-chain directors tracking cost components. CFOs, procurement teams, and project controllers can also leverage this slide in budget reviews and stakeholder updates.
Other Uses
Repurpose for supplier performance dashboards, budget variance analyses, operational KPI reports, production cost breakdowns, or financial presentations.
Login to download this file

Item ID
SB04389
Related Templates

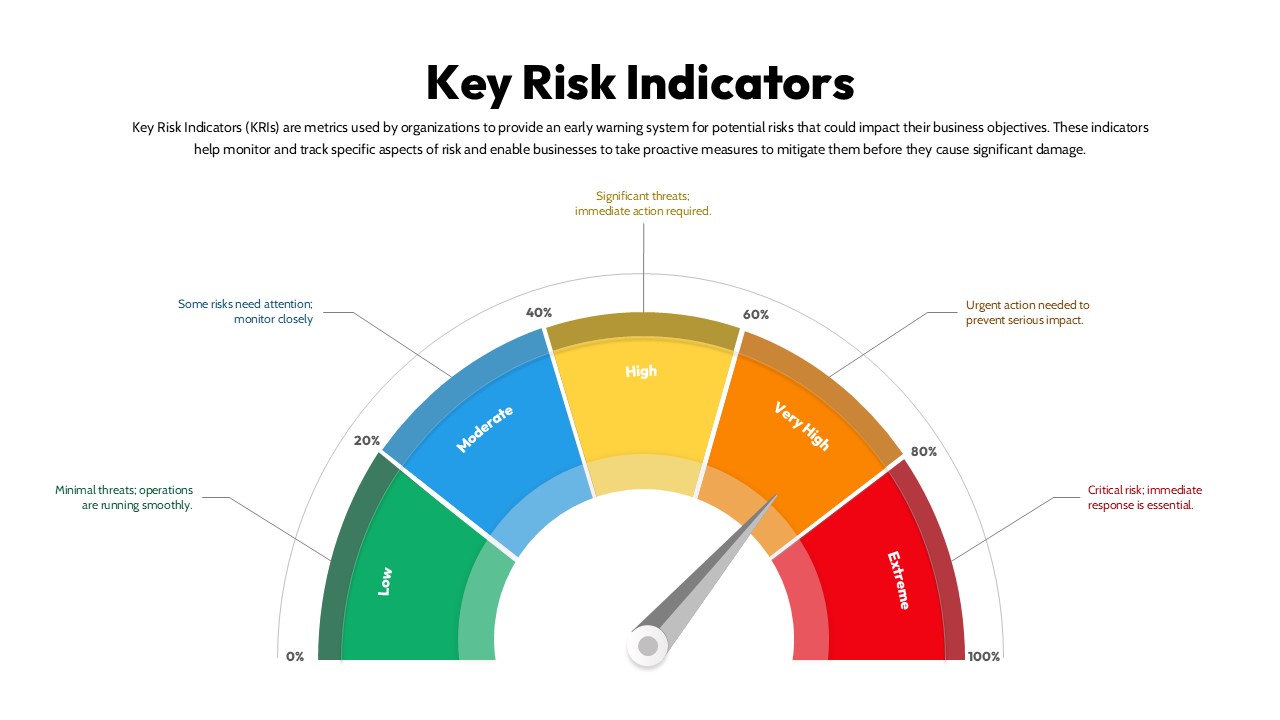
Key Risk Indicators (KRI) Gauge Template for PowerPoint & Google Slides
Risk Management
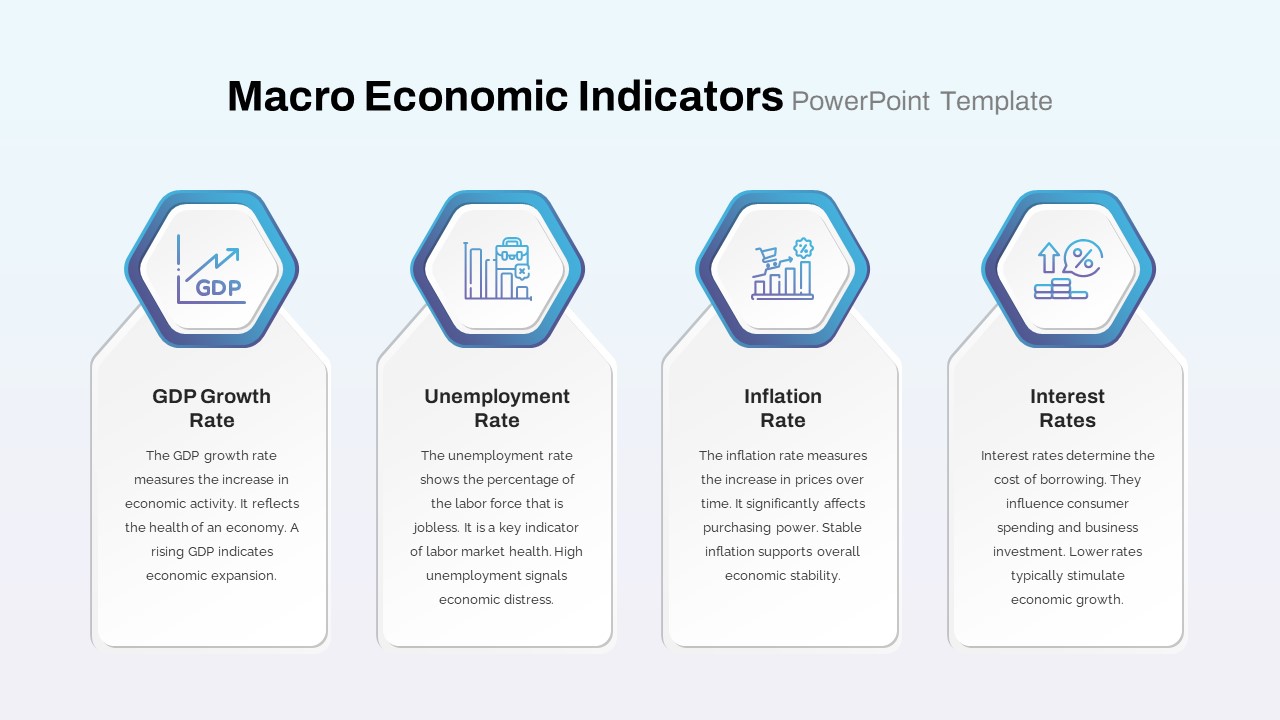
Macro Economic Indicators Infographic Template for PowerPoint & Google Slides
Comparison
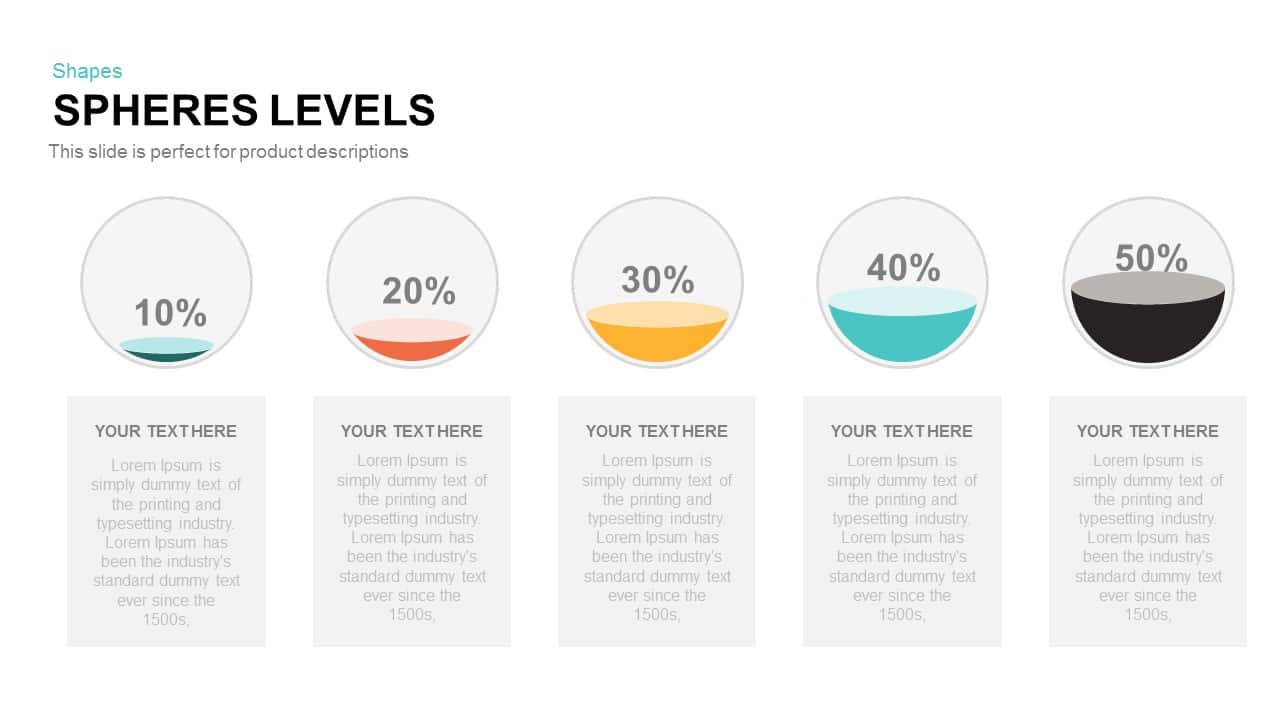
Five-Level Sphere Indicators Diagram template for PowerPoint & Google Slides
Infographics
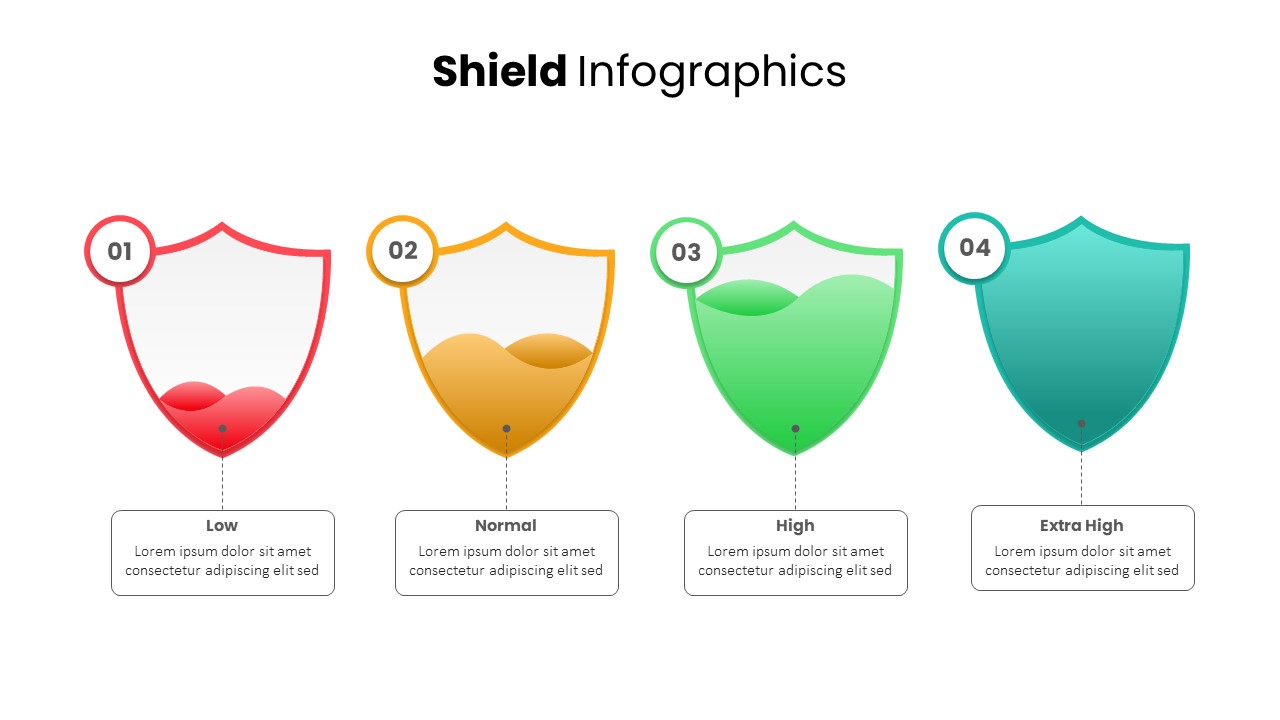
Shield Infographics Risk Indicators Template for PowerPoint & Google Slides
Infographics
Macroeconomic Indicators Dashboard Template for PowerPoint & Google Slides
PEST
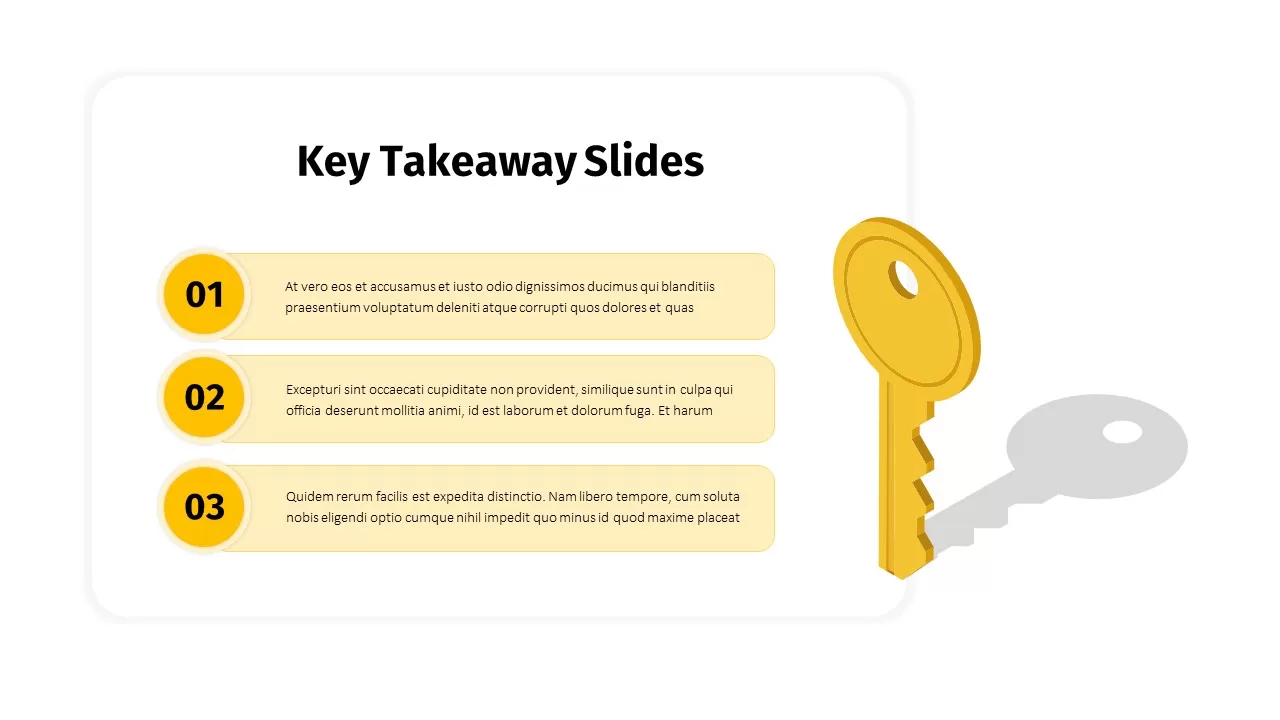
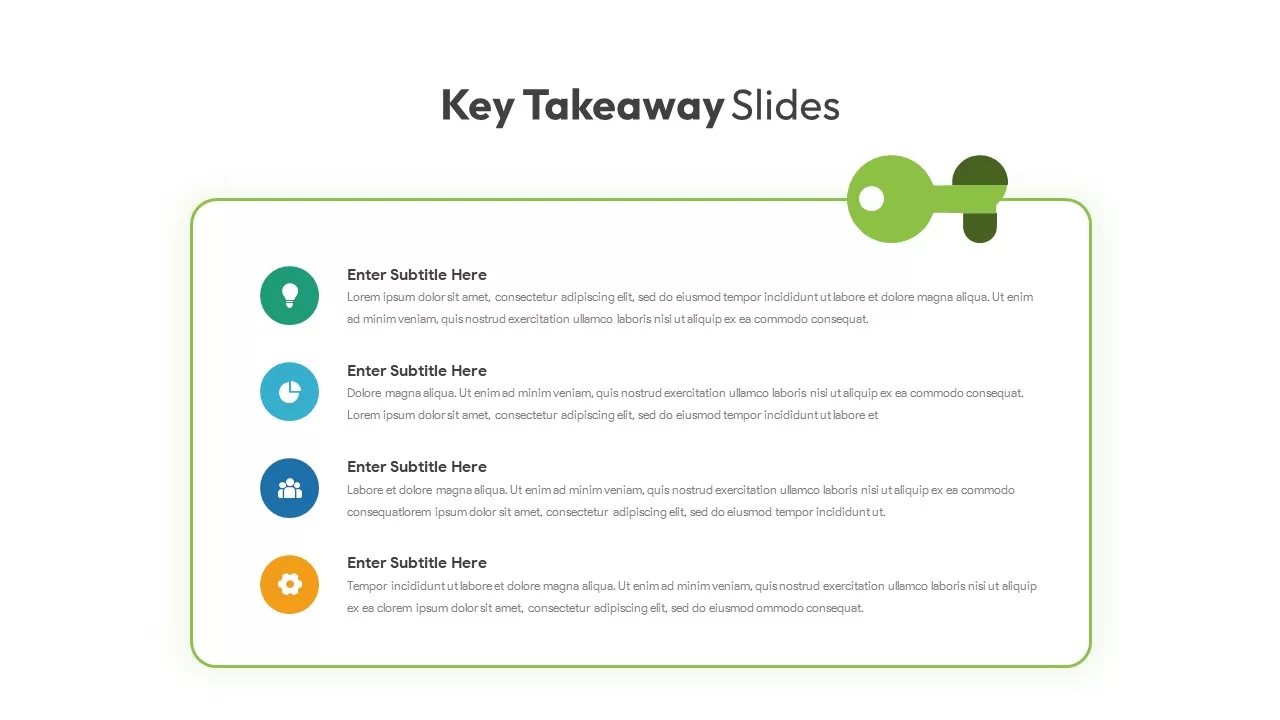
Key Takeaway Slide Template with Key Graphic for PowerPoint & Google Slides
Process
Cost Reduction Infographic Template for PowerPoint & Google Slides
Process
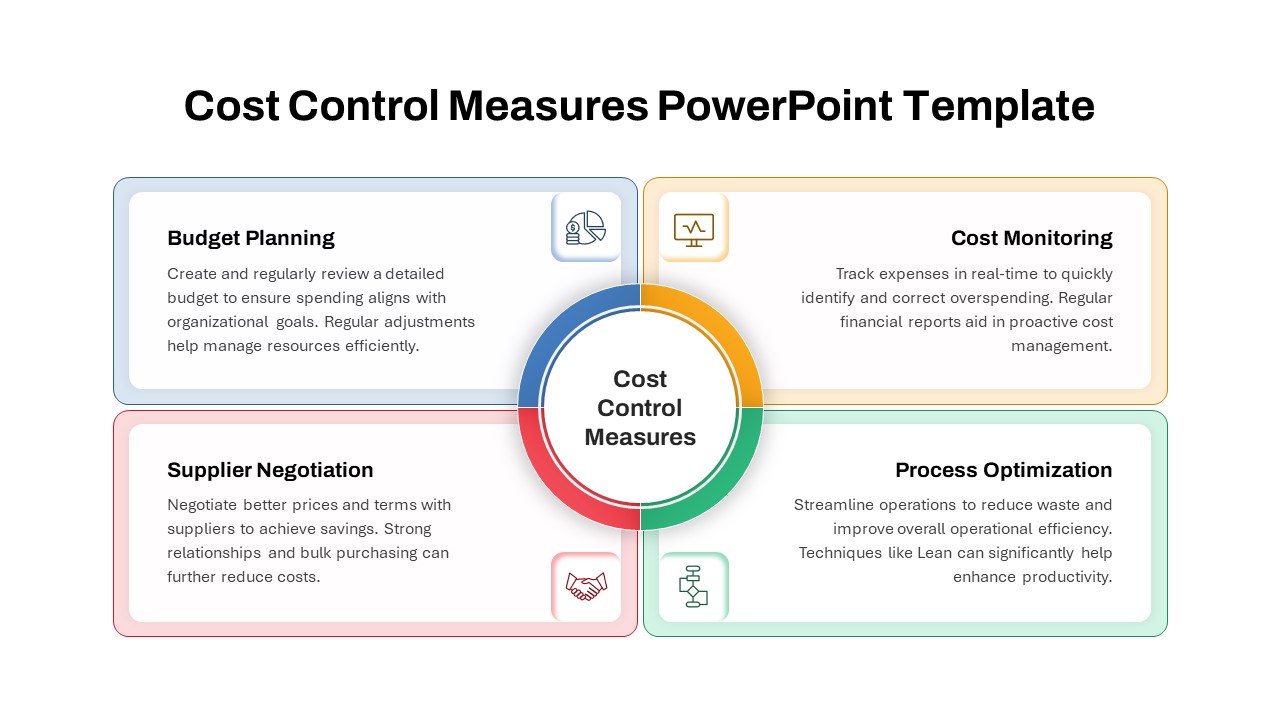
Cost Control Measures Infographic Template for PowerPoint & Google Slides
Circular
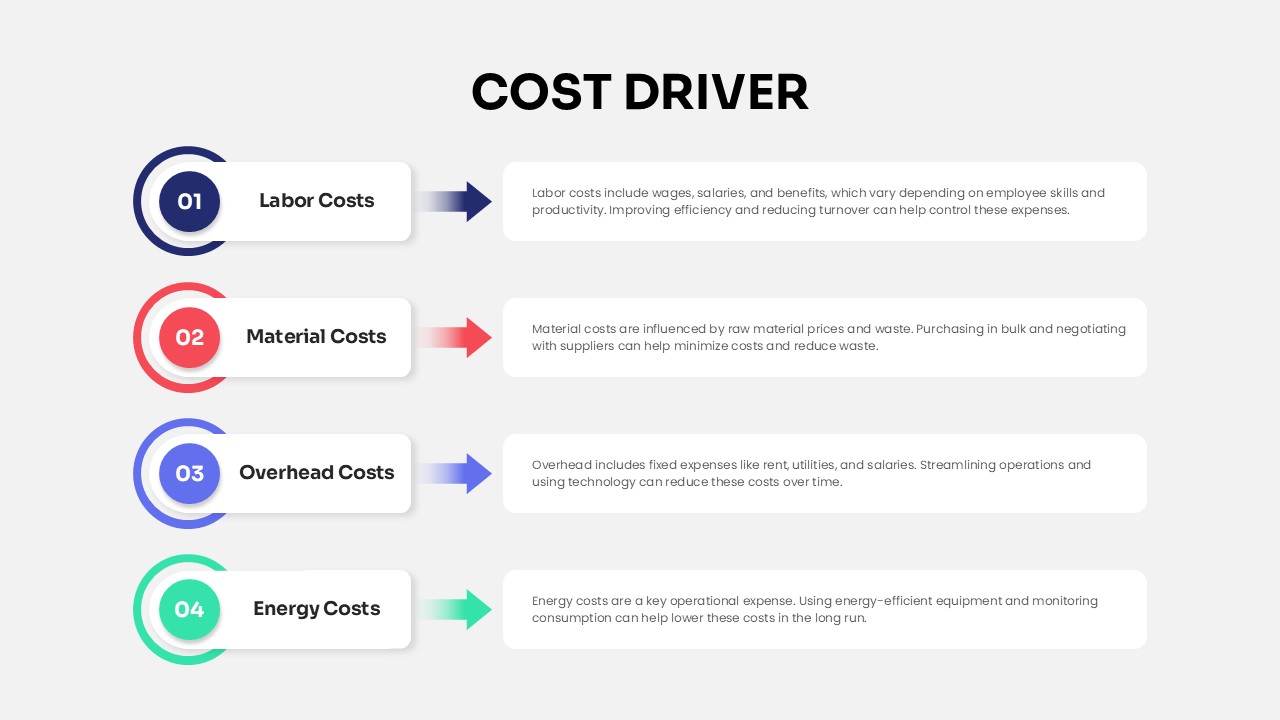
Cost Driver Infographic Slide Pack Template for PowerPoint & Google Slides
Process
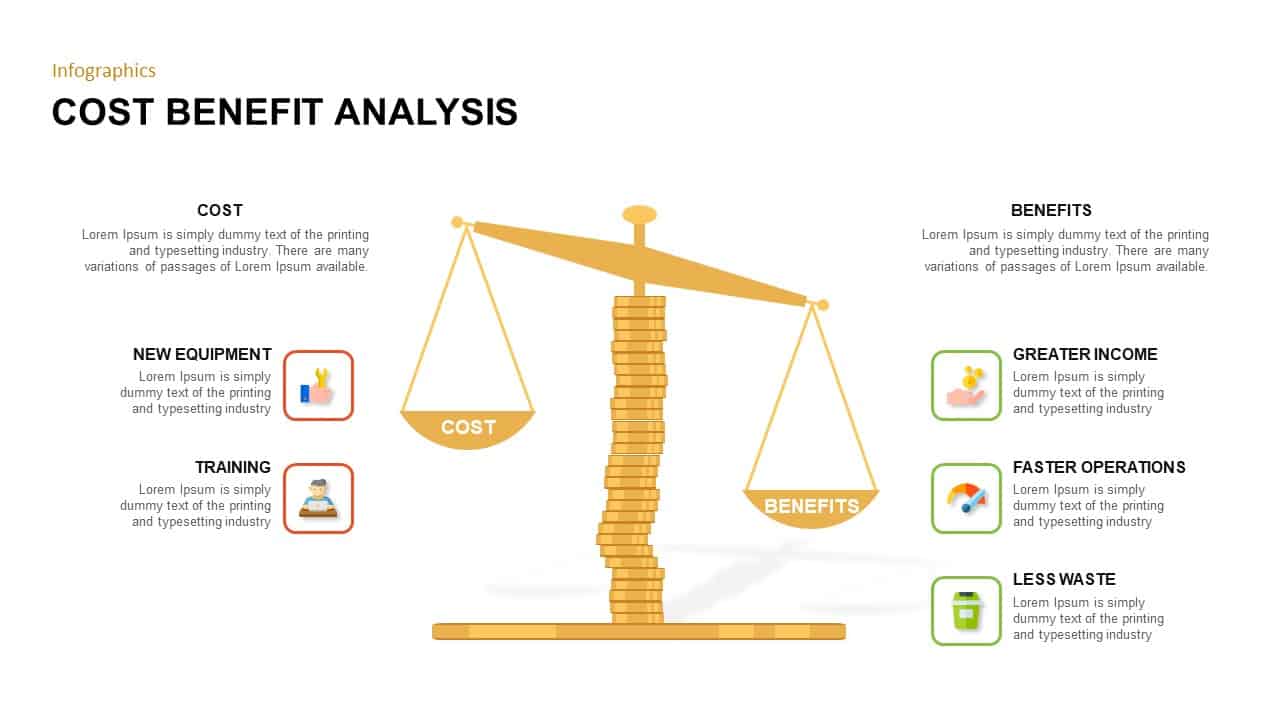
Cost Benefit Analysis infographic for PowerPoint & Google Slides
Comparison
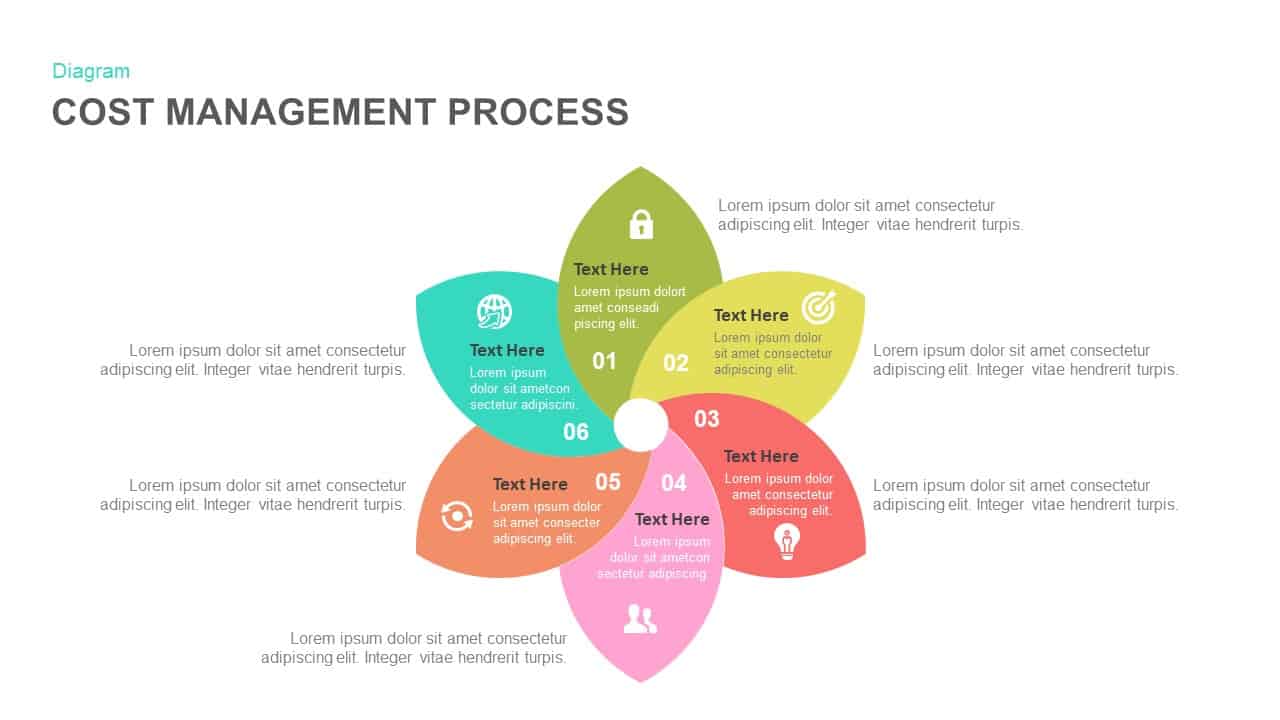
Cost Management Process template for PowerPoint & Google Slides
Process
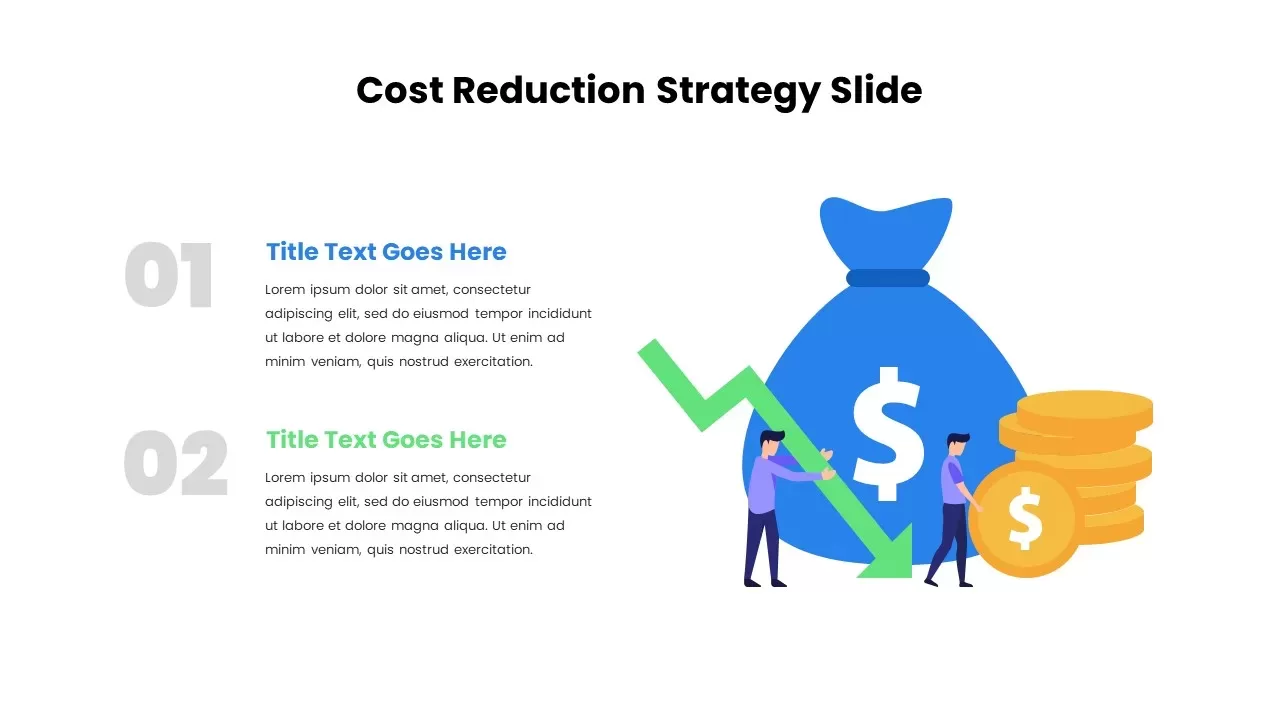
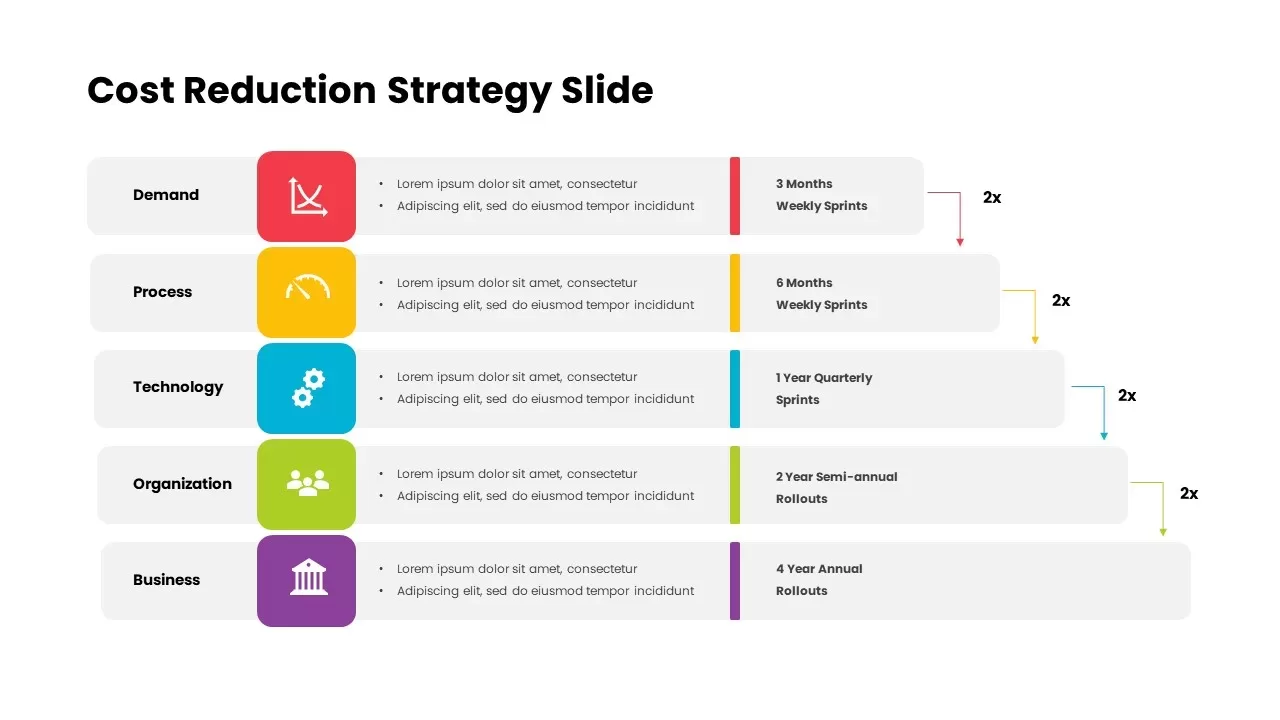
Cost Reduction Strategy template for PowerPoint & Google Slides
Business Strategy
Dual-Color Cost vs Benefit Analysis Template for PowerPoint & Google Slides
Comparison
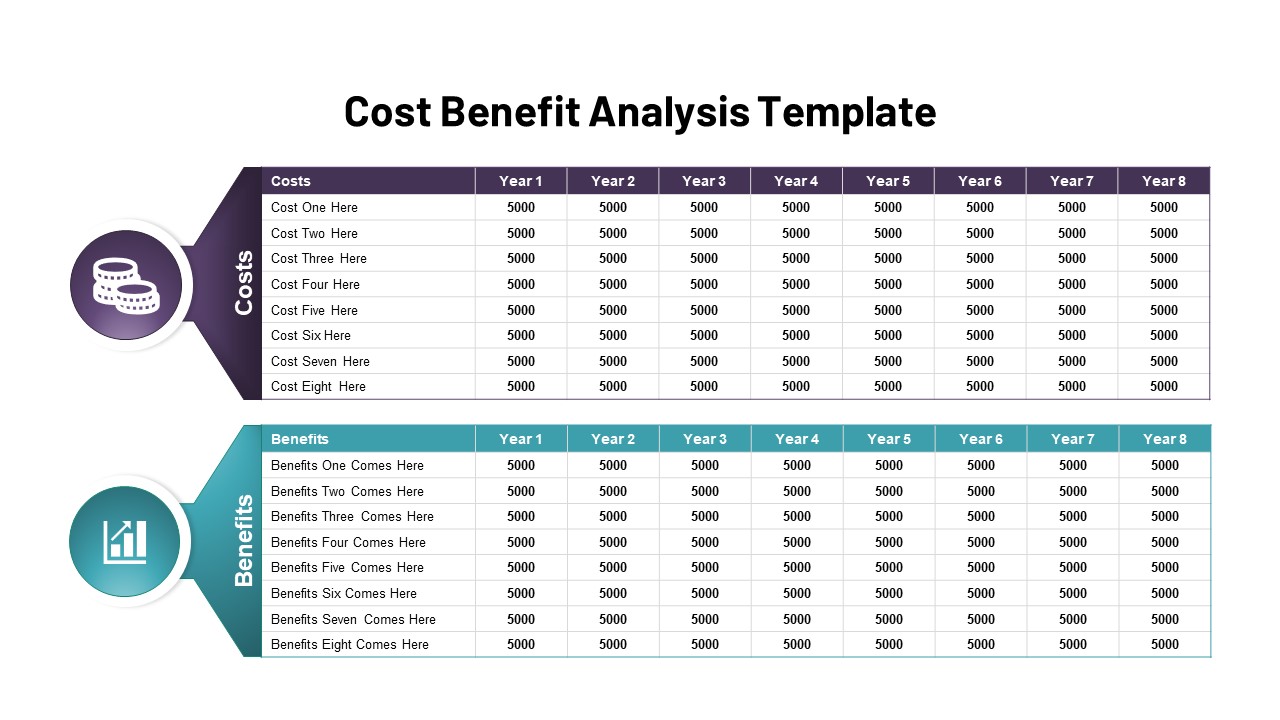
Cost Benefit Analysis Comparison Template for PowerPoint & Google Slides
Comparison
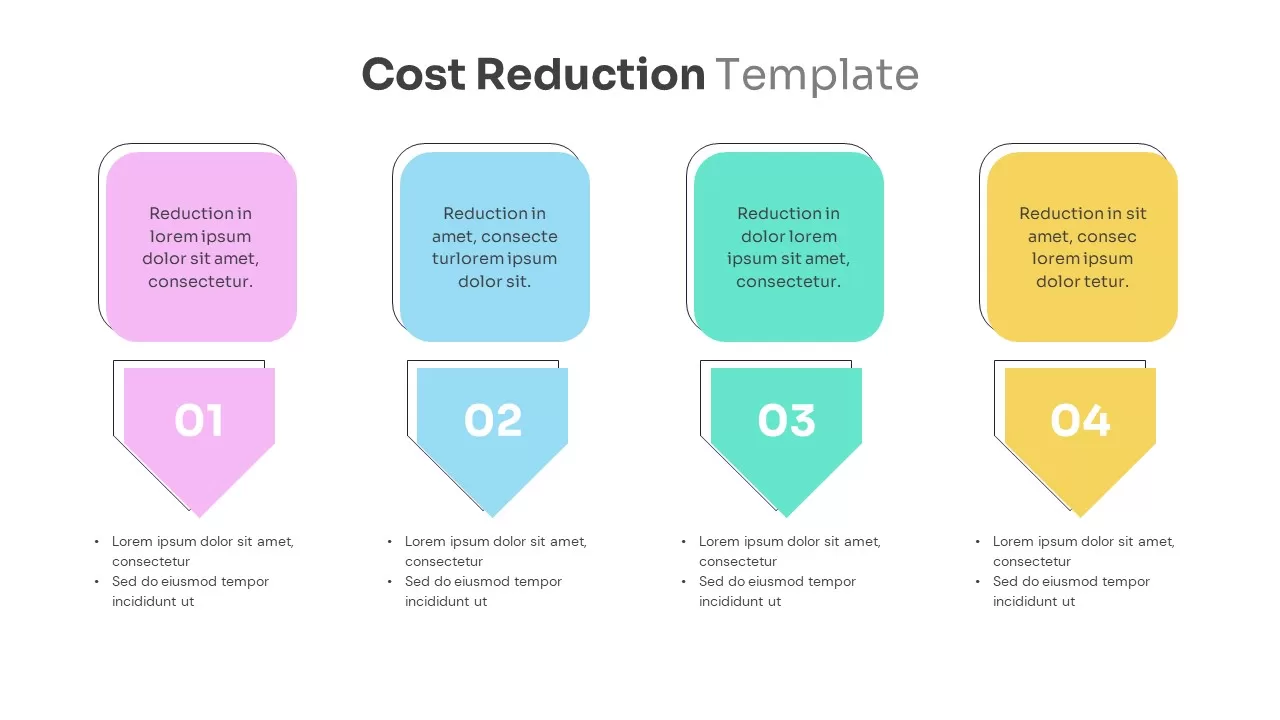
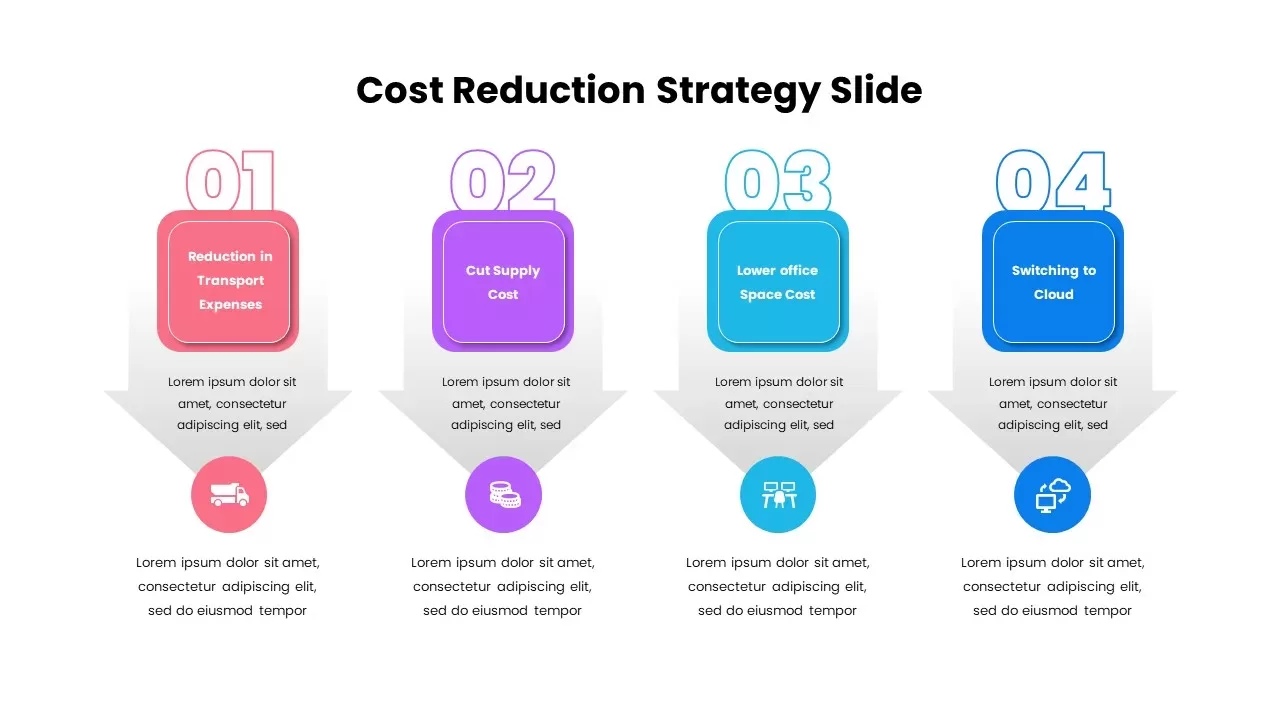
Four-Step Cost Reduction Strategy Template for PowerPoint & Google Slides
Process
Cost Reduction Strategy Donut Chart Template for PowerPoint & Google Slides
Pie/Donut
Cost Reduction Strategy Roadmap Template for PowerPoint & Google Slides
Business Strategy
Interactive Multi-Use Cost Comparison Template for PowerPoint & Google Slides
Comparison
Cost Cutting Savings Dashboard Template for PowerPoint & Google Slides
Pie/Donut
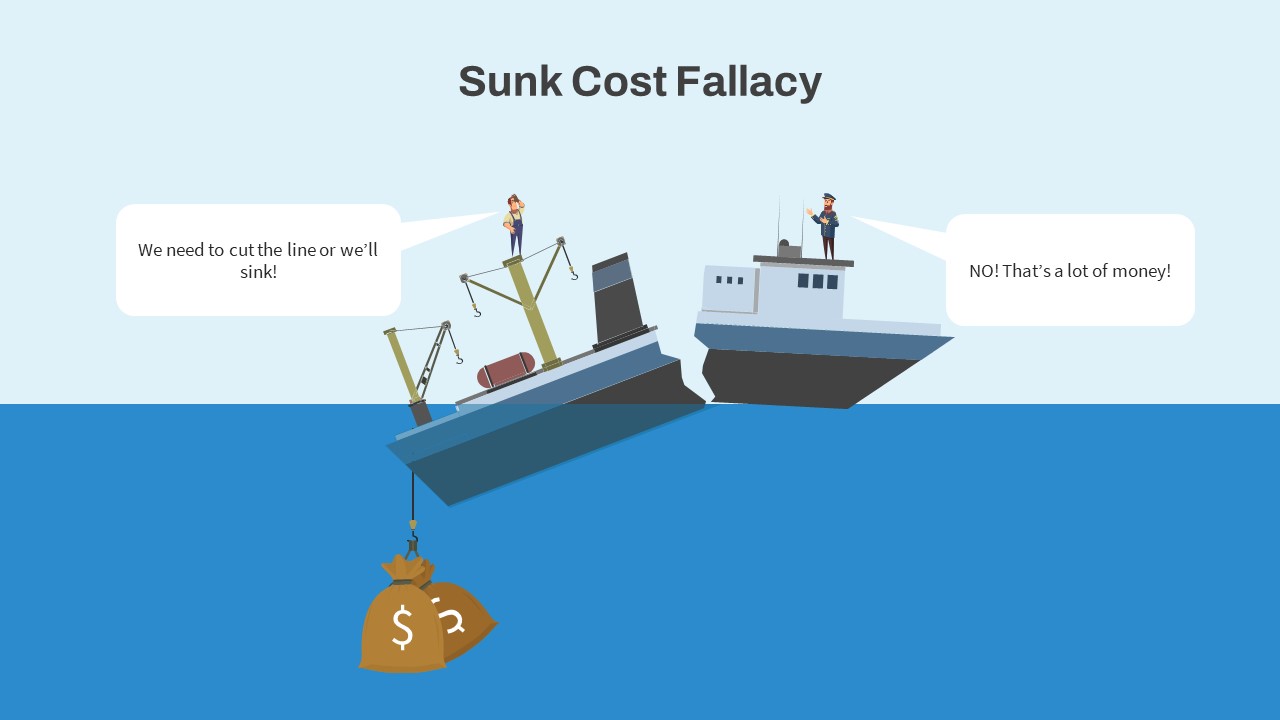
Sunk Cost Fallacy Dragging Anchor Slide Template for PowerPoint & Google Slides
Infographics
Cost-Volume-Profit Analysis Diagram Template for PowerPoint & Google Slides
Finance
Economies of Scale Cost Curve Comparison Template for PowerPoint & Google Slides
Comparison Chart
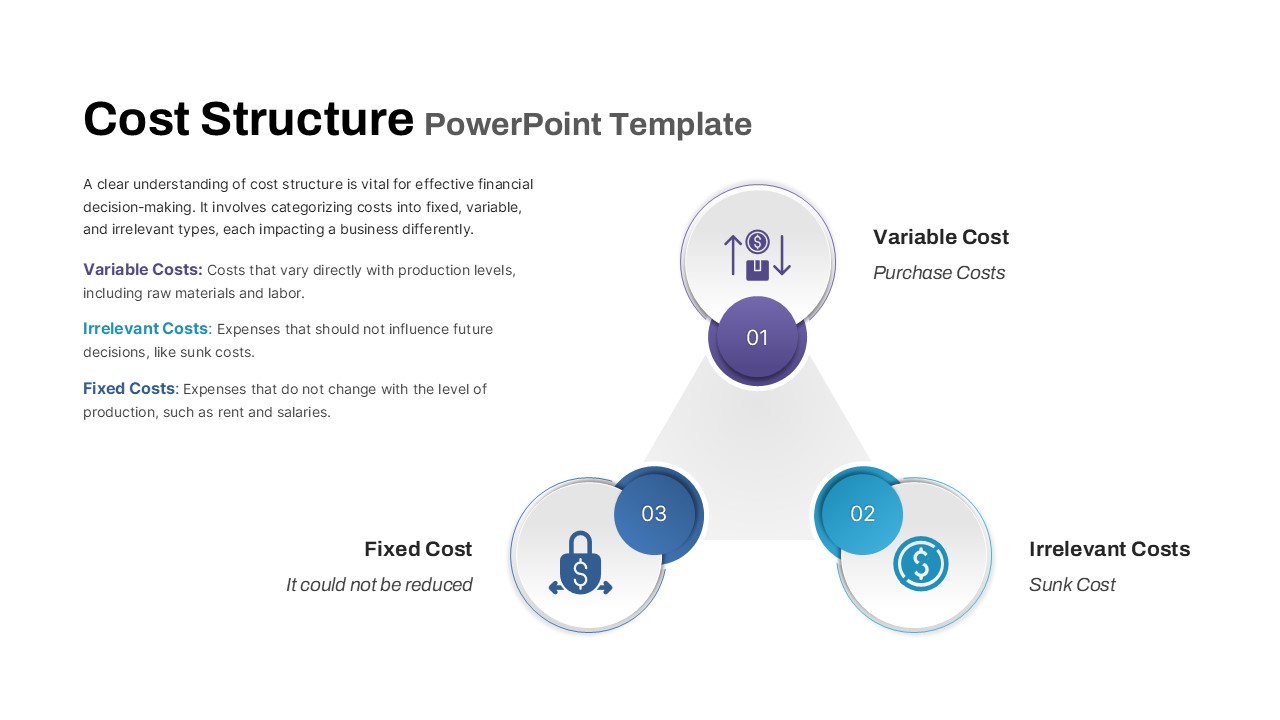
Cost Structure Triangle Diagram Template for PowerPoint & Google Slides
Finance
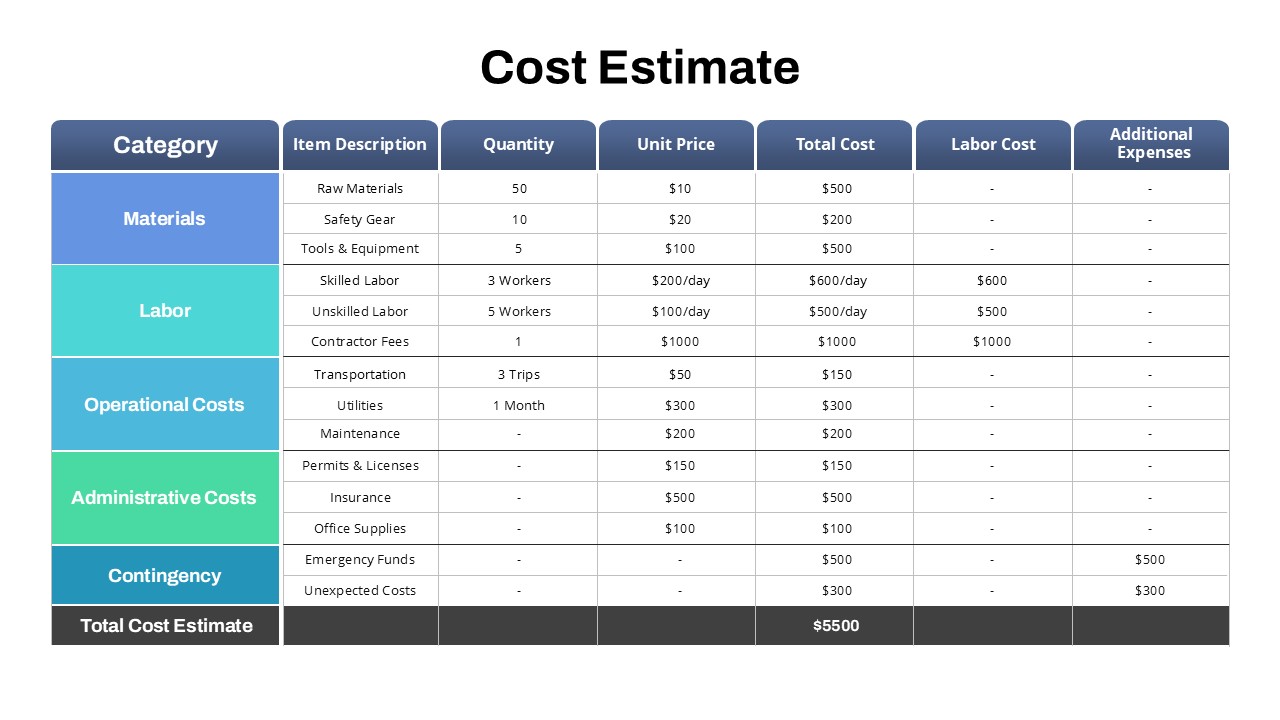
Project Detailed Cost Estimate Table Template for PowerPoint & Google Slides
Project
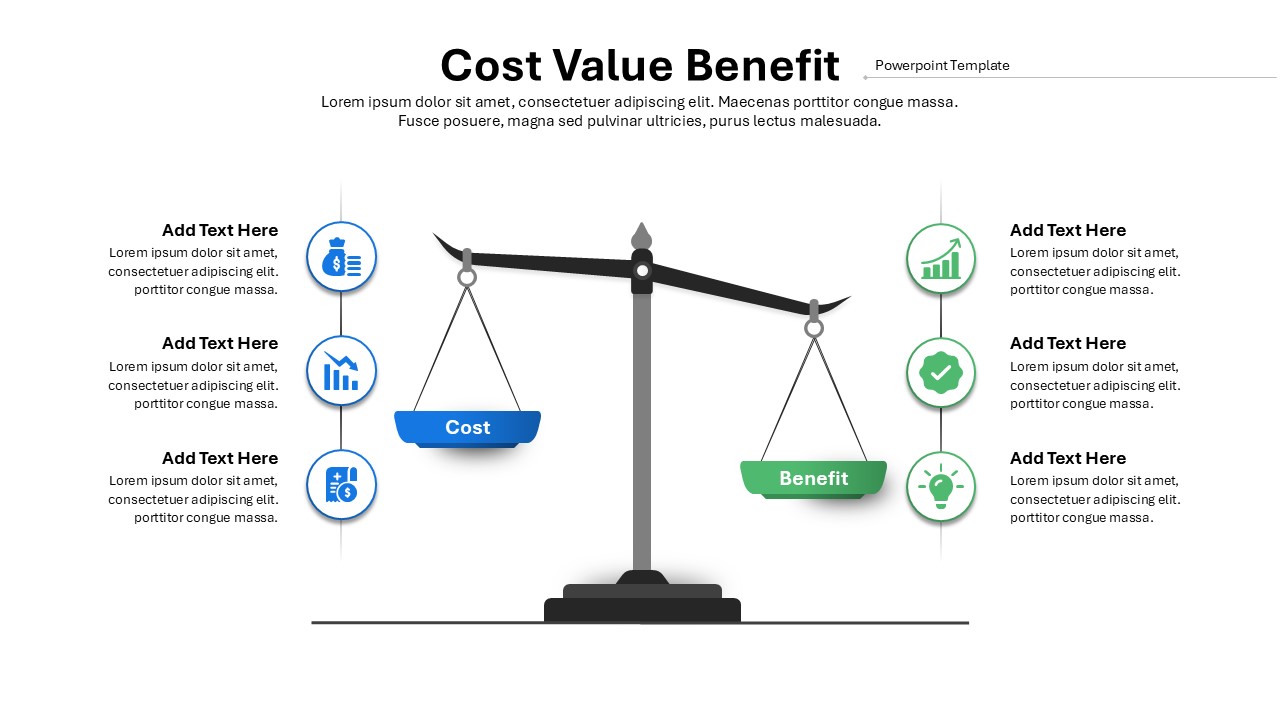
Cost vs Benefit template for PowerPoint & Google Slides
Charts
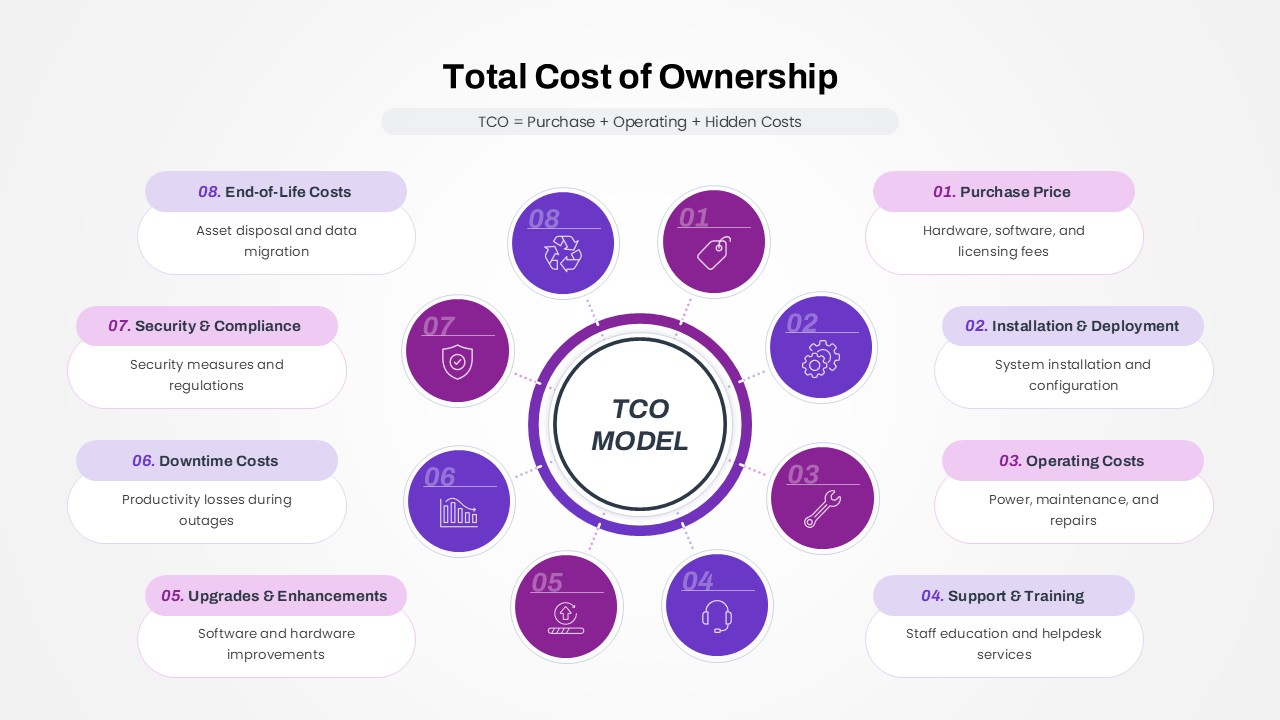
Total Cost of Ownership (TCO) Model template for PowerPoint & Google Slides
Business
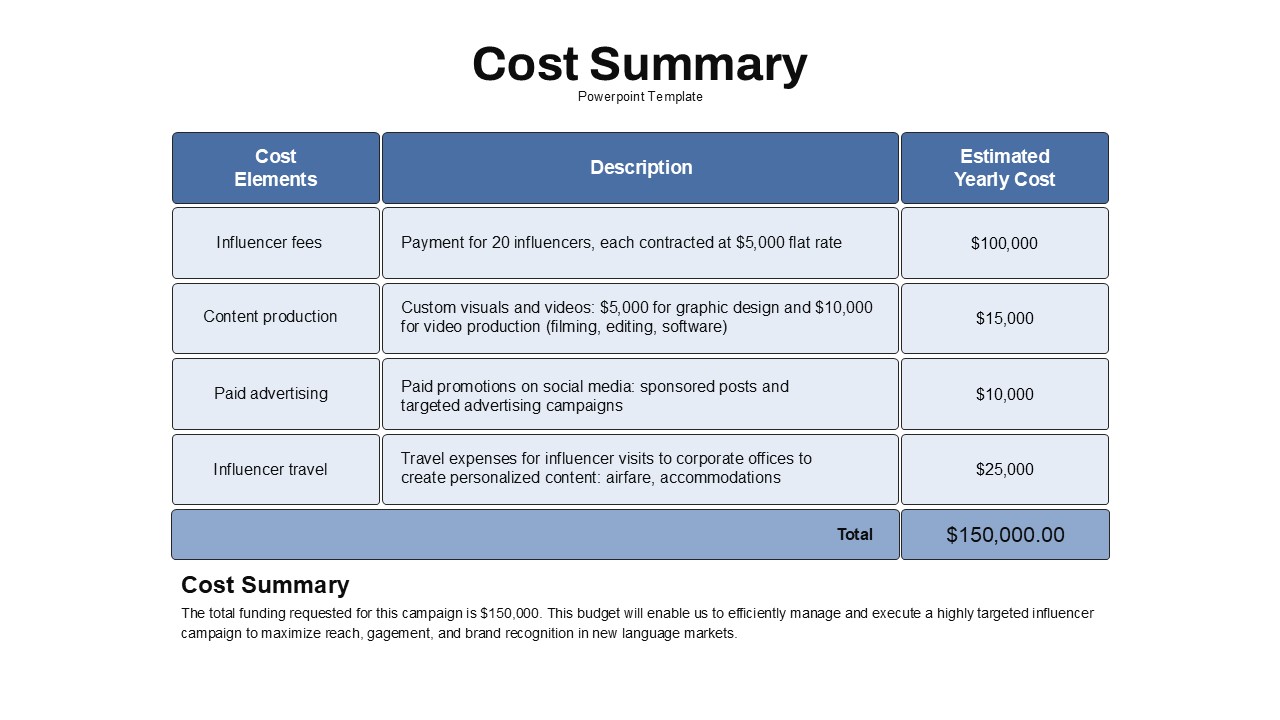
Cost Summary Table Template for PowerPoint & Google Slides
Business Report
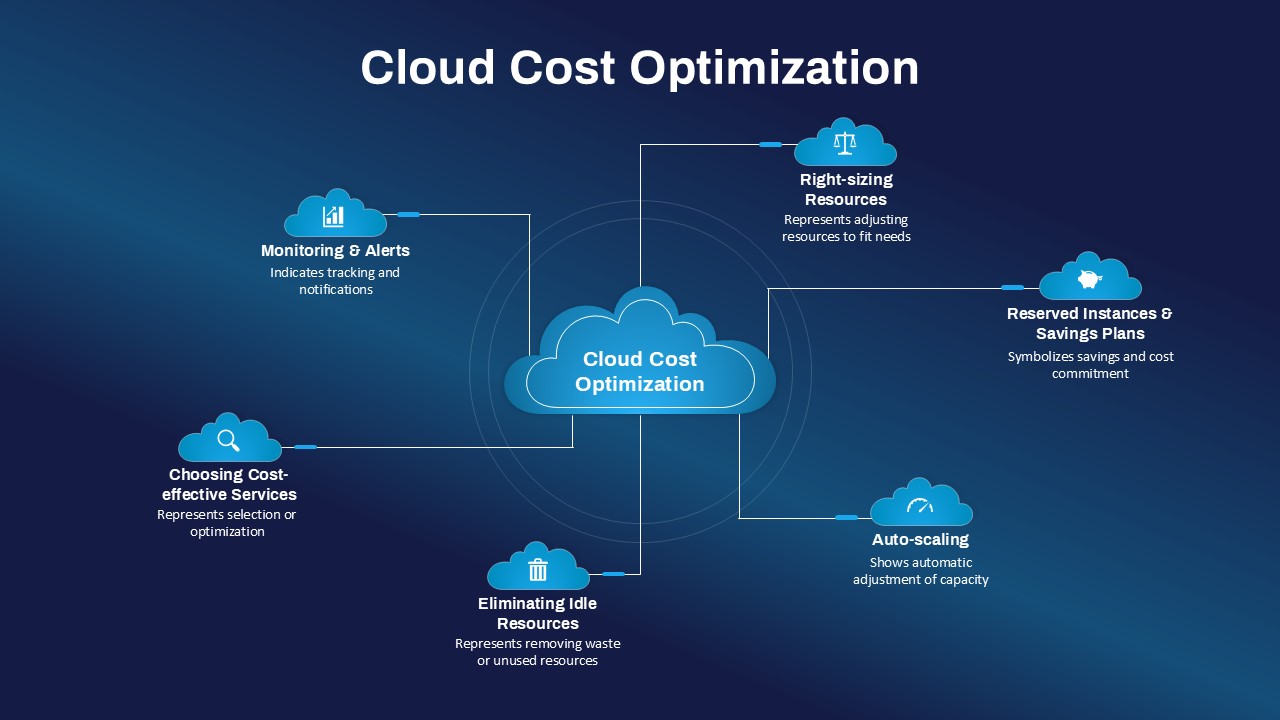
Cloud Cost Optimization Hub-and-Spoke Template for PowerPoint & Google Slides
Cloud Computing

Key Metaphor Infographic Slide Template for PowerPoint & Google Slides
Process
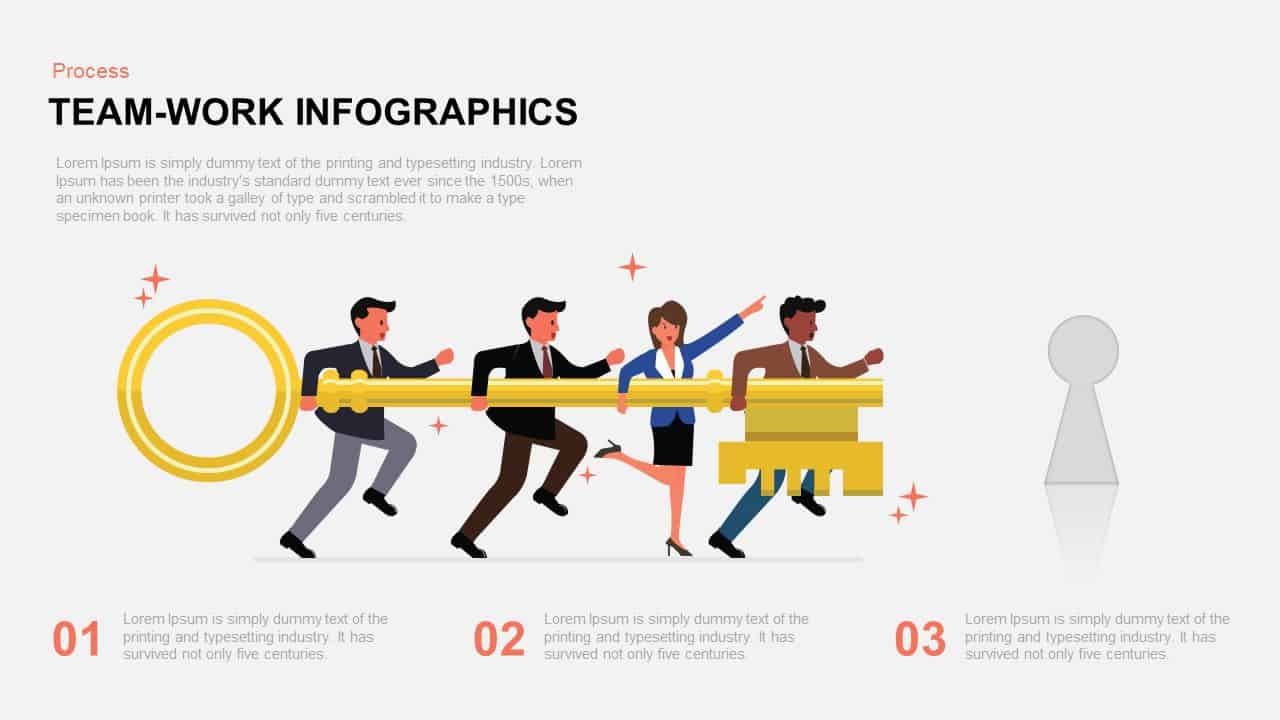
Teamwork Key Infographic Slide Template for PowerPoint & Google Slides
Process
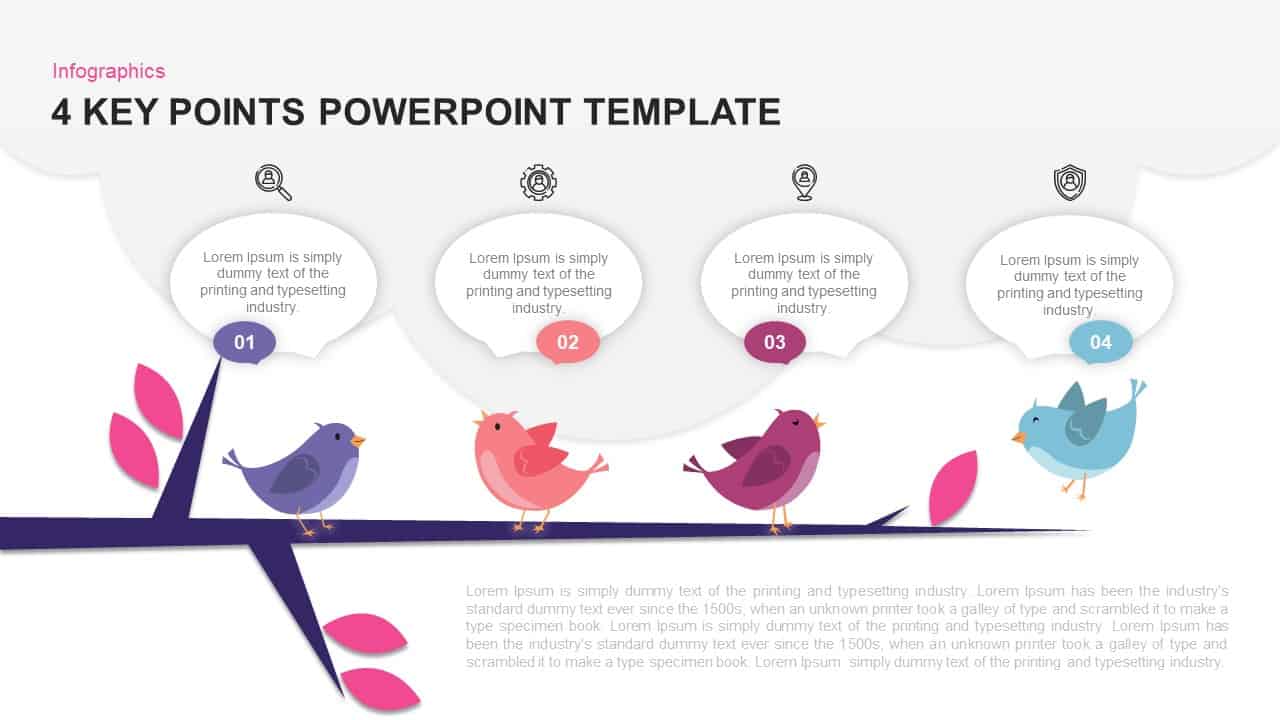
Bird Branch Four Key Points Infographic Template for PowerPoint & Google Slides
Agenda
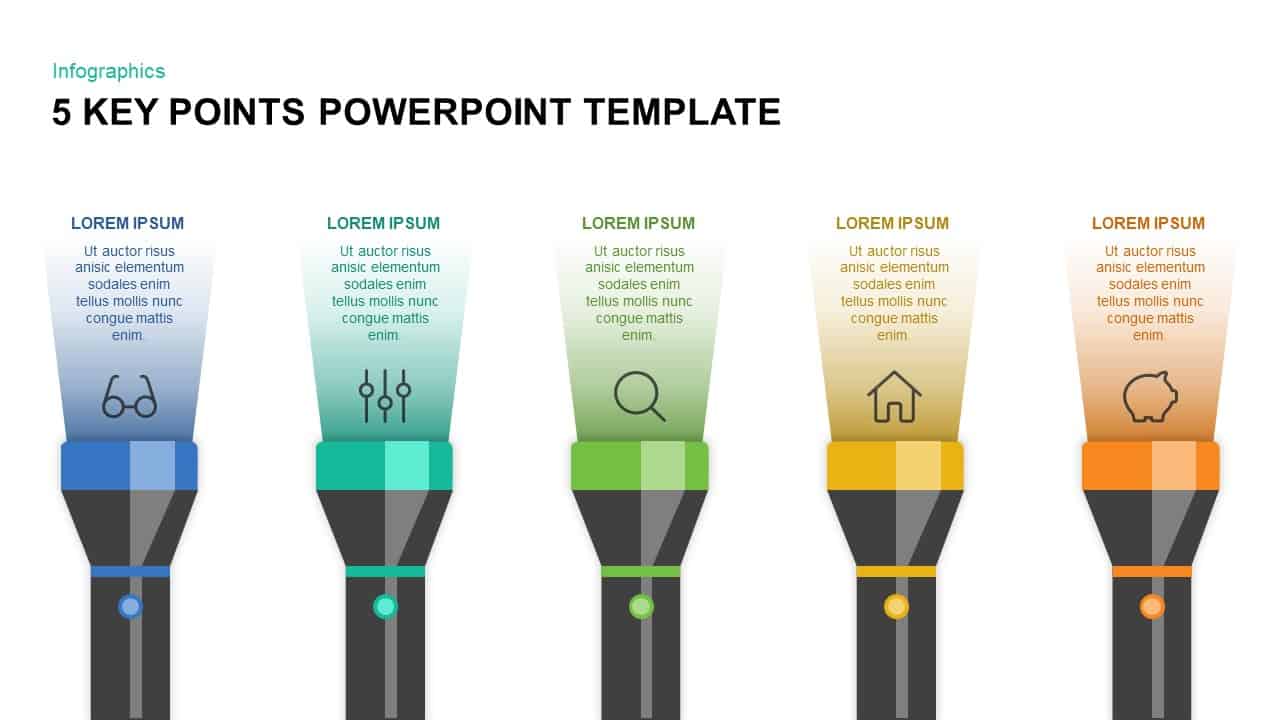
Five Key Flashlight Infographic Points Template for PowerPoint & Google Slides
Agenda
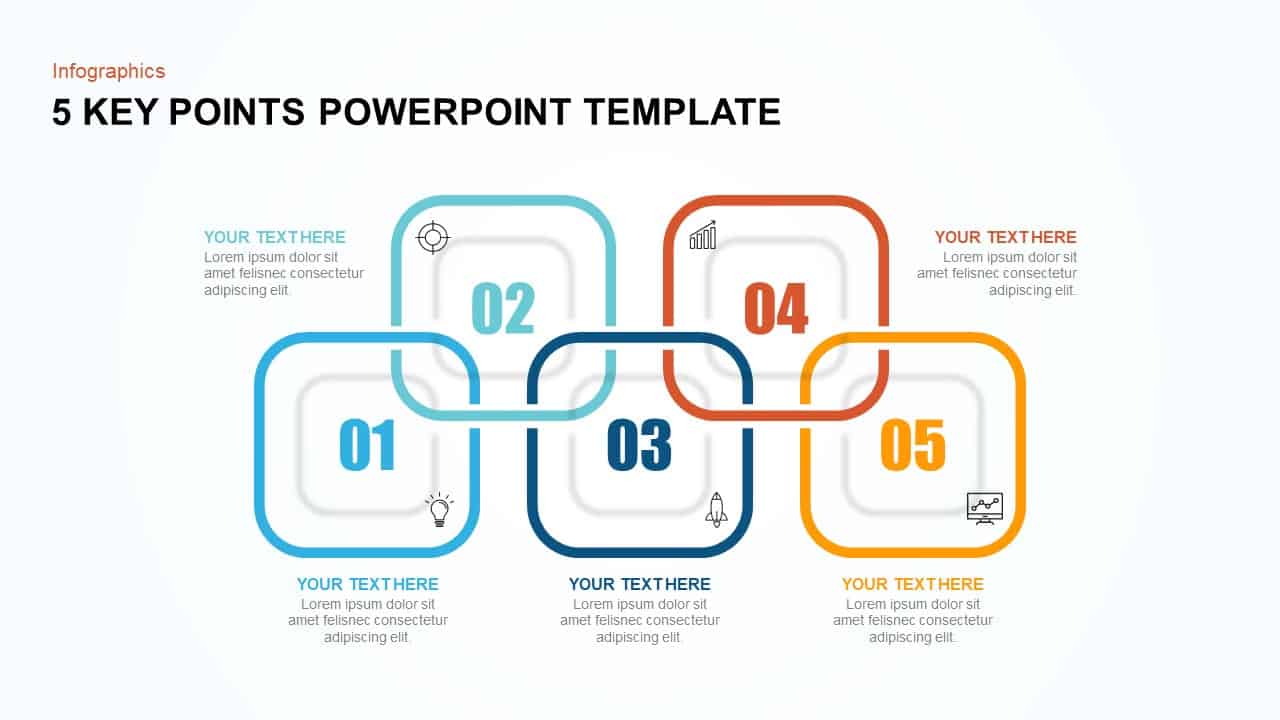
5 Key Points Infographic Diagram Template for PowerPoint & Google Slides
Process
Key Takeaway Slide Infographic Template for PowerPoint & Google Slides
Process
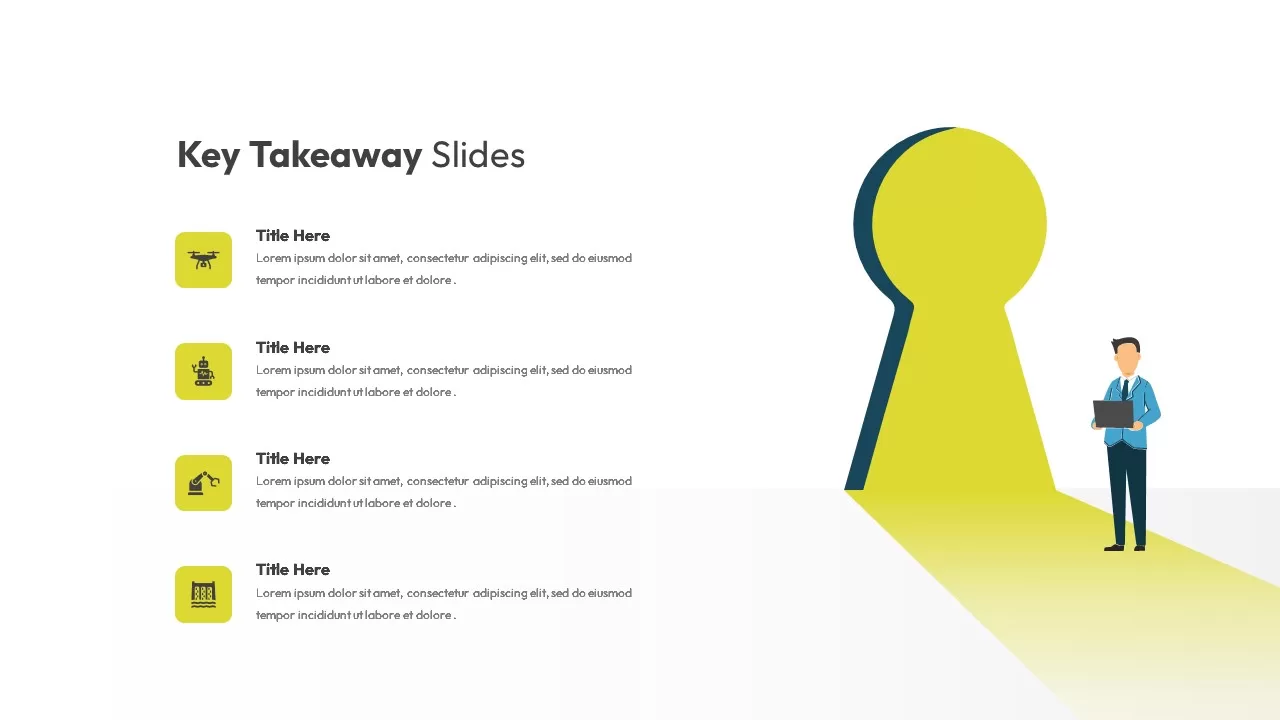
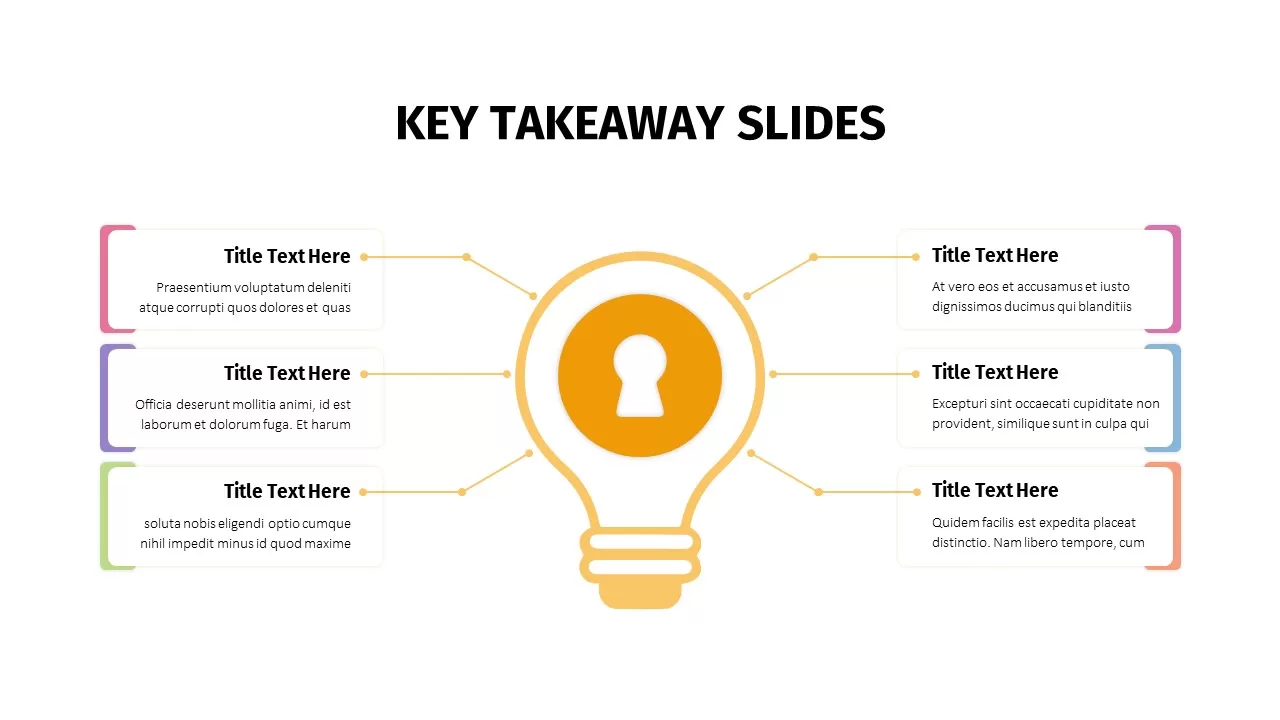
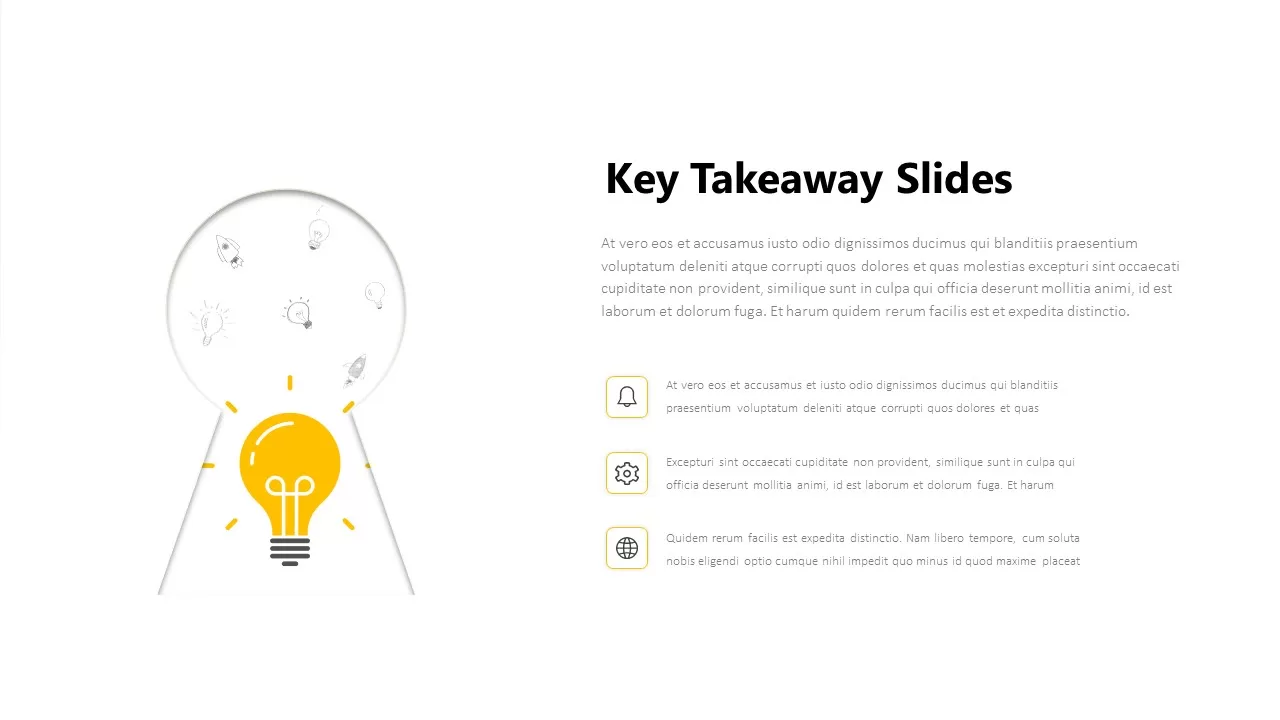
Key Takeaway Infographic Keyhole Diagram Template for PowerPoint & Google Slides
Process
Key Takeaway Infographic Slide Deck Template for PowerPoint & Google Slides
Process
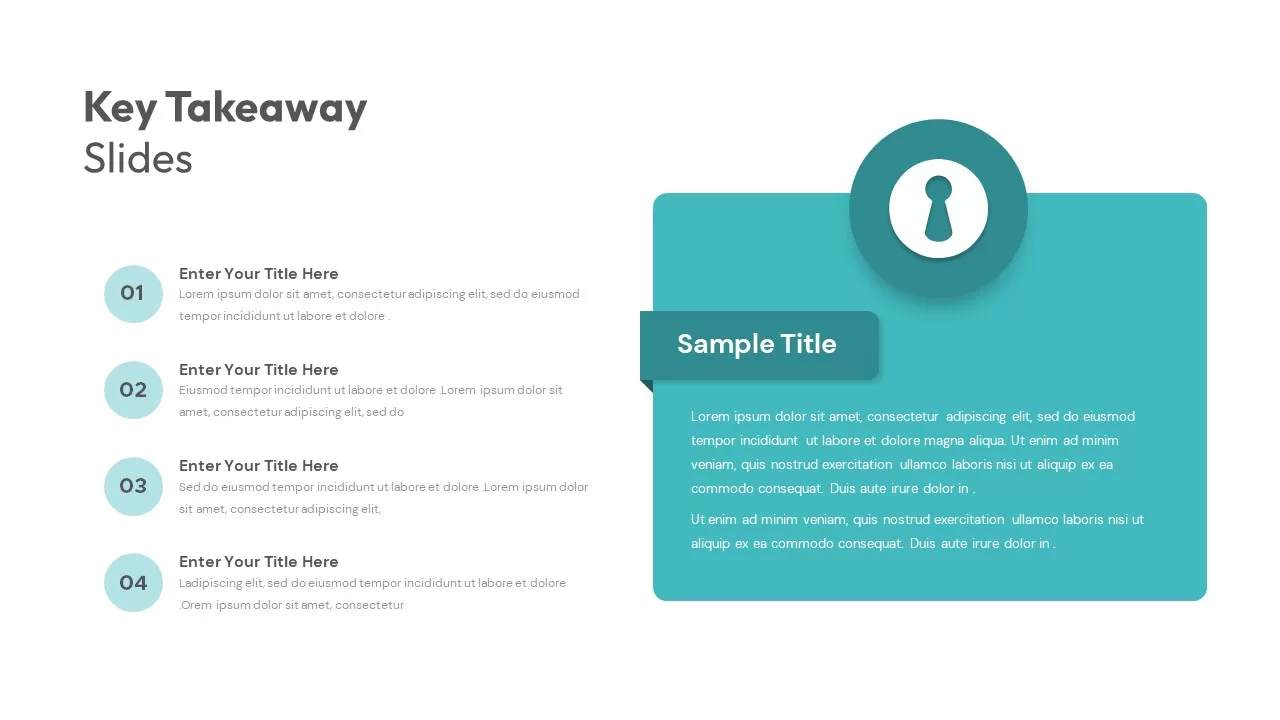
Key Takeaway Keyhole Infographic Slide Template for PowerPoint & Google Slides
Process
Animated Key Takeaway Spoke Infographic Template for PowerPoint & Google Slides
Infographics
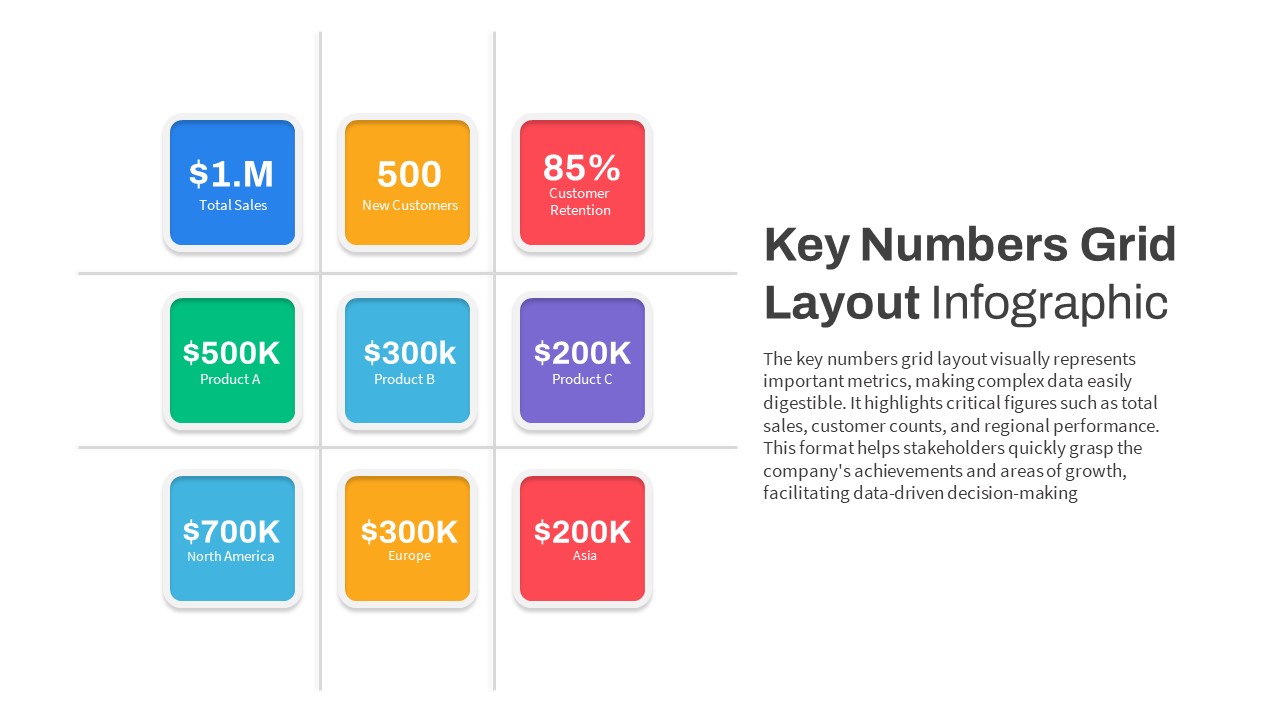
Key Numbers Grid Layout Infographic Template for PowerPoint & Google Slides
Business Report
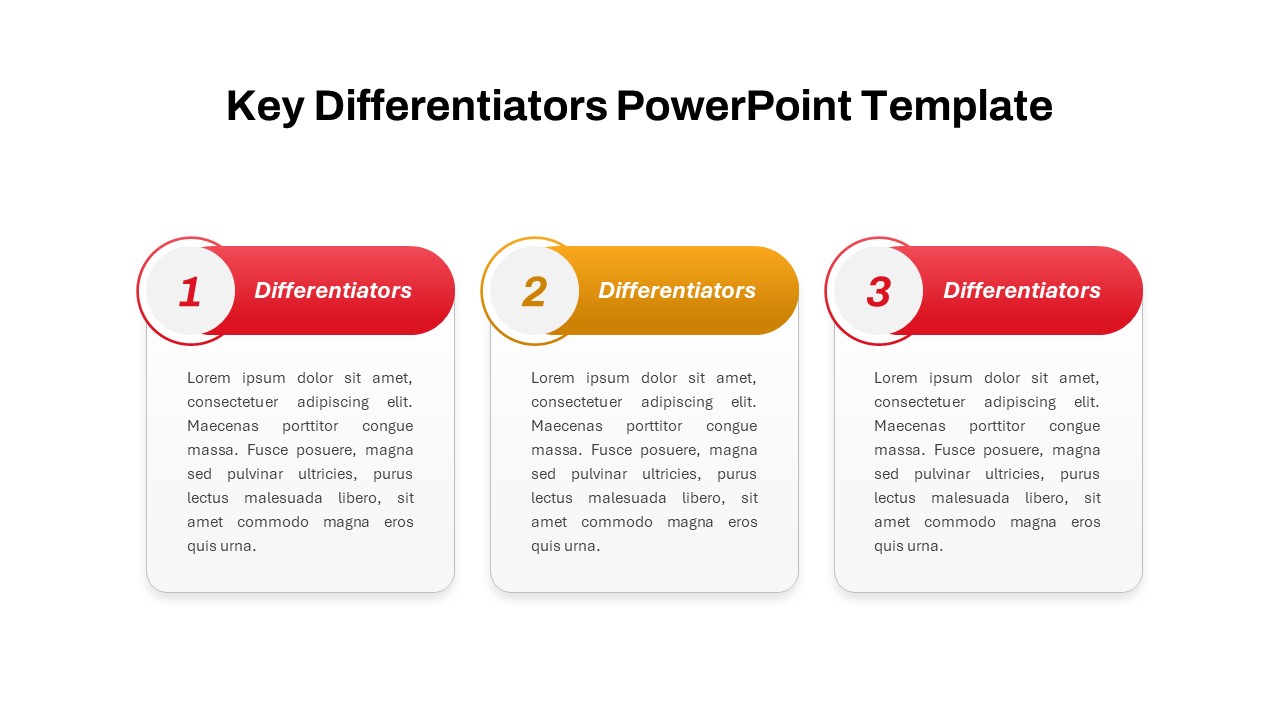
Key Differentiators Infographic Template for PowerPoint & Google Slides
Process
Success Key Diagram with Donut Chart Template for PowerPoint & Google Slides
Pie/Donut
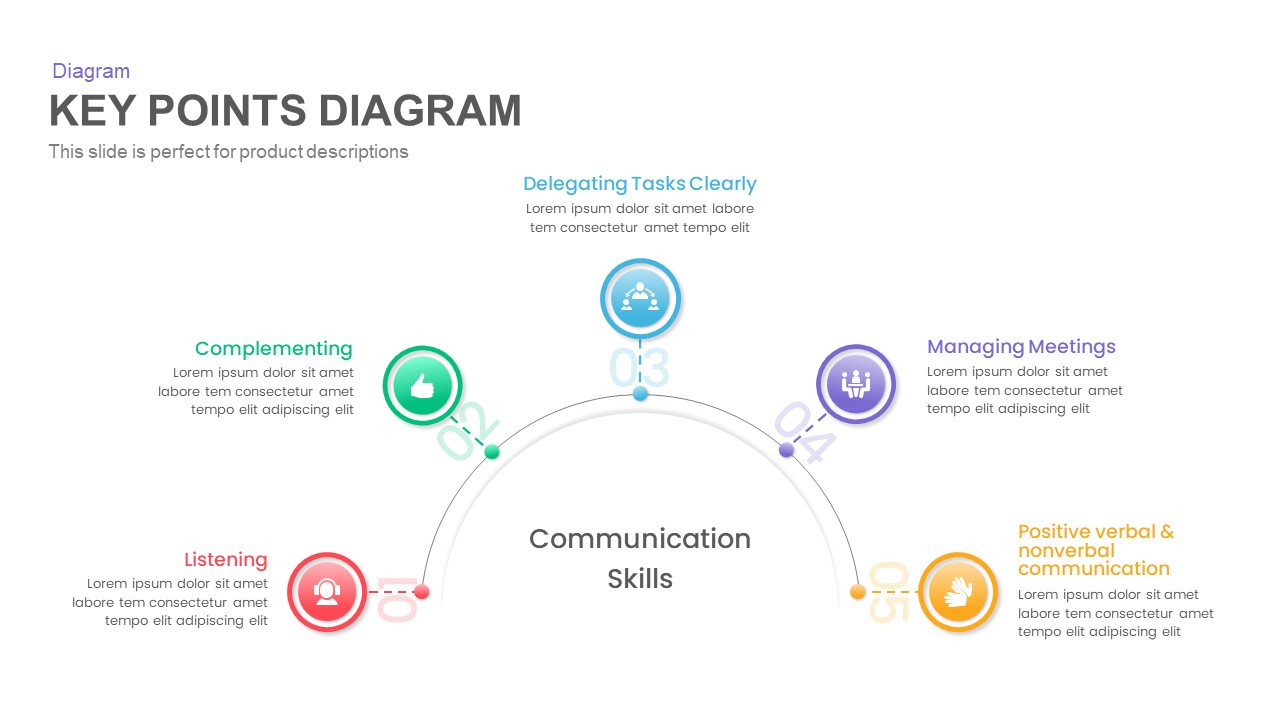
Dynamic Key Points Diagram Template for PowerPoint & Google Slides
Process
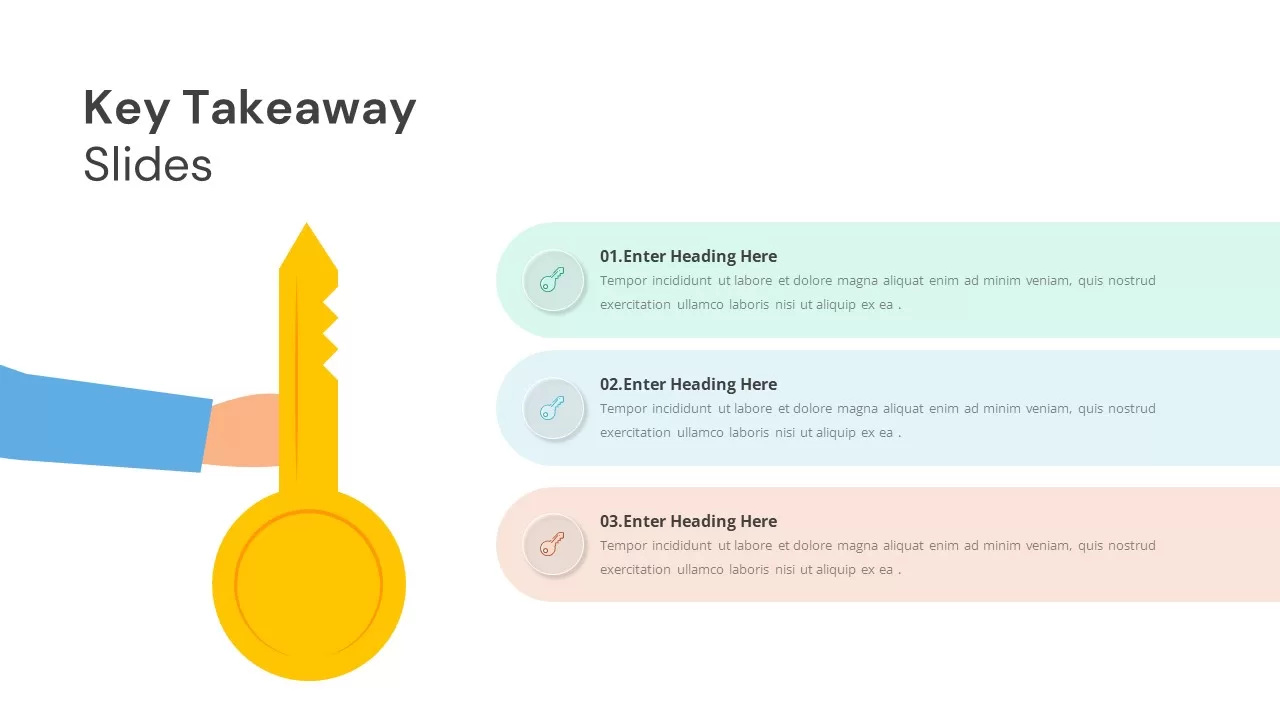
Key Takeaway Slide Template for PowerPoint & Google Slides
Process
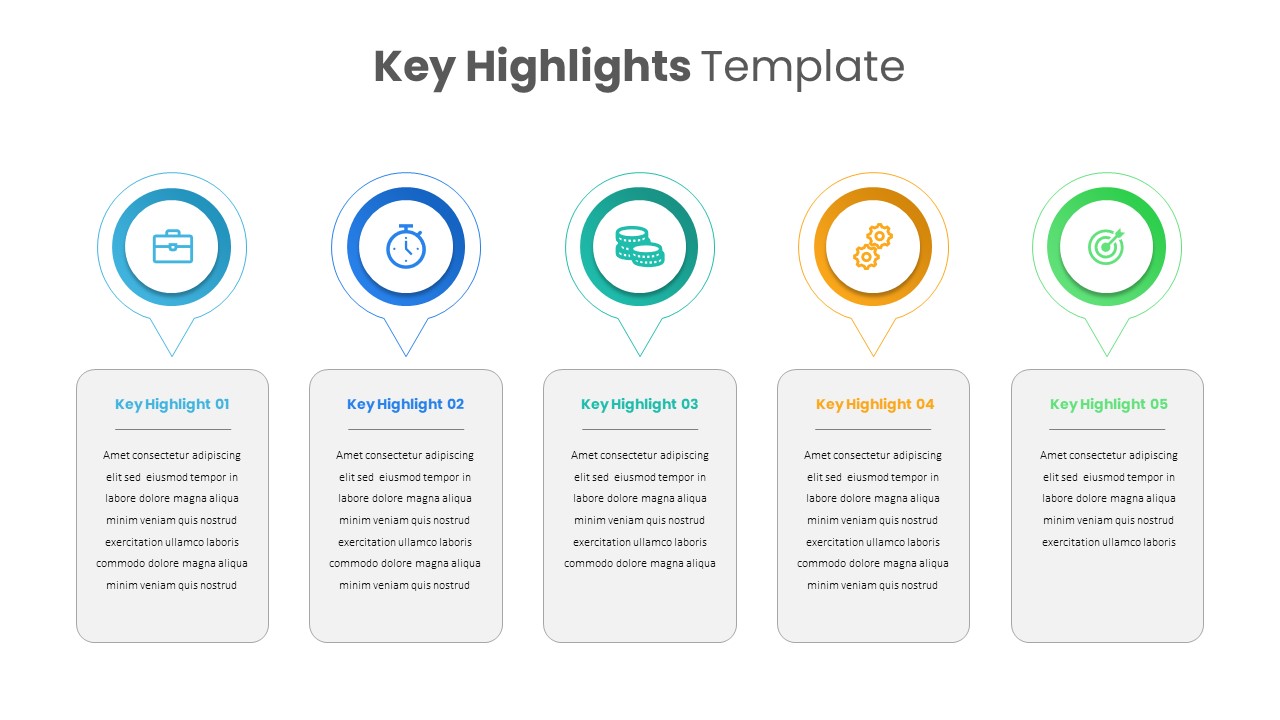
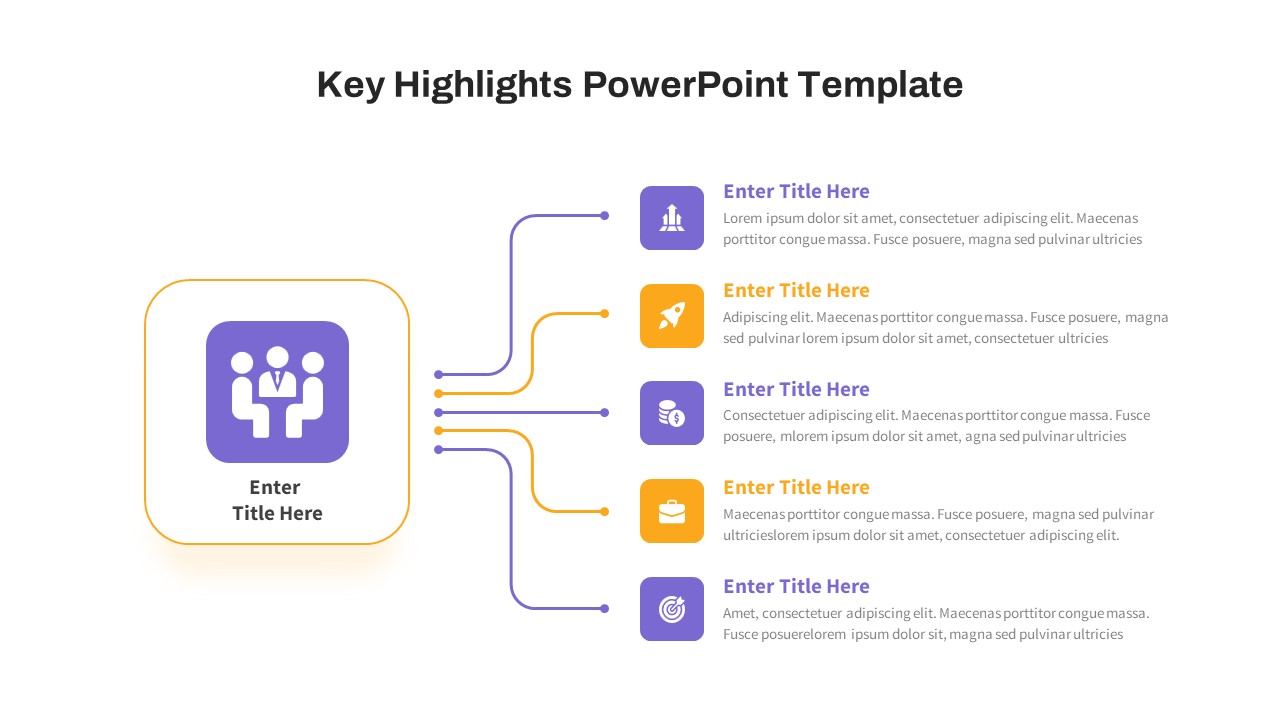
Professional Key Highlights Layout Template for PowerPoint & Google Slides
Business
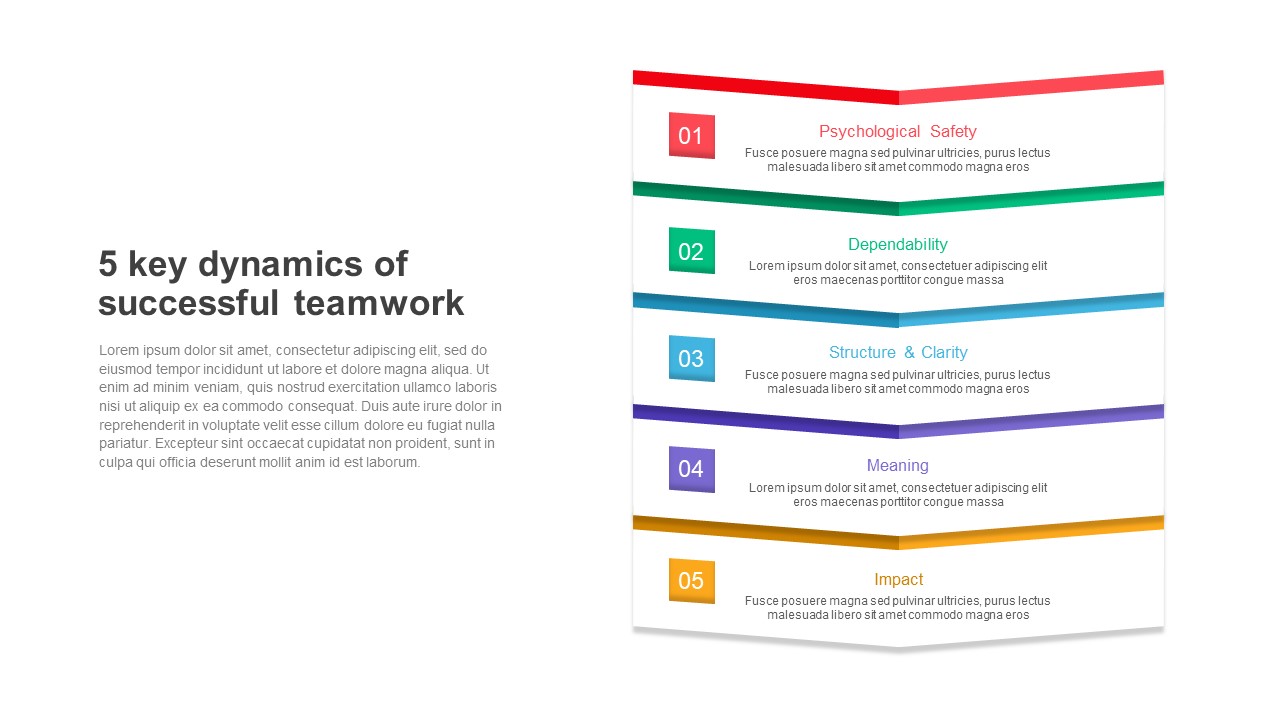
5 Key Dynamics of Successful Teamwork Template for PowerPoint & Google Slides
Process
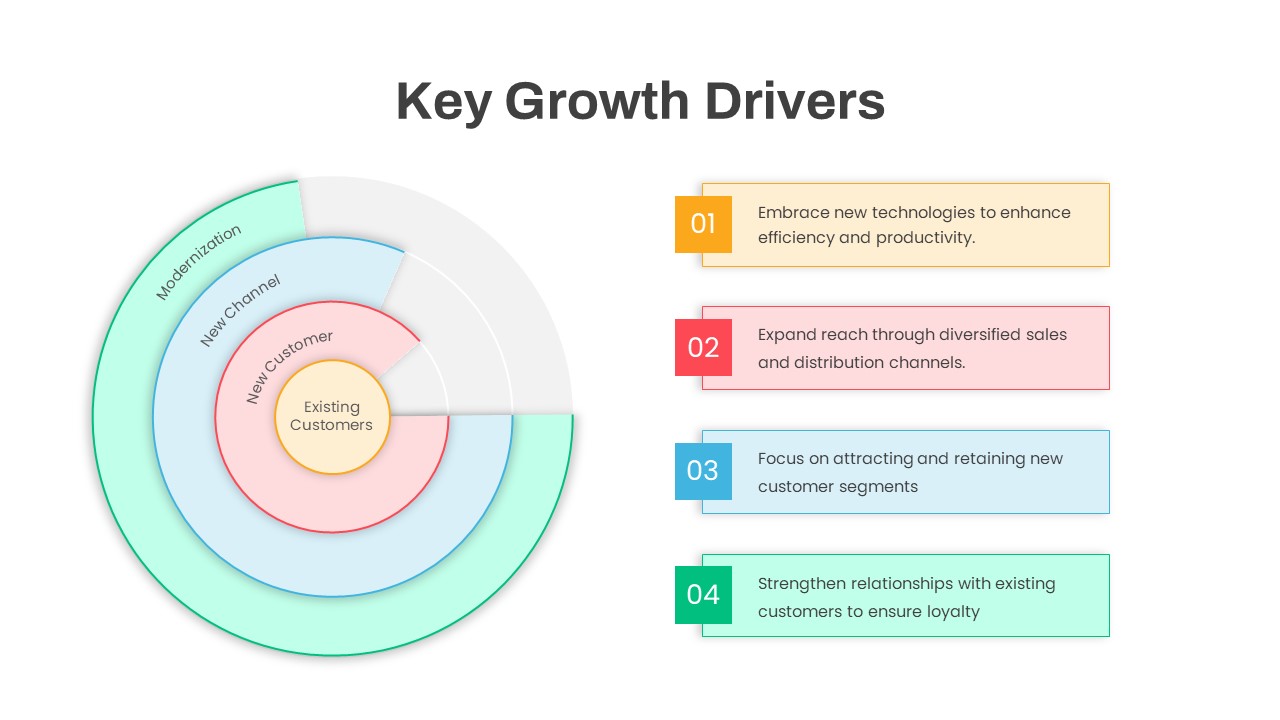
Circular Key Growth Drivers Diagram Template for PowerPoint & Google Slides
Circular
Free Key Economics Concepts & Diagrams Template for PowerPoint & Google Slides
Decks
Free
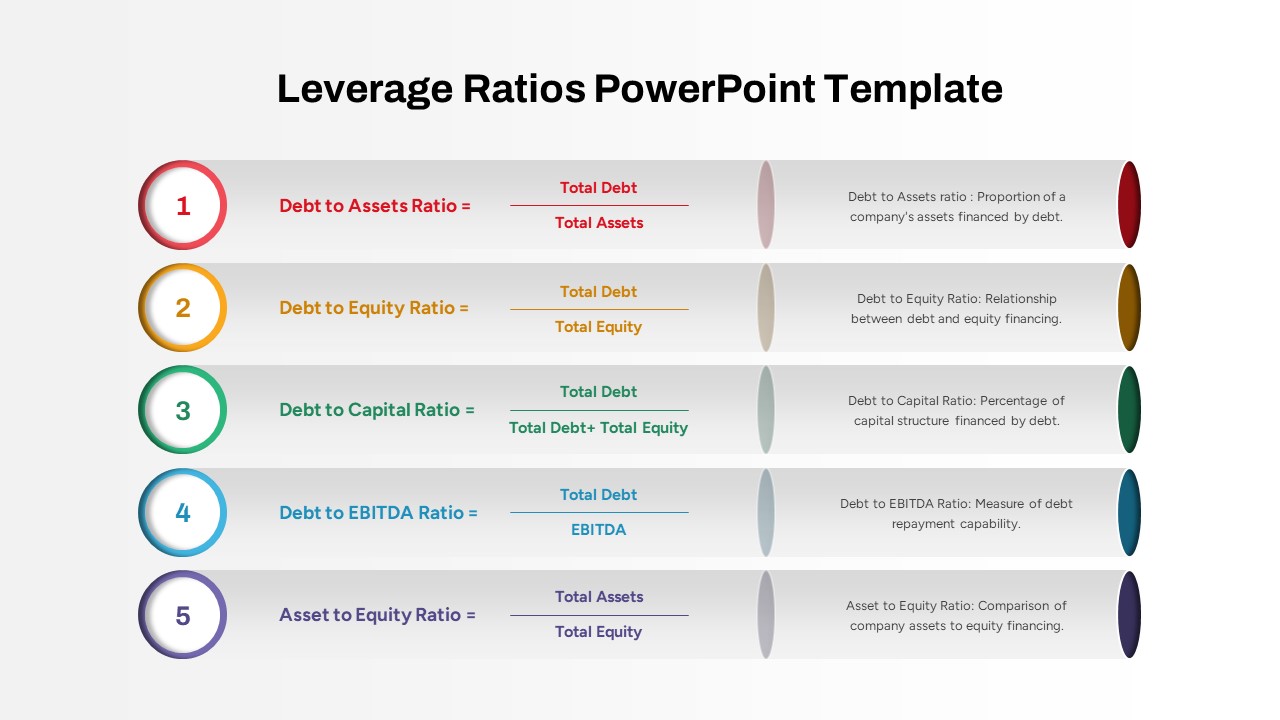
Five Key Leverage Ratios Overview Template for PowerPoint & Google Slides
Finance
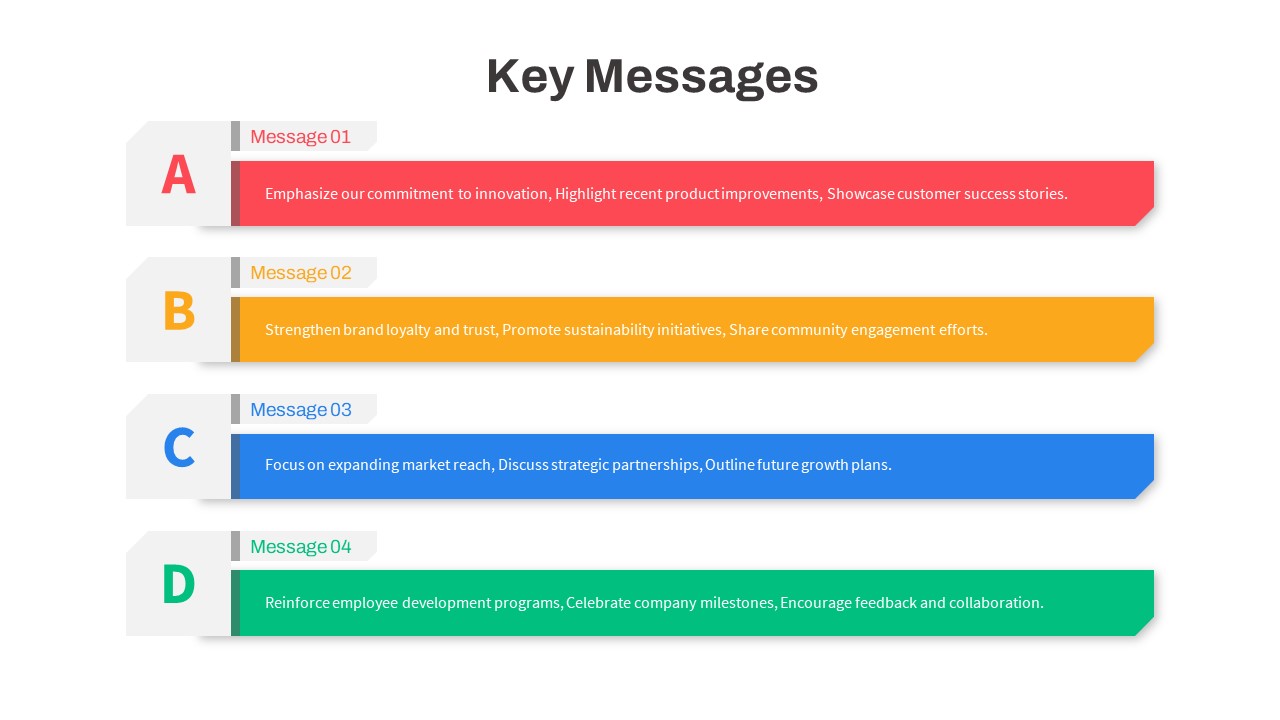
Color-Coded Corporate Key Messages Template for PowerPoint & Google Slides
Process
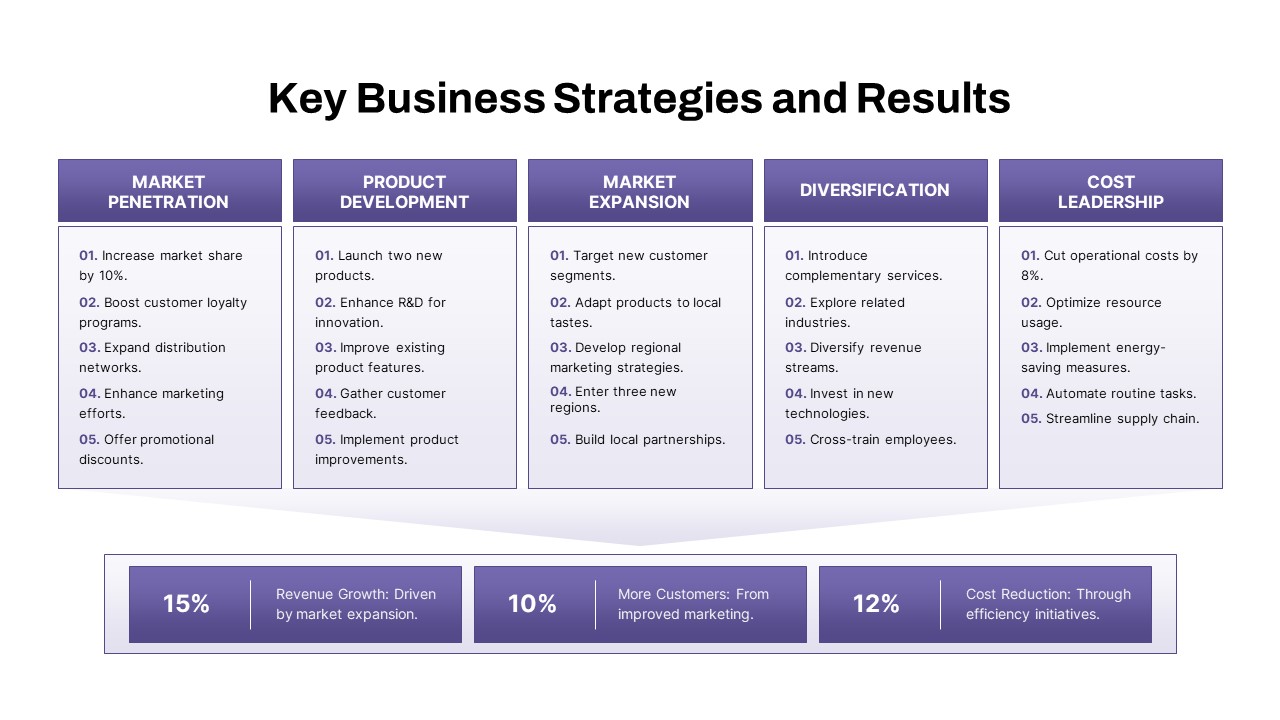
Key Business Strategies and Results Template for PowerPoint & Google Slides
Business Strategy
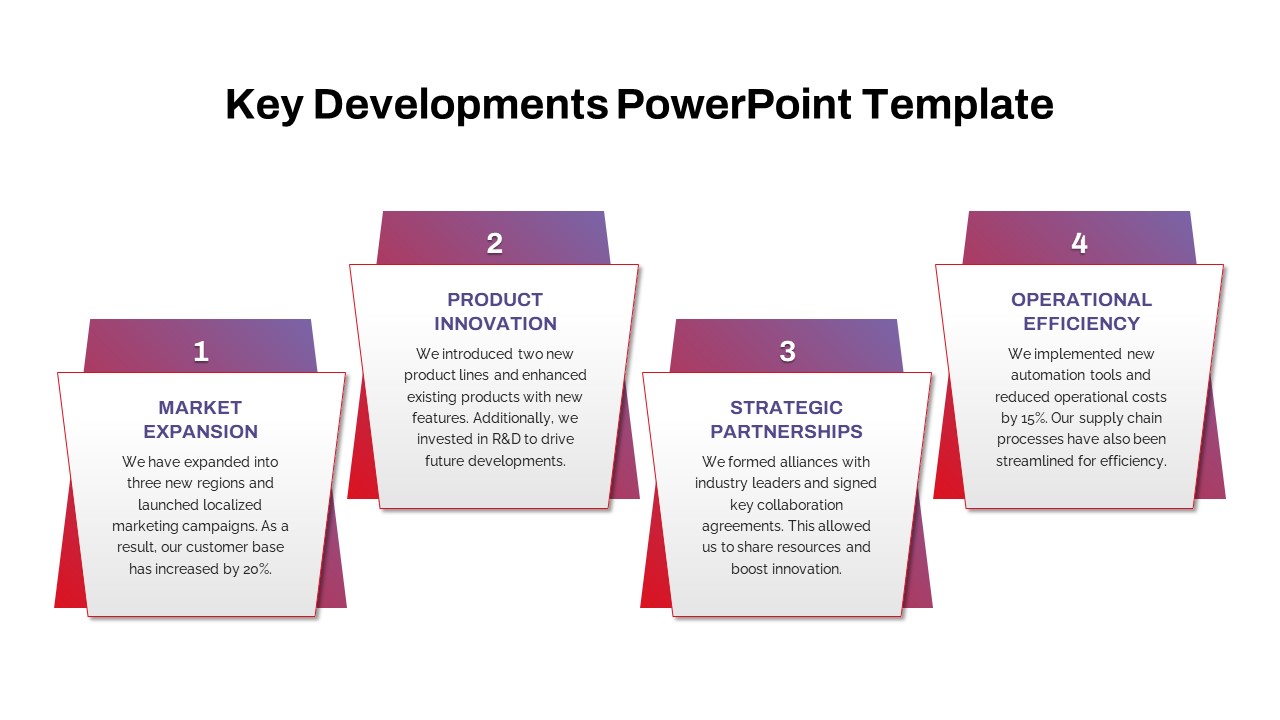
Key Developments Roadmap Timeline Template for PowerPoint & Google Slides
Timeline
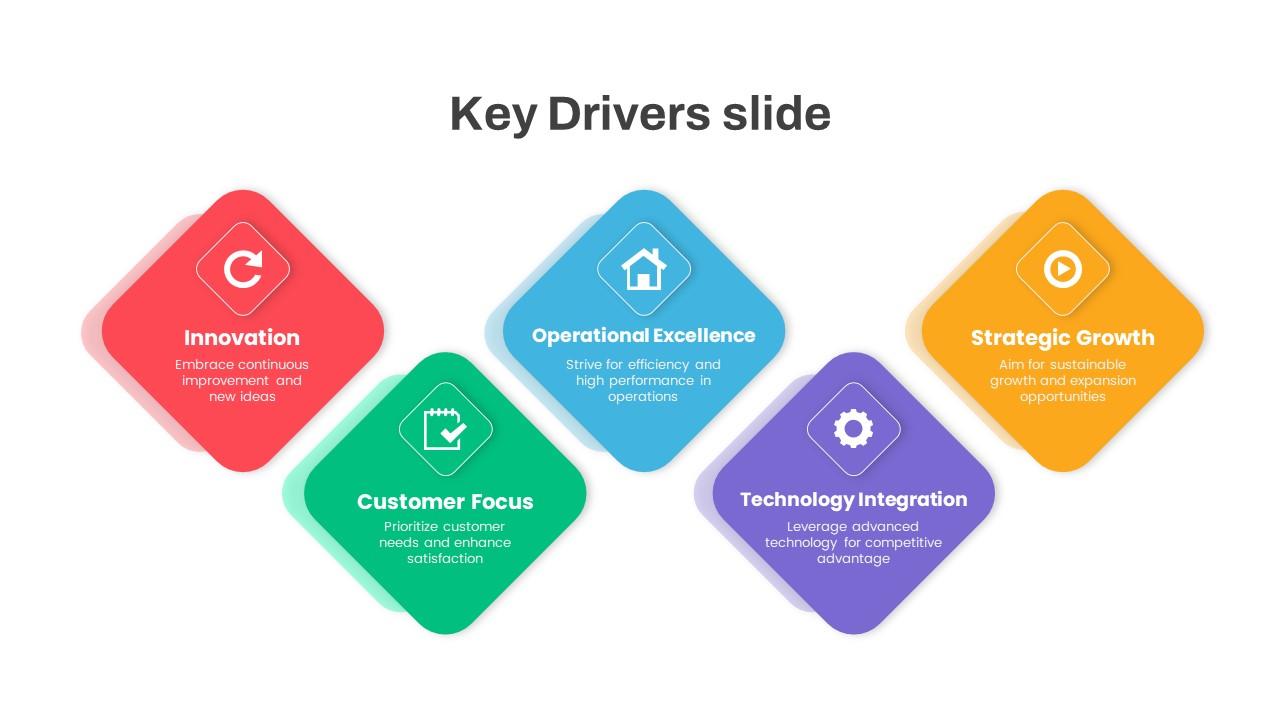
Dynamic Business Key Drivers Slide Template for PowerPoint & Google Slides
Process
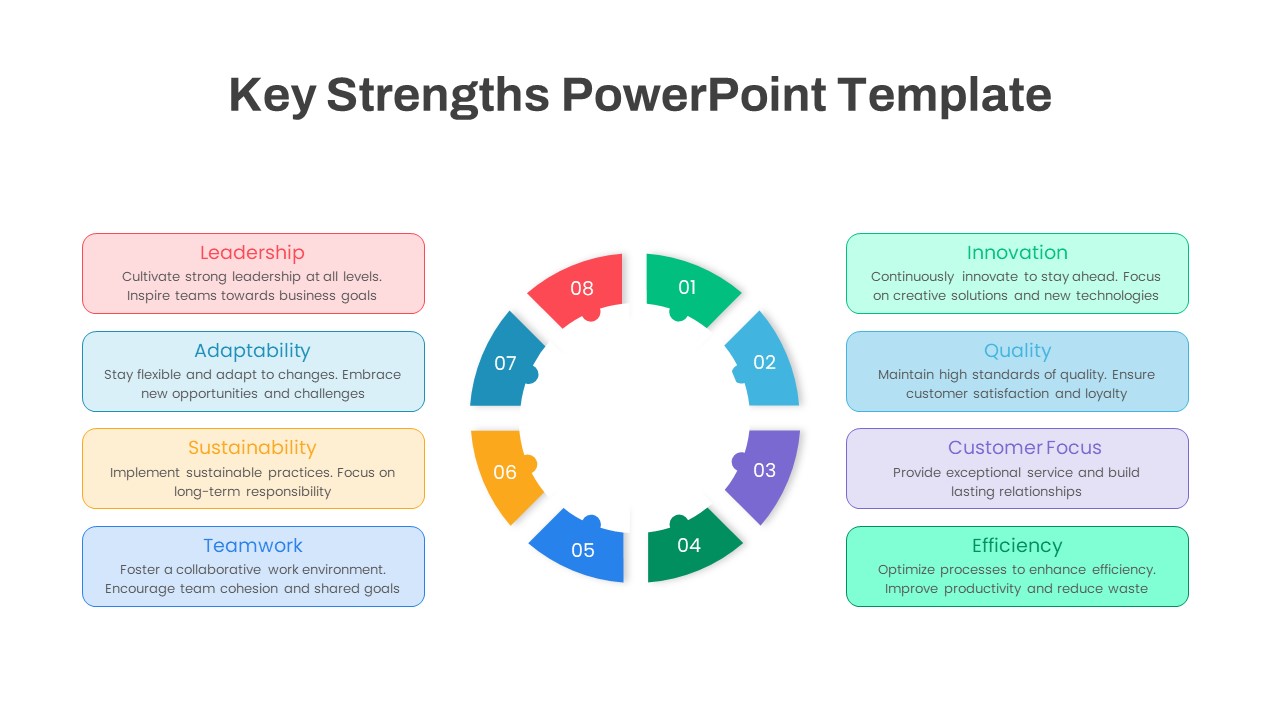
Eight-Segment Key Strengths Diagram Template for PowerPoint & Google Slides
Circular
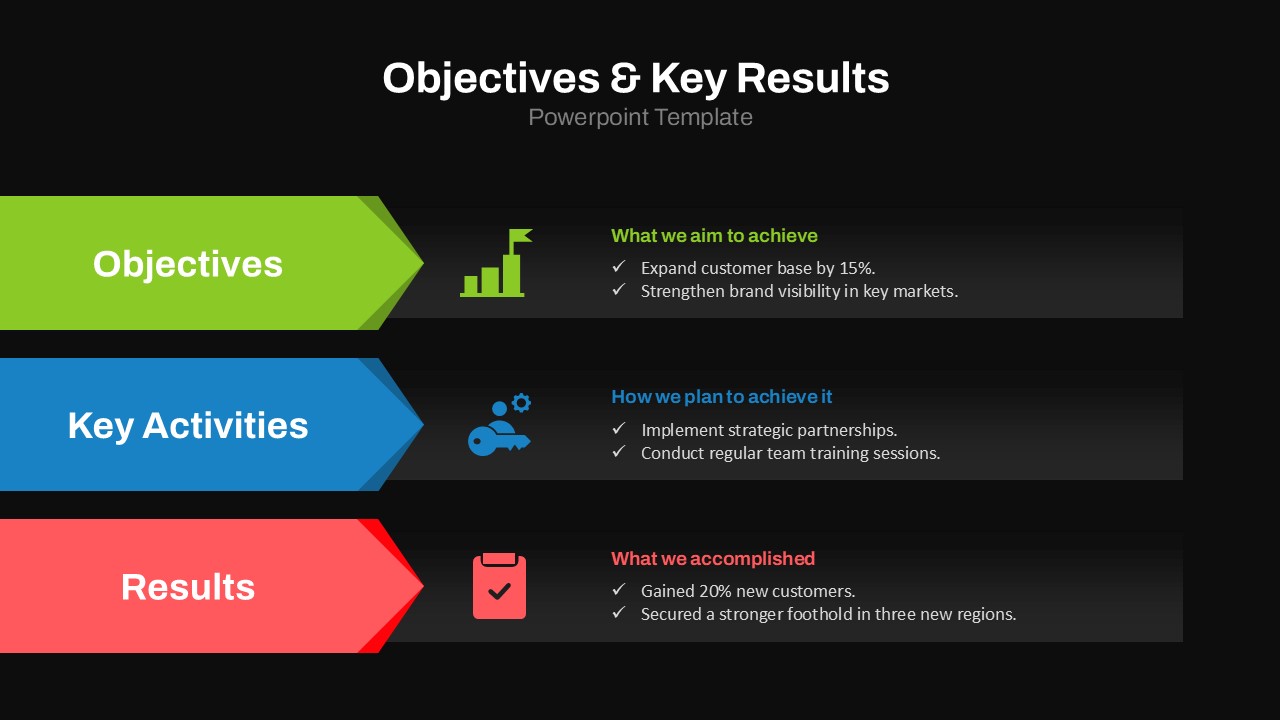
Objectives & Key Results Presentation Template for PowerPoint & Google Slides
Arrow
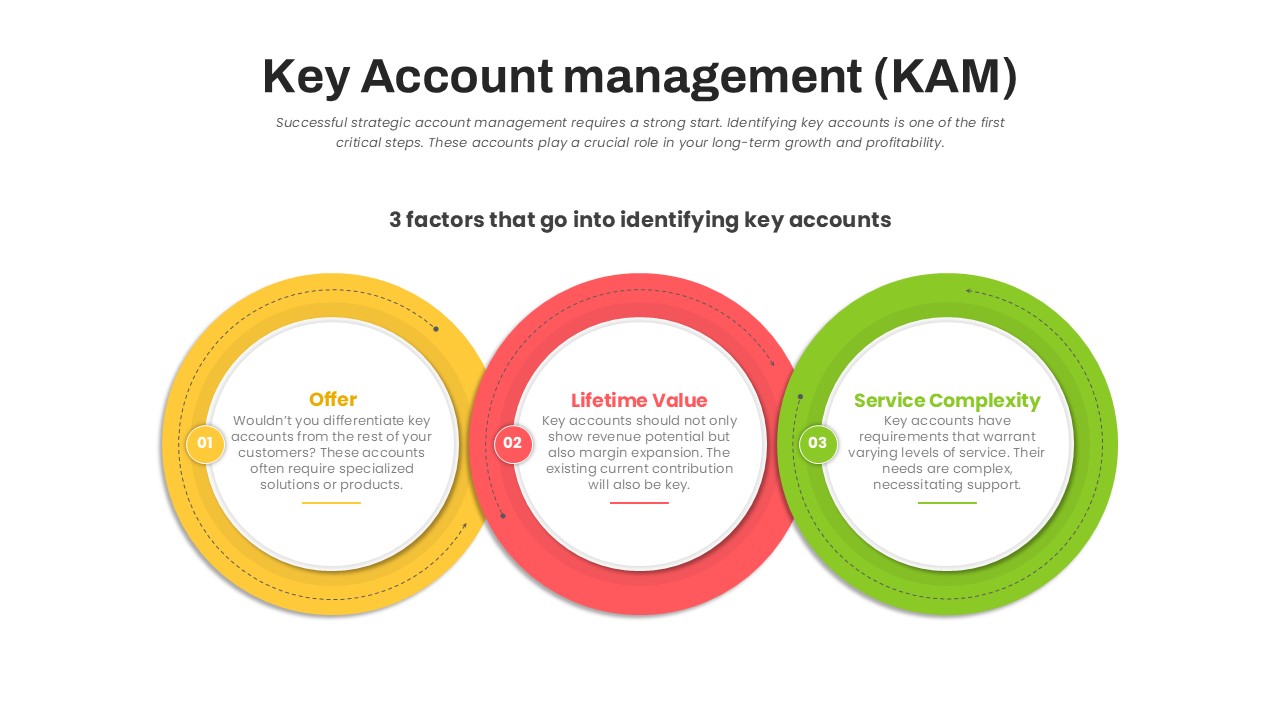
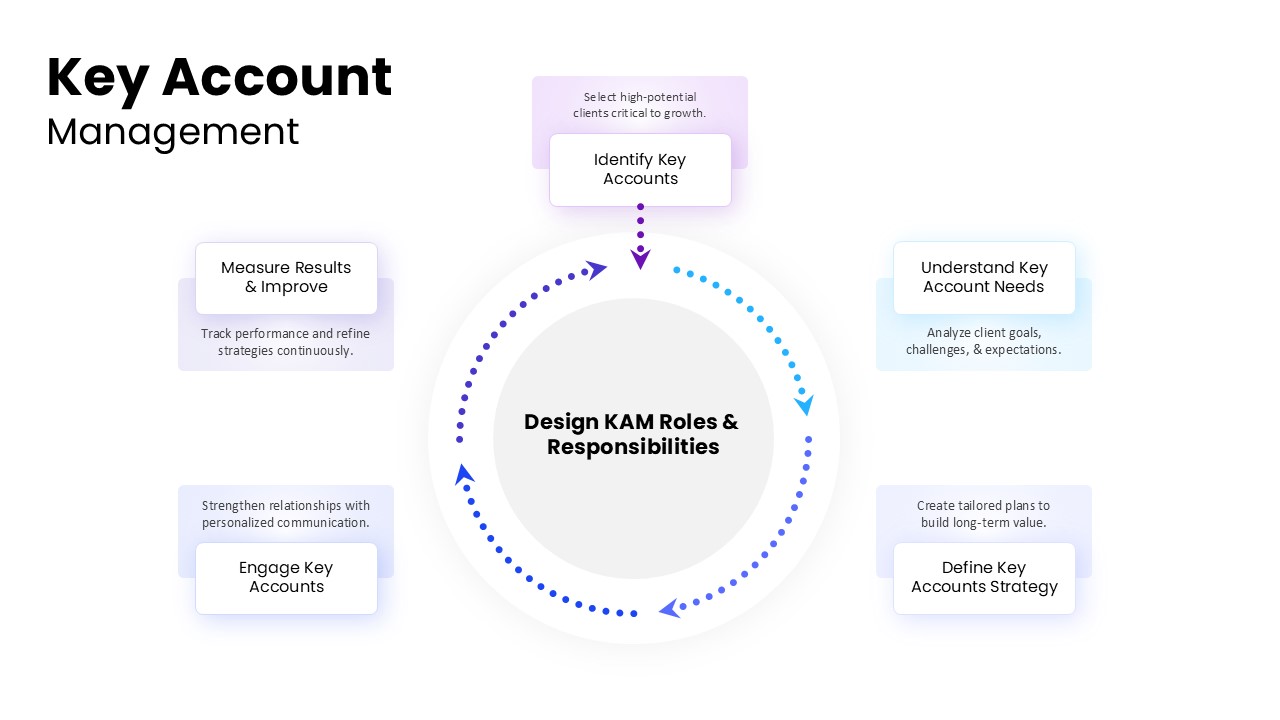
Key Account Management Circular Factors Template for PowerPoint & Google Slides
Circular
Generative AI Roadmap Key Stages Template for PowerPoint & Google Slides
Roadmap
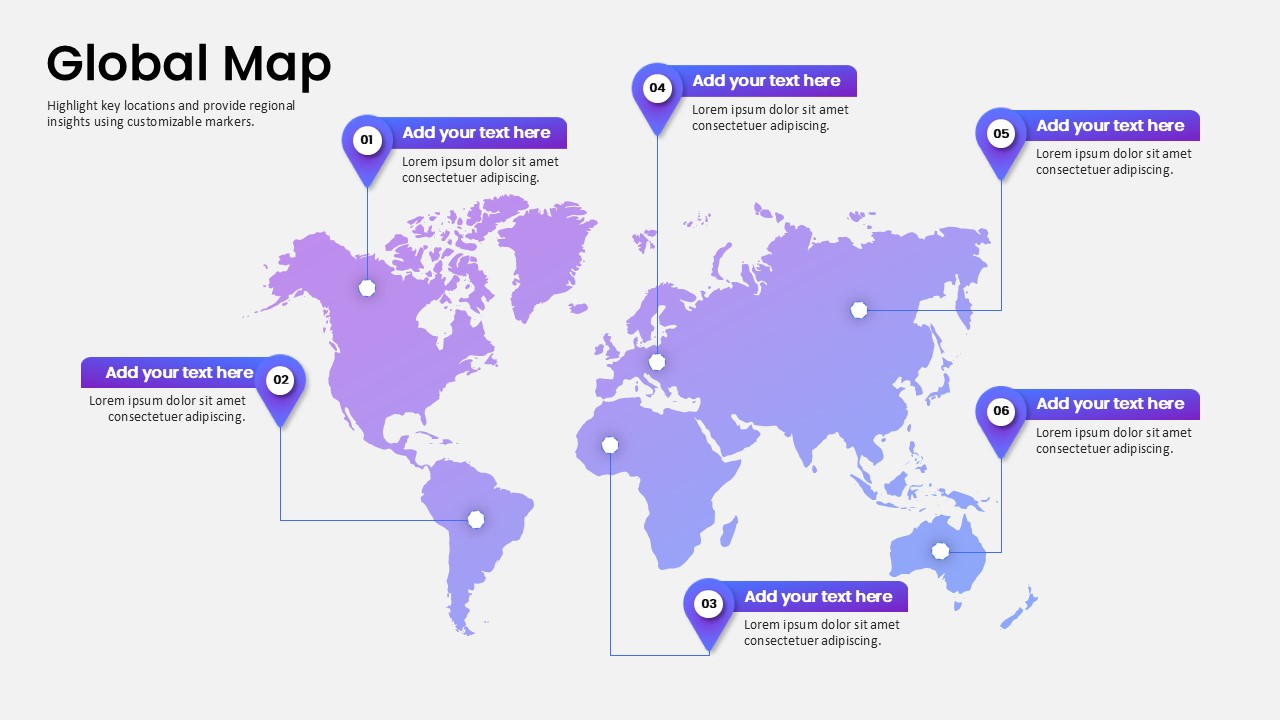
Global Map Highlighting Key Locations template for PowerPoint & Google Slides
World Maps
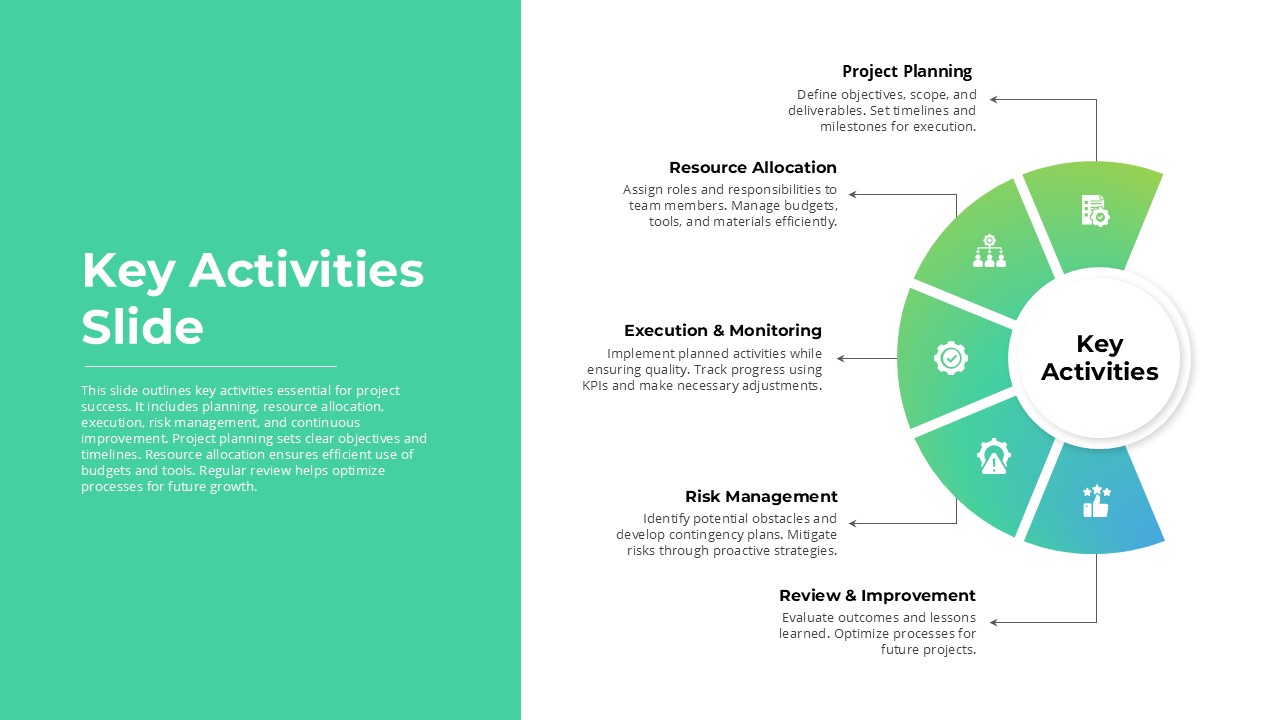
Project Key Activities Circular Diagram Template for PowerPoint & Google Slides
Process
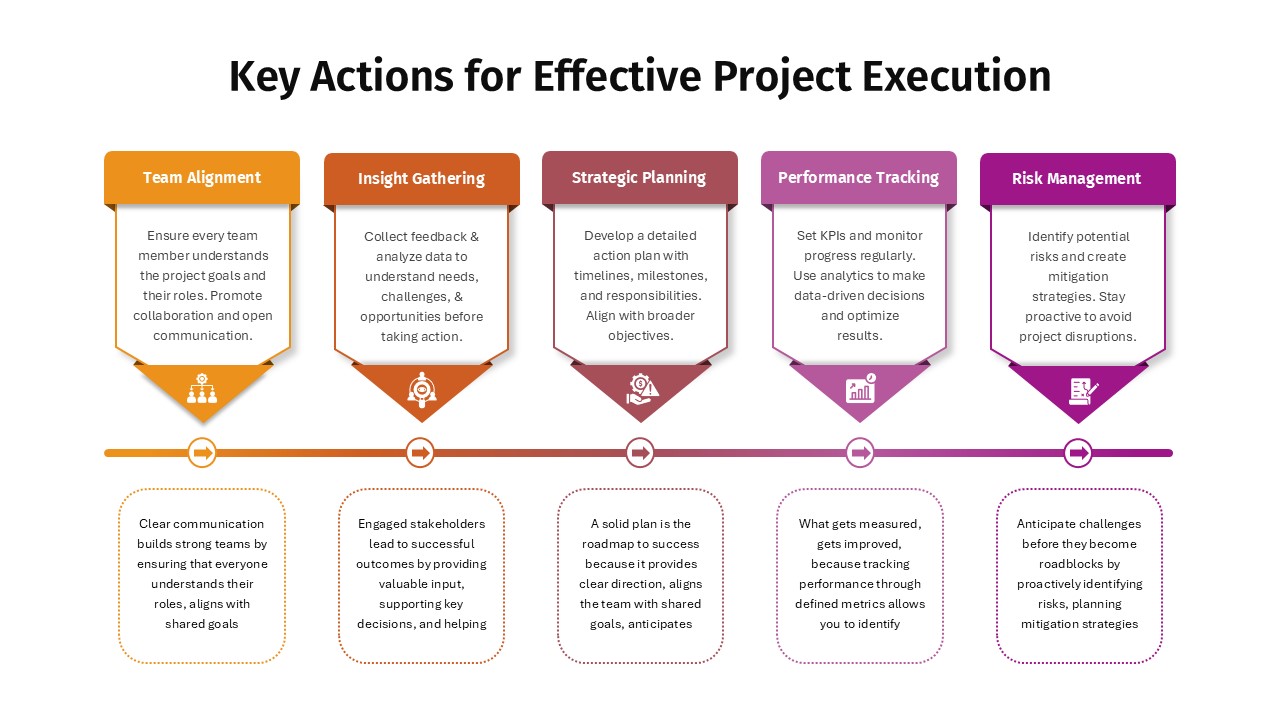
Key Actions Slide template for PowerPoint & Google Slides
Timeline
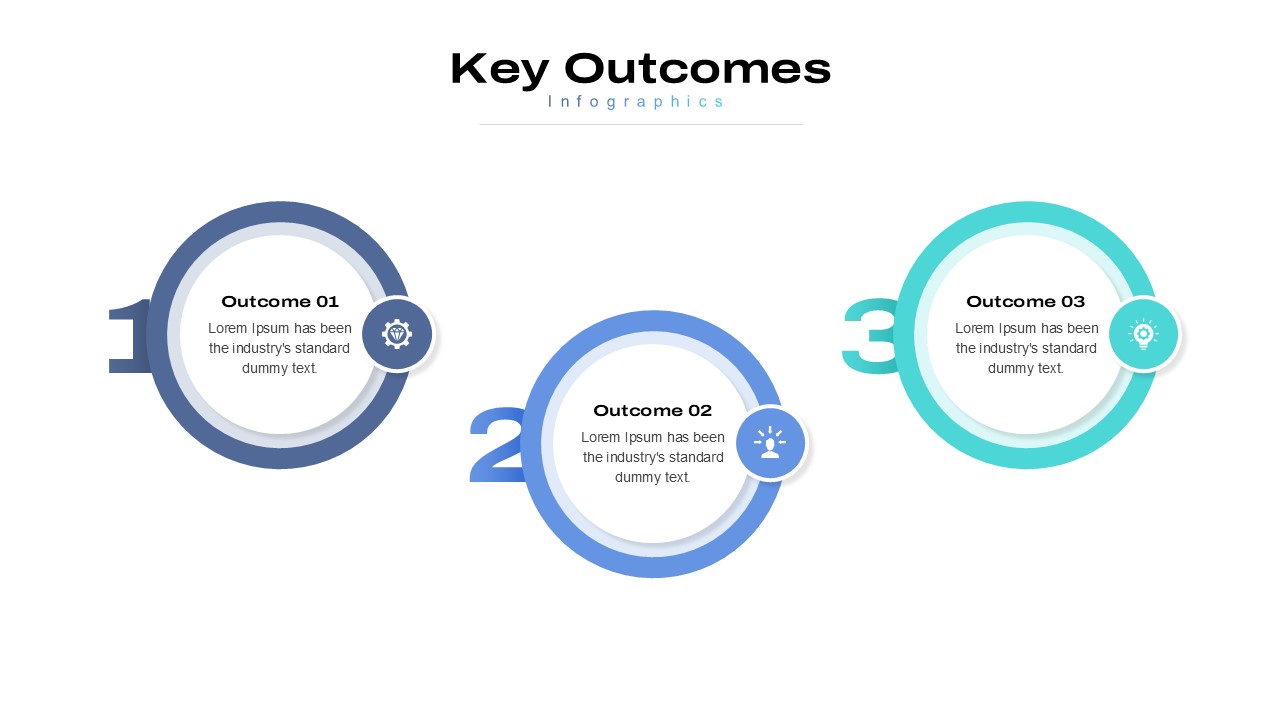
5 Styles Key Outcomes Infographics Pack Template for PowerPoint & Google Slides
Infographics
Podcast Marketing Strategy and Key Types Template for PowerPoint & Google Slides
Digital Marketing
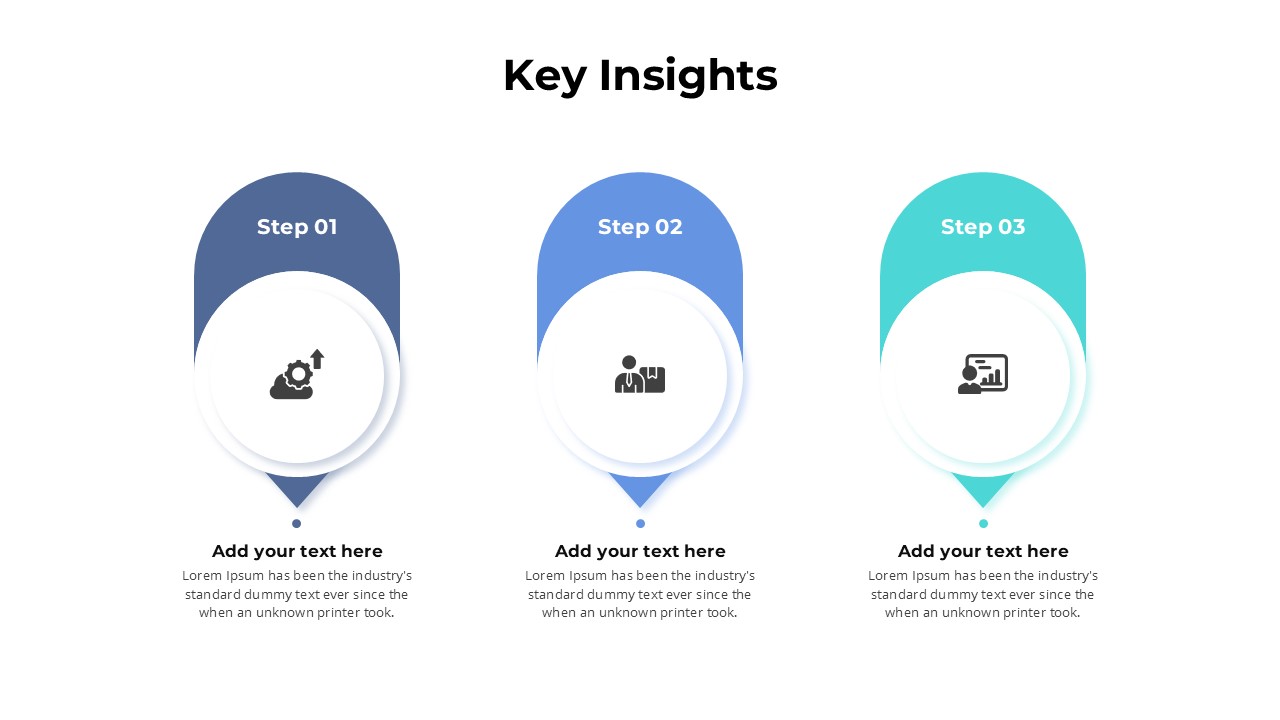
Key Insights Process Template for PowerPoint & Google Slides
Process
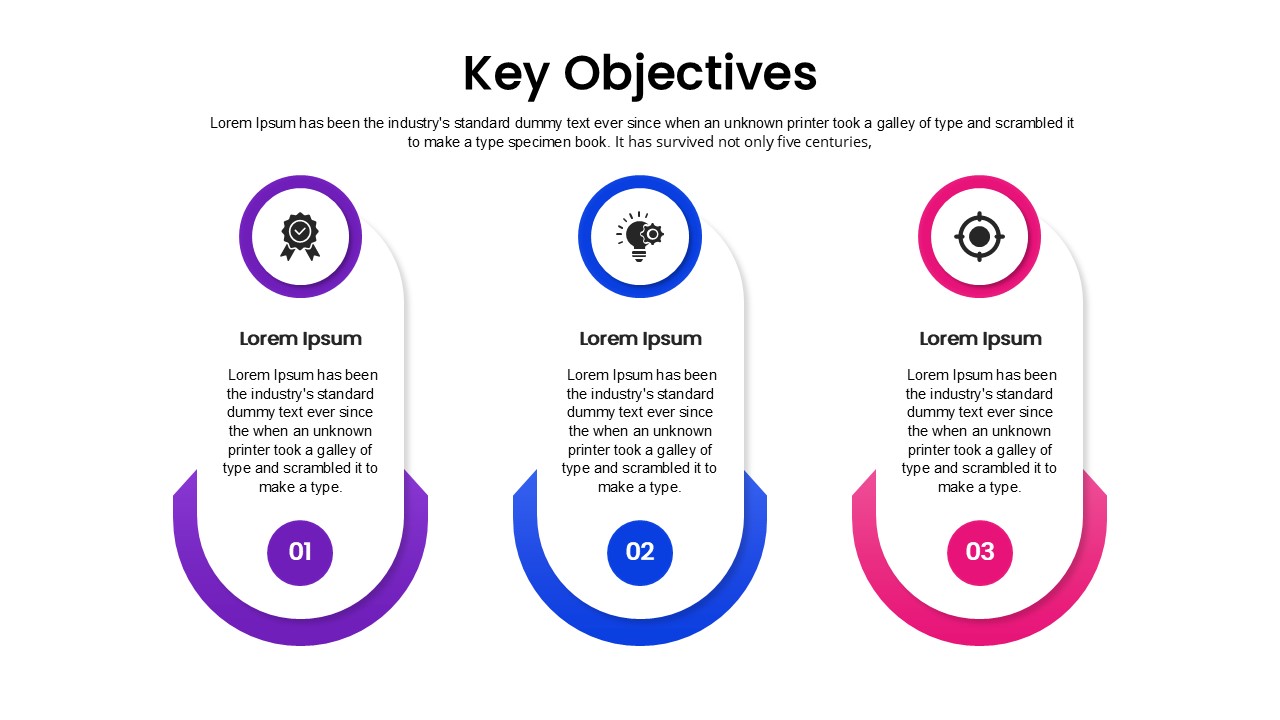
Key Objectives Circular Process template for PowerPoint & Google Slides
Business
Comprehensive Key Account Management Template for PowerPoint & Google Slides
Process
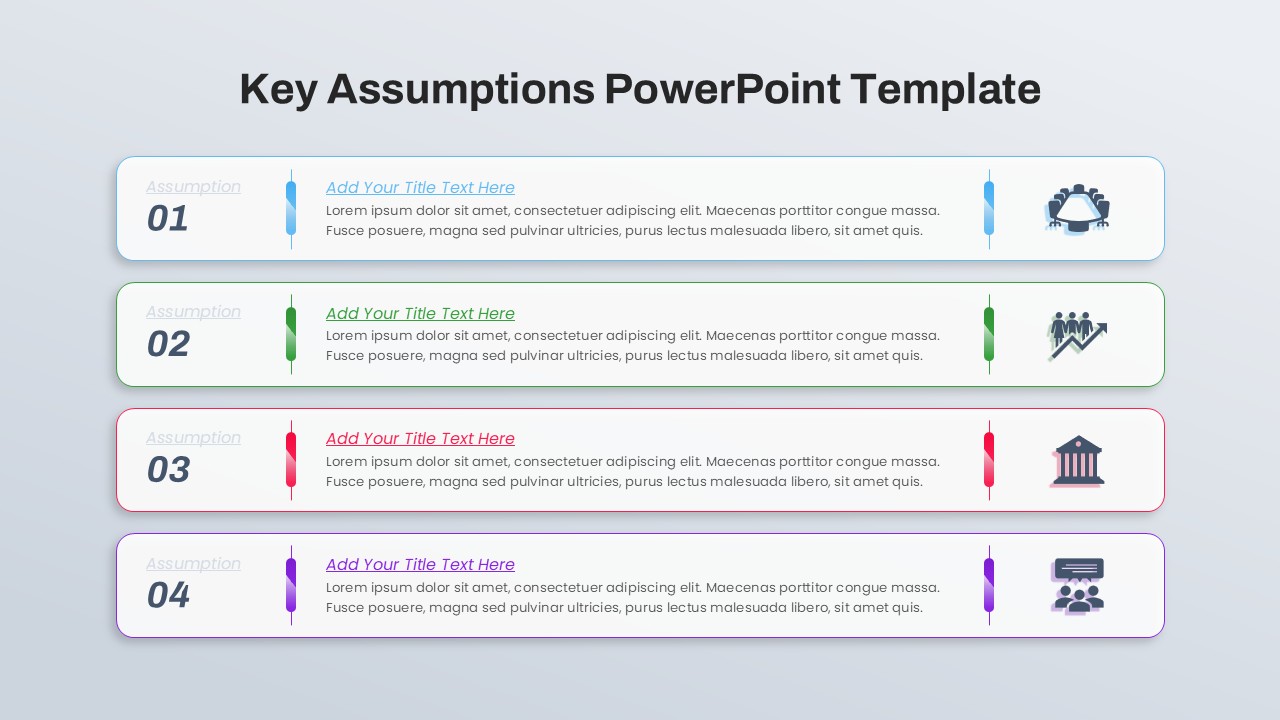
Key Assumptions Horizontal List Diagram Template for PowerPoint & Google Slides
Business Plan
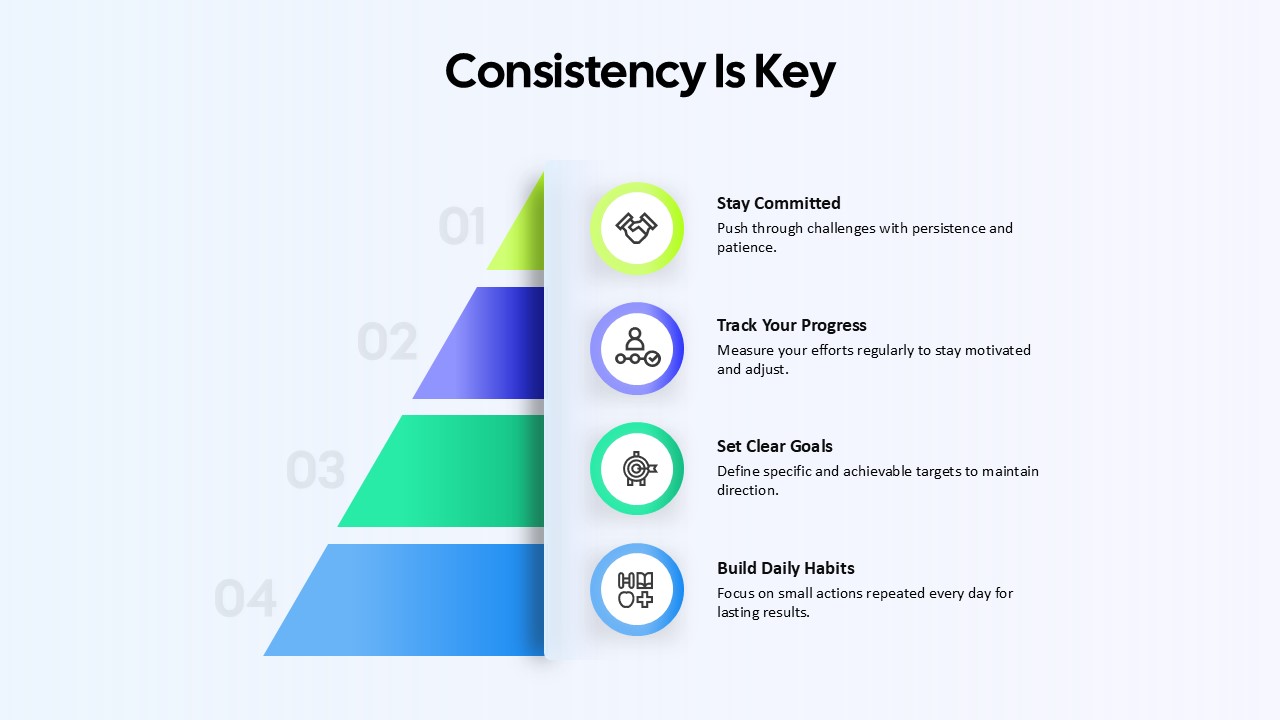
Consistency Is Key Four-Step Pyramid Template for PowerPoint & Google Slides
Process
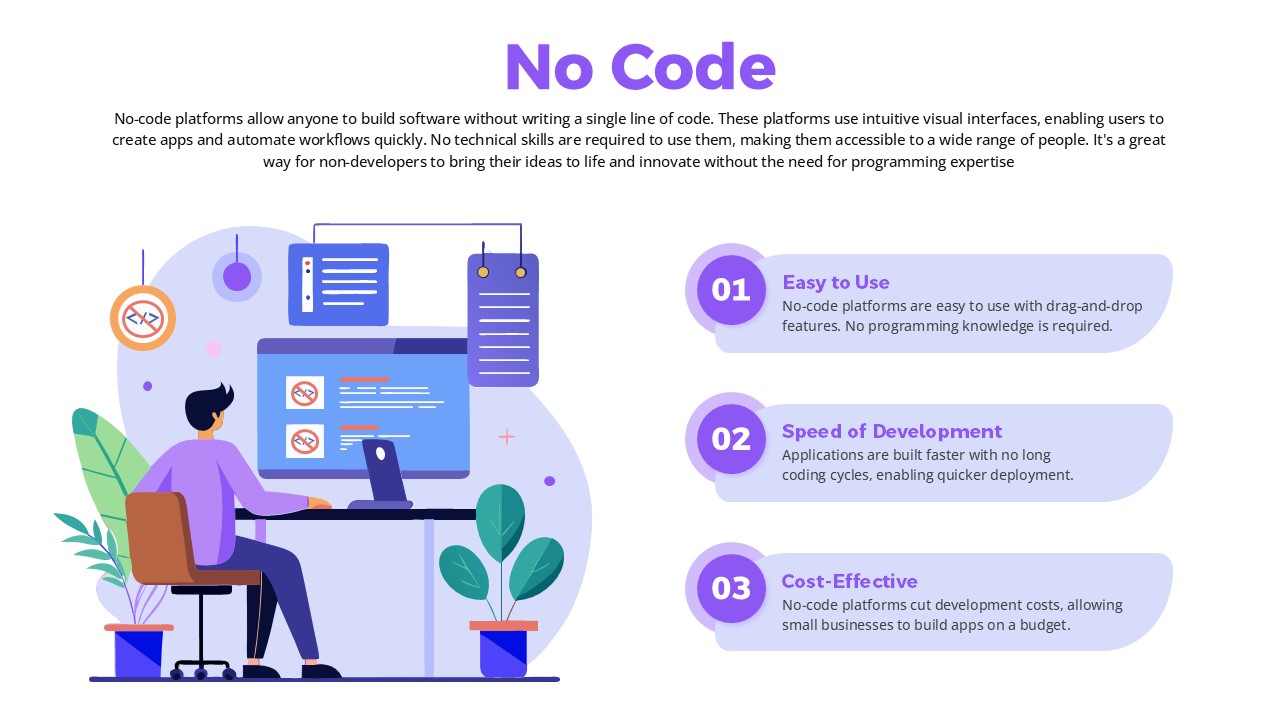
No-Code Overview with 3 Key Benefits Template for PowerPoint & Google Slides
Software Development
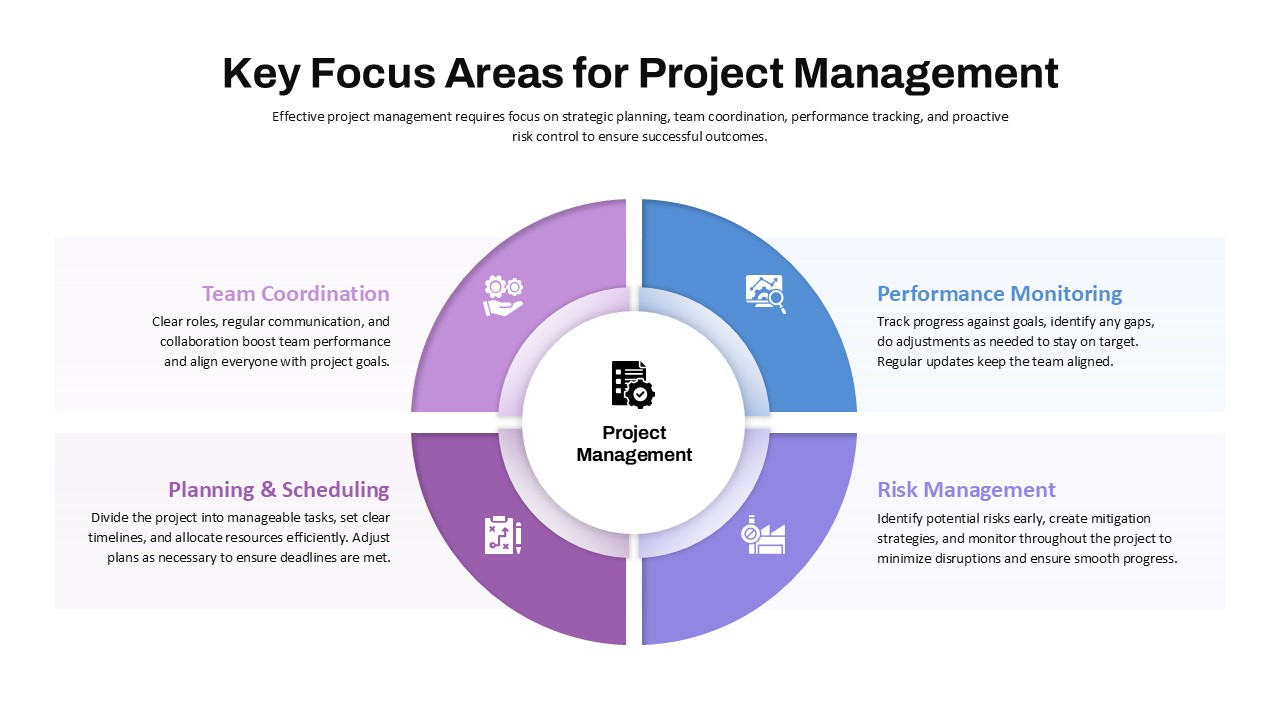
Key Focus Areas for Project Management Template for PowerPoint & Google Slides
Business
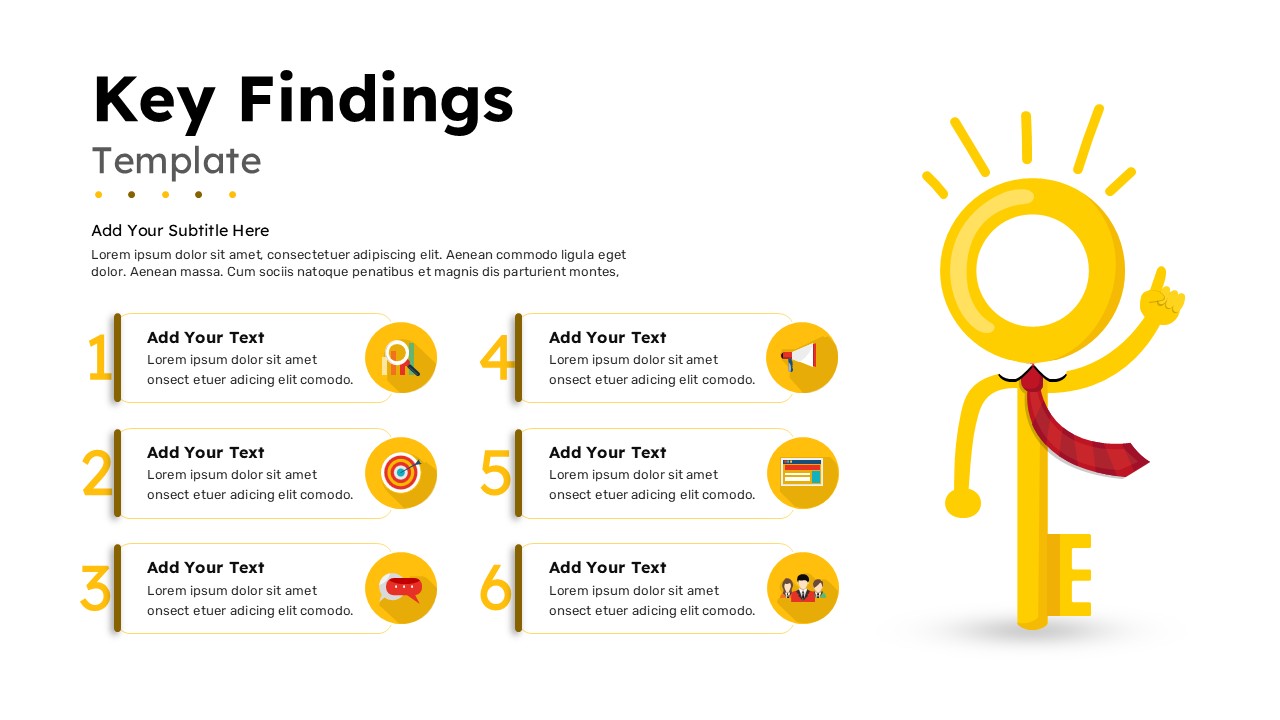
Key Findings Six-Step Diagram Template for PowerPoint & Google Slides
Business Report
Free Key Highlights Business Summary Slide for PowerPoint & Google Slides
Accomplishment
Free
Google Ads Optimization & Performance Infographic Template for PowerPoint & Google Slides
Digital Marketing
SQ3R Study Strategy Infographic Slides Template for PowerPoint & Google Slides
Business Strategy
Six Double Diamond Infographic Slides Template for PowerPoint & Google Slides
Process

Sales Process Infographic Slides Pack Template for PowerPoint & Google Slides
Process
Casino/Poker Chips Infographic Slides template for PowerPoint & Google Slides
Business Strategy
Agenda Infographic Pack of 2 Slides Template for PowerPoint & Google Slides
Agenda
Quad Chart Infographic Pack of 8 Slides Template for PowerPoint & Google Slides
Comparison Chart
Four Options Infographic Slides Template for PowerPoint & Google Slides
Comparison
Game Plan Infographic Slides Pack Template for PowerPoint & Google Slides
Infographics
Teamwork PowerPoint Infographic Template for PowerPoint & Google Slides
Leadership
Kite Infographic PowerPoint Template for PowerPoint & Google Slides
Process
Cladogram Infographic Di Template for PowerPoint & Google Slides Template
Decision Tree
Workflow PowerPoint Process infographic for PowerPoint & Google Slides
Process
Free Infographic Deck PowerPoint Pack for PowerPoint & Google Slides
Infographics
Free

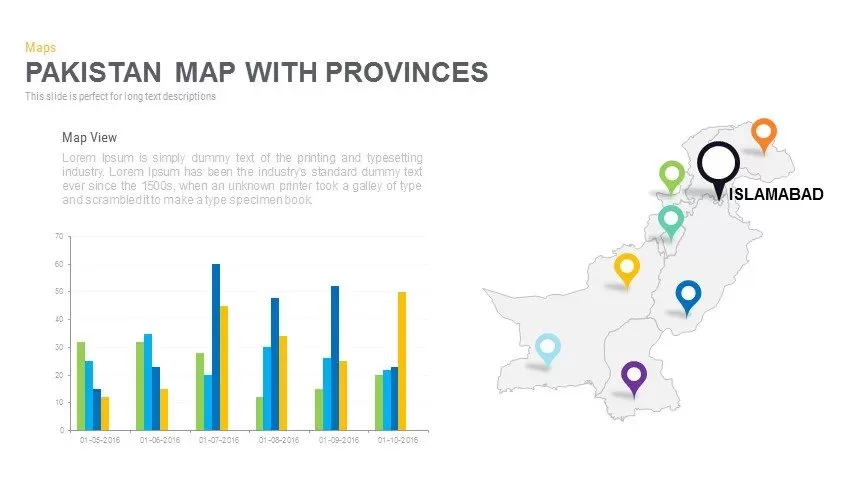
Pakistan Provinces Map Infographic Pack Template for PowerPoint & Google Slides
Maps
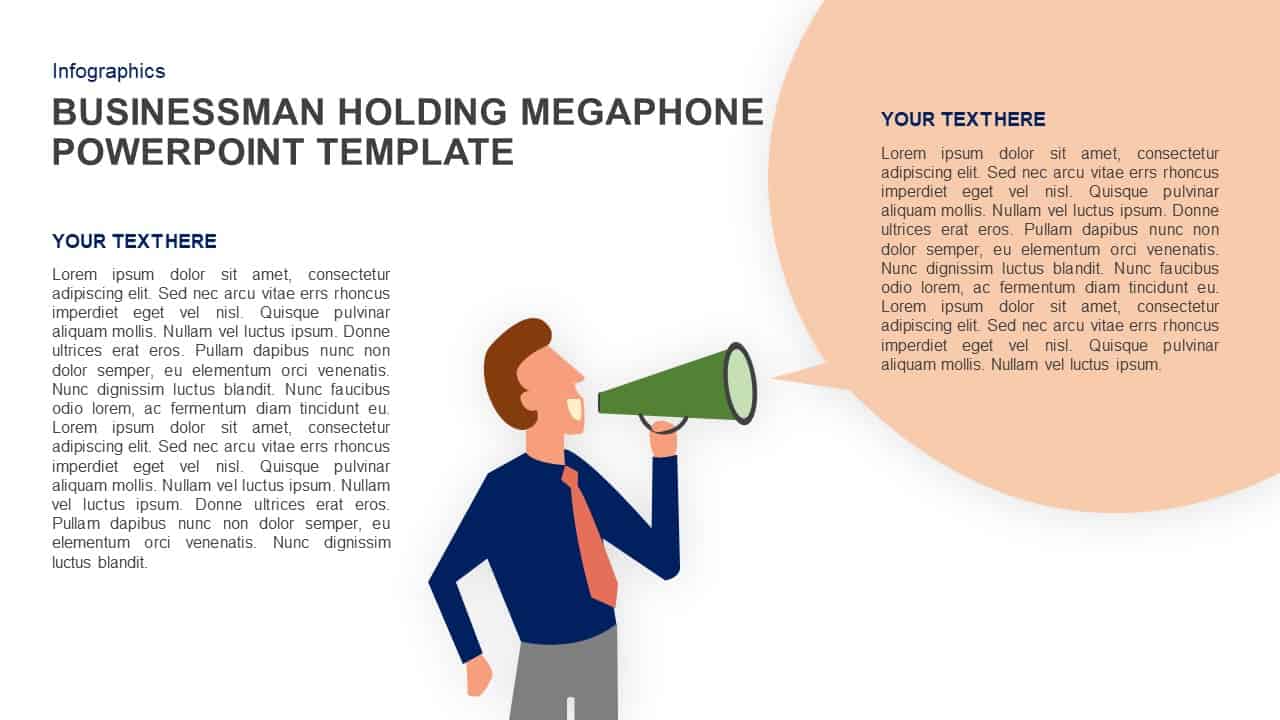
Businessman Megaphone Infographic Template for PowerPoint & Google Slides
Goals
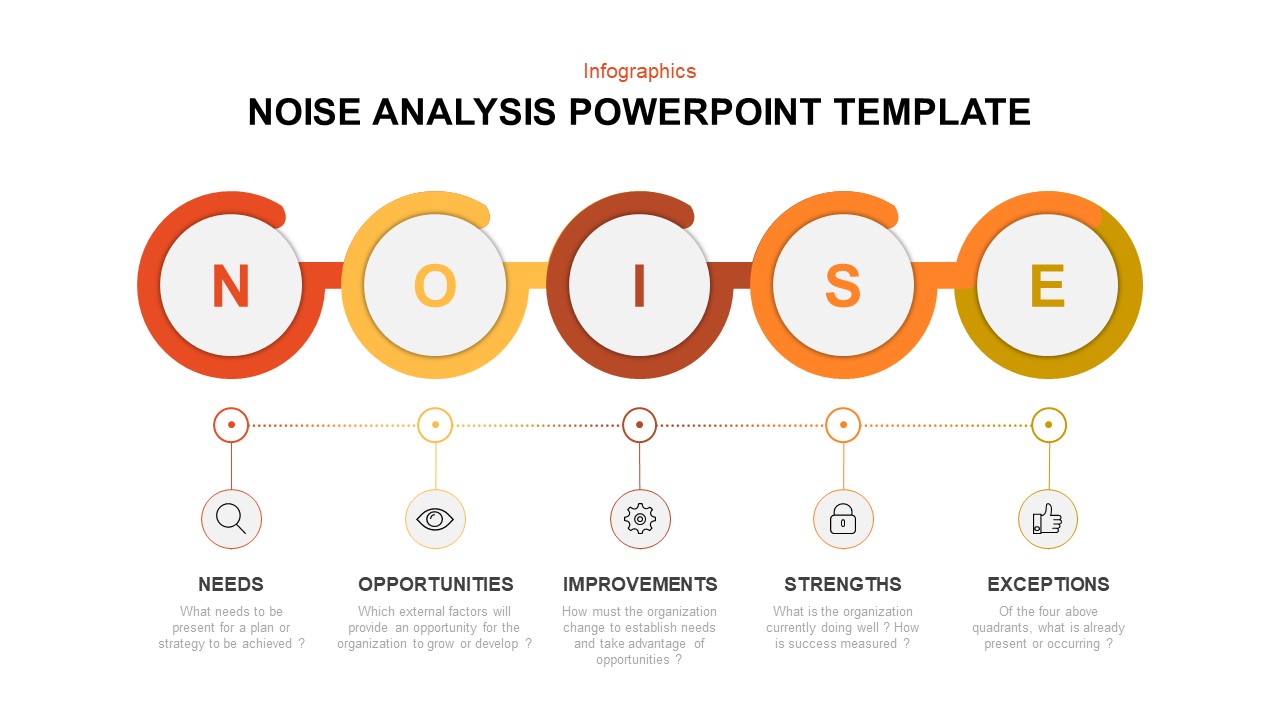
Modern Noise Analysis Infographic Template for PowerPoint & Google Slides
Process
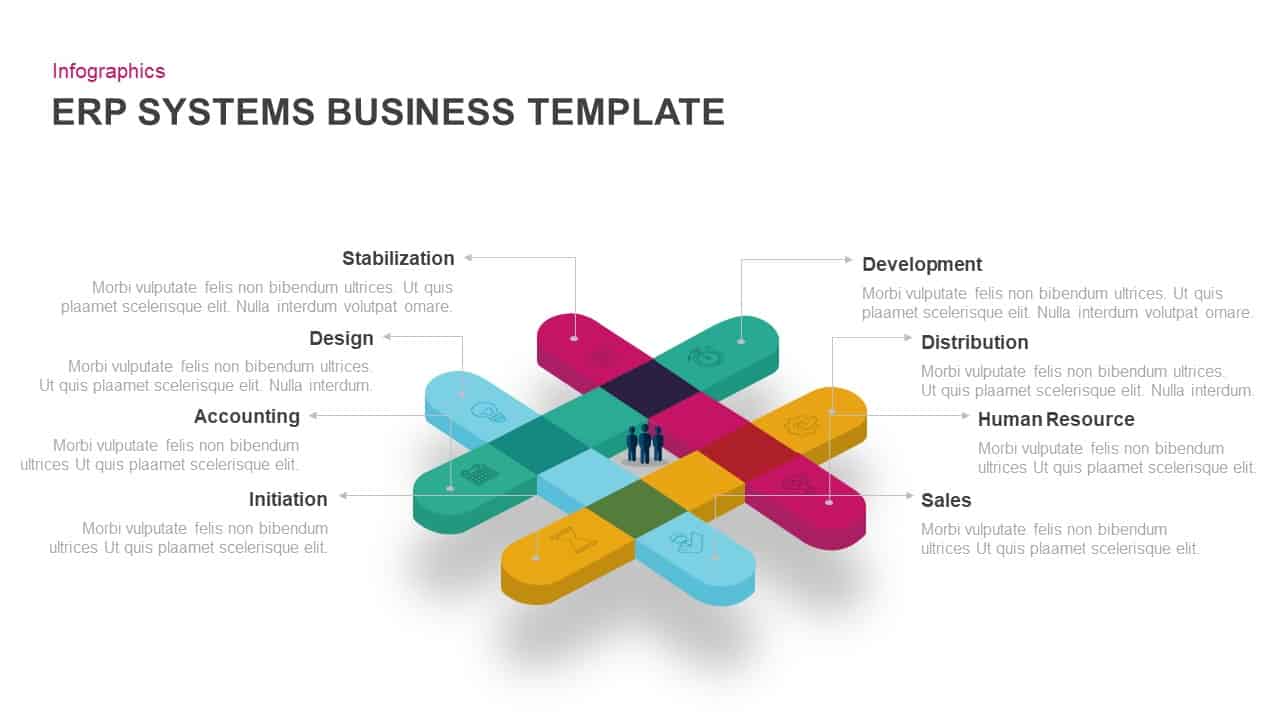
ERP Systems Modules Infographic Template for PowerPoint & Google Slides
Infographics
Social Media Network Infographic Template for PowerPoint & Google Slides
Circular
6-Part Circular Gear Infographic Diagram Template for PowerPoint & Google Slides
Process
Marketing Mix Infographic Presentation Template for PowerPoint & Google Slides
Circular

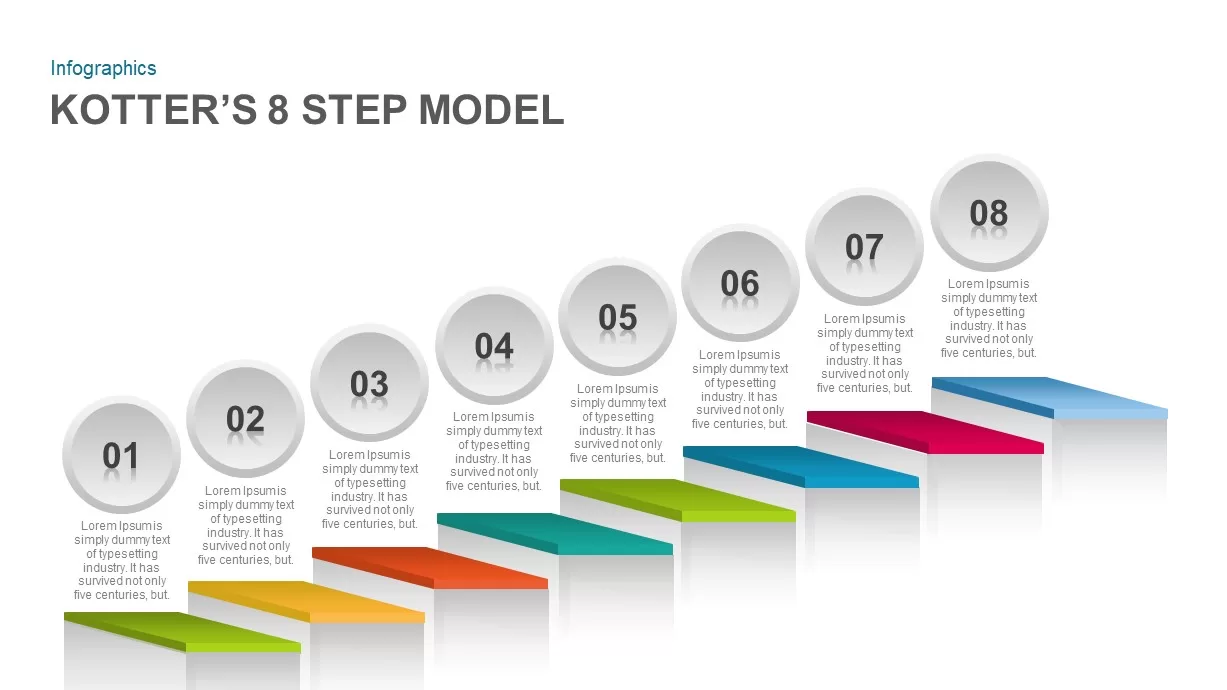
Kotter’s 8-Step Model Infographic Template for PowerPoint & Google Slides
Process
Overcoming Challenges Infographic Pack Template for PowerPoint & Google Slides
Opportunities Challenges
Colorful Agile Timeline Infographic Template for PowerPoint & Google Slides
Timeline
Free
Free Multi-Step Funnel Infographic Slide Pack Template for PowerPoint & Google Slides
Funnel
Free
Curved Roadmap Infographic Vision Journey Template for PowerPoint & Google Slides
Business Strategy
Pesticide Four-Step Process Infographic Template for PowerPoint & Google Slides
Process
European Union Map Infographic Template for PowerPoint & Google Slides
World Maps
Three-Part Parts Infographic Diagram Template for PowerPoint & Google Slides
Process
Mortgage Process Infographic Template for PowerPoint & Google Slides
Finance