Gartner Magic Quadrant Analysis Template for PowerPoint & Google Slides


Description
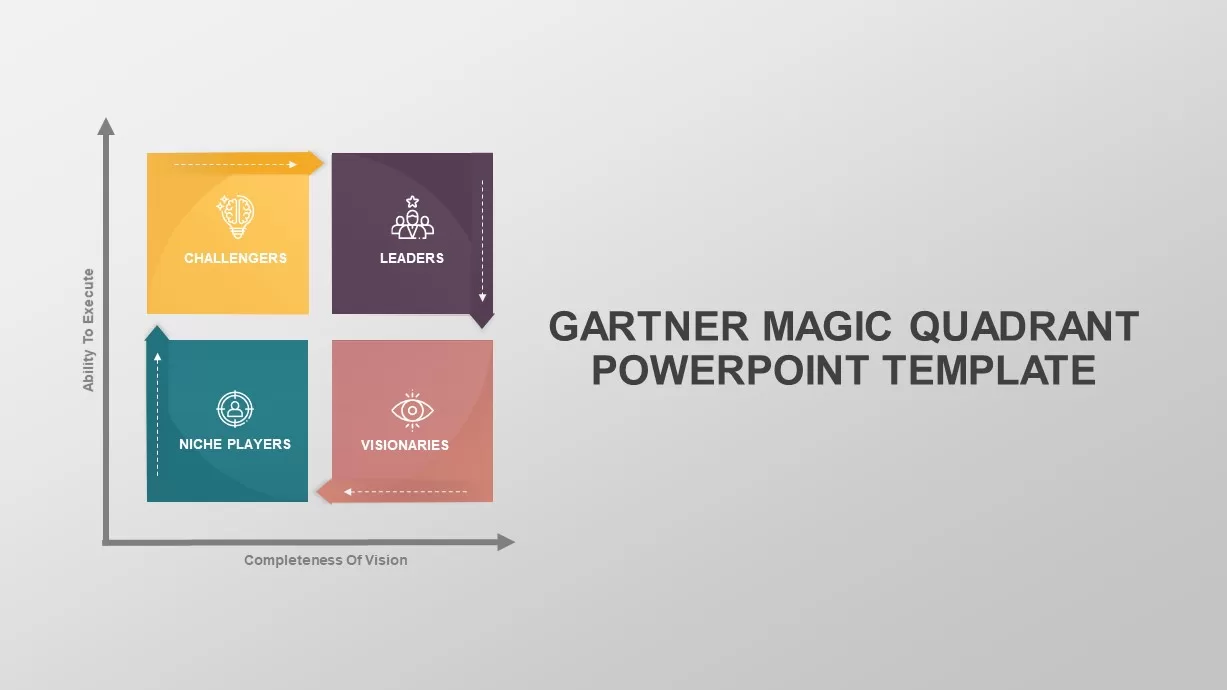
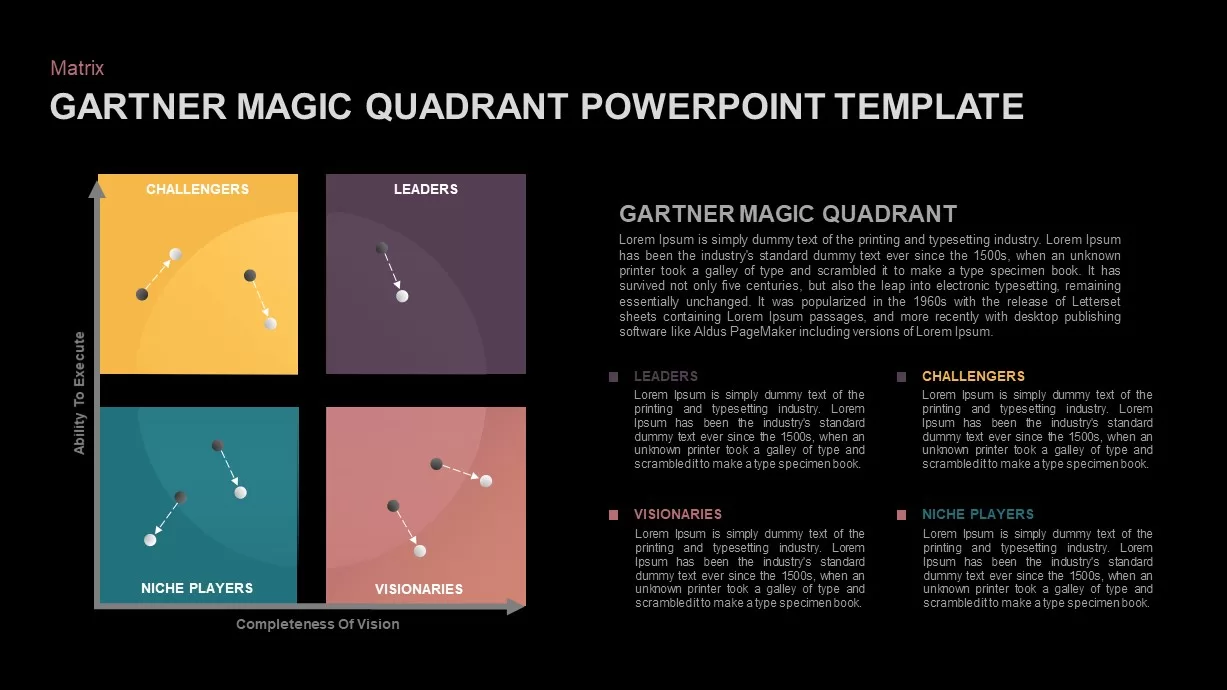
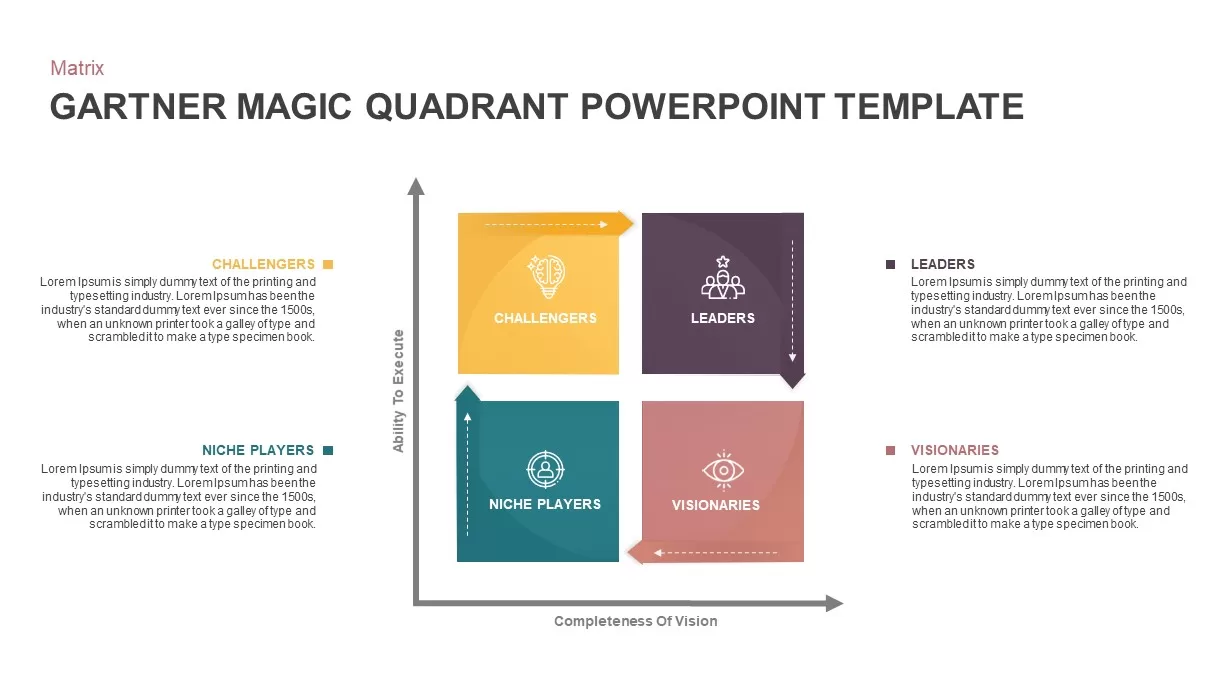
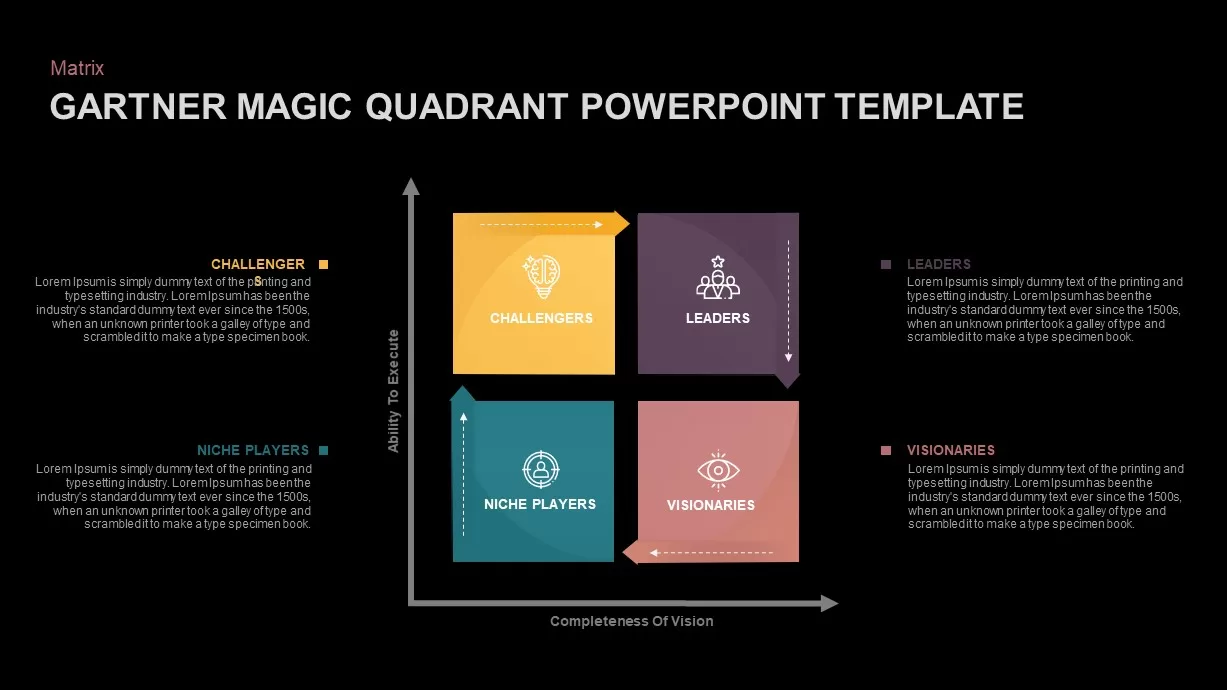
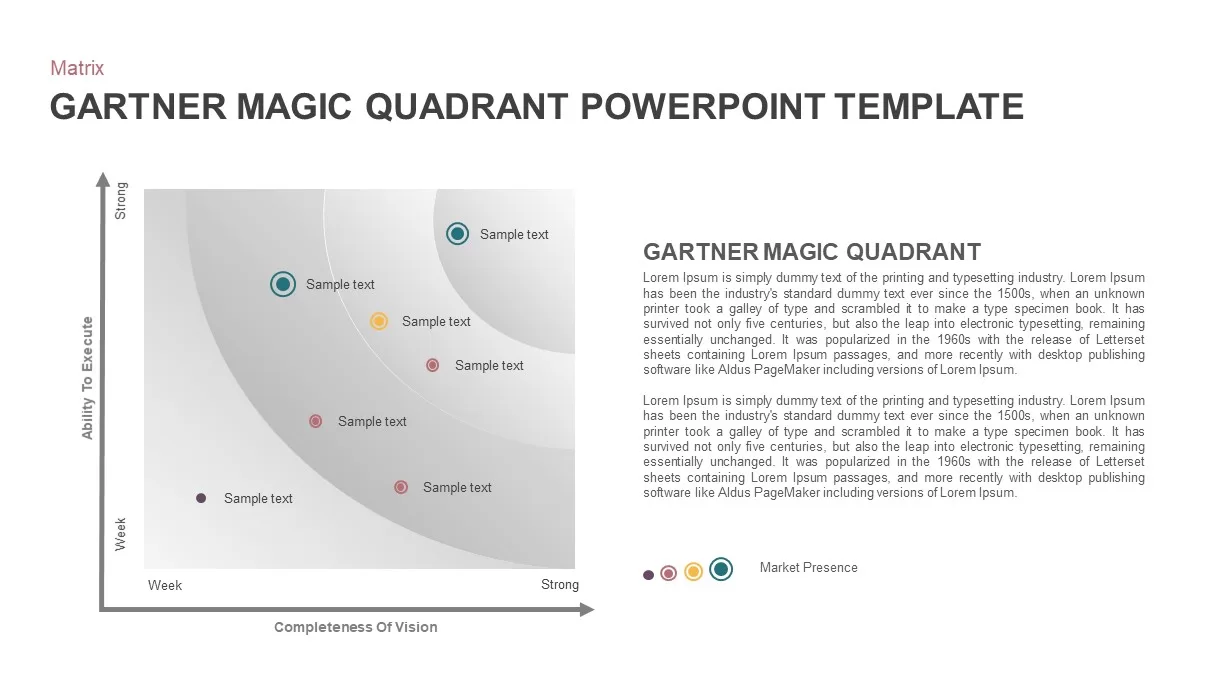
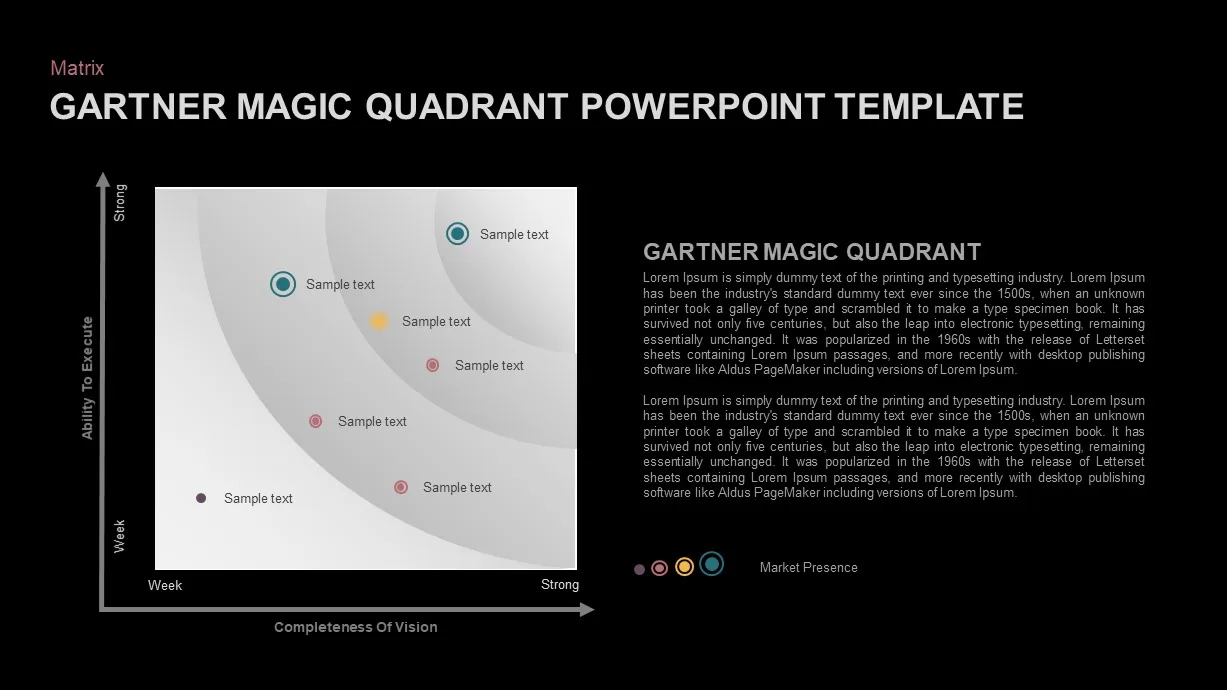
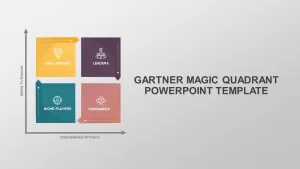
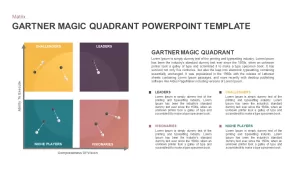
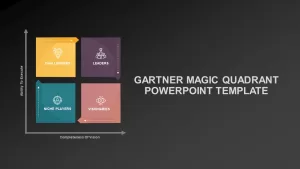
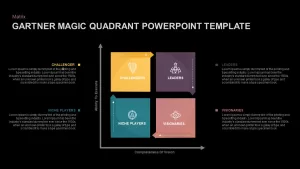
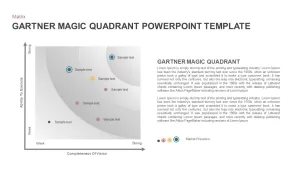
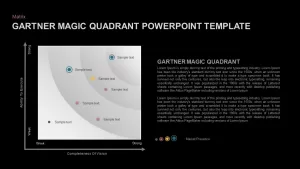
Leverage this comprehensive Gartner Magic Quadrant template to visualize vendor positioning across two critical axes—Ability to Execute and Completeness of Vision—within fully editable PowerPoint and Google Slides decks. The package features three distinct slide variations: a clean four-quadrant matrix with color-coded segments, crisp icons, and arrow indicators; a dynamic bubble trajectory layout that illustrates vendor movement over time through dotted connectors; and a modern concentric arch design where grayscale tiers serve as a backdrop for customizable data points and legends. Each layout includes intuitive SmartArt placeholders, axis labels, and text zones for detailed annotations.
Built on master slides, this template ensures brand consistency and rapid customization. Swap out quadrant labels, adjust bubble sizes and colors, replace icons with your own graphics, and tweak axis scales effortlessly via the theme wizard. Editable shape layers and grouped objects preserve alignment and uniform spacing, while high-contrast typography and optional drop shadows enhance readability. Whether you need to map challengers, leaders, visionaries, and niche players or highlight market presence tiers, these slides deliver precision and visual impact.
Optimized for both PowerPoint and Google Slides, this Magic Quadrant template eliminates formatting headaches and accelerates presentation development. Leverage built-in legends to decode data markers, customize color palettes to match corporate branding, and utilize responsive layouts that maintain full-resolution clarity on any device. Perfect for executive briefings, competitive analysis, product roadmap reviews, and strategic workshops, this toolkit helps you align stakeholders, drive data-driven conversations, and present complex market intelligence with confidence.
Comprehensive documentation and best-practice guides are included to walk users through each slide’s customization steps and design principles. The template leverages free, editable icon sets, vector shapes, and SmartArt graphics for scalability and consistency. Pre-defined color themes and global style presets enable rapid theme changes across all slides, while sample data markers and legend guides illustrate potential applications. With this Magic Quadrant toolkit, you can focus on storytelling, strategic recommendations, and analytical insights rather than manual formatting.
Who is it for
Product managers, market analysts, and IT leaders can leverage these Magic Quadrant slides to showcase vendor evaluations and competitive positioning. Strategy consultants, business development teams, and executive stakeholders will find this toolkit invaluable for data-driven briefs, pitch decks, and strategic planning workshops.
Other Uses
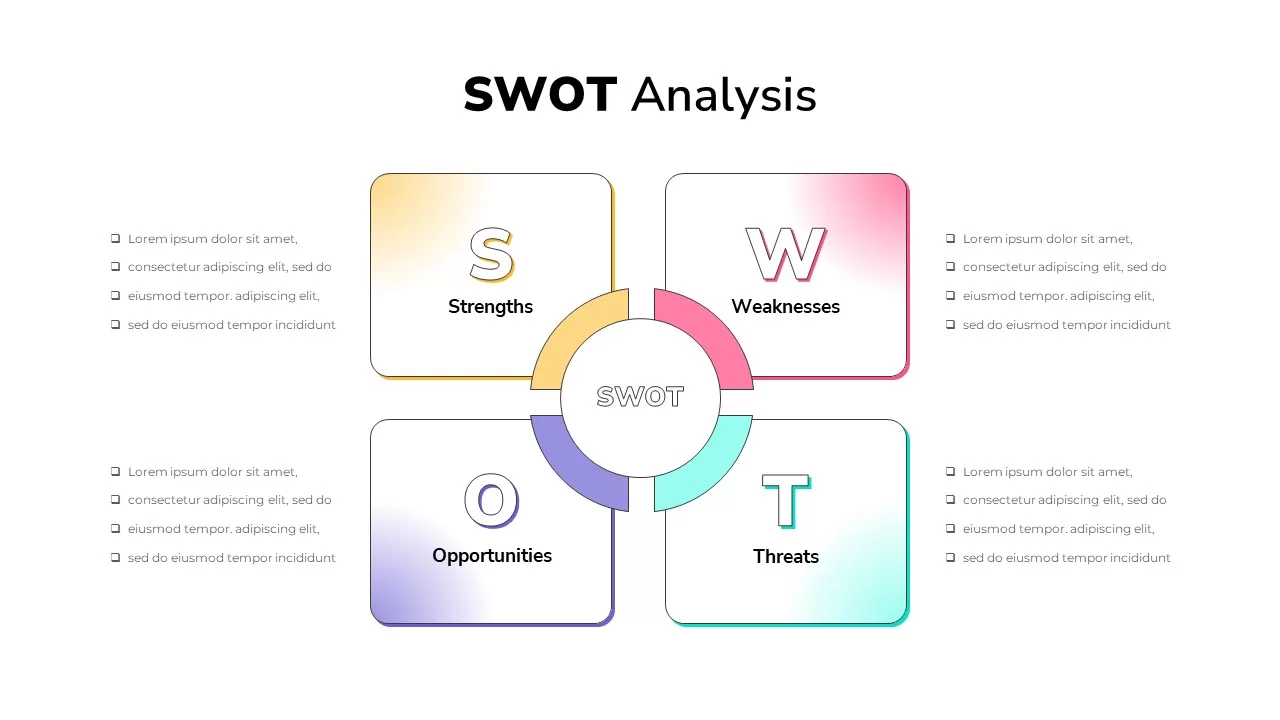
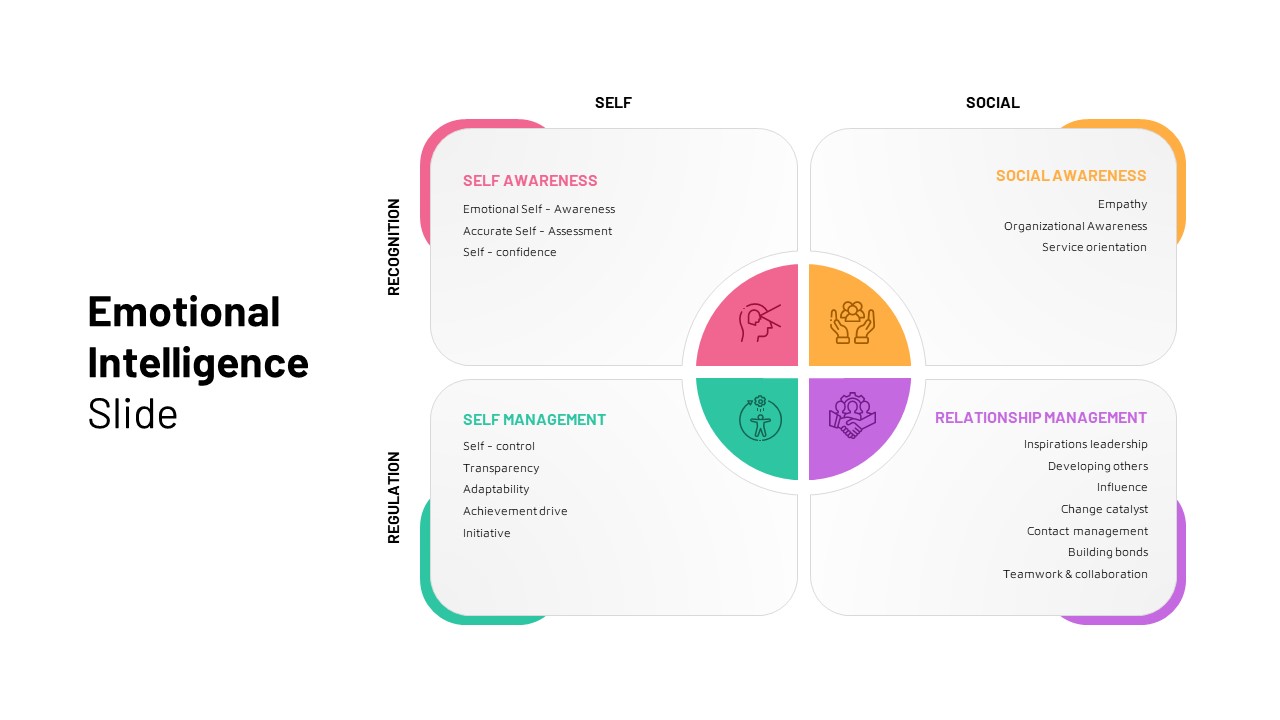
Apart from vendor assessments, repurpose these templates for SWOT quadrant analysis, capability maturity models, risk assessments, market segmentation matrices, and portfolio reviews. Use the bubble trajectory layout for trend mapping, the concentric arch design for customer satisfaction tiers, or the quadrant format for team performance evaluations and project status tracking.
Login to download this file

Item ID
SB01712
Related Templates

Gartner Hype Cycle Adoption Curve Diagram Template for PowerPoint & Google Slides
Infographics
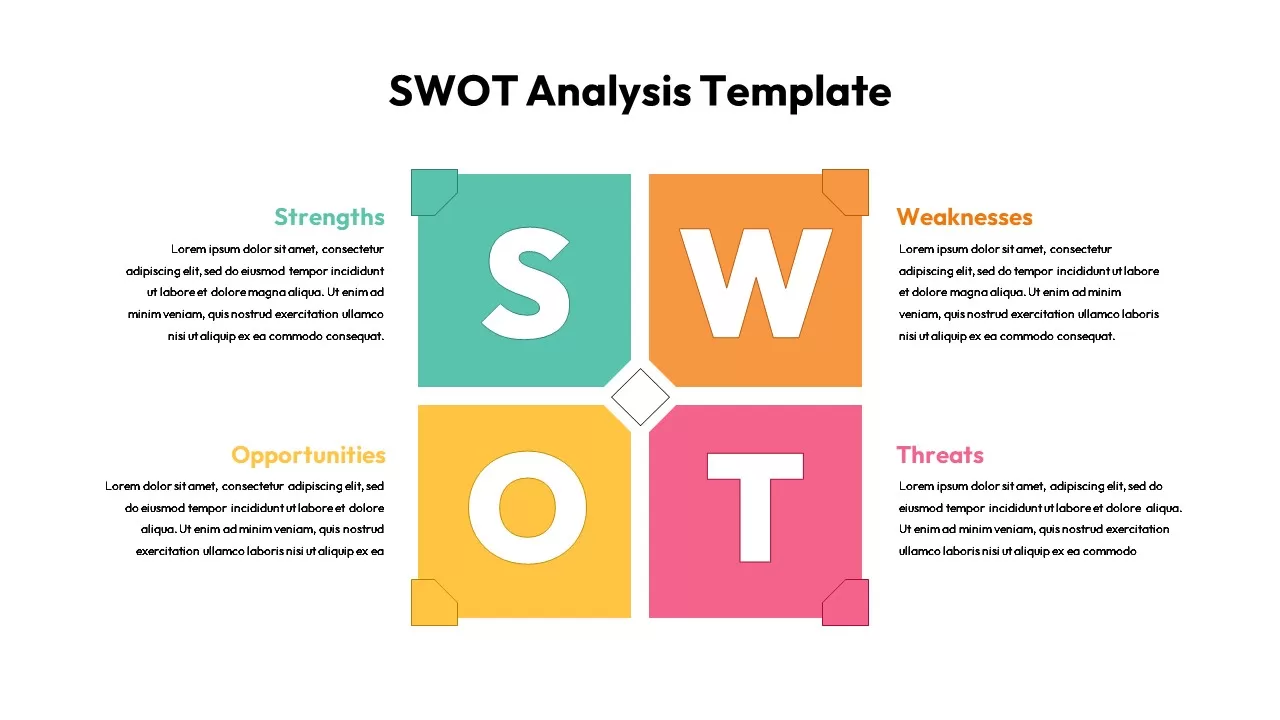
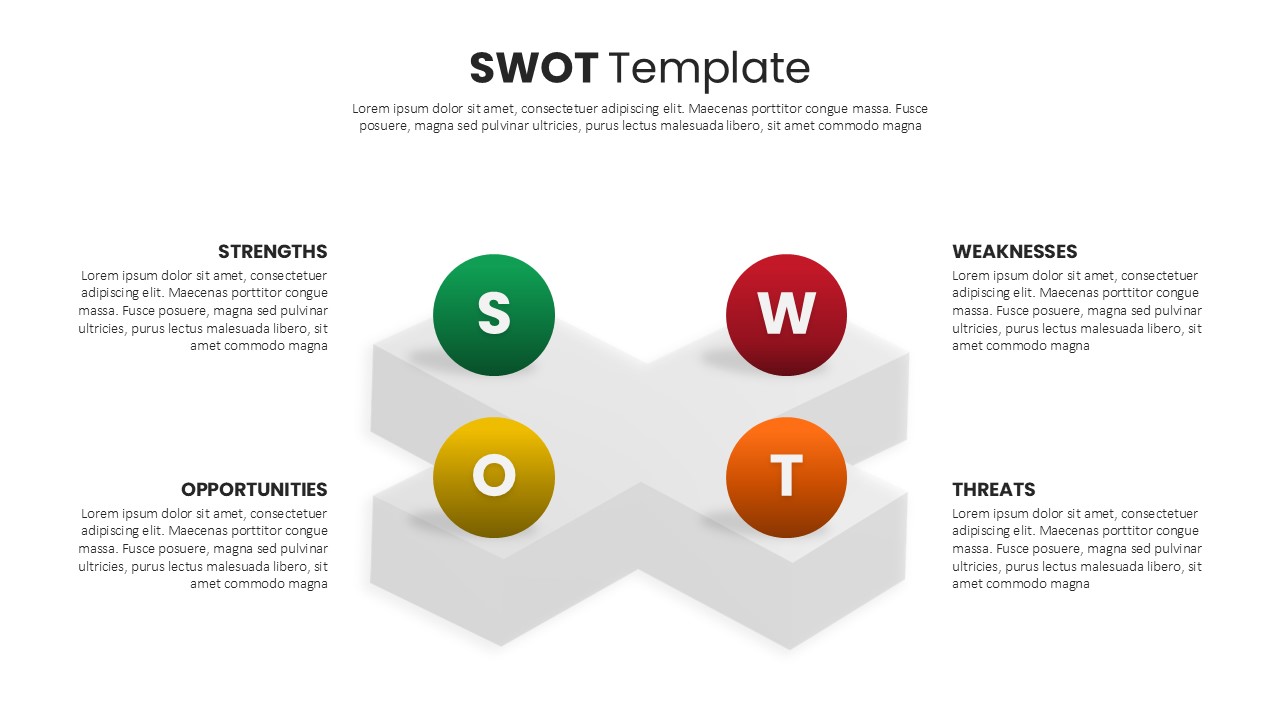
Four-Quadrant SWOT Analysis Diagram Template for PowerPoint & Google Slides
SWOT
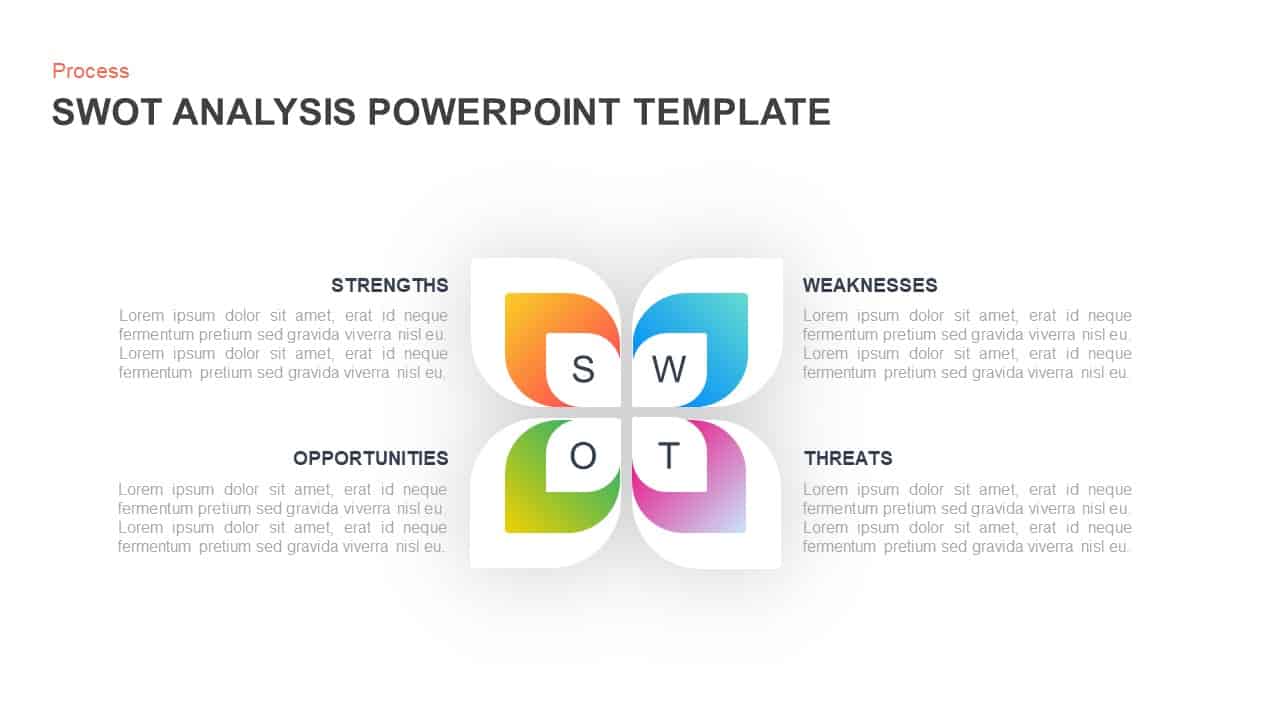
Gradient Petal SWOT Analysis Quadrant Template for PowerPoint & Google Slides
SWOT
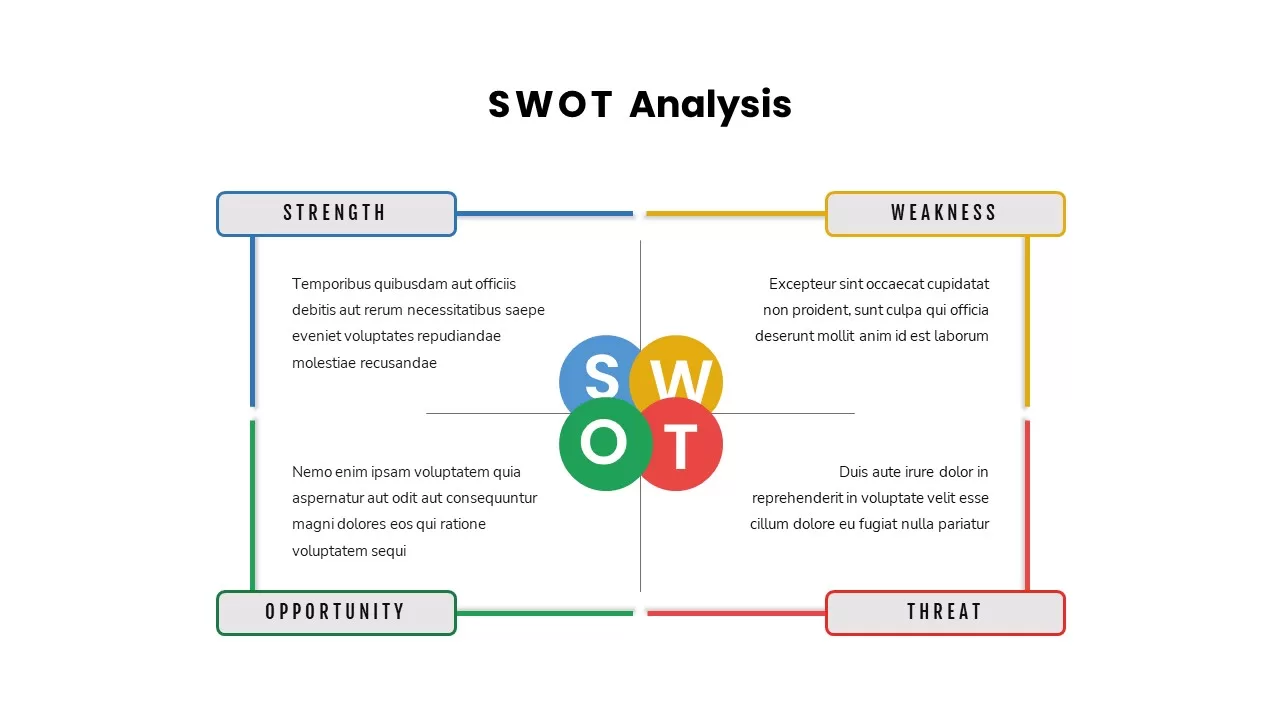
Modern Colorful SWOT Quadrant Analysis Template for PowerPoint & Google Slides
SWOT
Colorful SWOT Analysis Quadrant Template for PowerPoint & Google Slides
SWOT
SWOT Analysis Quadrant template for PowerPoint & Google Slides
Business Strategy
SWOT Analysis Quadrant template for PowerPoint & Google Slides
Business Strategy
Four Quadrant Scatter Chart Analysis Template for PowerPoint & Google Slides
Comparison Chart
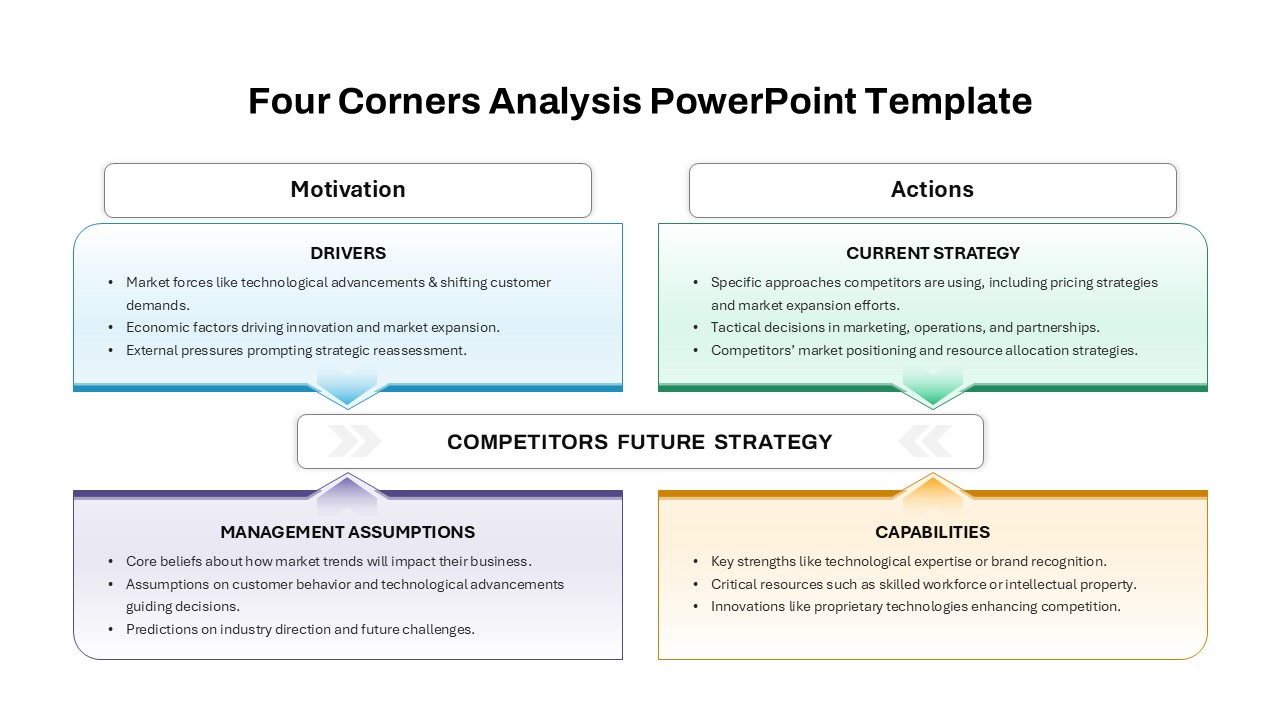
Four-Corners Strategic Analysis Quadrant Template for PowerPoint & Google Slides
SWOT
Colorful SWOT Analysis Quadrant Template for PowerPoint & Google Slides
SWOT
Multi Color SWOT Analysis Quadrant Template for PowerPoint & Google Slides
SWOT
3D Quadrant SWOT Analysis Template for PowerPoint & Google Slides
SWOT
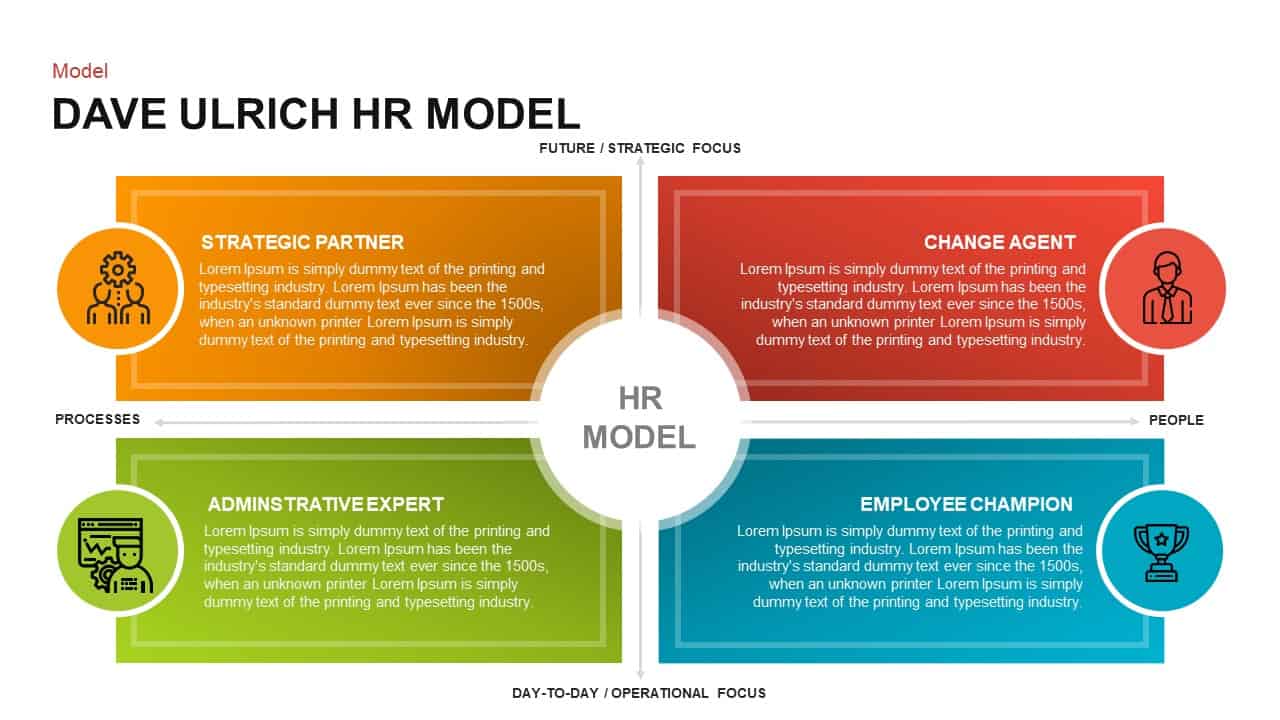
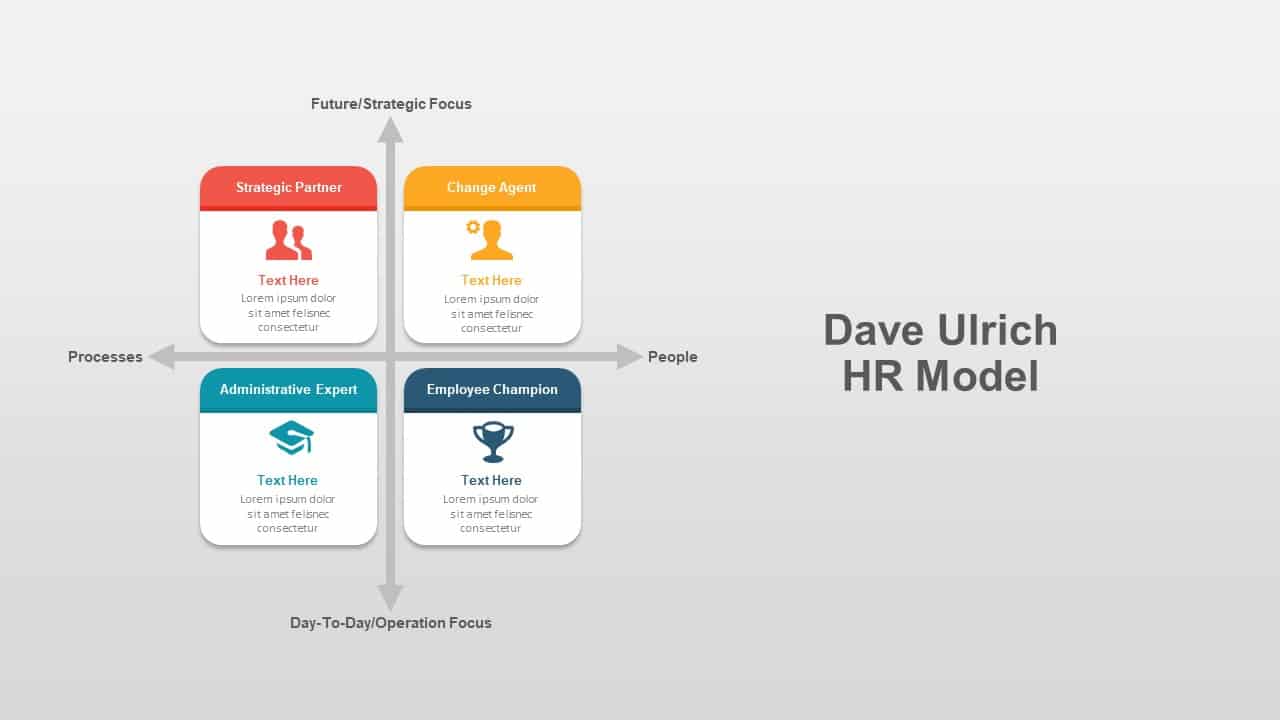
Dave Ulrich HR Model Template for PowerPoint and Keynote
Employee Performance
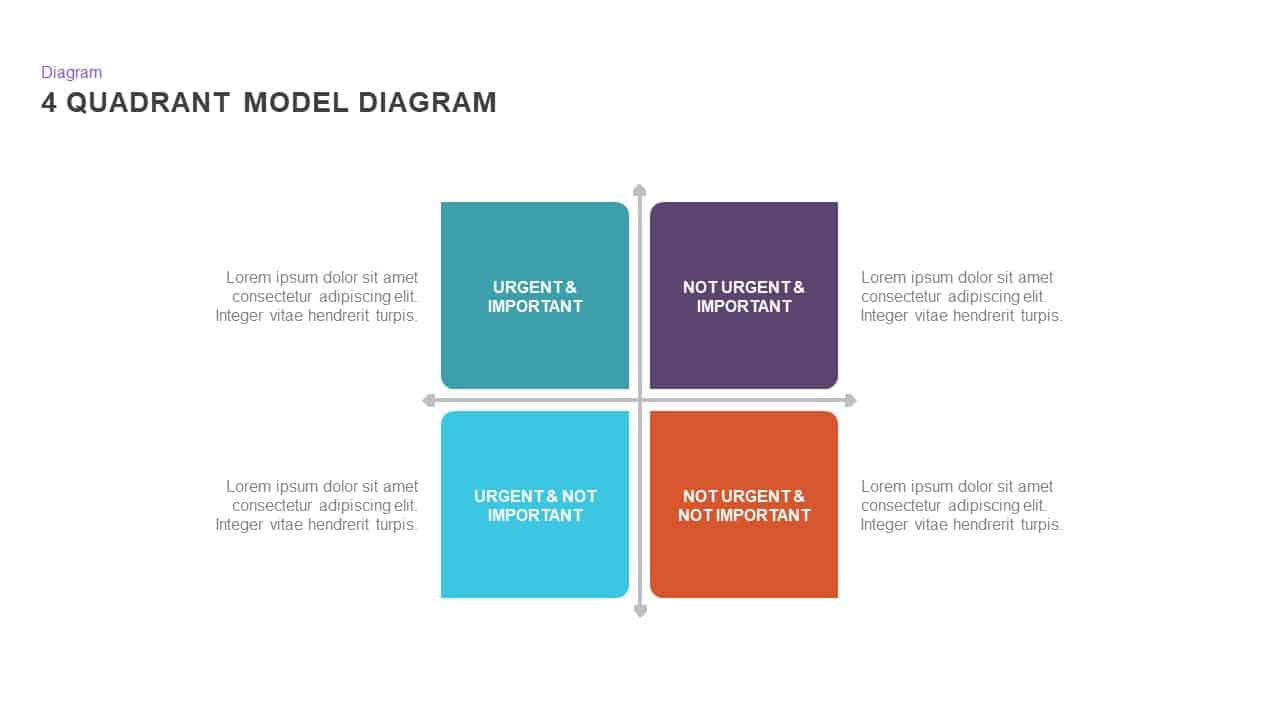
4 Quadrant PowerPoint Template
Process

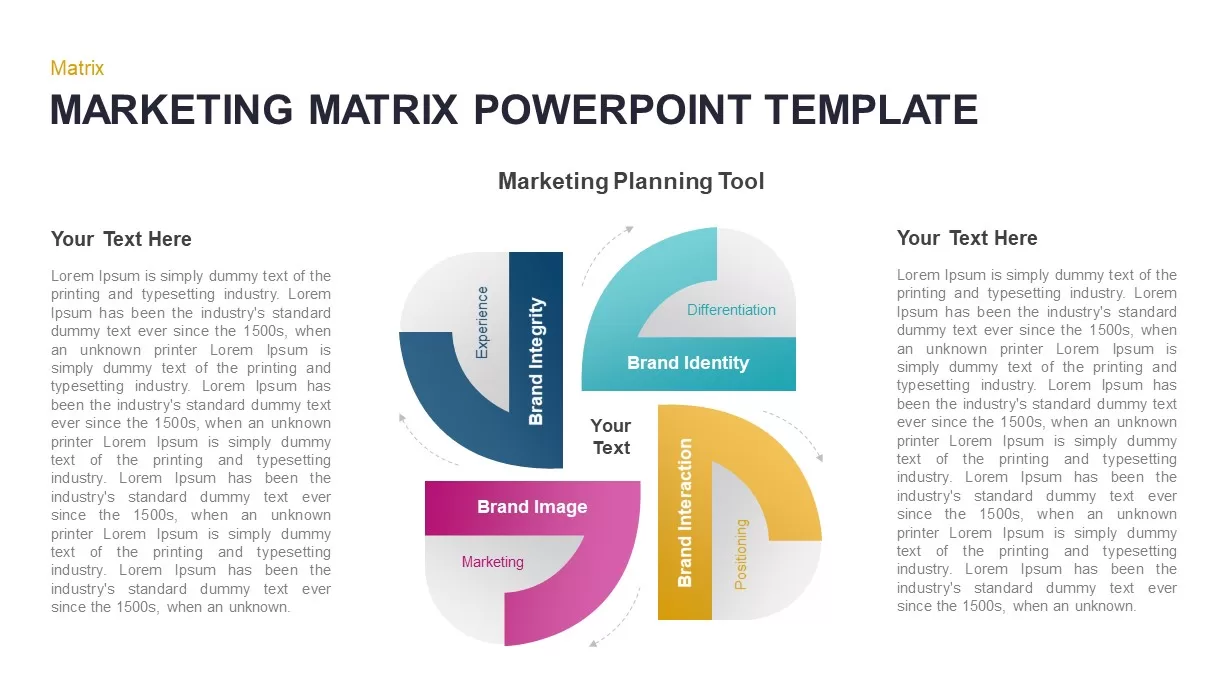
Marketing Matrix Brand Quadrant Diagram Template for PowerPoint & Google Slides
Process
Editable Four-Quadrant TOWS Matrix Template for PowerPoint & Google Slides
Opportunities Challenges
Gradient SWOT Quadrant Diagram Template for PowerPoint & Google Slides
SWOT
Opportunities Quadrant Diagram Template for PowerPoint & Google Slides
Opportunities Challenges
Modern Brainstorming Quadrant Slide Template for PowerPoint & Google Slides
Business Strategy
Emotional Intelligence Quadrant Template for PowerPoint & Google Slides
Circular
Free 4 Quadrant Template for PowerPoint & Google Slides
Business
Free
Free Balanced Scorecard Quadrant KPI Layout Template for PowerPoint & Google Slides
Employee Performance
Free
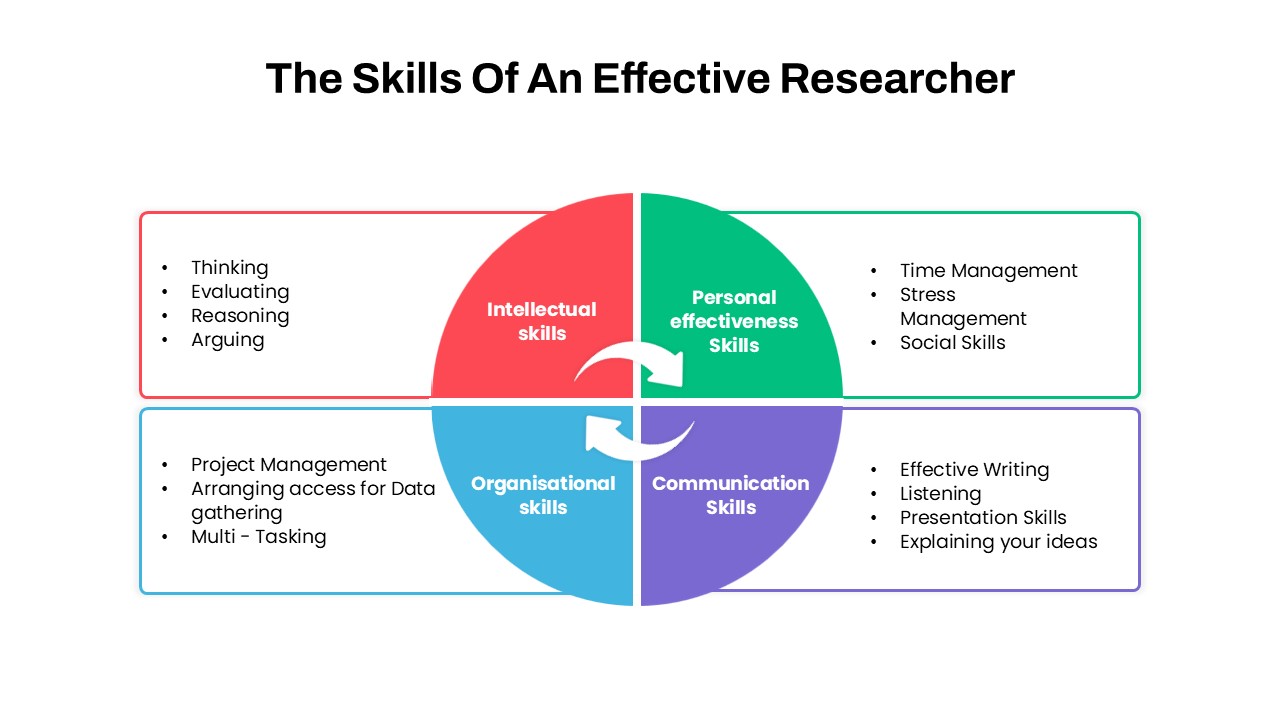
Researcher Skills Quadrant Diagram Template for PowerPoint & Google Slides
Circular
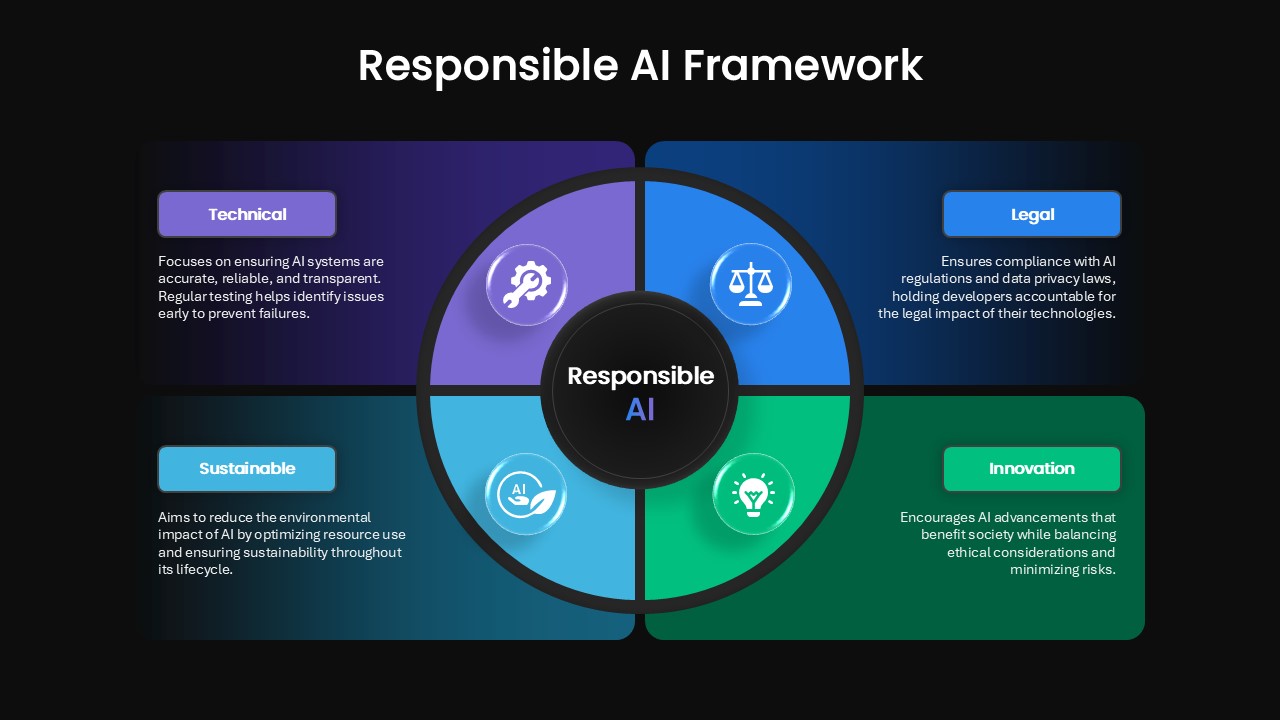
Four-Quadrant Responsible AI Framework Template for PowerPoint & Google Slides
Circular
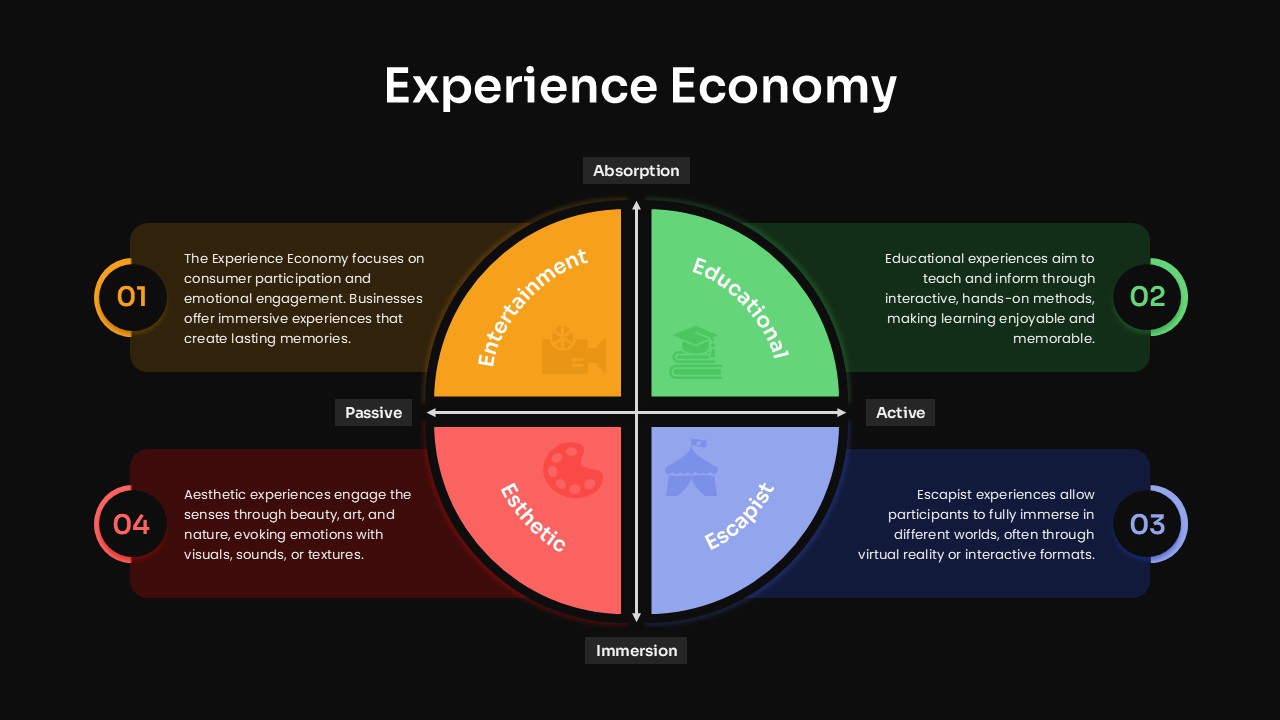
Experience Economy Quadrant Diagram Template for PowerPoint & Google Slides
Circular
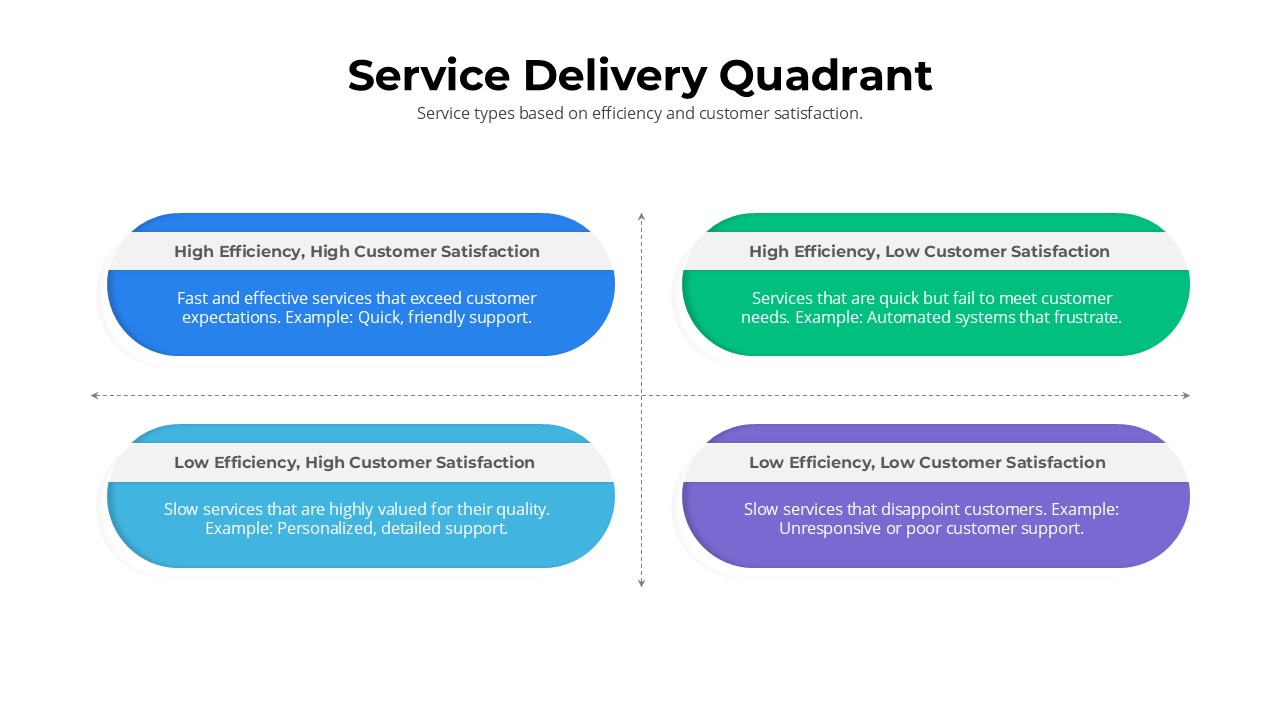
Service Delivery Quadrant Slide Template for PowerPoint & Google Slides
Comparison
Dave Ulrich HR Model 4-Quadrant Slide Deck for PowerPoint & Google Slides
HR
PEST Analysis PowerPoint Template for PowerPoint & Google Slides
Business Strategy
Mobile Data Analysis Chart template for PowerPoint & Google Slides
Charts
Donut Split Analysis template for PowerPoint & Google Slides
Pie/Donut
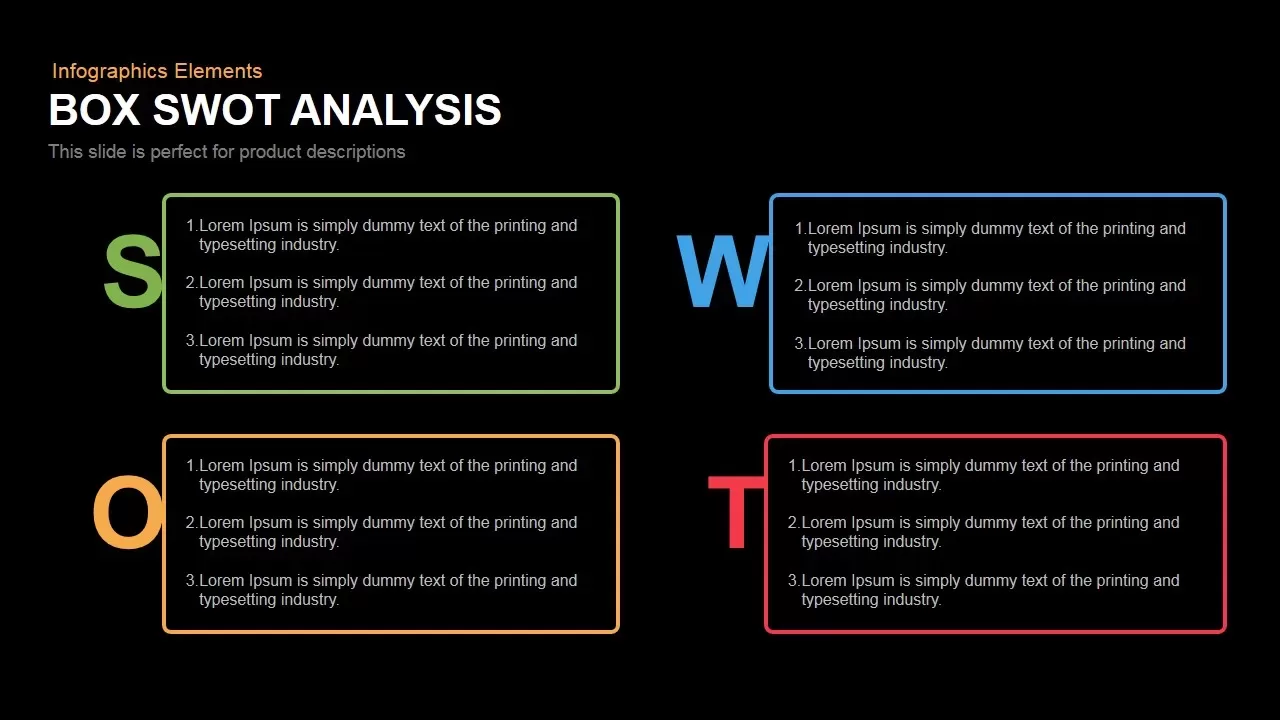
Box SWOT Analysis Infographic Template for PowerPoint & Google Slides
SWOT
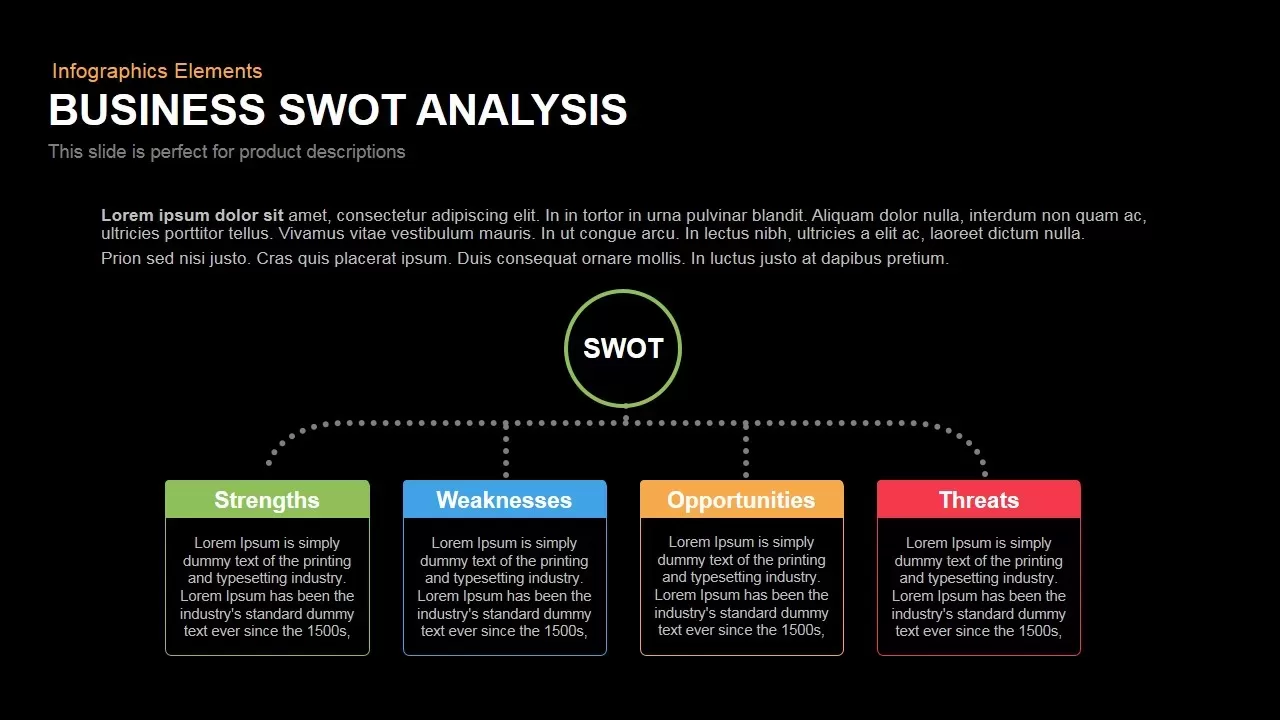
Box Business SWOT Analysis Template for PowerPoint & Google Slides
SWOT
E-Learning Report Analysis Template for PowerPoint & Google Slides
Infographics
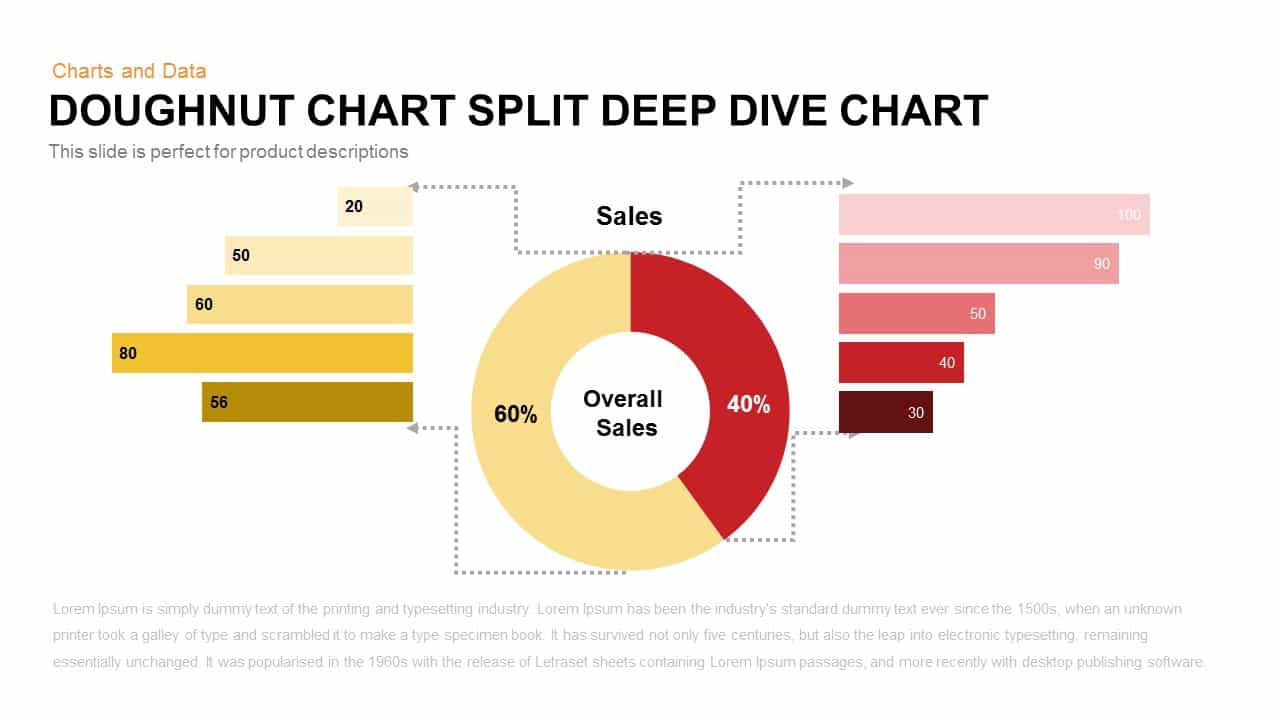
Split Doughnut Deep Dive Sales Analysis Template for PowerPoint & Google Slides
Pie/Donut
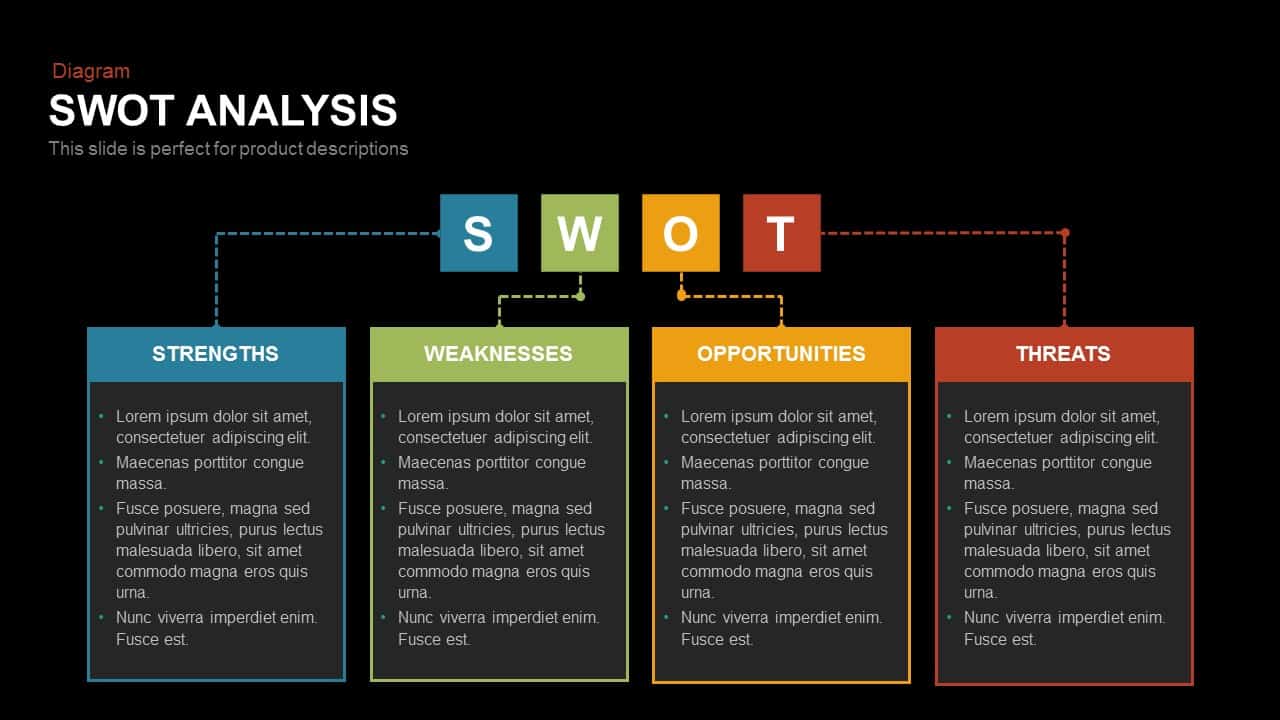
SWOT Analysis template for PowerPoint & Google Slides
SWOT
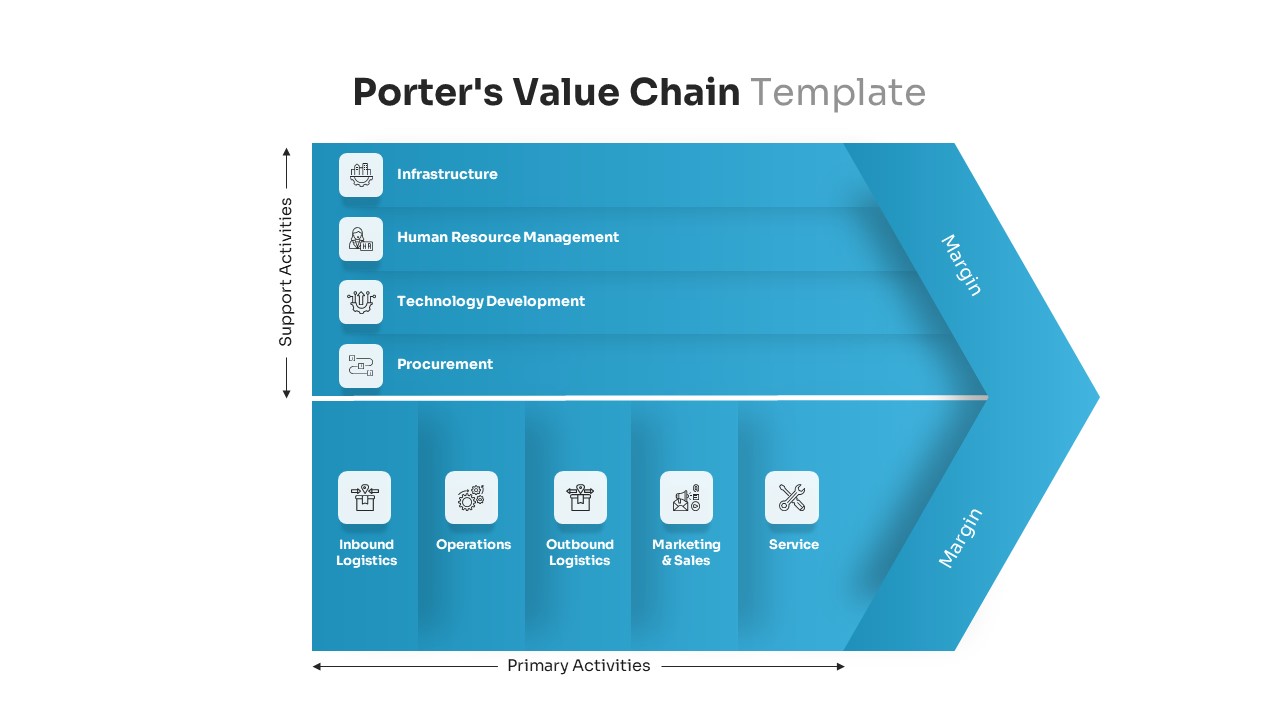
Porter’s Value Chain Analysis Diagram Template for PowerPoint & Google Slides
Business Strategy
Editable Force Field Analysis Diagram Template for PowerPoint & Google Slides
Business Plan
Free SWOT Analysis template for PowerPoint & Google Slides
SWOT
Free
Puzzle-Style SWOT Analysis Table Diagram Template for PowerPoint & Google Slides
SWOT
PEST Analysis Circular Diagram Template for PowerPoint & Google Slides
PEST
PESTLE Analysis Table Layout Diagram Template for PowerPoint & Google Slides
PEST
SWOT Analysis Gear Diagram Slide Template for PowerPoint & Google Slides
SWOT

Interactive Gap Analysis Puzzle Diagram Template for PowerPoint & Google Slides
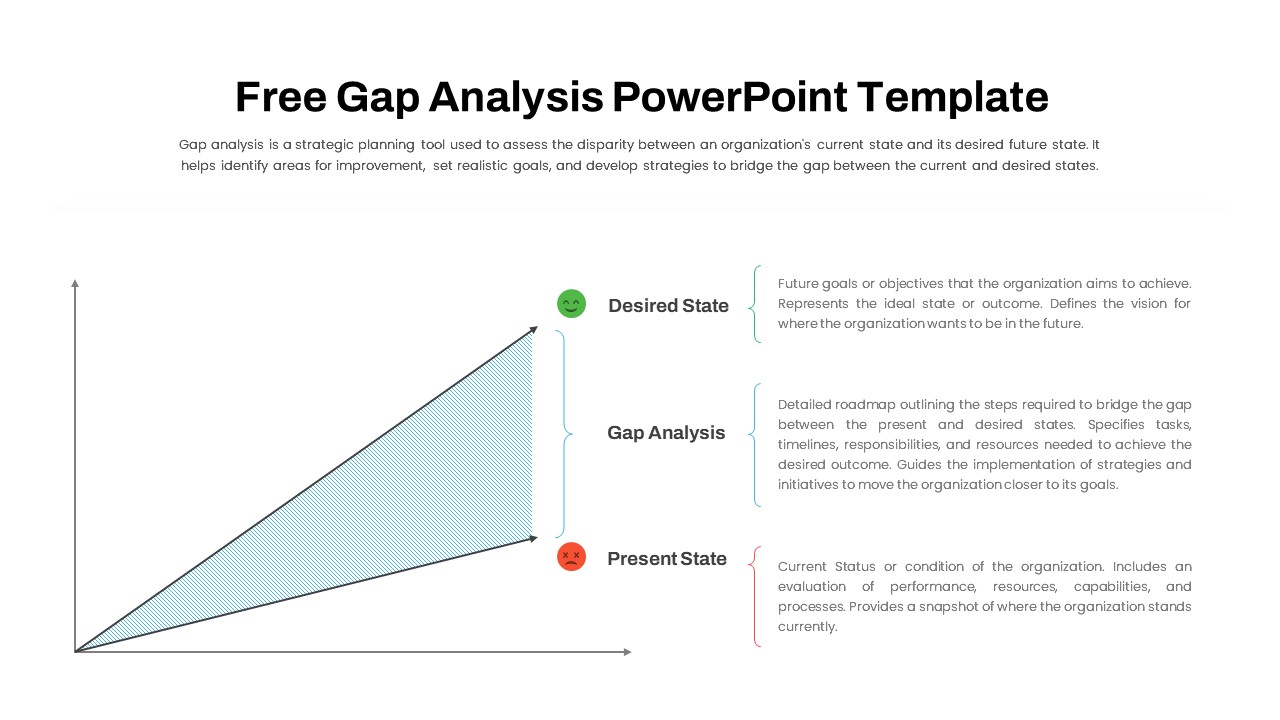
Gap
Interactive 3D Puzzle SWOT Analysis Slide Template for PowerPoint & Google Slides
SWOT
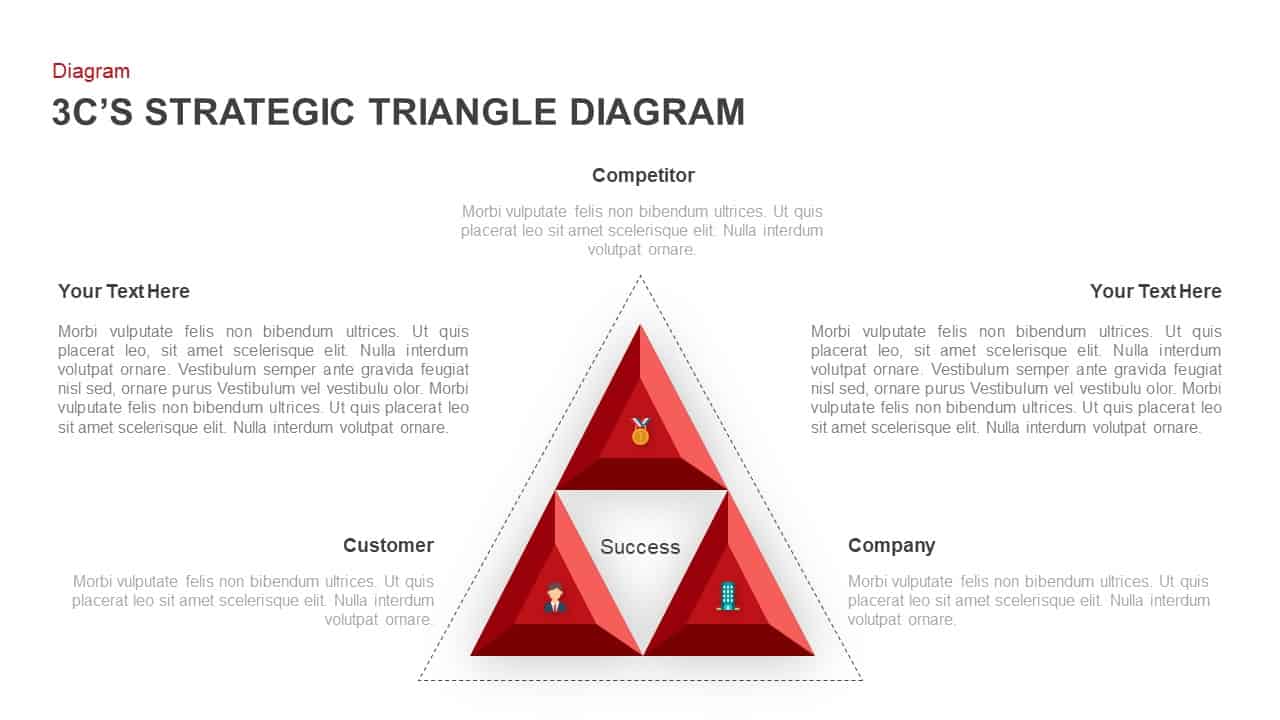
3C Strategic Triangle Analysis Template for PowerPoint & Google Slides
Competitor Analysis
Versatile SWOT Analysis Slide Collection Template for PowerPoint & Google Slides
SWOT
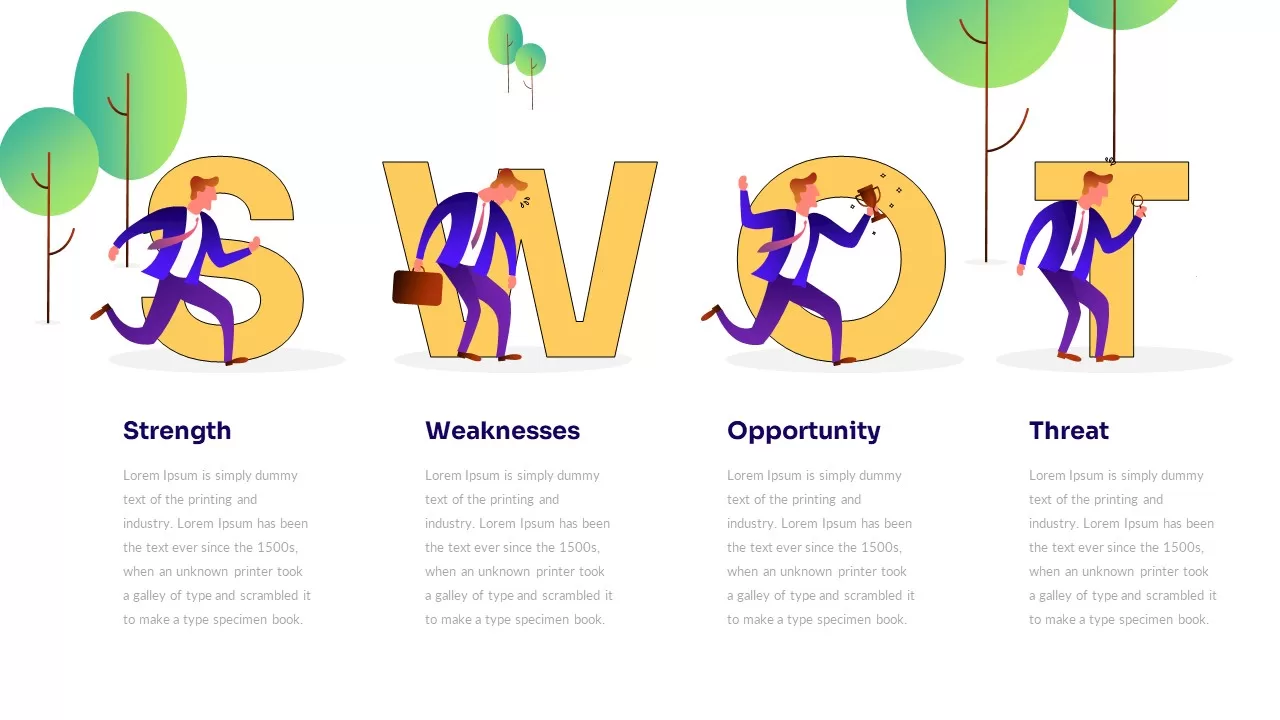
Illustrated Business SWOT Analysis Template for PowerPoint & Google Slides
SWOT
Fishbone Cause Analysis Diagram Template for PowerPoint & Google Slides
Process
Break-Even Analysis template for PowerPoint & Google Slides
Process
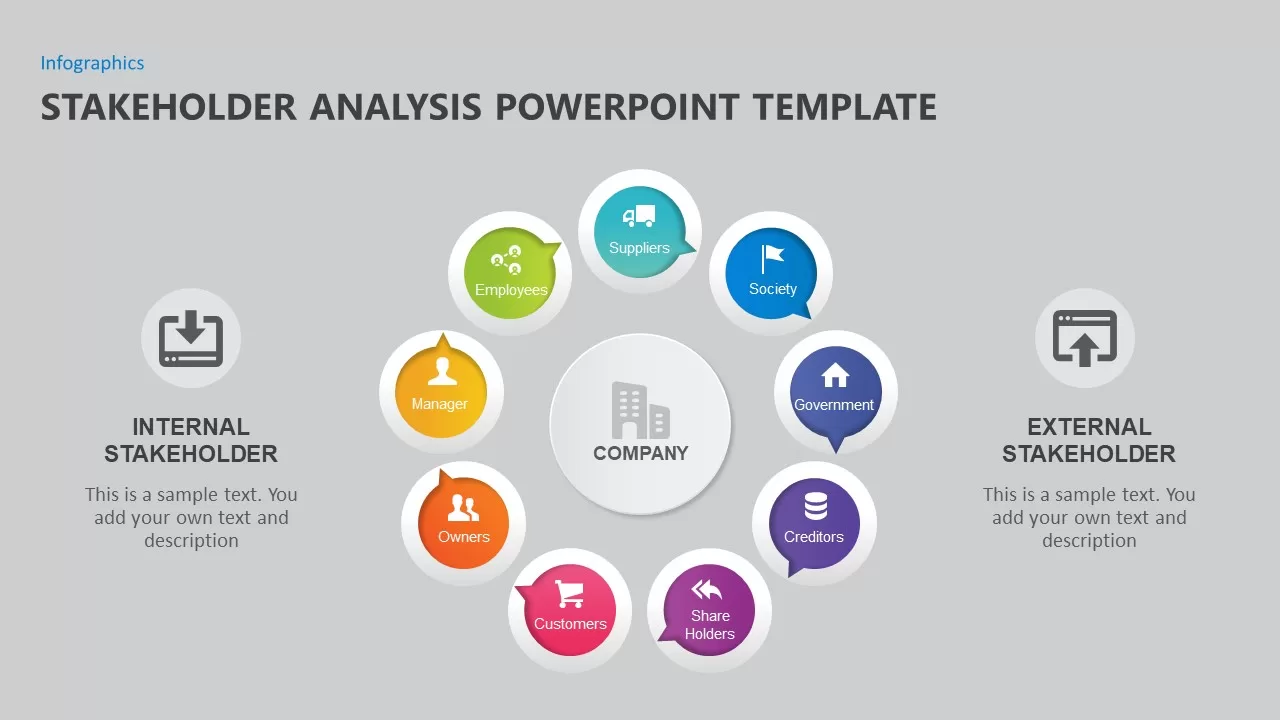
Stakeholder Analysis Template for PowerPoint
Business
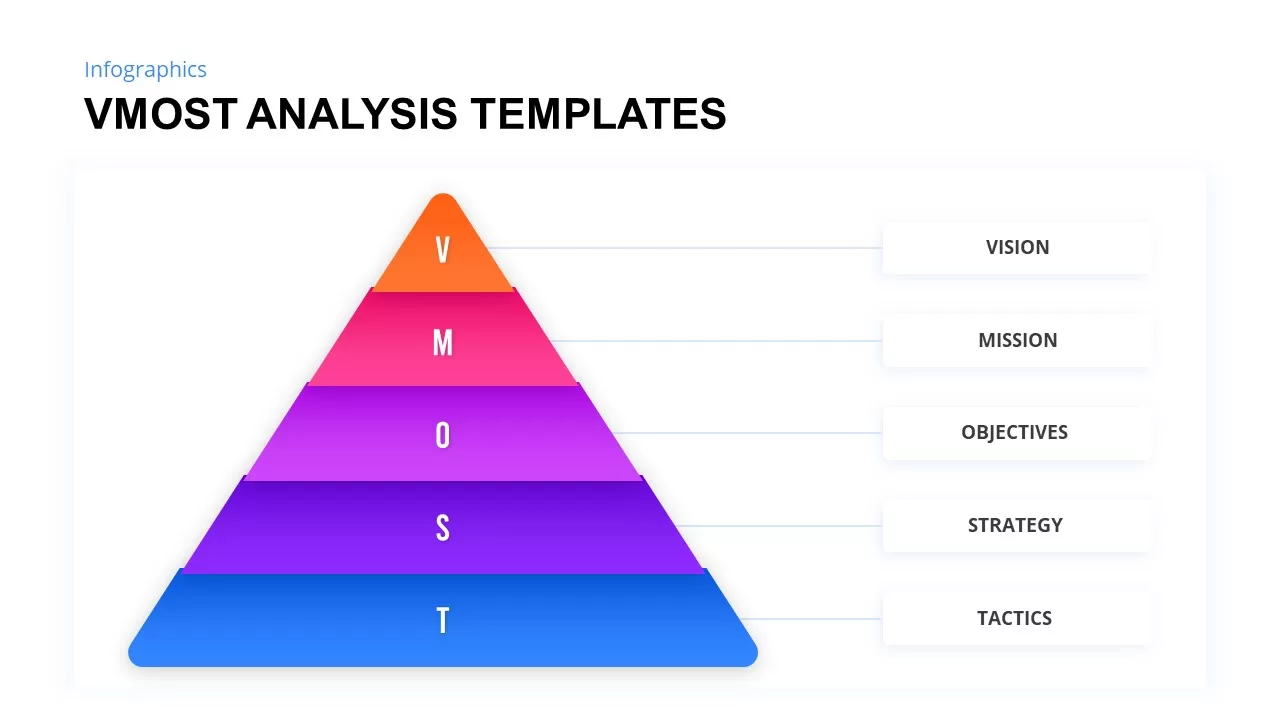
VMOST Analysis Template for PowerPoint & Google Slides
Business Strategy
IQ Scale Analysis Diagram template for PowerPoint & Google Slides
Employee Performance
Problem Statement Infographic PowerPoint Template
Business Strategy
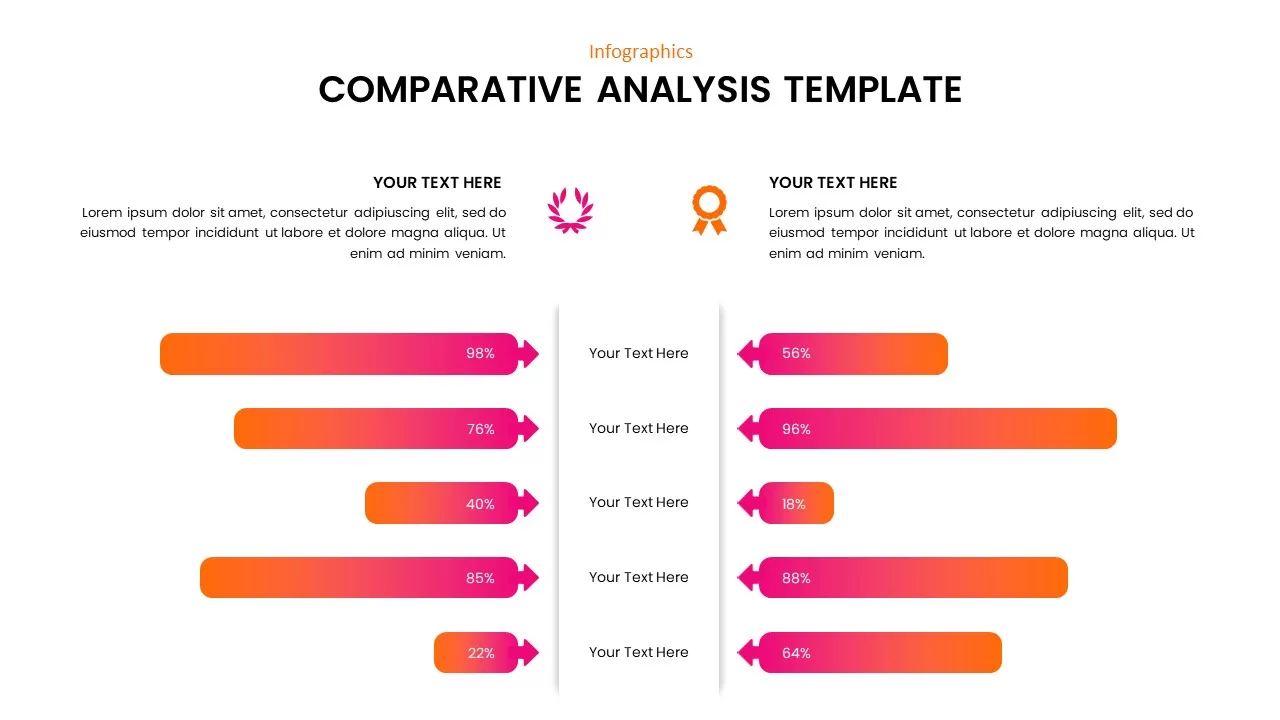
Comparative Analysis template for PowerPoint & Google Slides
Business Report
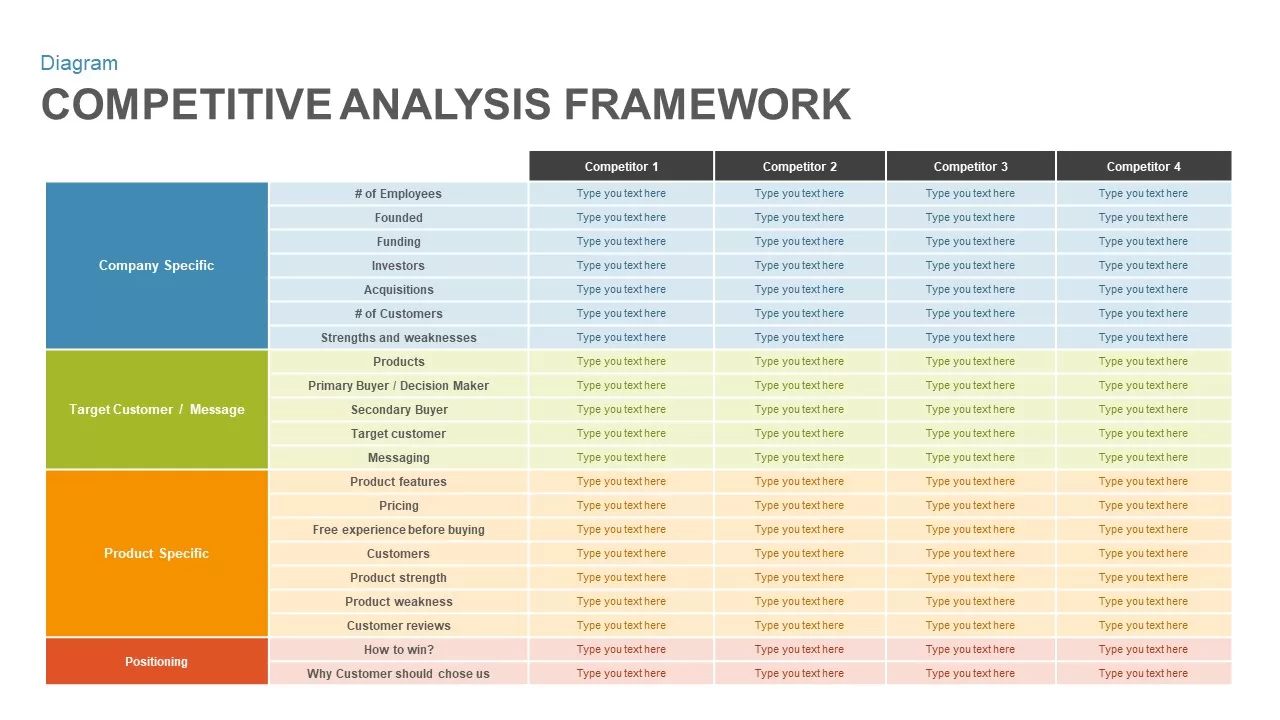
Competitive Analysis Framework Template
Business Report
Circular SWOT Analysis Infographic Template for PowerPoint & Google Slides
SWOT
Risk Impact Analysis Template
Risk Management
Colorful Vertical SWOT Analysis Layout Template for PowerPoint & Google Slides
SWOT
SWOT Analysis Framework template for PowerPoint & Google Slides
SWOT
SWOT Analysis Overview template for PowerPoint & Google Slides
Business
SWOT Analysis Template for PowerPoint & Google Slides
Business Strategy
SWOT Analysis template for PowerPoint & Google Slides
SWOT
Puzzle Piece SWOT Analysis Diagram Template for PowerPoint & Google Slides
Opportunities Challenges
Photo Personal SWOT Analysis Callouts Template for PowerPoint & Google Slides
SWOT
Current vs Future State Analysis template for PowerPoint & Google Slides
Comparison
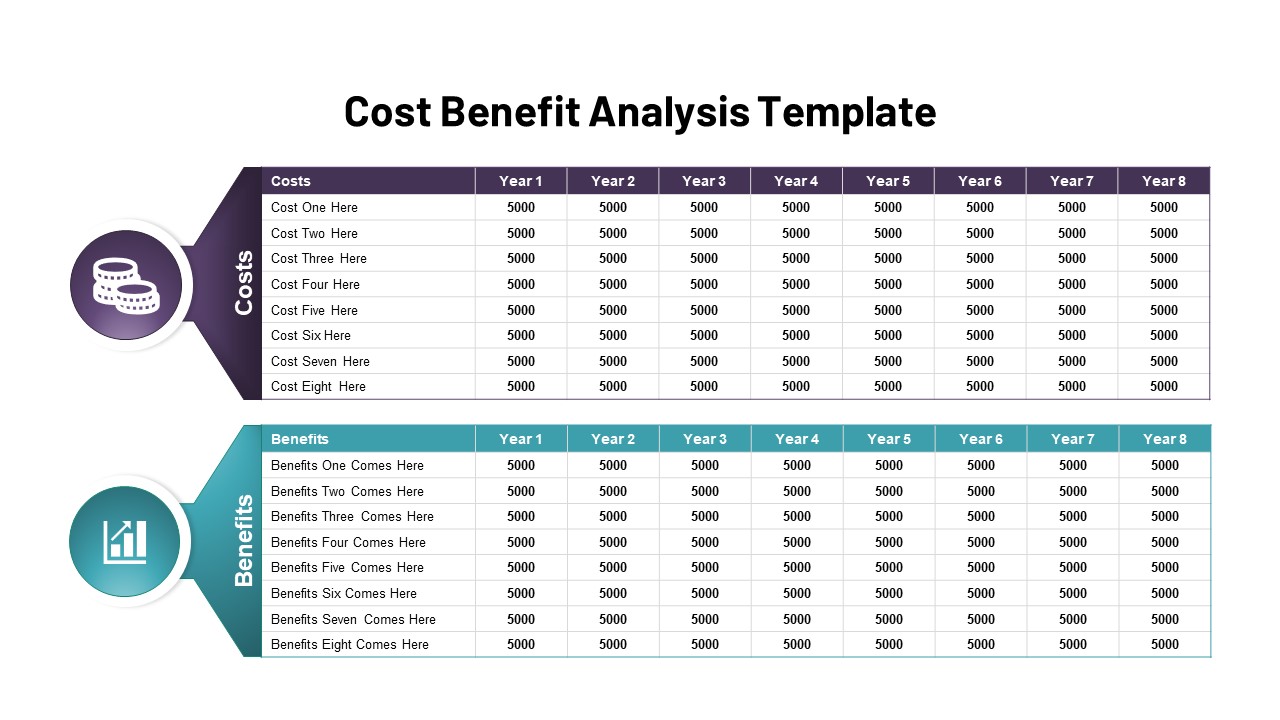
Cost Benefit Analysis Template PowerPoint and Google Slides
Comparison
Cost Benefit Analysis Comparison Template for PowerPoint & Google Slides
Comparison
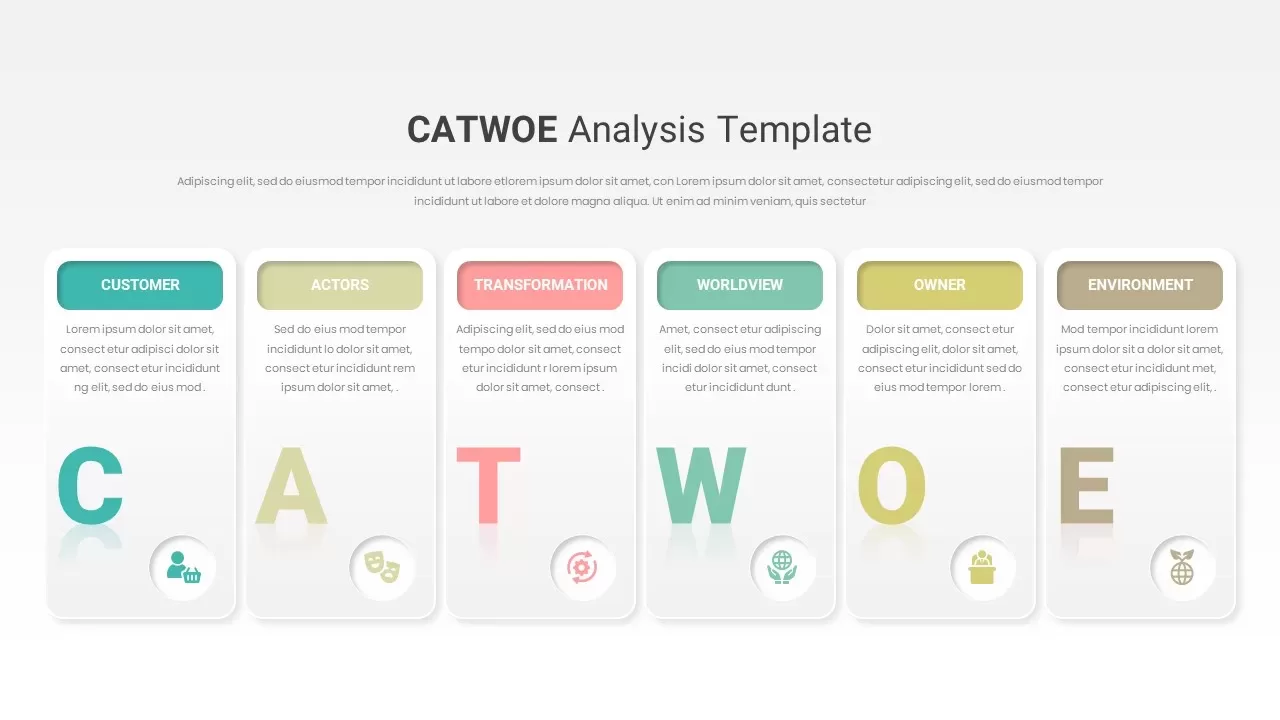
CATWOE Analysis Template for PowerPoint & Google Slides
Process
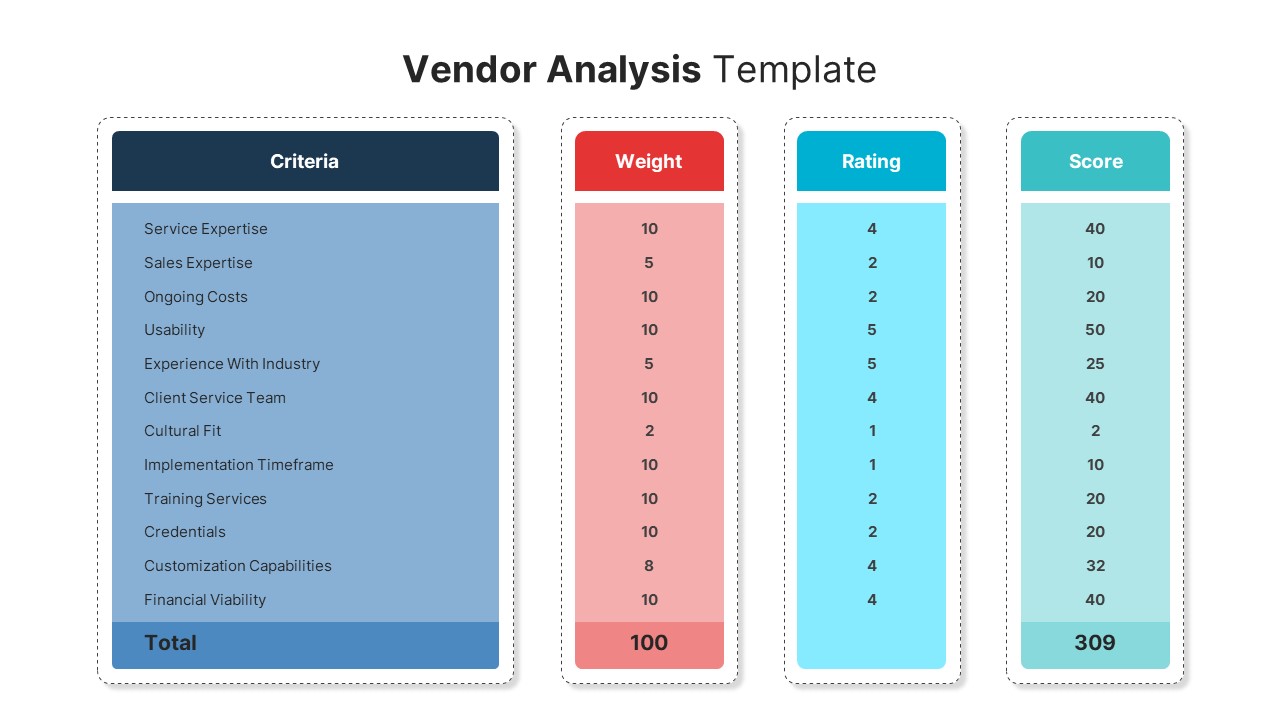
Vendor Analysis Criteria and Scoring template for PowerPoint & Google Slides
Business
Vendor Comparison Analysis template for PowerPoint & Google Slides
Comparison Chart
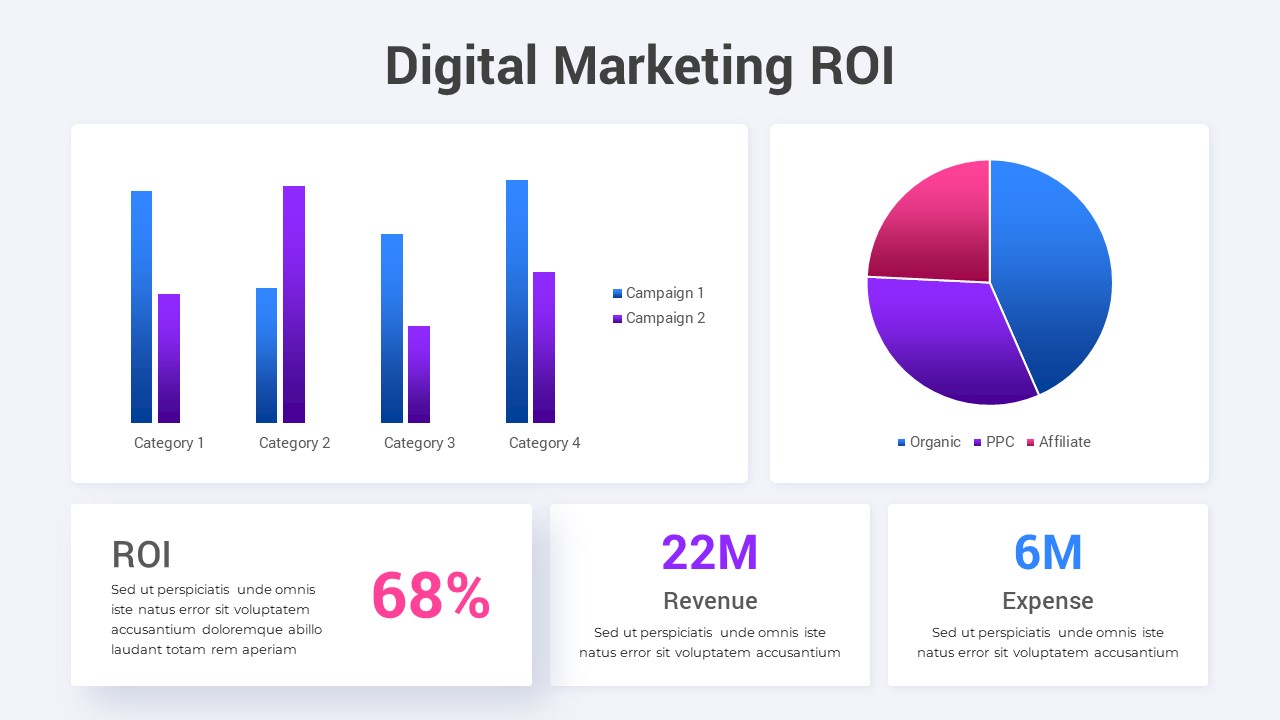
Digital Marketing ROI Analysis template for PowerPoint & Google Slides
Digital Marketing
Social Media Analysis Metrics Slide Deck Template for PowerPoint & Google Slides
Digital Marketing
Risk Pyramid Hierarchy Analysis Template for PowerPoint & Google Slides
Pyramid
Business Process Analysis Cycle Diagram Template for PowerPoint & Google Slides
Business Strategy
Population Pyramid Chart Analysis Template for PowerPoint & Google Slides
Bar/Column
Waterfall Column Chart Analysis Template for PowerPoint & Google Slides
Bar/Column
Waterfall Bar Chart Analysis Template for PowerPoint & Google Slides
Bar/Column
Proportional Area Chart Analysis Template for PowerPoint & Google Slides
Comparison Chart
Free Stock Market PowerPoint Template
Pitch Deck
Free
Free Competitor Analysis Matrix Template for PowerPoint & Google Slides
Competitor Analysis
Free
Free Comprehensive Gap Analysis Framework Template for PowerPoint & Google Slides
Opportunities Challenges
Free
Bottleneck Process Analysis Diagram Template for PowerPoint & Google Slides
Process
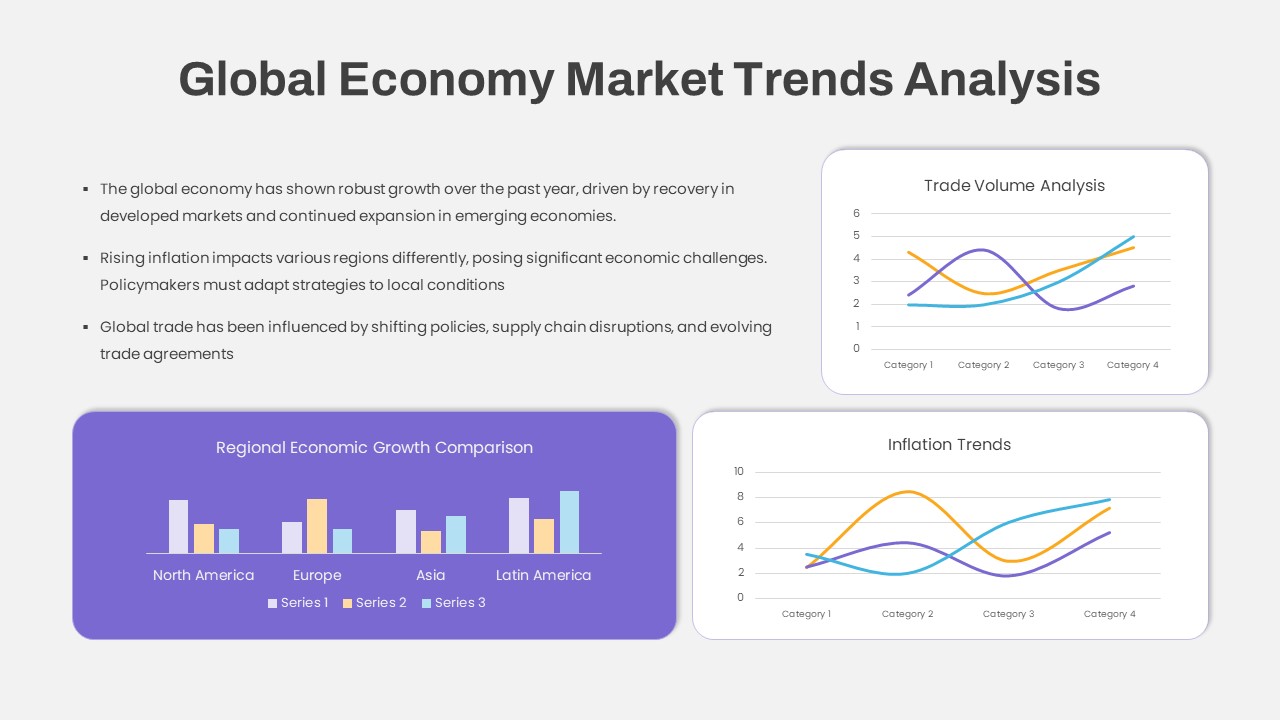
Global Economy Market Trends Analysis Template for PowerPoint & Google Slides
Comparison Chart
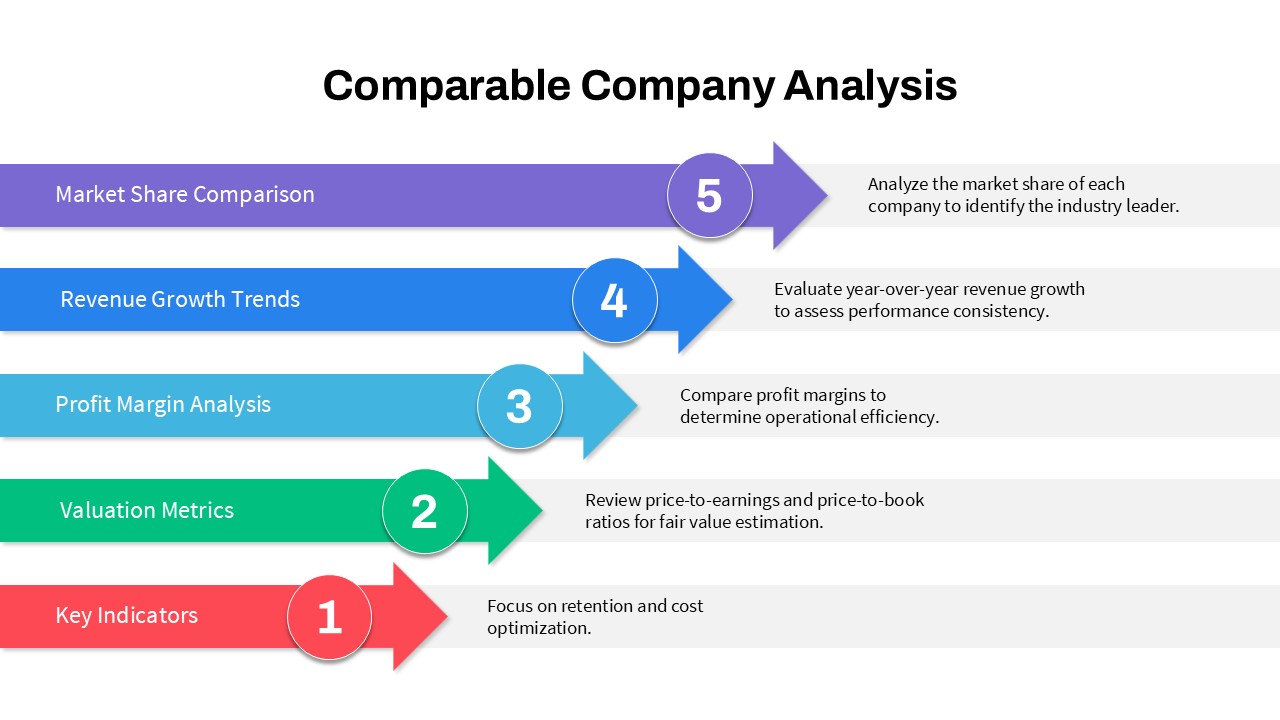
5-Step Comparable Company Analysis Template for PowerPoint & Google Slides
Arrow
DESTEP Marketing Analysis Diagram Template for PowerPoint & Google Slides
Circular
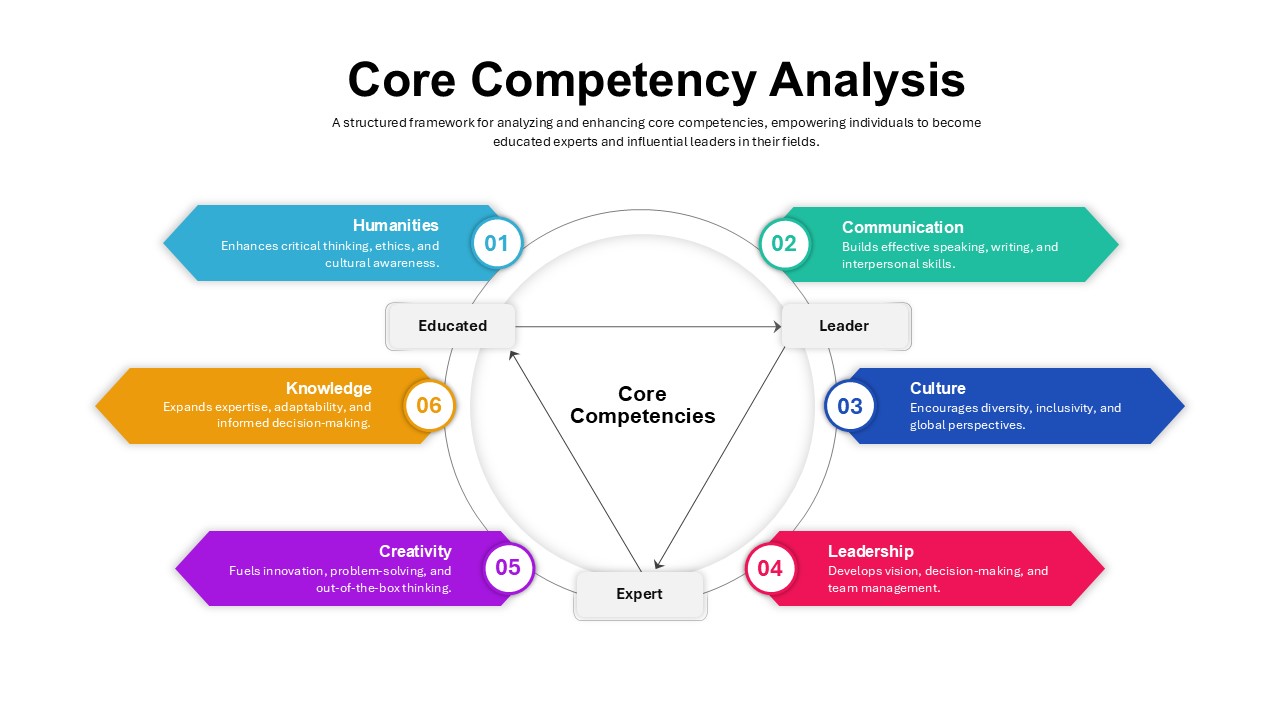
Core Competency Analysis Circular Template for PowerPoint & Google Slides
Circular
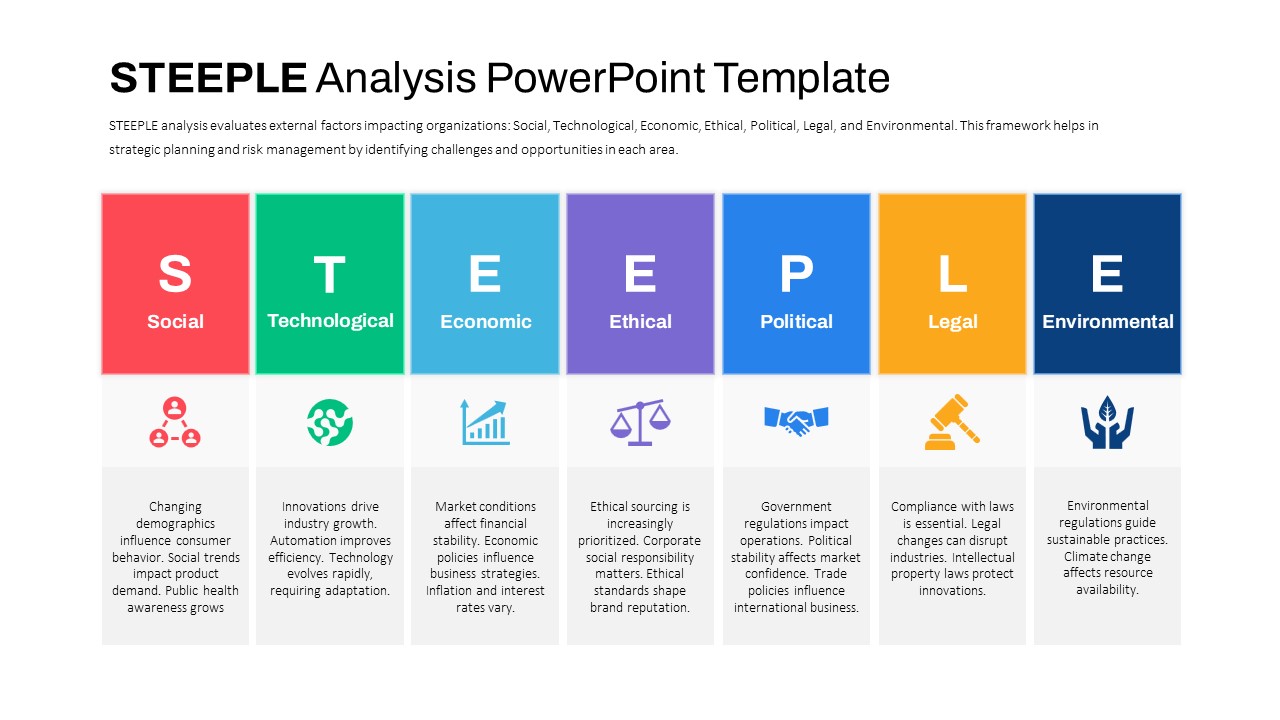
STEEPLE Analysis framework template for PowerPoint & Google Slides
Business Strategy
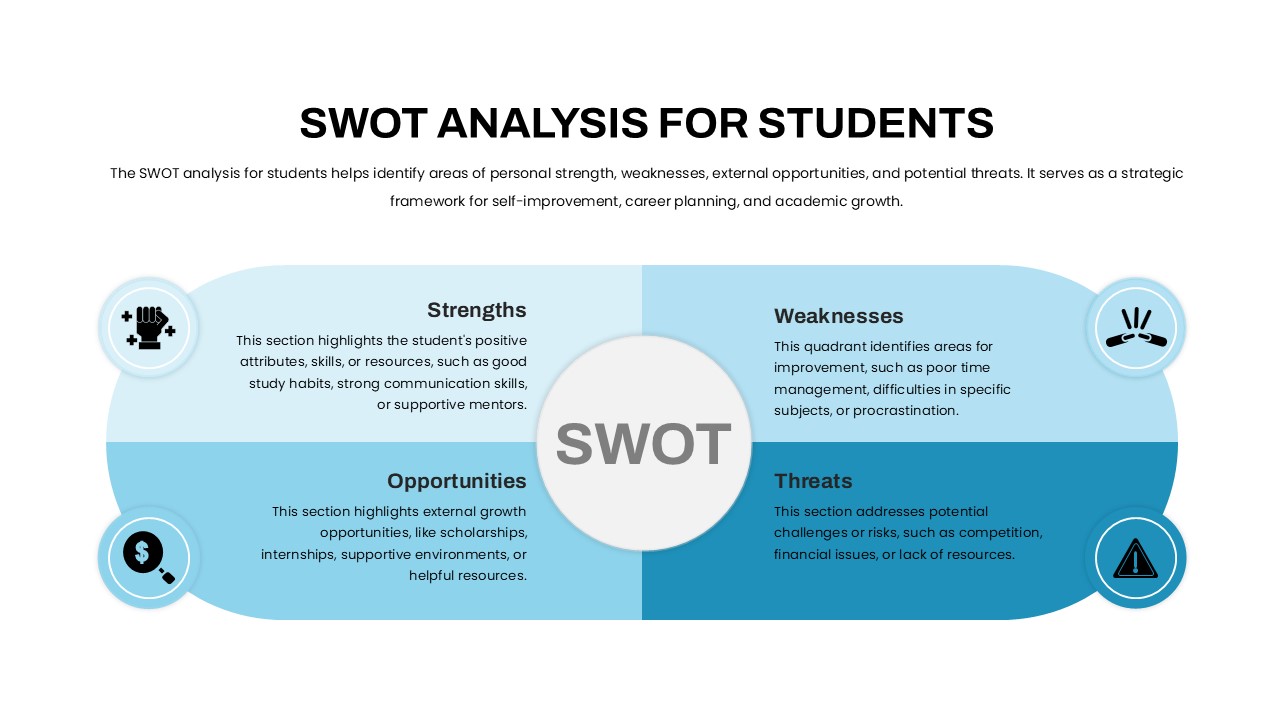
Student SWOT Analysis Framework Template for PowerPoint & Google Slides
SWOT
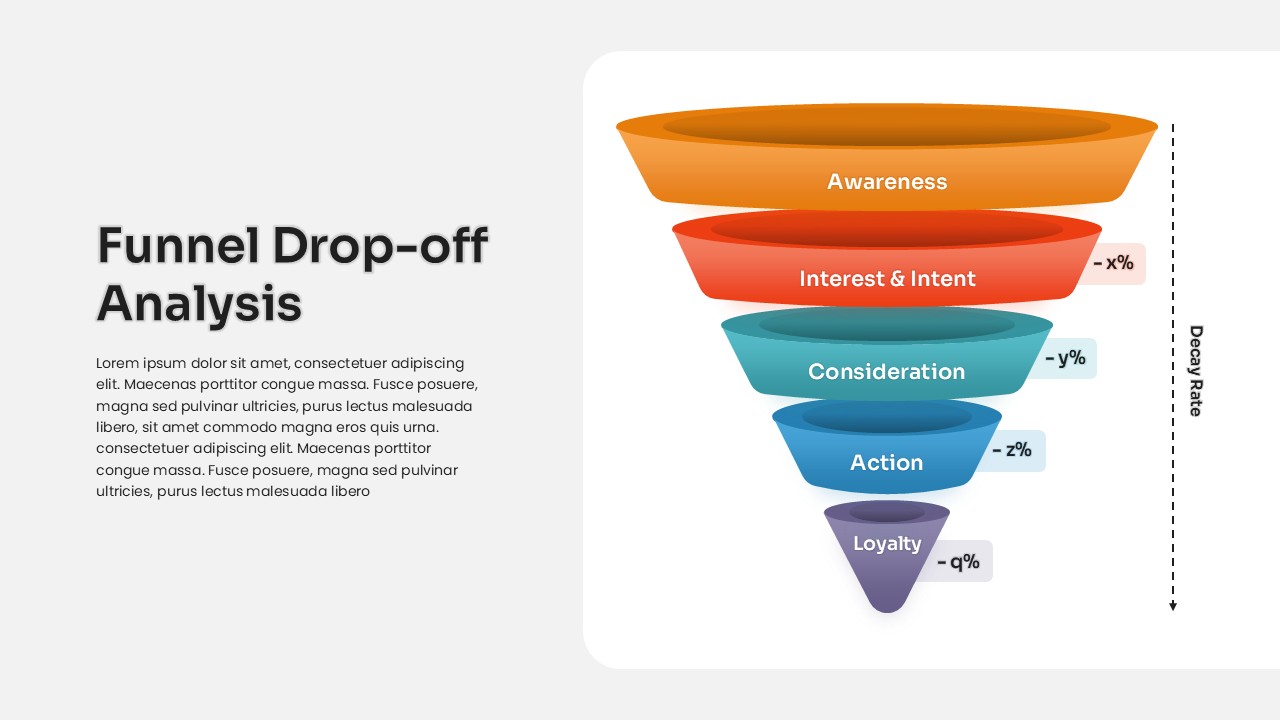
Funnel Drop-off Analysis template for PowerPoint & Google Slides
Business
Category Analysis Comparison Infographic Template for PowerPoint & Google Slides
Comparison
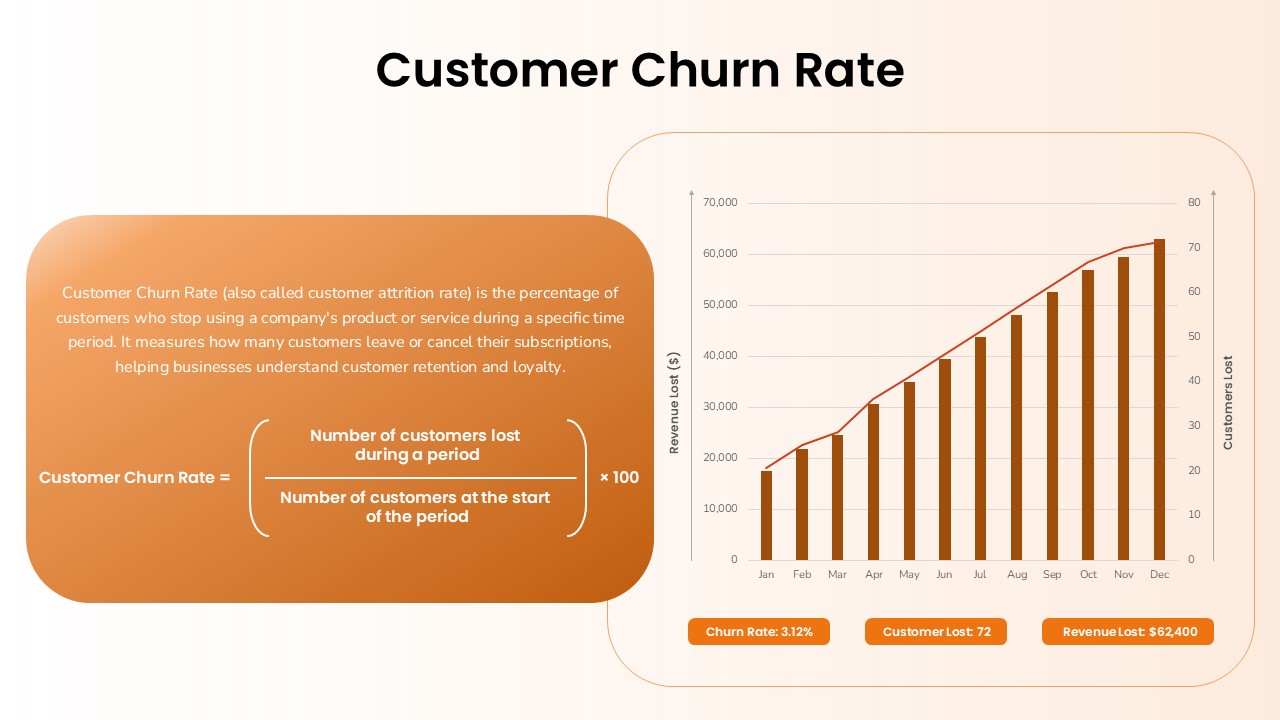
Customer Churn Rate Analysis template for PowerPoint & Google Slides
Business Report
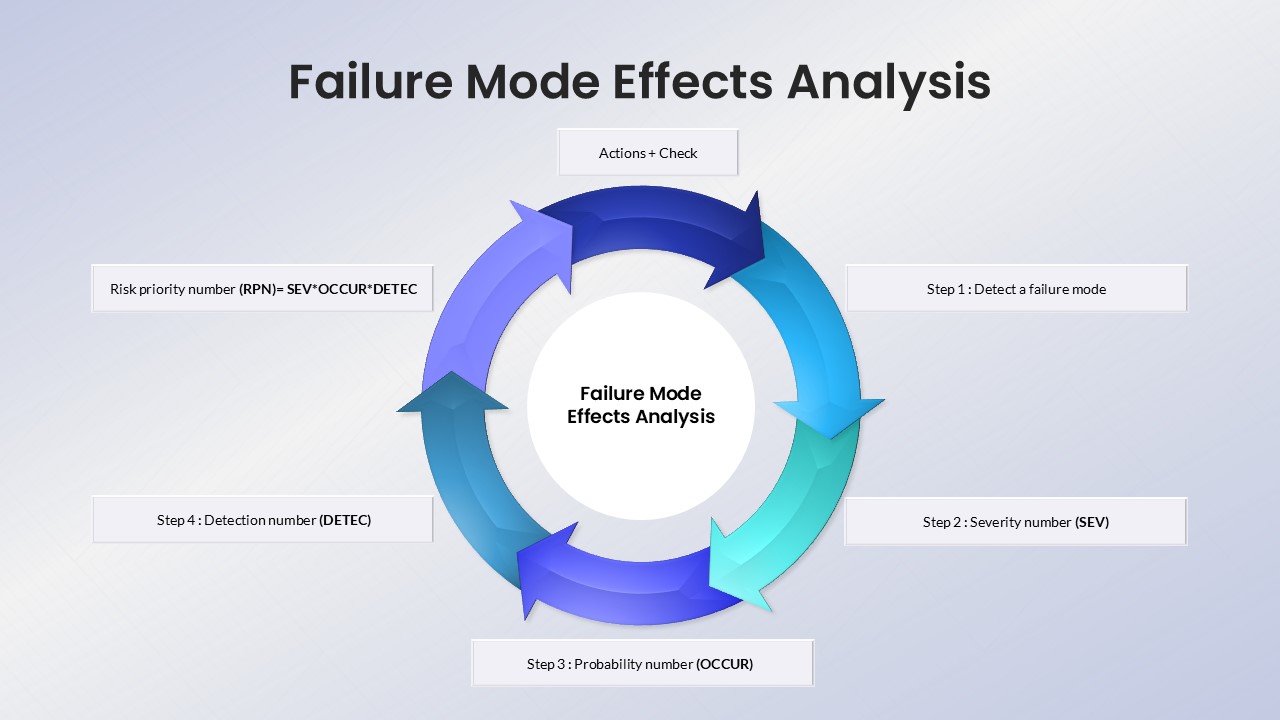
Failure Mode Effects Analysis (FMEA) Slide Template for PowerPoint & Google Slides
Process
Quantitative Risk Analysis Matrix template for PowerPoint & Google Slides
Risk Management
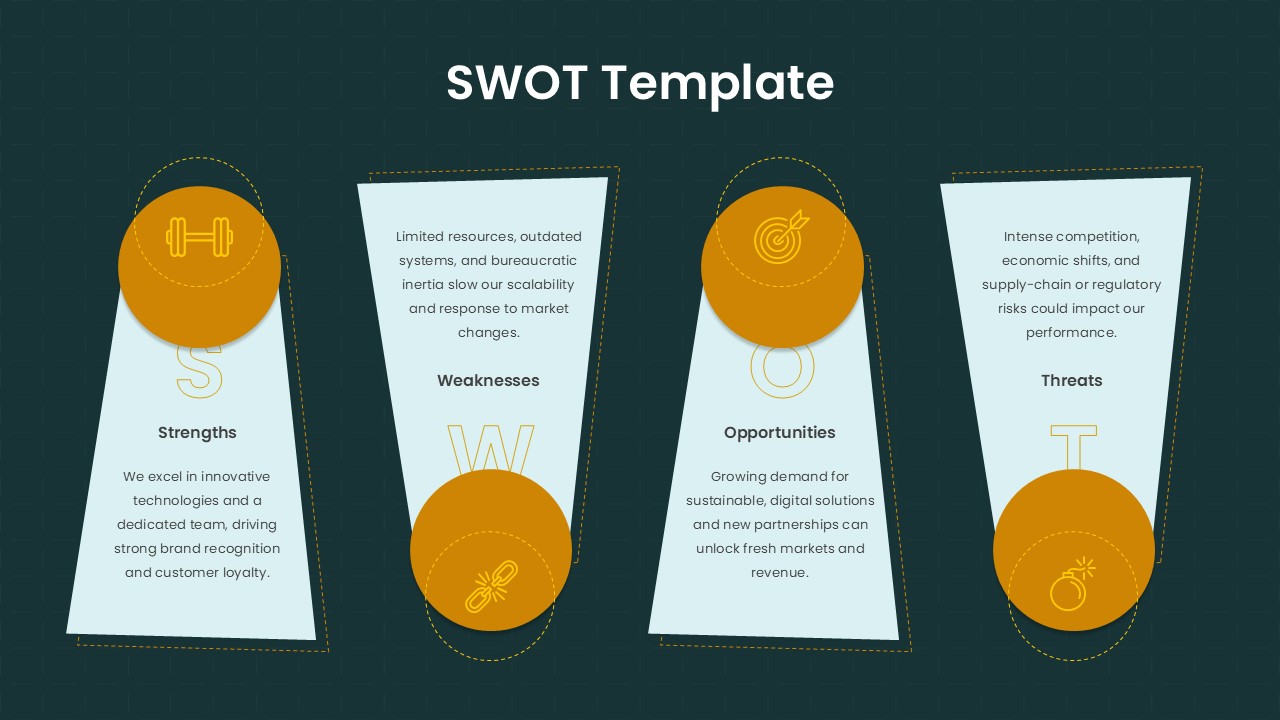
Trapezoid SWOT Analysis Template for PowerPoint & Google Slides
SWOT
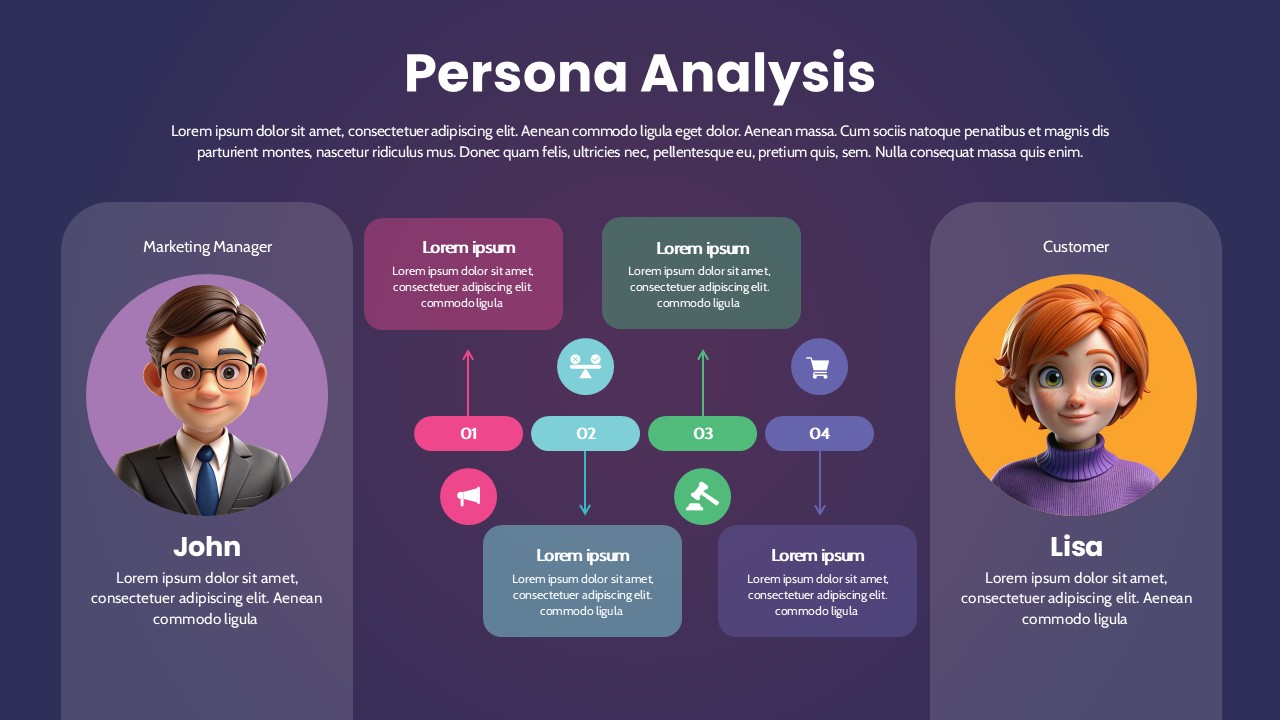
Persona Analysis Template for PowerPoint & Google Slides
Infographics
Cohort Analysis Retention Dashboard Template for PowerPoint & Google Slides
Comparison Chart
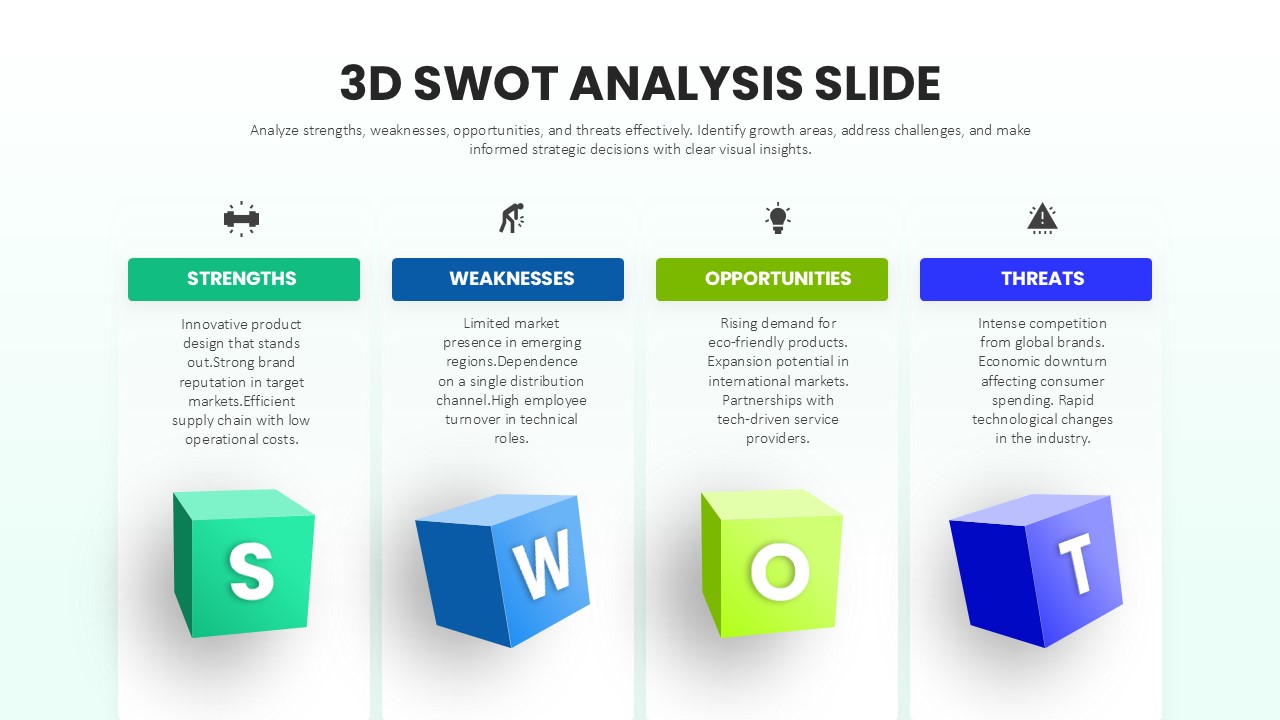
3D SWOT Analysis Template for PowerPoint & Google Slides
SWOT
Personal SWOT Analysis Matrix Cards Template for PowerPoint & Google Slides
SWOT
Customer Needs Analysis Template for PowerPoint & Google Slides
Customer Experience
Data Gap Analysis Template for PowerPoint & Google Slides
Business