Flow Chart PowerPoint Template
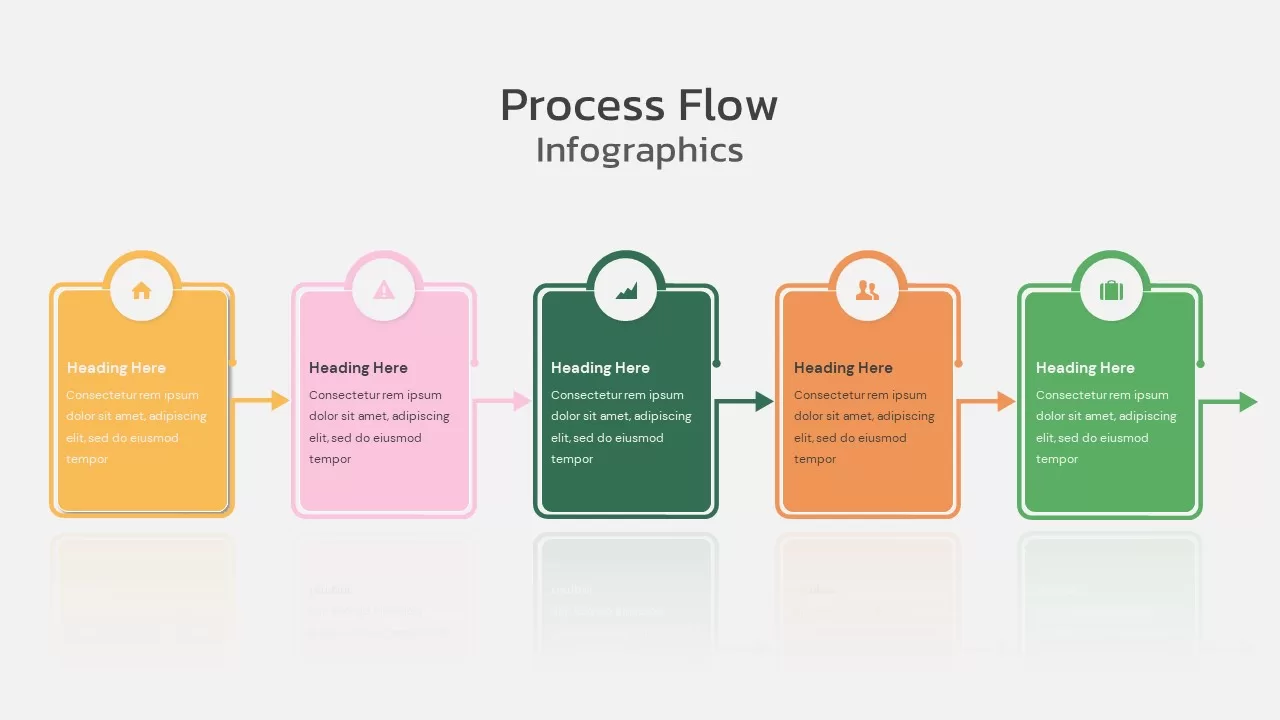
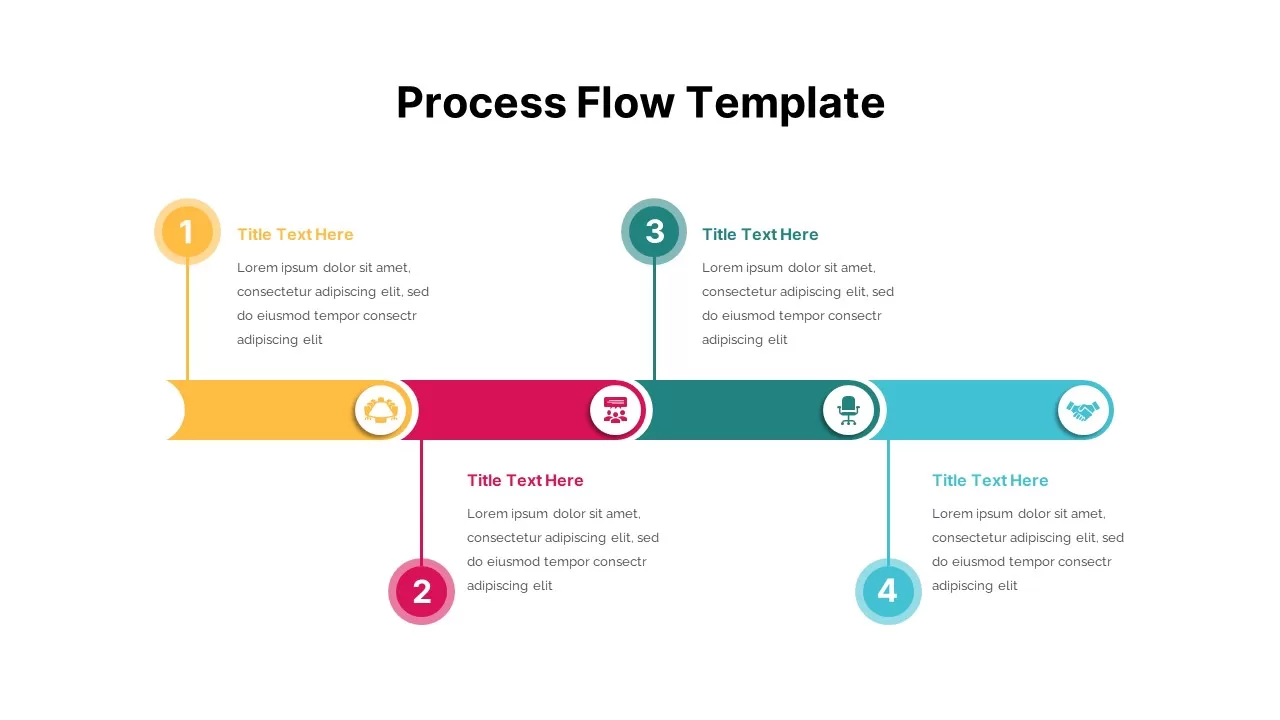
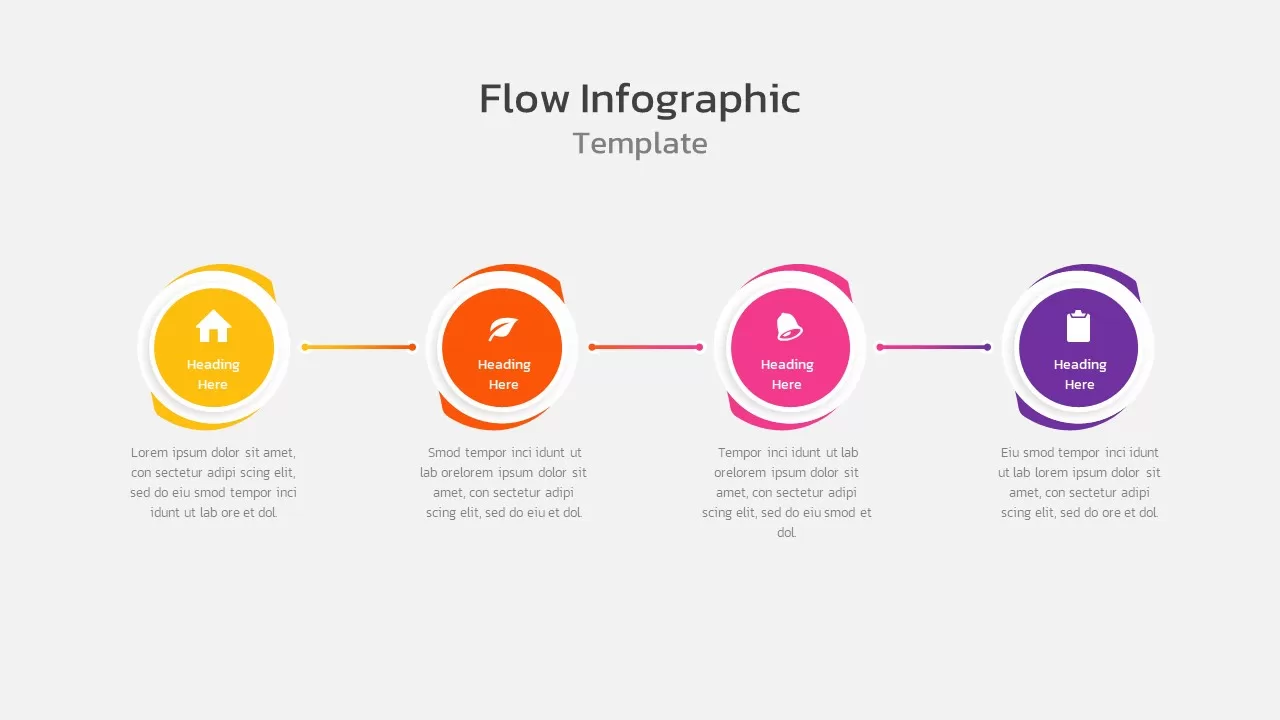
Flow chart PowerPoint is a graphical display of your company’s work breakdown structure. It is also used to create a hierarchical distribution of work positions or projects carried by each stratum. Flowcharts will show the organizational hierarchy structure in a PowerPoint presentation and how tasks are allocated to each member of the work progress aboard. This creative ppt design is highly usable on its own or with Mac keynote.
Process flowchart presentation diagrams are an important business tool in managing various procedures. Frequently, there are a lot of backgrounds and selections in workforce operations that can cause contradictory results. There are also standard operating procedures that need to be charted by many people in the organization. If these processes are newly framed or not often come across, there’s a risk of choosing the wrong step, which will cause an unproductive activity. Flowcharts are the best PowerPoint templates featuring work schedules and moves through a graphical exhibition.
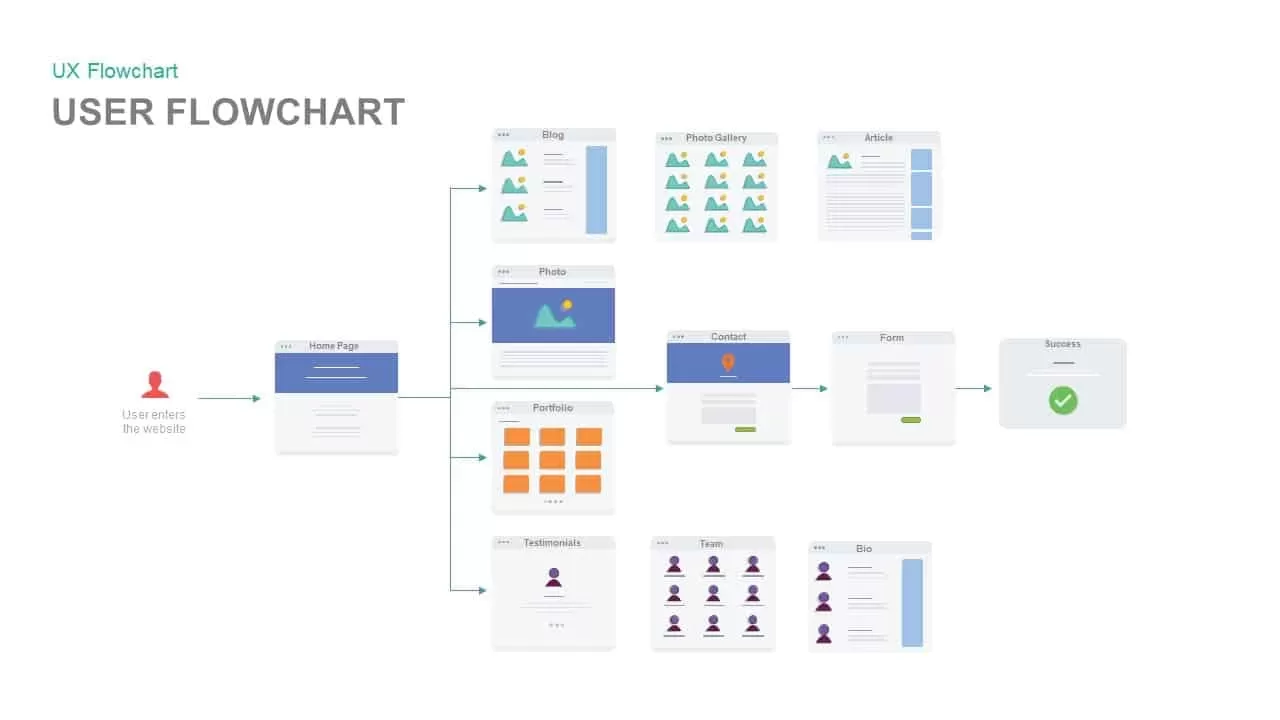
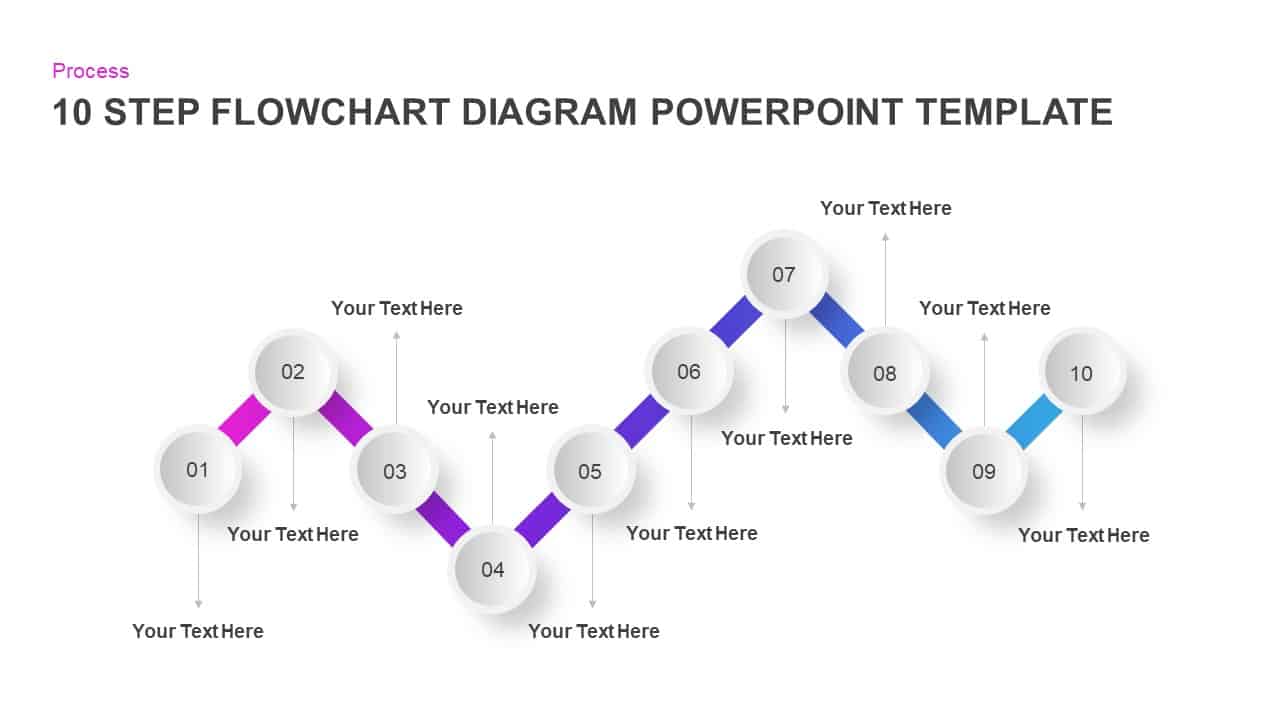
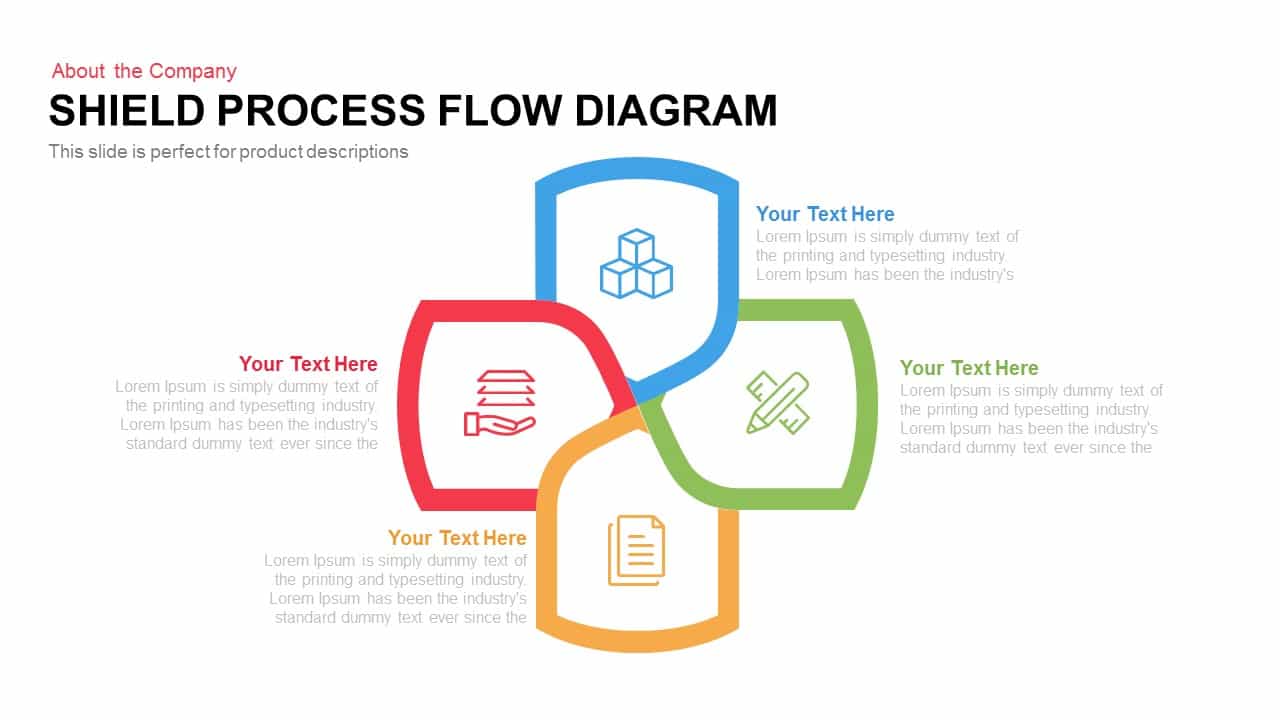
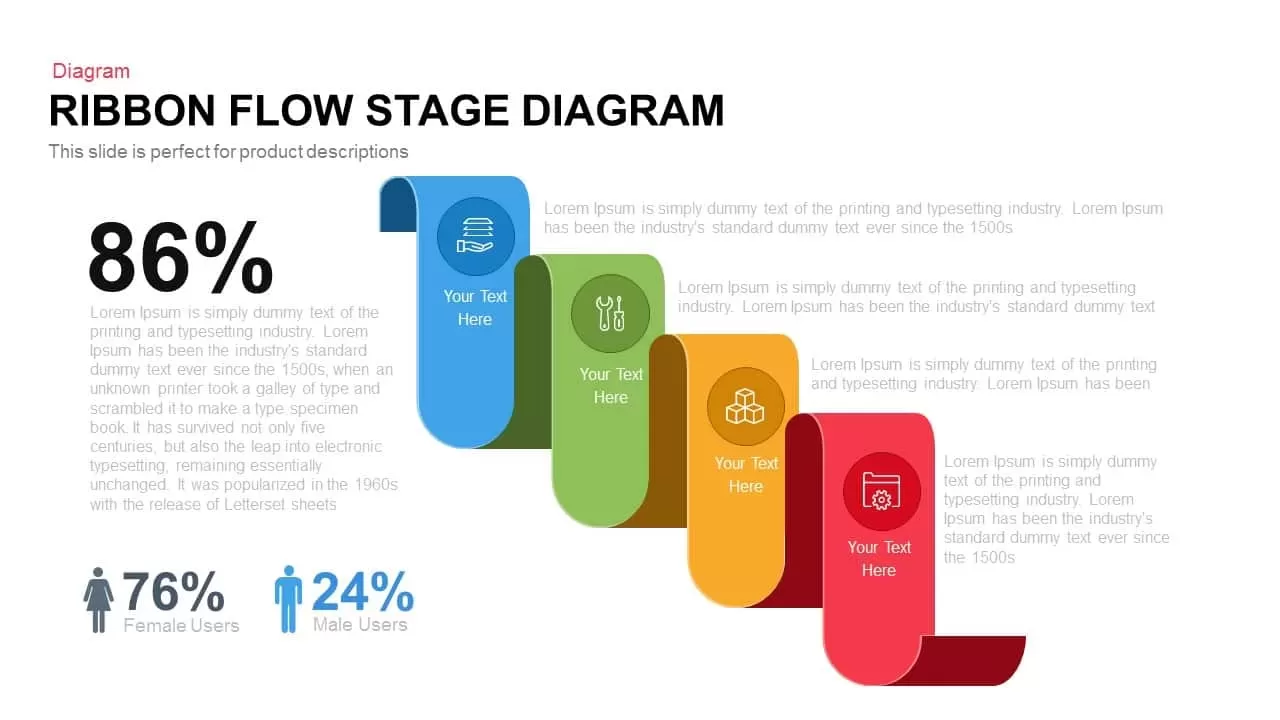
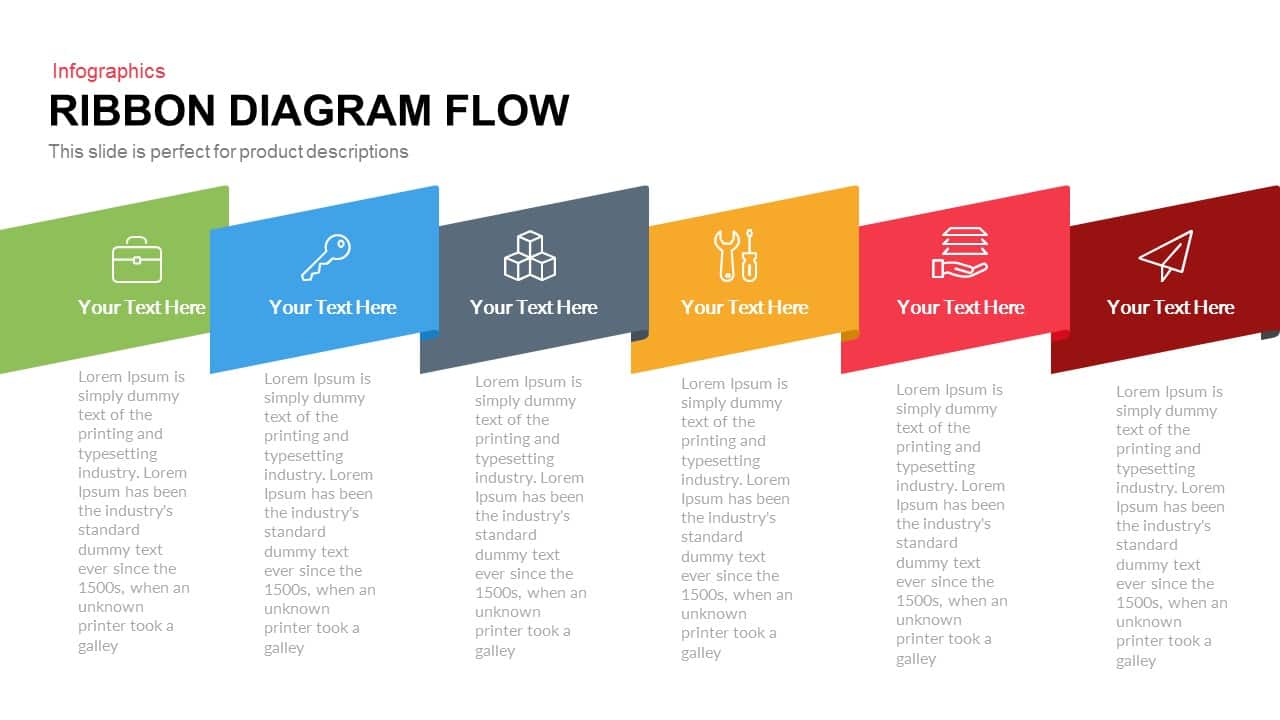
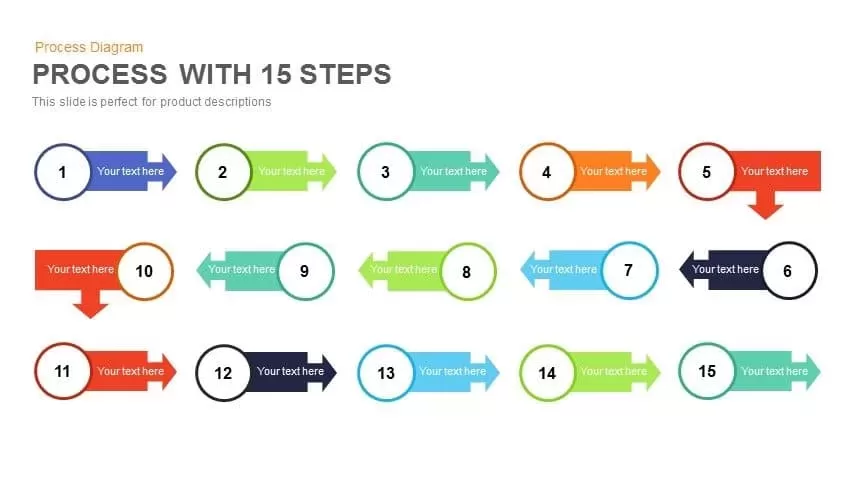
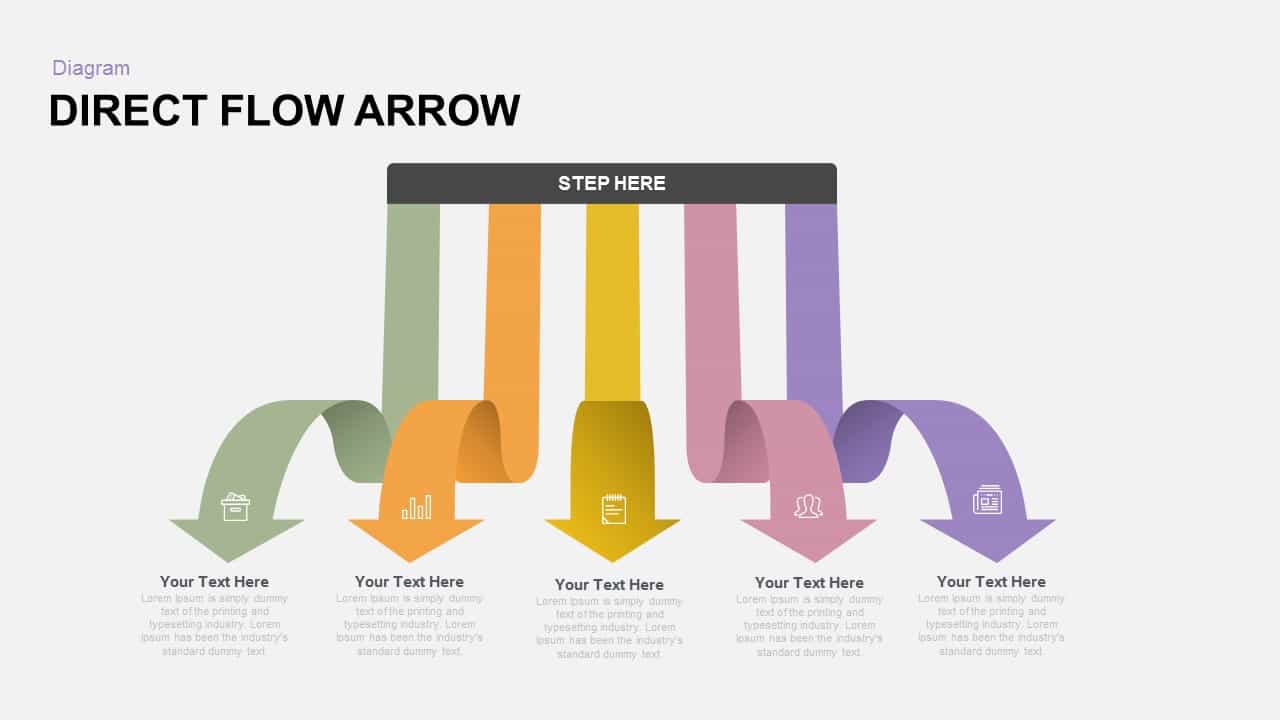
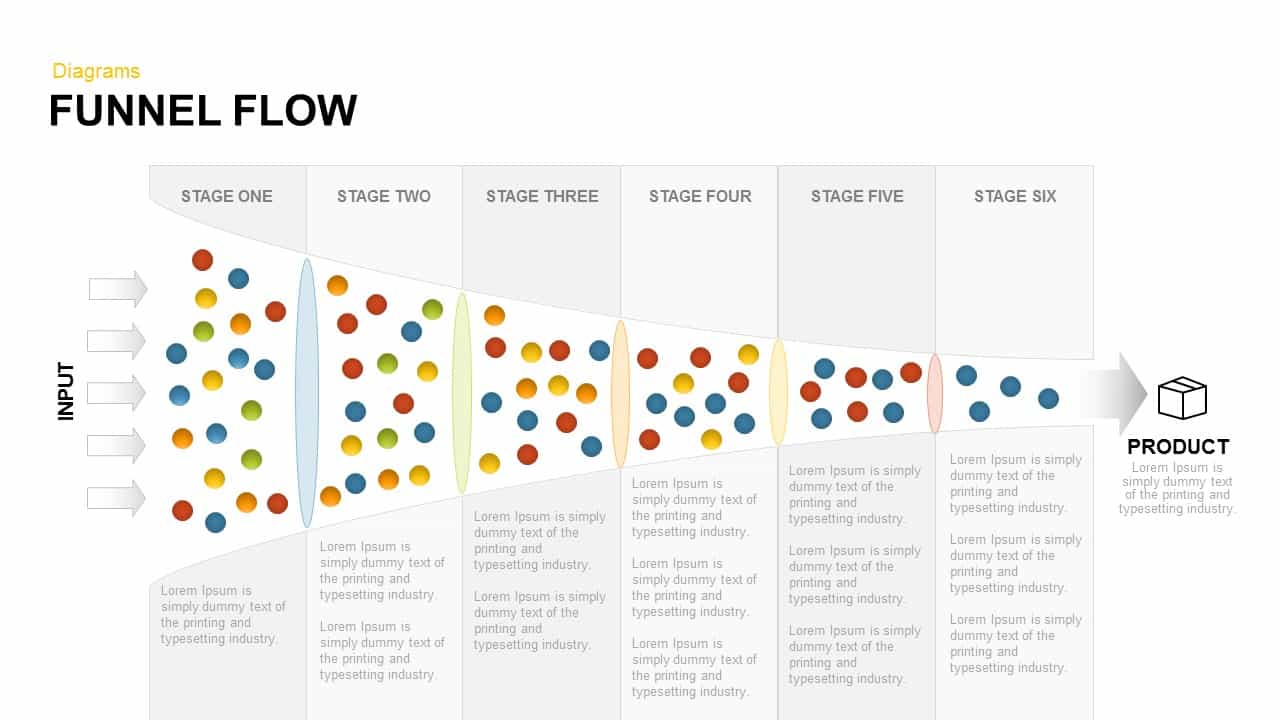
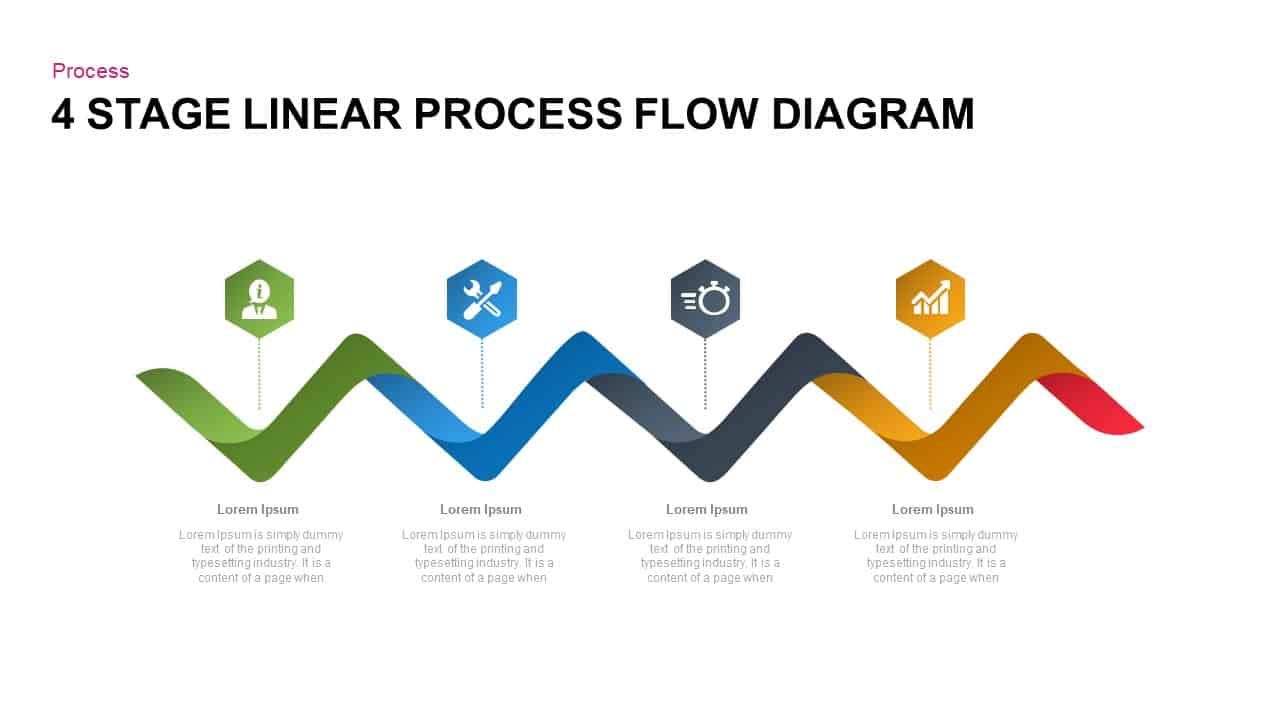
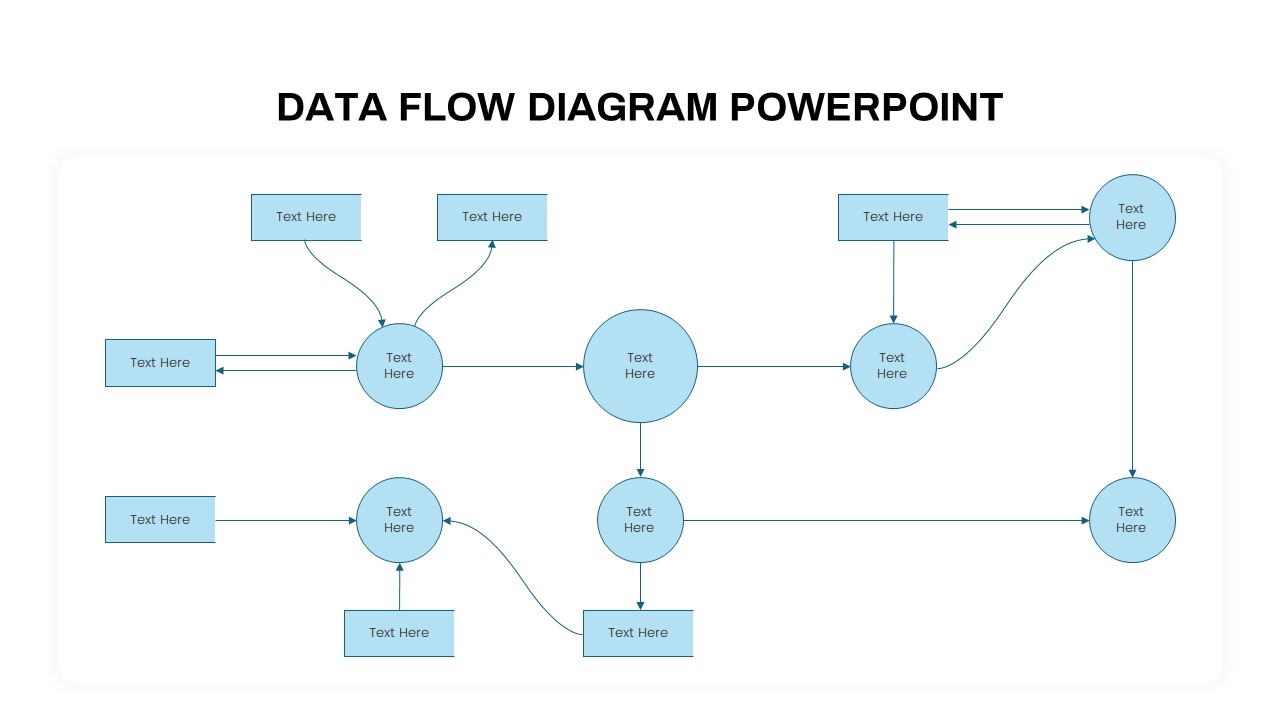
Flow chart PowerPoint template is an outstanding demonstration of the arrangement of steps and conclusions essential to perform a process. Each stage in the command is noted within a diagram shape. Steps are linked by line pointers and thin directional lines. This allows anyone to view the flowchart template and sensibly accompany the process from start to end. This ppt flowchart template is useful to show the structure of work processes and work assignments in categorized arrangements. The chain of command from the starting point can be illustrated using this flowchart PowerPoint diagram.
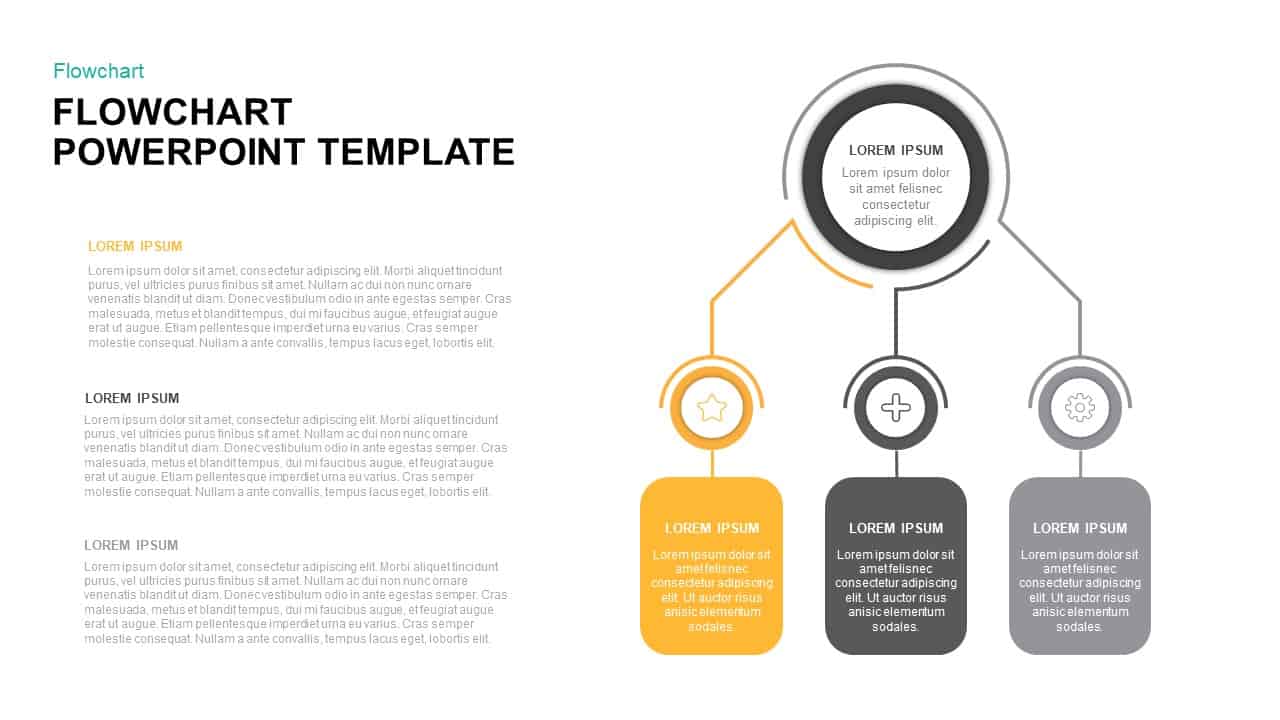
Flow chart PowerPoint template is useful for program and system design, project planning, process showcasing, map computer algorithms, and evaluation of incompetency and inefficiencies of a procedure. This is prototypical to display the org structure with hierarchy and the start and endpoints of the process. Here the rectangle and square shapes are viewing the distribution of concept or work activities.
Login to download this file


