Clustered Column Chart PowerPoint and Keynote Slide
Clustered Column Chart PowerPoint Template
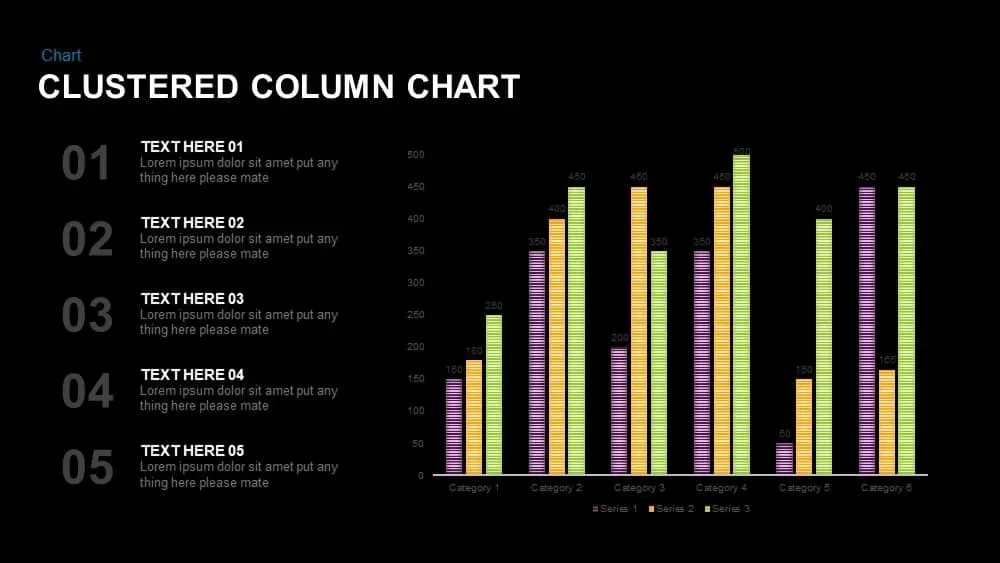
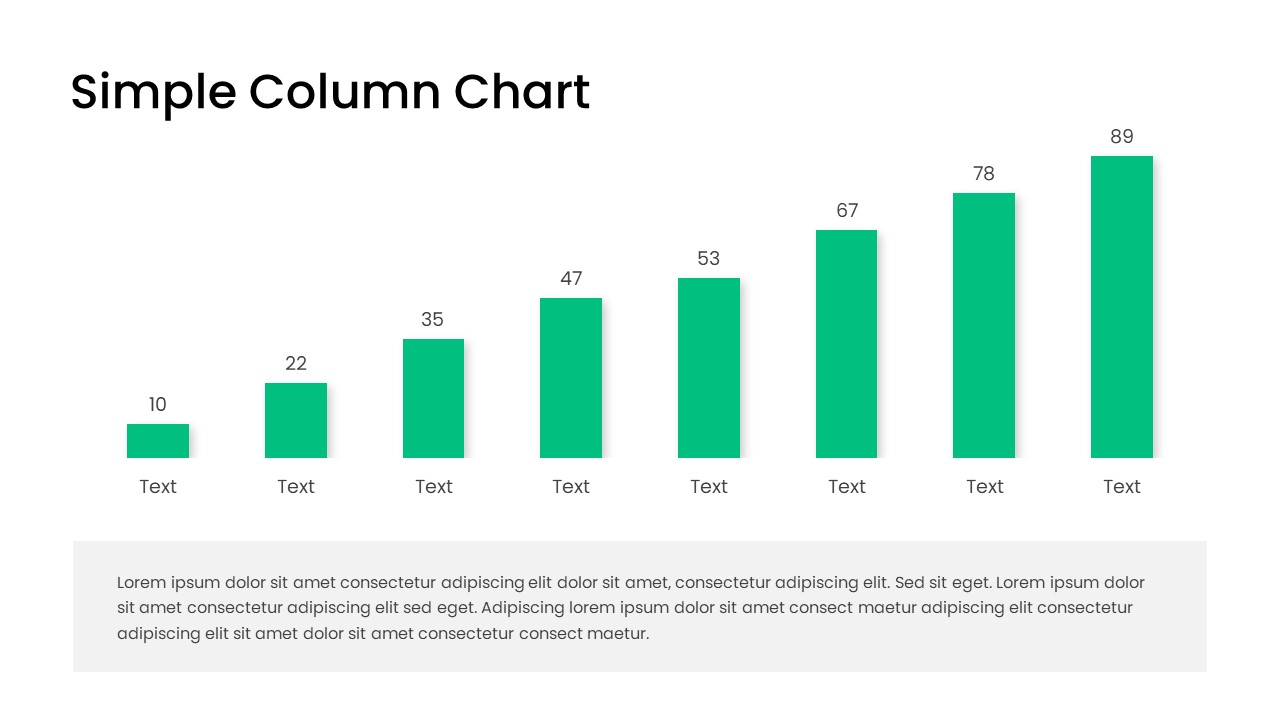
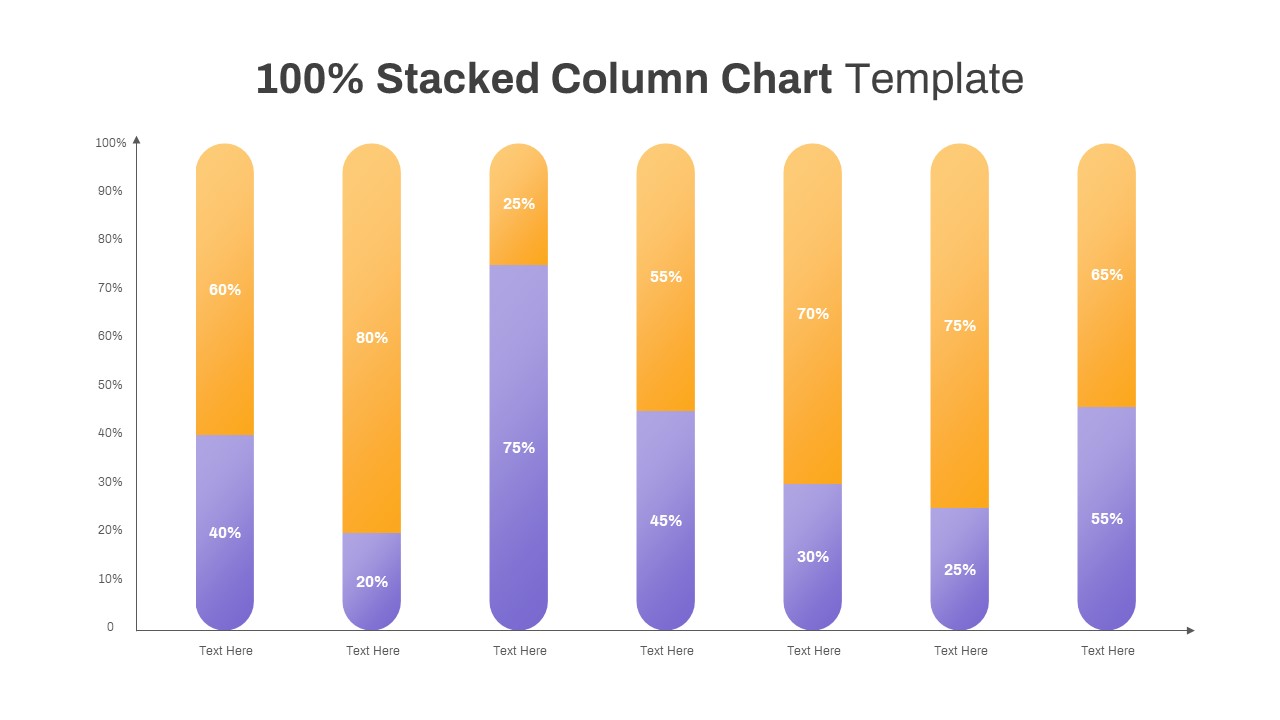
Clustered column chart powerpoint presentation—A cluster bar chart representing many groups of data systematically and graphically organized with vertical bar charts. The colorful and attractive slide design will make better impression to the beneficiaries. The enchanting appearance surely stimulates voluntary attention for the serious learning.
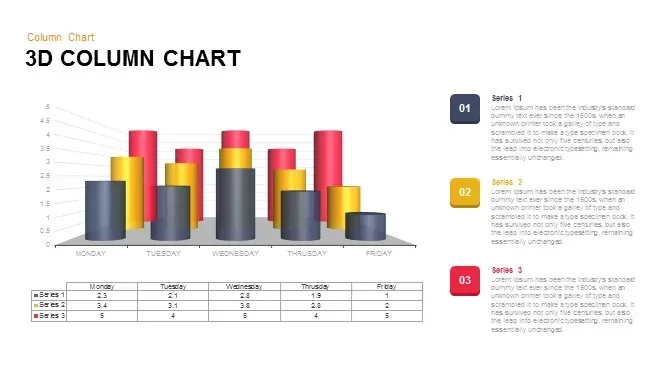
The clustered bar graph powerpoint template is perfect for the business and market-related presentation, apart from this, the universal nature of this bar chart says it will consume any subject under the sun and any type of data can be applied. Whether the presentation related to pure research or applied research any type of research presentation can be done with the clustered data ppt template. It is associated with the inferential statistics. Here you can illustrate number of categories or data series and its different values. Each cluster having three distinctive bar charts. The data is quantitative and the height of the bars is generally proportional to these values. Data can add according to the color coding and requirements. The color will tell the homogeneity of data. By this means data analysis becomes simple and easier. PowerPoint presentation will surely awesome with this Clustered Column Chart.
The clustered column chart PowerPoint and keynote template are perfect for data driven presentations such as marketing and sales. It is actually general which means that any subject matter can be applied. It can be used in exploration presentations where the user can envision bunched results. It is ideal for figures and record. The template is useful business and research. It is extremely useful for many business concepts like reporting and analyzing. Business research is common in corporate sector. Without having a well-defined research team, the data analyzing become a difficult task. Therefore, clustered bar diagram PowerPoint template can be useful for corporate research groups and other small and medium enterprises as well.
Login to download this file


