3D Circle Charts Infographics Template for PowerPoint & Keynote
3D Circle Charts Infographics Template for PowerPoint & Keynote
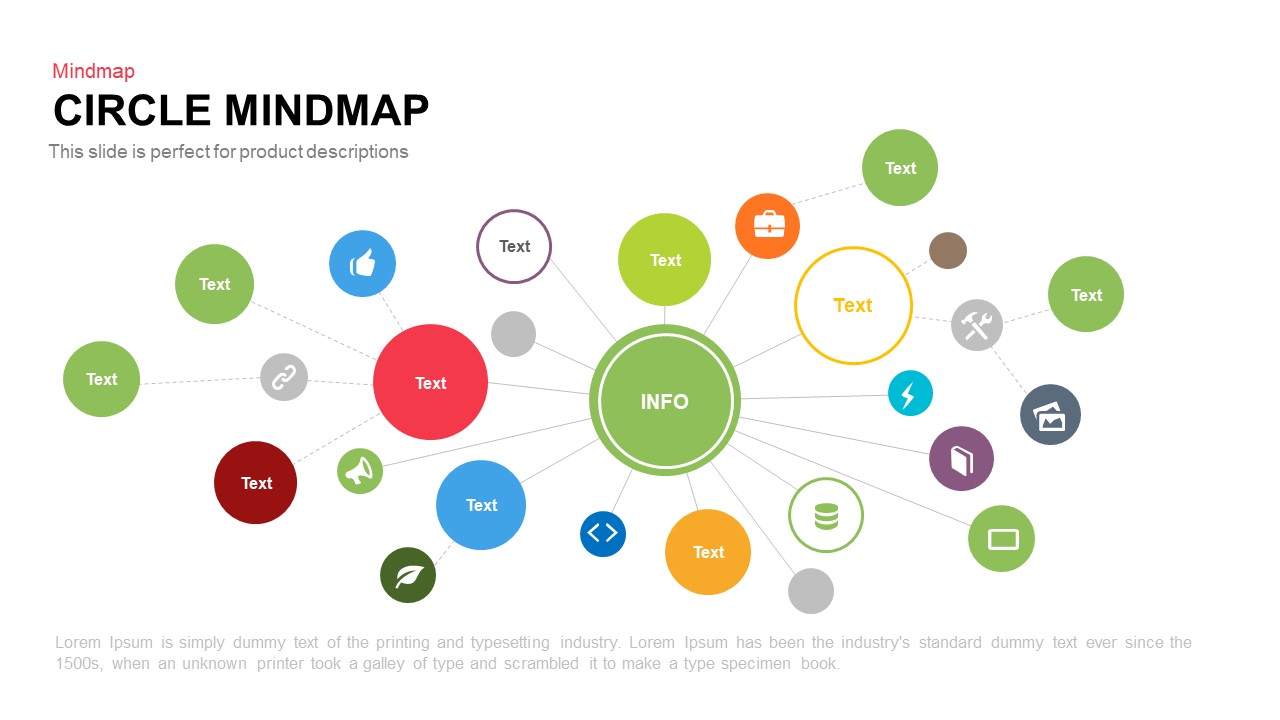
3D Circle Charts infographics is a 3d way to show your visualization which has six 3d spheres which are connected to a master like a molecular structure. The template has both keynote and powerpoint version get the membership access and Download instantly.
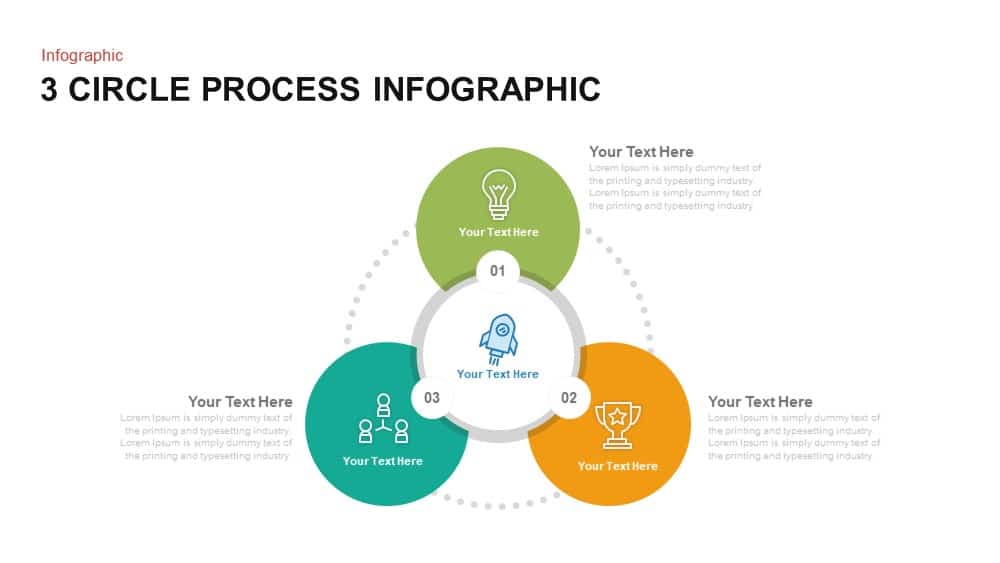
3d circle charts infographics is an aesthetically created process flow chart, ideal for complex business presentation. The user can display progressive improvement of an event in a structured way. It can be used to expose diverse work models and steps which will help to implement a strategy or a plan. The template is a suitable tool to display steps, rotation, variations etc. The big circle in the center is a hub that is encircled by the peripheral spoke circles. So presenter can use it as hub and spoke diagram to delineate the hub and spoke concept in business. Each fringed circles contains infographic icons and topic, which can be used as presentation theme.
3d circle with attractive color combination surely retain the attention of the viewers and make them active in discussion session. Presenters can deliver new trends in global and domestic market. For example, developing countries will see the highest economic growth as they come closer to the standard of living of the developed world. If a business professional wants to growth rapidly, consider these emerging markets to sell their products. So business people make a deep exploration about language, financial stability economic system, political stability, cultural factors and internal chaos which can influence these markets. User can develop these topics and create an astonishing showcase via this 3d slide. Modern technology and rapid means of communication lets customers to purchase product anywhere around the globe. Presenter can show the possibilities of digital and online marketing as a strong strategy for the companies.
3d circle charts infographics is a generic diagram which consumes almost all area of human life. Presenters from different fields and zones can utilize this PowerPoint for a sophisticated illustration. This diagram allows complete customization of the PowerPoint objects; color, infographic clipart, size of the circles, arrangement of text areas can alter or modify according to the artistic vision of the user and the nature of the presentation theme. We have good collection of circle diagrams that will fit for the business and other types of presentation.
Login to download this file


