Home » Templates » Charts » Bar/Column » Free Infographic Statistics Dashboard Slide for PowerPoint & Google Slides
Free Infographic Statistics Dashboard Slide for PowerPoint & Google Slides
Description
Present key performance metrics with clarity using this Infographic Statistics Dashboard slide. The layout includes four data-driven blocks, each visualizing a unique statistical insight—Statistical Accuracy (85%), Income Variation Range ($30k–$60k), Project Success Probability (70%), and Conversion Ratio (5:1). Paired with minimalistic charts like donut graphs, line graphs, bar charts, and ratios, each block uses color-coded headings and subtle iconography for instant recognition and visual segmentation.
Soft rounded containers and shadow effects give the design a clean, modern feel, ensuring your data is easily scannable and visually engaging. The template’s use of bold numbers and color accents—red, green, blue, and yellow—makes each stat stand out while maintaining a cohesive aesthetic. Placeholder text provides room for supporting context, allowing flexibility in how data is interpreted and applied.
Ideal for performance reporting, dashboards, marketing reviews, and KPI presentations, this slide is fully editable in PowerPoint and Google Slides. Adjust the metrics, icons, or chart styles to align with your business goals or department needs.
Who is it for
Perfect for marketing managers, analysts, project leaders, sales executives, and business strategists who need to present key statistics or performance summaries with visual clarity.
Other Uses
This layout can be adapted for survey results, financial reporting, campaign reviews, investor decks, or client performance snapshots. Also useful in internal team updates, dashboards, and training visuals.
Login to download this file
Add to favorites
Add to collection
No. of Slides
2Item ID
SB04013Rating
0.0
(0 reviews)
Related Templates

Social Media Statistics 2023 Dashboard Template for PowerPoint & Google Slides
Comparison
Premium

Statistics Infographic Template for PowerPoint & Google Slides
Infographics
Premium

Statistics Infographic & KPI Bar Chart Template for PowerPoint & Google Slides
Bar/Column
Premium

Statistics Infographic Template for PowerPoint & Google Slides
Bar/Column
Premium

Statistics Infographic Template for PowerPoint & Google Slides
Infographics
Premium

Statistics & Global Metrics Infographic Template for PowerPoint & Google Slides
Bar/Column
Premium

Free Metro UI Dashboard Infographic Template for PowerPoint & Google Slides
Business Report
Free

Statistics Presentation Template for PowerPoint & Google Slides
Business Report
Premium

Dynamic Statistics & Progress Charts Template for PowerPoint & Google Slides
Pie/Donut
Premium

Dynamic Data Dashboard Infographic Template for PowerPoint & Google Slides
Bar/Column
Premium

Professional Nurse Infographic Dashboard Template for PowerPoint & Google Slides
Nursing
Premium

Mastodon Metrics Infographic Dashboard Template for PowerPoint & Google Slides
Business Report
Premium

Freight Logistics Dashboard Infographic Template for PowerPoint & Google Slides
Comparison Chart
Premium

Free KPI Dashboard PowerPoint Template for PowerPoint & Google Slides
Charts
Free

Free Quarterly Business Review Dashboard Template for PowerPoint & Google Slides
Business
Free

Free Monthly Financial Dashboard & Cash Flow Template for PowerPoint & Google Slides
Business Report
Free

Performance KPI Dashboard Slide Template for PowerPoint & Google Slides
Business Report
Premium

KPI Dashboard Data Overview Slide Template for PowerPoint & Google Slides
Bar/Column
Premium

Soccer Match Stats Dashboard Slide Template for PowerPoint & Google Slides
Graphics
Premium

Engineering Maintenance Dashboard Slide for PowerPoint & Google Slides
Software Development
Premium

E-commerce Analytics Dashboard Template for PowerPoint & Google Slides
Bar/Column
Premium

Product Usage Analytics Dashboard Chart Template for PowerPoint & Google Slides
Bar/Column
Premium

Data Analytics Dashboard Design template for PowerPoint & Google Slides
Bar/Column
Premium

Efficiency KPI Dashboard Metaphor Template for PowerPoint & Google Slides
Infographics
Premium

Business Dashboard Analytics & KPIs Template for PowerPoint & Google Slides
Bar/Column
Premium

Professional Team Efficiency Dashboard Template for PowerPoint & Google Slides
Business Report
Premium

Project Management Dashboard Template for PowerPoint & Google Slides
Project
Premium

Website Performance Dashboard template for PowerPoint & Google Slides
Charts
Premium

Sales Performance Dashboard template for PowerPoint & Google Slides
Business Report
Premium

Immigration Data Dashboard Template for PowerPoint & Google Slides
Bar/Column
Premium

Employee Skill Analysis Dashboard Template for PowerPoint & Google Slides
Employee Performance
Premium

Sales Growth Dashboard: KPI Gauge & Line Template for PowerPoint & Google Slides
Revenue
Premium

Social Media Performance Dashboard Template for PowerPoint & Google Slides
Bar/Column
Premium

Net Promoter Score Dashboard Template for PowerPoint & Google Slides
Customer Experience
Premium

Dashboard Templates for PowerPoint & Google Slides
Bar/Column
Premium

Modern Project Status Report Dashboard Template for PowerPoint & Google Slides
Project Status
Premium

Bull and Bear Stock Market Dashboard Template for PowerPoint & Google Slides
Infographics
Premium

KPI Dashboard template for PowerPoint & Google Slides
Business Report
Premium

KPI Dashboard Overview template for PowerPoint & Google Slides
Finance
Premium

KPI Dashboard Data Visualization Template for PowerPoint & Google Slides
Bar/Column
Premium

Interactive Benchmarking Gauge Dashboard Template for PowerPoint & Google Slides
Pie/Donut
Premium

Heat Map Risk Matrix Dashboard Template for PowerPoint & Google Slides
Comparison Chart
Premium

Project Status Dashboard Table Template for PowerPoint & Google Slides
Project Status
Premium

Project Status Dashboard with Metrics Template for PowerPoint & Google Slides
Project Status
Premium

Colorful Project Status Dashboard Template for PowerPoint & Google Slides
Project Status
Premium

Weekly Update Schedule Dashboard Template for PowerPoint & Google Slides
Agenda
Premium

Project Status Dashboard Template for PowerPoint & Google Slides
Project Status
Premium

Weekly Status Report Dashboard Template for PowerPoint & Google Slides
HR
Premium

Website Performance Monitoring Dashboard Template for PowerPoint & Google Slides
Business Report
Premium

One Pager Project Status Dashboard Template for PowerPoint & Google Slides
Project Status
Premium

One Pager Annual Report Dashboard Template for PowerPoint & Google Slides
Business Report
Premium

Social Media Analytics Dashboard Template for PowerPoint & Google Slides
Digital Marketing
Premium

Employee Satisfaction Survey Dashboard Template for PowerPoint & Google Slides
Employee Performance
Premium

Customer Satisfaction KPI Dashboard Template for PowerPoint & Google Slides
Customer Experience
Premium

Weekly Project Status Dashboard Template for PowerPoint & Google Slides
Project Status
Premium

Cost Cutting Savings Dashboard Template for PowerPoint & Google Slides
Pie/Donut
Premium

Macroeconomic Indicators Dashboard Template for PowerPoint & Google Slides
PEST
Premium

Michigan County Map with KPI Dashboard Template for PowerPoint & Google Slides
World Maps
Premium

Quarterly Financial Summary Dashboard Template for PowerPoint & Google Slides
Business Report
Premium

Banking Financial Overview Dashboard Template for PowerPoint & Google Slides
Finance
Premium

Quarterly Business Review Dashboard Template for PowerPoint & Google Slides
Pitch Deck
Premium

Monthly Business Review Dashboard Deck Template for PowerPoint & Google Slides
Business Report
Premium

DevOps KPI Dashboard Performance Metrics Template for PowerPoint & Google Slides
Software Development
Premium

Purchasing KPI Metrics Dashboard Template for PowerPoint & Google Slides
Business Report
Premium

Procurement KPI Dashboard & Metrics Template for PowerPoint & Google Slides
Business Report
Premium

Project Progress Dashboard Pie Charts Template for PowerPoint & Google Slides
Project
Premium

Monthly Sales Performance Dashboard Template for PowerPoint & Google Slides
Charts
Premium

HR Report Dashboard Template for PowerPoint & Google Slides
Employee Performance
Premium

Budget Forecast Dashboard & Donut Charts Template for PowerPoint & Google Slides
Pie/Donut
Premium

Risk Level Gauge Comparison Dashboard Template for PowerPoint & Google Slides
Comparison
Premium

Inventory Management Dashboard Template for PowerPoint & Google Slides
Process
Premium

Incident Tracking Dashboard for PowerPoint & Google Slides
Business Plan
Premium

Digital Marketing KPIs Dashboard Dark Template for PowerPoint & Google Slides
Business Report
Premium

Employee Performance Metrics Dashboard Template for PowerPoint & Google Slides
Employee Performance
Premium

Turnover Analysis Dashboard Template for PowerPoint & Google Slides
Employee Performance
Premium

Project Tracking Dashboard Table Template for PowerPoint & Google Slides
Project Status
Premium

Action Items Management Dashboard Table Template for PowerPoint & Google Slides
Project Status
Premium

Electronic Health Records Dashboard template for PowerPoint & Google Slides
Health
Premium

Patient-Satisfaction KPI Dashboard for PowerPoint & Google Slides
Business
Premium

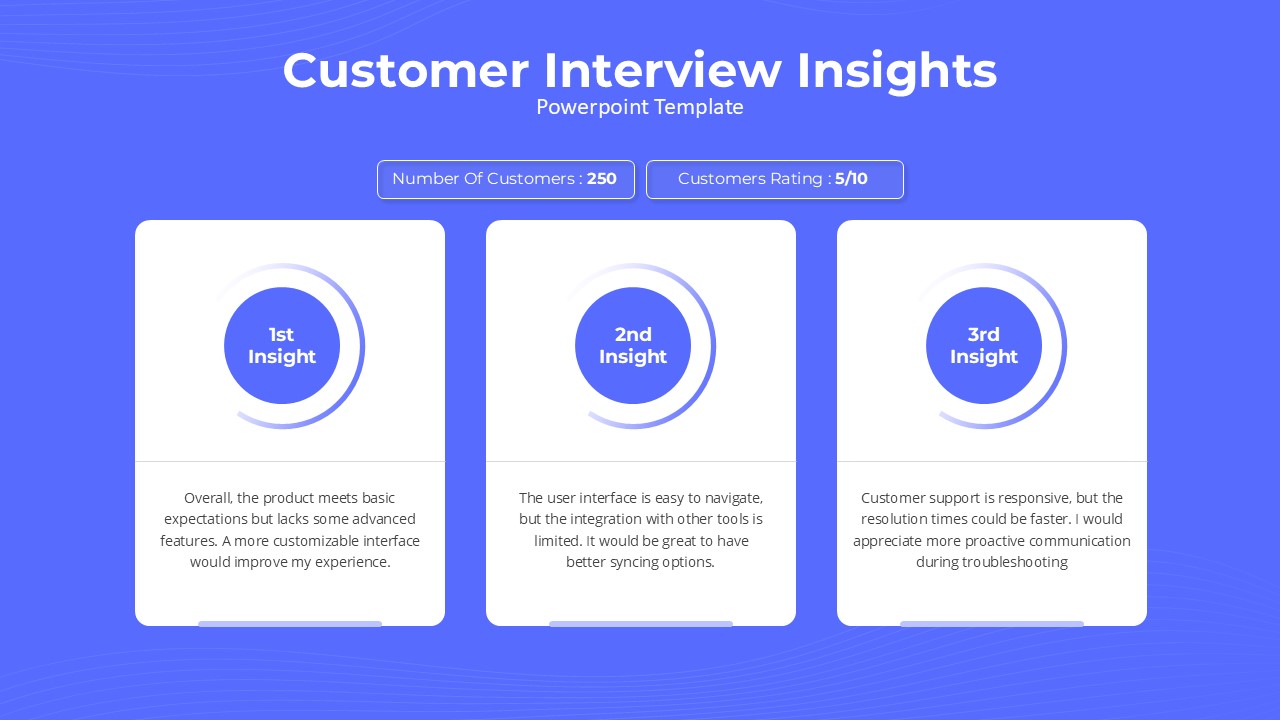
Customer Interview Insights Dashboard Template for PowerPoint & Google Slides
Customer Experience
Premium

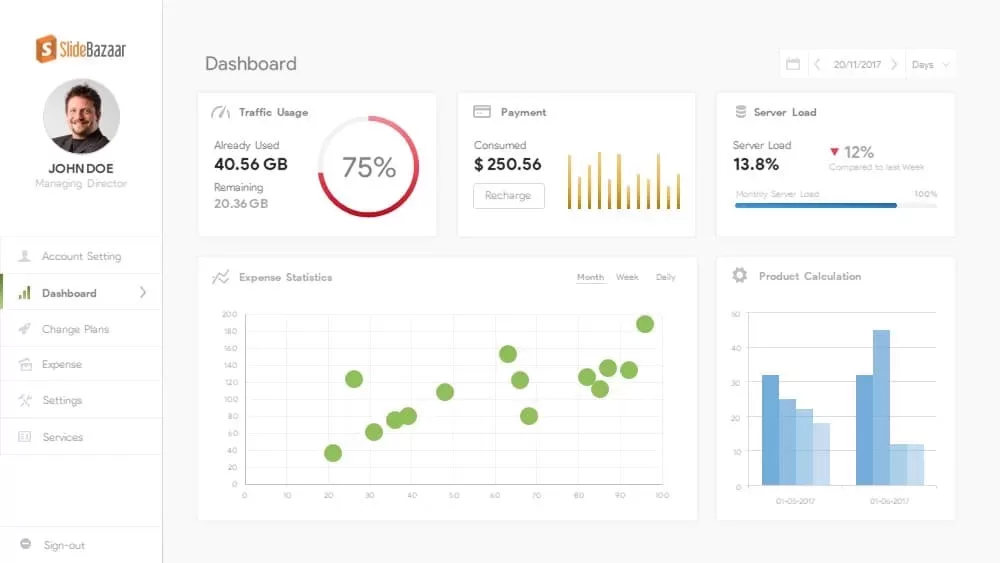
Account Overview Dashboard template for PowerPoint & Google Slides
Business
Premium

Free Data Analytics Dashboard Template for PowerPoint
Charts
Free

Free Colorful Infographic Slide Pack Template for PowerPoint & Google Slides
Roadmap
Free

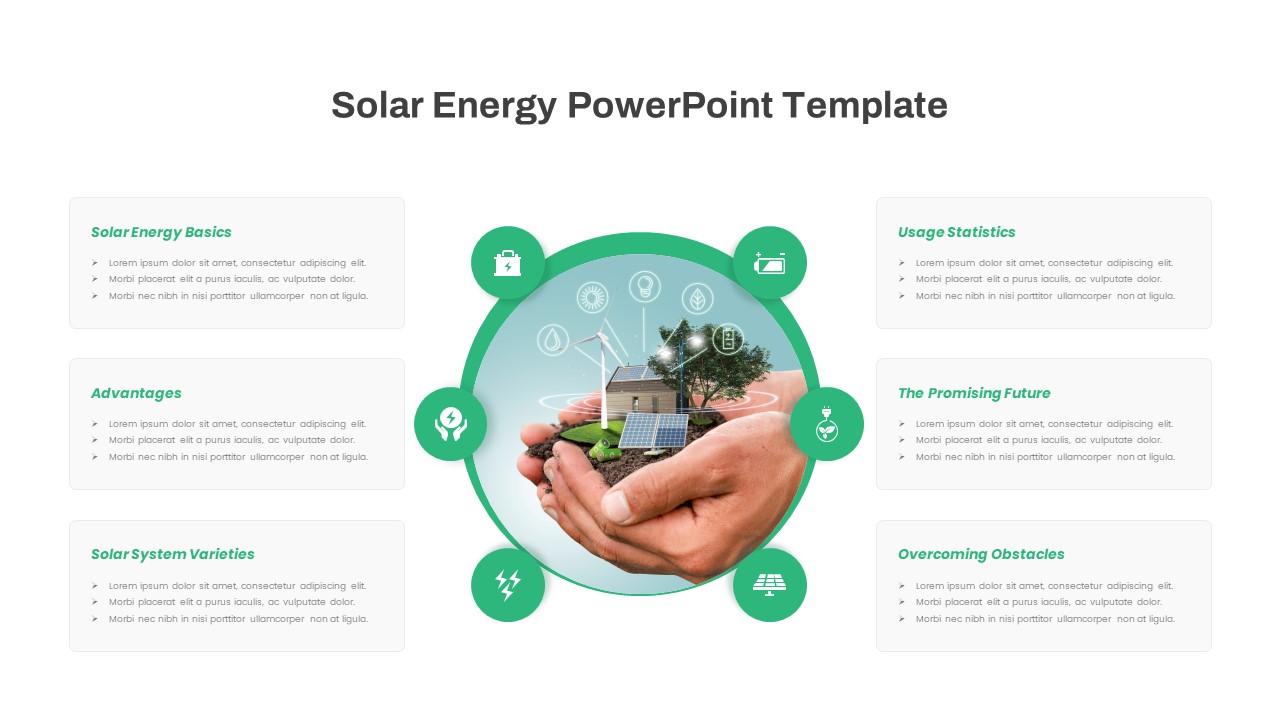
Free Solar Energy Infographic Slide Template for PowerPoint & Google Slides
Circle
Free

Free Multi-Step Funnel Infographic Slide Pack Template for PowerPoint & Google Slides
Funnel
Free

Free Nutrition Infographic Slide Template for PowerPoint & Google Slides
Health
Free

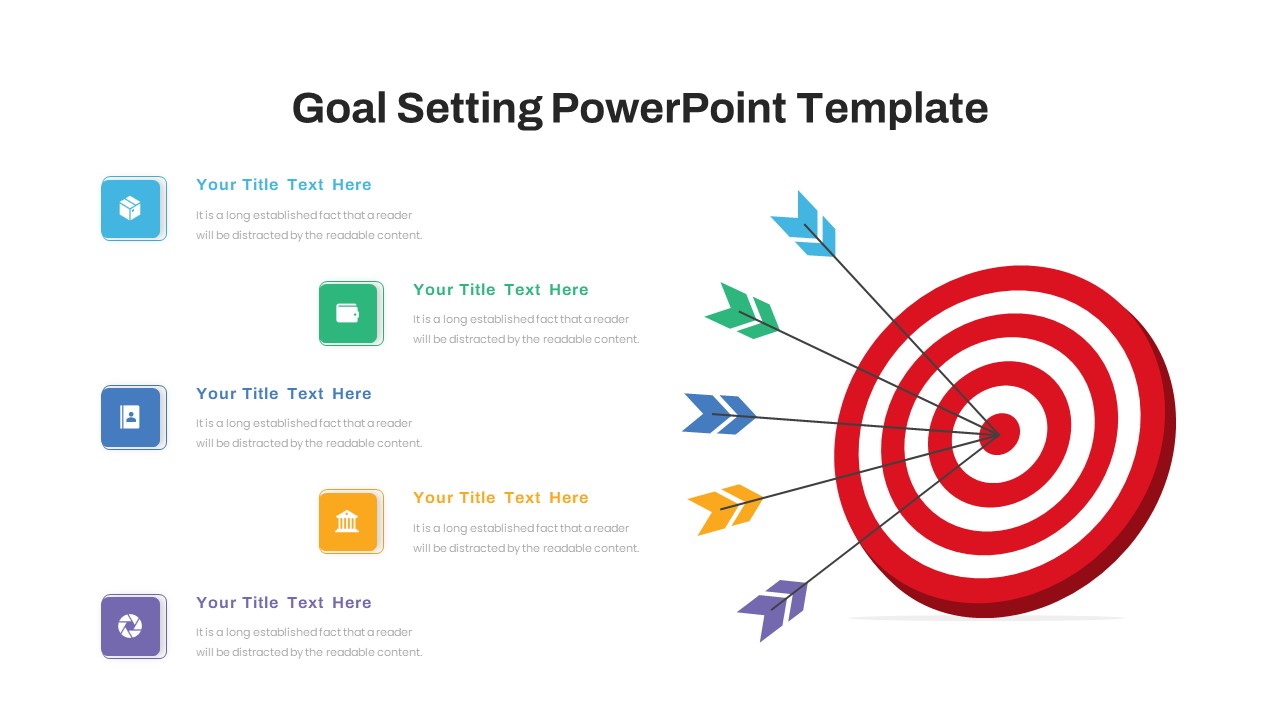
Free Goal Setting Target Infographic Slide Template for PowerPoint & Google Slides
Goals
Free

Free Online Shopping 3-Slide Infographic Template for PowerPoint & Google Slides
Digital Marketing
Free

Free Infographic Deck PowerPoint Pack for PowerPoint & Google Slides
Infographics
Free

Free Application Mockup Screens Infographic Template for PowerPoint & Google Slides
Comparison
Free

Free Multi-Year Arrow Timeline Infographic Template for PowerPoint & Google Slides
Timeline
Free

Free Agenda Infographic Template for PowerPoint & Google Slides
Agenda
Free

Free Modern Four-Step Agenda Infographic Template for PowerPoint & Google Slides
Agenda
Free

Free ChatGPT Infographic Presentation Template for PowerPoint & Google Slides
Pitch Deck
Free

Free Radiation Hub and Spoke Infographic Template for PowerPoint & Google Slides
Circle
Free

Free Animated DNA Infographic Diagram Template for PowerPoint & Google Slides
Infographics
Free

Free Three and Four Pillar Infographic Pack Template for PowerPoint & Google Slides
Process
Free

Free Cute Dental Health Infographic Layout for PowerPoint & Google Slides
Health
Free

Free Global Warming Infographic Comparison Template for PowerPoint & Google Slides
Comparison Chart
Free

Free Social Media Hub-and-Spoke Infographic Template for PowerPoint & Google Slides
Circle
Free


