Facebook Social Metrics Infographic Template for PowerPoint & Google Slides


Description
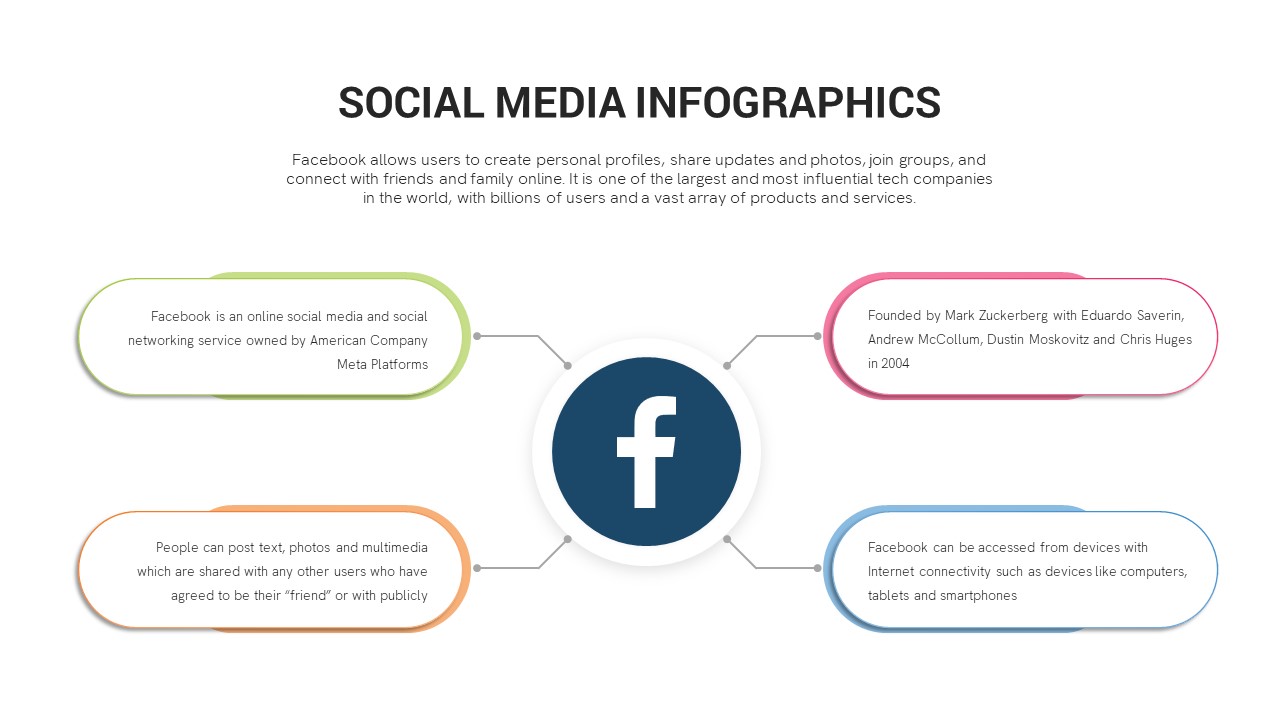
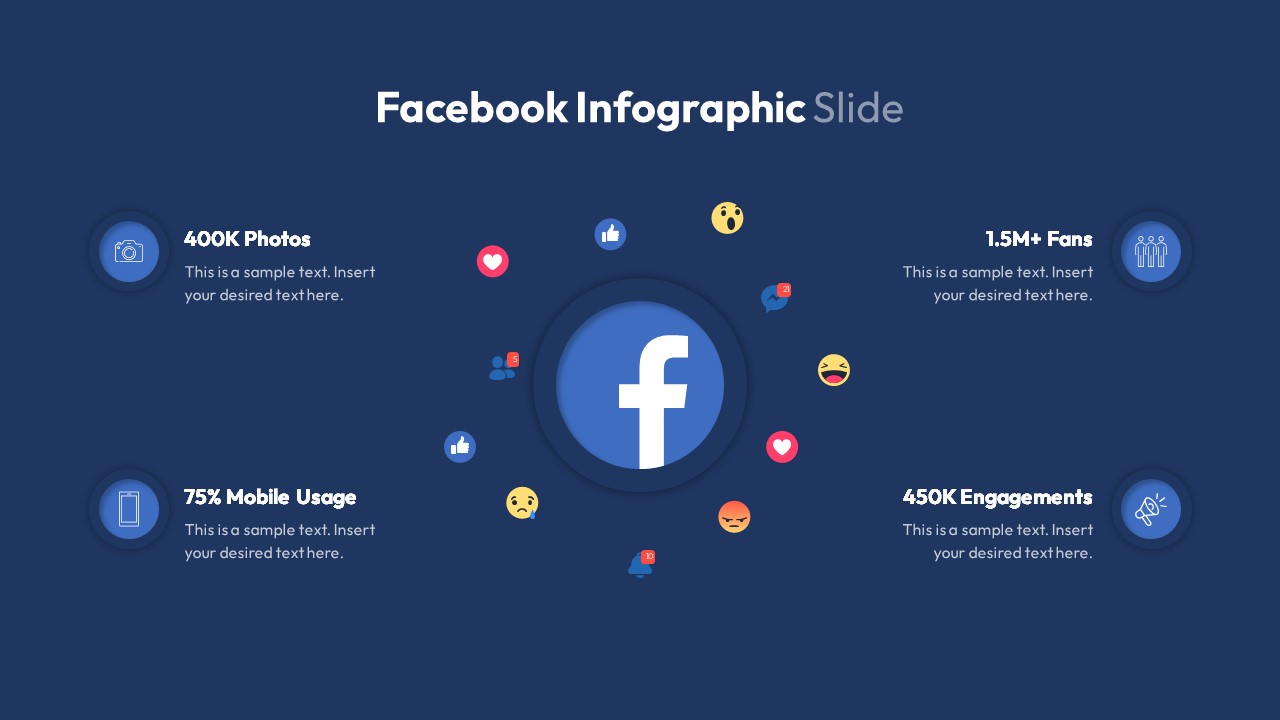
Leverage this dynamic Facebook infographic slide to present essential social media metrics in a clear, visually engaging hub-and-spoke layout. At the center sits the iconic Facebook logo, surrounded by four customizable metric cards—400K Photos, 1.5M+ Fans, 75% Mobile Usage, and 450K Engagements—each paired with a distinctive icon and sample text placeholder. Reaction emojis and notification badges further reinforce engagement themes, adding color and context without cluttering the clean, white backdrop. The modern flat design employs bold blue accents, crisp typography, and subtle drop shadows to ensure maximum readability and professional polish across devices and platforms.
Engineered for rapid customization, this template leverages master slides, editable text, and icon placeholders that allow you to swap numbers, labels, or color accents in seconds. Whether updating campaign performance for an executive briefing or embedding within a larger marketing deck, the slide maintains consistent formatting and high-resolution clarity in both PowerPoint and Google Slides. Optimize stakeholder alignment by highlighting key performance indicators at a glance, driving data-driven discussions and informed decision-making. SEO-optimized structure and simple editing controls make this asset ideal for marketers, agencies, or internal teams seeking streamlined content creation.
With intuitive placeholders and consistent color palettes, you can easily adapt the hub-and-spoke framework to track quarterly growth figures, audience demographics, ad impressions, or engagement rates across any social platform. The slide’s vector-based icons and scalable shapes guarantee pixel-perfect results at any resolution, while its clean white space promotes focus on data points. Fully compatible with corporate branding guidelines, this infographic ensures rapid deployment and seamless integration into broader pitch decks or status reports.
Who is it for
Social media managers, digital marketers, and community managers can leverage this infographic to report campaign performance, audience growth, and engagement trends. Brand strategists, marketing agencies, and CMOs will find the hub-and-spoke layout invaluable for executive presentations and stakeholder briefings.
Other Uses
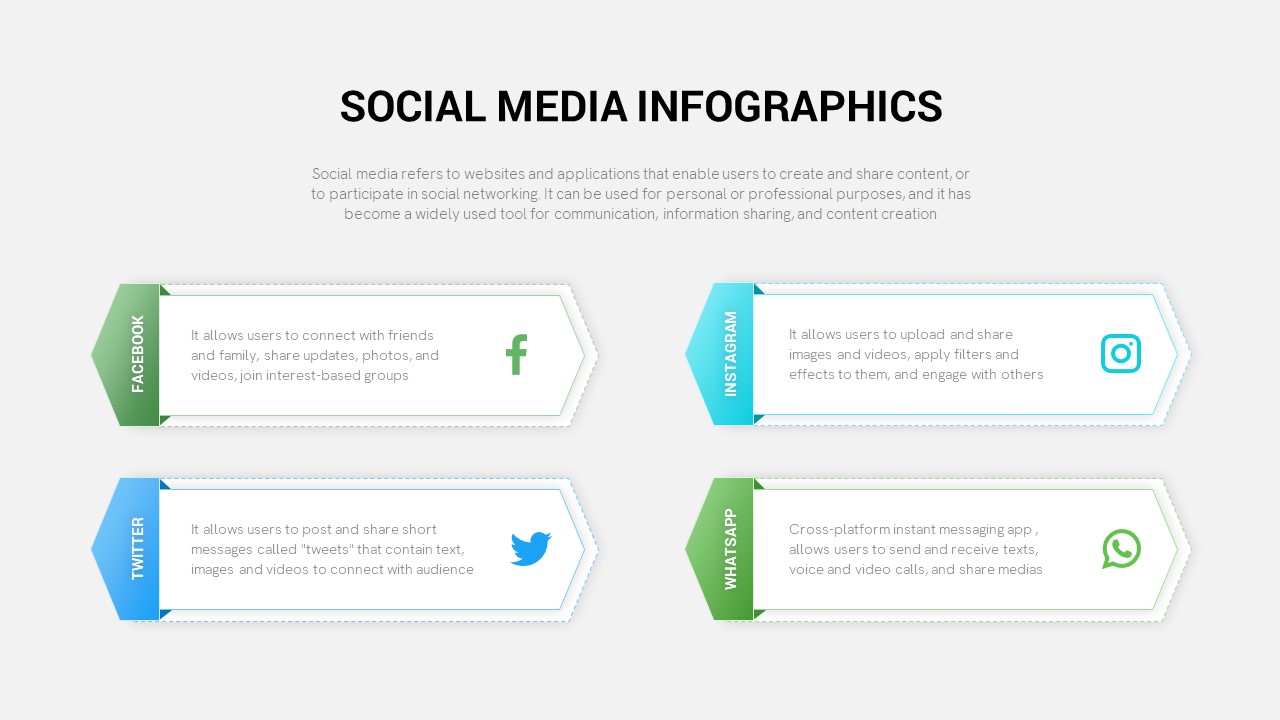
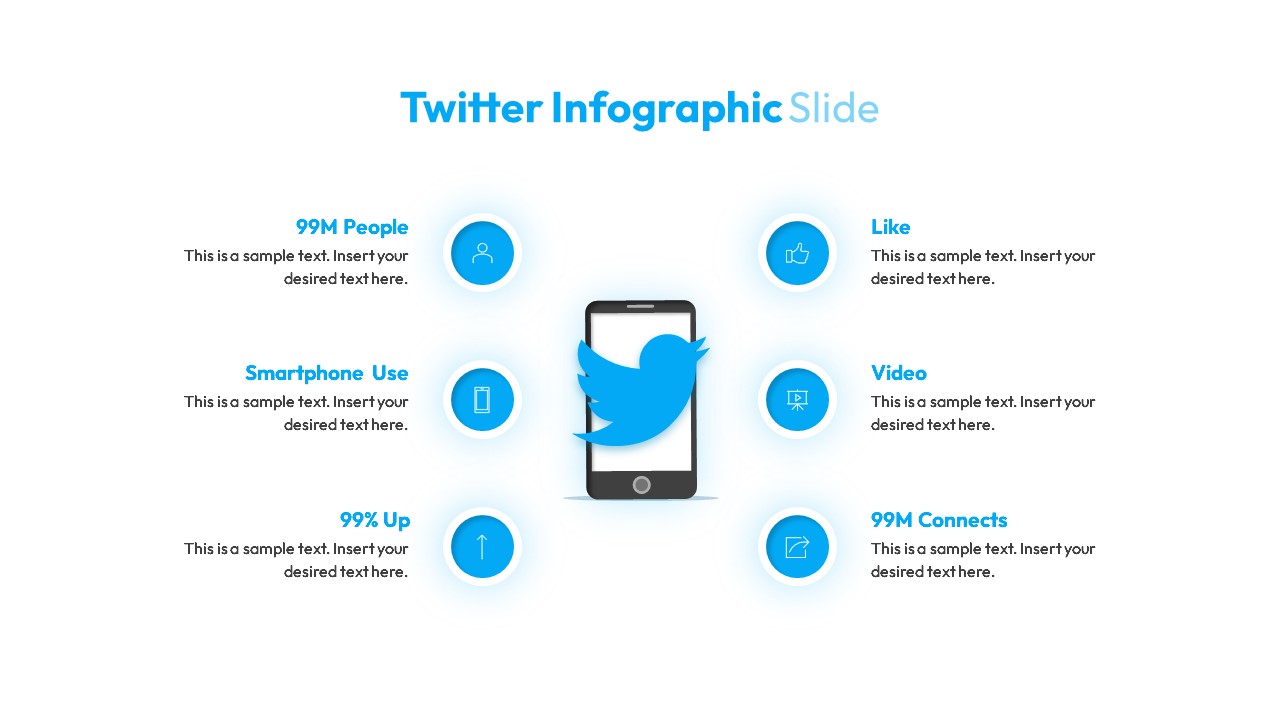
Beyond Facebook analytics, repurpose this slide to visualize Instagram or Twitter metrics, KPI dashboards, ad performance summaries, product feature overviews, or event attendance figures. Duplicate and modify metric nodes to track quarterly sales, website traffic sources, or customer satisfaction scores across departments.
Login to download this file

Item ID
SB03405
Related Templates

Social Media Metrics template for PowerPoint & Google Slides
Comparison Chart
Premium
Social Media Analysis Metrics Slide Deck Template for PowerPoint & Google Slides
Digital Marketing
Premium
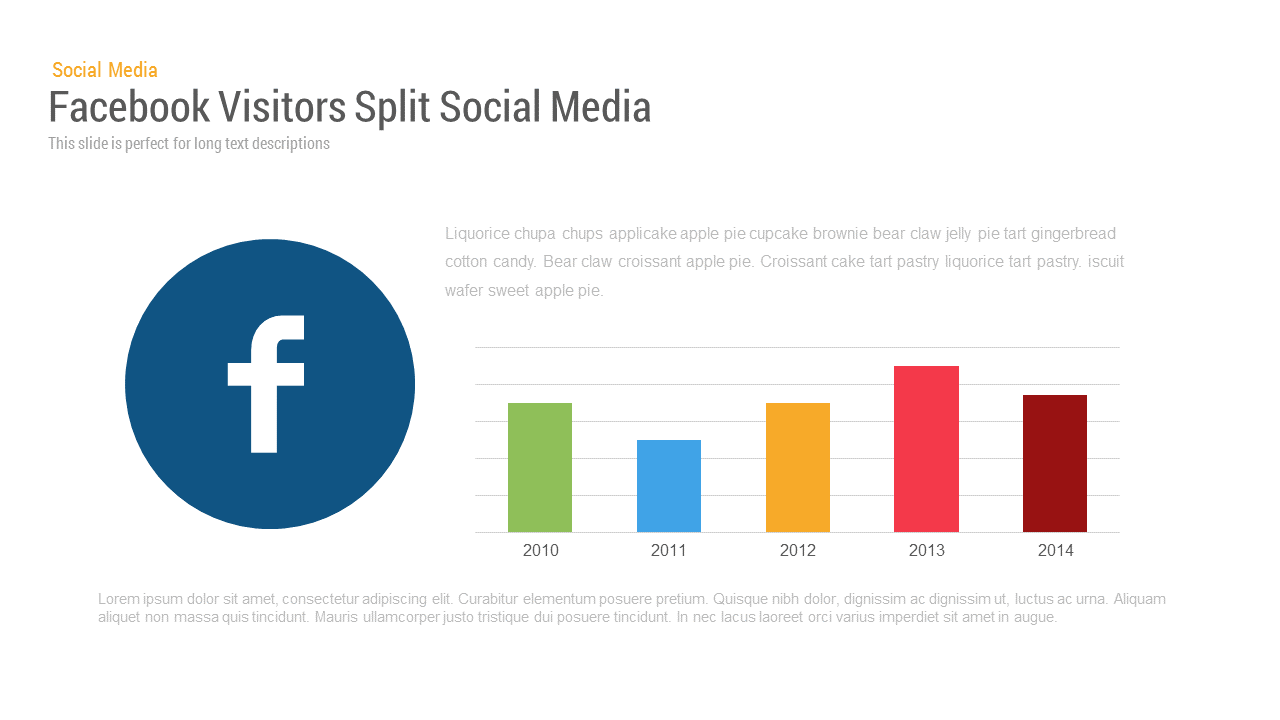
Facebook User Split template for PowerPoint & Google Slides
Bar/Column
Premium
Free Facebook Page Analytics Slide for PowerPoint & Google Slides
Customer Experience
Free
Bubble Head Metrics Infographic Template for PowerPoint & Google Slides
Circle
Premium
Circle Segment Sales Metrics Infographic Template for PowerPoint & Google Slides
Circle
Premium
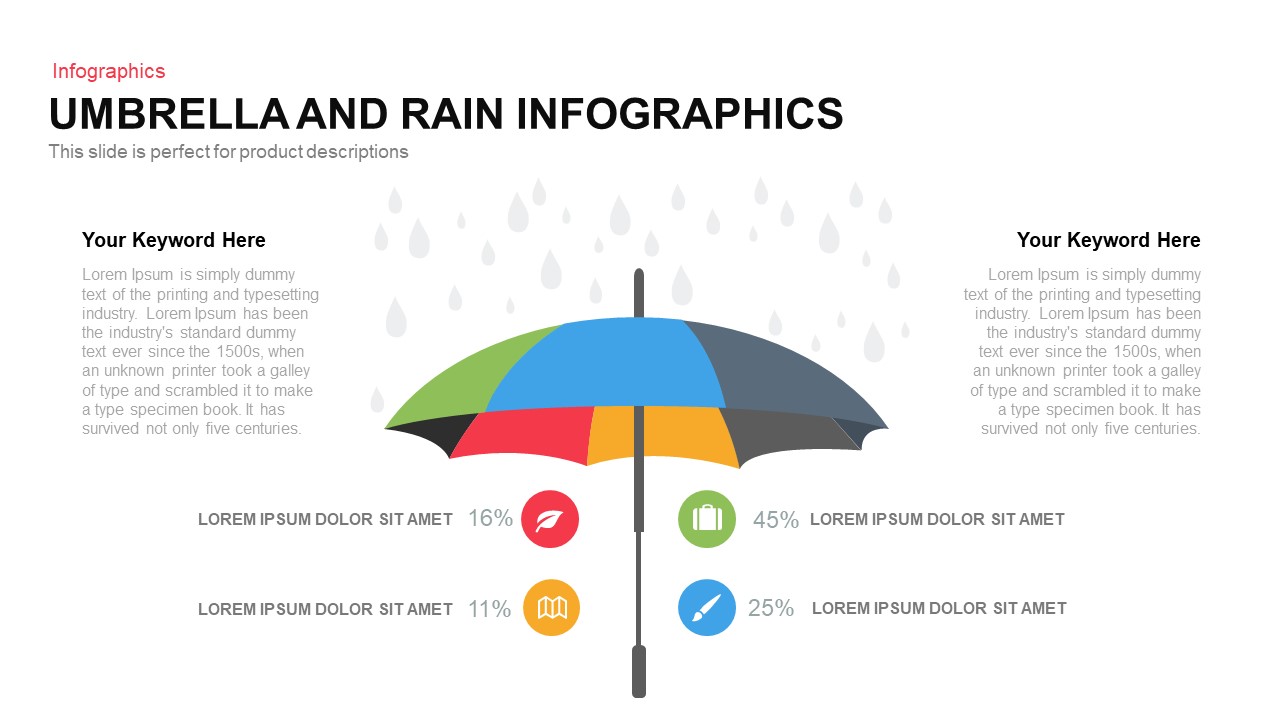
Umbrella and Rain Infographic Metrics Template for PowerPoint & Google Slides
Comparison
Premium
Colorful Block Infographic Metrics Slide Template for PowerPoint & Google Slides
Infographics
Premium
Statistics & Global Metrics Infographic Template for PowerPoint & Google Slides
Bar/Column
Premium
LinkedIn Metrics Infographic Slide Template for PowerPoint & Google Slides
Digital Marketing
Premium
Instagram Infographic Metrics Slide Template for PowerPoint & Google Slides
Marketing
Premium
Mastodon Metrics Infographic Dashboard Template for PowerPoint & Google Slides
Business Report
Premium
iPad App Mockup with Progress Metrics Template for PowerPoint & Google Slides
Bar/Column
Premium
Asia Map with KPI Metrics and Legend Template for PowerPoint & Google Slides
World Maps
Premium
Mobile Usage Metrics template for PowerPoint & Google Slides
Comparison Chart
Premium

Scale Metaphor Metrics Comparison Template for PowerPoint & Google Slides
Charts
Premium
Comprehensive Recruitment Metrics Report Template for PowerPoint & Google Slides
Recruitment
Premium
Benchmarking Metrics Comparison Slide Template for PowerPoint & Google Slides
Pie/Donut
Premium
Project Status Dashboard with Metrics Template for PowerPoint & Google Slides
Project Status
Premium
Circular Image Gallery & KPI Metrics Template for PowerPoint & Google Slides
Pie/Donut
Premium
Agriculture Infographics Slide with Progress Rings & Metrics Template for PowerPoint & Google Slides
Pie/Donut
Premium
Annual Recurring Revenue Metrics Template for PowerPoint & Google Slides
Bar/Column
Premium
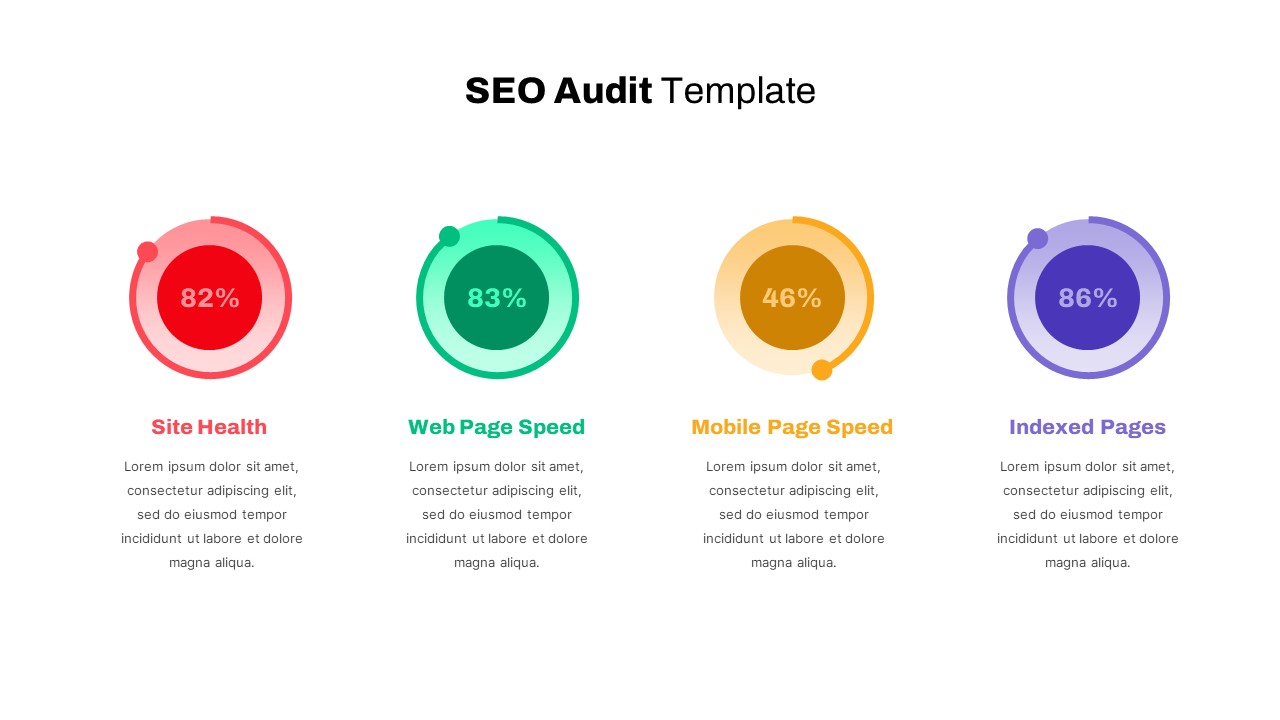
Detailed SEO Audit Metrics Overview Template for PowerPoint & Google Slides
Circle
Premium
Free Editable U.S. Map with Regional Metrics Template for PowerPoint & Google Slides
World Maps
Free
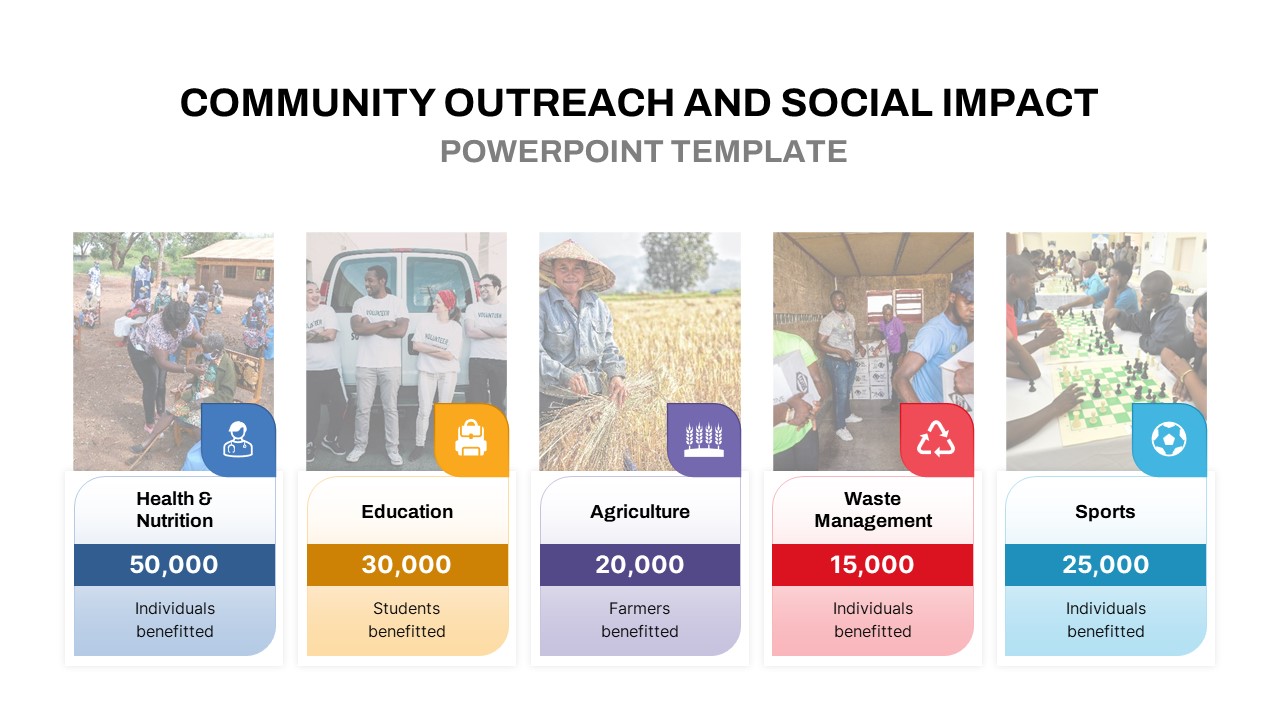
Community Outreach Impact Metrics Template for PowerPoint & Google Slides
Accomplishment
Premium
DevOps KPI Dashboard Performance Metrics Template for PowerPoint & Google Slides
Software Development
Premium
Purchasing KPI Metrics Dashboard Template for PowerPoint & Google Slides
Business Report
Premium
Financial Snapshot & Metrics Overview Template for PowerPoint & Google Slides
Finance
Premium
Procurement KPI Dashboard & Metrics Template for PowerPoint & Google Slides
Business Report
Premium
Market Validation Metrics Overview Template for PowerPoint & Google Slides
Business
Premium
Employee Performance Metrics Dashboard Template for PowerPoint & Google Slides
Employee Performance
Premium
Pirate Metrics AARRR Funnel Framework Template for PowerPoint & Google Slides
Funnel
Premium
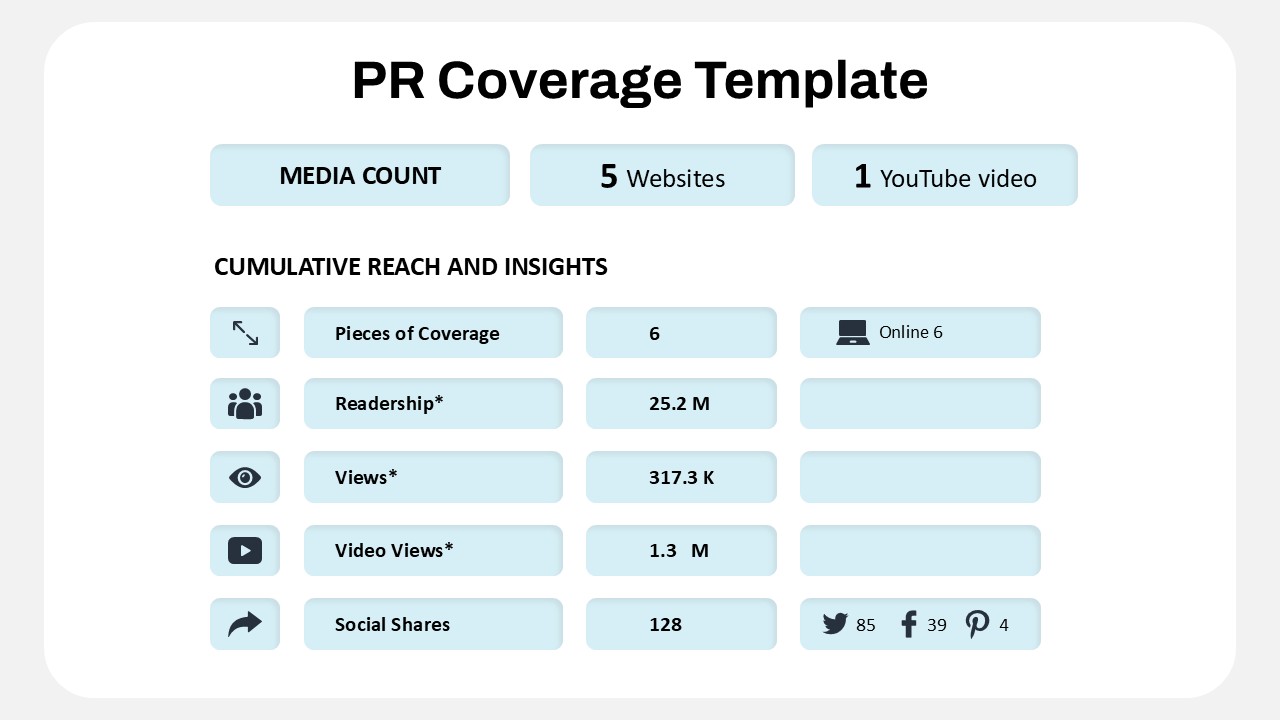
Public Relations Coverage Metrics Template for PowerPoint & Google Slides
Business Report
Premium
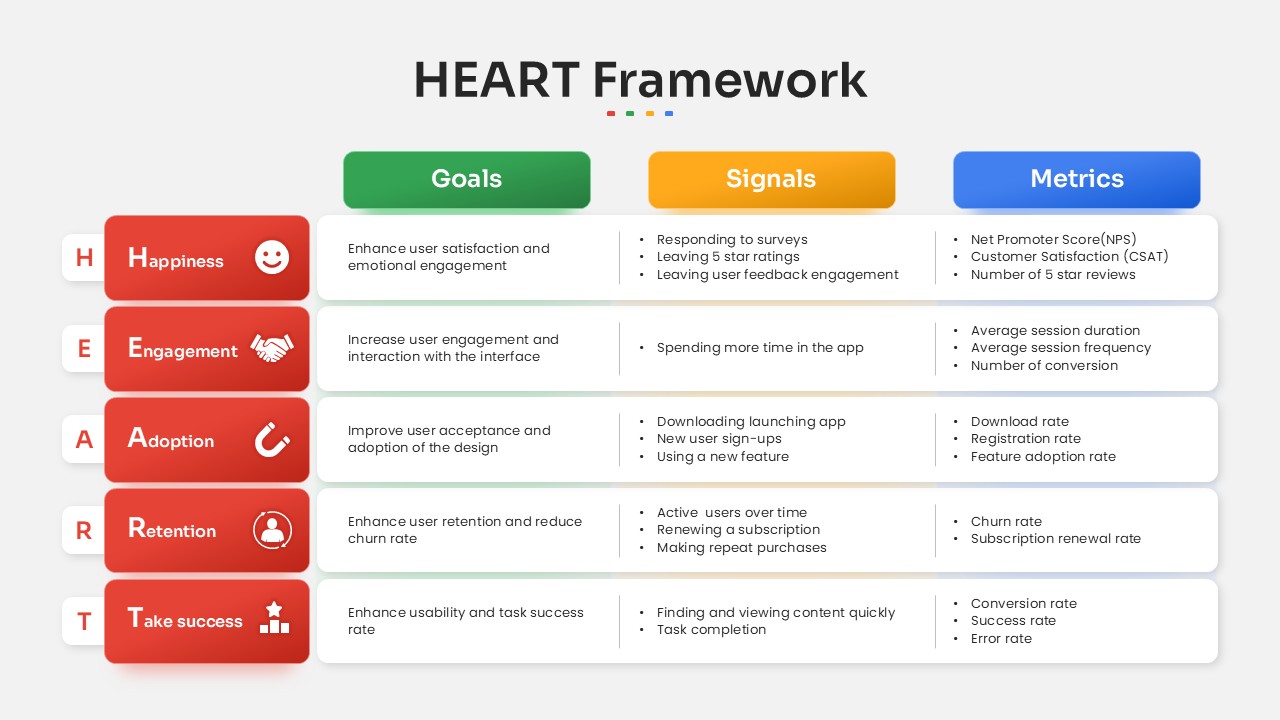
HEART Framework Goals, Signals & Metrics Template for PowerPoint & Google Slides
Process
Premium
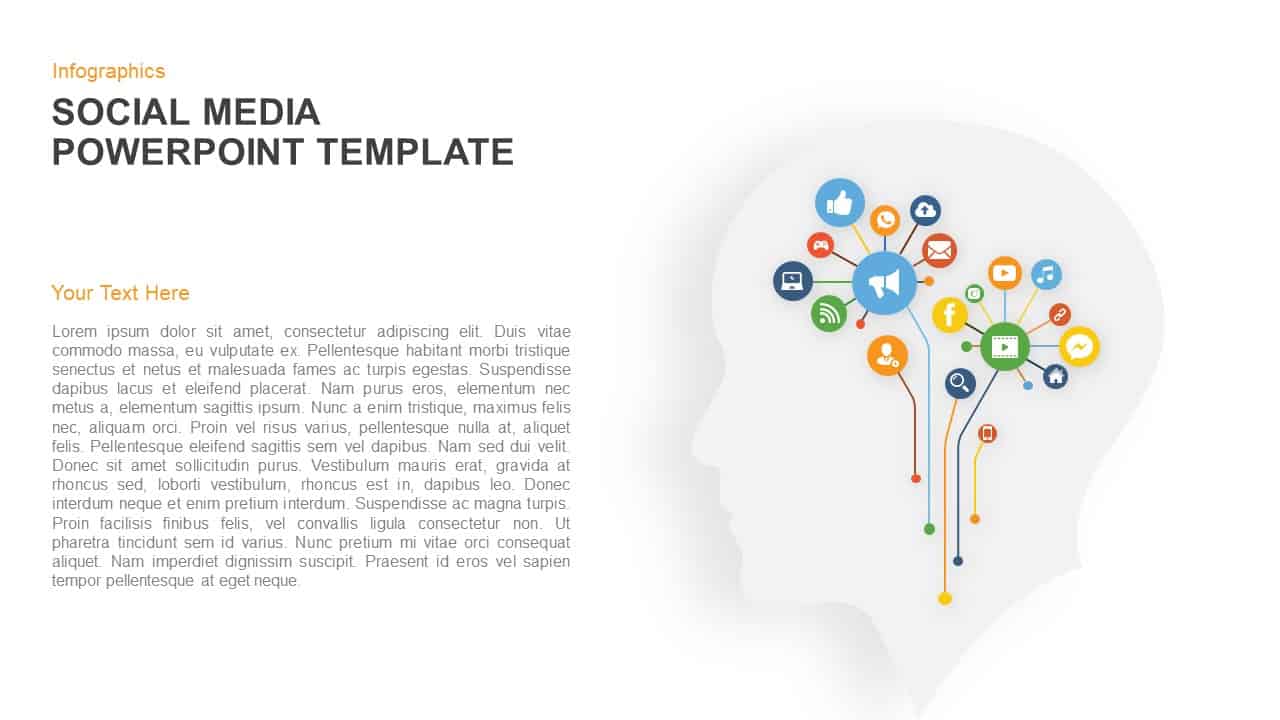
Social Media Mind Network Infographic Template for PowerPoint & Google Slides
Digital Marketing
Premium
Social Network Connectivity Infographic Template for PowerPoint & Google Slides
Infographics
Premium
Social Media Rocket Launch Infographic Template for PowerPoint & Google Slides
Marketing
Premium
Social Network Infographic Diagram Template for PowerPoint & Google Slides
Digital Marketing
Premium
Social Media Network Infographic Template for PowerPoint & Google Slides
Circle
Premium
Social Media Smartphone Infographic Template for PowerPoint & Google Slides
Pie/Donut
Premium
Social Media Infographic Arrow Layout Template for PowerPoint & Google Slides
Arrow
Premium
Twitter Social Media Infographic Template for PowerPoint & Google Slides
Circle
Premium
Free Social Media Hub-and-Spoke Infographic Template for PowerPoint & Google Slides
Circle
Free
Social Learning Theory Infographic Template for PowerPoint & Google Slides
Circle
Premium
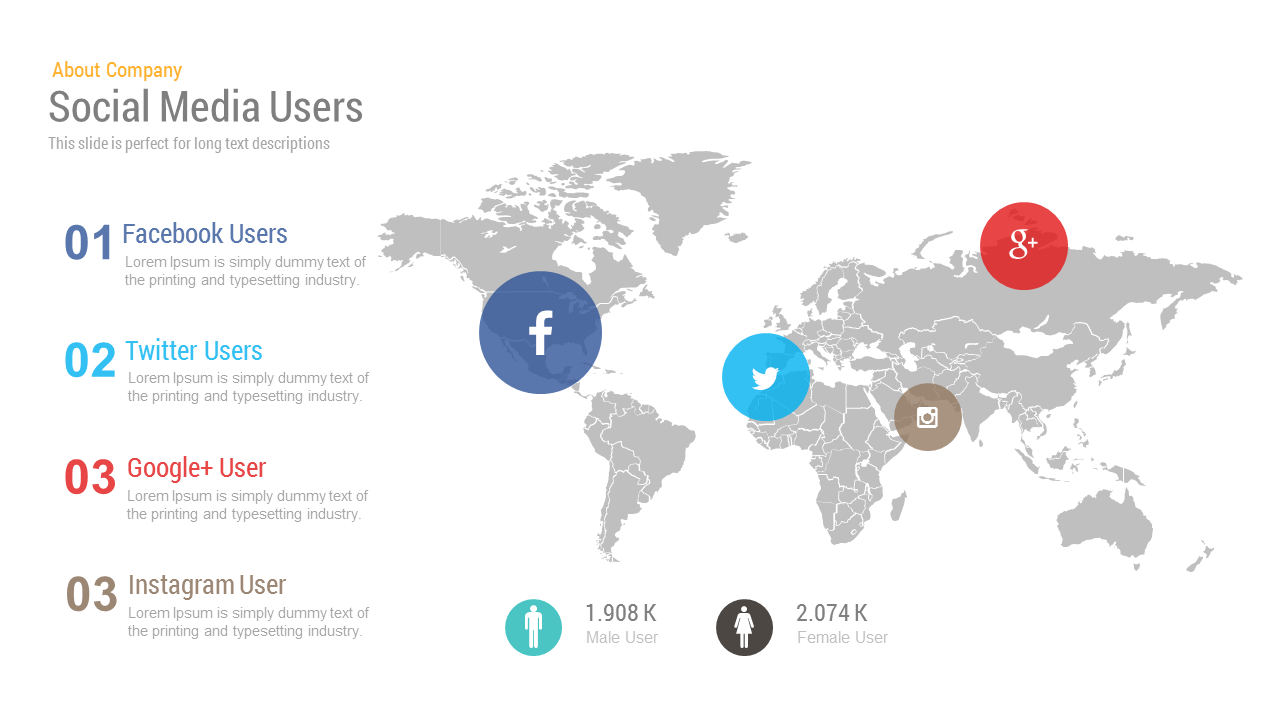
Free Social Media Users Map template for PowerPoint & Google Slides
World Maps
Free
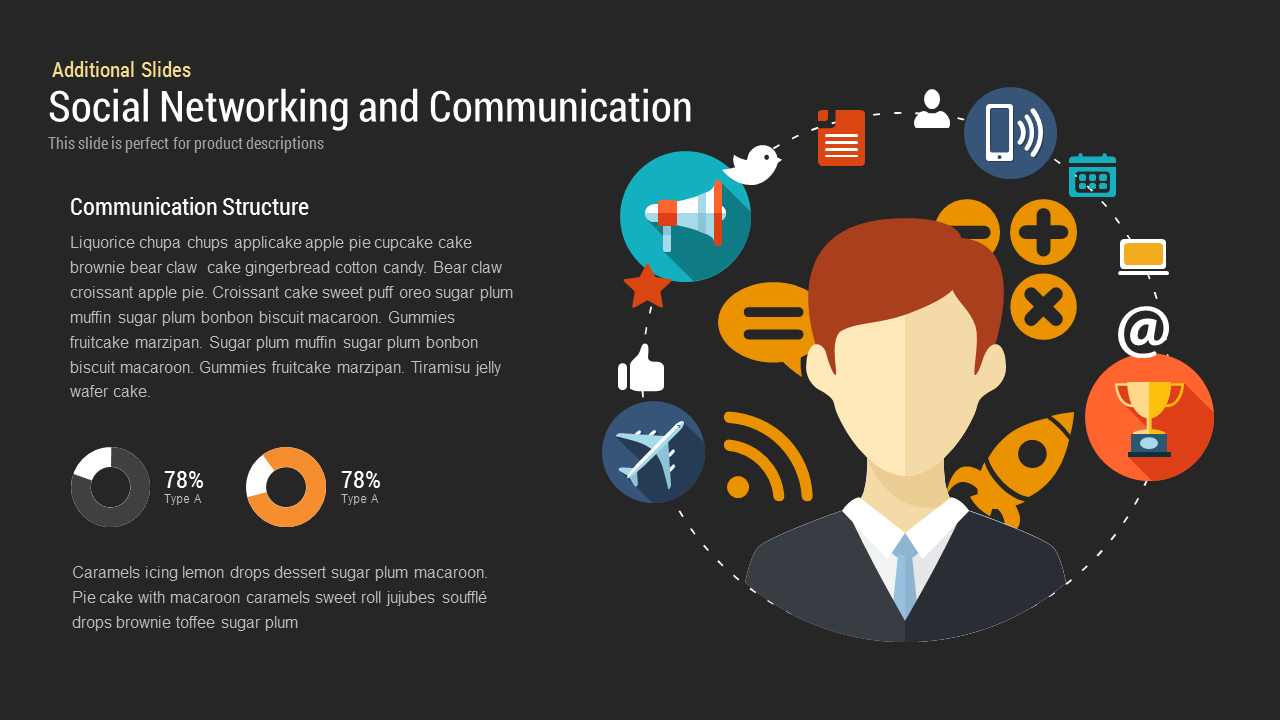
Social Networking and Communication template for PowerPoint & Google Slides
Digital Marketing
Premium
Comprehensive Social Media Icons Slide Template for PowerPoint & Google Slides
Advertising
Premium

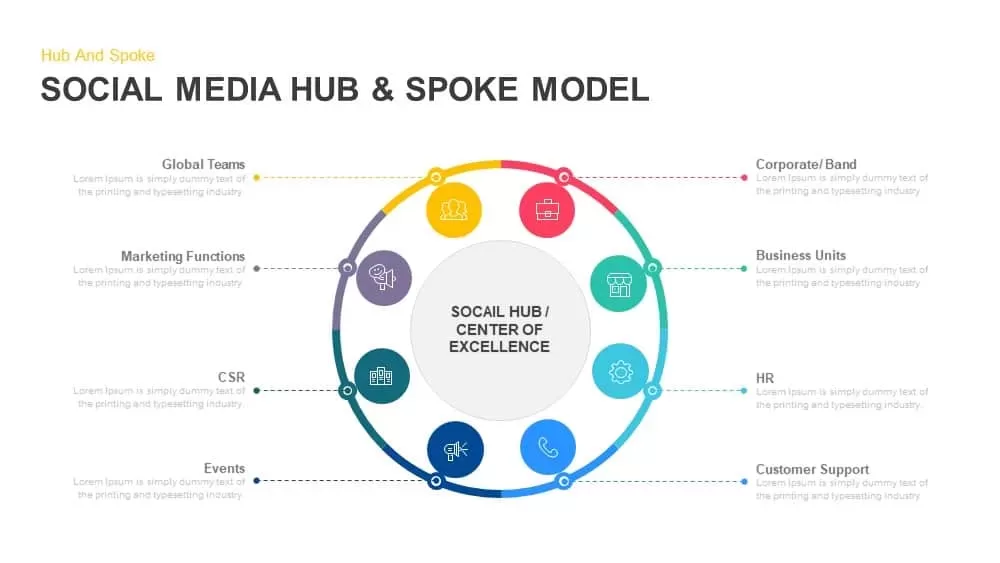
Social Media Hub & Spoke Model Template for PowerPoint & Google Slides
Process
Premium
Social Media Market Share Pie Charts Template for PowerPoint & Google Slides
Pie/Donut
Premium
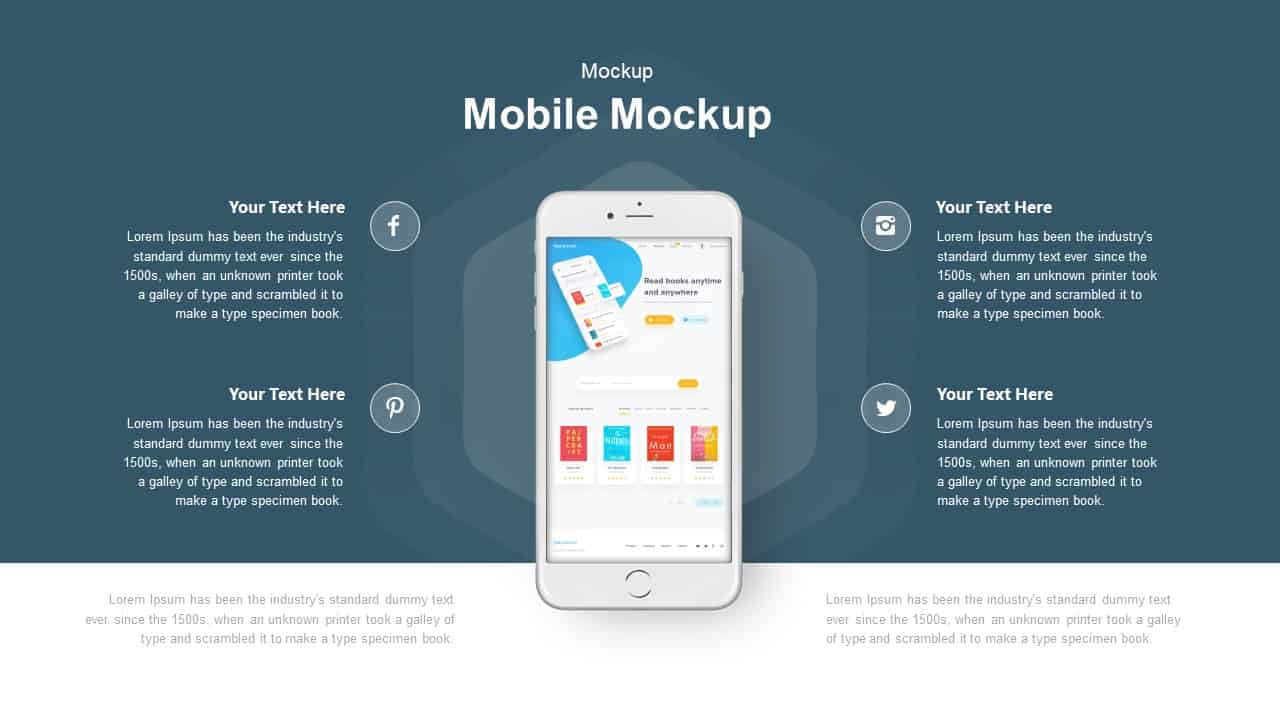
Mobile Mockup with Social Callouts Template for PowerPoint & Google Slides
Software Development
Premium
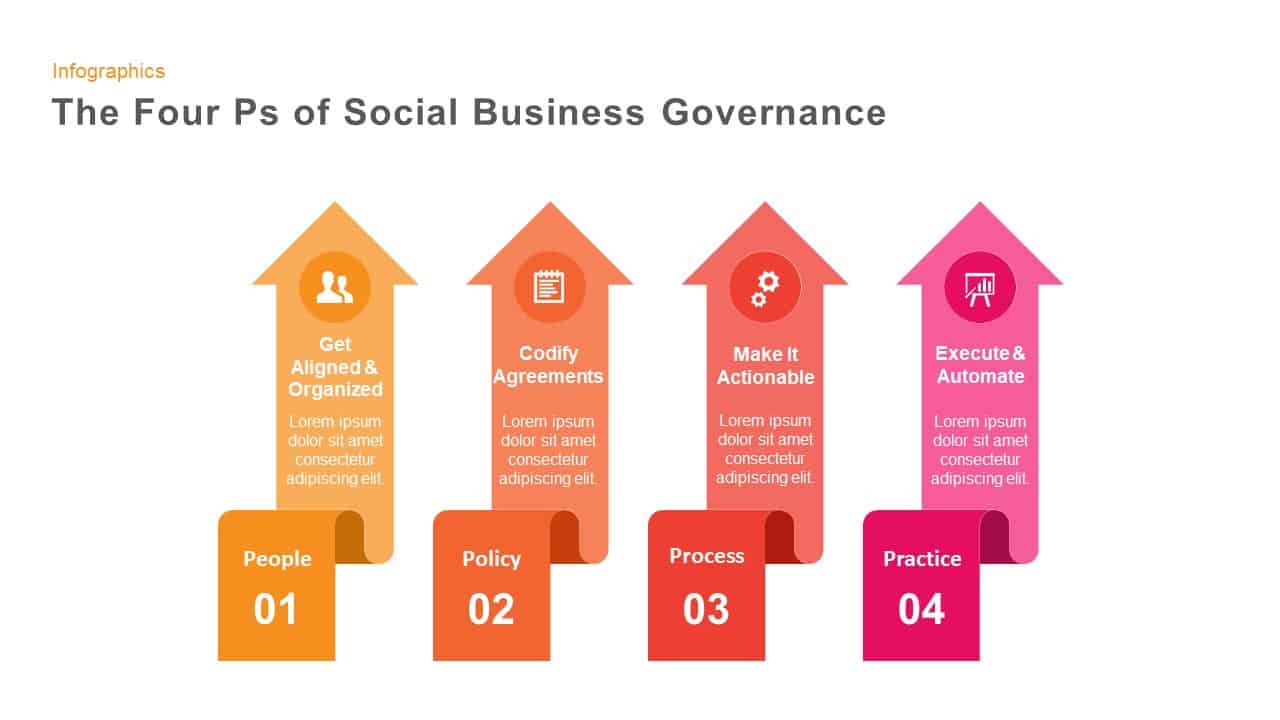
Four Ps of Social Business Governance template for PowerPoint & Google Slides
Business Strategy
Premium
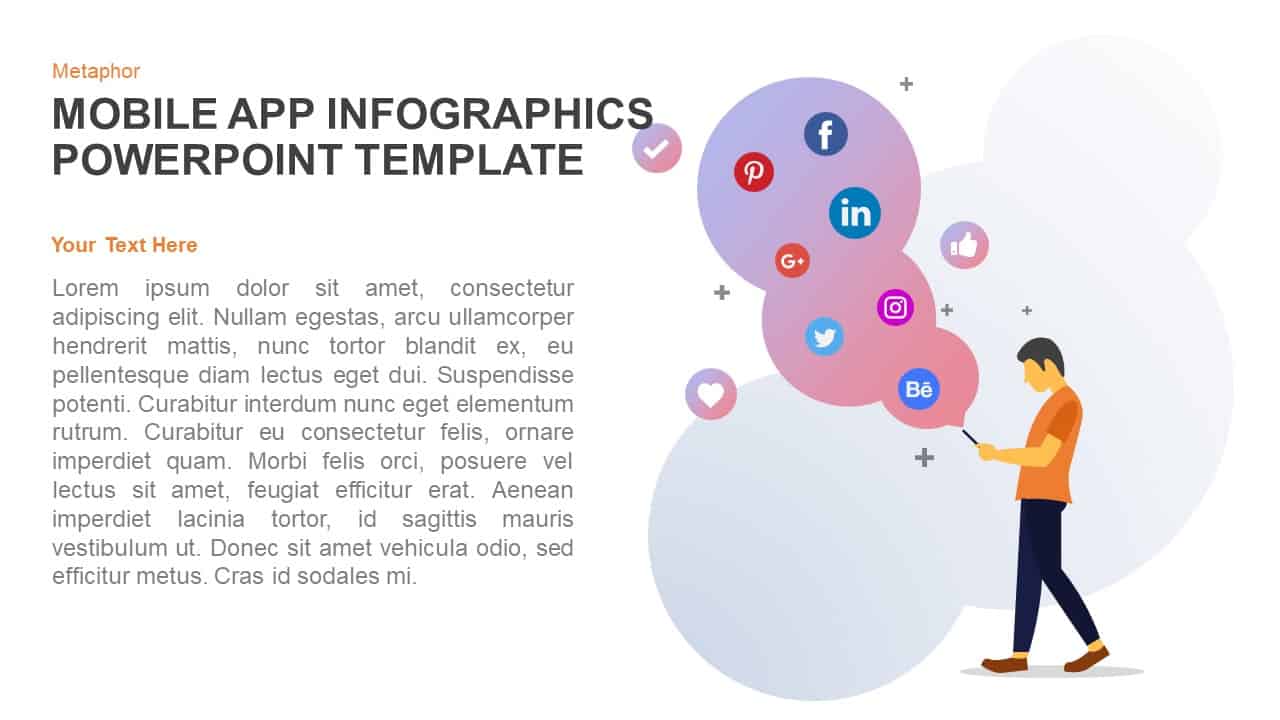
Mobile App Social Media Metaphor Template for PowerPoint & Google Slides
Infographics
Premium
Social Media Metaphor Illustration Template for PowerPoint & Google Slides
Digital Marketing
Premium
Social Media Performance Dashboard Template for PowerPoint & Google Slides
Bar/Column
Premium
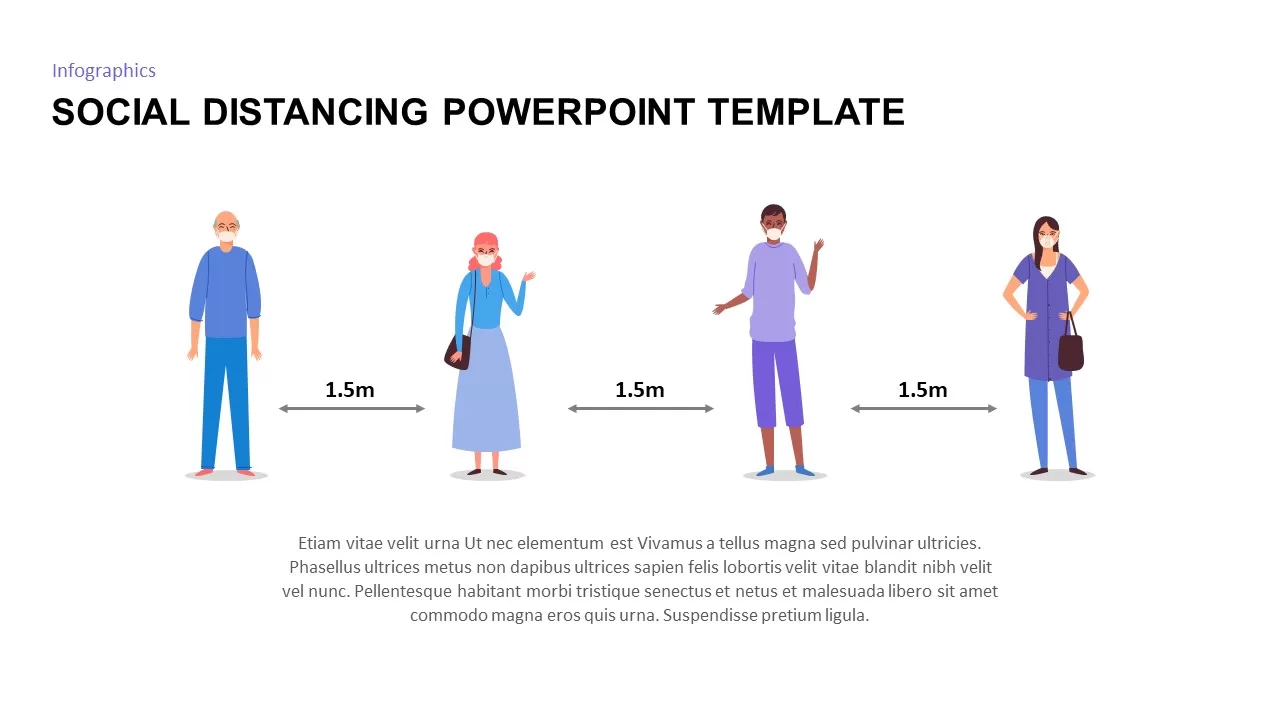
Social Distancing PowerPoint & Google Slides Template
Business Strategy
Premium
Social Media Marketing Tool Template for PowerPoint & Google Slides
Digital Marketing
Premium
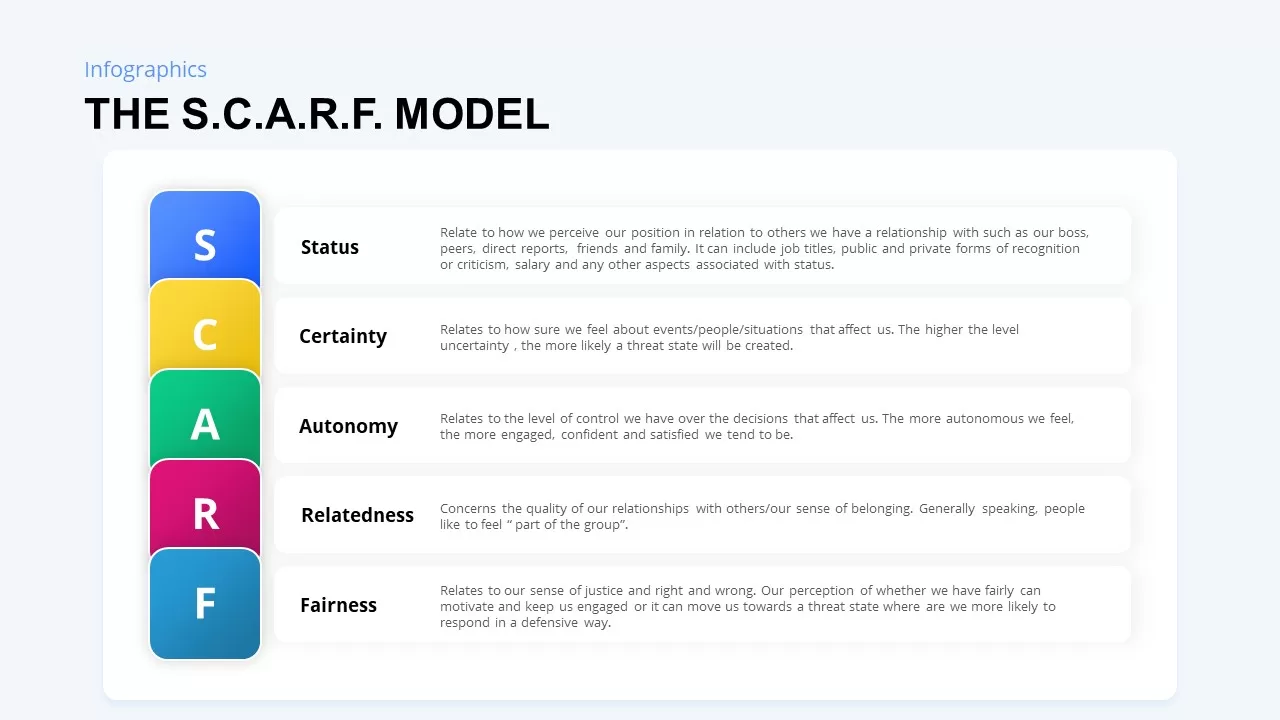
SCARF Model Social Threats & Rewards Template for PowerPoint & Google Slides
Business Strategy
Premium
Free 3D Social Media Icons template for PowerPoint & Google Slides
Digital Marketing
Free
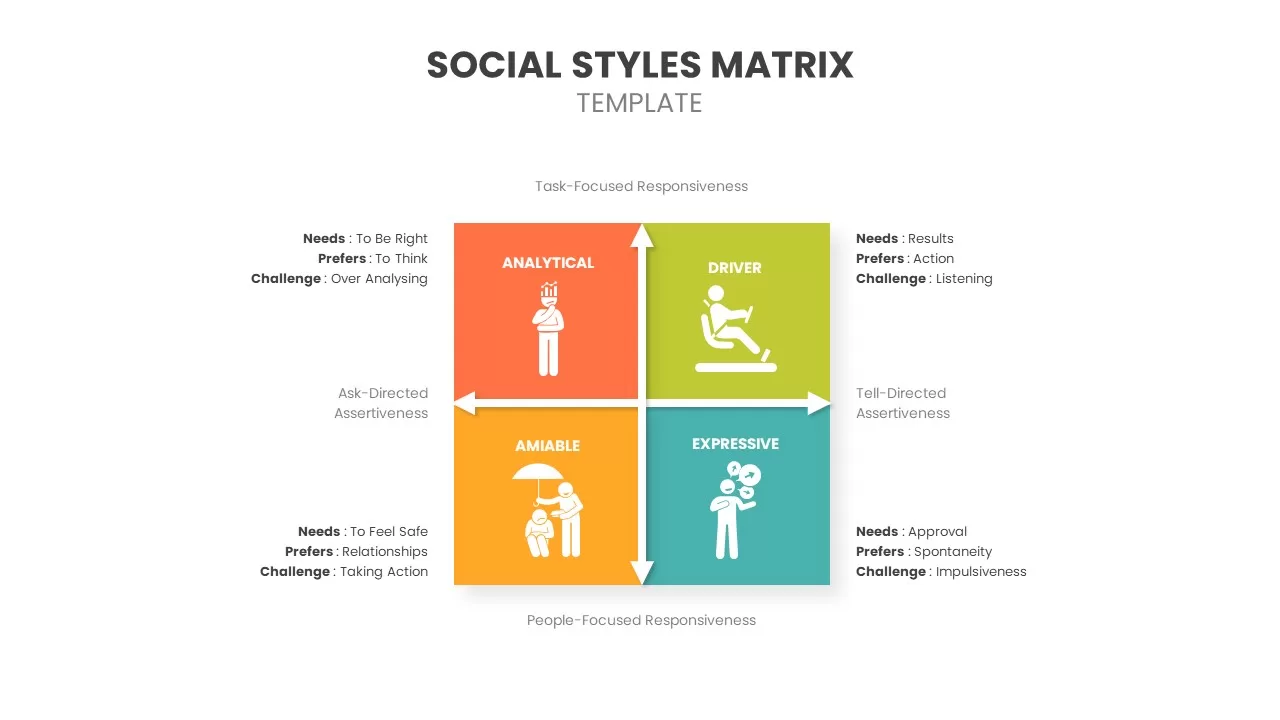
Social Styles Matrix Template for PowerPoint & Google Slides
Business
Premium
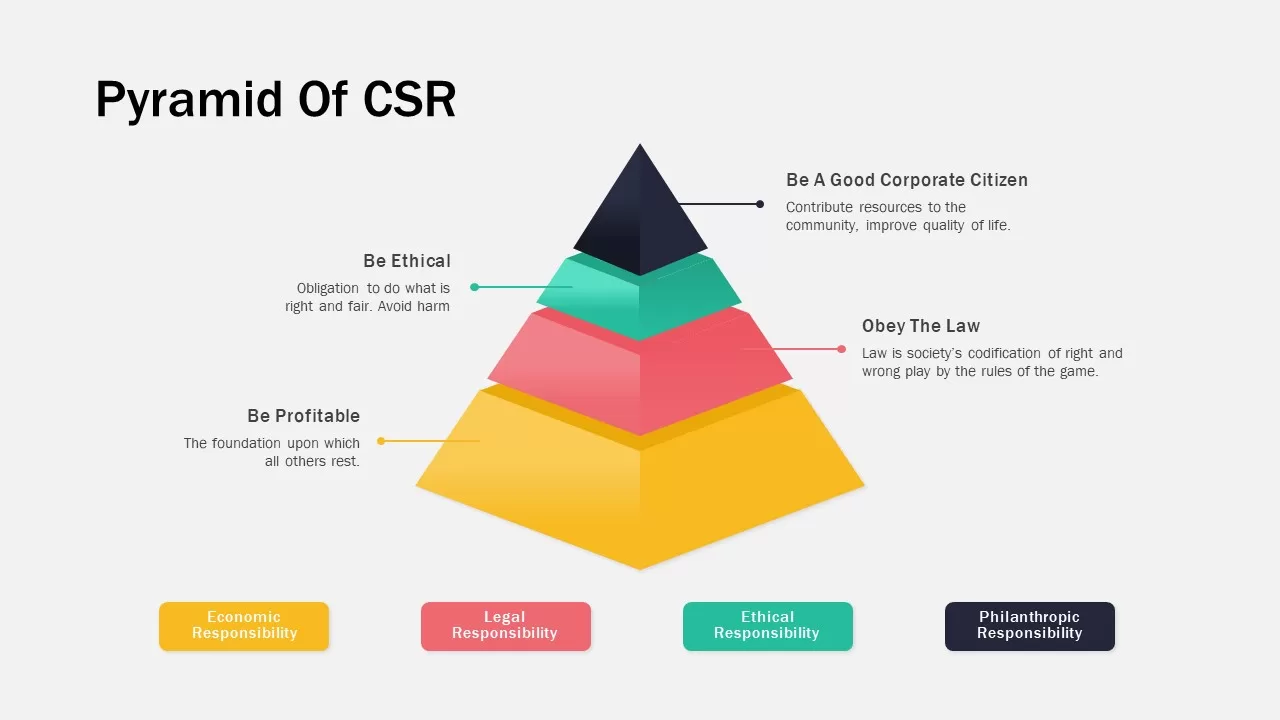
Corporate Social Responsibility Pyramid Template for PowerPoint & Google Slides
Pyramid
Premium
Popular Social Media Comparison Grid Template for PowerPoint & Google Slides
Digital Marketing
Premium
Social Media Analytics Dashboard Template for PowerPoint & Google Slides
Digital Marketing
Premium

Social Media Marketing Agency Pitch Deck Template for PowerPoint & Google Slides
Pitch Deck
Premium
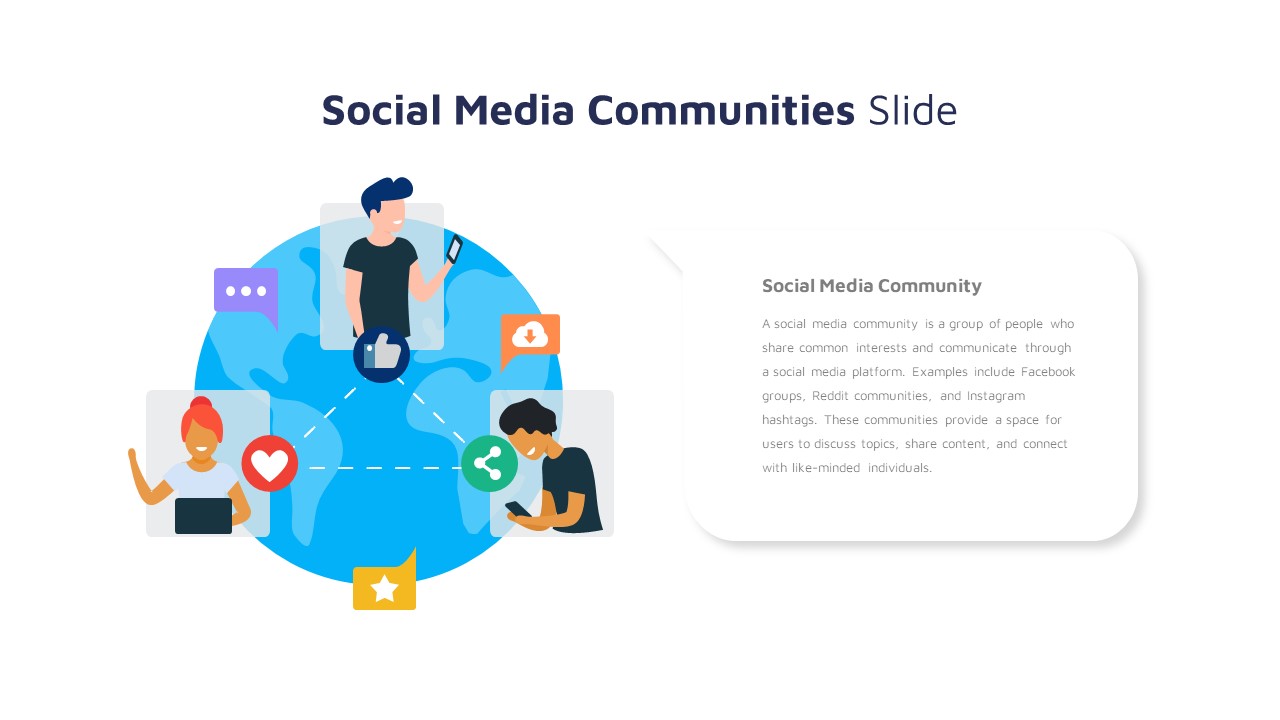
Social Media Community Network Slide Template for PowerPoint & Google Slides
Circle
Premium
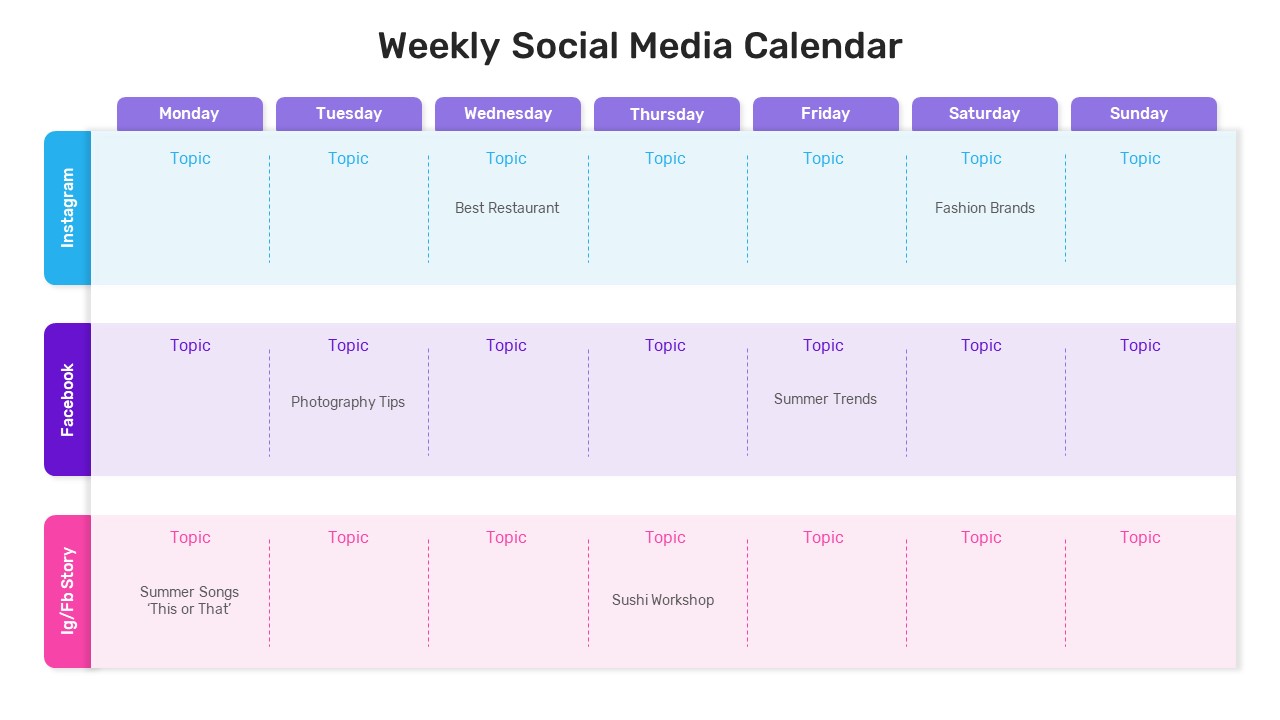
Weekly Social Media Calendar Editable Template for PowerPoint & Google Slides
Digital Marketing
Premium
Six-Step Social Media Management Process Template for PowerPoint & Google Slides
Process
Premium
Modern Social Media Infographics Template for PowerPoint & Google Slides
Digital Marketing
Premium
Social Media Plan Table Slide Deck Template for PowerPoint & Google Slides
Process
Premium
Social Media Marketing Connection Template for PowerPoint & Google Slides
Digital Marketing
Premium
Social Media Policy Dos & Don’ts Slide Template for PowerPoint & Google Slides
Comparison
Premium
Social Media Marketing Strategy Template for PowerPoint & Google Slides
Digital Marketing
Premium
Social Media Listening Overview Slide Template for PowerPoint & Google Slides
Customer Experience
Premium
Social Media Voice Template for PowerPoint & Google Slides
Customer Experience
Premium
Social Media Hub-and-Spoke Infographics Template for PowerPoint & Google Slides
Circle
Premium
Social Media Statistics 2023 Dashboard Template for PowerPoint & Google Slides
Comparison
Premium
Social Media Report Presentation Template for PowerPoint & Google Slides
Digital Marketing
Premium
Comprehensive Social Media Audit Template for PowerPoint & Google Slides
Digital Marketing
Premium
Modern Social Media Timeline Roadmap Template for PowerPoint & Google Slides
Timeline
Premium
Corporate Social Responsibility Strategy Template for PowerPoint & Google Slides
Company Profile
Premium
Free Comprehensive Social Work Presentation Template for PowerPoint & Google Slides
Pitch Deck
Free
Free Nonprofit Charity Social Impact Deck Template for PowerPoint & Google Slides
Pitch Deck
Free

Social Media Marketing Presentation Template for PowerPoint & Google Slides
Decks
Premium
Social Media Presentation Template for PowerPoint & Google Slides
Pitch Deck
Premium
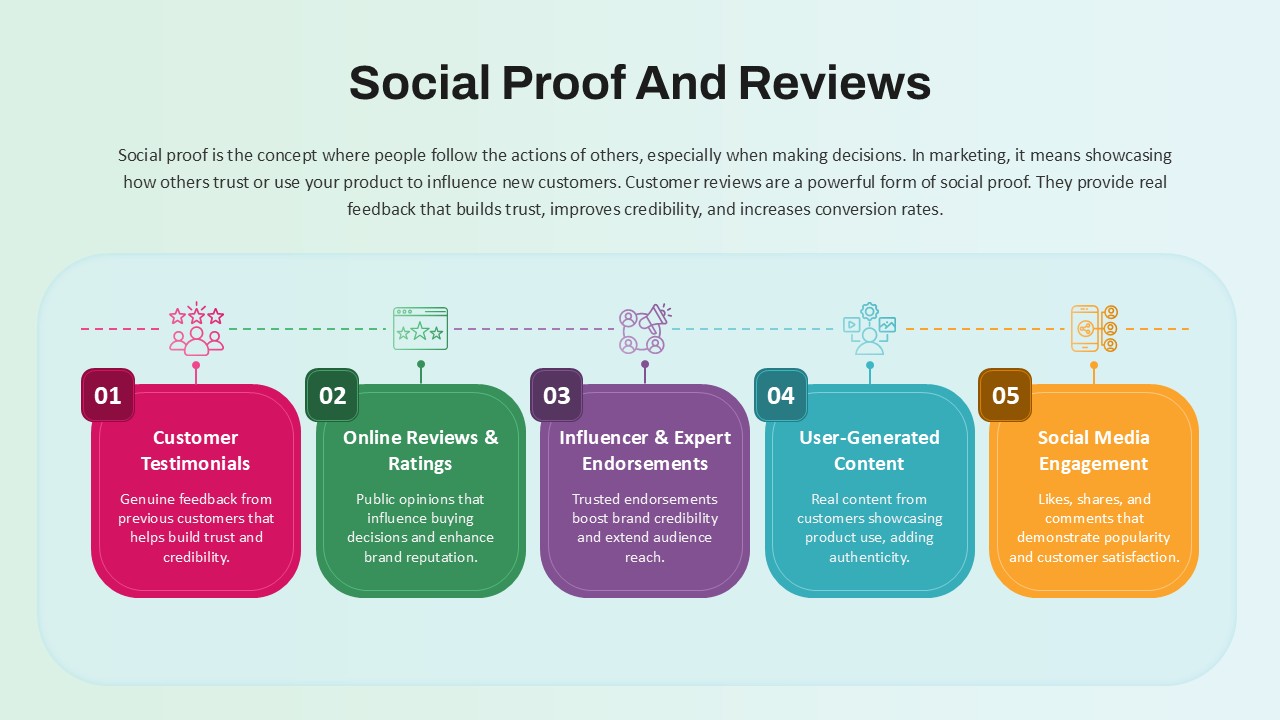
Social Proof and Reviews in Marketing template for PowerPoint & Google Slides
Customer Journey
Premium
Social Media Marketing Overview Template for PowerPoint & Google Slides
Advertising
Premium
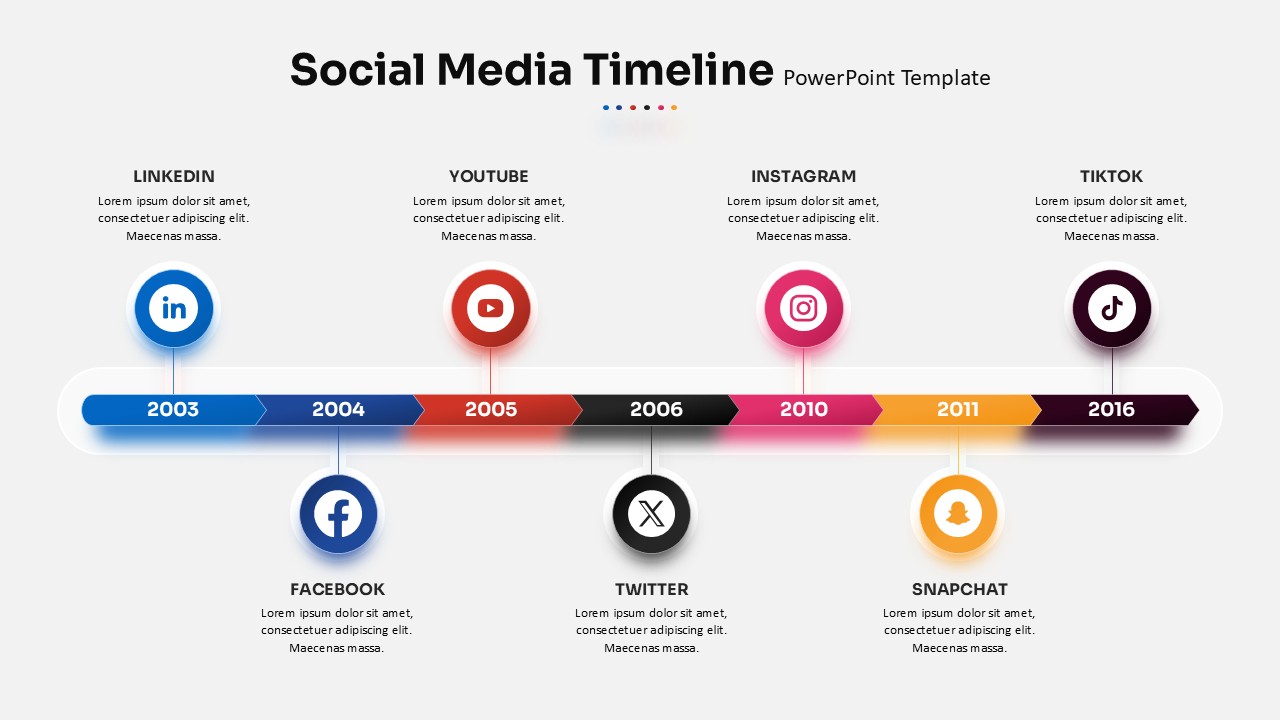
Social Media Timeline template for PowerPoint & Google Slides
Timeline
Premium
Social Media Recruiting Strategy template for PowerPoint & Google Slides
Business
Premium
Social Media Network Hub Diagram Slide for PowerPoint & Google Slides
Process
Premium
Google Ads Optimization & Performance Infographic Template for PowerPoint & Google Slides
Digital Marketing
Premium
SQ3R Study Strategy Infographic Slides Template for PowerPoint & Google Slides
Business Strategy
Premium
Six Double Diamond Infographic Slides Template for PowerPoint & Google Slides
Process
Premium
Sales Process Infographic Slides Pack Template for PowerPoint & Google Slides
Process
Premium
Casino/Poker Chips Infographic Slides template for PowerPoint & Google Slides
Business Strategy
Premium
Agenda Infographic Pack of 2 Slides Template for PowerPoint & Google Slides
Agenda
Premium
Quad Chart Infographic Pack of 8 Slides Template for PowerPoint & Google Slides
Comparison Chart
Premium
Four Options Infographic Slides Template for PowerPoint & Google Slides
Comparison
Premium
Game Plan Infographic Slides Pack Template for PowerPoint & Google Slides
Infographics
Premium
Teamwork PowerPoint Infographic Template for PowerPoint & Google Slides
Leadership
Premium
Kite Infographic PowerPoint Template for PowerPoint & Google Slides
Process
Premium
Workflow PowerPoint Process infographic for PowerPoint & Google Slides
Process
Premium