Three-Stage S Curve Growth Diagram Template for PowerPoint & Google Slides

Description
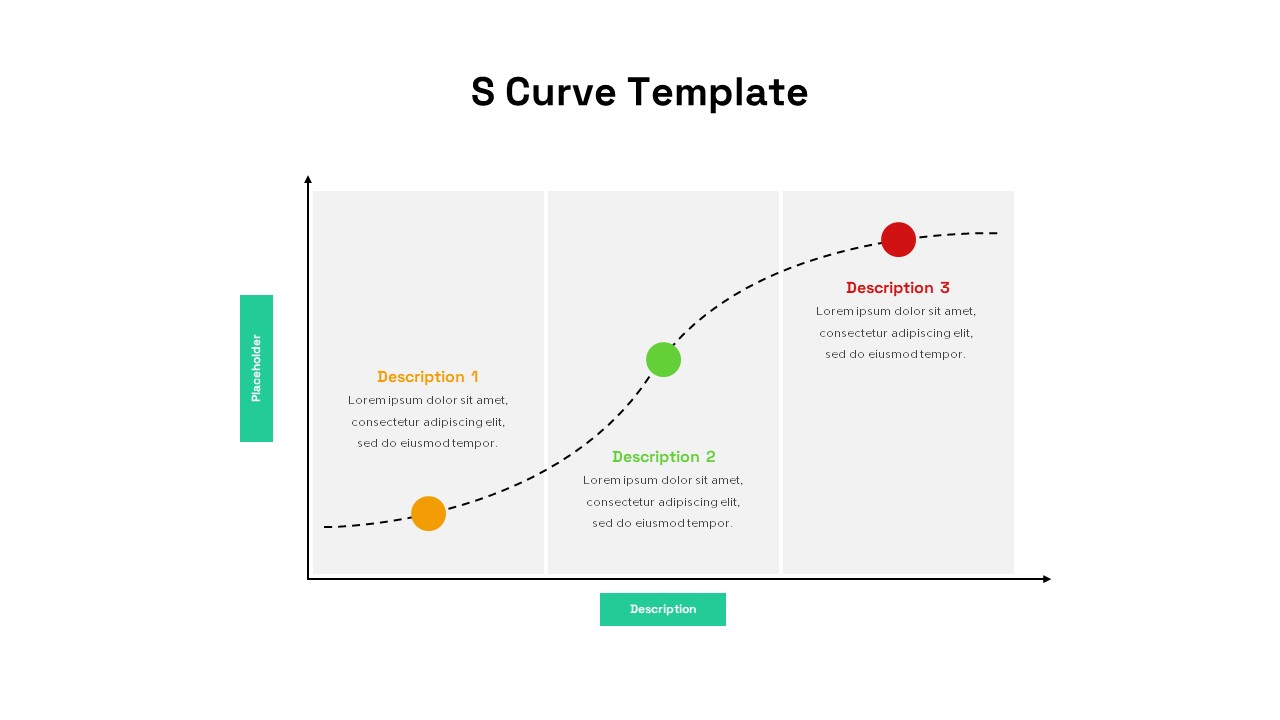
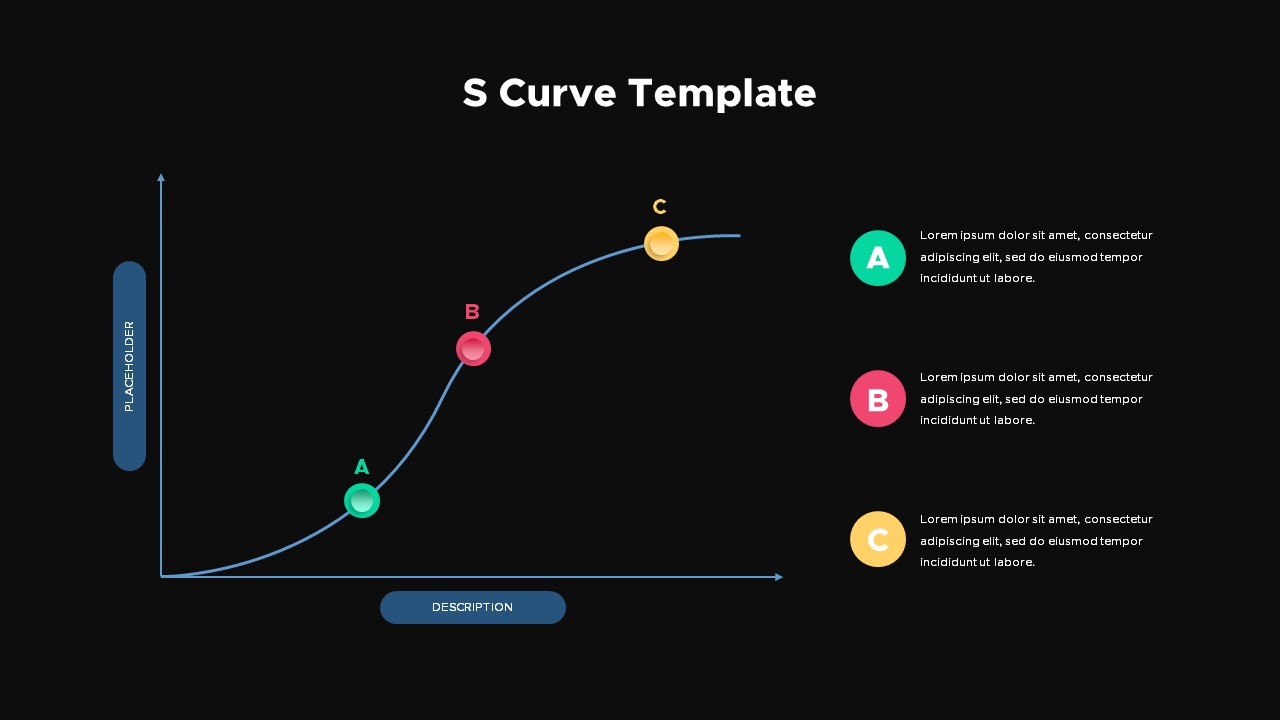
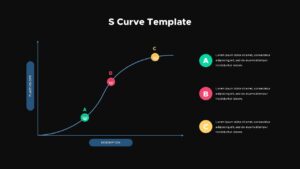
Use this professional S-curve diagram slide to present three sequential stages—A, B, C—along a smooth S-shaped trajectory. A clean horizontal and vertical axis anchors the dark-blue curve, while the three colored milestone circles (emerald for A, magenta for B, amber for C) mark critical inflection points. A horizontal pill-shaped label below the X-axis and a vertical placeholder tag on the Y-axis offer space for axis titles. On the right, aligned callouts with matching colored circles let you elaborate on each stage with concise text. White background and ample white space ensure clarity and focus. Crafted using master layouts and vector objects, the template lets you adjust curve thickness, swap marker icons, modify color accents, and update fonts effortlessly. Whether scaling metrics, showcasing adoption phases, or mapping performance growth, this slide maintains full resolution in both PowerPoint and Google Slides, guaranteeing seamless brand integration and collaborative editing without formatting issues.
The slide’s axis arrows and placeholder labels can be customized to reflect specific KPIs or metrics, and the vector-based markers ensure smooth scaling without pixelation. Built-in color palettes adhere to accessibility standards, while easily adjustable legends and data callouts allow you to fine-tune the narrative. The uncluttered minimalist aesthetic keeps audience attention on key inflection points and enables rapid comprehension during executive briefings or workshops.
Who is it for
Product managers, business strategists, and analysts will leverage this S-curve template to illustrate growth lifecycles, adoption rates, or performance milestones. It supports C-level presentations, investor pitches, and strategic reviews, enabling stakeholders to visualize progress inflection points at a glance.
Other Uses
Beyond growth metrics, adapt this S-curve for project phase transitions, learning curves, or technology adoption frameworks. Customize stage labels to depict revenue ramp-up, customer onboarding journeys, or competency development pathways in any corporate or academic presentation.
Login to download this file

Item ID
SB03268
Related Templates

Greiner’s Growth Model Curve template for PowerPoint & Google Slides
Infographics
Premium
Growth Curve Line Chart Visualization Template for PowerPoint & Google Slides
Charts
Premium

Three Stage 3D Arrow Process Diagram Template for PowerPoint & Google Slides
Process
Premium

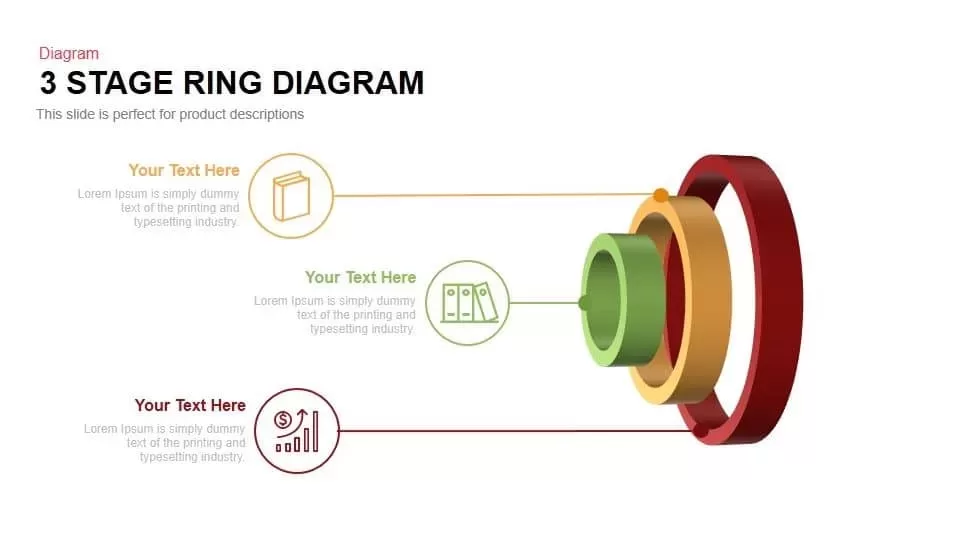
Three-Stage Ring Process Diagram Template for PowerPoint & Google Slides
Circle
Premium
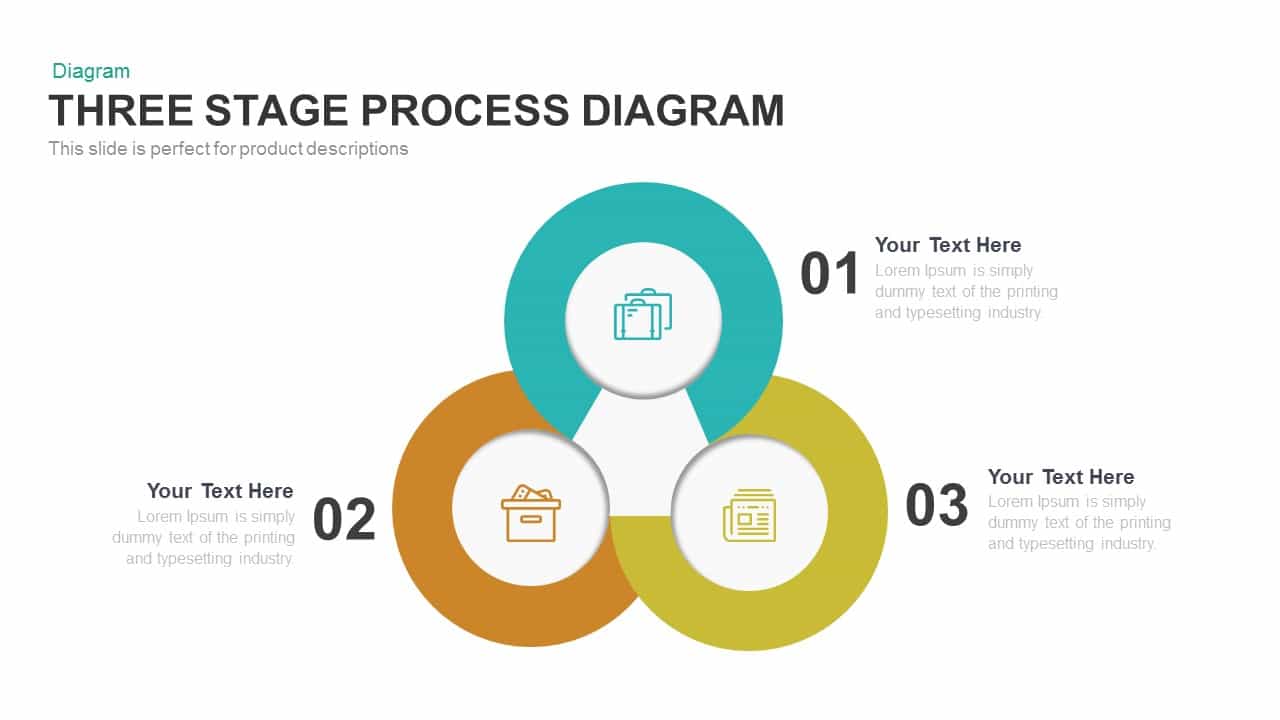
Engaging Three-Stage Process Diagram Template for PowerPoint & Google Slides
Process
Premium
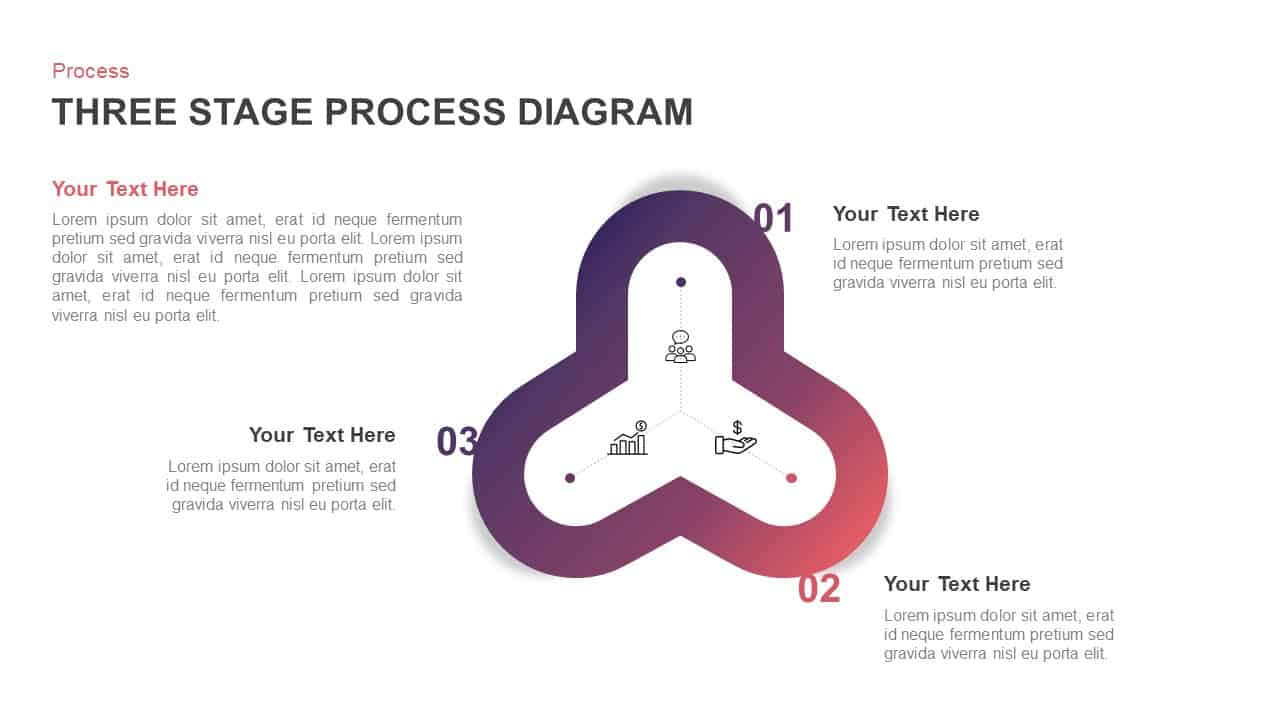
Three-Stage Loop Process Diagram Template for PowerPoint & Google Slides
Process
Premium
Three Four Five Stage Timeline Infographic Template for PowerPoint & Google Slides
Timeline
Premium
Three-Stage Circular Options Chart Template for PowerPoint & Google Slides
Comparison
Premium
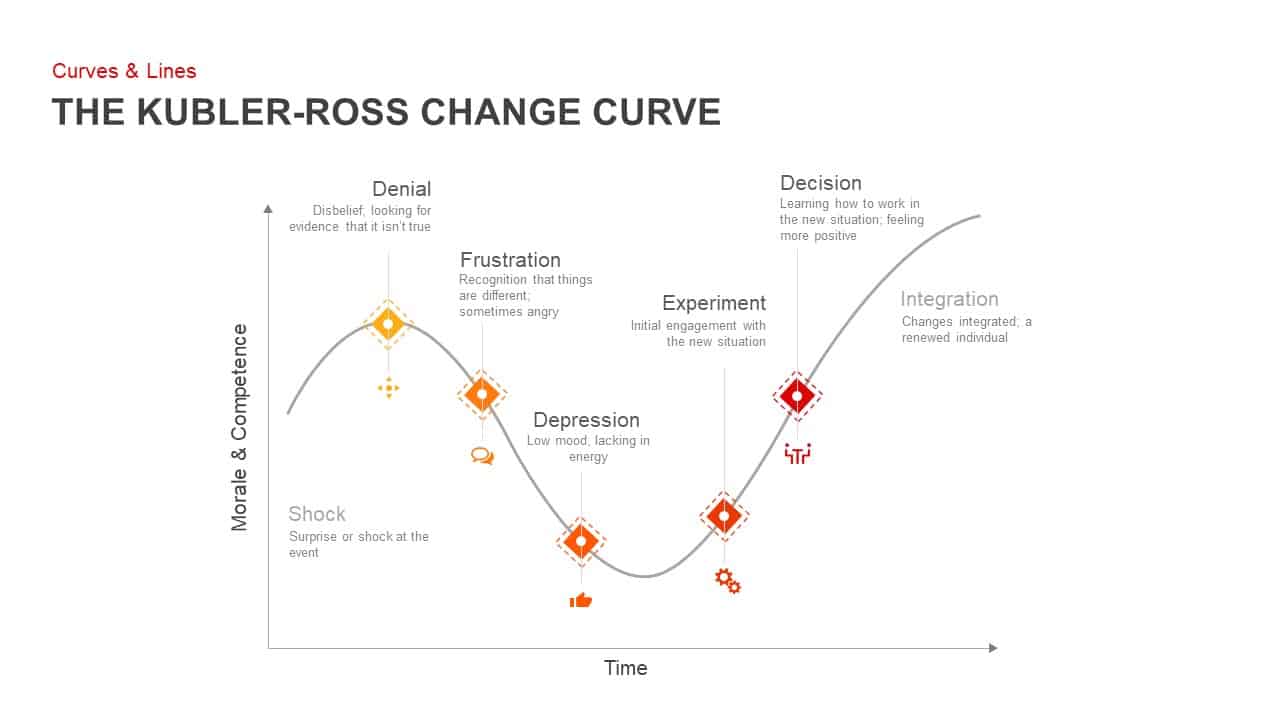
Kubler-Ross Change Curve Diagram Template for PowerPoint & Google Slides
Timeline
Premium

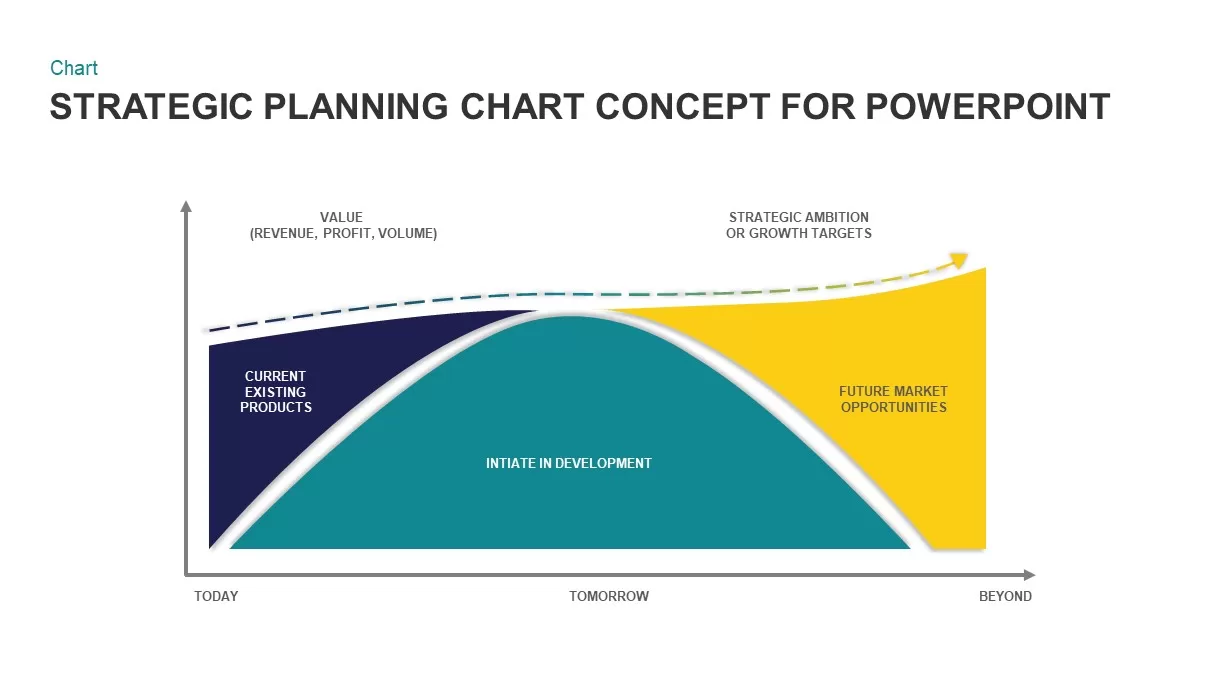
Strategic Planning Curve Diagram Template for PowerPoint & Google Slides
Charts
Premium
Snake Shaped Curve Diagram template for PowerPoint & Google Slides
Business
Premium
S-Curve Progression Framework Diagram Template for PowerPoint & Google Slides
Charts
Premium
Experience Curve Analysis Diagram Template for PowerPoint & Google Slides
Business Strategy
Premium
Gartner Hype Cycle Adoption Curve Diagram Template for PowerPoint & Google Slides
Infographics
Premium

Growth Arrow for Progress & Growth template for PowerPoint & Google Slides
Arrow
Premium
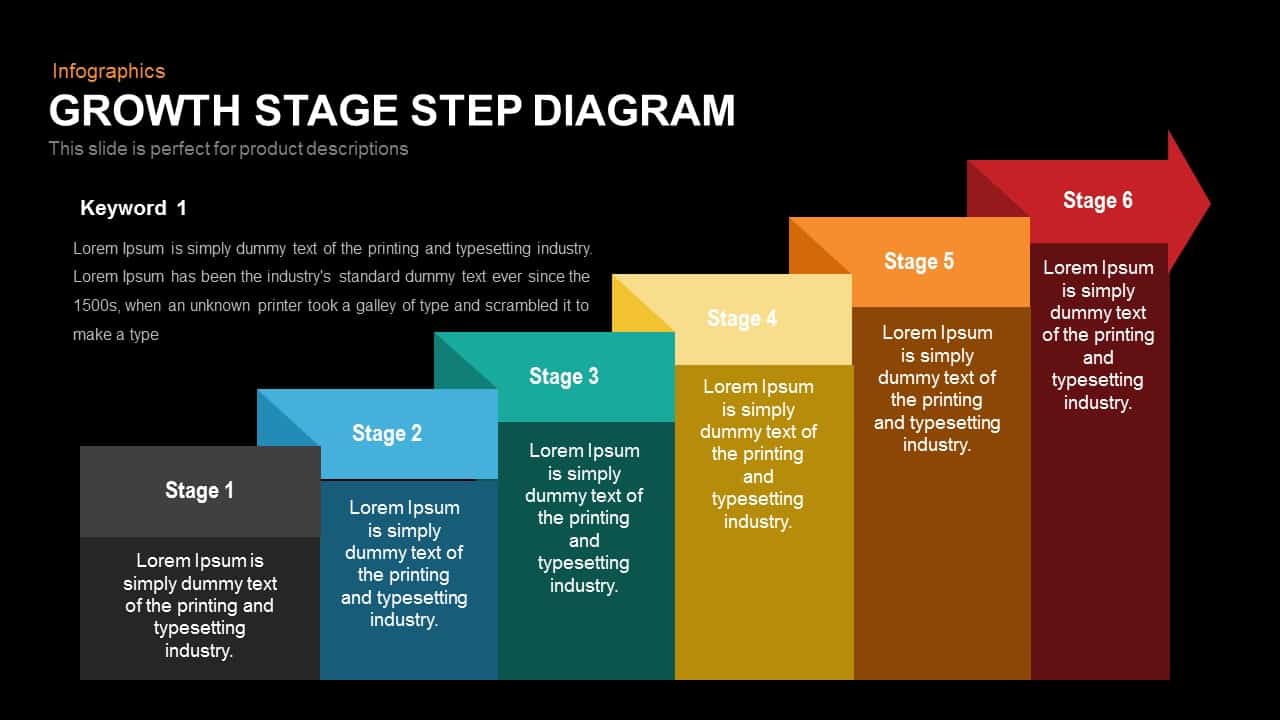
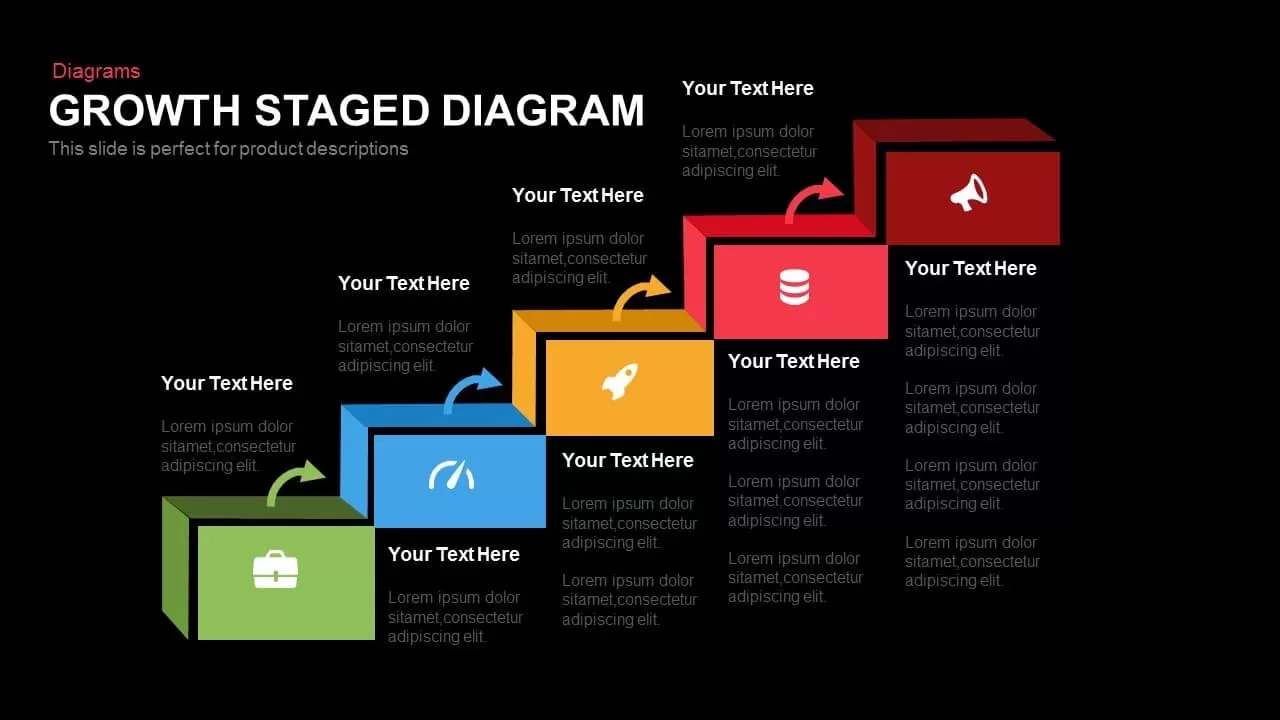
Growth Stage Diagram template for PowerPoint & Google Slides
Process
Premium
Five-Step Growth Stage Staircase Diagram Template for PowerPoint & Google Slides
Process
Premium
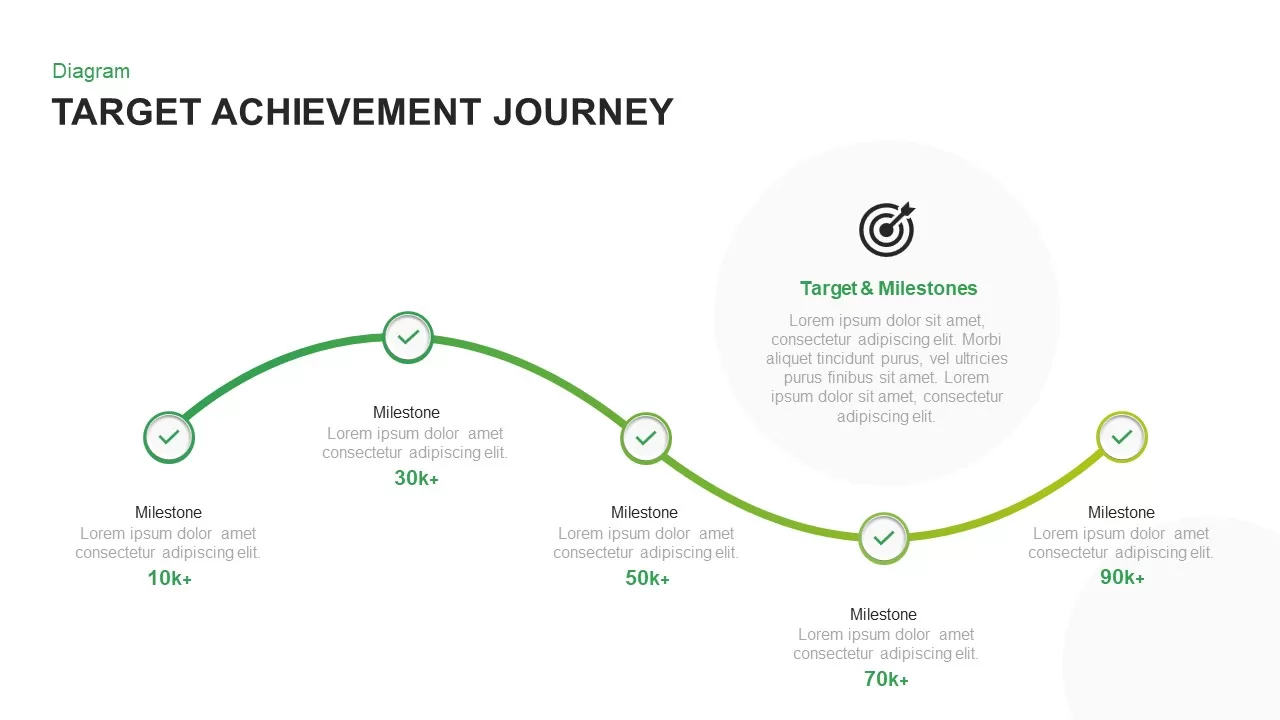
Target Achievement Milestone Curve Template for PowerPoint & Google Slides
Roadmap
Premium
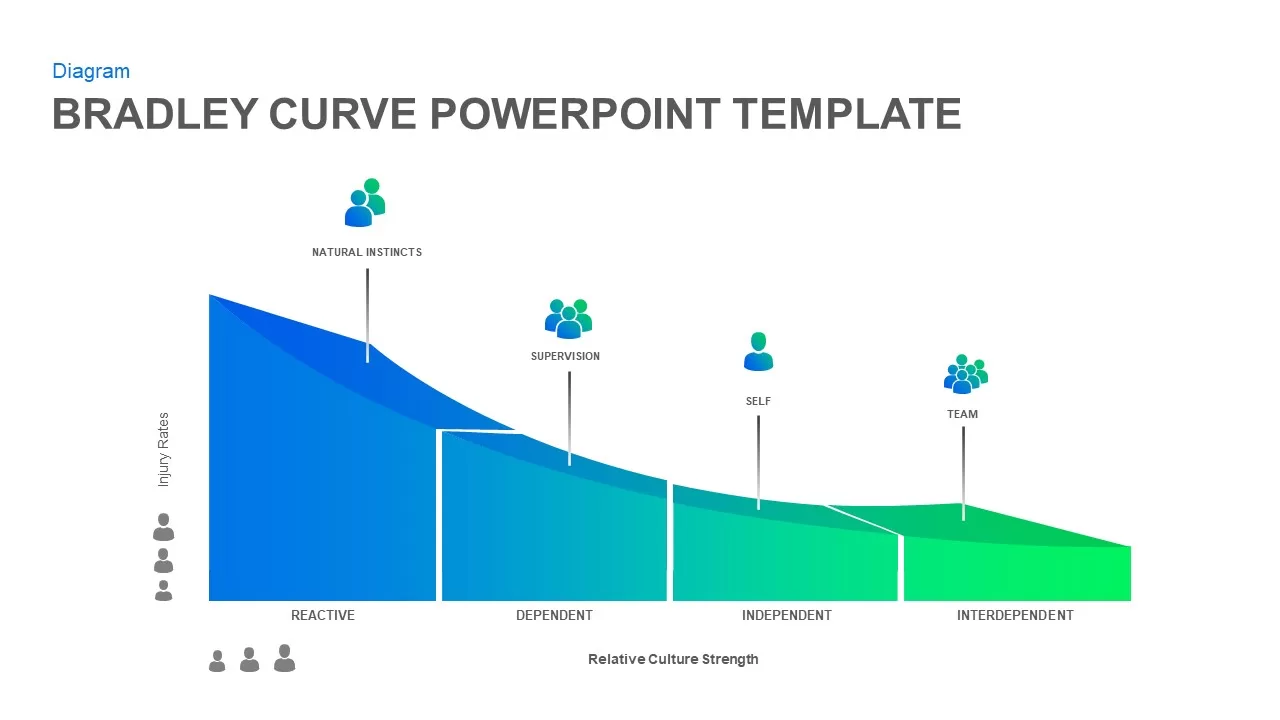
Bradley Curve Infographic Template for PowerPoint & Google Slides
Infographics
Premium
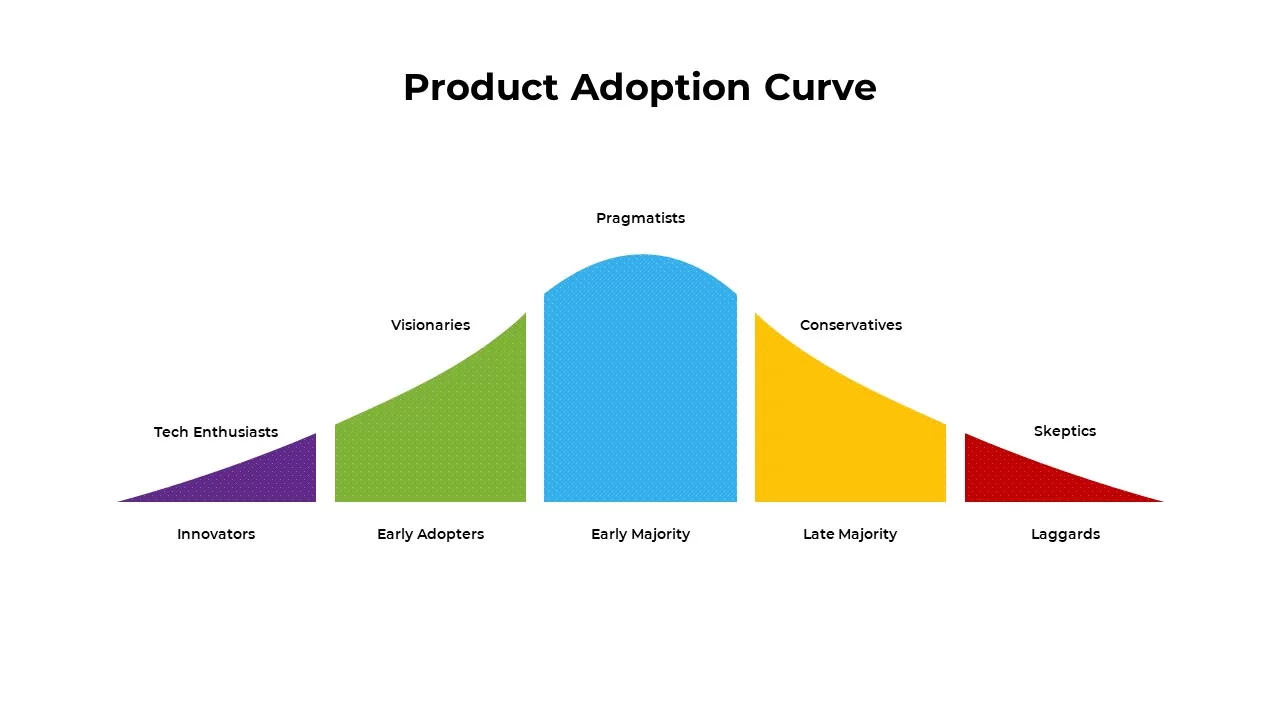
Product Adoption Curve Template for PowerPoint & Google Slides
Process
Premium
8-Bell Curve Infographic Slide Template for PowerPoint & Google Slides
Comparison Chart
Premium
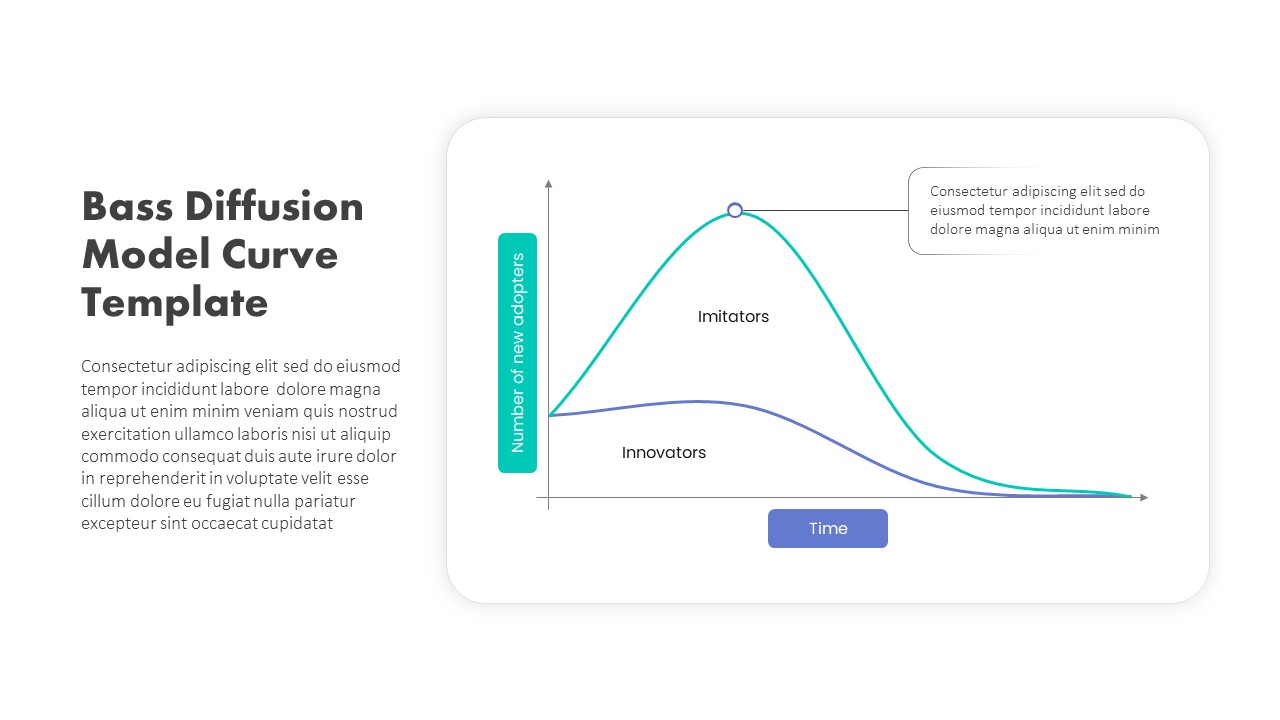
Bass Diffusion Model Curve for Adoption Template for PowerPoint & Google Slides
Comparison Chart
Premium
Economies of Scale Cost Curve Comparison Template for PowerPoint & Google Slides
Comparison Chart
Premium

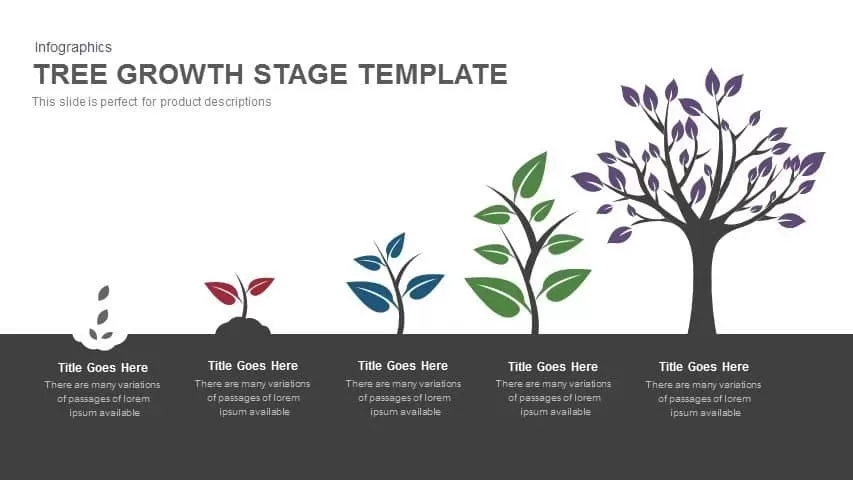
Tree Growth Stage Infographic Template for PowerPoint & Google Slides
Timeline
Premium
Five-Stage Growth Arrow Infographic Template for PowerPoint & Google Slides
Arrow
Premium
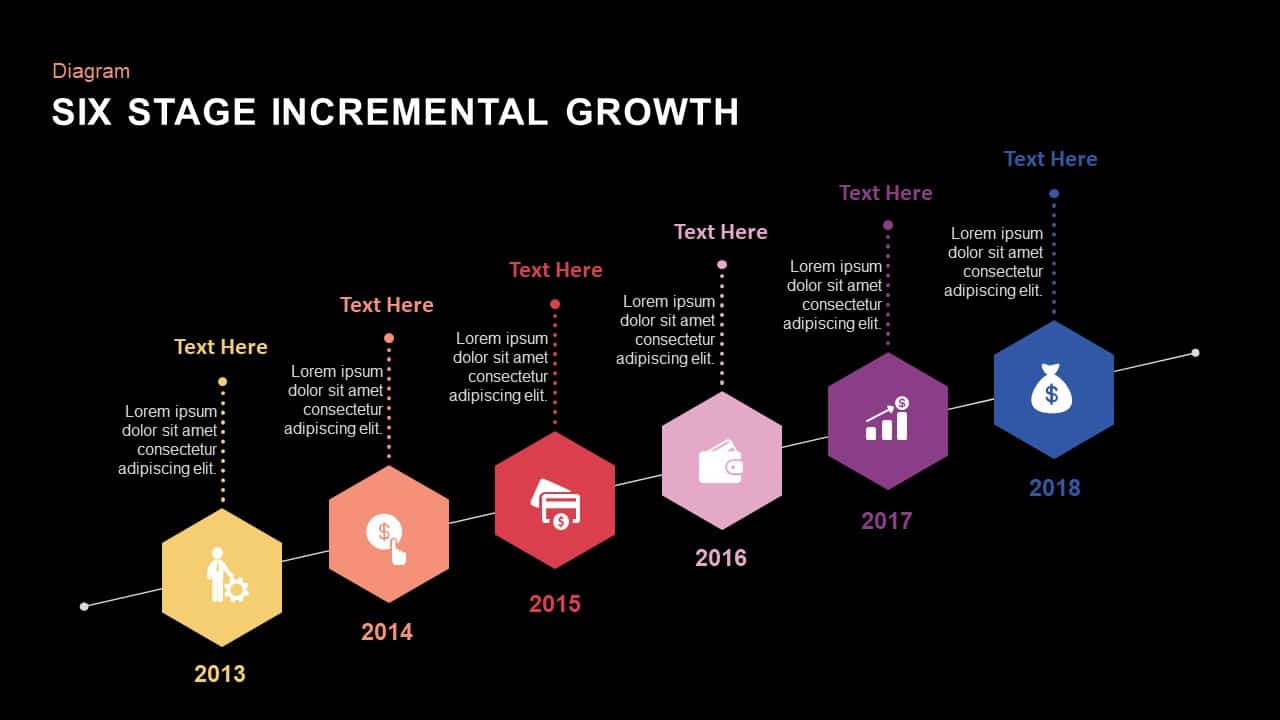
Six Stage Incremental Growth template for PowerPoint & Google Slides
Timeline
Premium
5-Stage Financial Growth Timeline Template for PowerPoint & Google Slides
Timeline
Premium
Three-Section Fishbone Process Diagram template for PowerPoint & Google Slides
Process
Premium
Three Circle Arrow Process Diagram template for PowerPoint & Google Slides
Circle
Premium
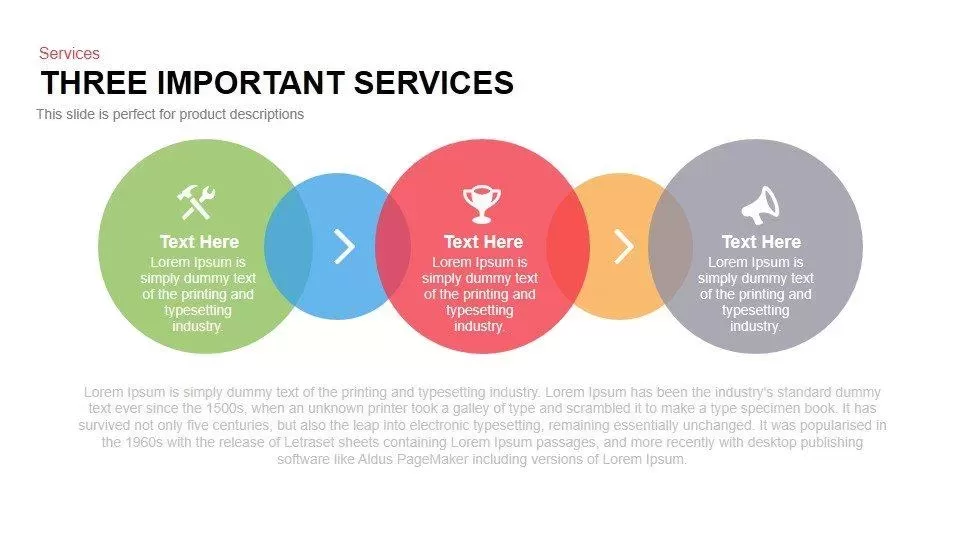
Three Important Services Flow Diagram Template for PowerPoint & Google Slides
Process
Premium
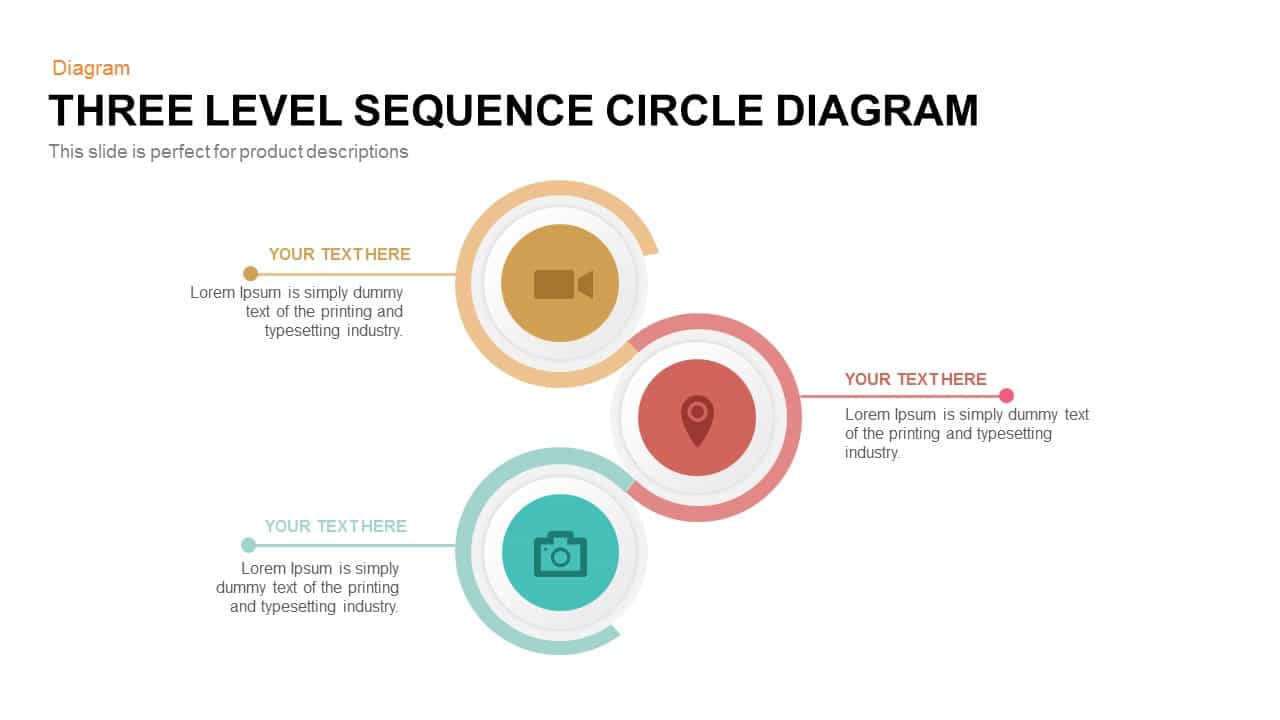
Three-Level Sequence Circle Diagram Template for PowerPoint & Google Slides
Circle
Premium
Three-Circle Diagram Infographic Template for PowerPoint & Google Slides
Circle
Premium
Three Section Triangle Diagram Template for PowerPoint & Google Slides
Process
Premium
Three Level Funnel Process Diagram Template for PowerPoint & Google Slides
Funnel
Premium
Three to Six Staged Circular Diagram Template for PowerPoint & Google Slides
Process
Premium
Three-Way Decision Process Arrow Diagram Template for PowerPoint & Google Slides
Arrow
Premium
Three-Branch Cluster Diagram Presentation Template for PowerPoint & Google Slides
Mind Maps
Premium
Three to Nine-Step Puzzle Ring Process Diagram Template for PowerPoint & Google Slides
Circle
Premium
Creative Three-Circle Venn Diagram Template for PowerPoint & Google Slides
Comparison
Premium
Circular Three-Step Infographic Diagram Template for PowerPoint & Google Slides
Circle
Premium
Three-Step Flowchart Process Diagram Template for PowerPoint & Google Slides
Flow Charts
Premium
Three-Section Triangle Diagram Template for PowerPoint & Google Slides
Pyramid
Premium
Three Section Triangle Diagram Template for PowerPoint & Google Slides
Process
Premium
Three-Step Triangular Gear Diagram Template for PowerPoint & Google Slides
Process
Premium
Three-Step Result Diagram Infographic Template for PowerPoint & Google Slides
Process
Premium
Three-Part Puzzle Piece Diagram Template for PowerPoint & Google Slides
Process
Premium
Three-Step Circular Arrows Diagram Template for PowerPoint & Google Slides
Process
Premium
Three-Step Curved Arrow Process Diagram Template for PowerPoint & Google Slides
Arrow
Premium
Three-Step Hub and Spoke Diagram Template for PowerPoint & Google Slides
Circle
Premium
Three-Step Gears Brain Diagram Template for PowerPoint & Google Slides
Process
Premium
Three-Phase Triangle Cycle Diagram Template for PowerPoint & Google Slides
Infographics
Premium
Modern Three-Point Process Diagram Template for PowerPoint & Google Slides
Process
Premium
Three-Part Parts Infographic Diagram Template for PowerPoint & Google Slides
Process
Premium
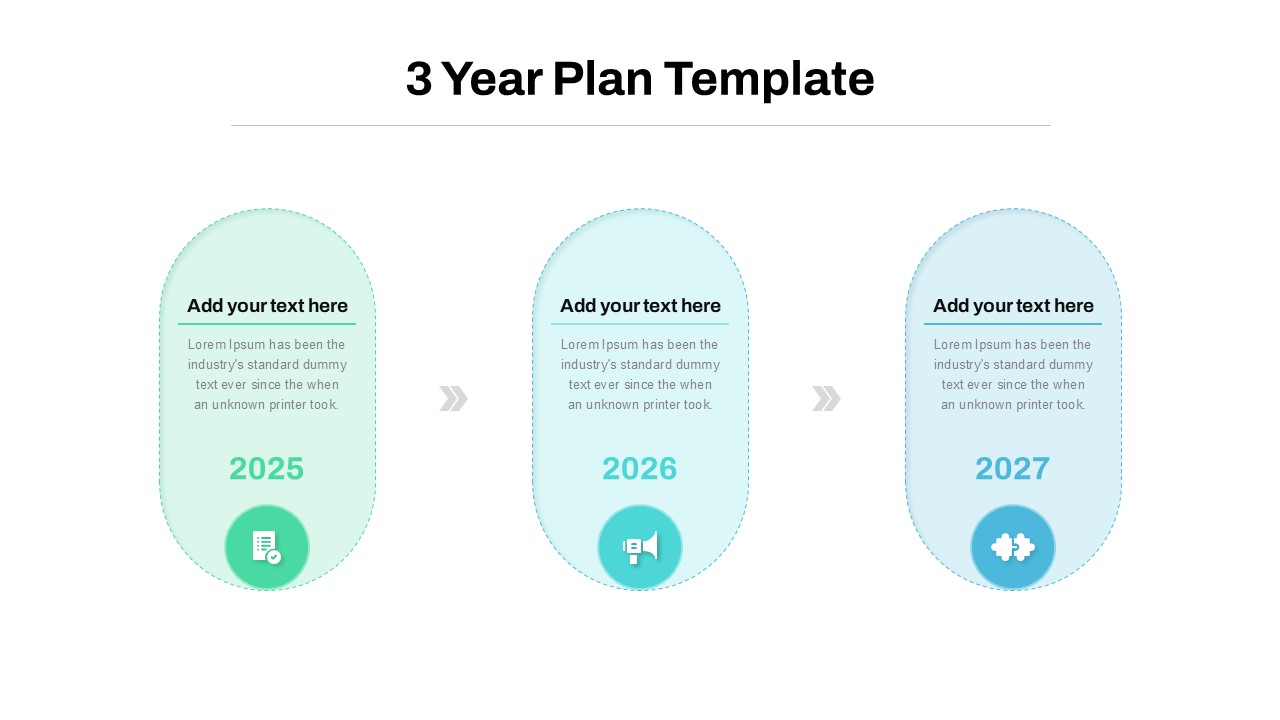
Three-Year Plan Timeline Diagram Template for PowerPoint & Google Slides
Timeline
Premium
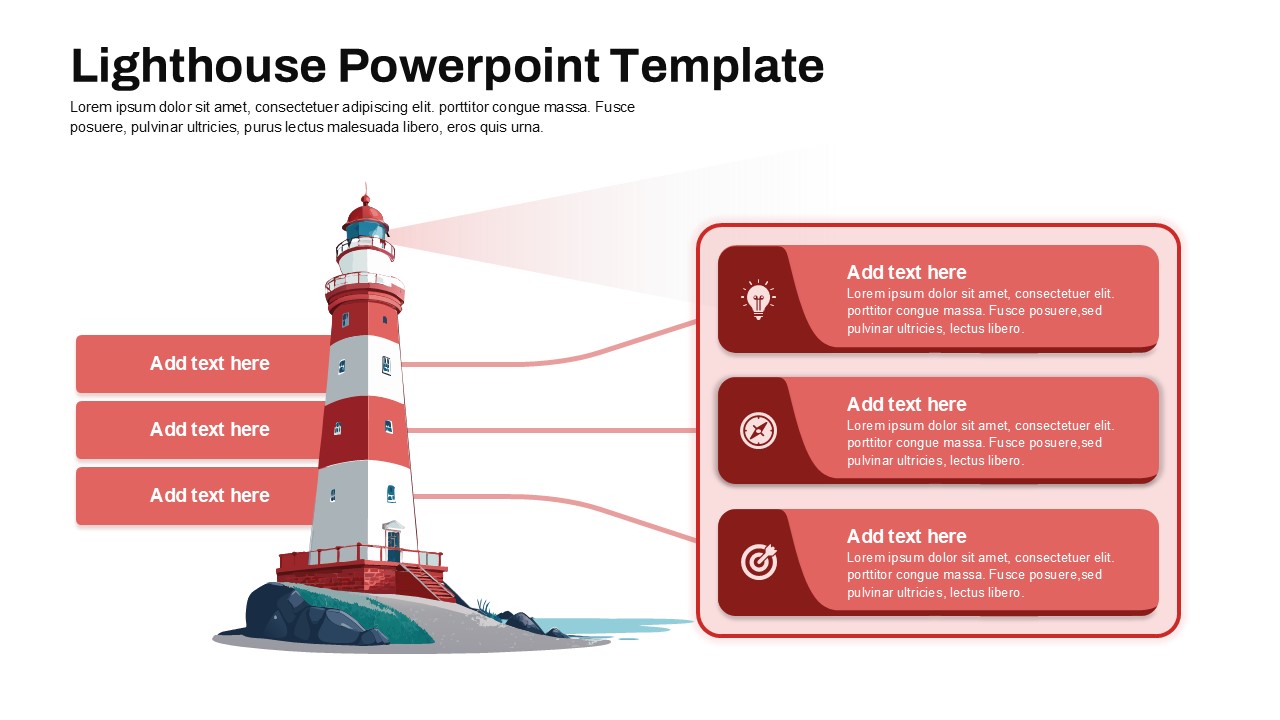
Lighthouse Three-Step Guidance Diagram Template for PowerPoint & Google Slides
Process
Premium
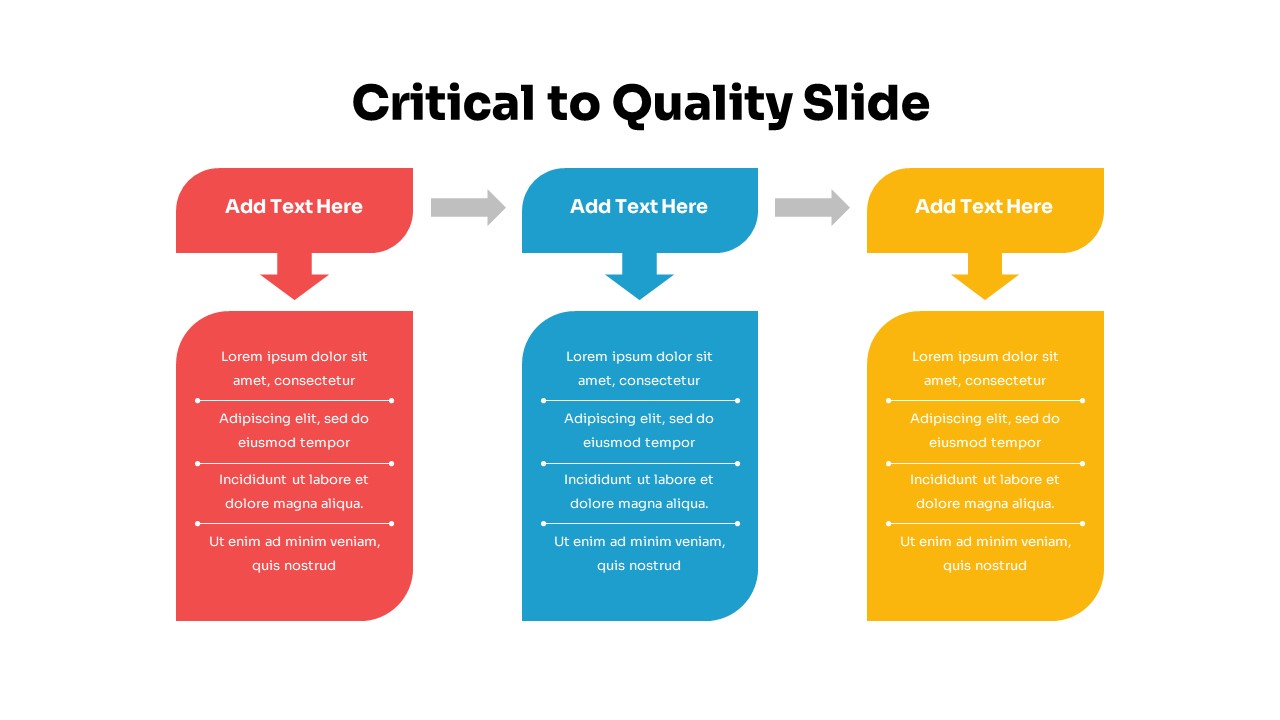
Three-Step Critical to Quality Slides Template for PowerPoint & Google Slides
Process
Premium
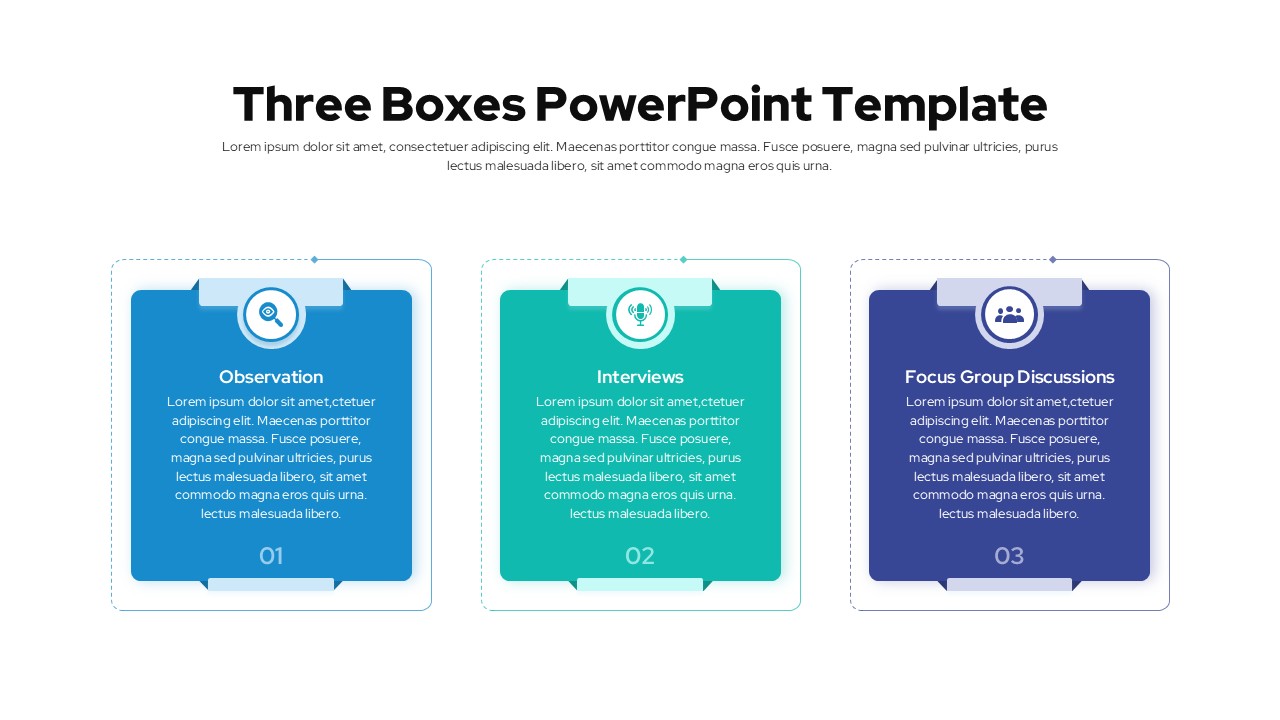
Three Boxes PowerPoint Template for PowerPoint & Google Slides
Business Report
Premium
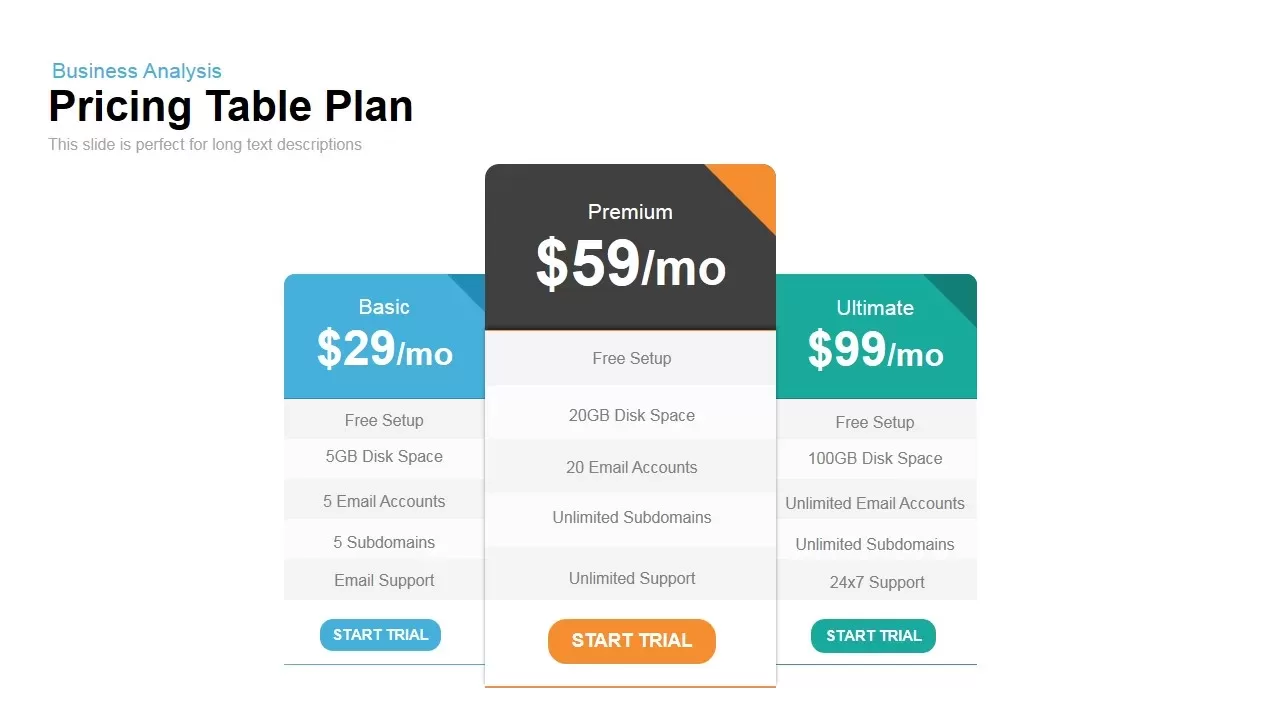
Three-Tier Pricing Table Slide Template for PowerPoint & Google Slides
Comparison
Premium
Three-Year Bar Chart template for PowerPoint & Google Slides
Charts
Premium
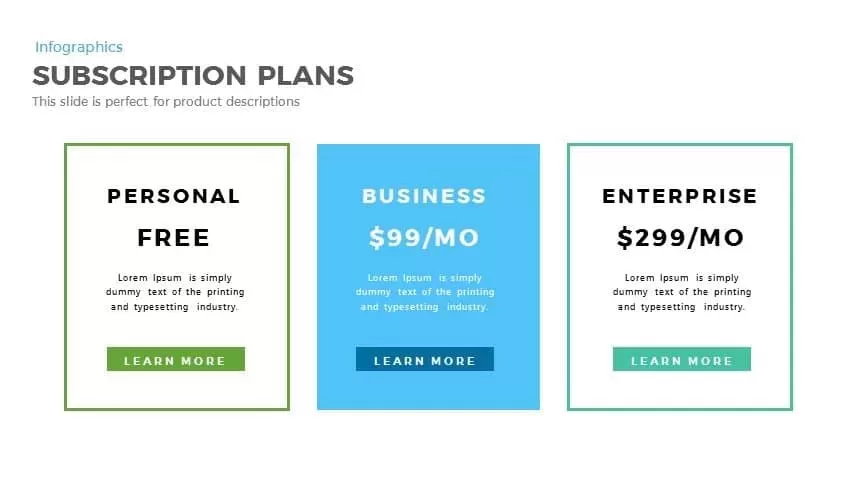
Three Subscription Pricing Plans Template for PowerPoint & Google Slides
Comparison
Premium
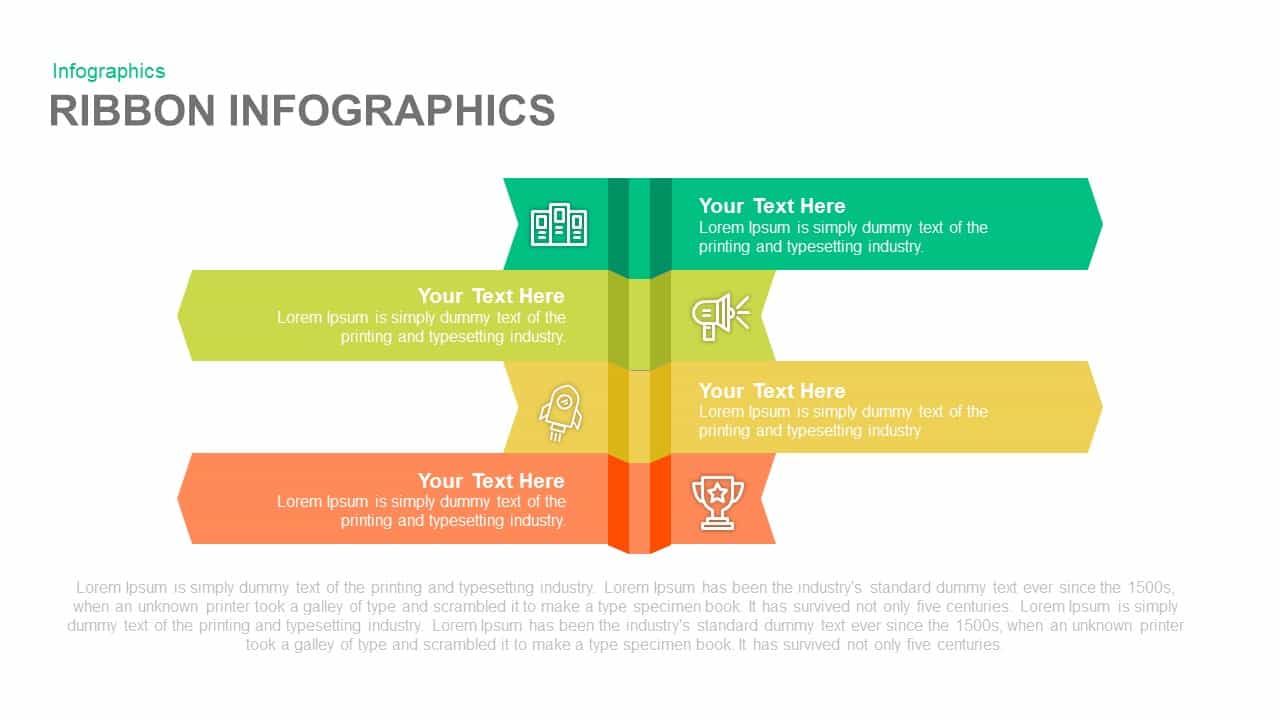
Dual-Side Three-Step Ribbon Infographic Template for PowerPoint & Google Slides
Comparison
Premium

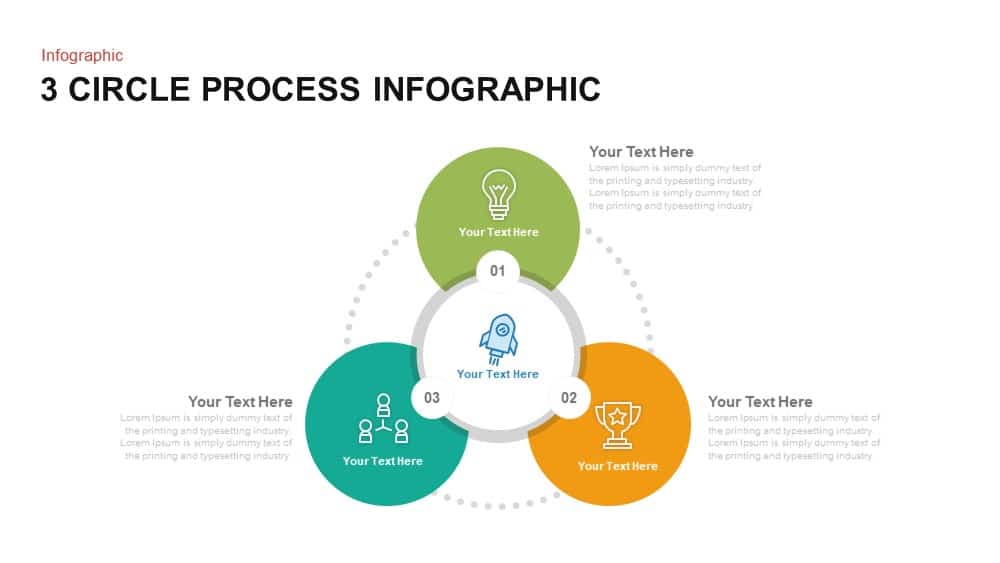
Three-Circle Process Infographic Template for PowerPoint & Google Slides
Circle
Premium
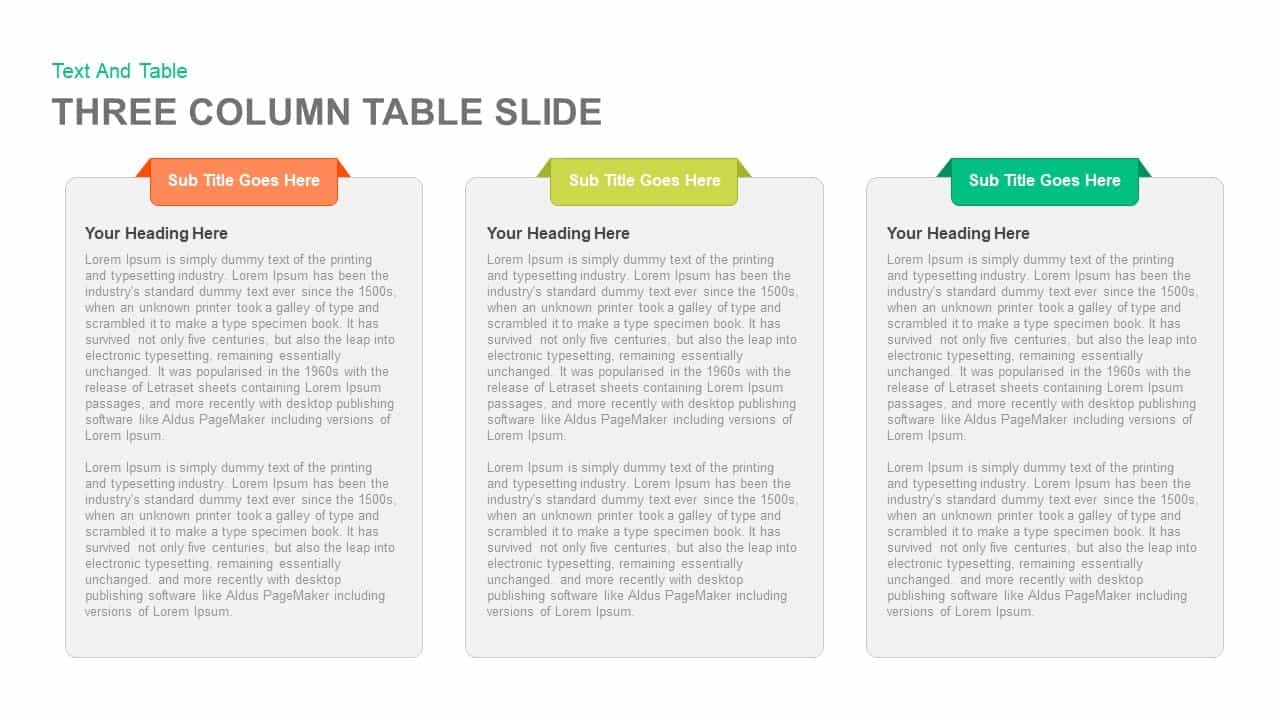
Clean Three-Four Column Table Slide Template for PowerPoint & Google Slides
Business Report
Premium
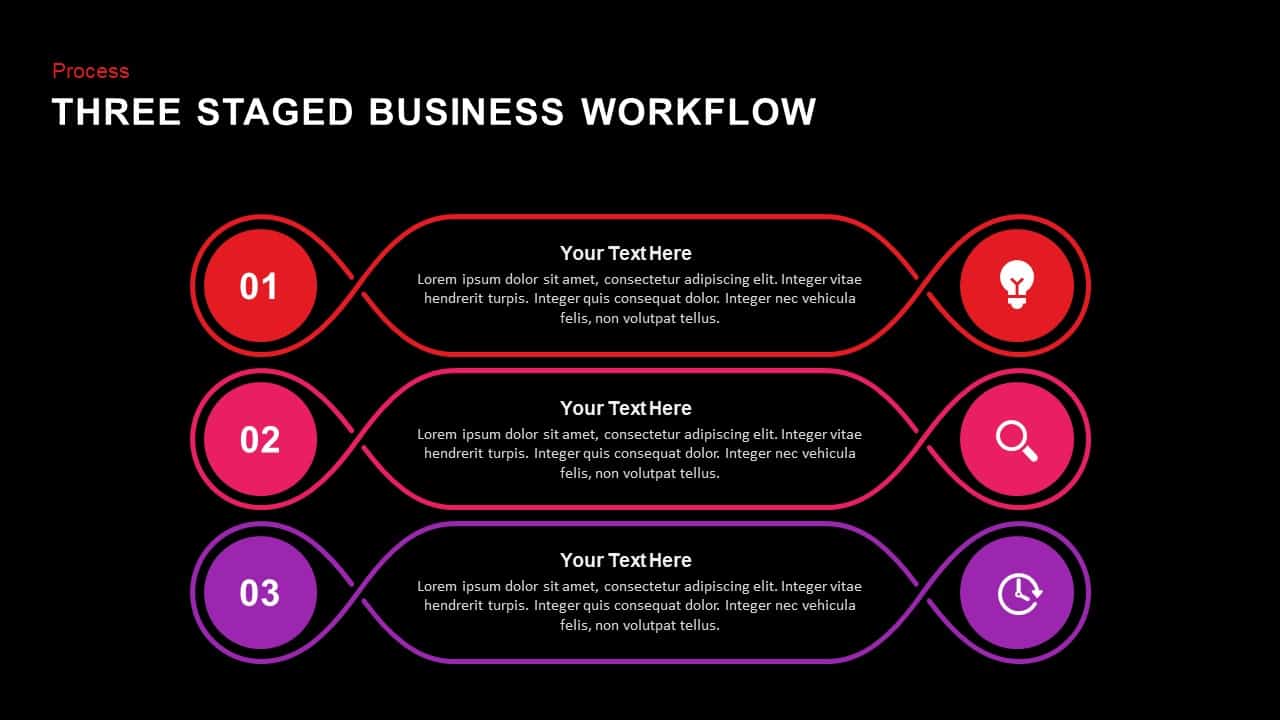
Three Staged Business Workflow template for PowerPoint & Google Slides
Business
Premium
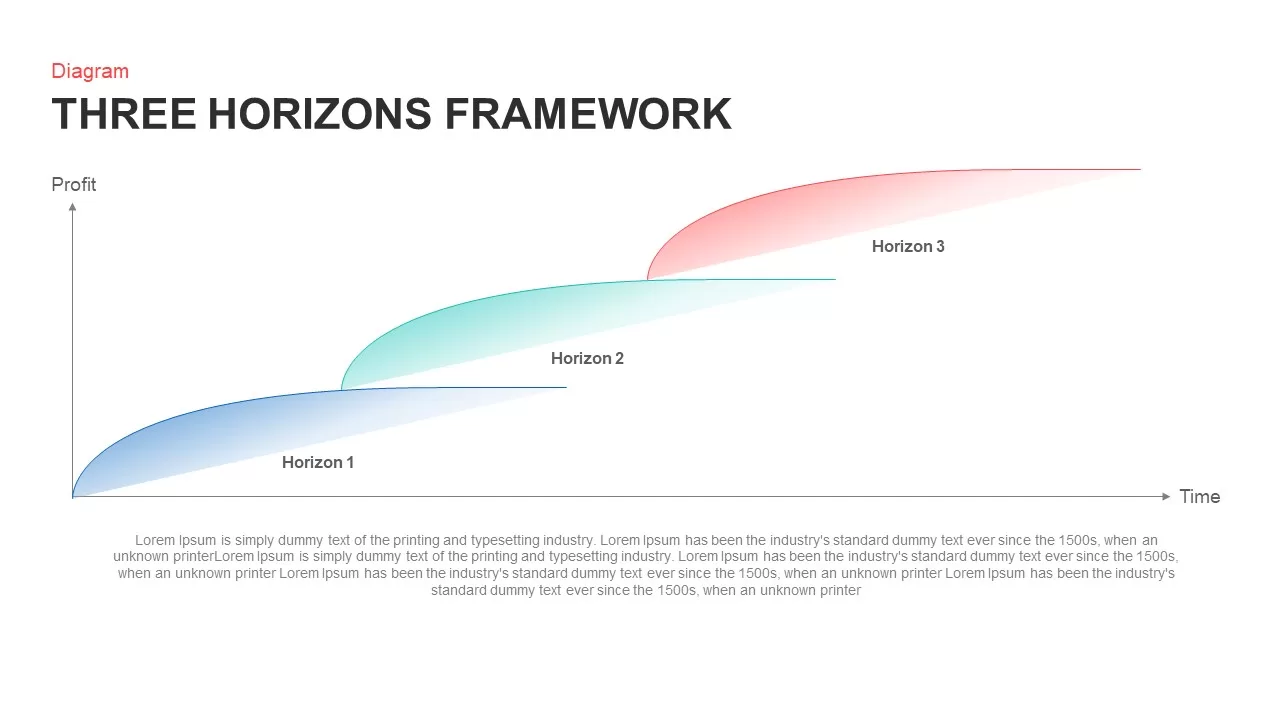
Strategic Three Horizons Framework Template for PowerPoint & Google Slides
Business Strategy
Premium
Three and Four-Column Card Layout Template for PowerPoint & Google Slides
Infographics
Premium
Three-Year Strategic Plan Matrix Template for PowerPoint & Google Slides
Timeline
Premium
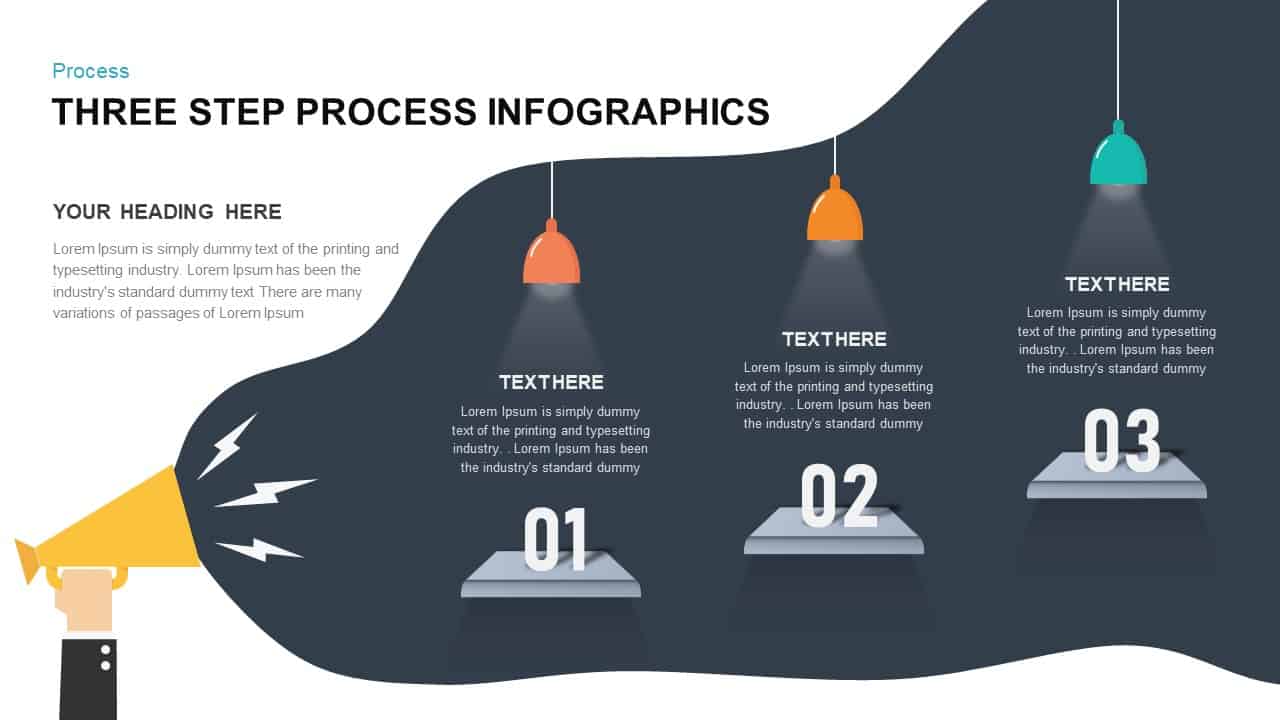
Three-Step Process Infographics Template for PowerPoint & Google Slides
Process
Premium
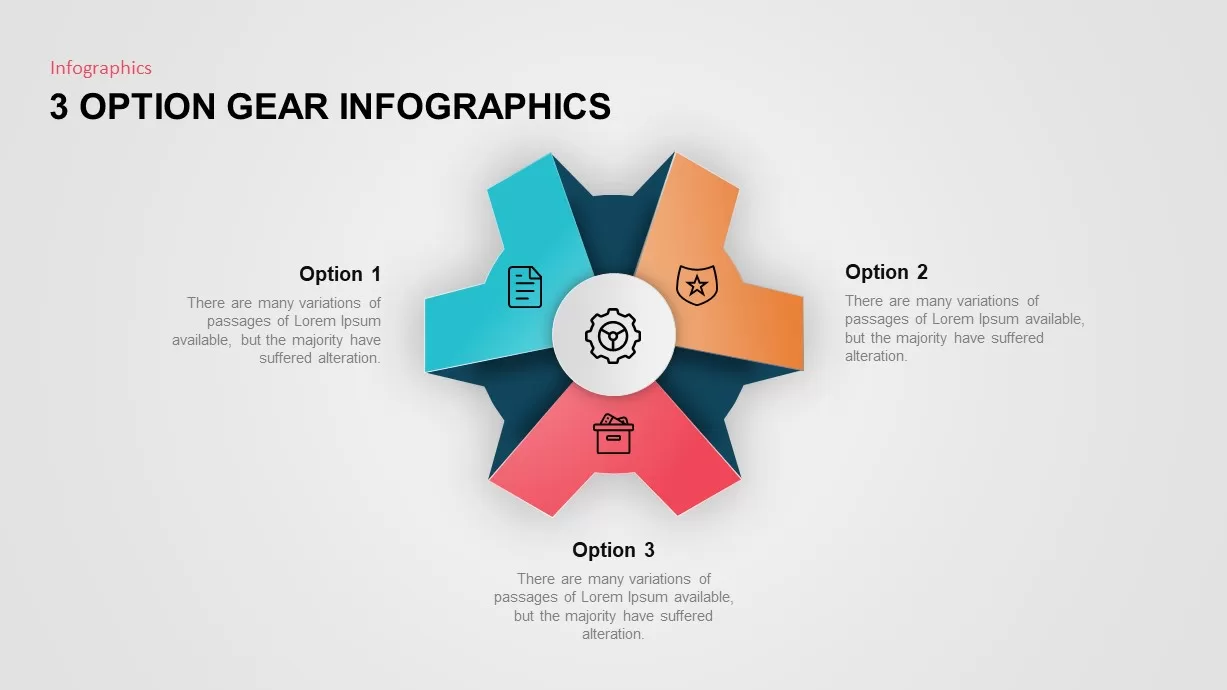
Three-Option Gear Infographic Pro Template for PowerPoint & Google Slides
Process
Premium
Three-Phase Planning Gear Infographic Template for PowerPoint & Google Slides
Process
Premium
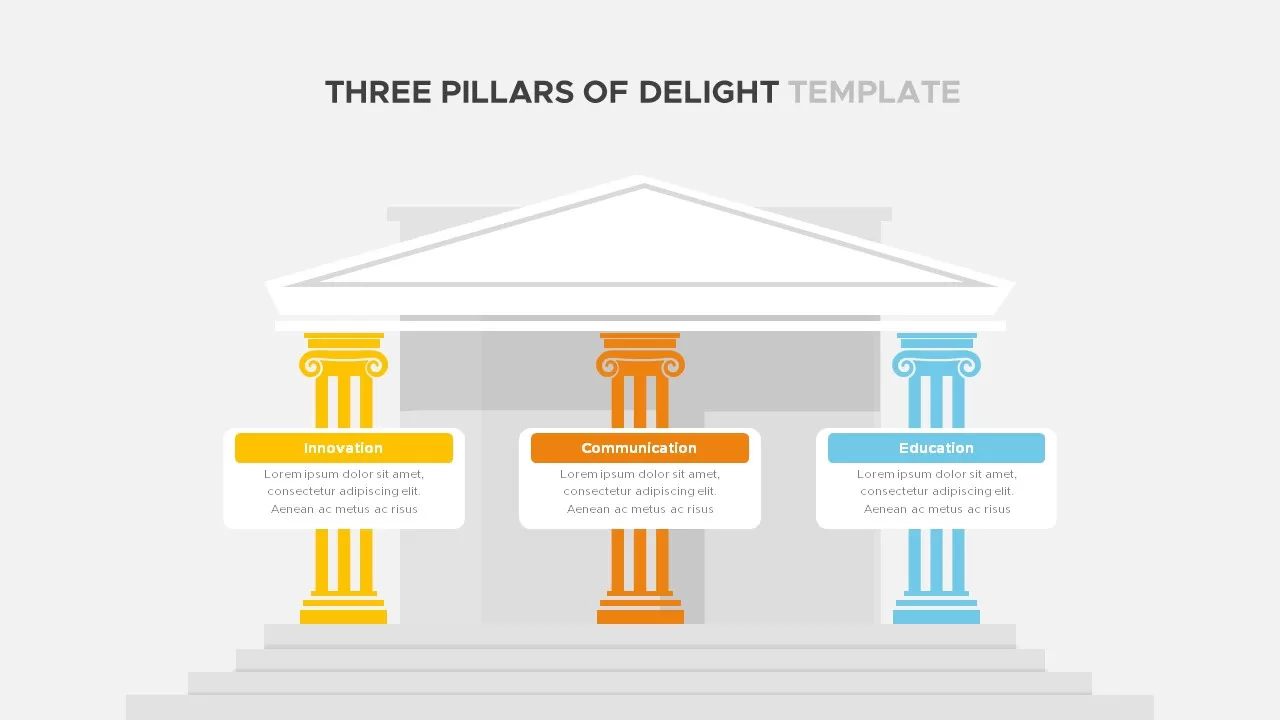
Three Pillars of Delight Template for PowerPoint & Google Slides
Business
Premium
Three-Year Plan Infographic Pack Template for PowerPoint & Google Slides
Timeline
Premium
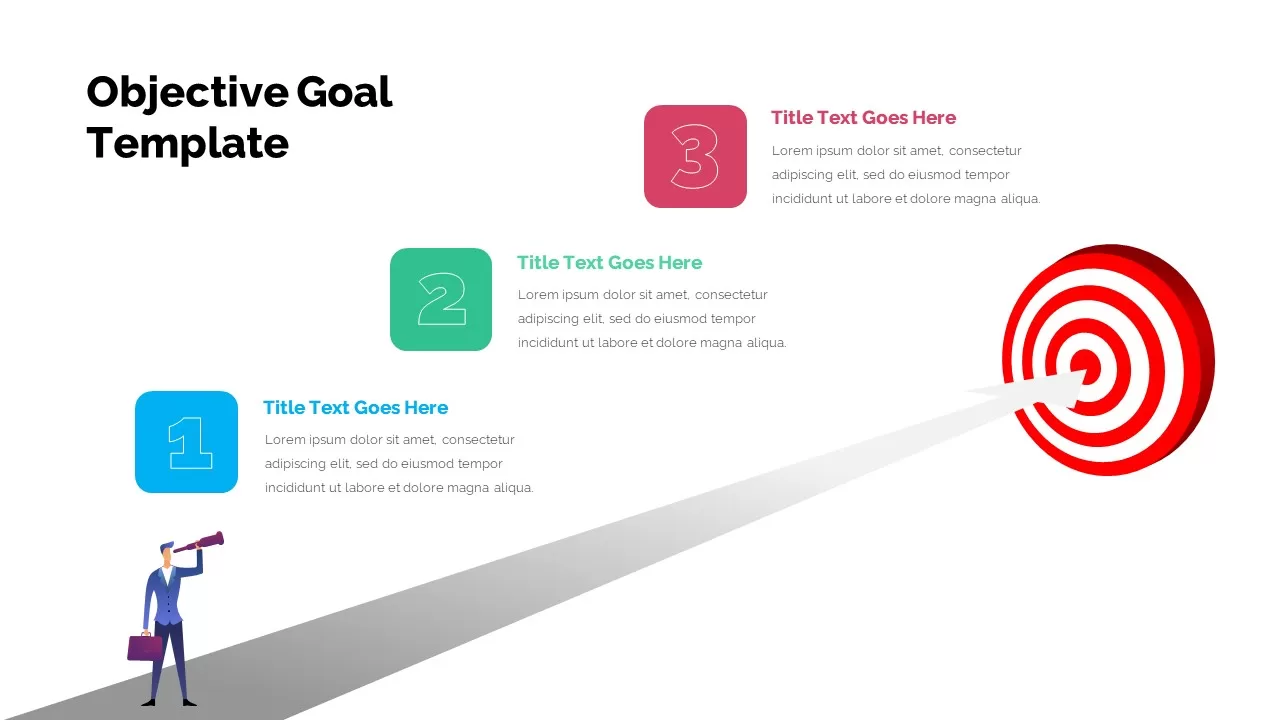
Three-Step Objective Goal Process Template for PowerPoint & Google Slides
Goals
Premium
Three-Segment Circular Arrow Cycle Template for PowerPoint & Google Slides
Circle
Premium
Three-Step Wavy Arrow Flow Template for PowerPoint & Google Slides
Process
Premium
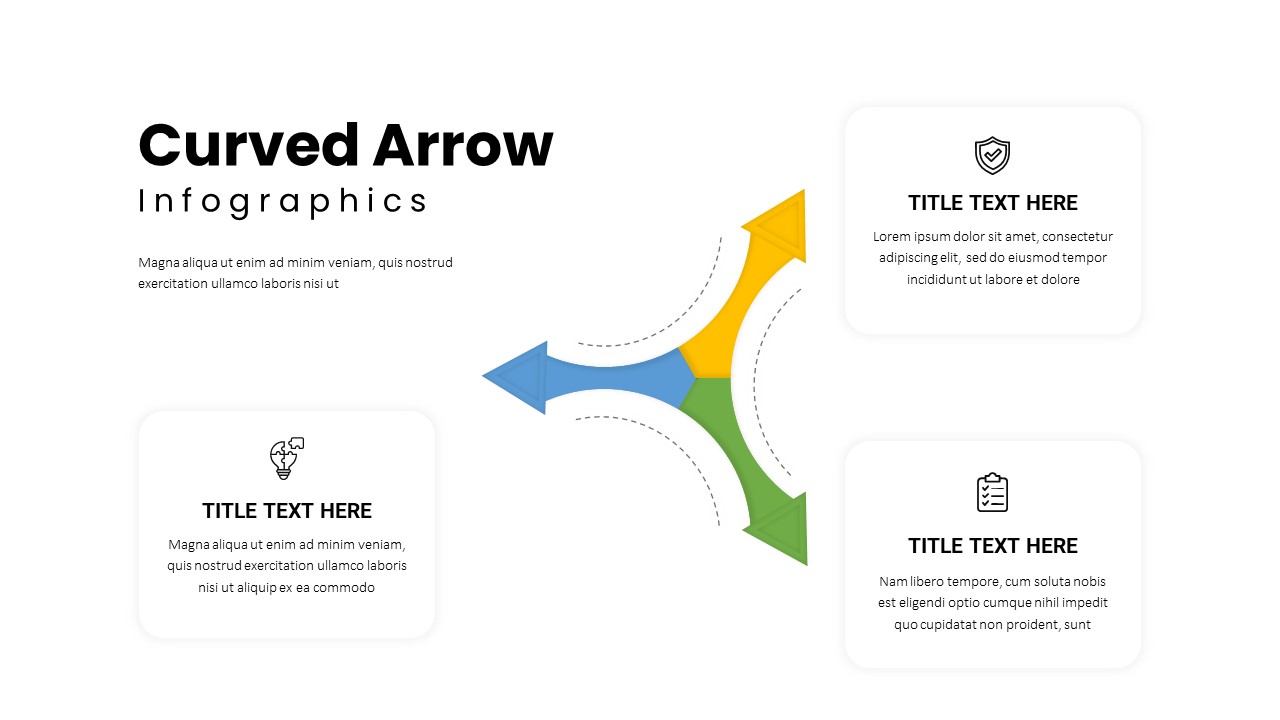
Three-Path Curved Arrow Infographic Template for PowerPoint & Google Slides
Arrow
Premium
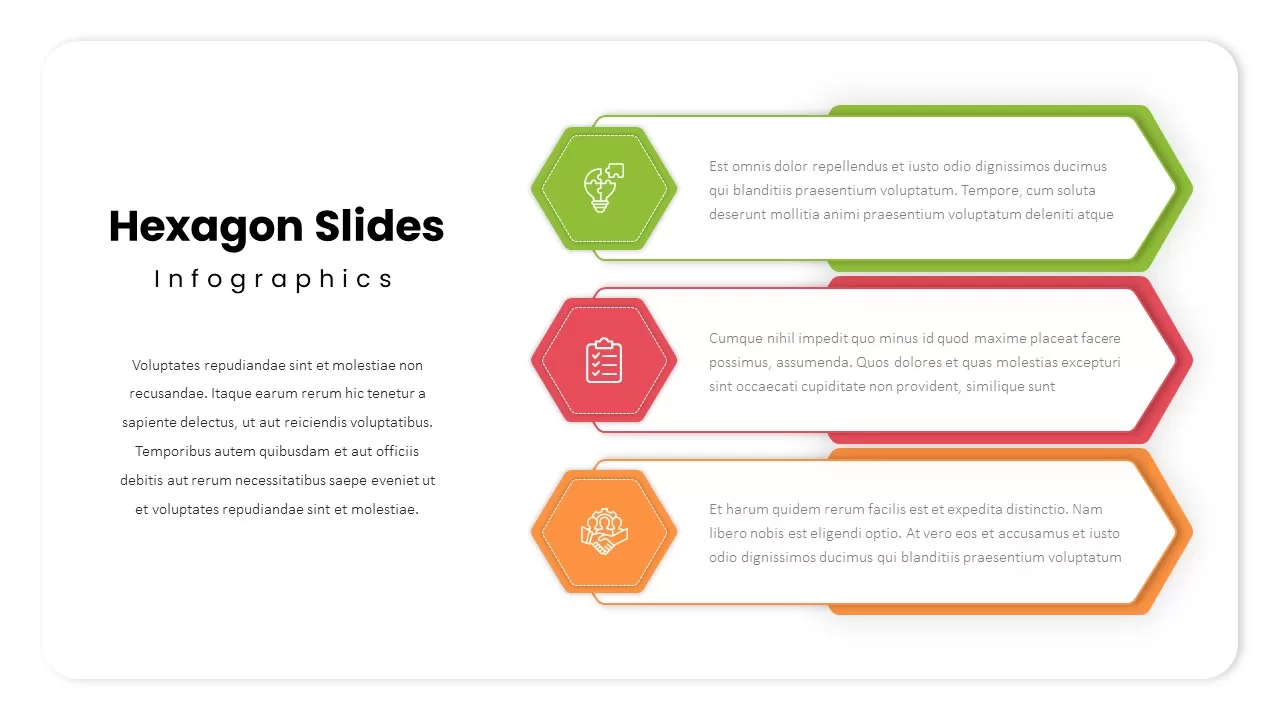
Three-Step Hexagon Infographic Process Template for PowerPoint & Google Slides
Process
Premium
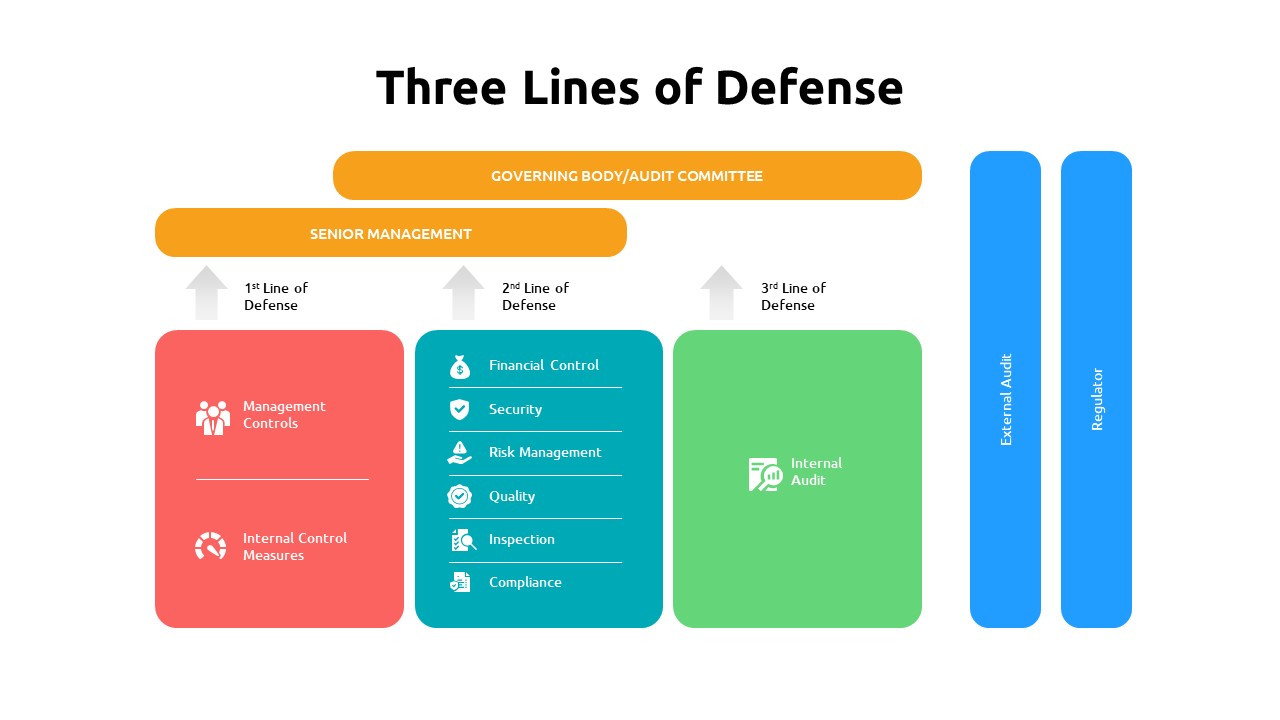
Three lines of defense template for PowerPoint & Google Slides
Risk Management
Premium
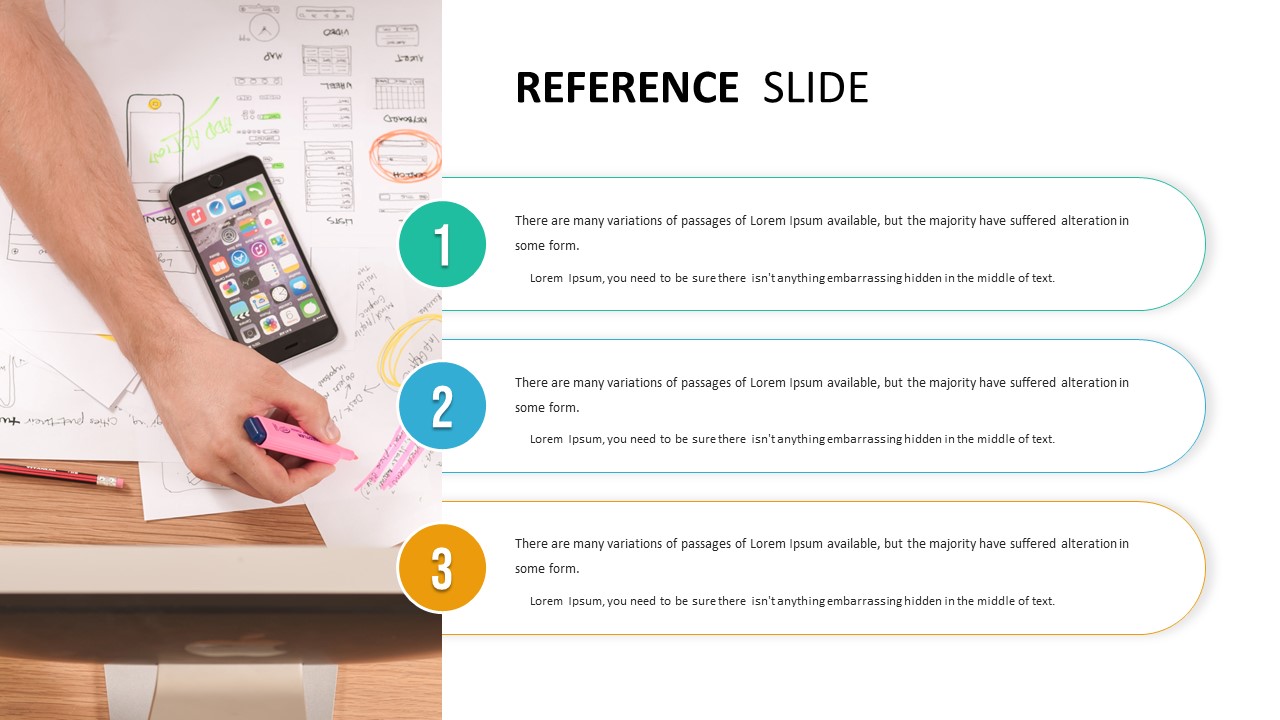
Three-Step Reference Slide Layout Template for PowerPoint & Google Slides
Infographics
Premium
Clean Three-Step Reference Slide Template for PowerPoint & Google Slides
Agenda
Premium
Three-Part Shield Infographics Template for PowerPoint & Google Slides
Comparison
Premium
Five-Phase and Three-Phase Phases Chart Template for PowerPoint & Google Slides
Charts
Premium
Three-Year Vertical Milestone Timeline Template for PowerPoint & Google Slides
Timeline
Premium
Three-Year Project Roadmap Timeline Template for PowerPoint & Google Slides
Timeline
Premium
Dynamic Three-Series Stacked Area Chart Template for PowerPoint & Google Slides
Comparison Chart
Premium
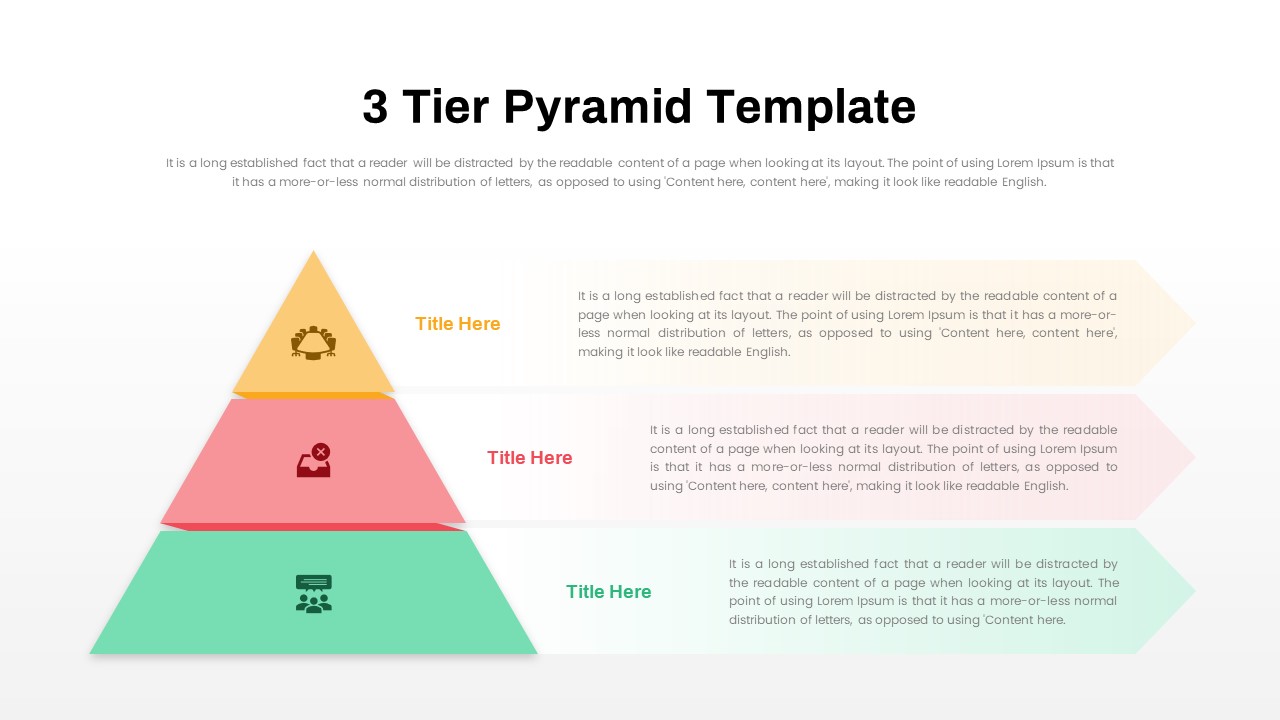
Three-Tier Pyramid Infographic Template for PowerPoint & Google Slides
Pyramid
Premium
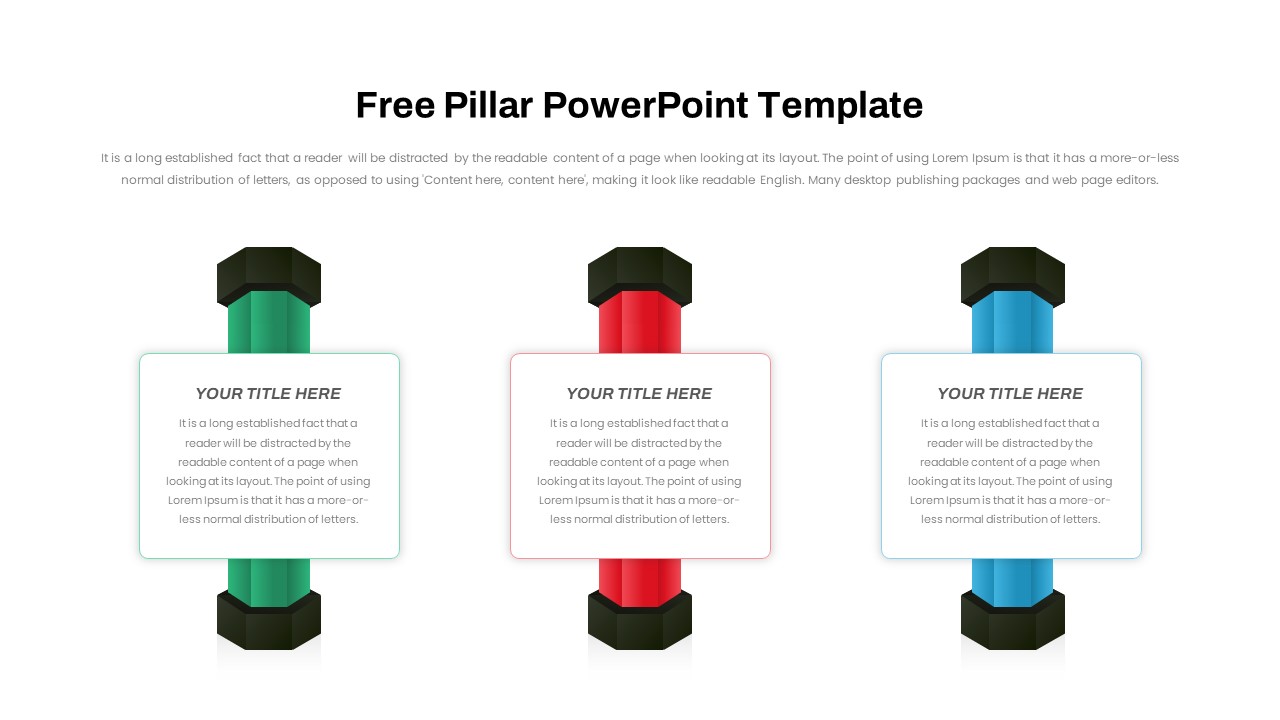
Free Three and Four Pillar Infographic Pack Template for PowerPoint & Google Slides
Process
Free
Open Door Policy Three-Step Process Template for PowerPoint & Google Slides
Process
Premium
Colorful Three-Presenter Profile Cards Template for PowerPoint & Google Slides
Our Team
Premium
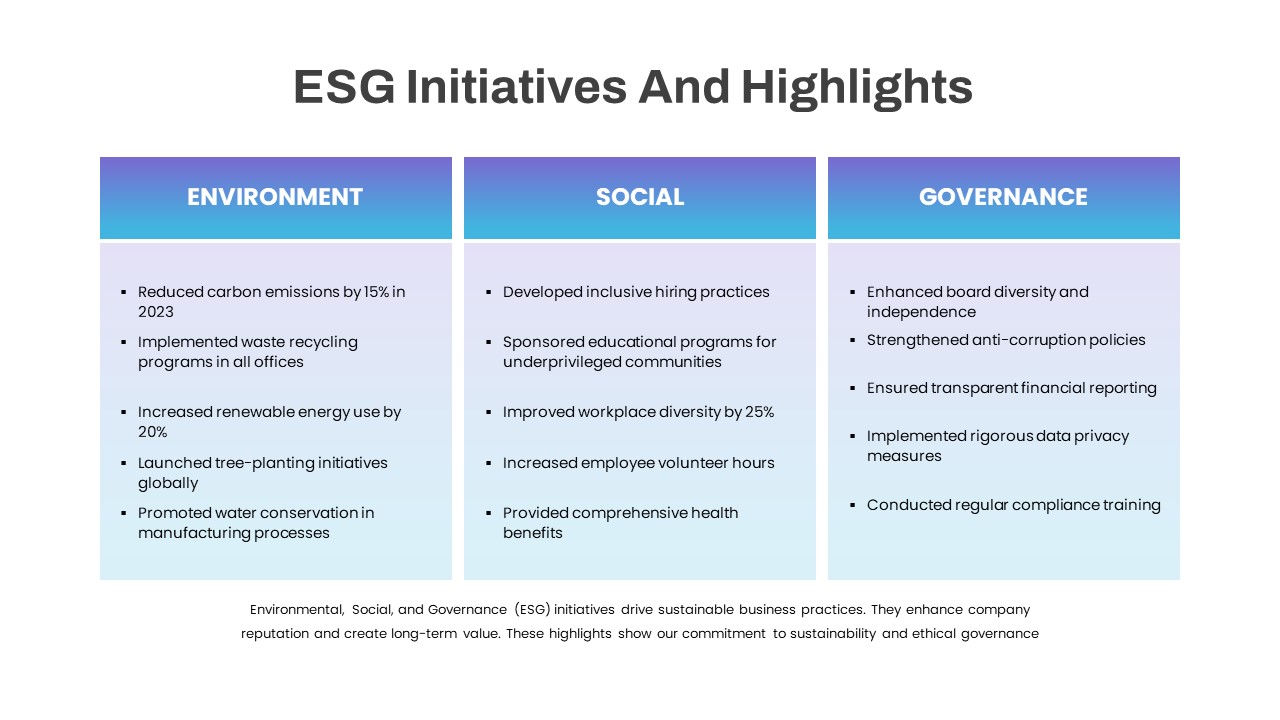
ESG Initiatives Three-Column Template for PowerPoint & Google Slides
Comparison
Premium
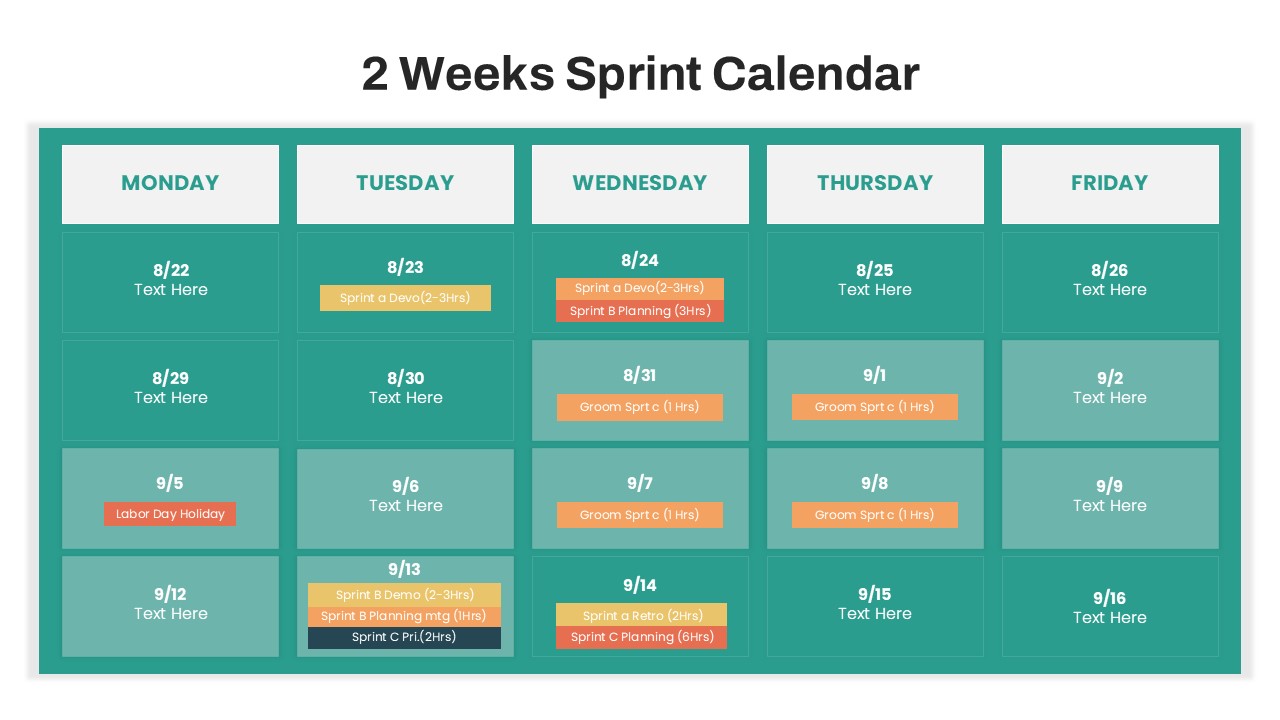
Two- and Three-Week Sprint Calendar Template for PowerPoint & Google Slides
Scrum
Premium
Three-Category Comparison Template for PowerPoint & Google Slides
Comparison
Premium
Three-Step Strategic Differentiator Template for PowerPoint & Google Slides
Competitor Analysis
Premium
Three Options Infographic Pack Template for PowerPoint & Google Slides
Process
Premium
Three-Step Servant Leadership Framework Template for PowerPoint & Google Slides
Leadership
Premium
QR Code Scan Me Three-Step Slide Template for PowerPoint & Google Slides
Infographics
Premium
Free Three-Option Comparison Slide for PowerPoint & Google Slides
Comparison
Free
Greiner Growth Model Six-Phase Diagram Template for PowerPoint & Google Slides
Business Models
Premium
Modern Growth Hacking Venn Diagram Template for PowerPoint & Google Slides
Circle
Premium
Flywheel Growth Cycle Diagram Template for PowerPoint & Google Slides
Circle
Premium