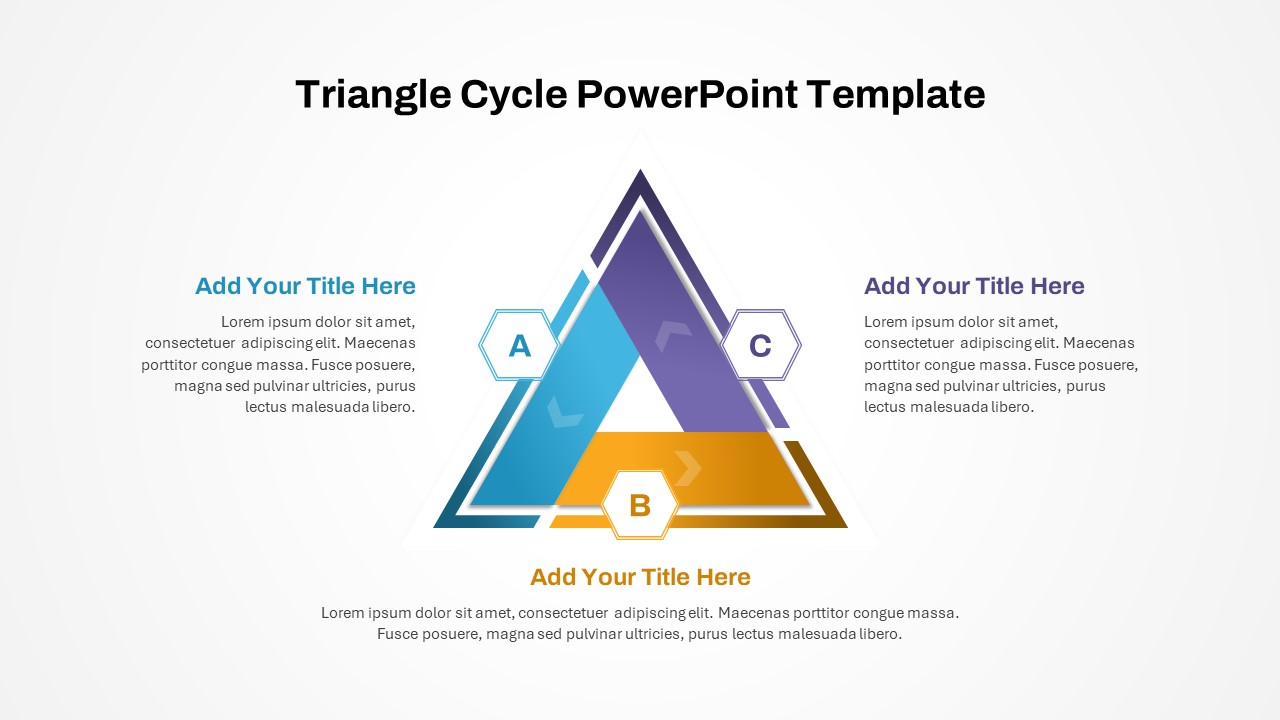
Three-Phase Triangle Cycle Diagram Template for PowerPoint & Google Slides


Description
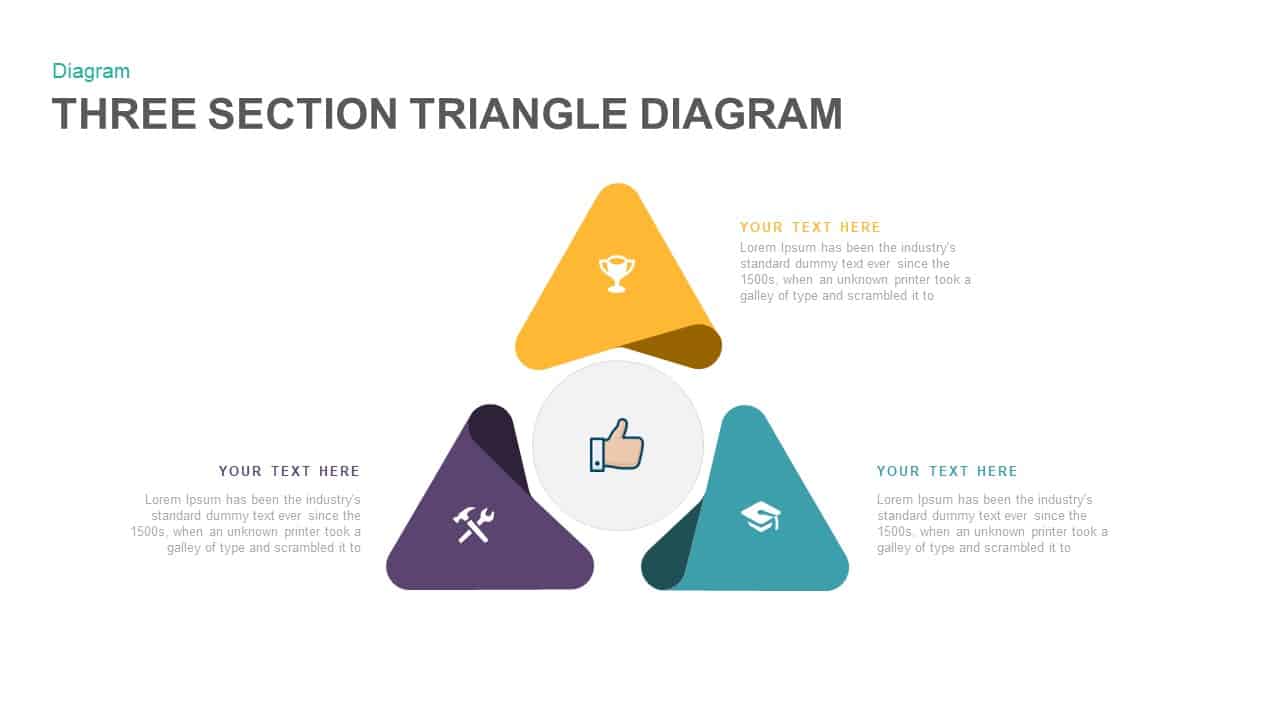
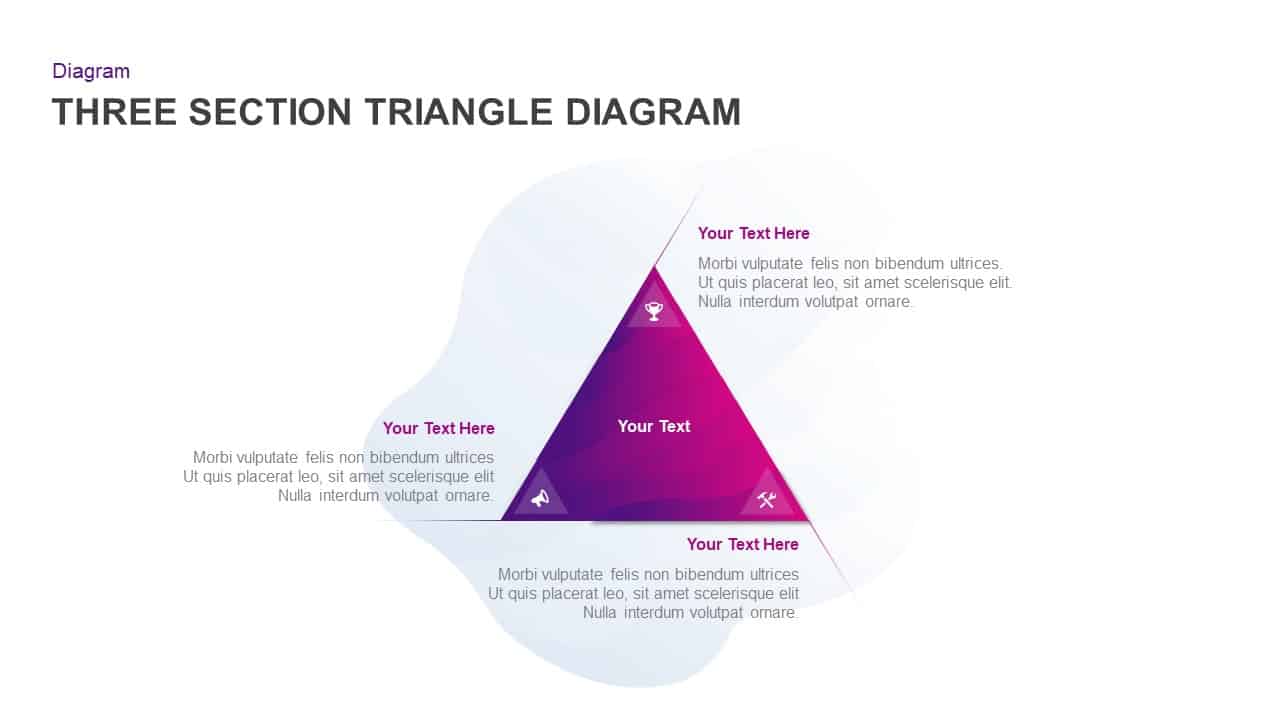
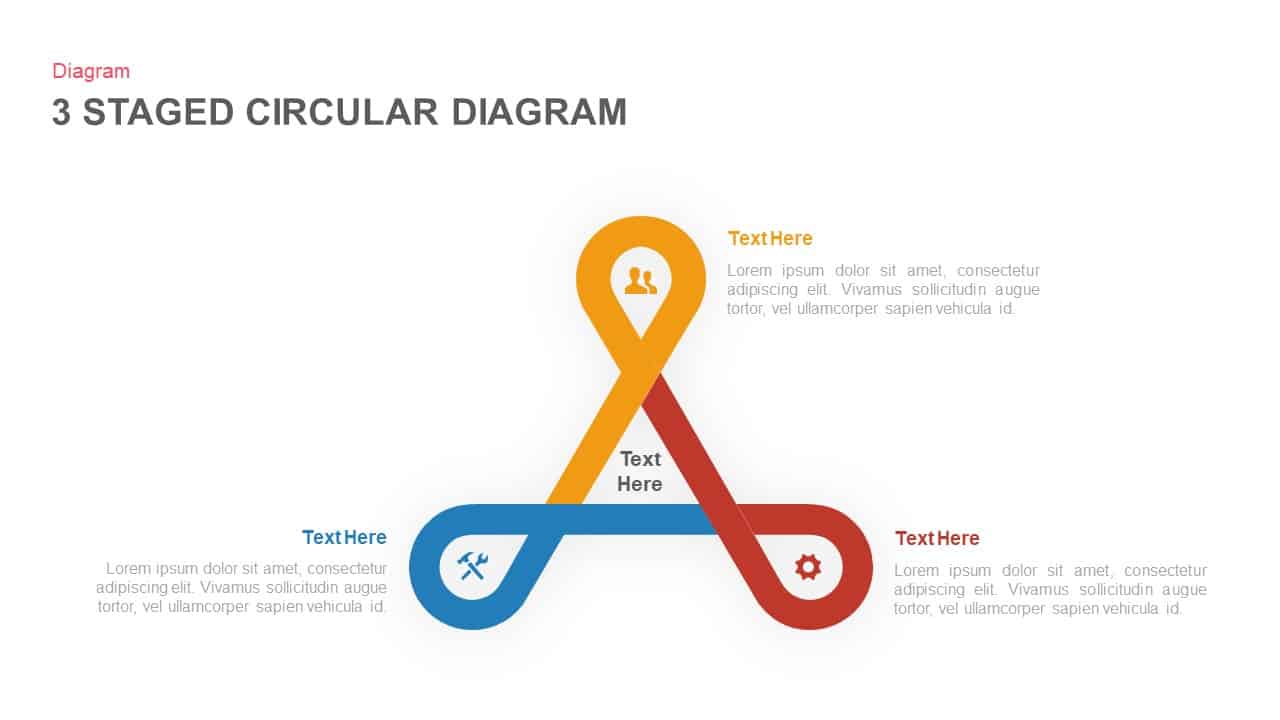
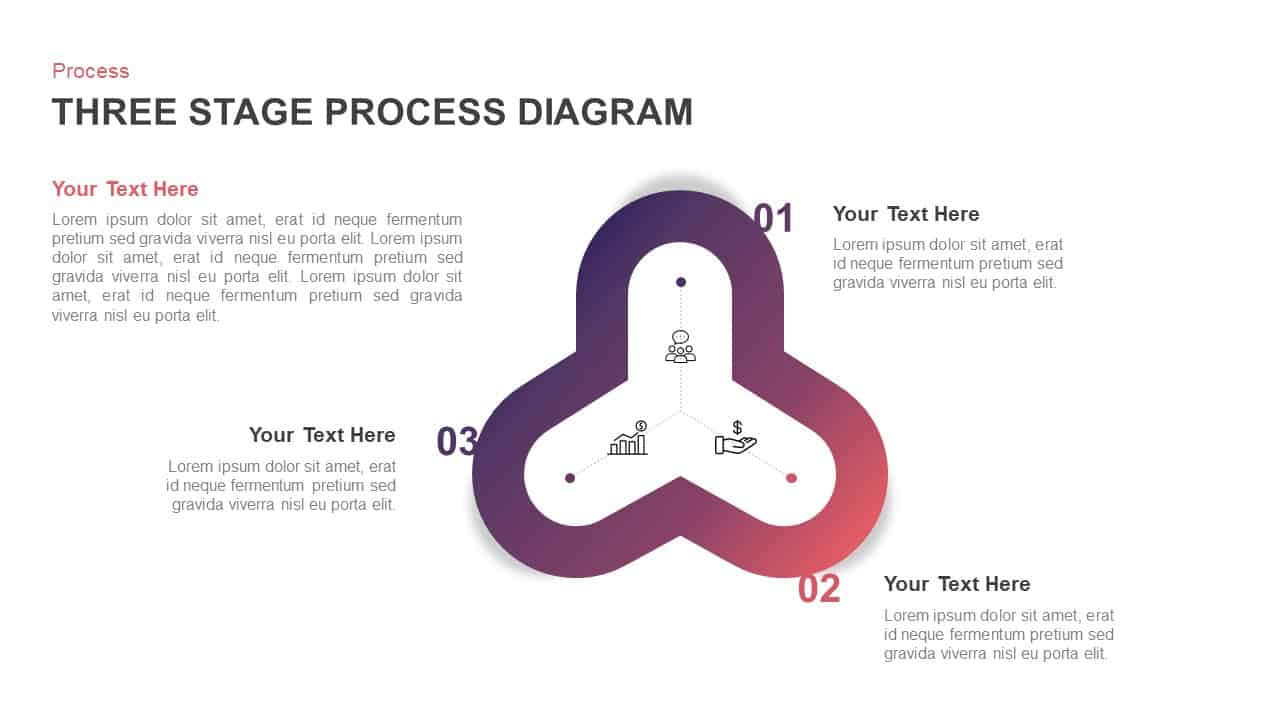
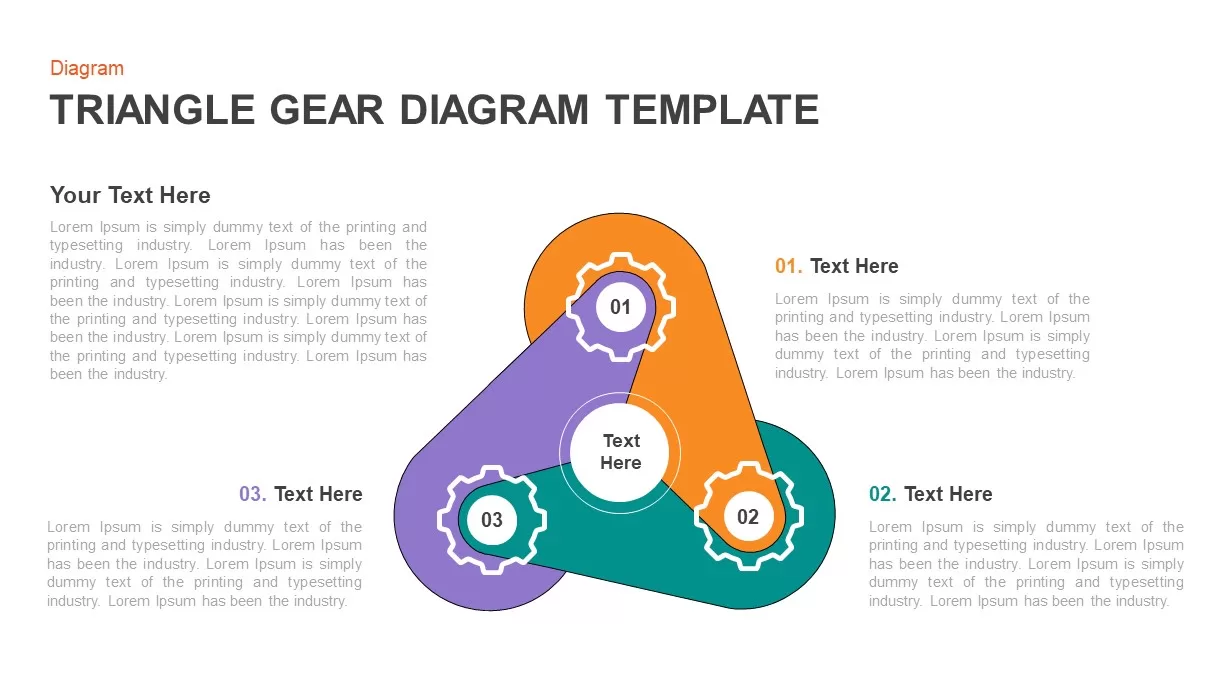
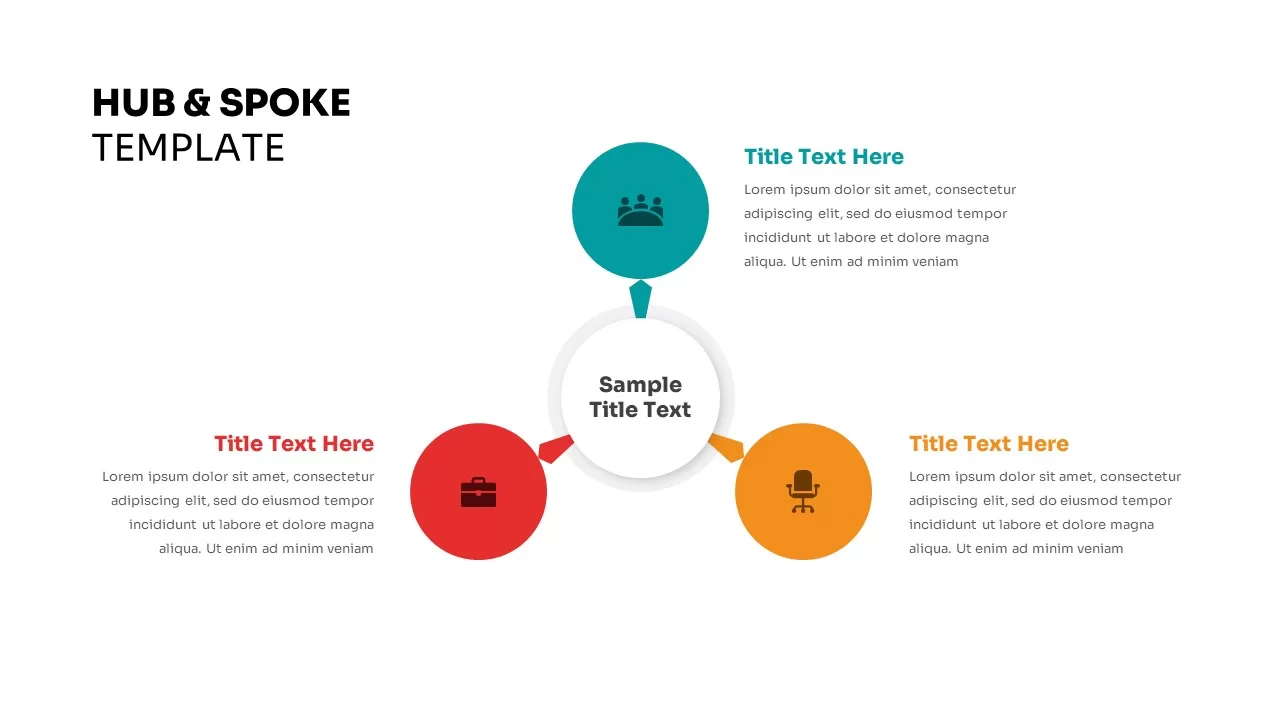
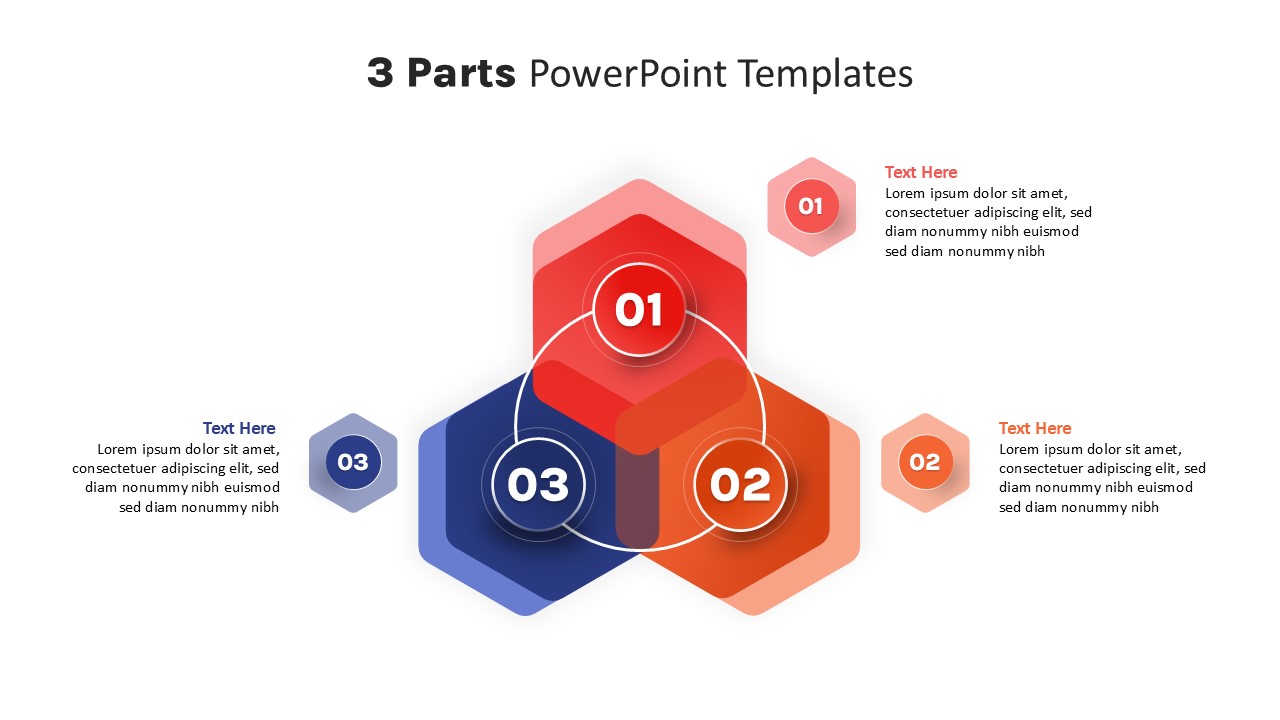
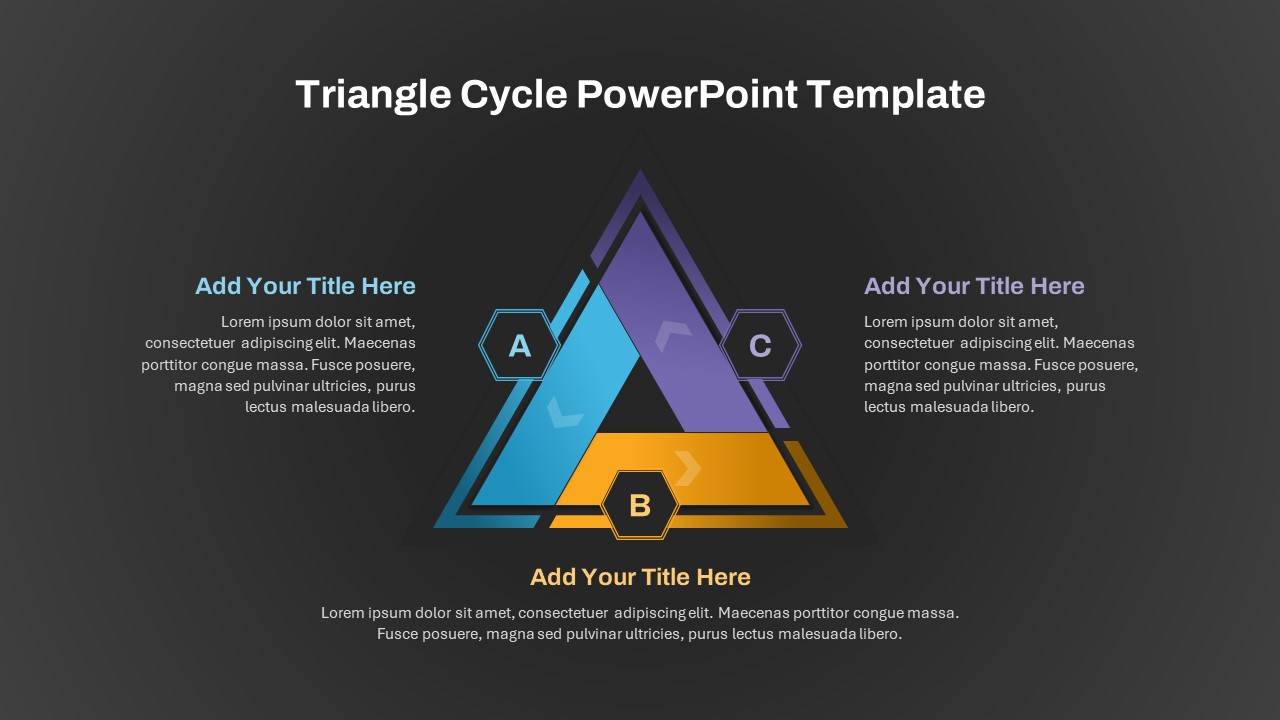
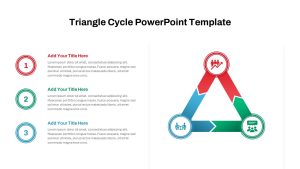
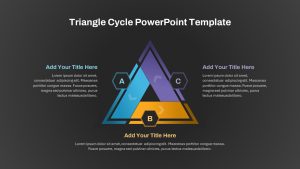
Communicate cyclical processes with clarity using this three-segment triangle cycle diagram slide. Centered on a light gradient background, an isometric triangular loop features three interconnected arrow segments in vivid accent hues—blue, purple, and gold—guiding readers through each phase. Each segment is paired with a numbered hexagon marker (A, B, C) and adjacent text placeholders, enabling you to describe each stage with concise headings and detailed bullet points. The clean layout employs vector shapes, master slide integration, and editable icons, so you can adjust segment colors, swap icons, or modify text effortlessly without sacrificing crispness at any resolution.
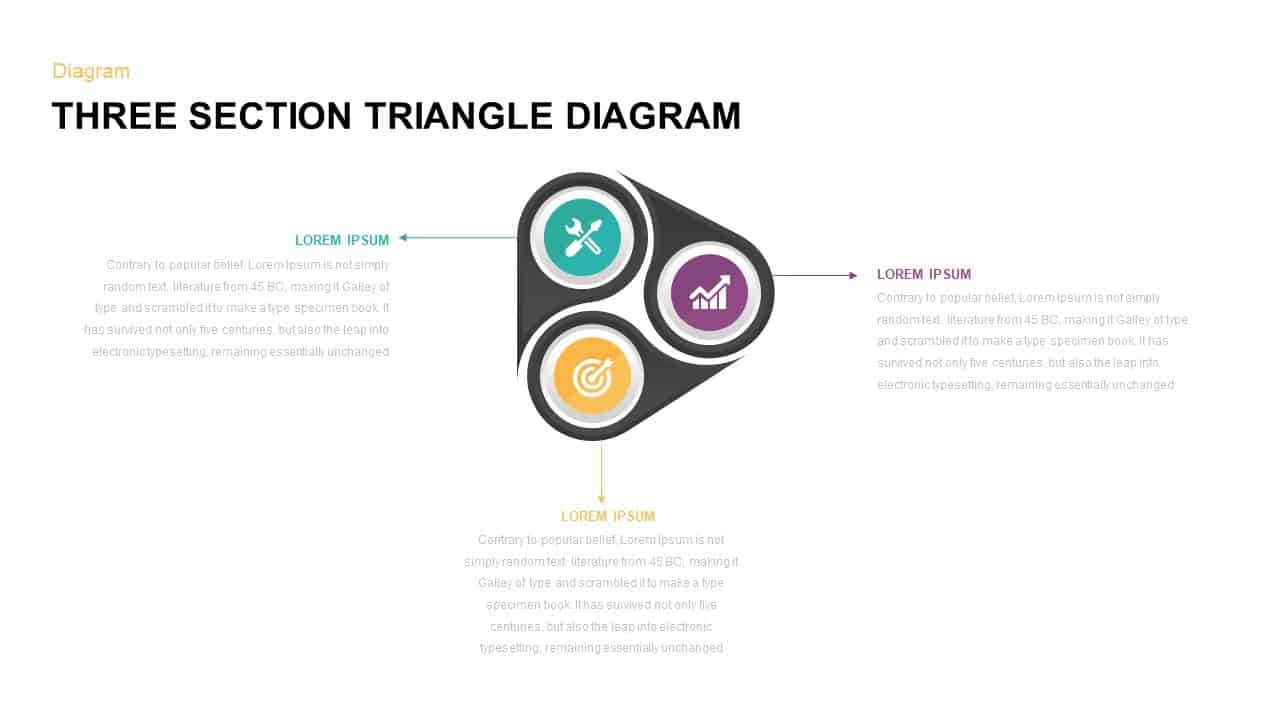
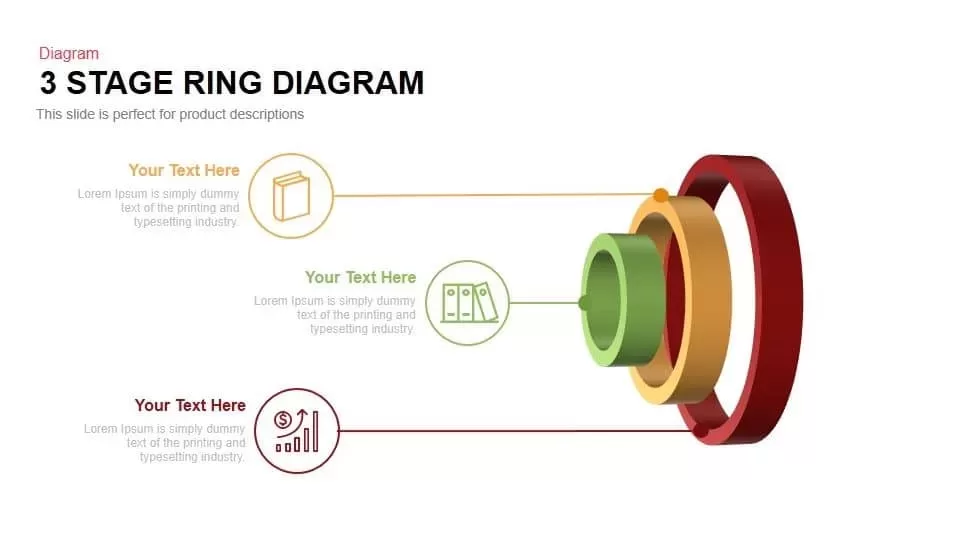
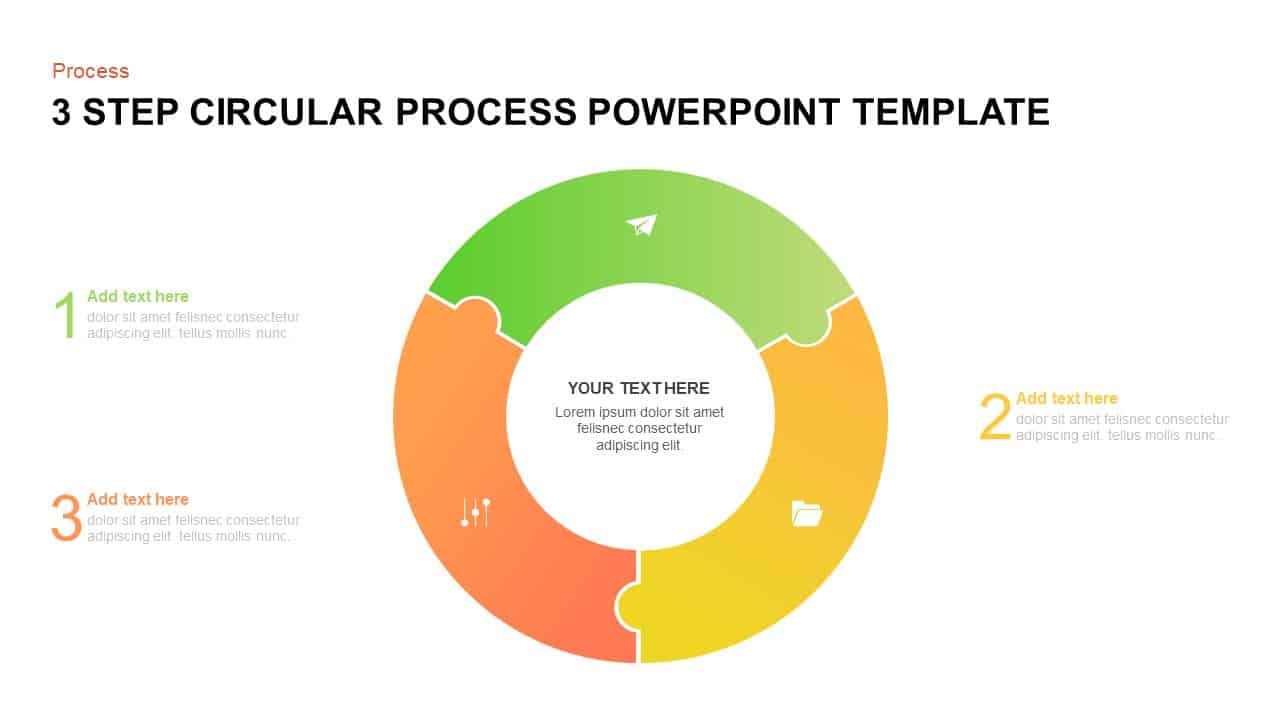
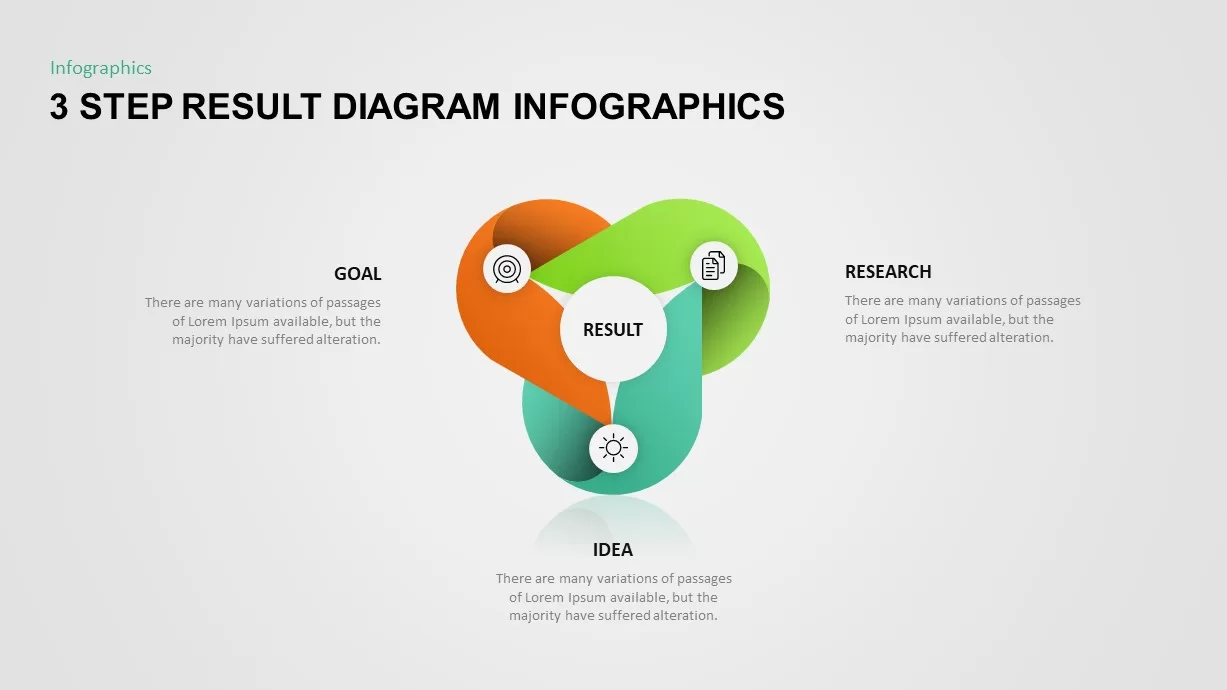
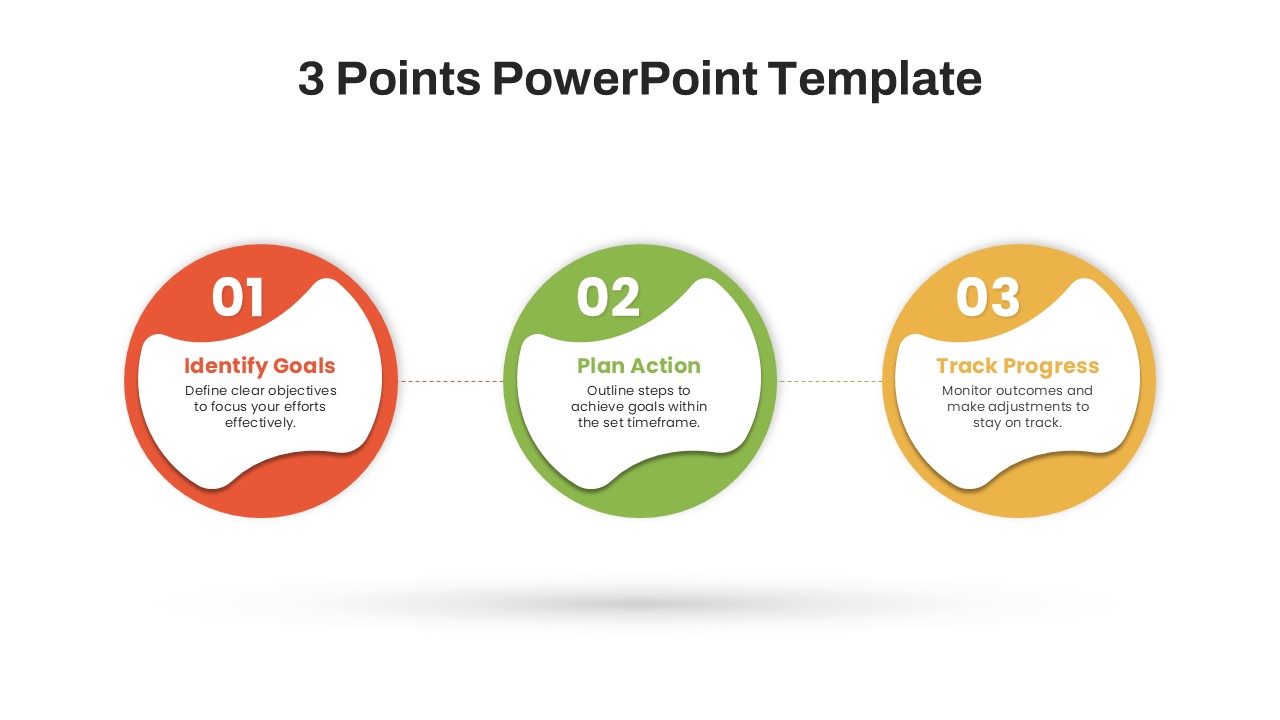
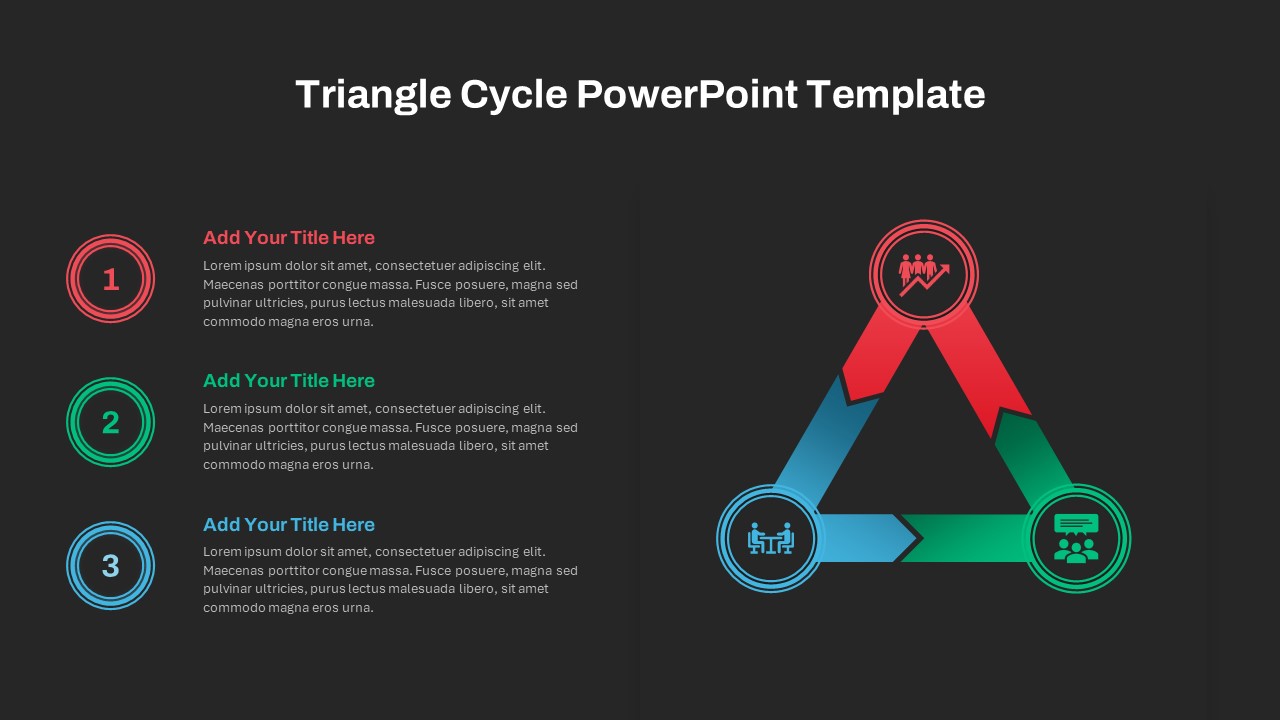
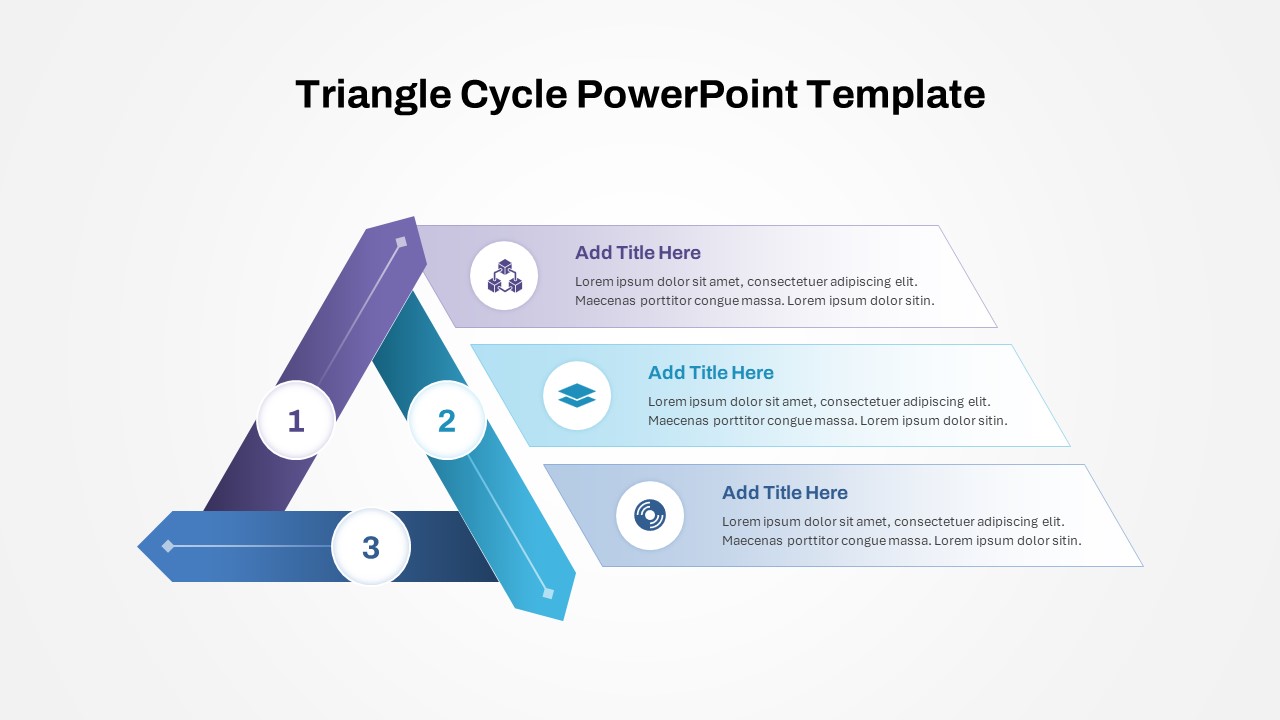
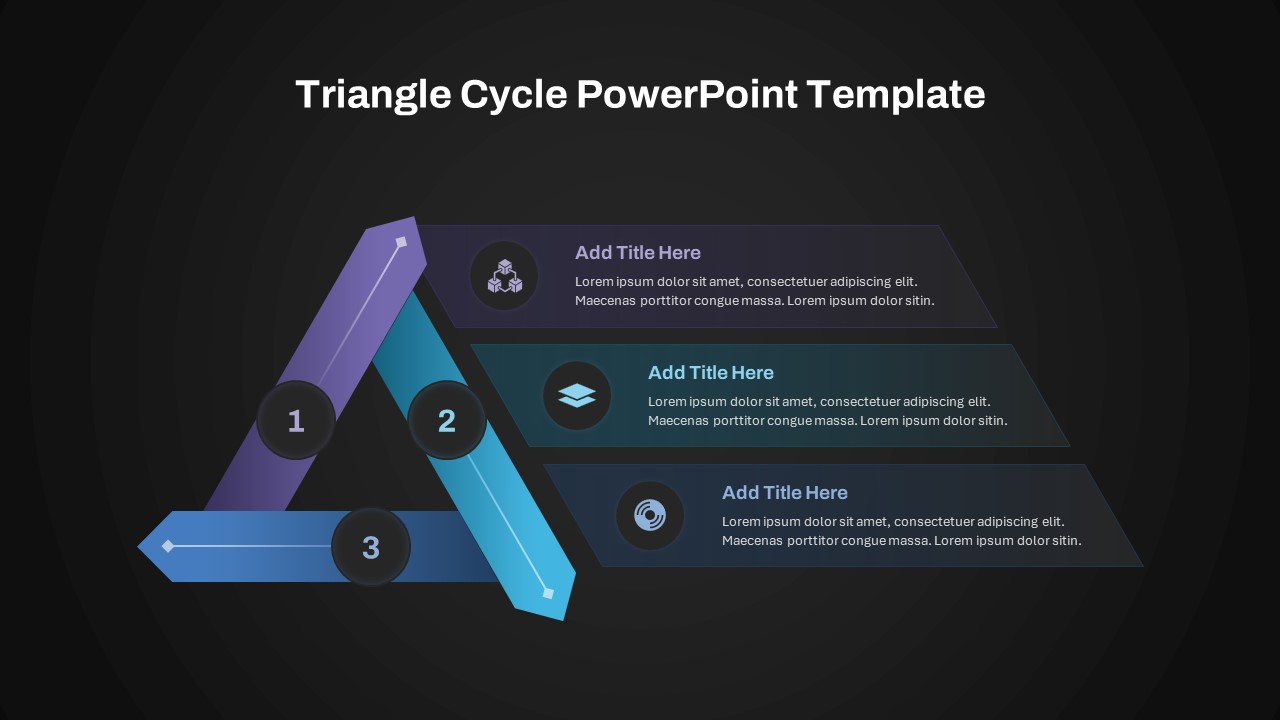
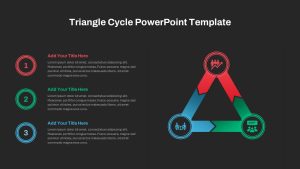
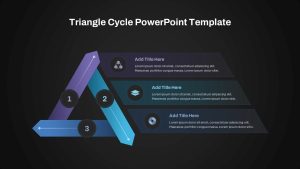
The outer ring version uses bold numbered circles in red, green, and blue alongside matching descriptive text boxes on the left, balancing visuals and narrative. Alternatively, icon-embedded variants place meaningful glyphs within each segment’s header box, organizing information in three horizontal callout bars for streamlined instruction. All variations leverage PowerPoint and Google Slides native features—master slides, placeholder text, and vector support—ensuring consistent formatting across devices and platforms.
Whether you need to illustrate project lifecycles, strategic frameworks, or three-step workflows, this versatile asset adapts to your content. The minimalist background coupled with vibrant color coding draws attention to core concepts while maintaining professional polish.
Who is it for
Project managers, business strategists, and process improvement specialists will benefit from this slide’s structured cycle visuals when presenting methodologies, roadmaps, or operational frameworks. Trainers, consultants, and university lecturers can also employ these designs to teach sequential concepts, stages, or repeatable procedures.
Other Uses
Beyond lifecycle diagrams, repurpose this triangle layout to highlight marketing funnels, quality assurance stages, or resource allocation phases. Use numbered icons for audit processes, compliance steps, or team roles. Adjust colors to match corporate palettes and duplicate segments to expand or condense your cycle as needed.
Login to download this file

Item ID
SB04228
Related Templates

Five-Phase and Three-Phase Phases Chart Template for PowerPoint & Google Slides
Charts
Three Section Triangle Diagram Template for PowerPoint & Google Slides
Process
Three-Section Triangle Diagram Template for PowerPoint & Google Slides
Pyramid
Three Section Triangle Diagram Template for PowerPoint & Google Slides
Process

Three-Phase Planning Gear Infographic Template for PowerPoint & Google Slides
Process
Three-Segment Circular Arrow Cycle Template for PowerPoint & Google Slides
Circular
Gear Process Phase Diagram template for PowerPoint & Google Slides
Process
Greiner Growth Model Six-Phase Diagram Template for PowerPoint & Google Slides
Business Models
Four-Phase Maturity Model Diagram Template for PowerPoint & Google Slides
Process
Five-Phase Strategy Timeline Diagram Template for PowerPoint & Google Slides
Timeline
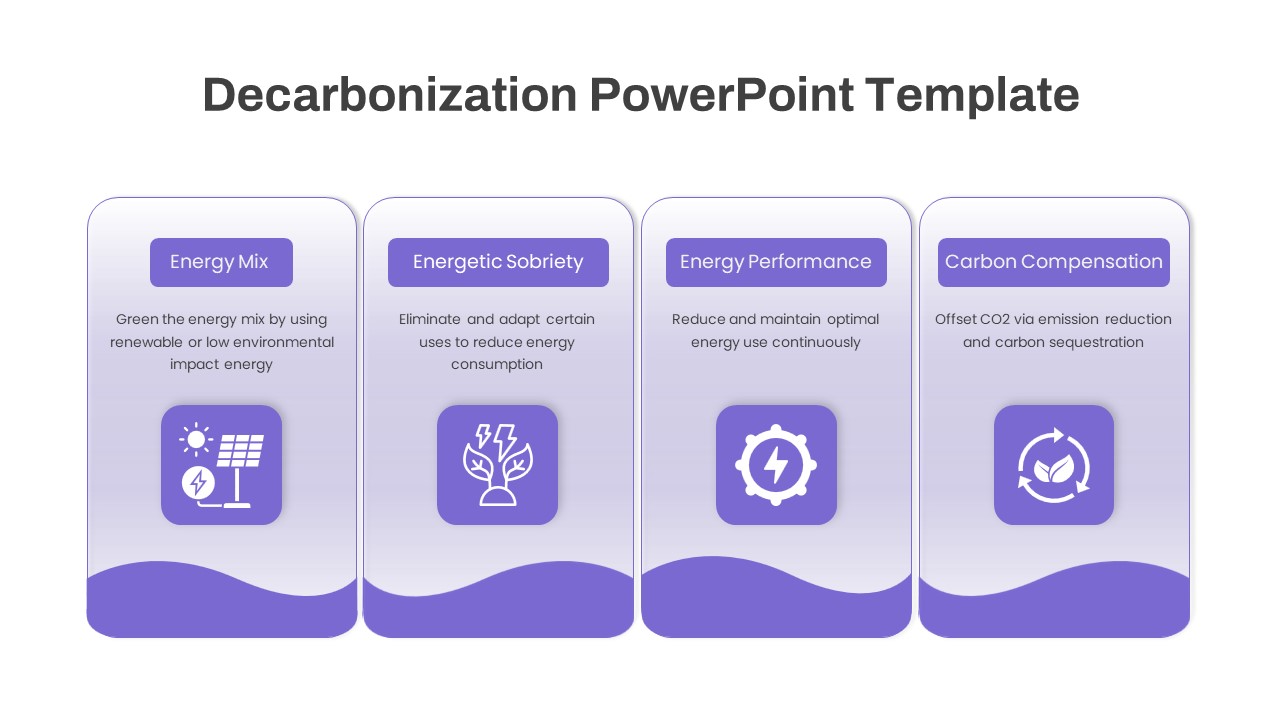
Four-Phase Decarbonization Diagram Template for PowerPoint & Google Slides
Process
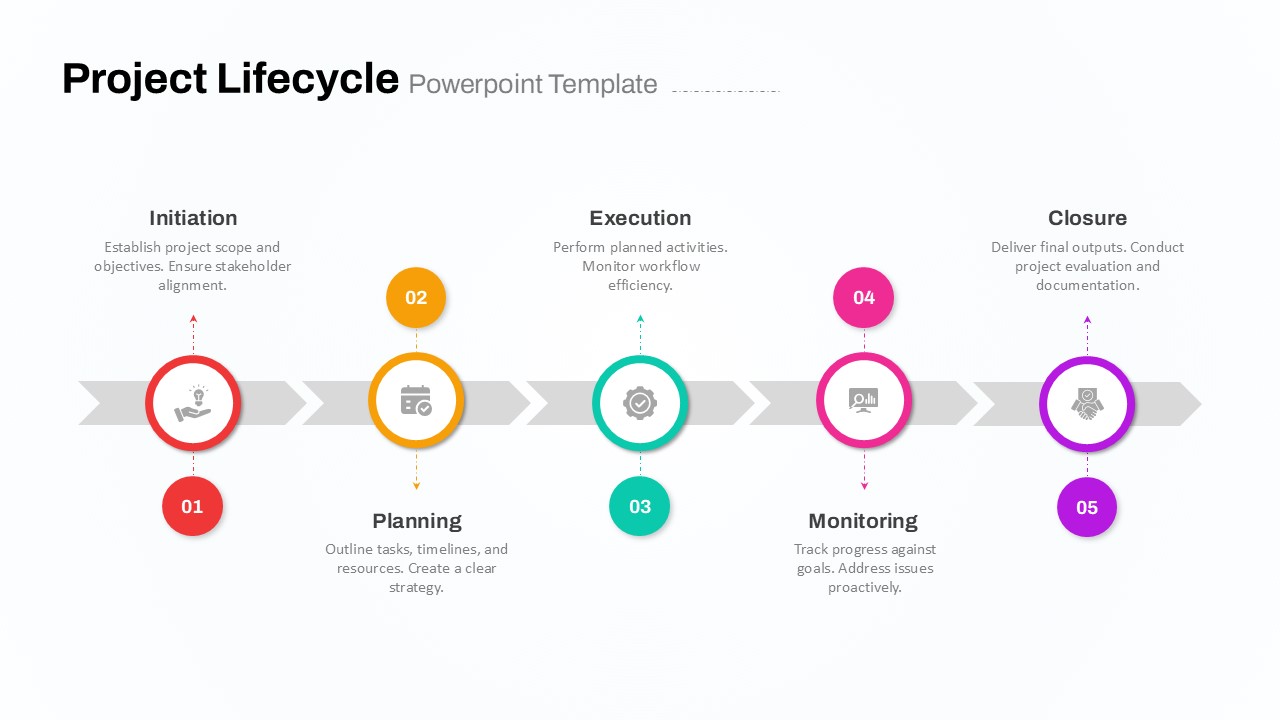
Five-Phase Project Lifecycle Diagram Template for PowerPoint & Google Slides
Infographics
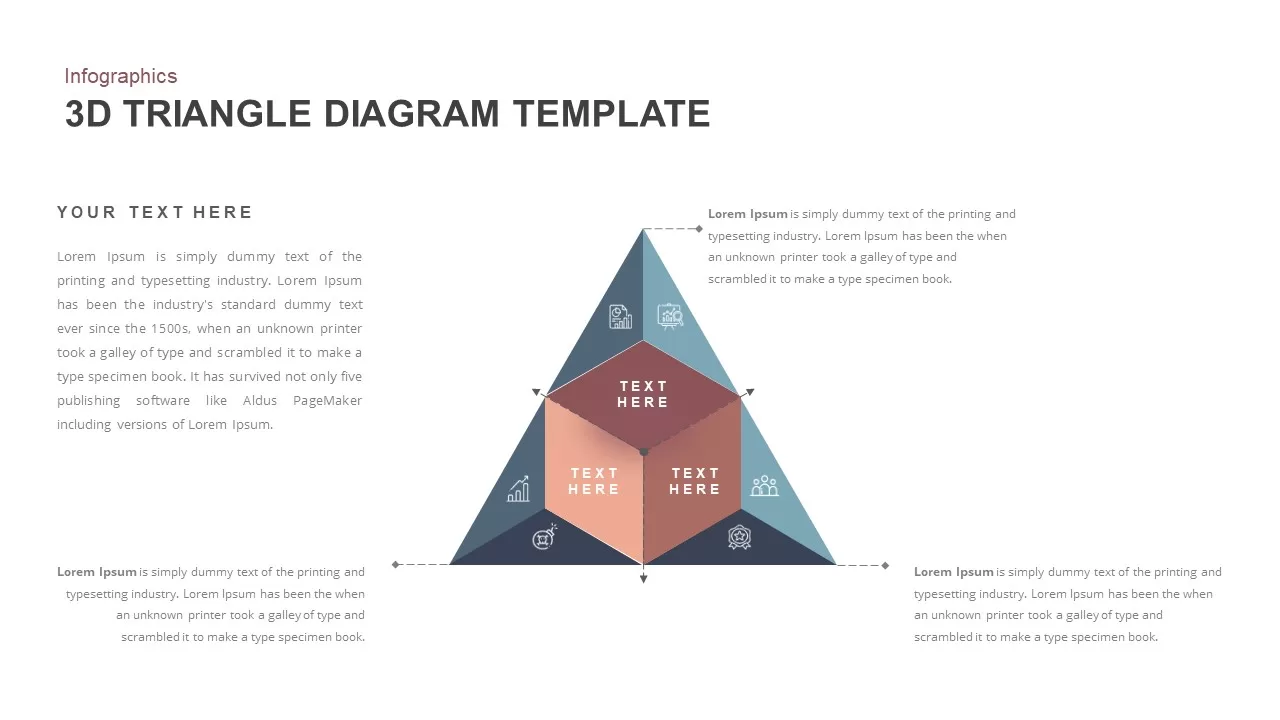
3D Triangle Diagram Infographic Template for PowerPoint & Google Slides
Pyramid
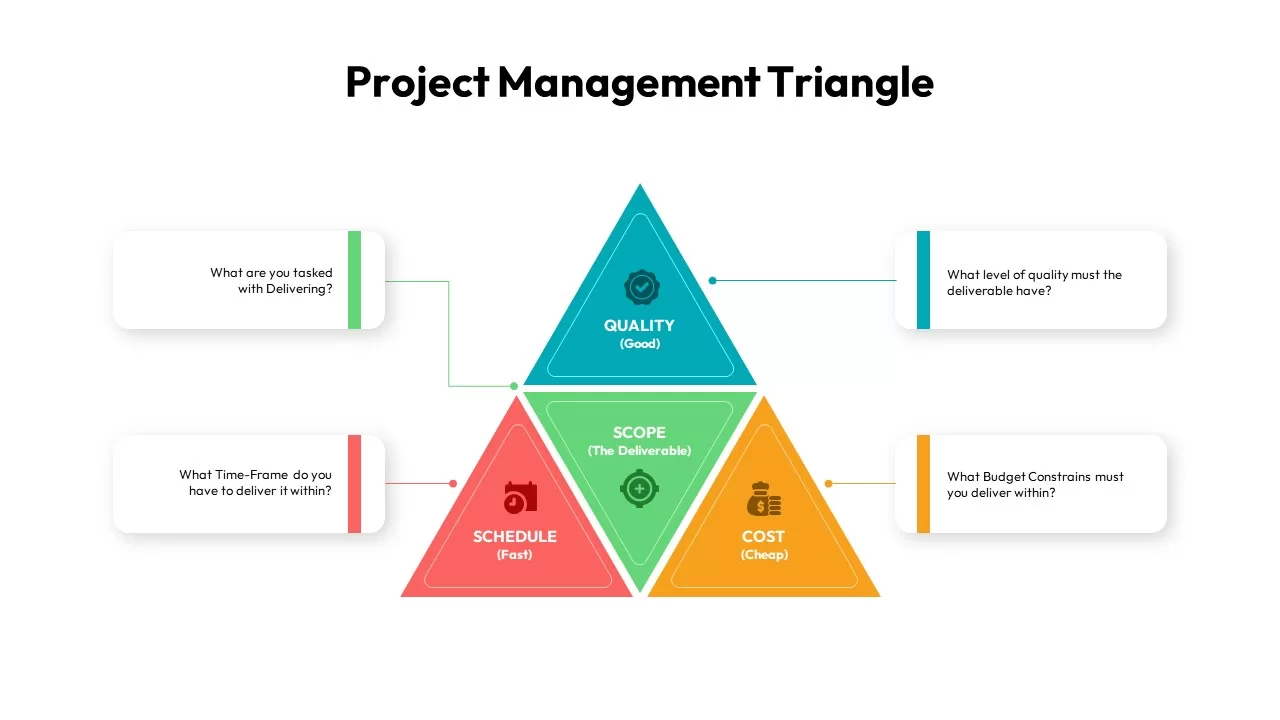
Project Management Triangle Diagram Template for PowerPoint & Google Slides
Project
Category Creation Triangle Diagram Template for PowerPoint & Google Slides
Business Strategy
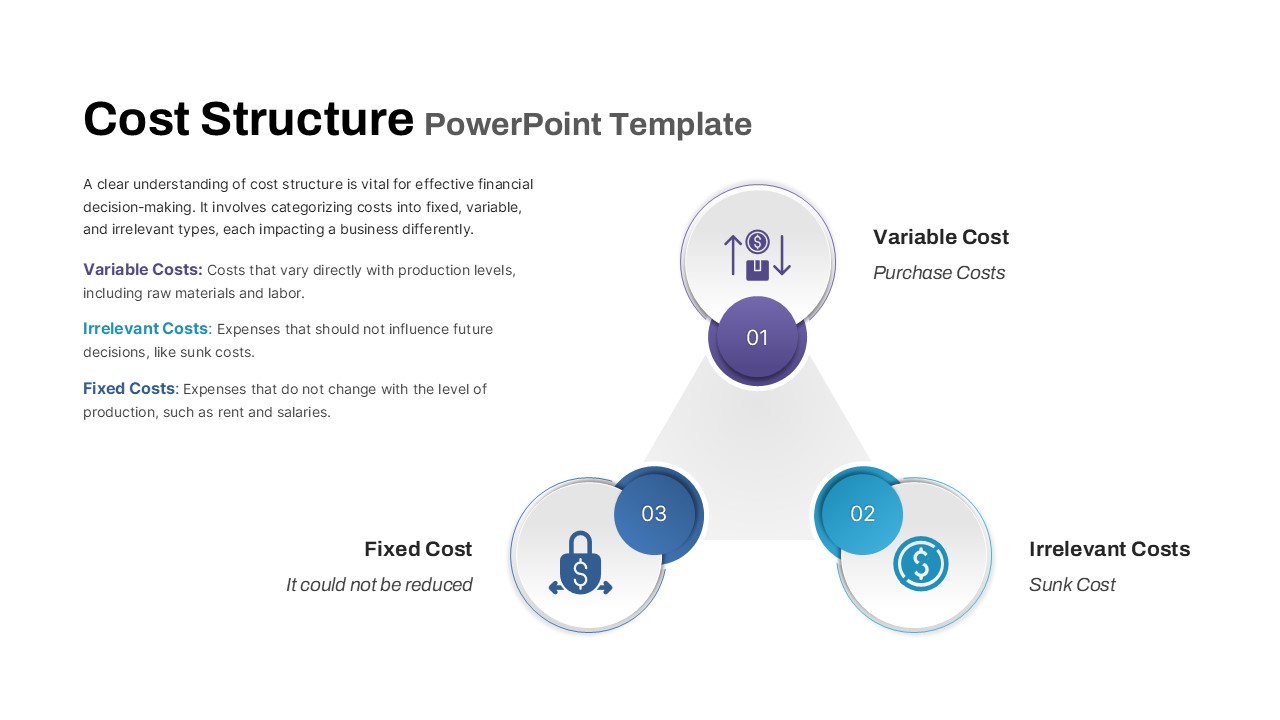
Cost Structure Triangle Diagram Template for PowerPoint & Google Slides
Finance
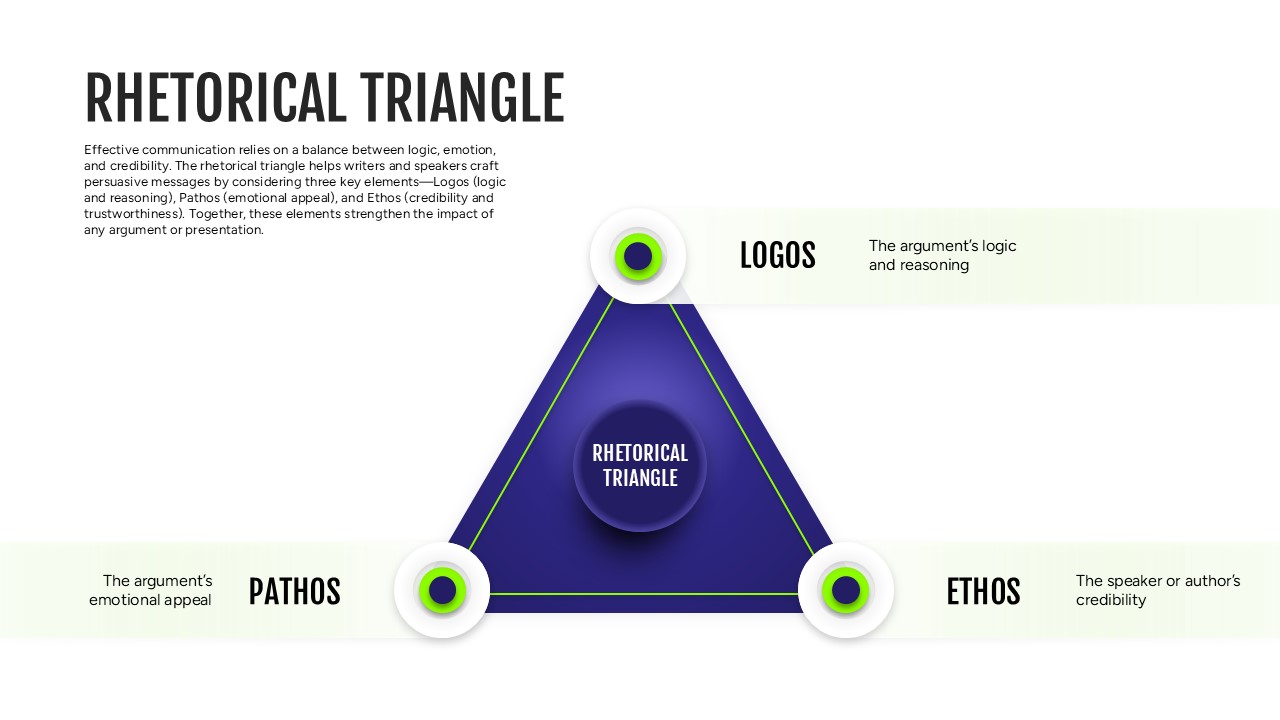
Rhetorical Triangle Model Diagram Template for PowerPoint & Google Slides
Leadership
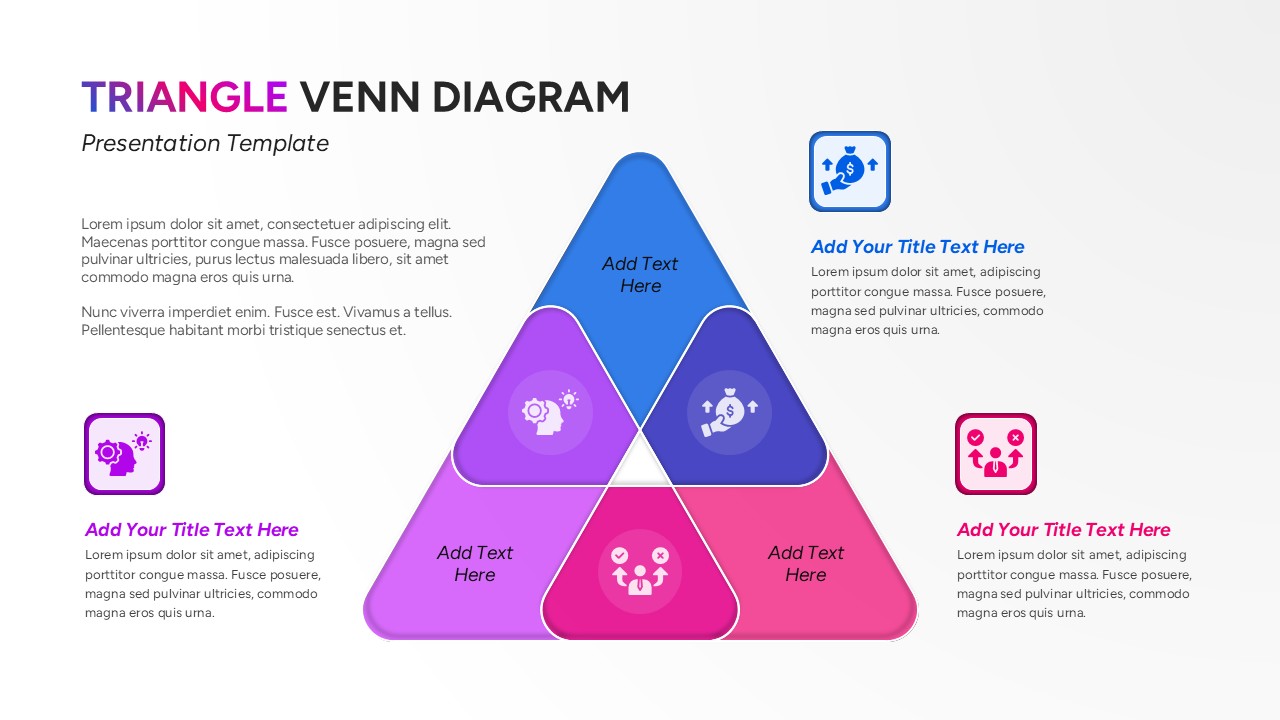
Triangle Venn Diagram Infographic Template for PowerPoint & Google Slides
Comparison
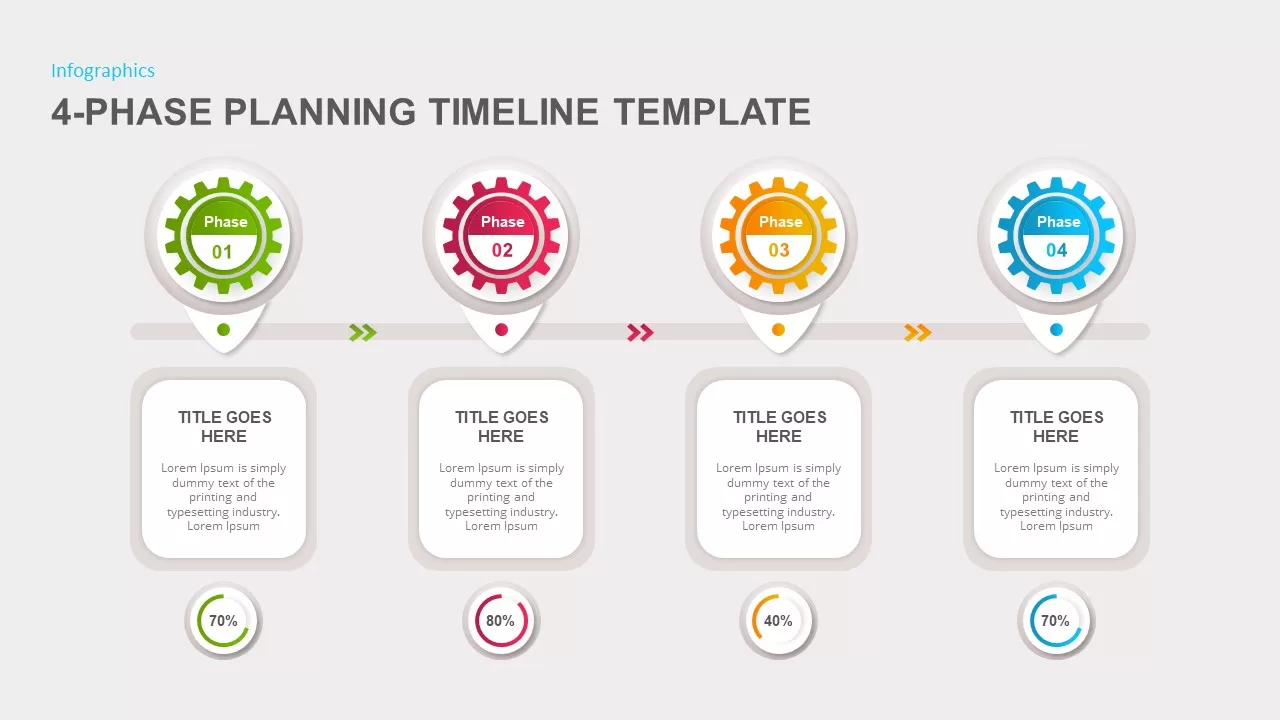
4-Phase Planning Timeline template for PowerPoint & Google Slides
Infographics
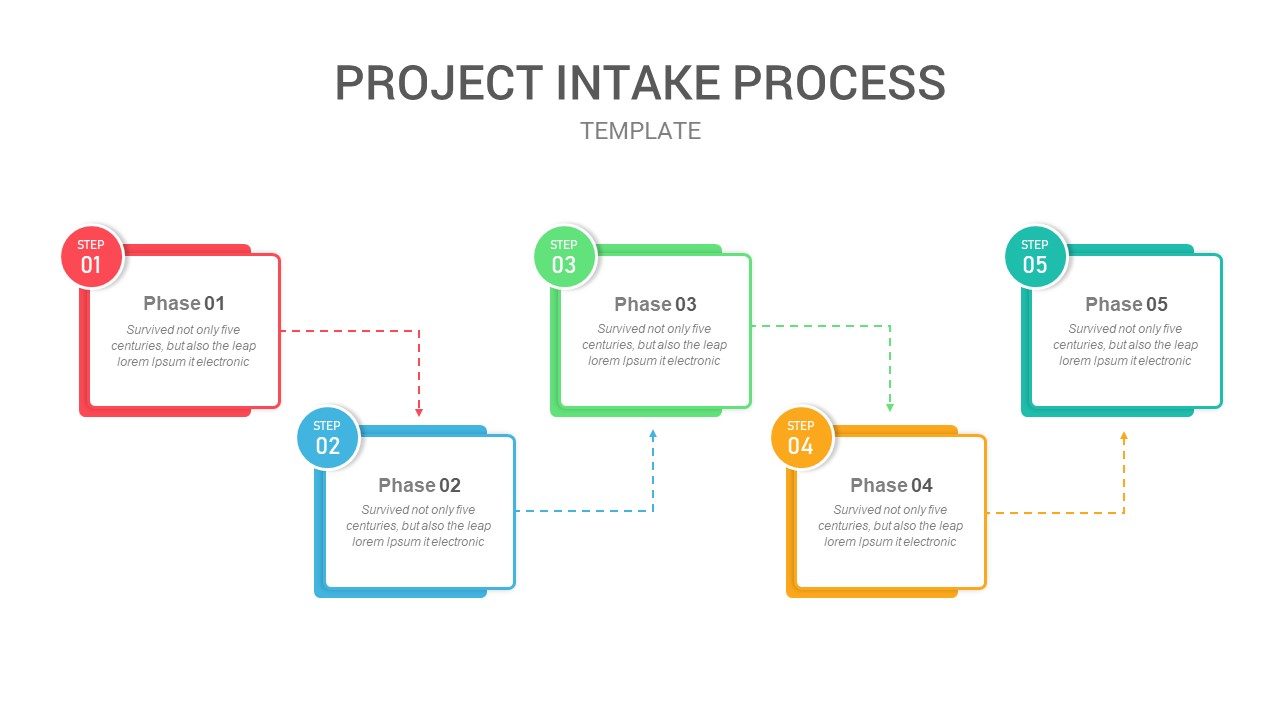
Five-Phase Project Intake Process Flow Template for PowerPoint & Google Slides
Process
Five-Phase Horizontal Timeline Chart Template for PowerPoint & Google Slides
Timeline
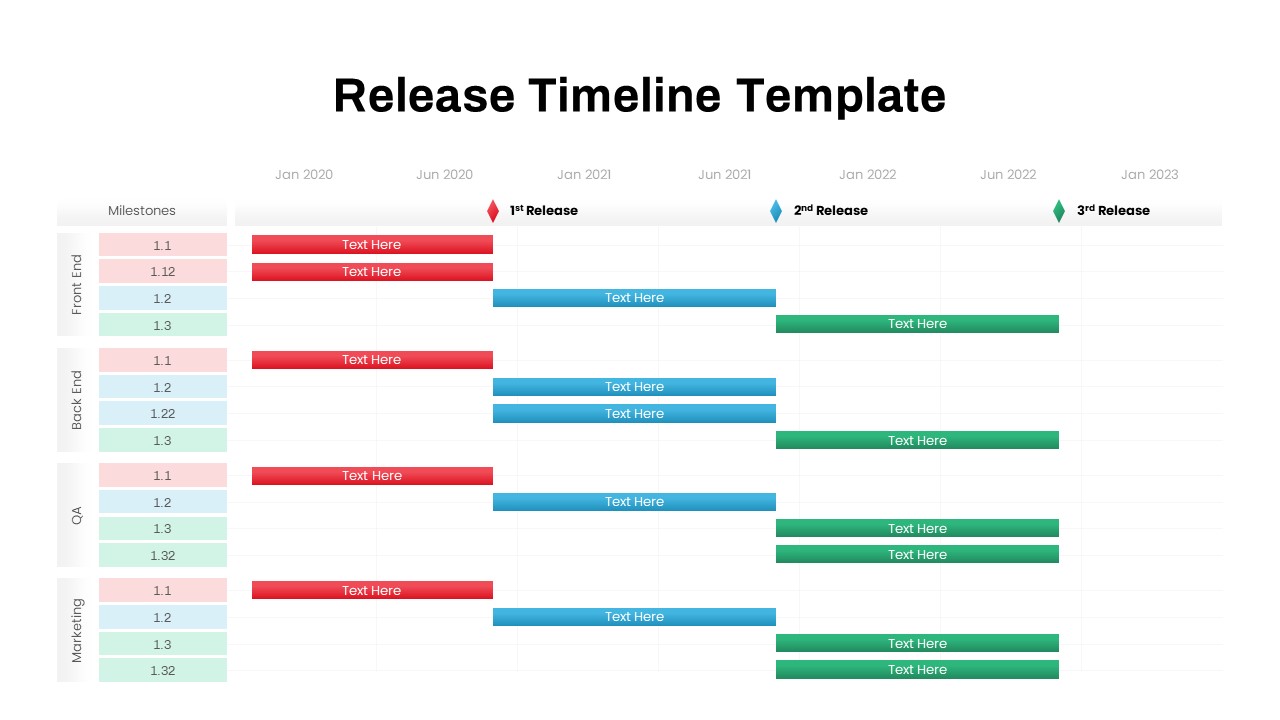
Multi-Team Multi-Phase Release Timeline Template for PowerPoint & Google Slides
Timeline
Multi-Phase Research Roadmap Infographic Template for PowerPoint & Google Slides
Roadmap
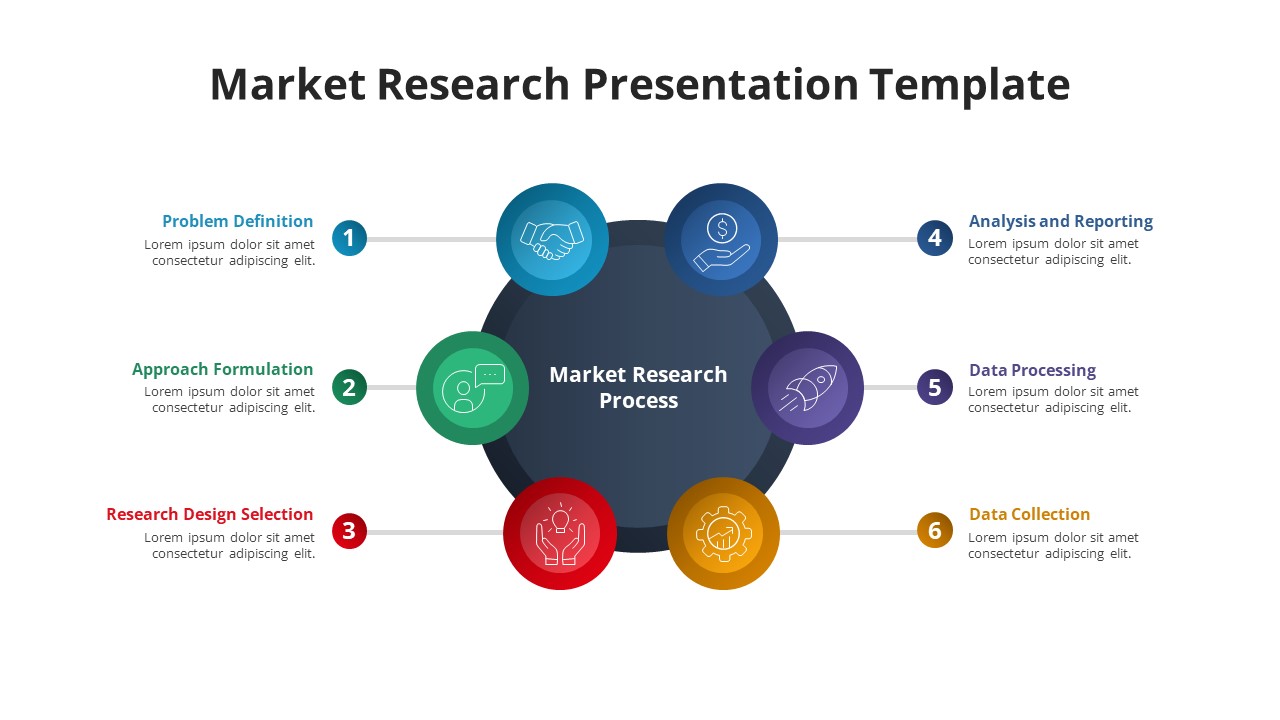
Free Six-Phase Market Research Process Template for PowerPoint & Google Slides
Process
Free
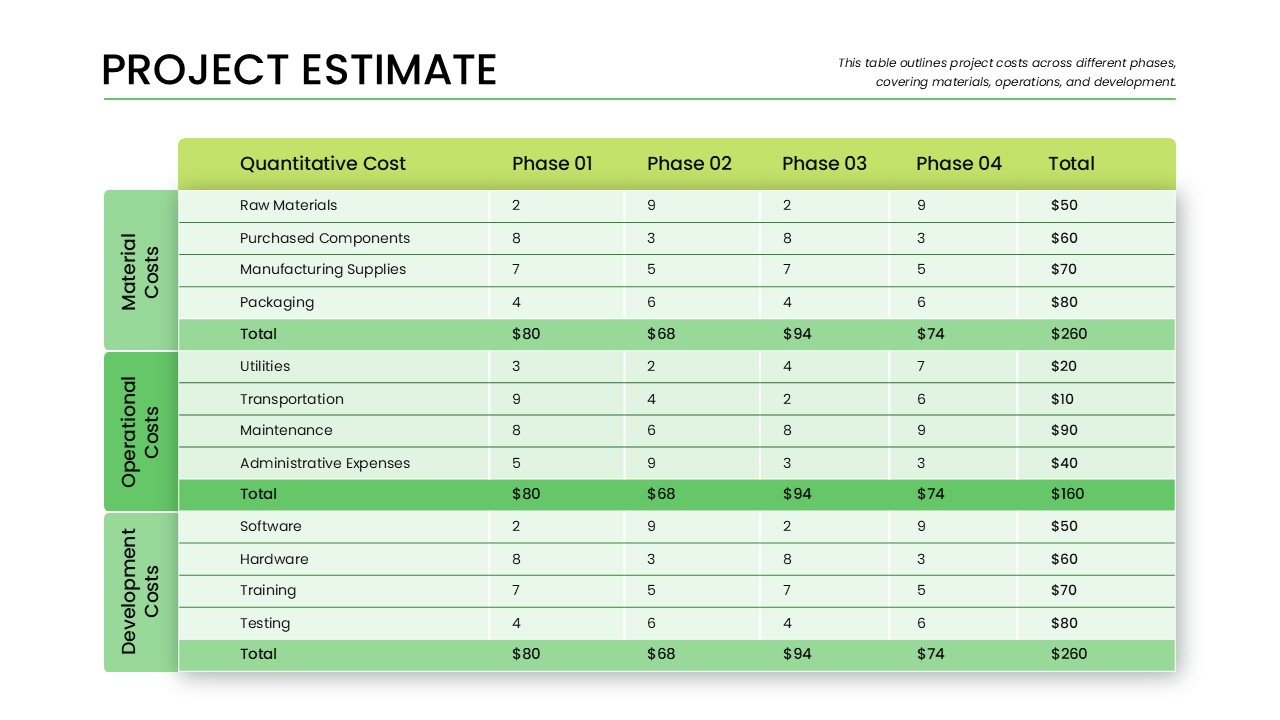
Phase-Wise Project Estimate Table Template for PowerPoint & Google Slides
Business Report
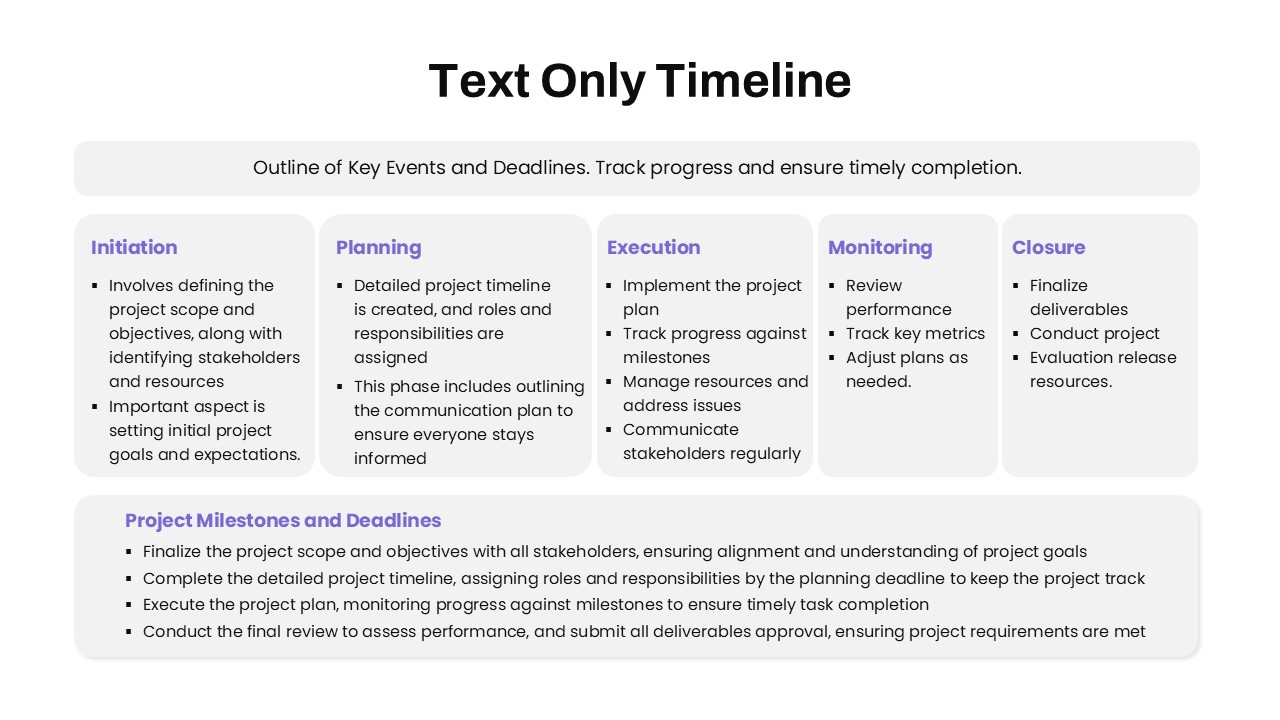
Text-Only Five-Phase Timeline Template for PowerPoint & Google Slides
Timeline

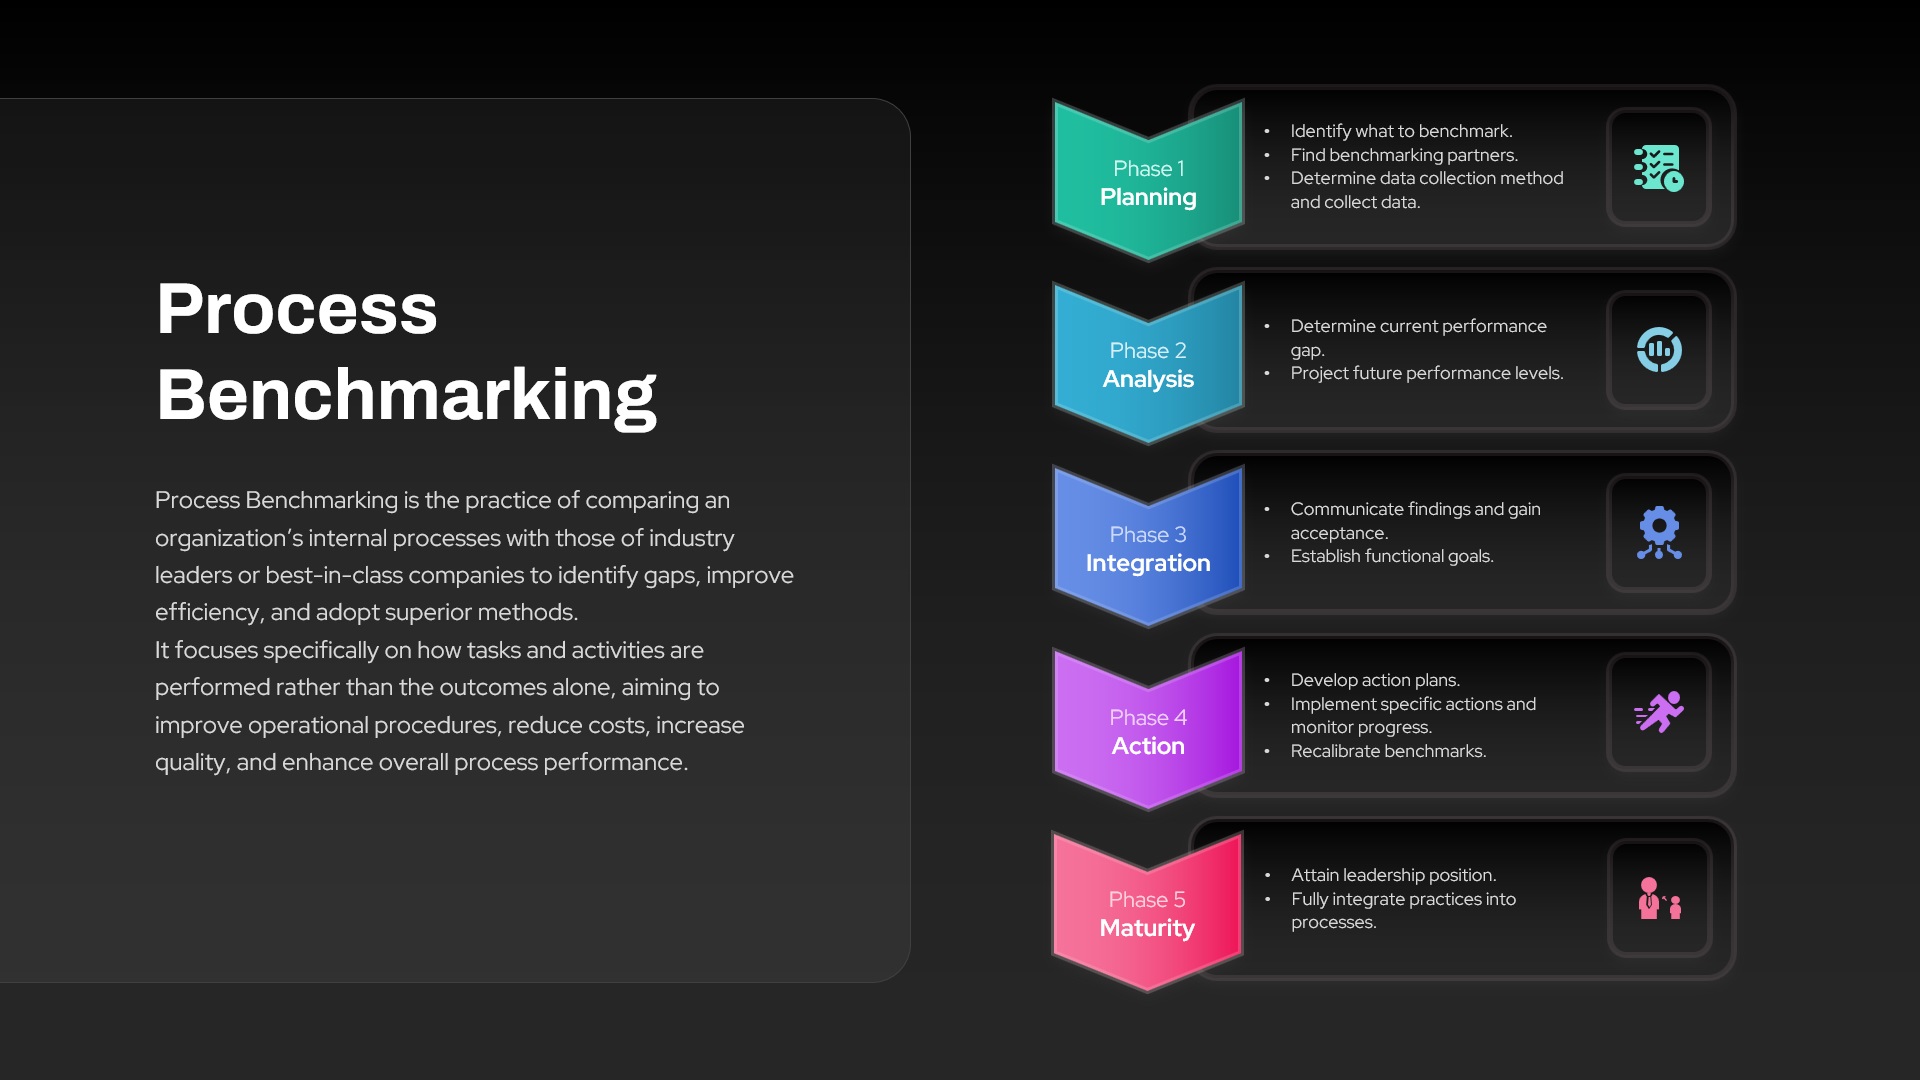
Process Benchmarking Five-Phase Framework Template for PowerPoint & Google Slides
Process
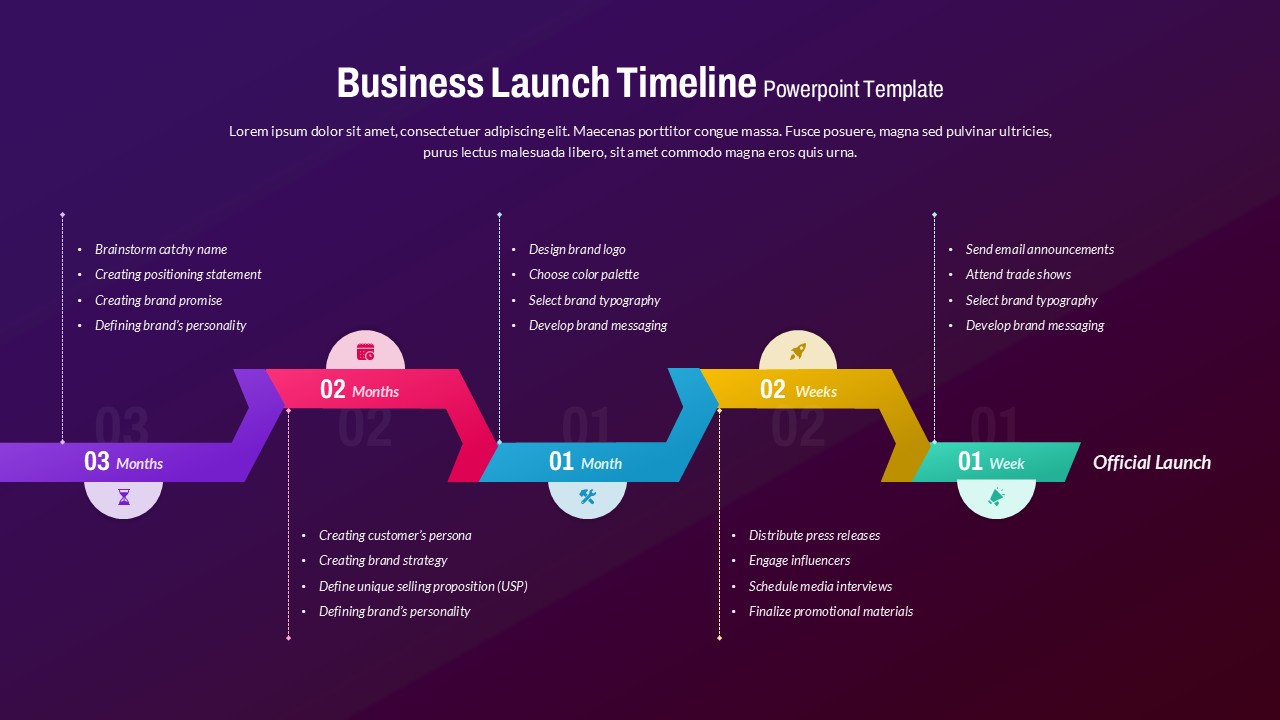
Business Launch Timeline Roadmap 5-Phase Template for PowerPoint & Google Slides
Business
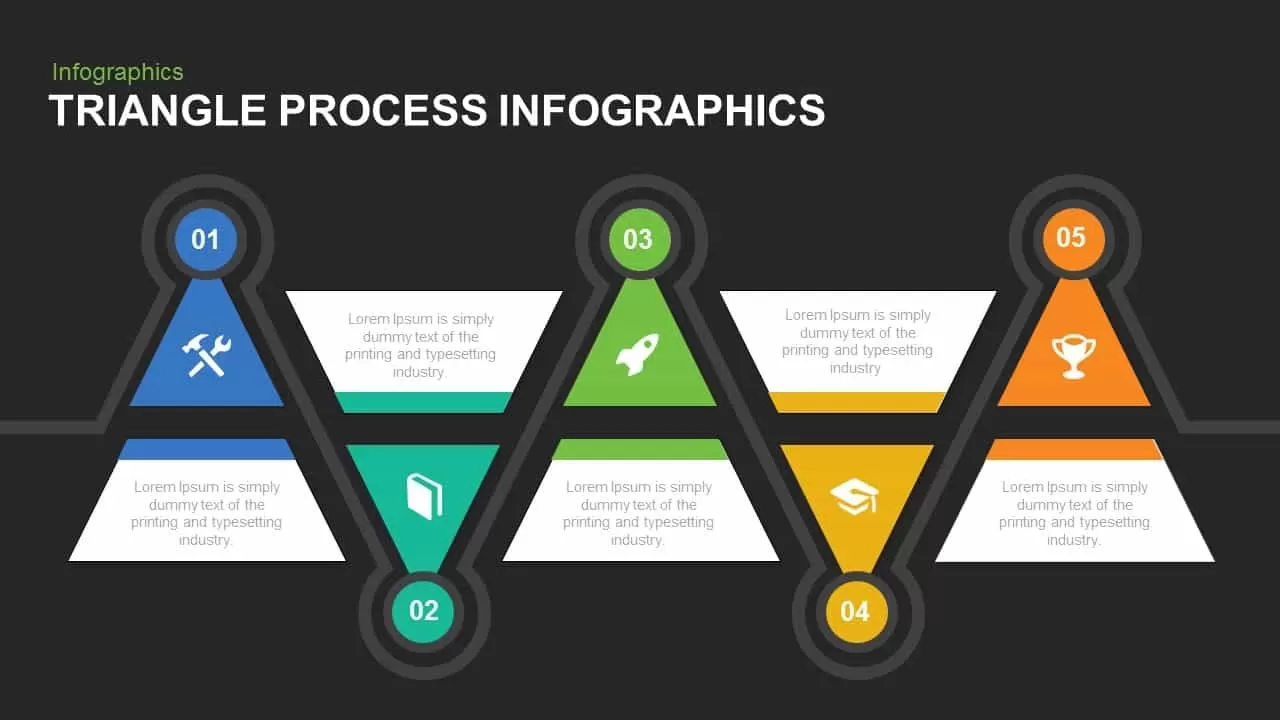
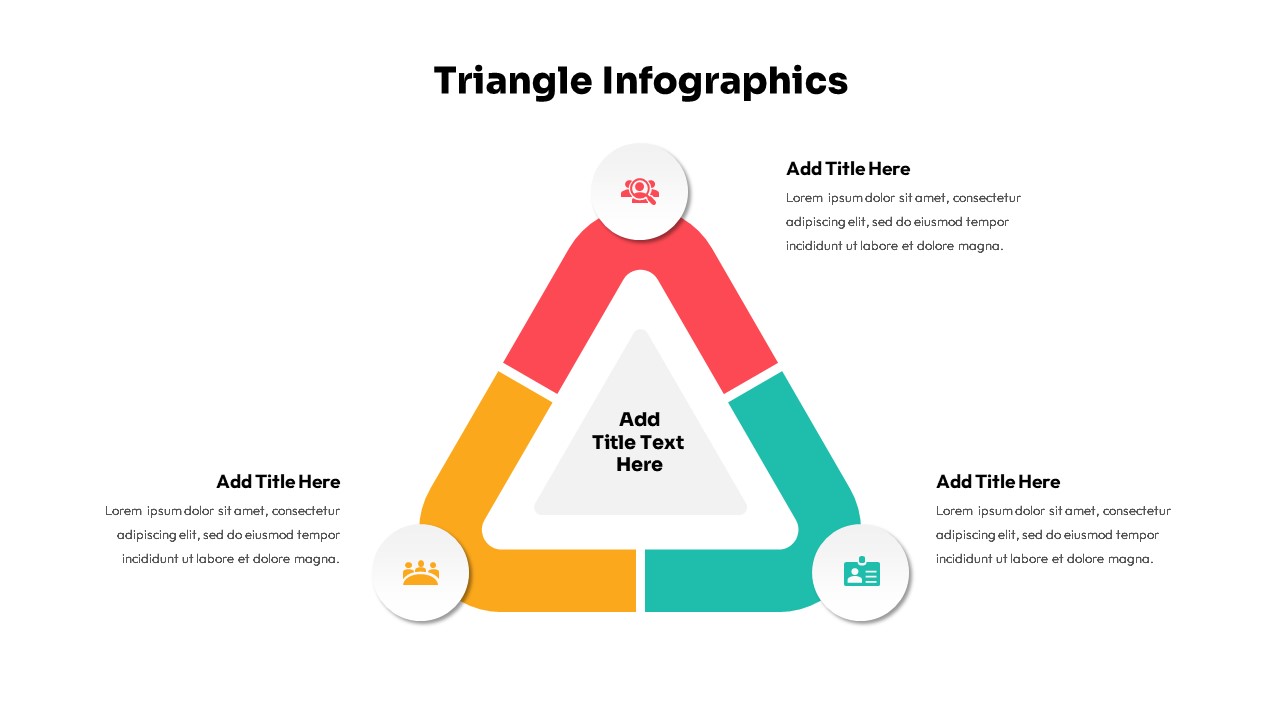
Triangle Process Infographics template for PowerPoint & Google Slides
Process
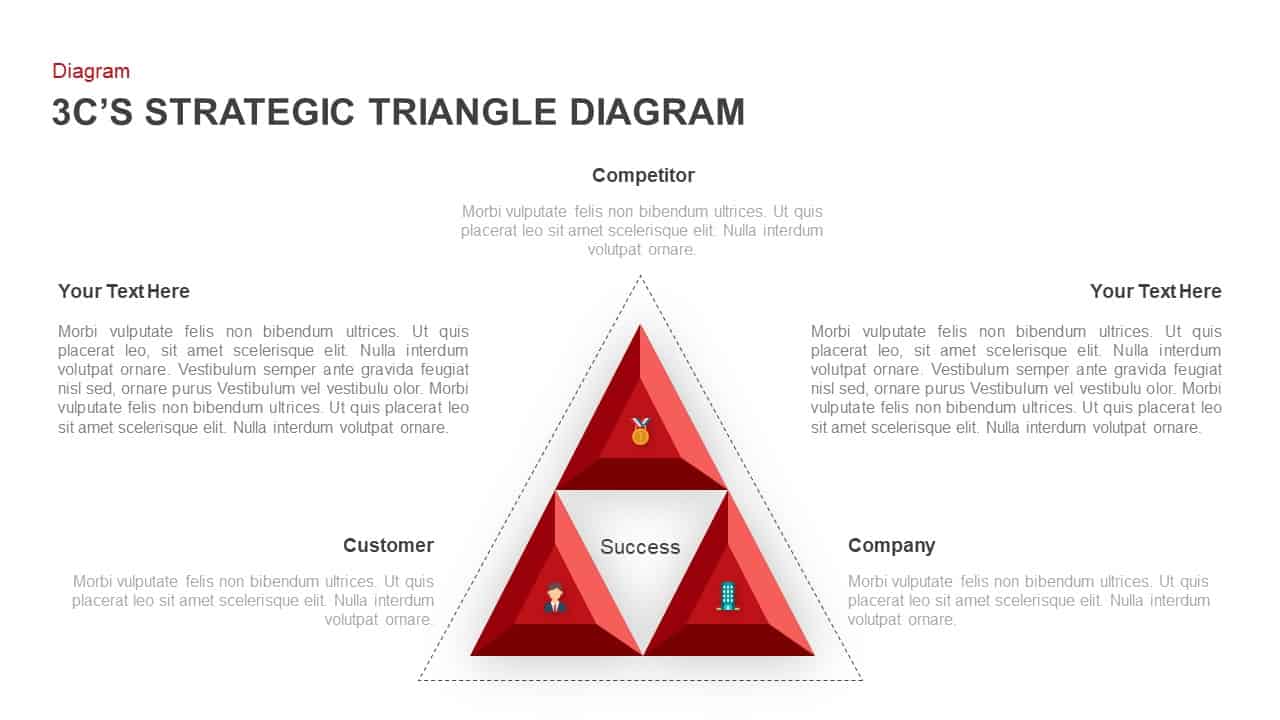
3C Strategic Triangle Analysis Template for PowerPoint & Google Slides
Competitor Analysis
Gradient Triangle Business Plan Deck Template for PowerPoint & Google Slides
Business Plan
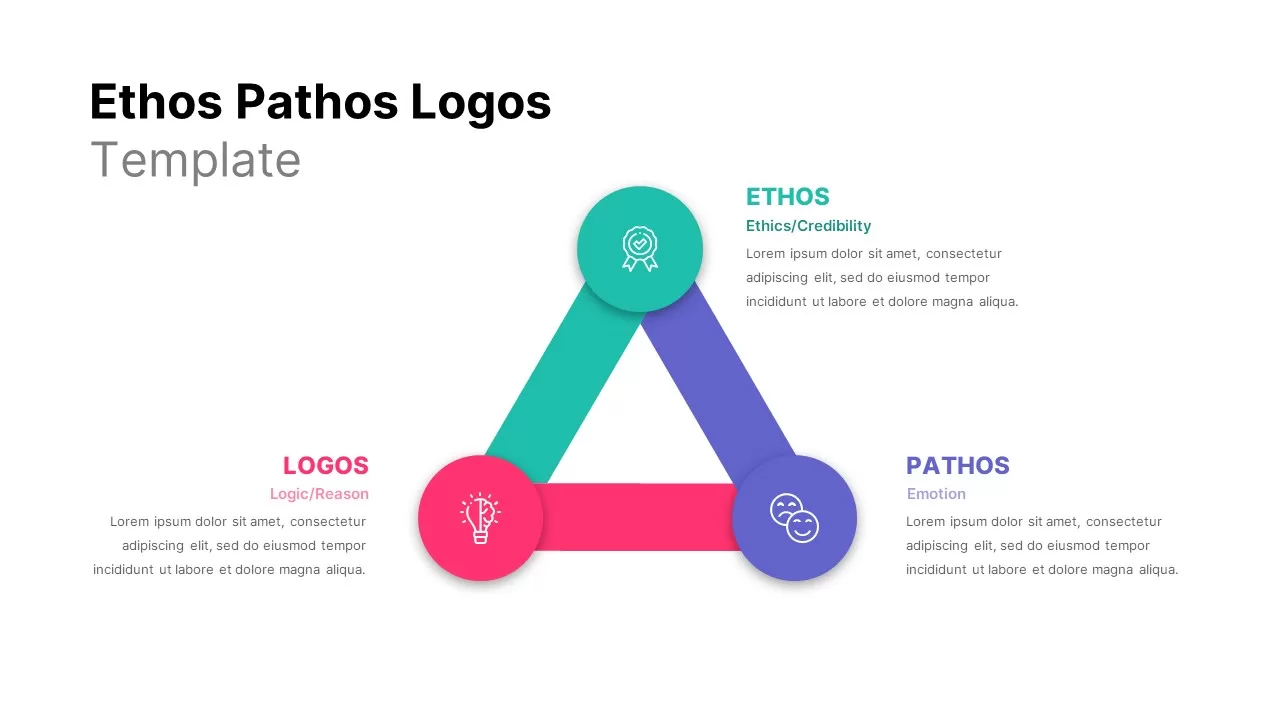
Rhetorical Triangle Ethos Pathos Logos Template for PowerPoint & Google Slides
Comparison
Triangle Infographic Slide Collection Template for PowerPoint & Google Slides
Decks
Three-Section Fishbone Process Diagram template for PowerPoint & Google Slides
Process
Three Circle Arrow Process Diagram template for PowerPoint & Google Slides
Circular

Three Stage 3D Arrow Process Diagram Template for PowerPoint & Google Slides
Process

Three-Stage Ring Process Diagram Template for PowerPoint & Google Slides
Circular
Three Important Services Flow Diagram Template for PowerPoint & Google Slides
Process
Three-Level Sequence Circle Diagram Template for PowerPoint & Google Slides
Circular
Engaging Three-Stage Process Diagram Template for PowerPoint & Google Slides
Process
Three-Circle Diagram Infographic Template for PowerPoint & Google Slides
Circular
Three Level Funnel Process Diagram Template for PowerPoint & Google Slides
Funnel
Three to Six Staged Circular Diagram Template for PowerPoint & Google Slides
Process
Three-Way Decision Process Arrow Diagram Template for PowerPoint & Google Slides
Arrow
Three-Branch Cluster Diagram Presentation Template for PowerPoint & Google Slides
Mind Maps
Three to Nine-Step Puzzle Ring Process Diagram Template for PowerPoint & Google Slides
Circular
Creative Three-Circle Venn Diagram Template for PowerPoint & Google Slides
Comparison
Circular Three-Step Infographic Diagram Template for PowerPoint & Google Slides
Circular
Three-Step Flowchart Process Diagram Template for PowerPoint & Google Slides
Flow Charts
Three-Stage Loop Process Diagram Template for PowerPoint & Google Slides
Process
Three-Step Triangular Gear Diagram Template for PowerPoint & Google Slides
Process
Three-Step Result Diagram Infographic Template for PowerPoint & Google Slides
Process
Three-Part Puzzle Piece Diagram Template for PowerPoint & Google Slides
Process
Three-Step Circular Arrows Diagram Template for PowerPoint & Google Slides
Process
Three-Step Curved Arrow Process Diagram Template for PowerPoint & Google Slides
Arrow
Three-Step Hub and Spoke Diagram Template for PowerPoint & Google Slides
Circular
Three-Stage S Curve Growth Diagram Template for PowerPoint & Google Slides
Process
Three-Step Gears Brain Diagram Template for PowerPoint & Google Slides
Process
Modern Three-Point Process Diagram Template for PowerPoint & Google Slides
Process
Three-Part Parts Infographic Diagram Template for PowerPoint & Google Slides
Process
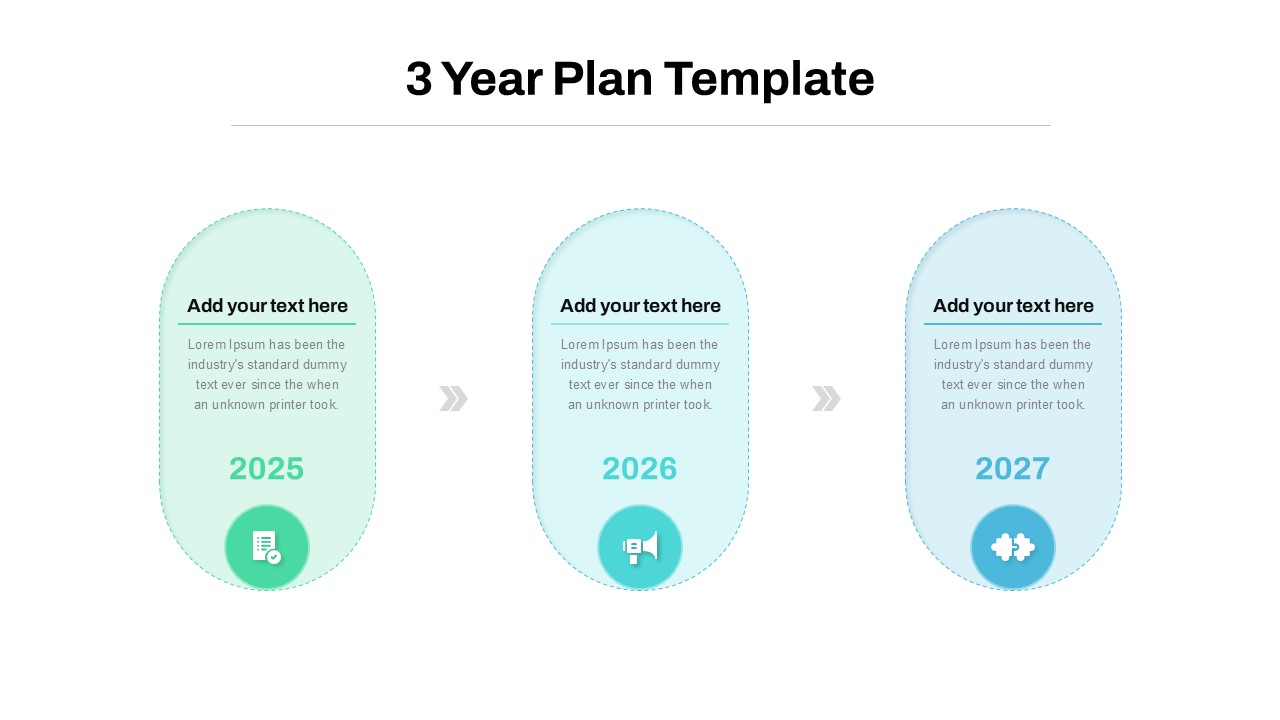
Three-Year Plan Timeline Diagram Template for PowerPoint & Google Slides
Timeline
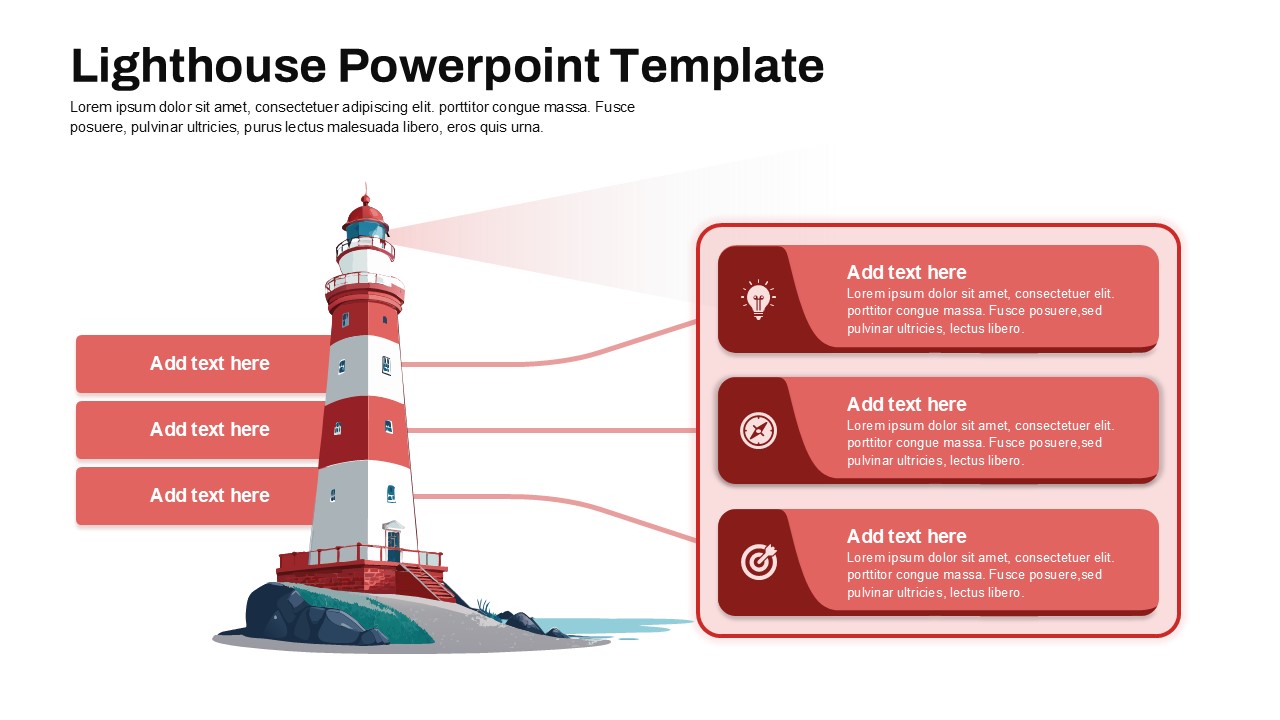
Lighthouse Three-Step Guidance Diagram Template for PowerPoint & Google Slides
Process
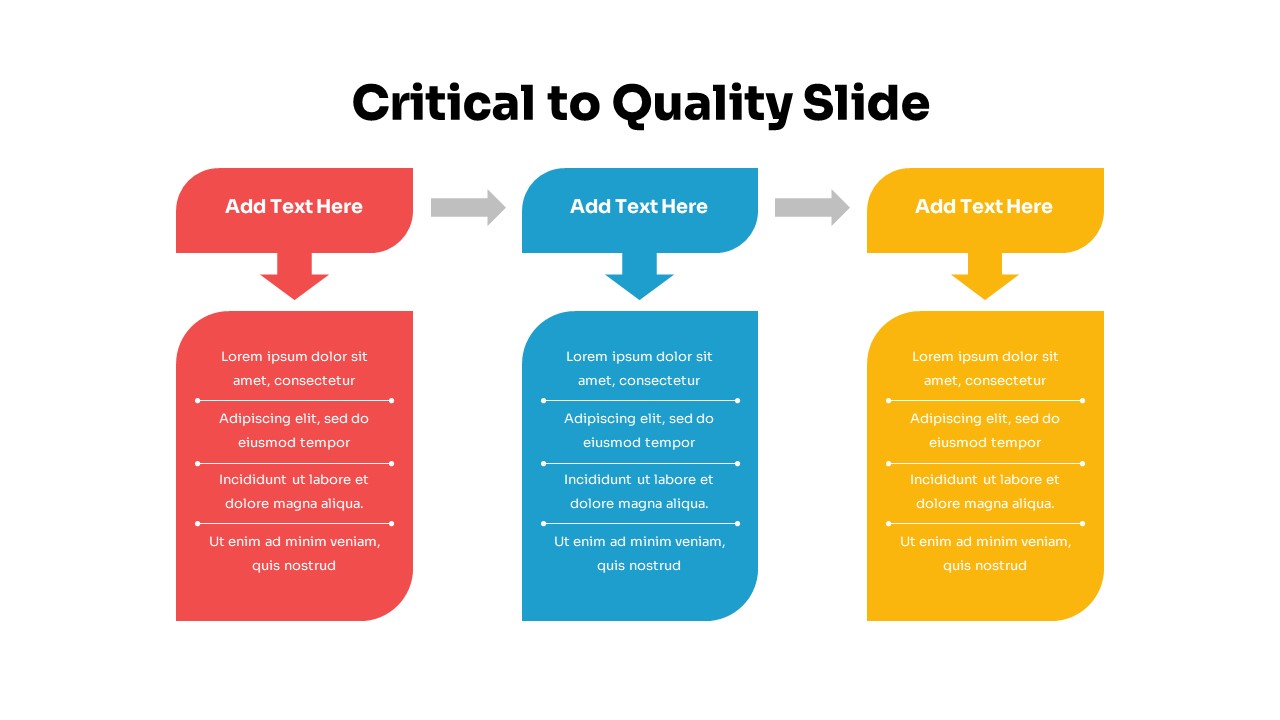
Three-Step Critical to Quality Slides Template for PowerPoint & Google Slides
Process
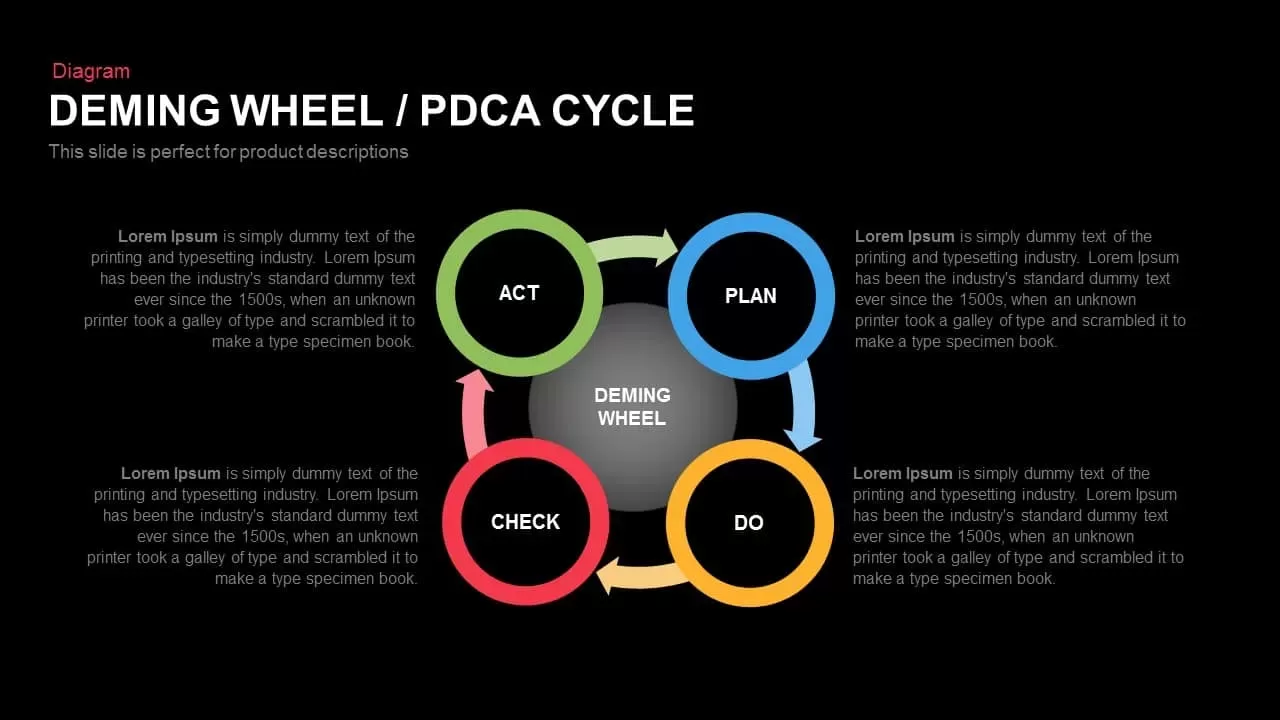
Deming Wheel PDCA Cycle Diagram Template for PowerPoint & Google Slides
Business Plan
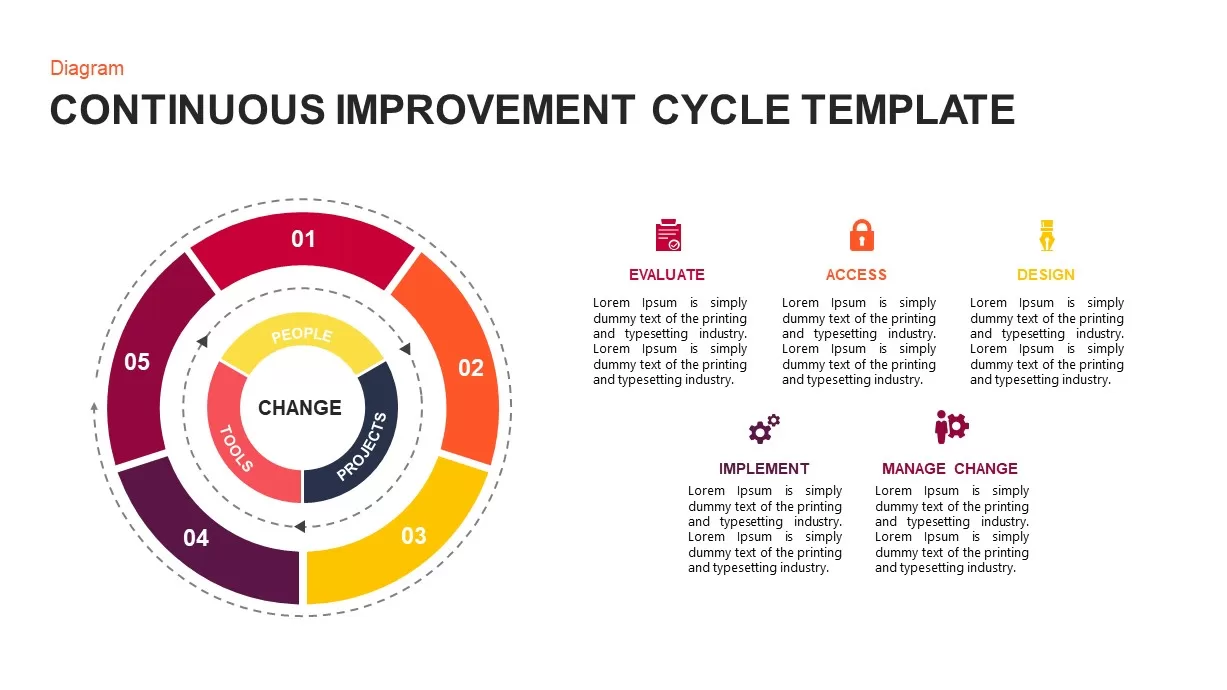
Continuous Improvement Cycle Diagram Template for PowerPoint & Google Slides
Circular
Modern Five-Stage Cycle Process Diagram Template for PowerPoint & Google Slides
Process
Six-Stage Circular Cycle Diagram Template for PowerPoint & Google Slides
Process
Four-Point Arrow Cycle Diagram Template for PowerPoint & Google Slides
Arrow

Data-Driven Marketing Cycle Diagram Template for PowerPoint & Google Slides
Customer Journey
Eight-Step Sales Cycle Diagram Template for PowerPoint & Google Slides
Process
Software Development Life Cycle Diagram Template for PowerPoint & Google Slides
Circular
3, 4 & 5 Circular Stages Cycle Diagram Deck Template for PowerPoint & Google Slides
Circular
Four-Stage Cycle Process Diagram Template for PowerPoint & Google Slides
Process
Data Migration Life Cycle Curved Diagram Template for PowerPoint & Google Slides
Process
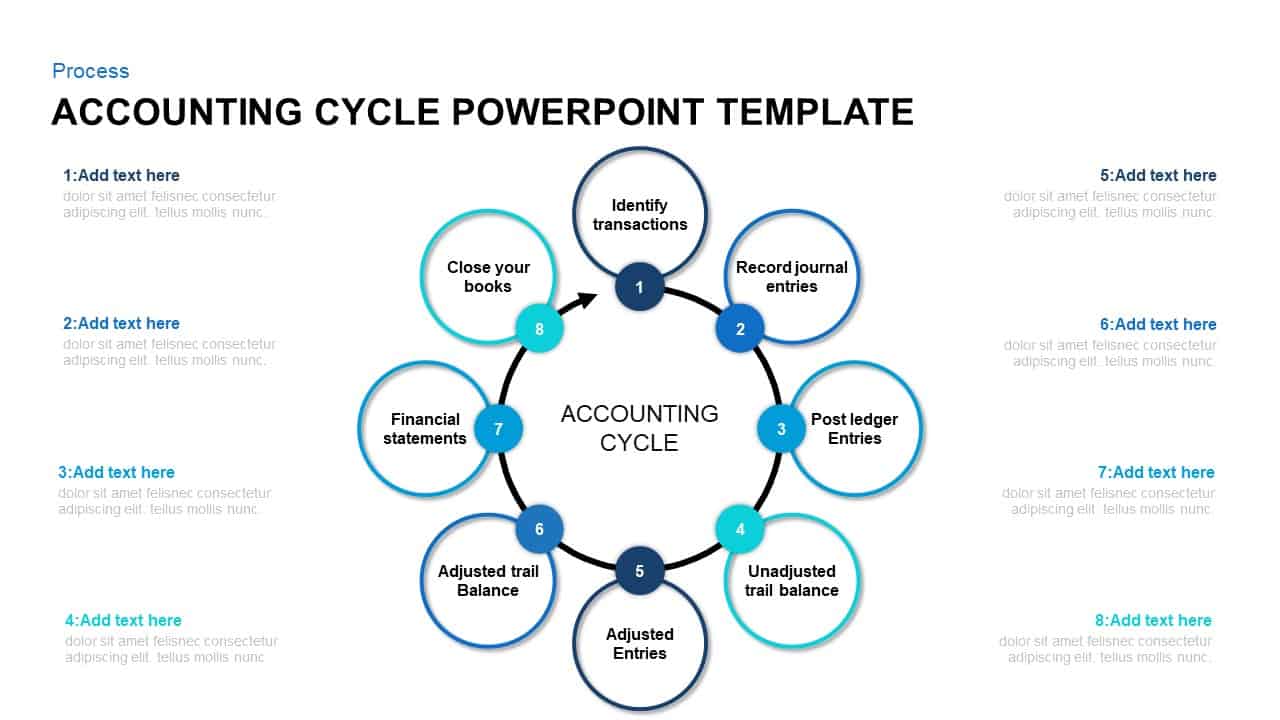
8-Step Circular Accounting Cycle Diagram Template for PowerPoint & Google Slides
Accounting
Multi-Style Project Life Cycle Diagram Template for PowerPoint & Google Slides
Process
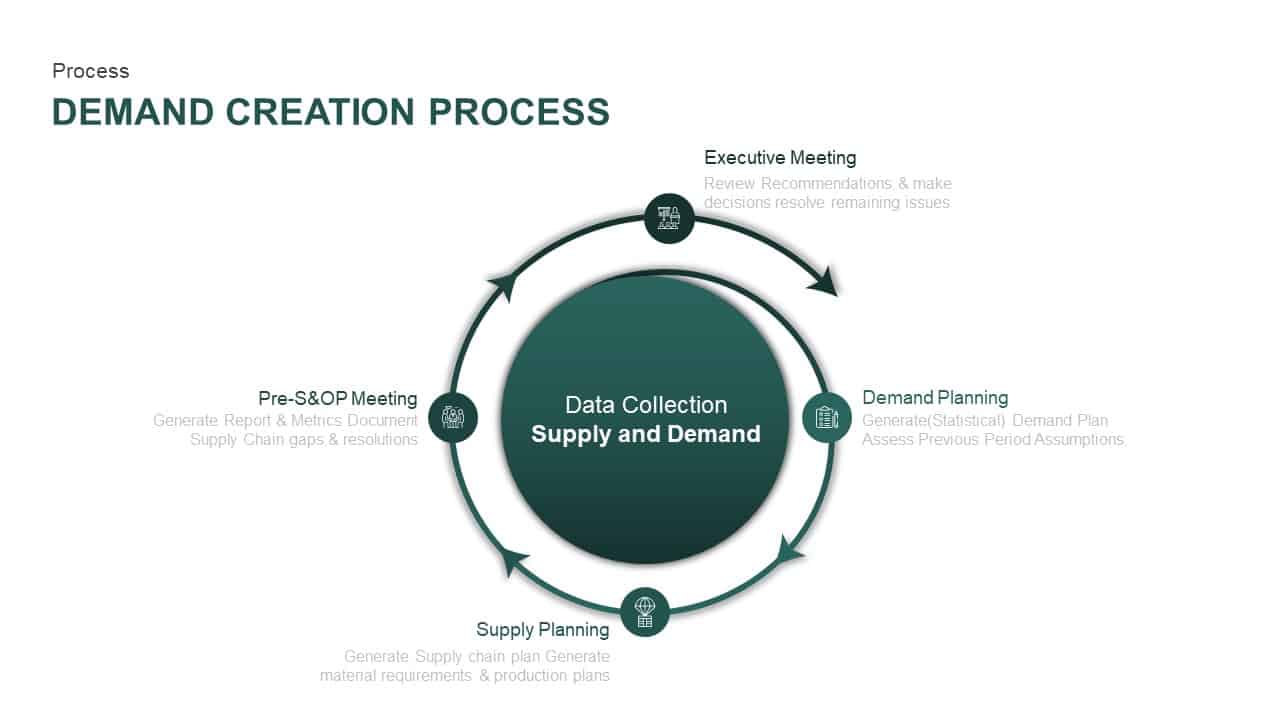
Supply and Demand Creation Cycle Diagram Template for PowerPoint & Google Slides
Process
Modern 6-Step Cycle Diagram Slide Deck Template for PowerPoint & Google Slides
Process
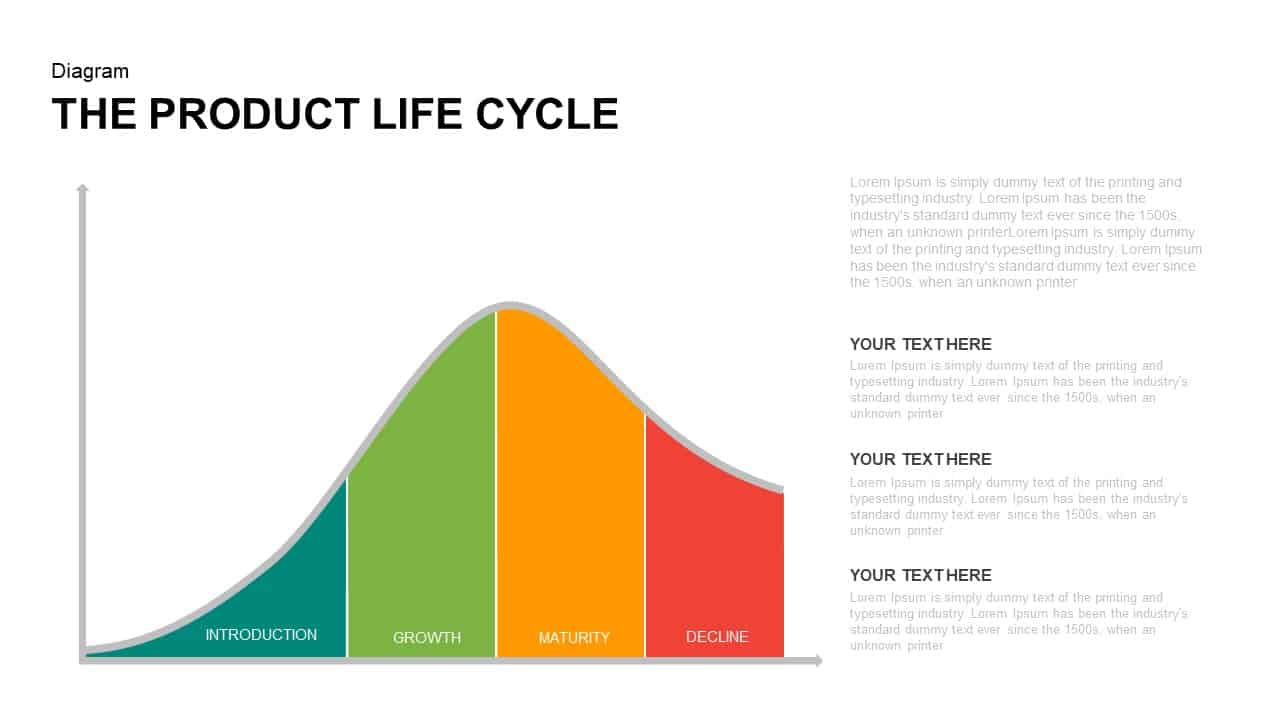
Corporate Product Life Cycle Diagram Template for PowerPoint & Google Slides
Process
Enterprise Risk Management Cycle Diagram Template for PowerPoint & Google Slides
Process
4MAT Learning Cycle Circular Diagram Template for PowerPoint & Google Slides
Circular
Continuous Improvement Cycle Diagram Template for PowerPoint & Google Slides
Process
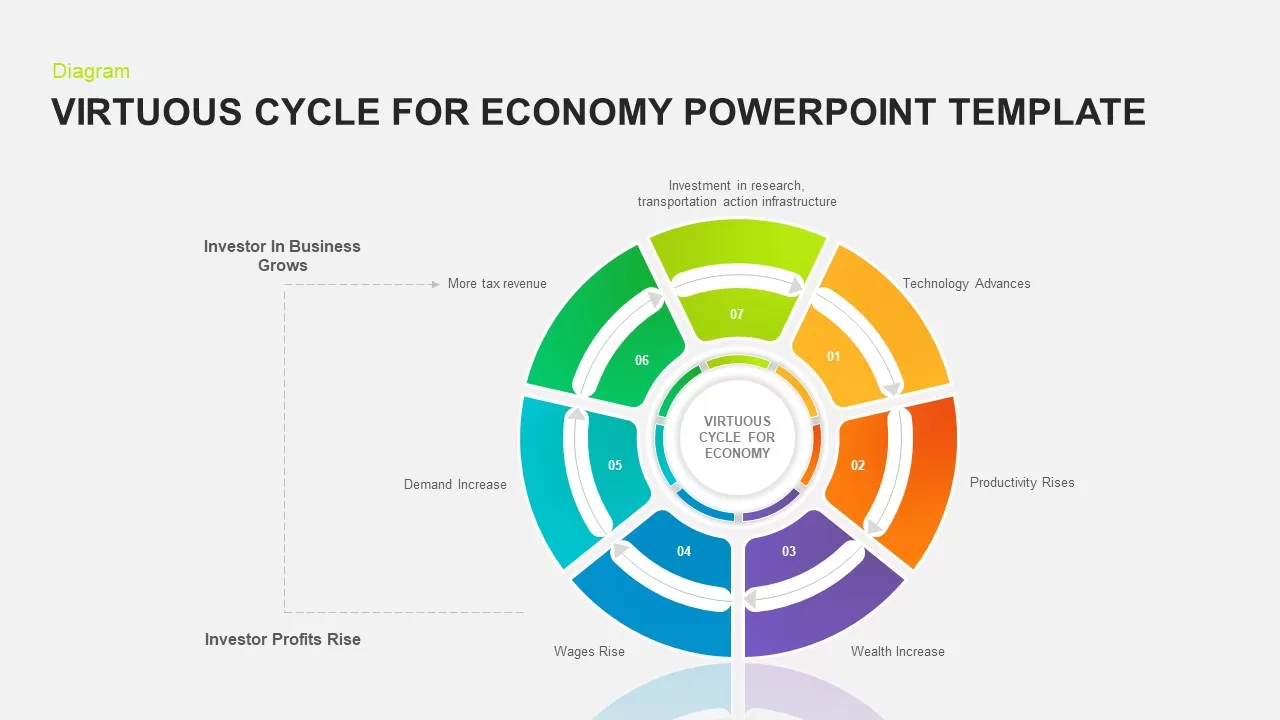
7-Step Virtuous Economy Cycle Diagram Template for PowerPoint & Google Slides
Process
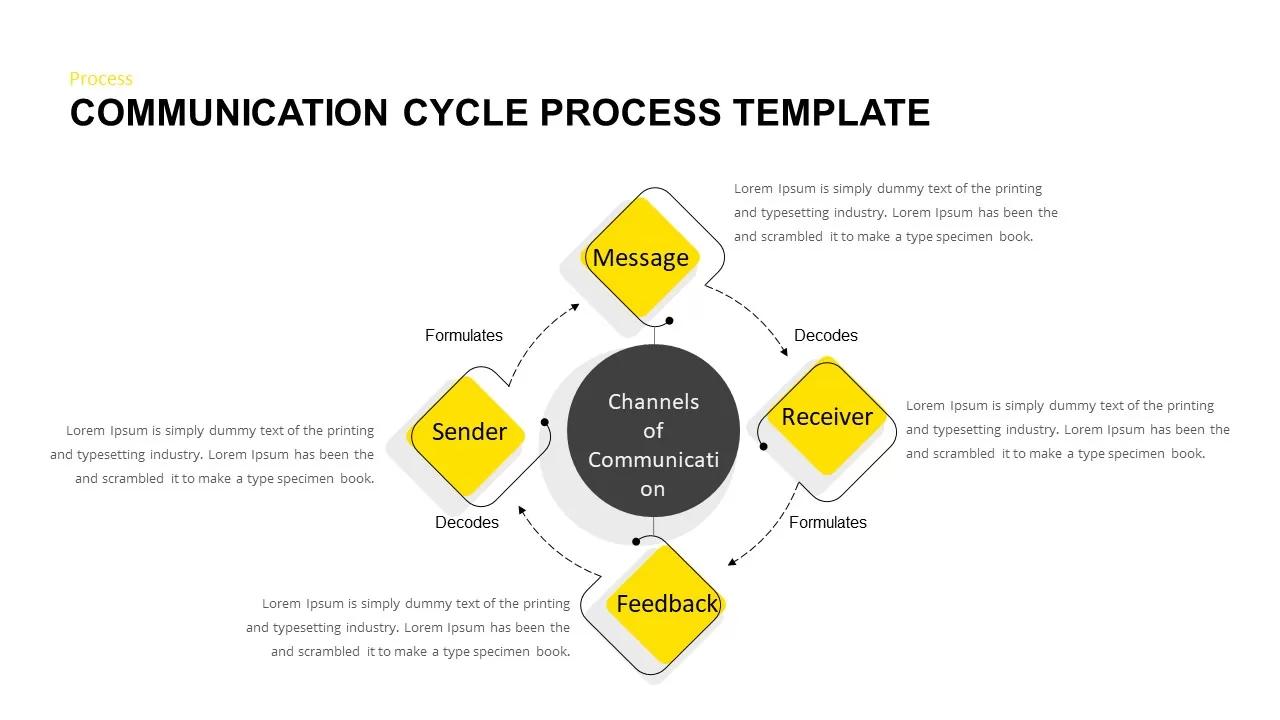
Communication Cycle Process Diagram template for PowerPoint & Google Slides
Business
Concentric Circular Arrow Cycle Diagram Template for PowerPoint & Google Slides
Process
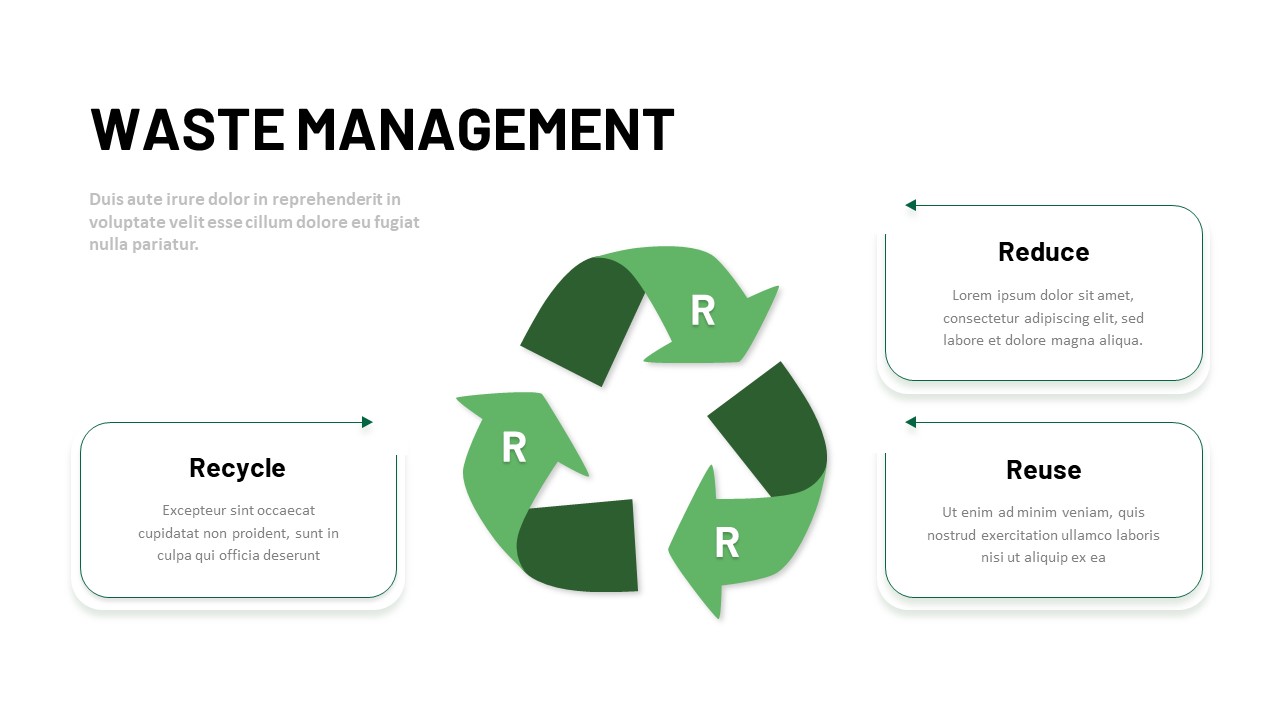
3R Waste Management Cycle Diagram Template for PowerPoint & Google Slides
Circular
Release Management Cycle Circular Diagram Template for PowerPoint & Google Slides
Software Development
Business Process Analysis Cycle Diagram Template for PowerPoint & Google Slides
Business Strategy
Free Time Management Clock Cycle Diagram Template for PowerPoint & Google Slides
Process
Free
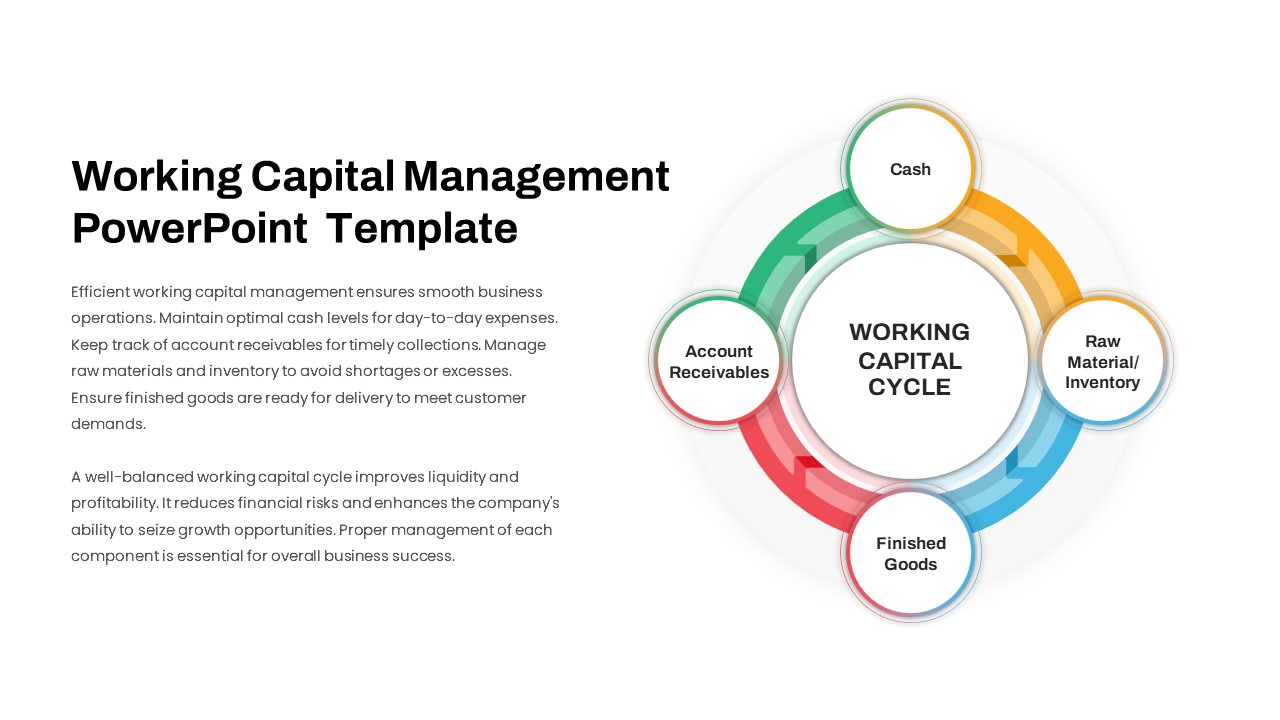
Working Capital Cycle Diagram Template for PowerPoint & Google Slides
Circular
Gartner Hype Cycle Adoption Curve Diagram Template for PowerPoint & Google Slides
Infographics
Colorful Startup Financing Cycle Diagram Template for PowerPoint & Google Slides
Finance
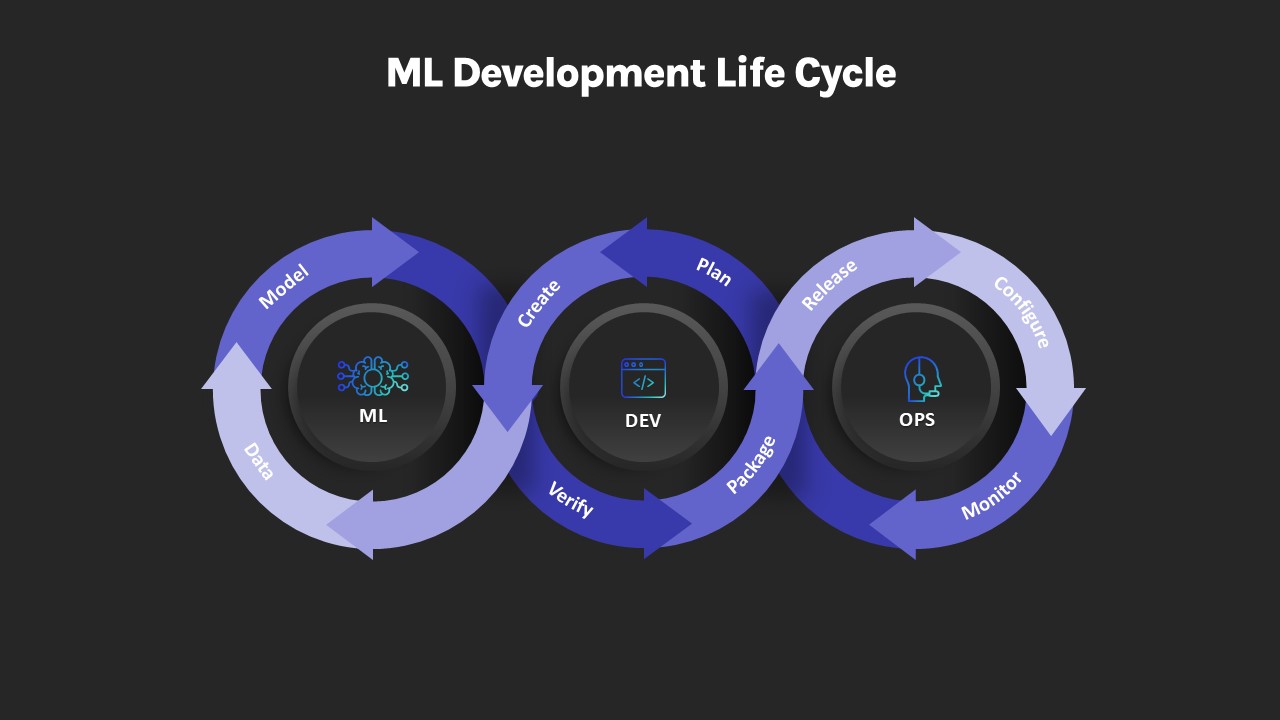
ML Development Life Cycle Diagram Template for PowerPoint & Google Slides
Machine Learning
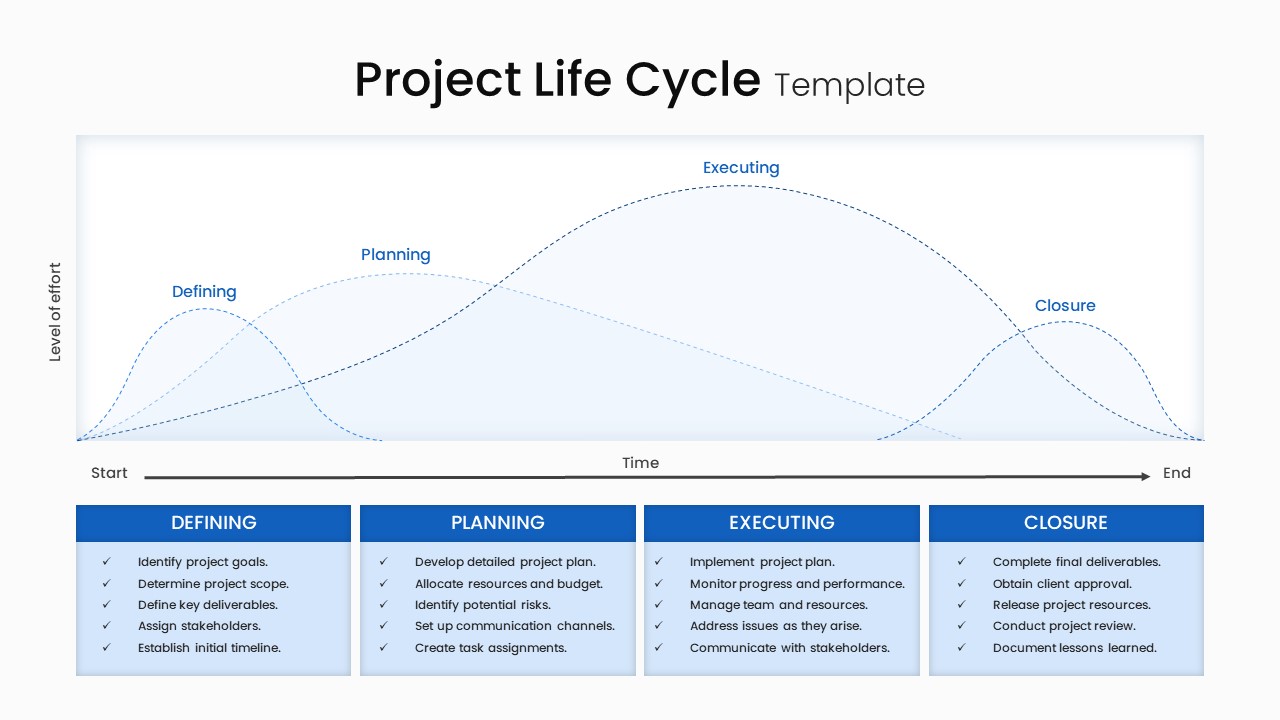
Project Life Cycle Workflow Diagram Template for PowerPoint & Google Slides
Process
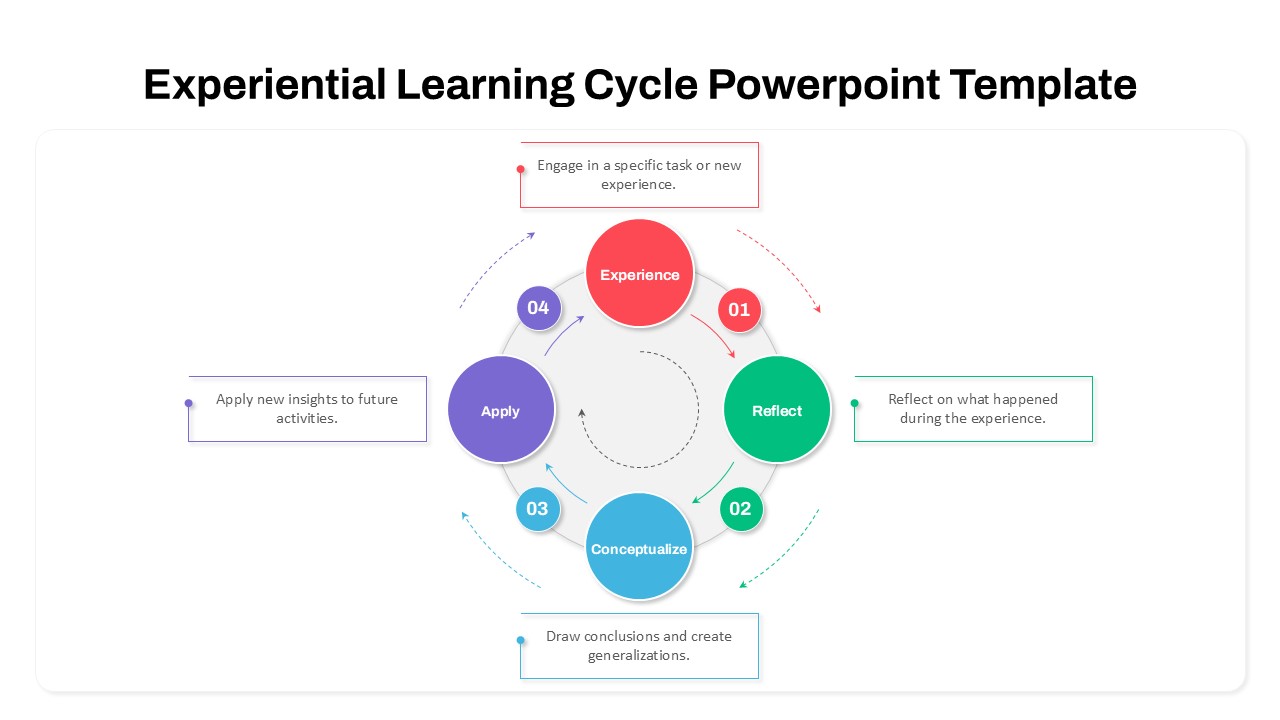
Experiential Learning Cycle Diagram Template for PowerPoint & Google Slides
Circular
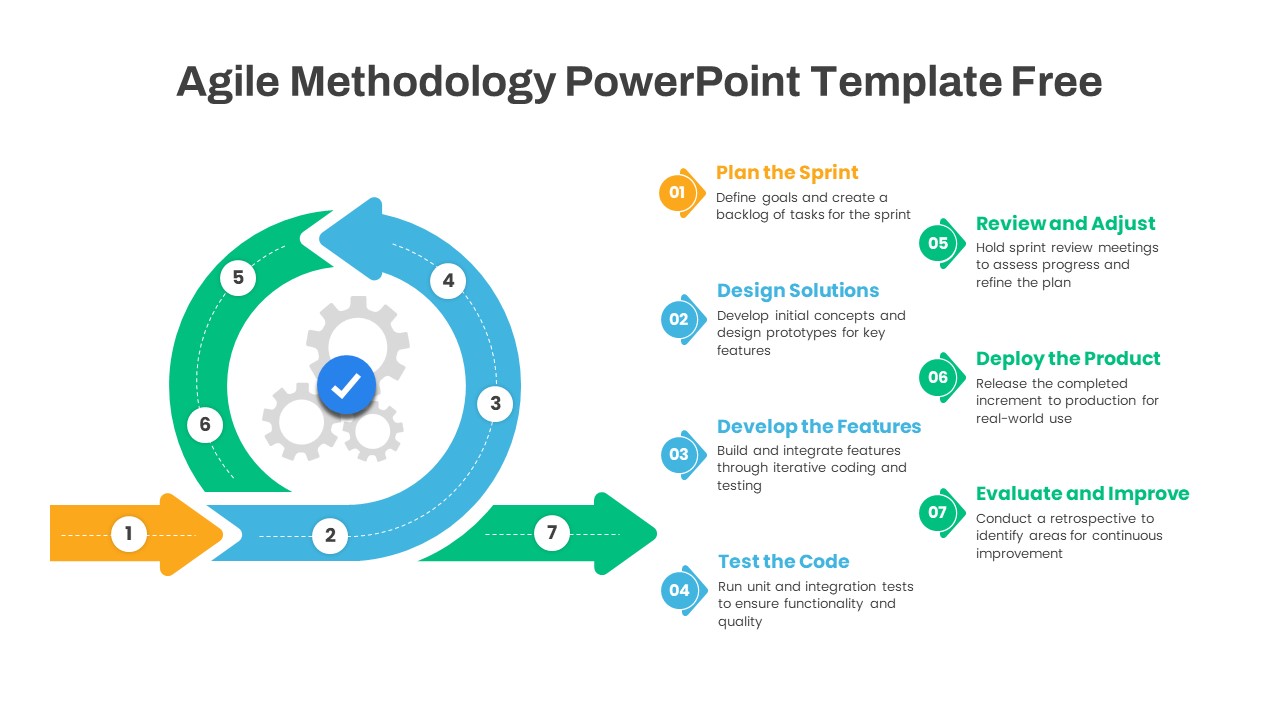
Agile Methodology Cycle Diagram Template for PowerPoint & Google Slides
Project
Free
Change Management Process Cycle Diagram Template for PowerPoint & Google Slides
Process
Flywheel Growth Cycle Diagram Template for PowerPoint & Google Slides
Circular
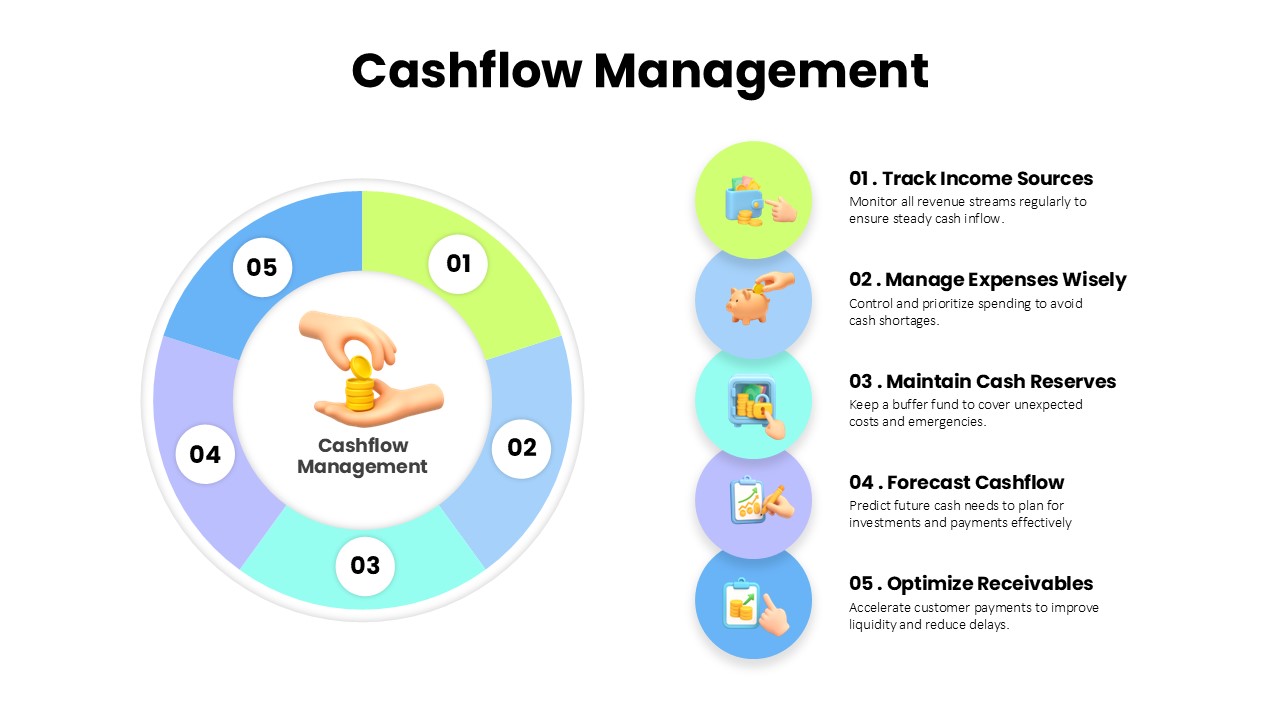
Cashflow Management Cycle Diagram Template for PowerPoint & Google Slides
Finance
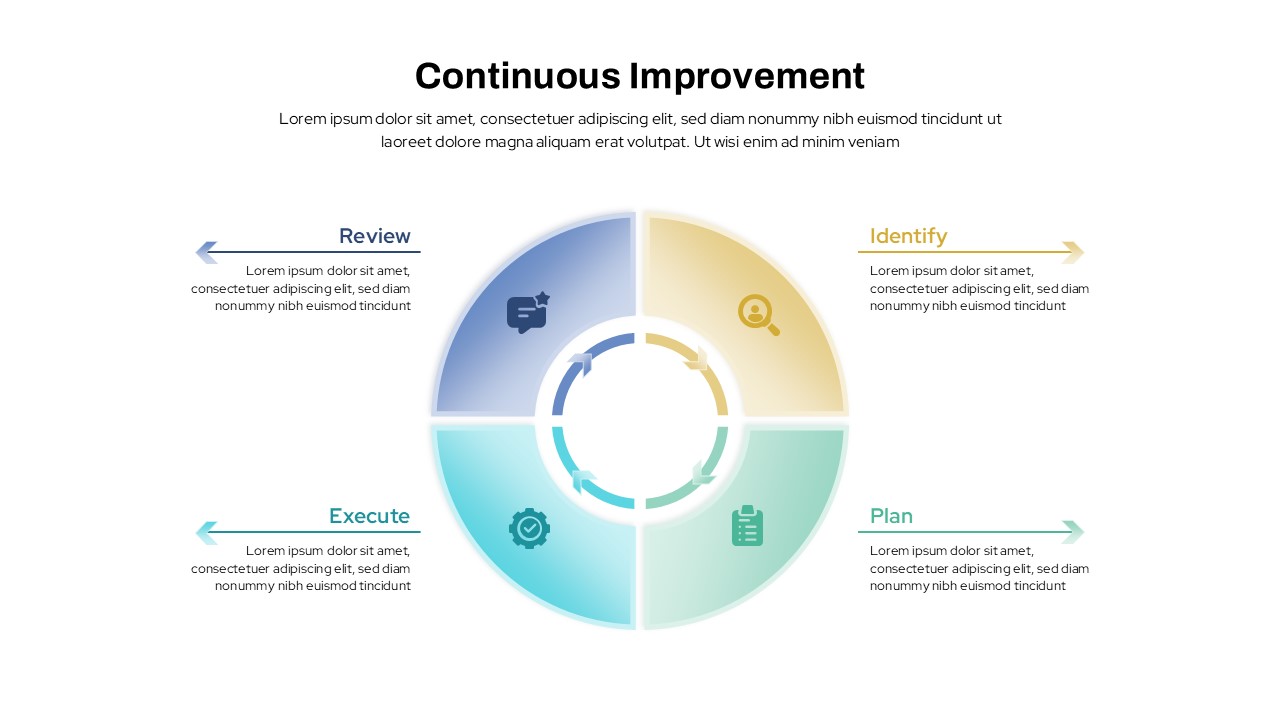
Continuous Improvement Cycle Diagram Template for PowerPoint & Google Slides
Process