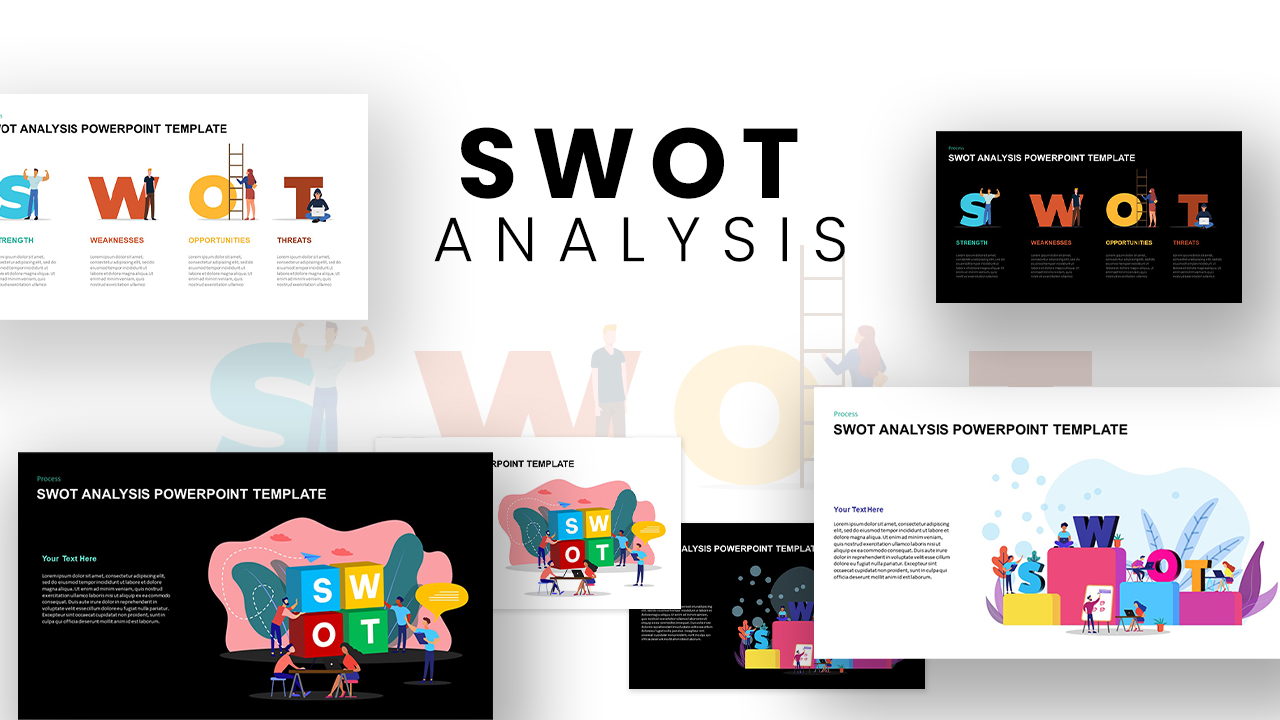
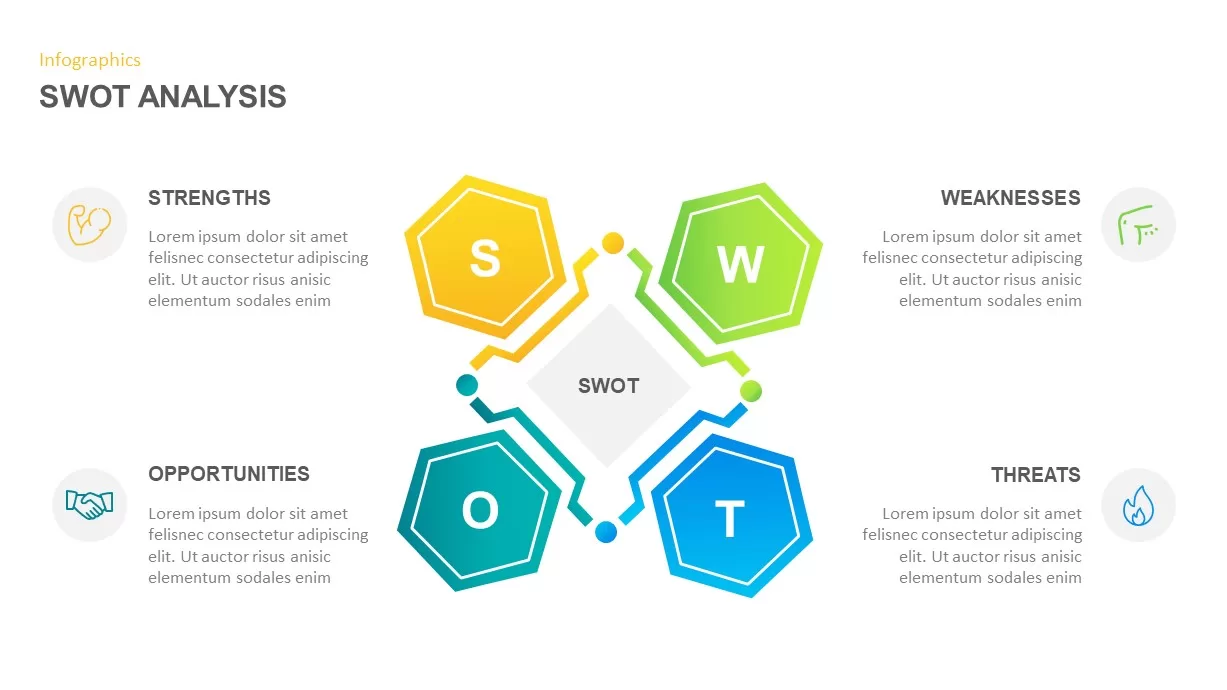
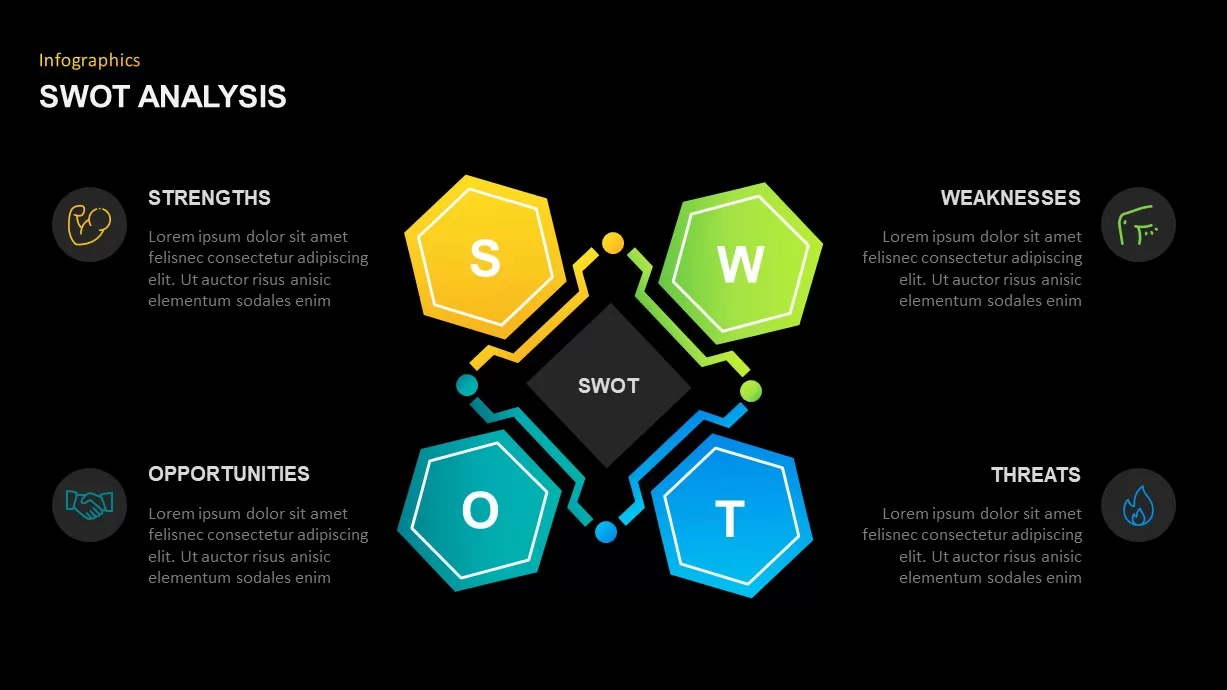
SWOT Analysis Infographic Diagram Template for PowerPoint & Google Slides
Description
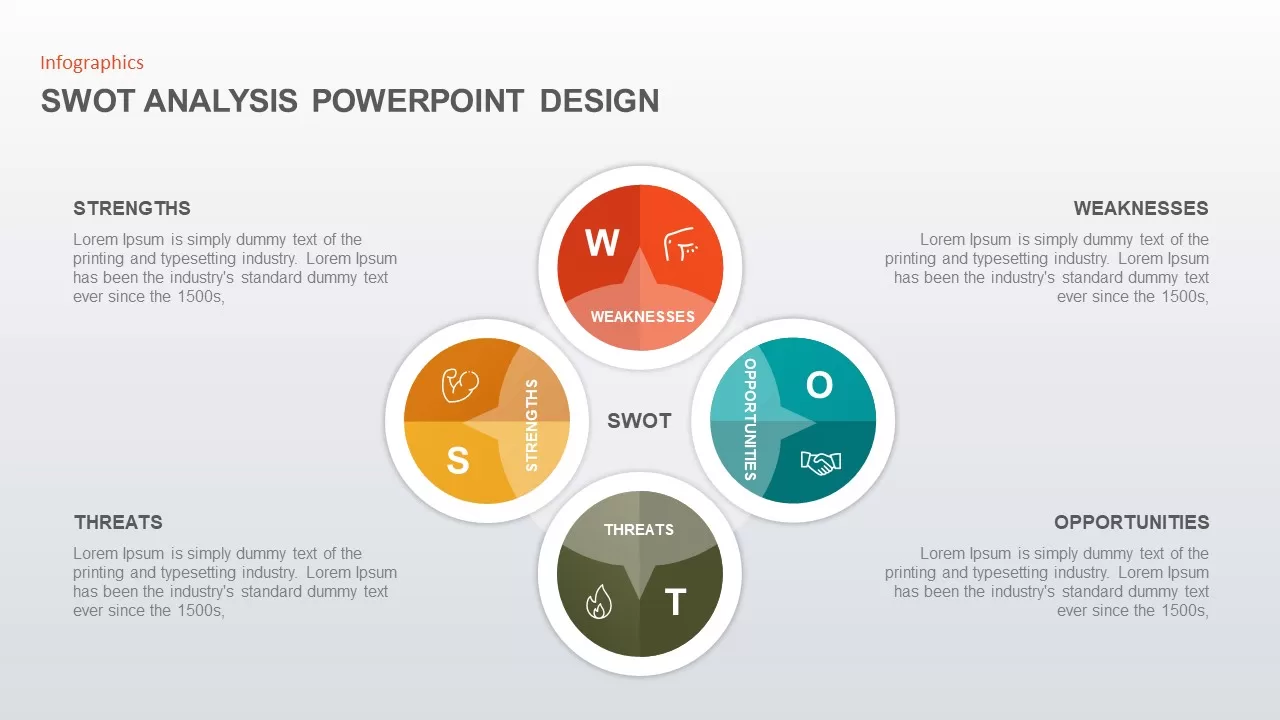
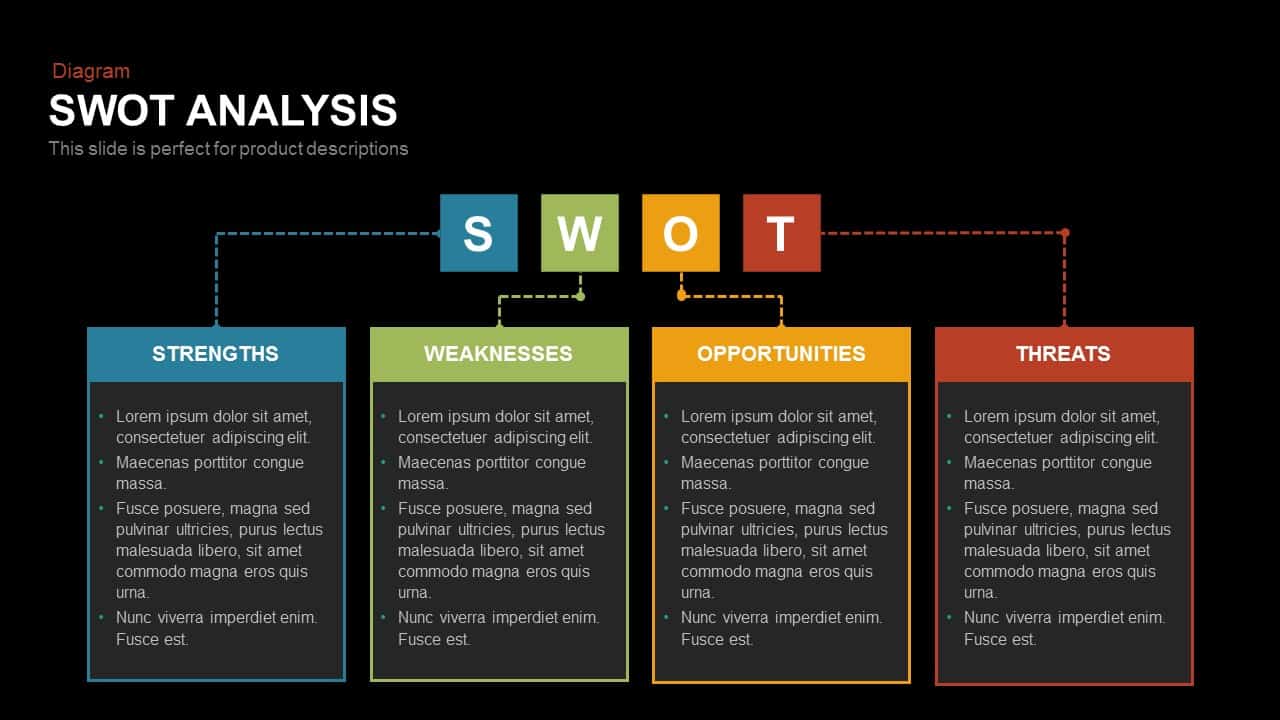
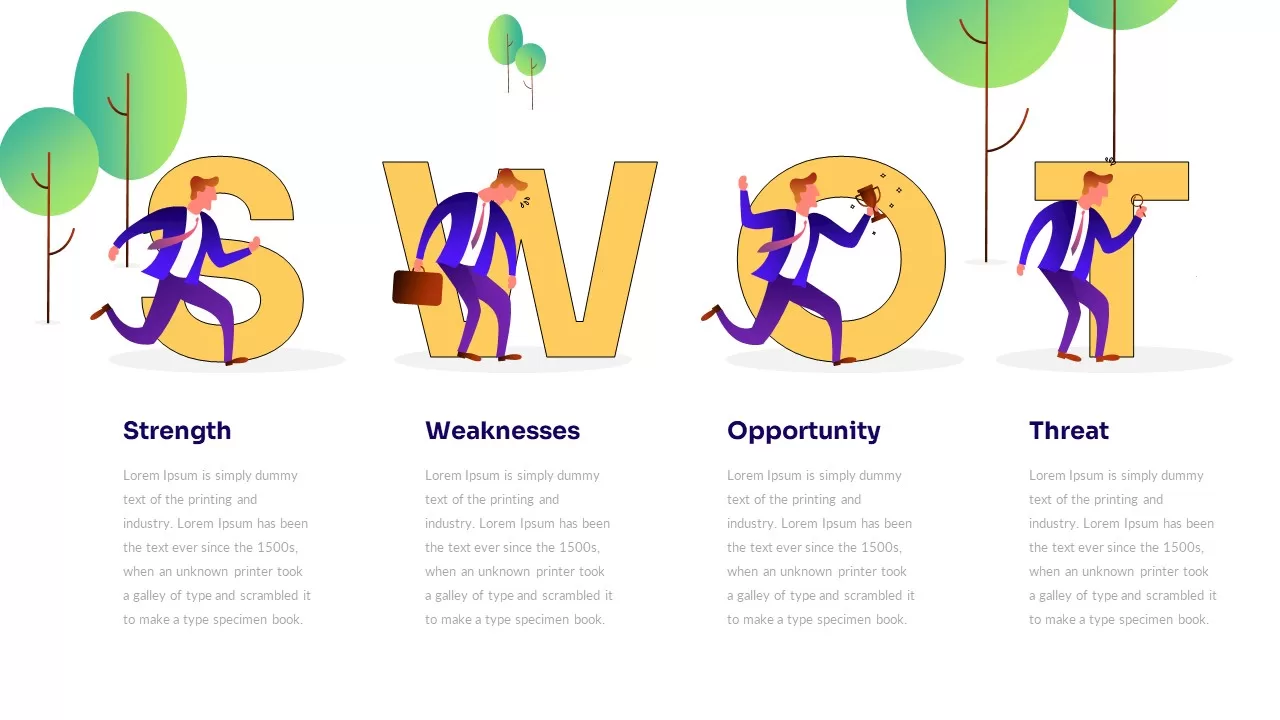
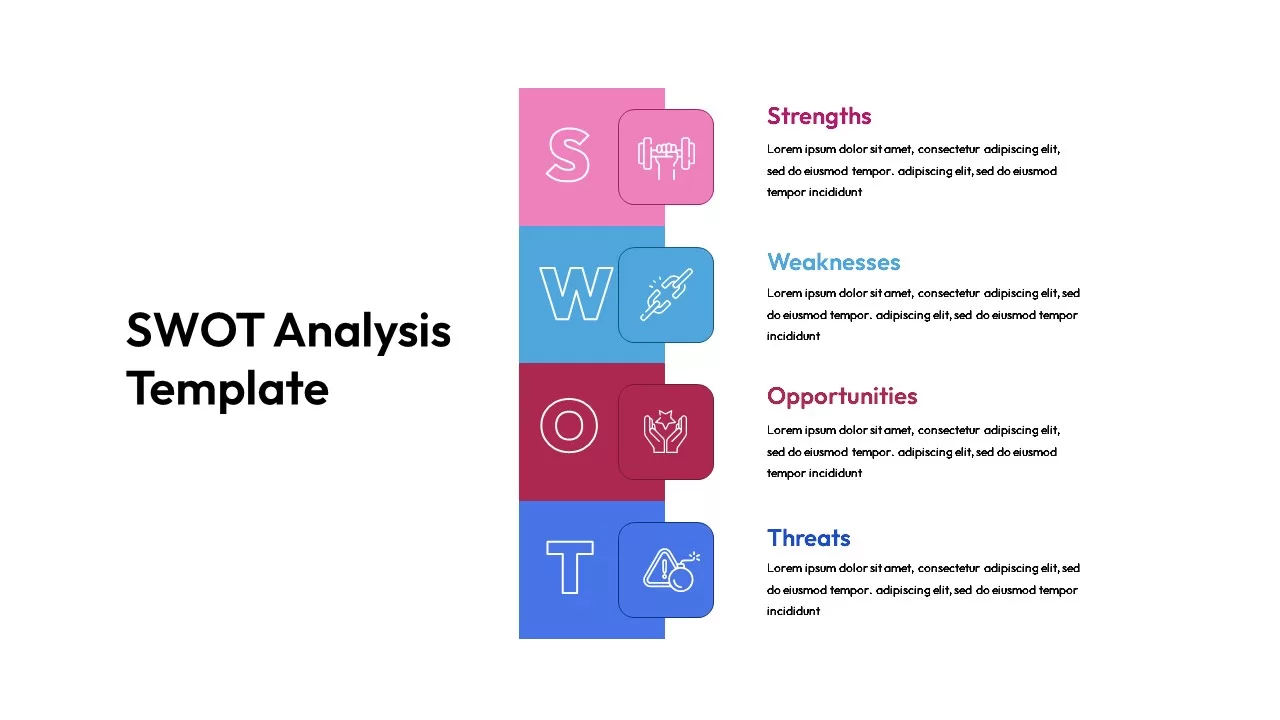
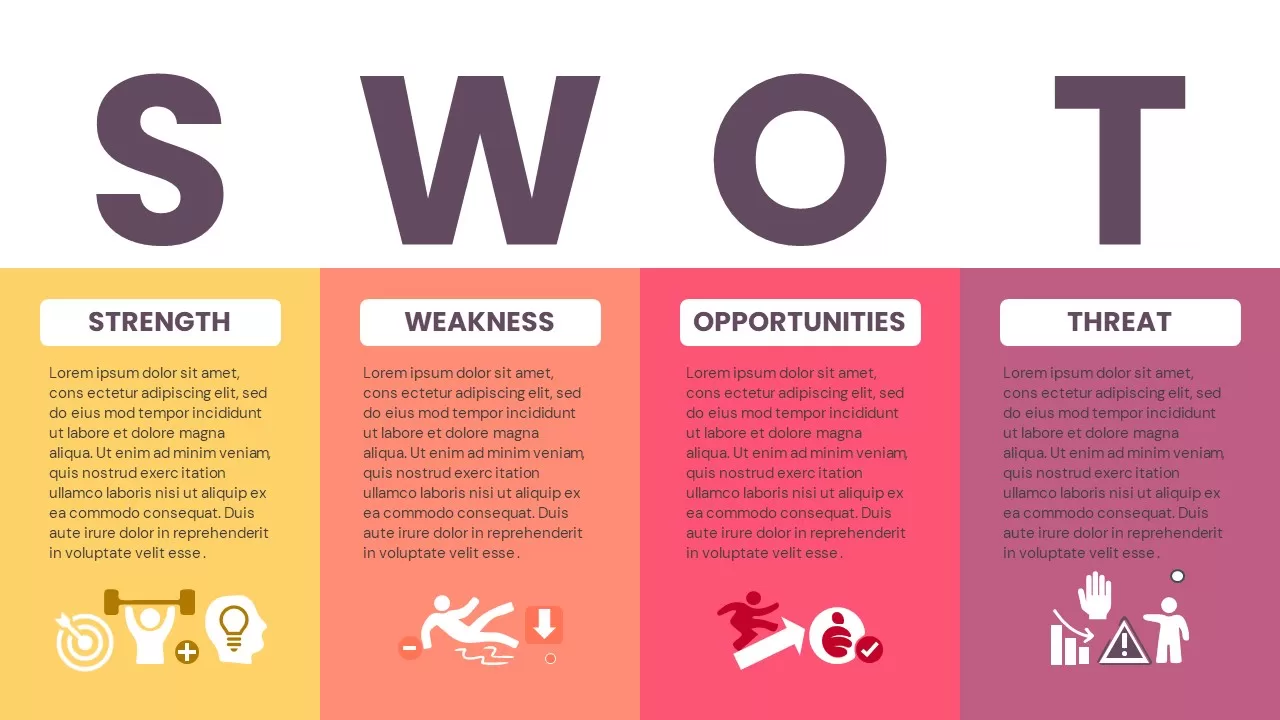
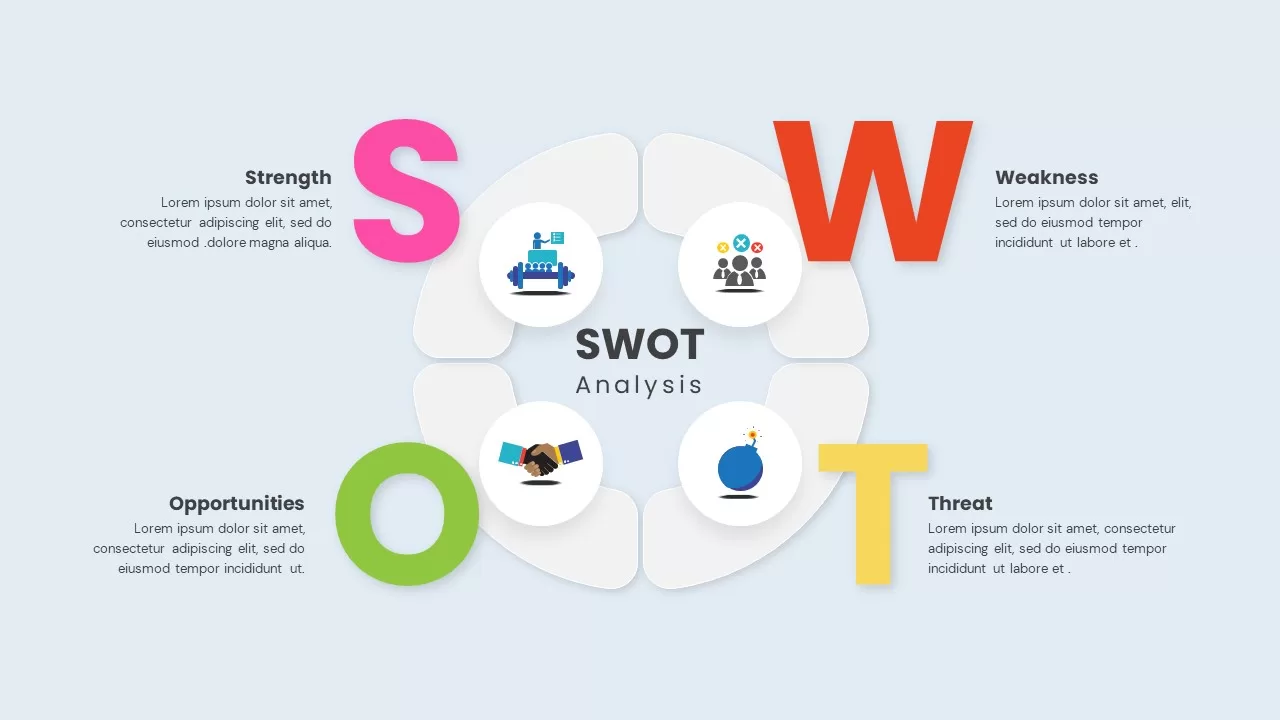
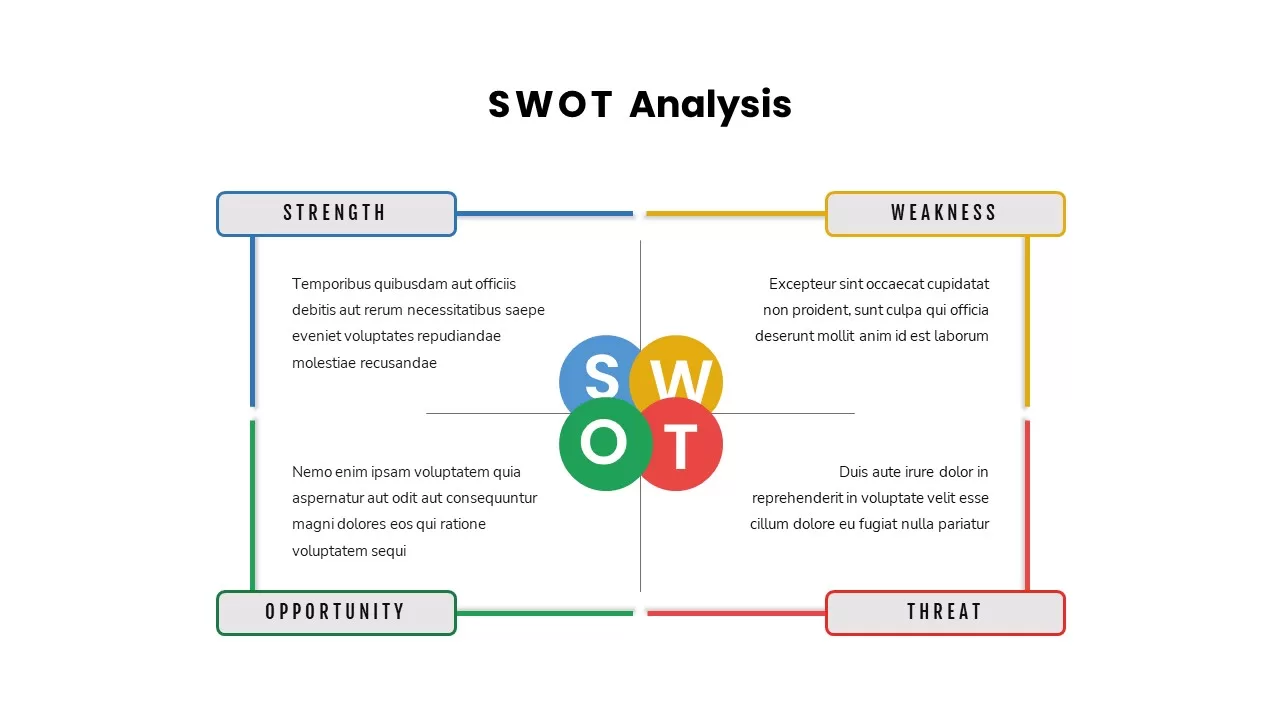
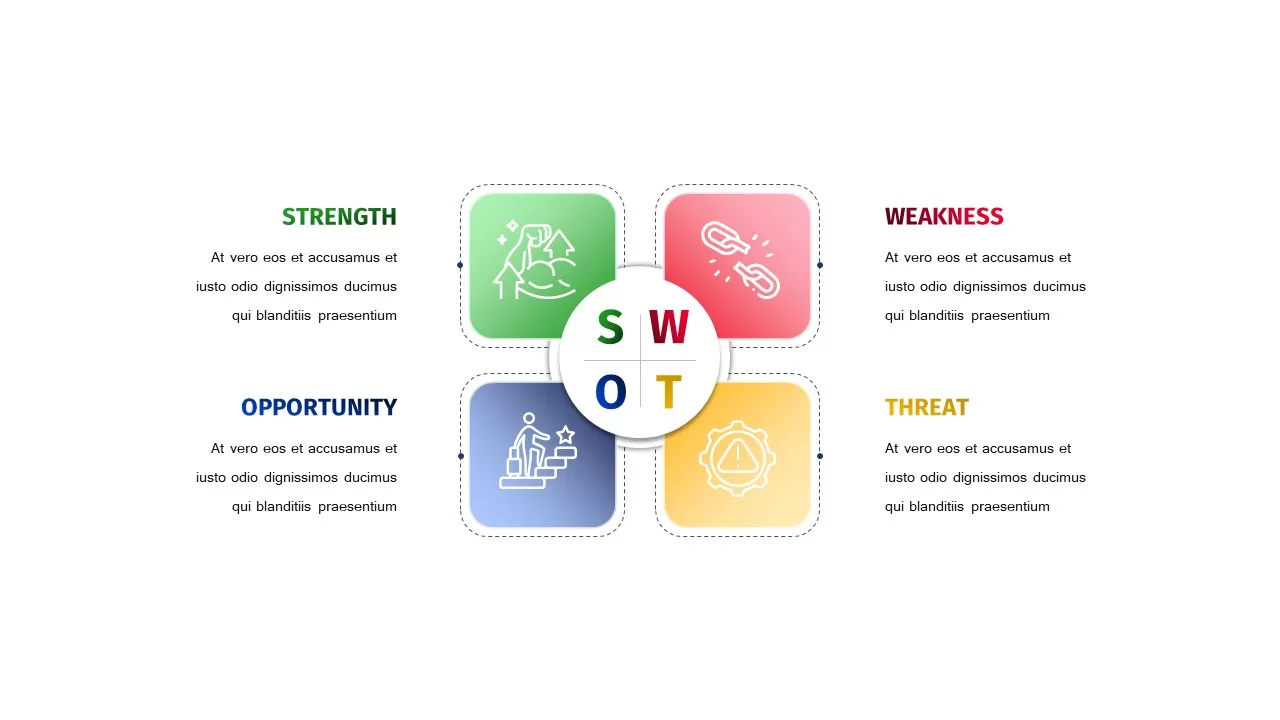
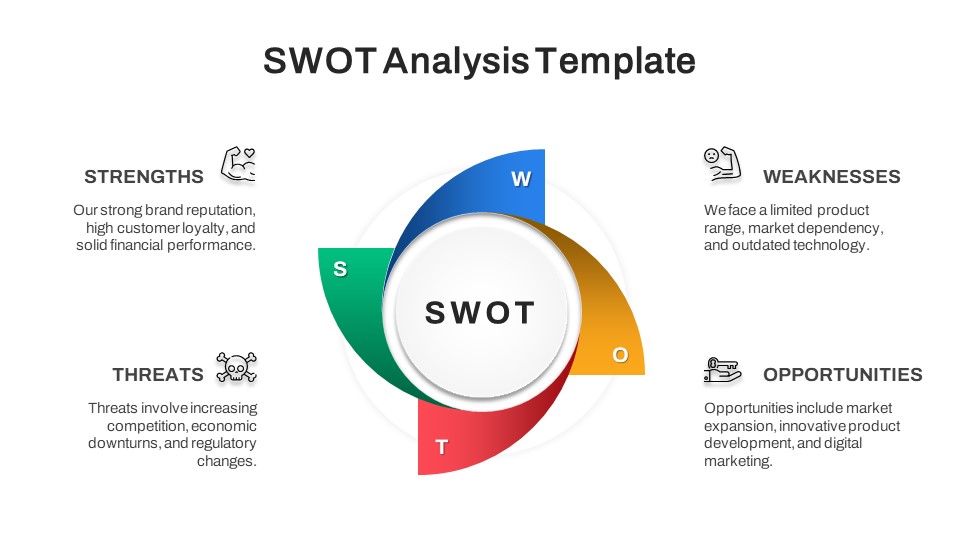
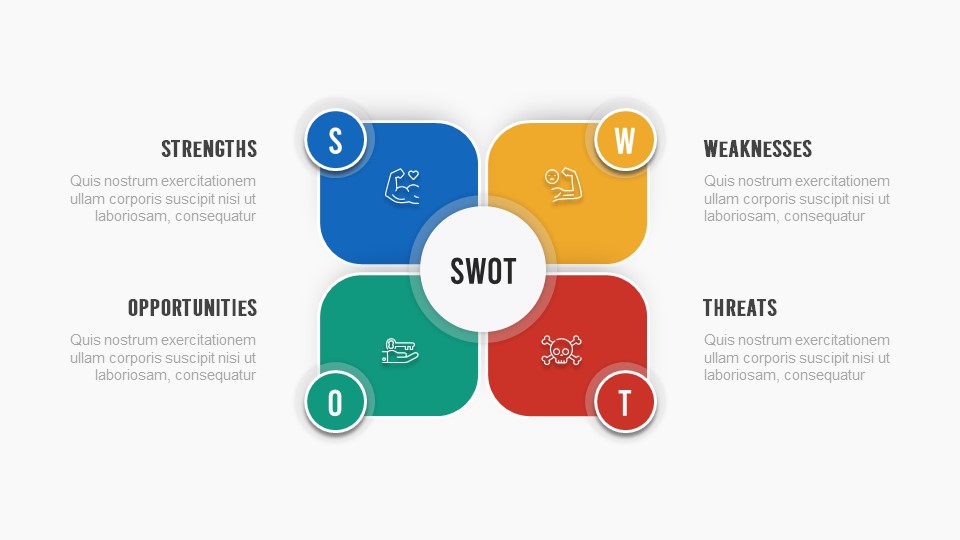
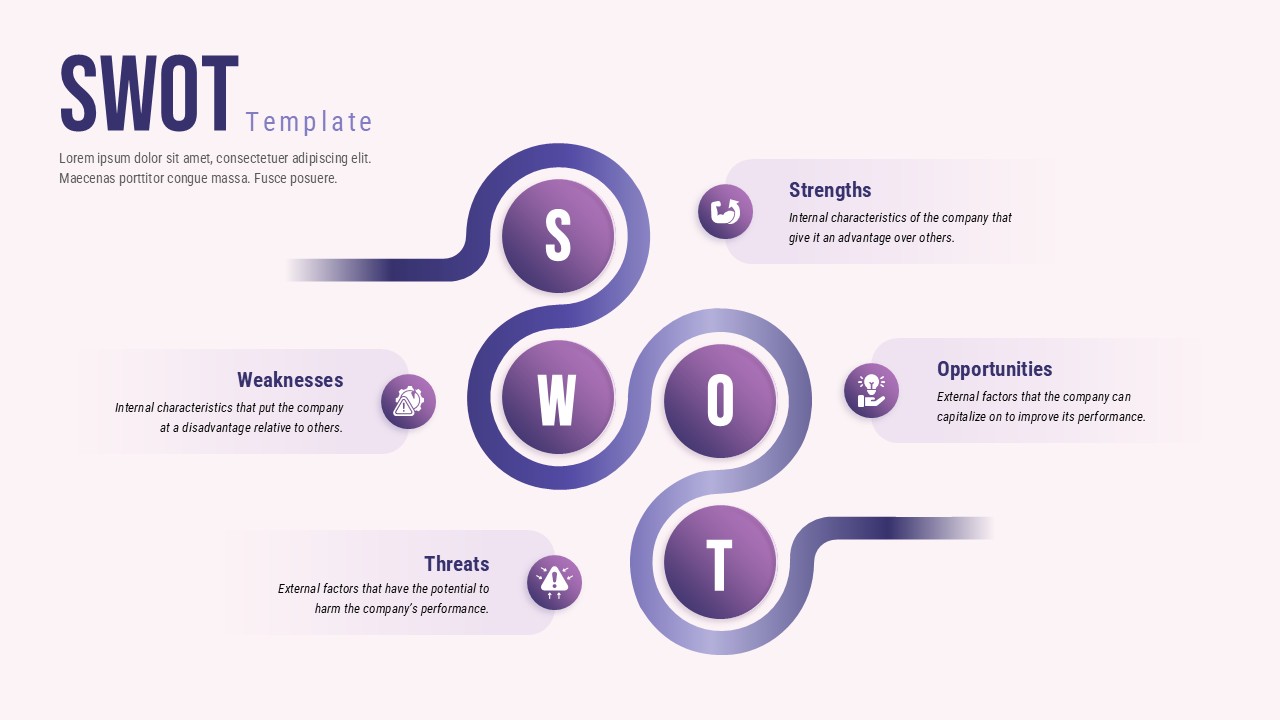
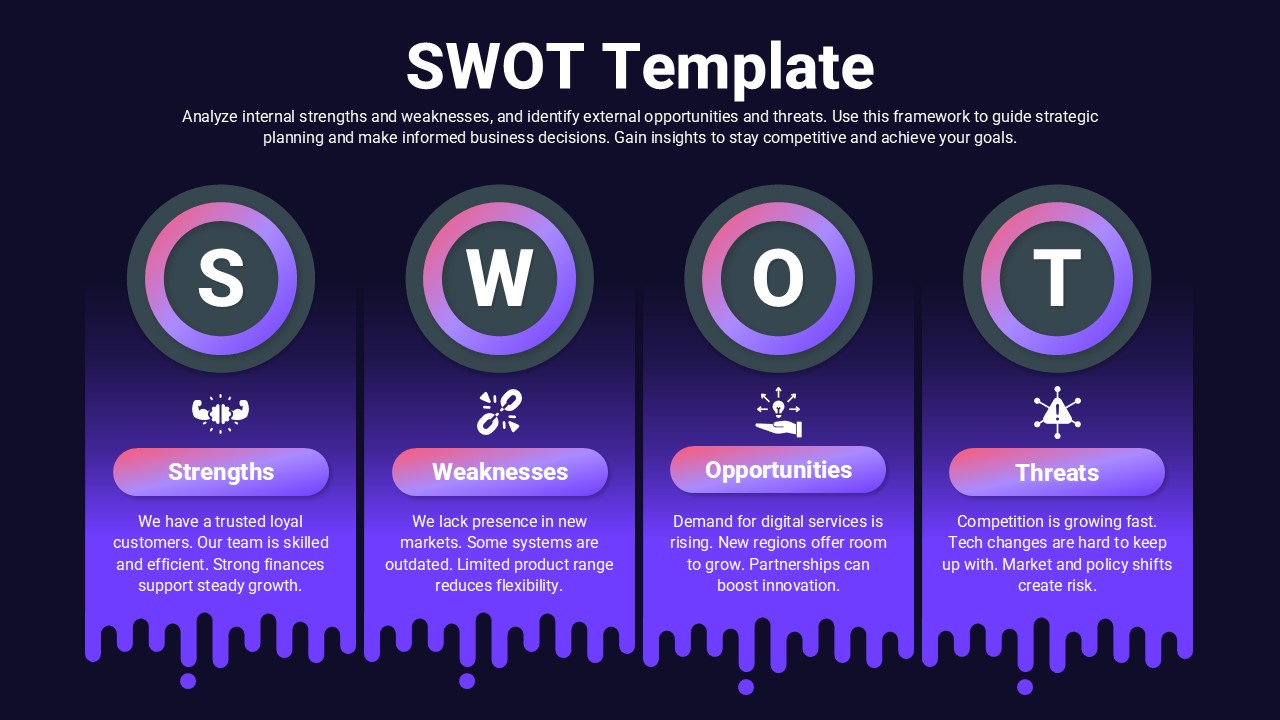
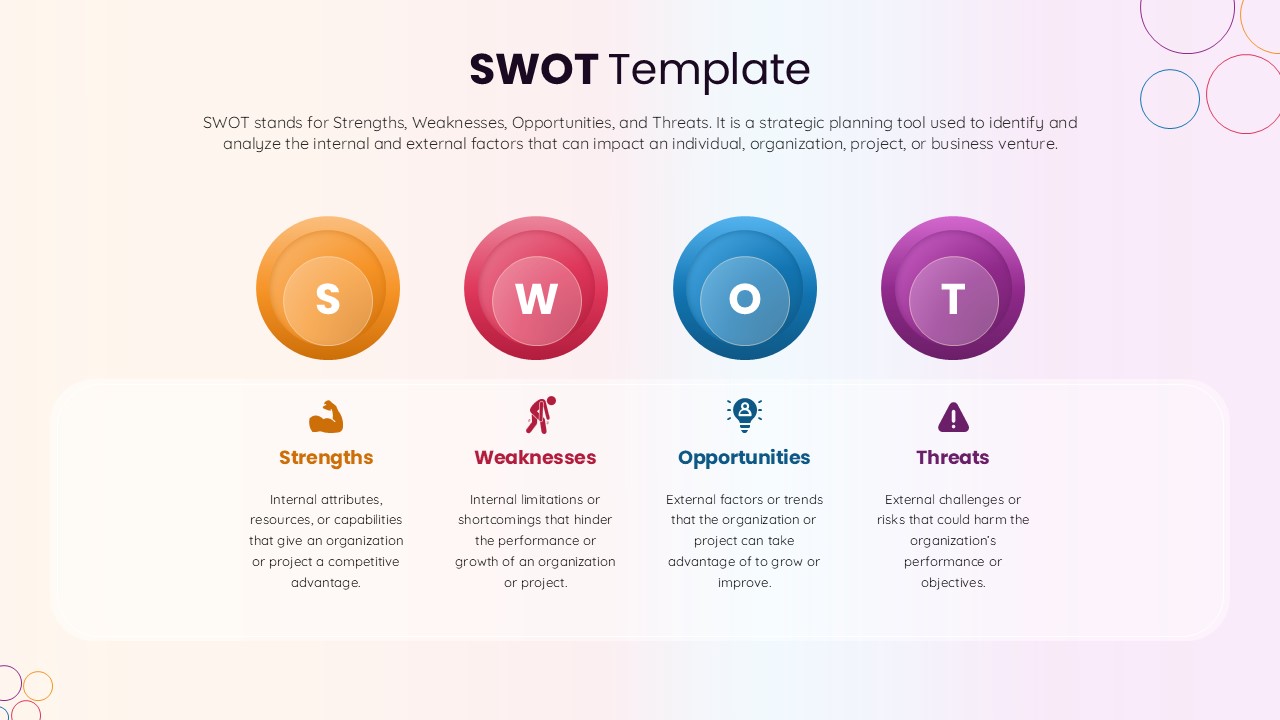
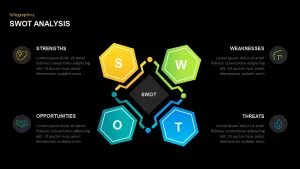
Deliver a compelling SWOT analysis with this four-part infographic diagram slide, engineered to convey strategic insights with visual impact. At the core, a diamond-shaped “SWOT” label anchors four pentagonal segments that extend outward in rich yellow (Strengths), vibrant green (Weaknesses), teal (Opportunities), and blue (Threats). Each segment displays a clear letter and icon placeholder, allowing quick substitution with industry-specific symbols—from muscle-arm illustrations to handshake graphics—enhancing audience comprehension. Flying connectors and subtle drop shadows impart depth and motion, guiding viewers fluidly through the interrelated quadrants.
Built on PowerPoint and Google Slides master layouts, this template is fully editable and optimized for seamless customization. Modify segment colors with a single click, replace icons or letters, and adjust shape dimensions to emphasize priority areas. Paired sidebars on each side accommodate detailed bullet points, data callouts, or commentary, maintaining slide balance and readability. Preconfigured font styles ensure consistency, while scalable vector graphics preserve crispness on any screen or projector.
Designed for versatility, this infographic effortlessly adapts to a variety of contexts. Use it in executive briefings to outline competitive positioning, workshop sessions to facilitate collaborative SWOT exercises, investor reports to illustrate market evaluations, or training seminars to highlight organizational assessments. The design also works as a framework for other four-category analyses—like risk–impact matrices, product feature comparisons, or customer segmentation frameworks—by simply renaming segment titles.
Save time and maintain brand cohesion across presentations by leveraging the template’s master slides and customizable theme colors. Whether preparing high-impact boardroom decks, marketing plans, or academic lectures, this SWOT infographics template delivers clarity, flexibility, and professional polish in record time.
Who is it for
Business leaders, marketing strategists, consultants, and project managers will benefit from this SWOT infographic when evaluating organizational strengths, weaknesses, opportunities, and threats. Strategy teams, risk analysts, and executive presenters can also use the slide to facilitate workshops, board presentations, and collaborative planning sessions.
Other Uses
Beyond traditional SWOT assessments, repurpose this diagram for risk–impact matrices, product feature comparisons, audience segmentation, or balanced scorecard visualizations—simply update the segment titles to match any four-part framework.
Login to download this file

Item ID
SB01667
Related Templates

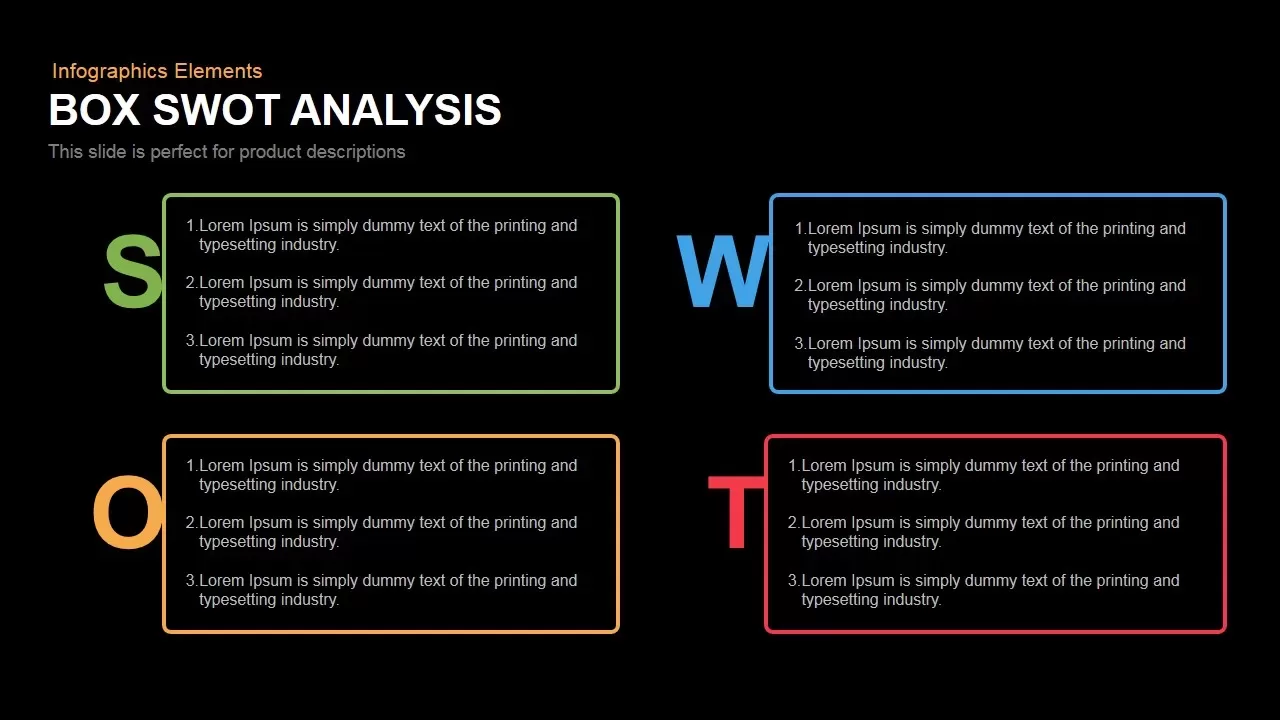
Box SWOT Analysis Infographic Template for PowerPoint & Google Slides
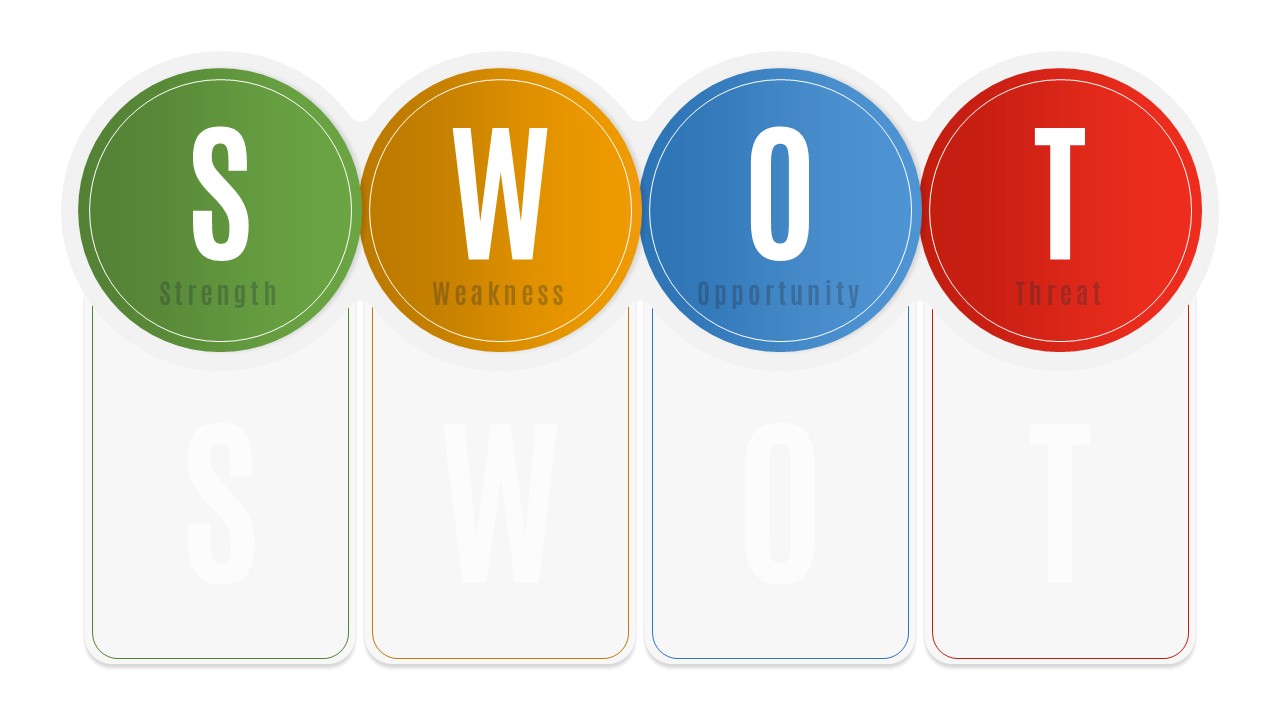
SWOT
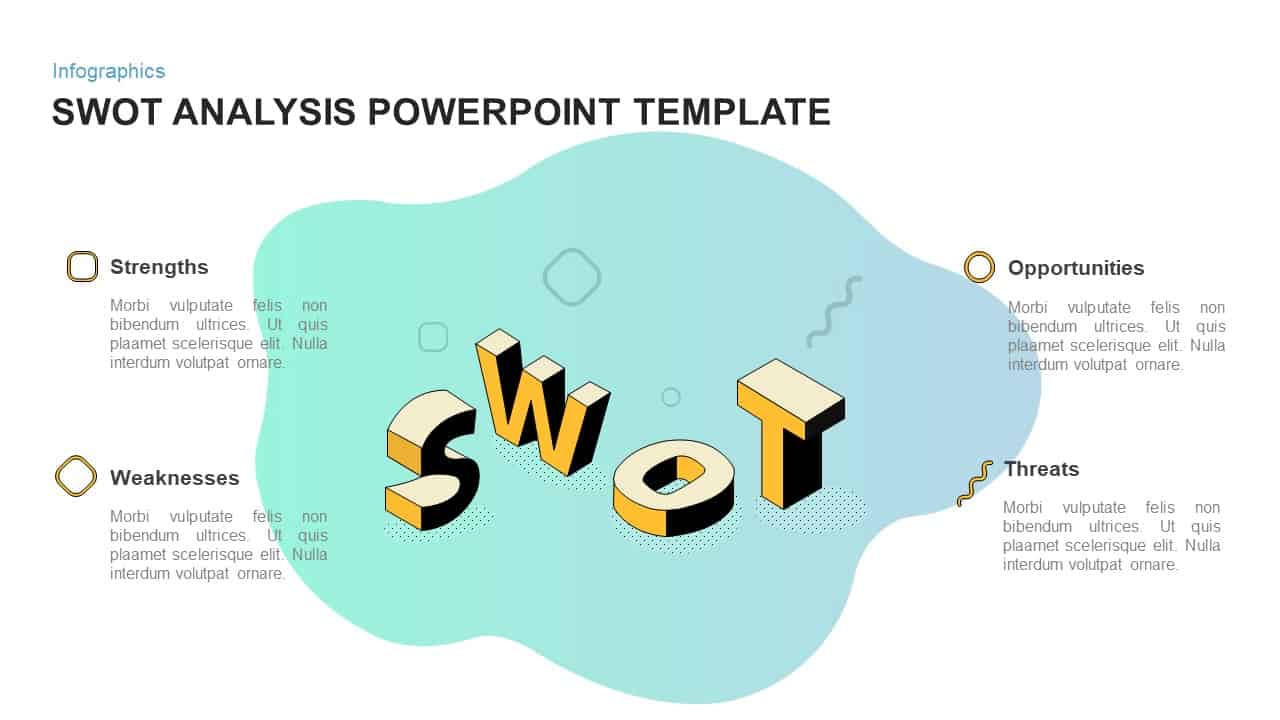
3D Blob SWOT Analysis Infographic Template for PowerPoint & Google Slides
SWOT
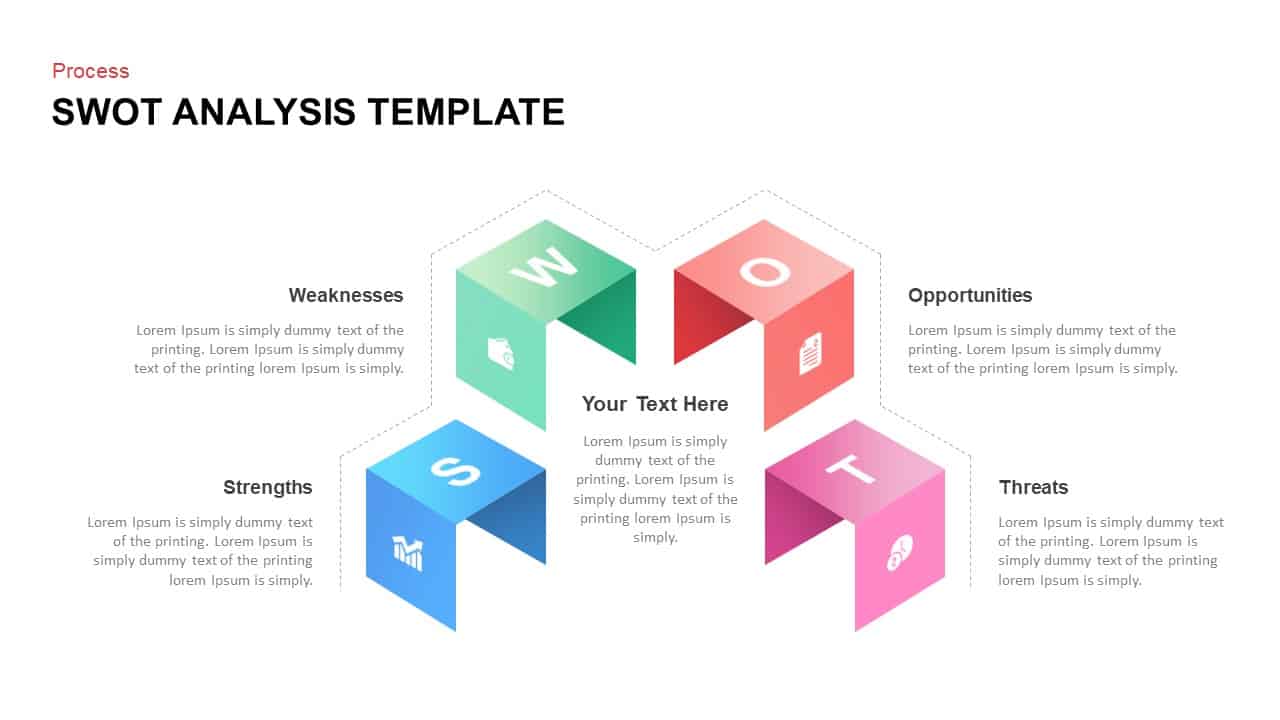
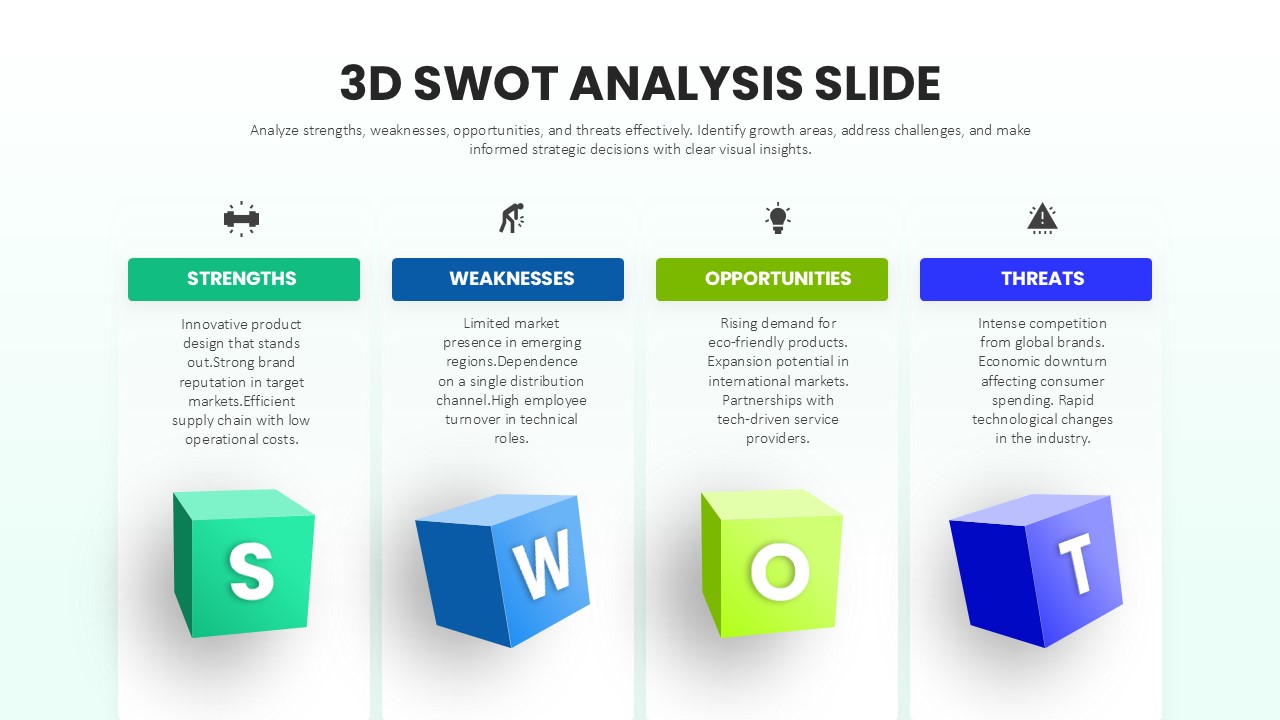
3D Cube SWOT Analysis Infographic Template for PowerPoint & Google Slides
SWOT

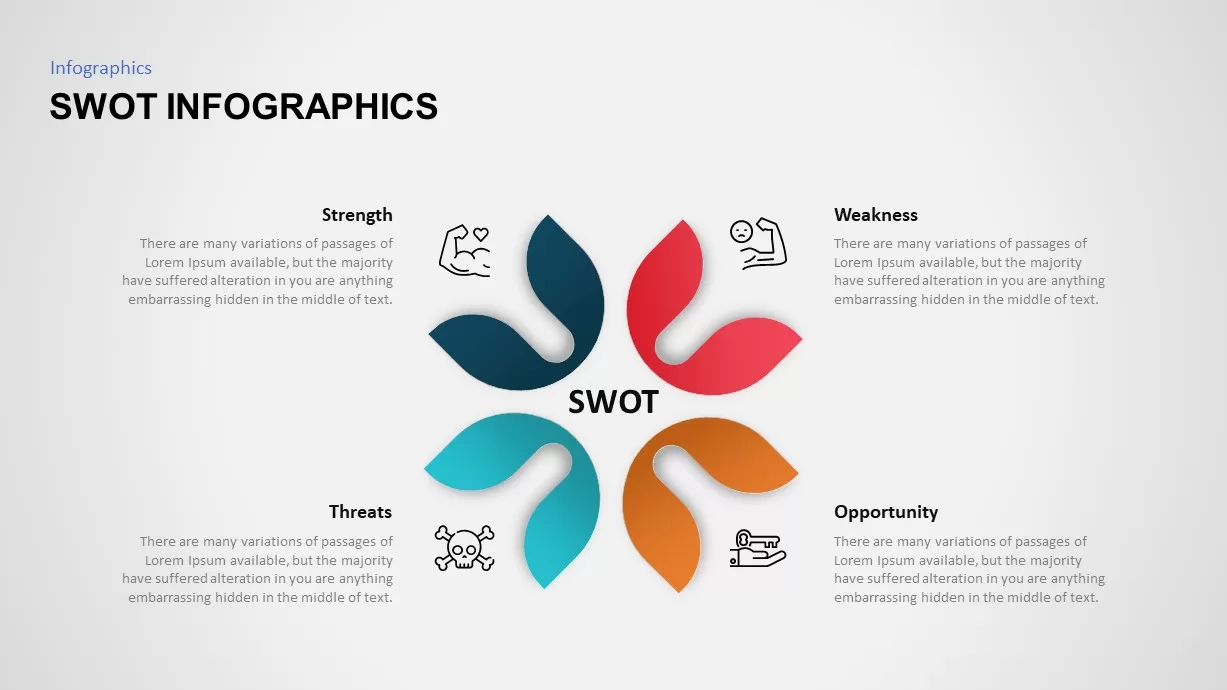
SWOT Analysis Petal Infographic Template for PowerPoint & Google Slides
SWOT
SWOT Analysis Circular Infographic Template for PowerPoint & Google Slides
SWOT
SWOT Analysis Grid Infographic Template for PowerPoint & Google Slides
SWOT
Circular SWOT Analysis Infographic Template for PowerPoint & Google Slides
SWOT
SWOT Analysis Infographic with Circular Icons Template for PowerPoint & Google Slides
SWOT
Orange SWOT Analysis Infographic Template for PowerPoint & Google Slides
SWOT
SWOT Analysis Infographic Slide for PowerPoint & Google Slides
SWOT
Modern Circle SWOT Analysis Diagram Template for PowerPoint & Google Slides
SWOT
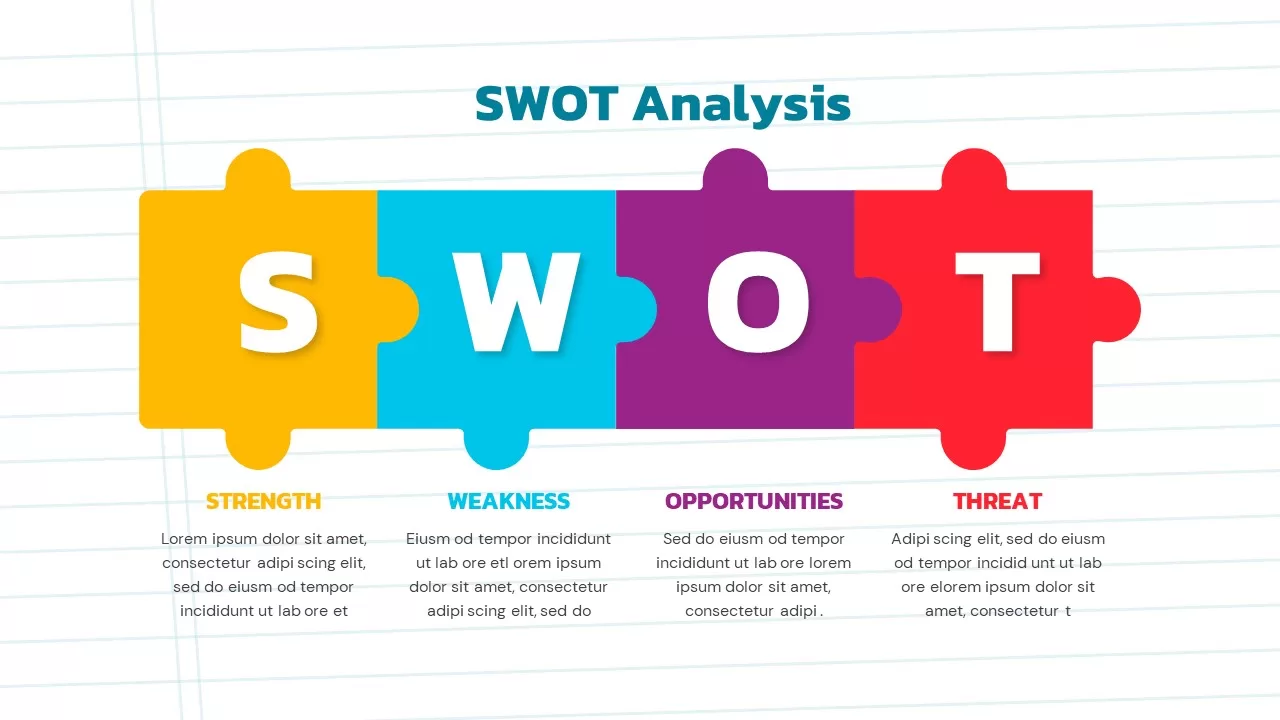
Puzzle-Style SWOT Analysis Table Diagram Template for PowerPoint & Google Slides
SWOT
SWOT Analysis Gear Diagram Slide Template for PowerPoint & Google Slides
SWOT
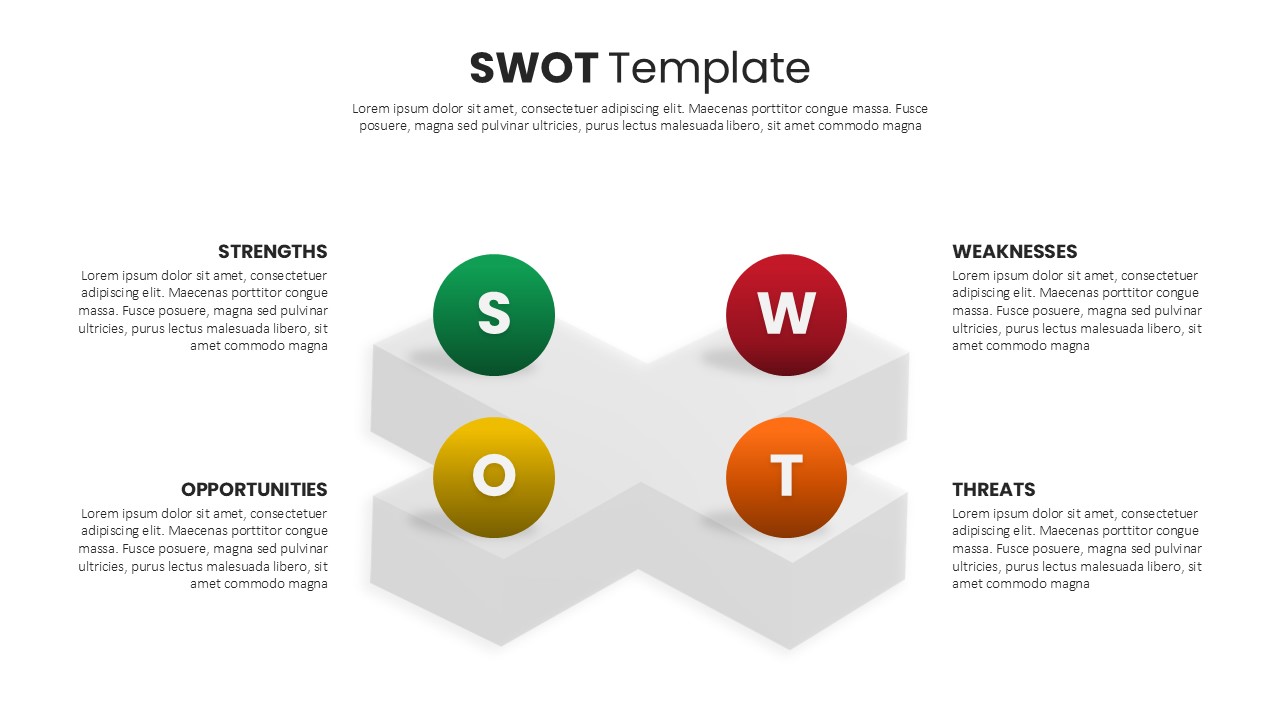
Four-Quadrant SWOT Analysis Diagram Template for PowerPoint & Google Slides
SWOT
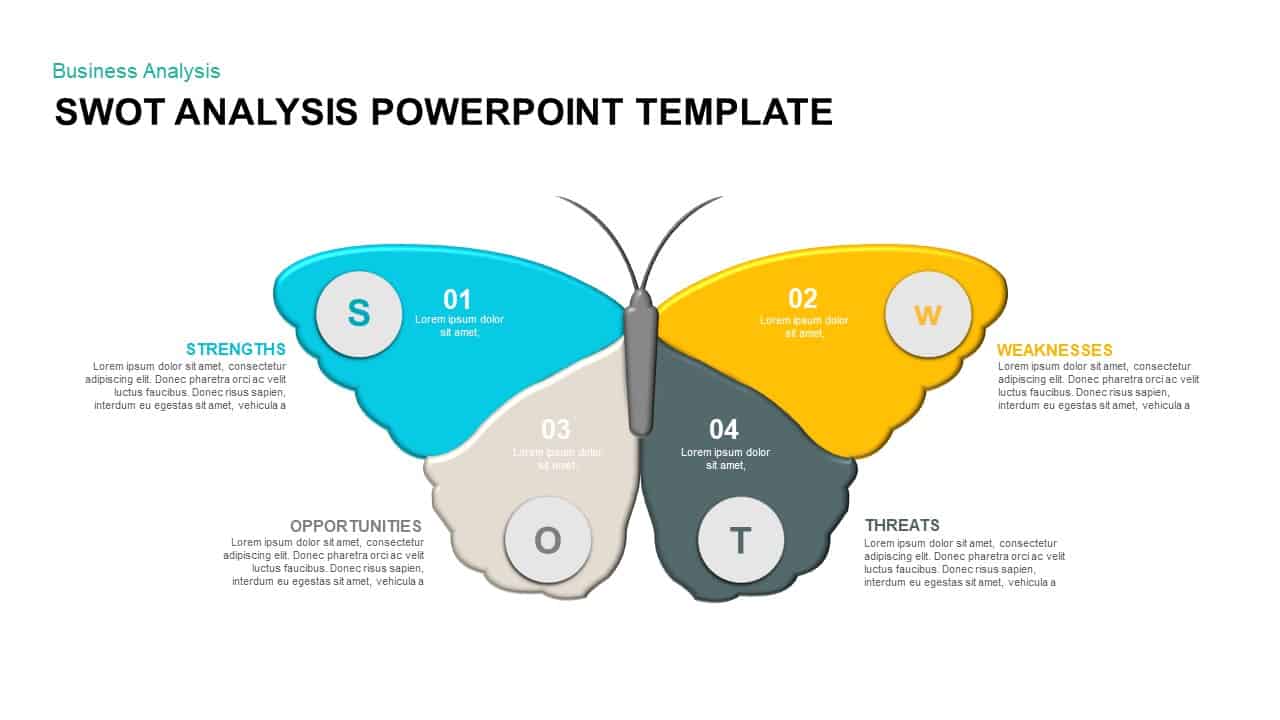
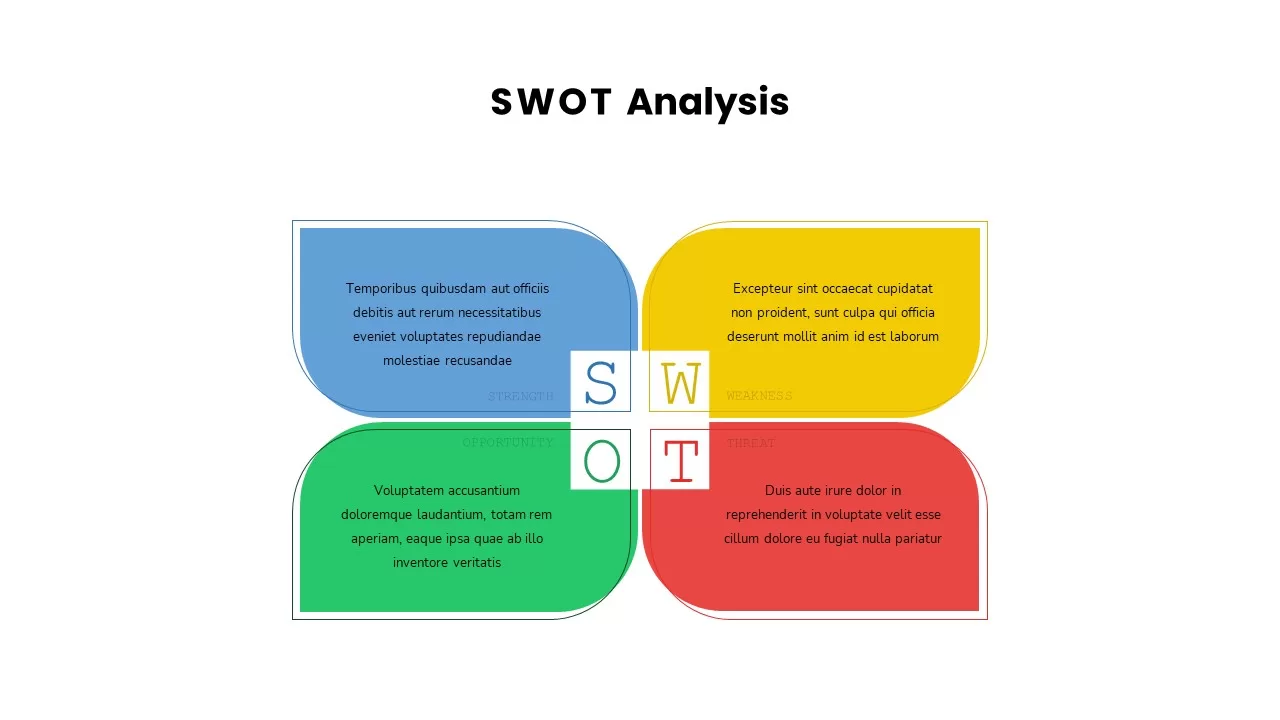
Butterfly SWOT Analysis Diagram Template for PowerPoint & Google Slides
SWOT
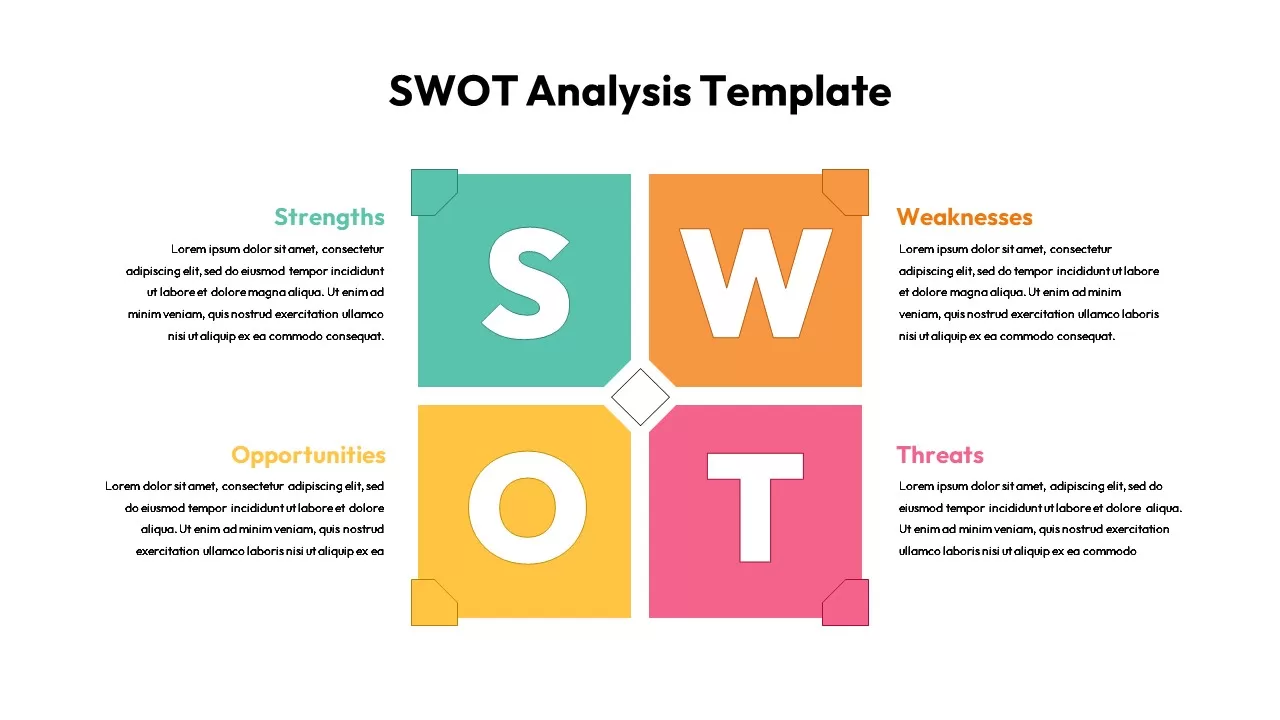
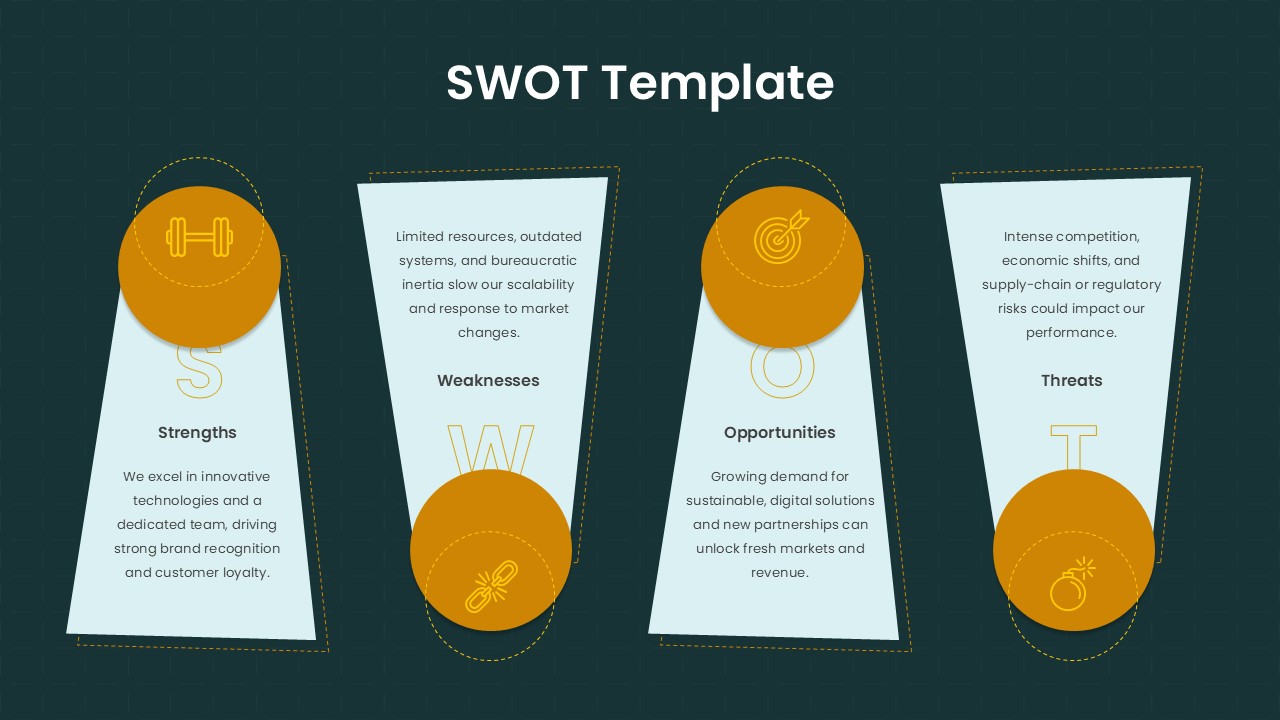
Four-Part SWOT Analysis Diagram Template for PowerPoint & Google Slides
SWOT
Puzzle Piece SWOT Analysis Diagram Template for PowerPoint & Google Slides
Opportunities Challenges

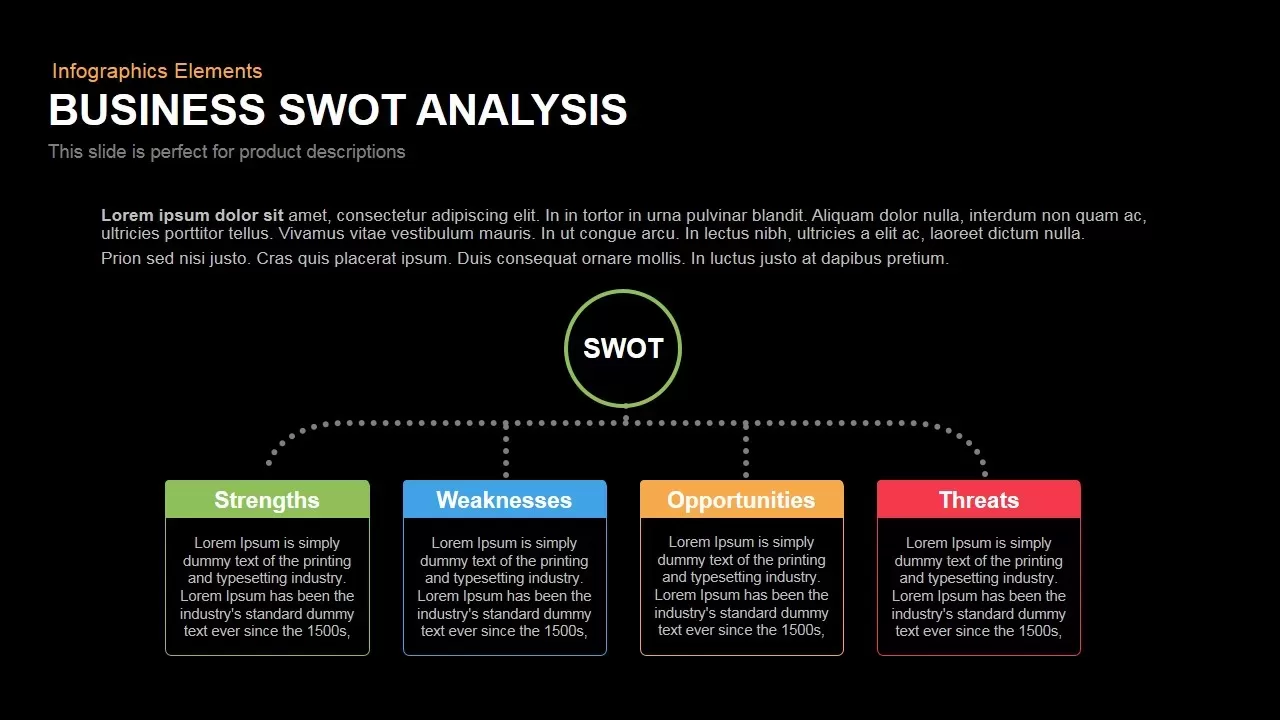
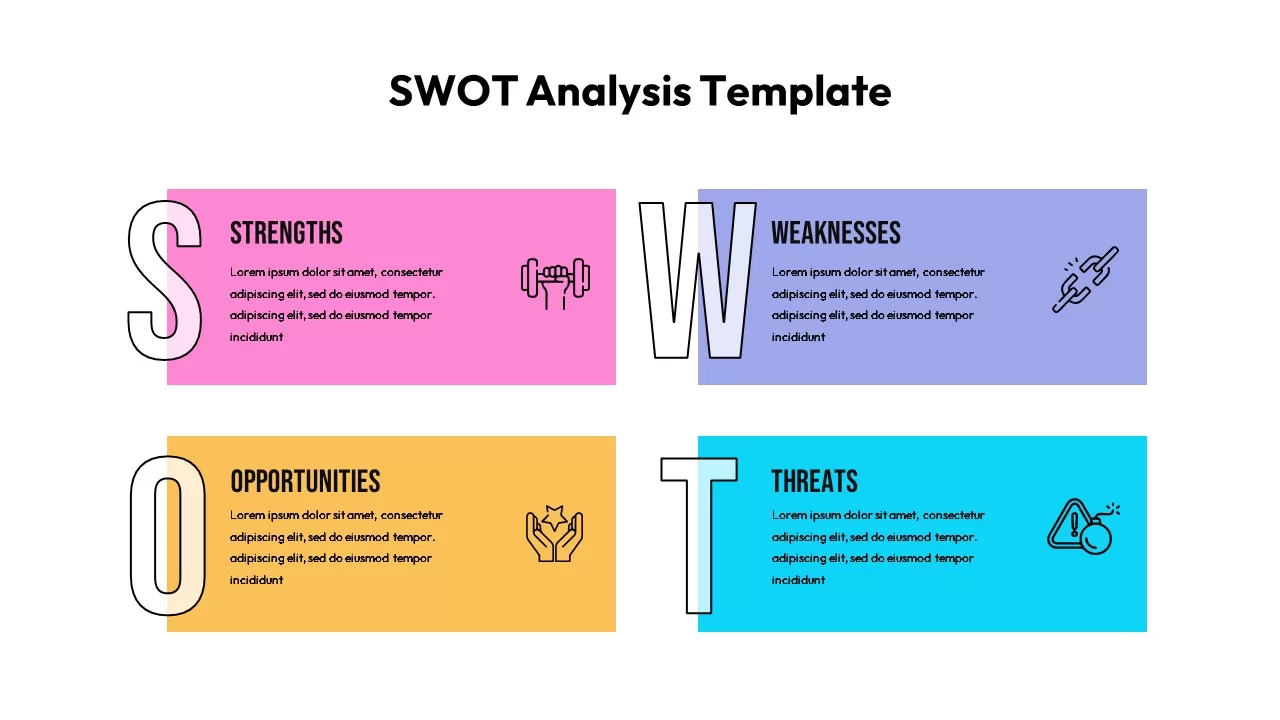
Colorful SWOT Analysis Diagram Template for PowerPoint & Google Slides
SWOT
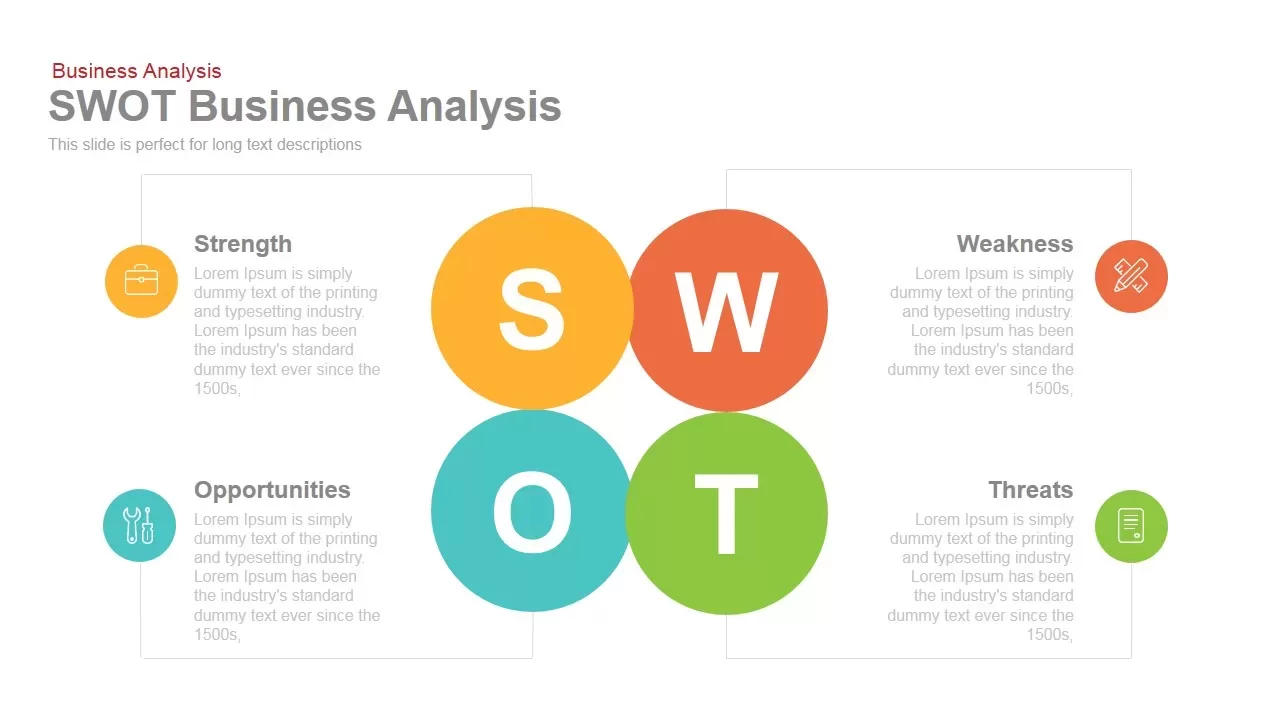
SWOT Business Analysis template for PowerPoint & Google Slides
SWOT
Box Business SWOT Analysis Template for PowerPoint & Google Slides
SWOT
SWOT Analysis template for PowerPoint & Google Slides
SWOT
Free SWOT Analysis template for PowerPoint & Google Slides
SWOT
Free
Interactive 3D Puzzle SWOT Analysis Slide Template for PowerPoint & Google Slides
SWOT
Gradient Petal SWOT Analysis Quadrant Template for PowerPoint & Google Slides
SWOT
SWOT Analysis Metaphor Illustration Template for PowerPoint & Google Slides
SWOT
Versatile SWOT Analysis Slide Collection Template for PowerPoint & Google Slides
SWOT
Illustrated Business SWOT Analysis Template for PowerPoint & Google Slides
SWOT
Modern Colorful SWOT Quadrant Analysis Template for PowerPoint & Google Slides
SWOT
Colorful SWOT Analysis Quadrant Template for PowerPoint & Google Slides
SWOT
Colorful Vertical SWOT Analysis Layout Template for PowerPoint & Google Slides
SWOT
SWOT Analysis Framework template for PowerPoint & Google Slides
SWOT
SWOT Analysis Overview template for PowerPoint & Google Slides
Business
SWOT Analysis Visual Overview template for PowerPoint & Google Slides
Business Strategy
SWOT Analysis Quadrant template for PowerPoint & Google Slides
Business Strategy
SWOT Analysis Blocks template for PowerPoint & Google Slides
Business Strategy
SWOT Analysis Quadrant template for PowerPoint & Google Slides
Business Strategy
SWOT Analysis Template for PowerPoint & Google Slides
Business Strategy
Free SWOT Analysis Template for PowerPoint & Google Slides
SWOT
Free
Free SWOT Analysis Overview template for PowerPoint & Google Slides
SWOT
Free
SWOT Analysis template for PowerPoint & Google Slides
SWOT
SWOT Analysis template for PowerPoint & Google Slides
SWOT
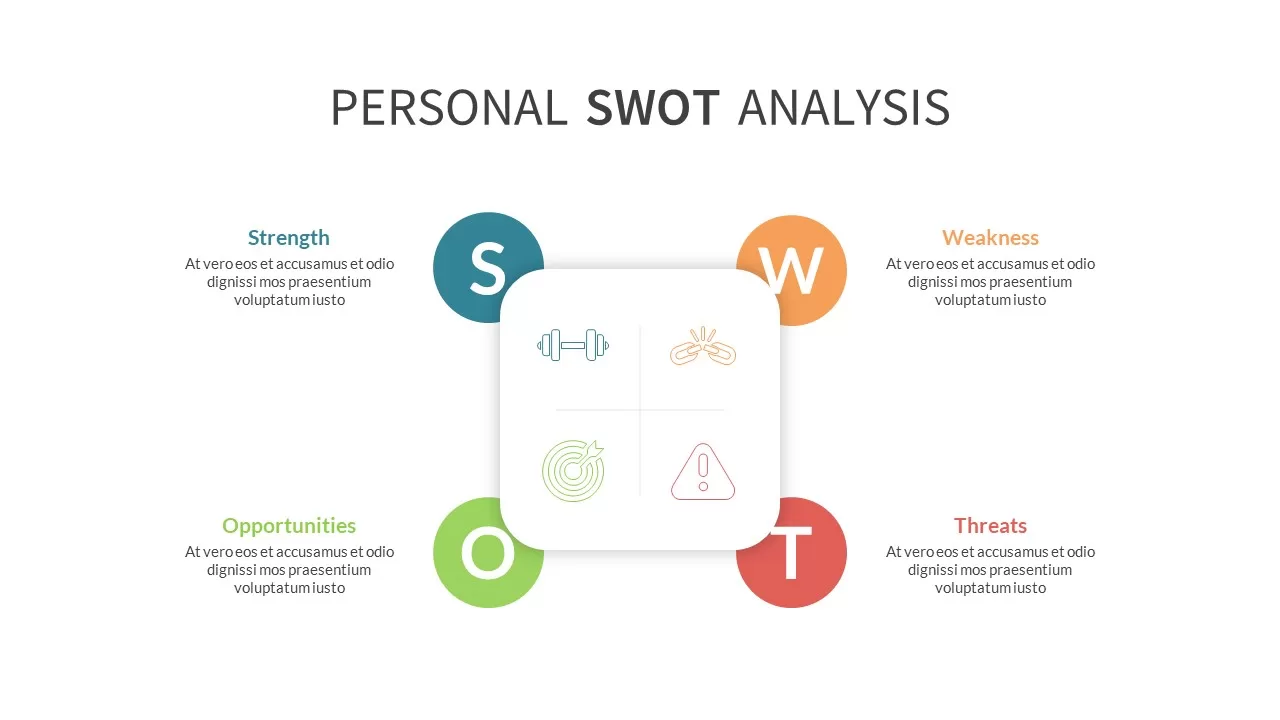
Photo Personal SWOT Analysis Callouts Template for PowerPoint & Google Slides
SWOT
Marketing SWOT Analysis Slide Template for PowerPoint & Google Slides
SWOT
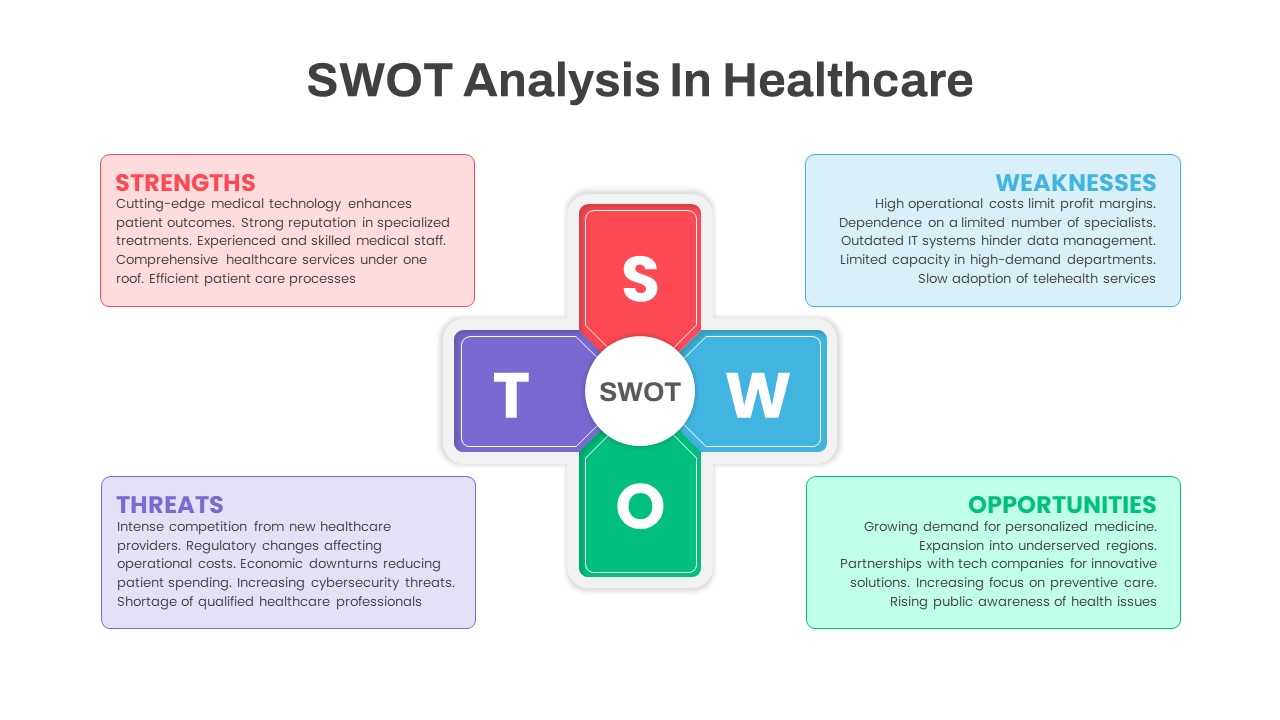
SWOT Analysis in Healthcare template for PowerPoint & Google Slides
SWOT
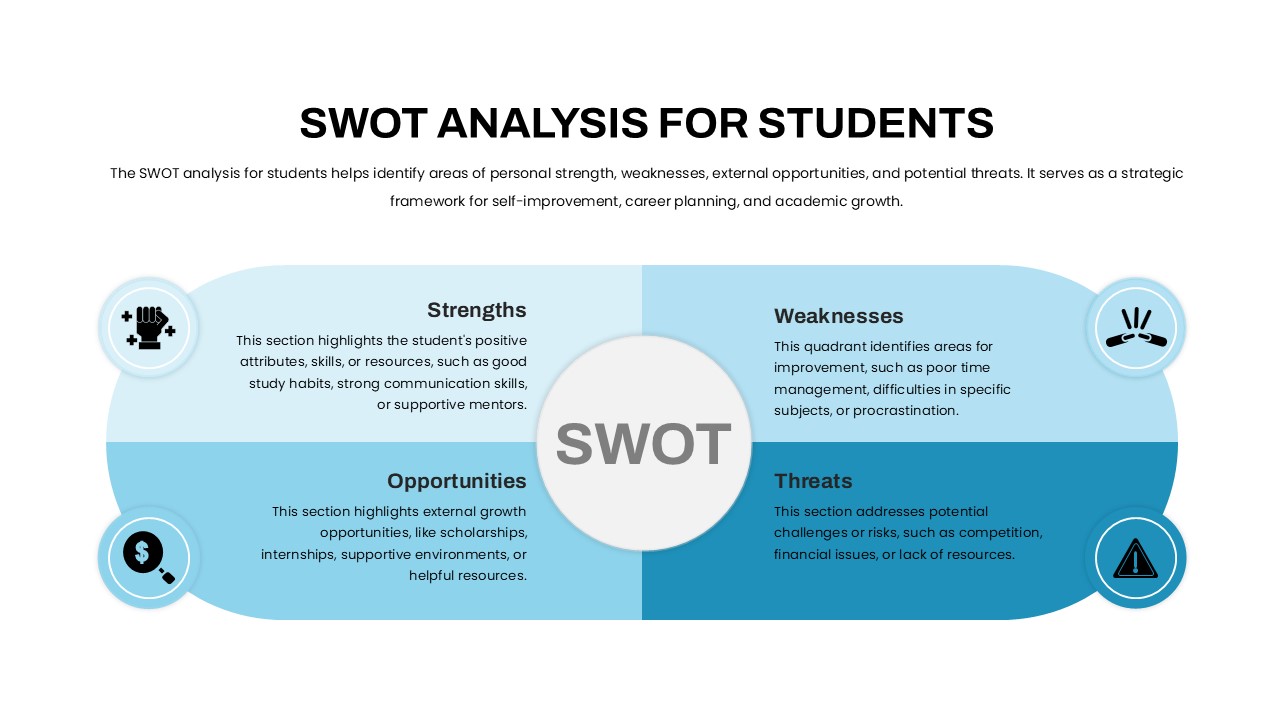
Student SWOT Analysis Framework Template for PowerPoint & Google Slides
SWOT
Colorful SWOT Analysis Quadrant Template for PowerPoint & Google Slides
SWOT
Trapezoid SWOT Analysis Template for PowerPoint & Google Slides
SWOT
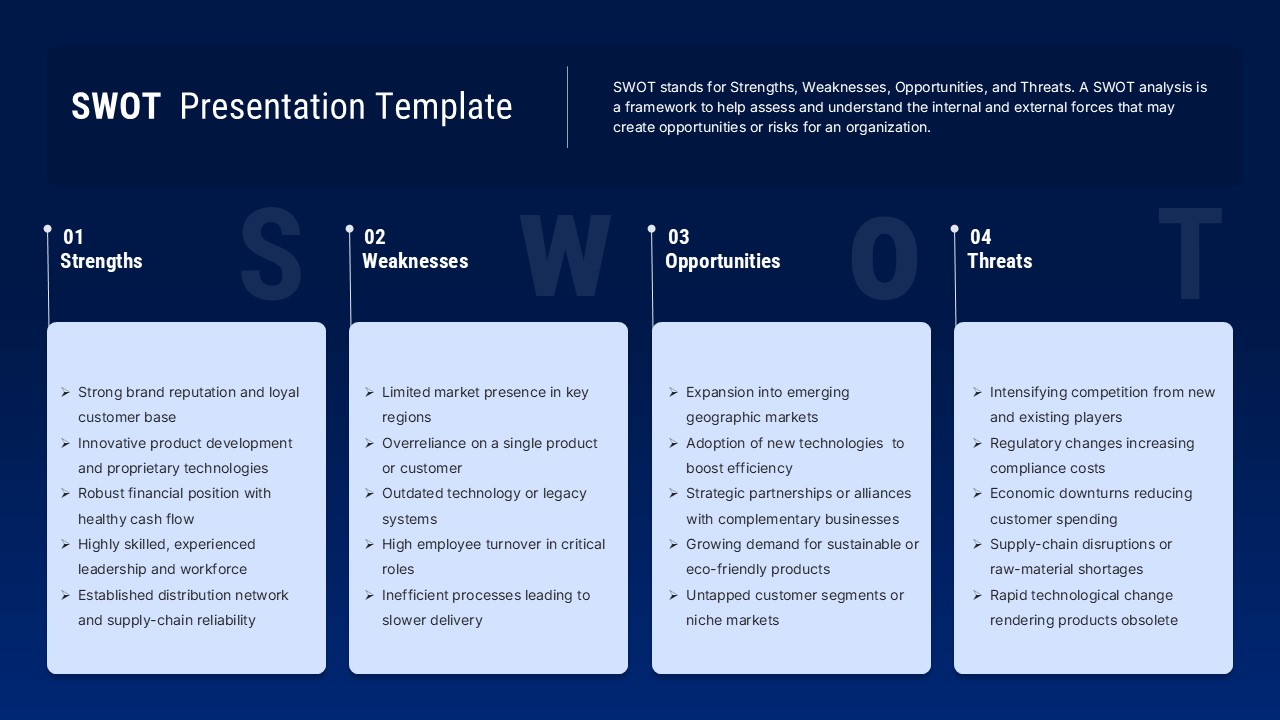
Blue SWOT Analysis Presentation Template for PowerPoint & Google Slides
SWOT
Multi Color SWOT Analysis Quadrant Template for PowerPoint & Google Slides
SWOT
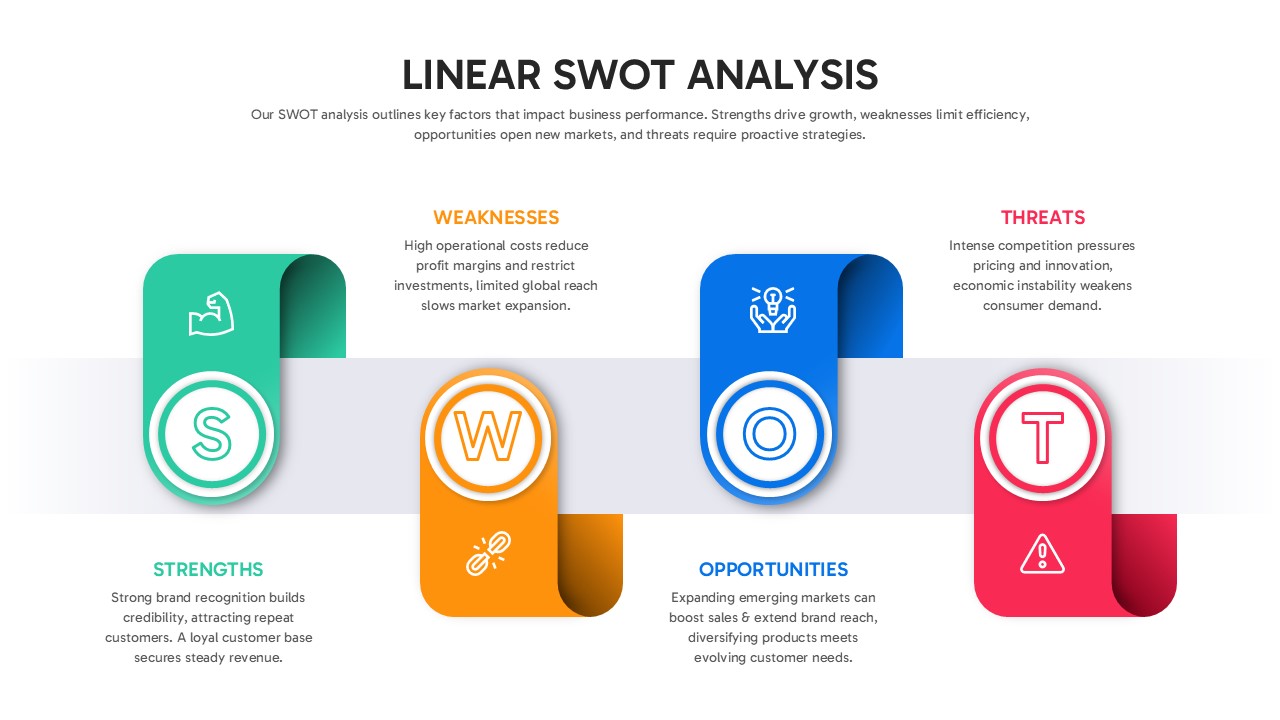
Linear SWOT Analysis Slide Template for PowerPoint & Google Slides
SWOT
3D SWOT Analysis Template for PowerPoint & Google Slides
SWOT
Personal SWOT Analysis Matrix Cards Template for PowerPoint & Google Slides
SWOT
Blank SWOT Analysis Template for PowerPoint & Google Slides
SWOT
3D Quadrant SWOT Analysis Template for PowerPoint & Google Slides
SWOT
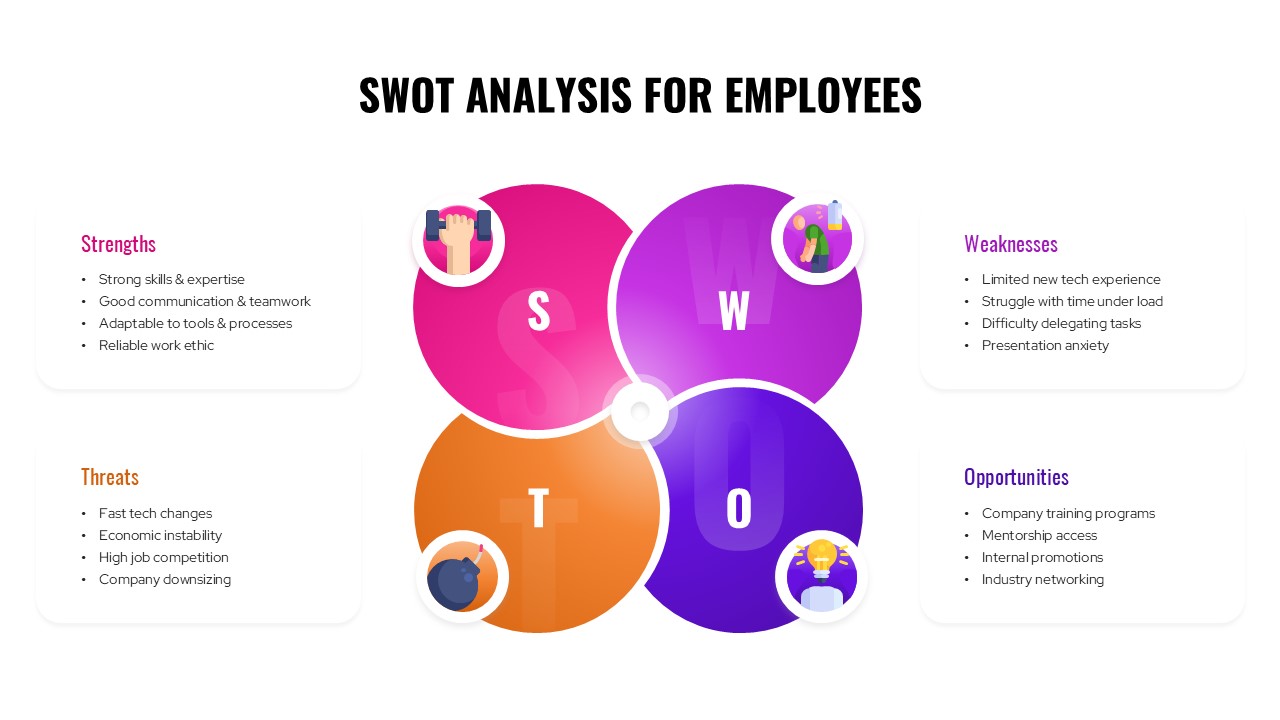
SWOT Analysis For Employees Template for PowerPoint & Google Slides
SWOT
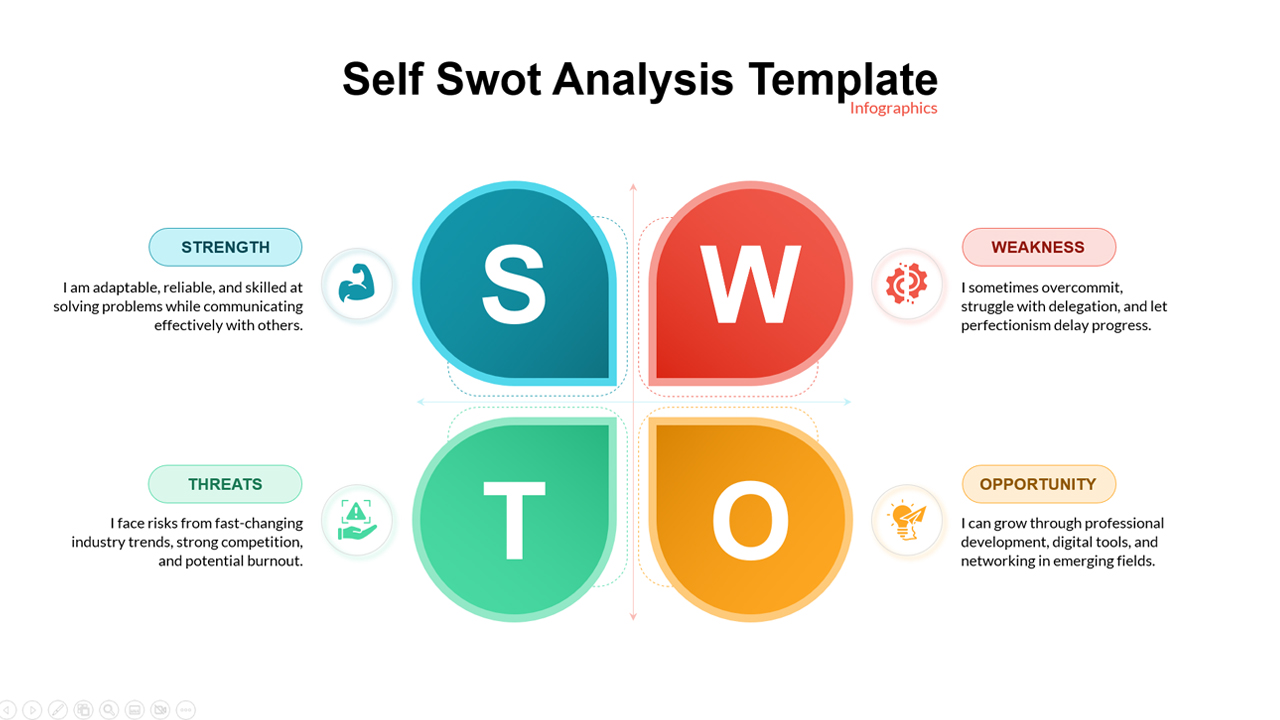
Self SWOT Analysis Template for PowerPoint & Google Slides
SWOT
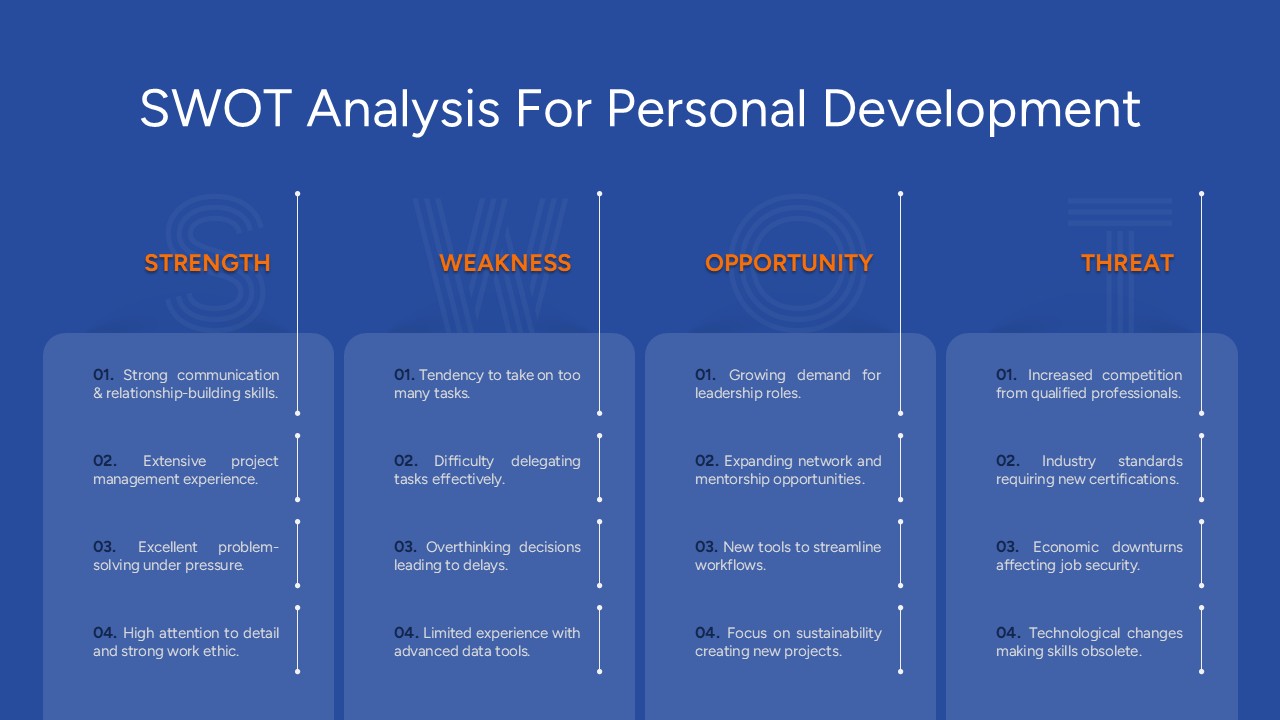
Free SWOT Analysis for Personal Development Template for PowerPoint & Google Slides
SWOT
Free
SWOT Analysis for PowerPoint & Google Slides
SWOT
Cluster Analysis Infographic Diagram Template for PowerPoint & Google Slides
Business
Gradient SWOT Quadrant Diagram Template for PowerPoint & Google Slides
SWOT
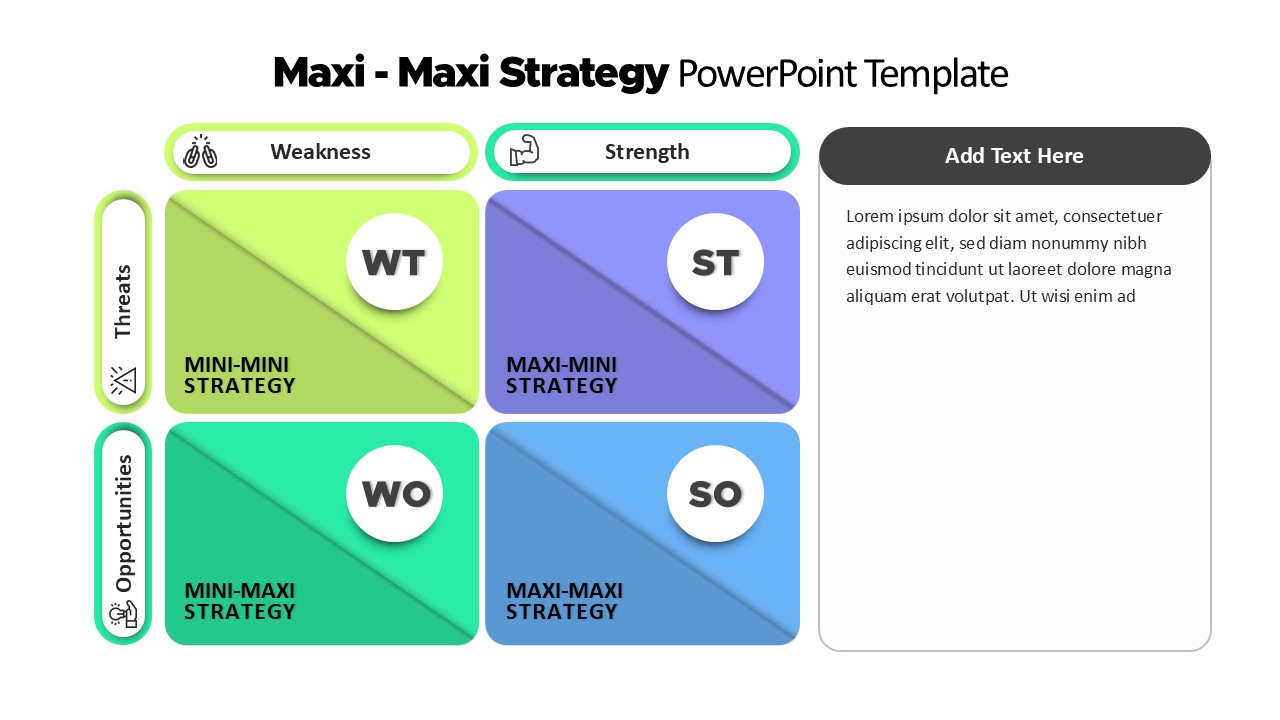
Maxi-Maxi Strategy Matrix SWOT Diagram Template for PowerPoint & Google Slides
SWOT
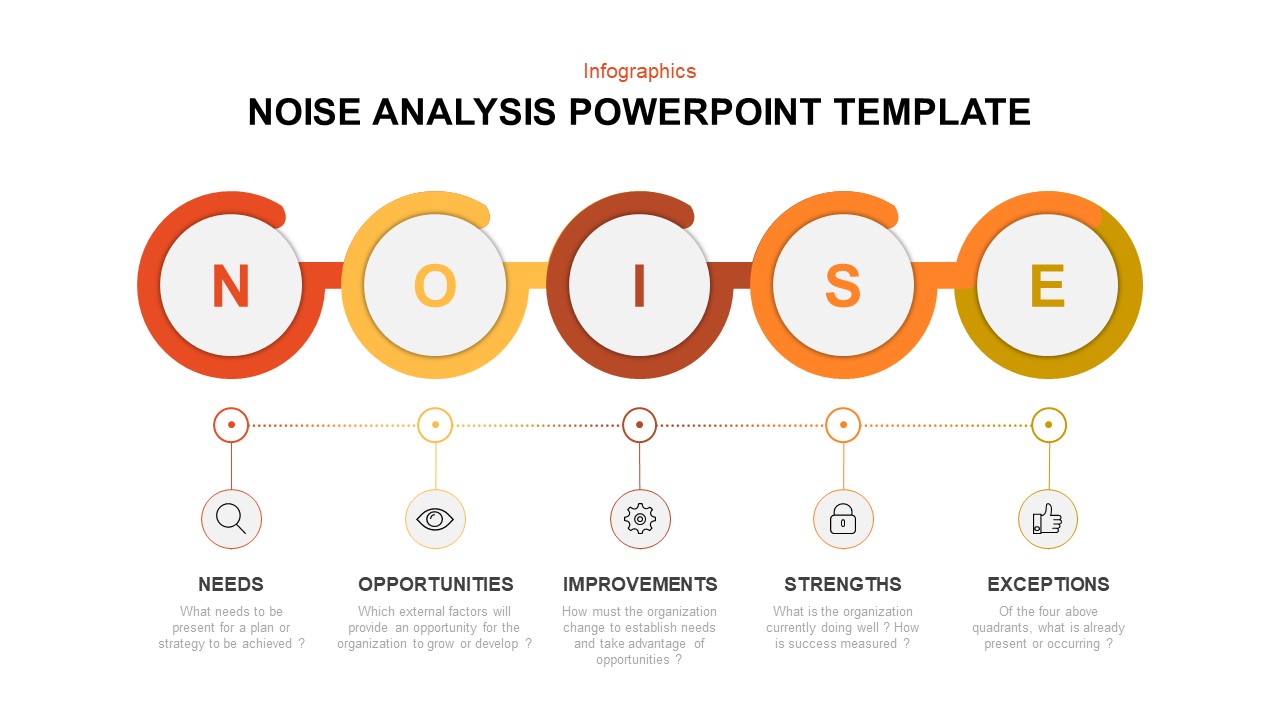
Modern Noise Analysis Infographic Template for PowerPoint & Google Slides
Process
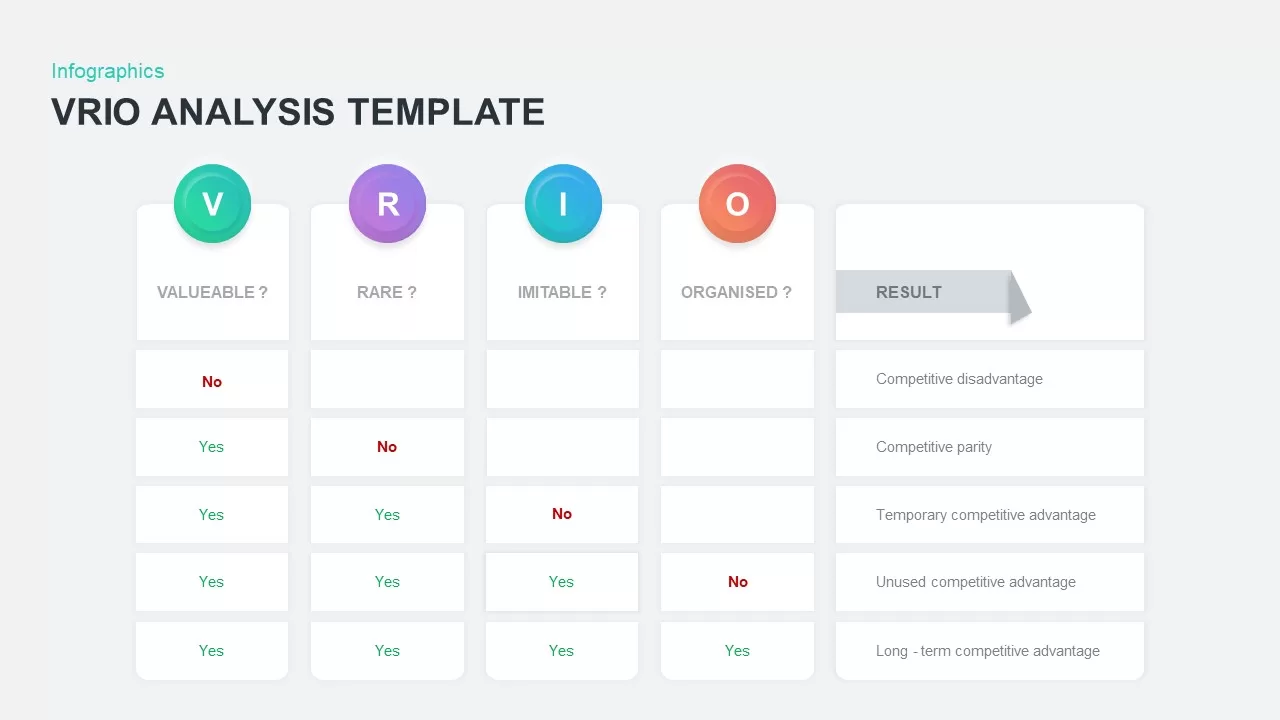
VRIO Analysis Infographic Template for PowerPoint & Google Slides
Business Strategy
Root Cause Analysis Infographic Pack Template for PowerPoint & Google Slides
Process
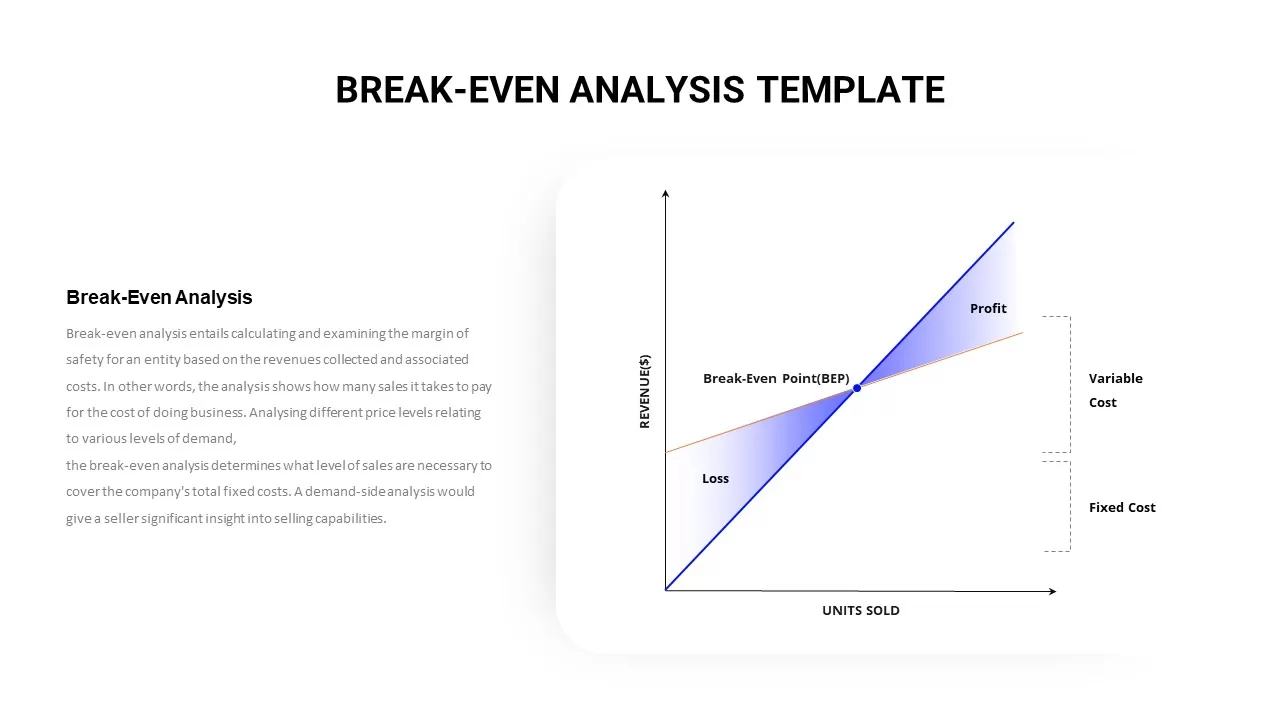
Break-Even Analysis Infographic Template for PowerPoint & Google Slides
Revenue
Category Analysis Comparison Infographic Template for PowerPoint & Google Slides
Comparison
Mobile User Data Analysis Infographic for PowerPoint & Google Slides
Process
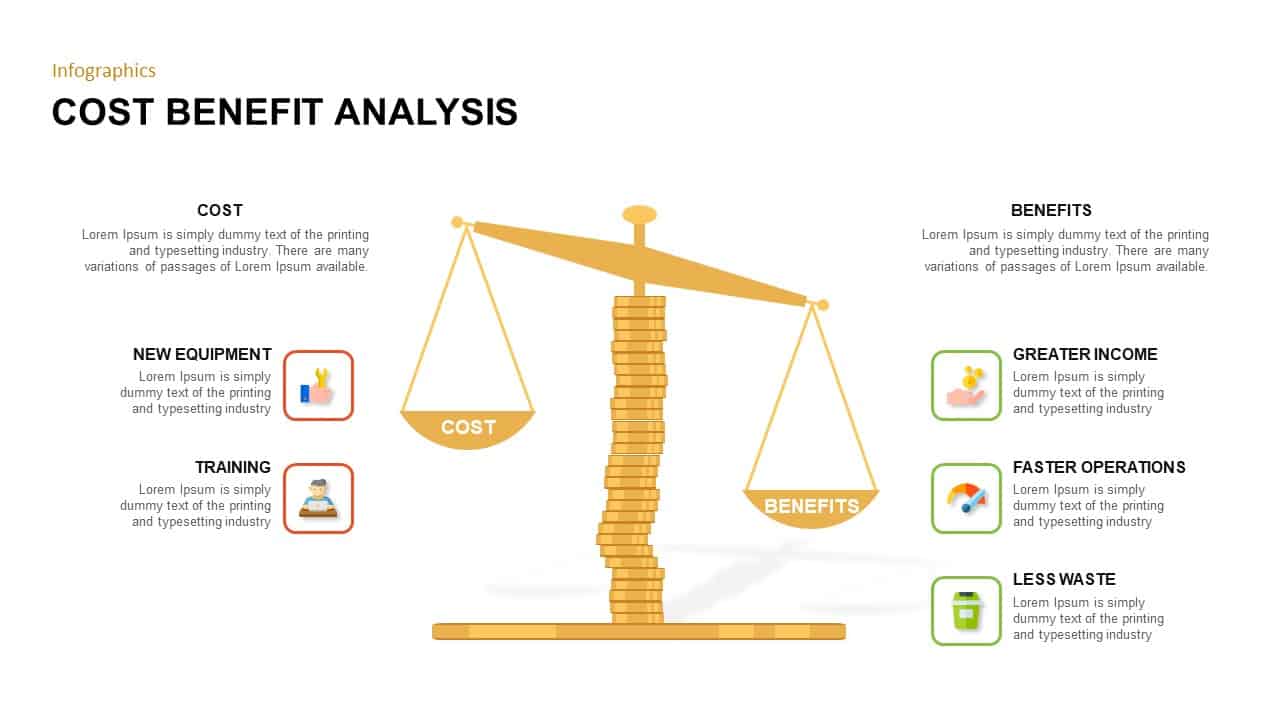
Cost Benefit Analysis infographic for PowerPoint & Google Slides
Comparison
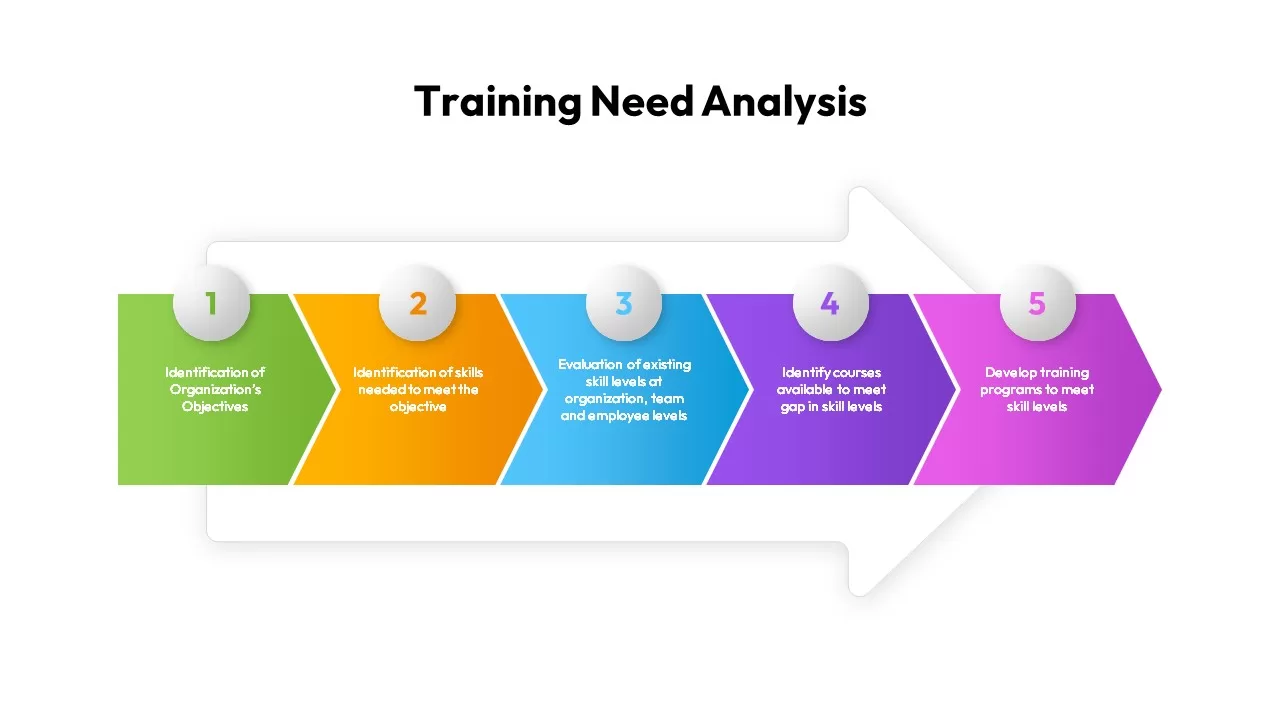
Training Need Analysis Process infographic for PowerPoint & Google Slides
Employee Performance
Creative SWOT Chart template for PowerPoint & Google Slides
SWOT
SWOT Marketing Template for PowerPoint & Google Slides
SWOT
Neon Gradient SWOT Business Template for PowerPoint & Google Slides
SWOT
SWOT Template with Colorful Circles for PowerPoint & Google Slides
SWOT
Porter’s Value Chain Analysis Diagram Template for PowerPoint & Google Slides
Business Strategy
Editable Force Field Analysis Diagram Template for PowerPoint & Google Slides
Business Plan

Professional PESTEL Analysis Diagram Template for PowerPoint & Google Slides
PEST
PEST Analysis Circular Diagram Template for PowerPoint & Google Slides
PEST
PESTLE Analysis Table Layout Diagram Template for PowerPoint & Google Slides
PEST

Interactive Gap Analysis Puzzle Diagram Template for PowerPoint & Google Slides
Gap
Fishbone Diagram Analysis Template for PowerPoint & Google Slides
Flow Charts
Business Target Analysis Diagram Template for PowerPoint & Google Slides
Circular
Fishbone Cause Analysis Diagram Template for PowerPoint & Google Slides
Process
IQ Scale Analysis Diagram template for PowerPoint & Google Slides
Employee Performance
Six-Step Business Analysis Diagram template for PowerPoint & Google Slides
Circular
Business Process Analysis Cycle Diagram Template for PowerPoint & Google Slides
Business Strategy
Free Root Cause Analysis Fishbone Diagram Template for PowerPoint & Google Slides
Process
Free
Experience Curve Analysis Diagram Template for PowerPoint & Google Slides
Business Strategy
Cost-Volume-Profit Analysis Diagram Template for PowerPoint & Google Slides
Finance
Bottleneck Process Analysis Diagram Template for PowerPoint & Google Slides
Process
Fundamental Analysis Circular Diagram Template for PowerPoint & Google Slides
Circular
Cultural Web Analysis Circular Diagram Template for PowerPoint & Google Slides
Circular
DESTEP Marketing Analysis Diagram Template for PowerPoint & Google Slides
Circular
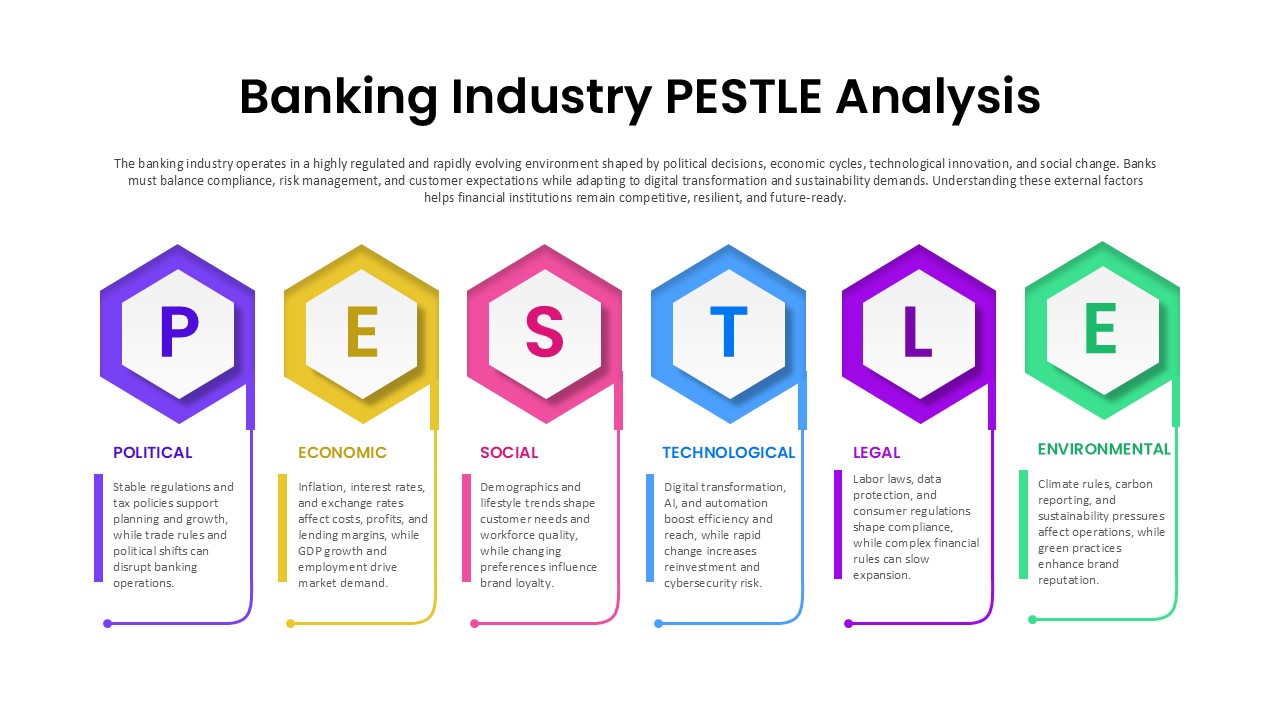
Banking Industry PESTLE Analysis Diagram Template for PowerPoint & Google Slides
PEST
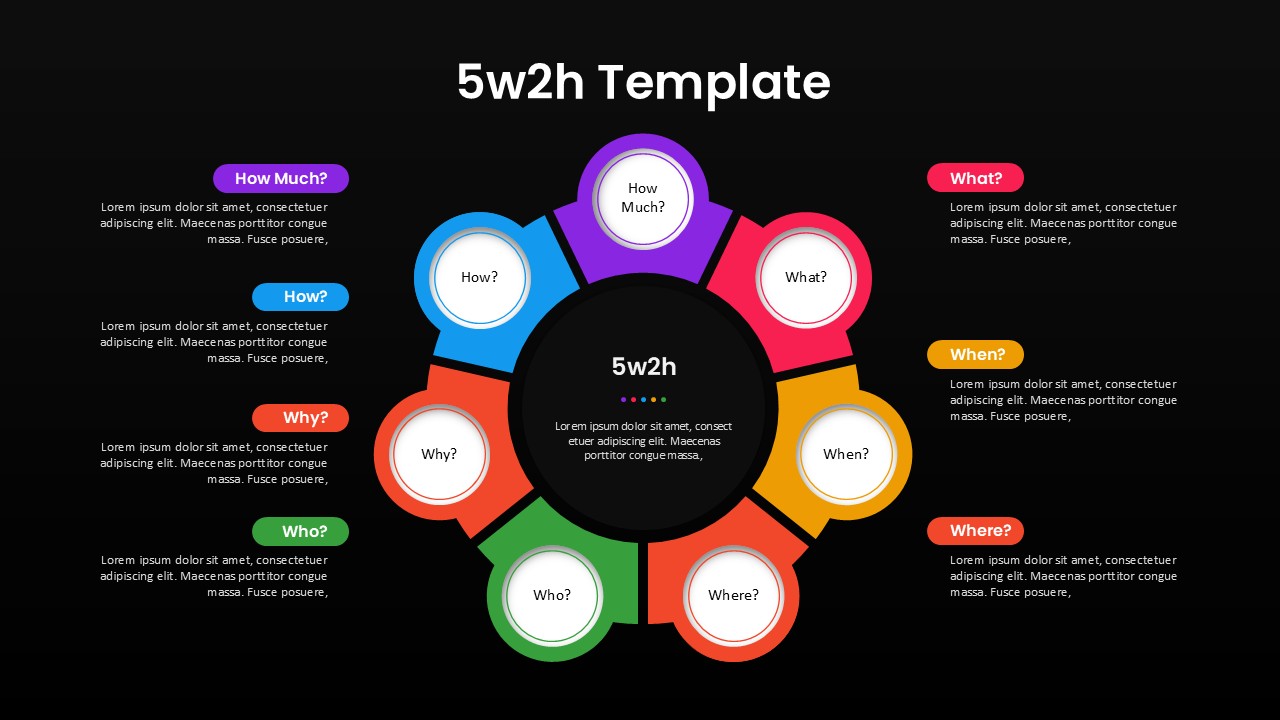
5W2H Analysis Radial Diagram Template for PowerPoint & Google Slides
Decision Tree
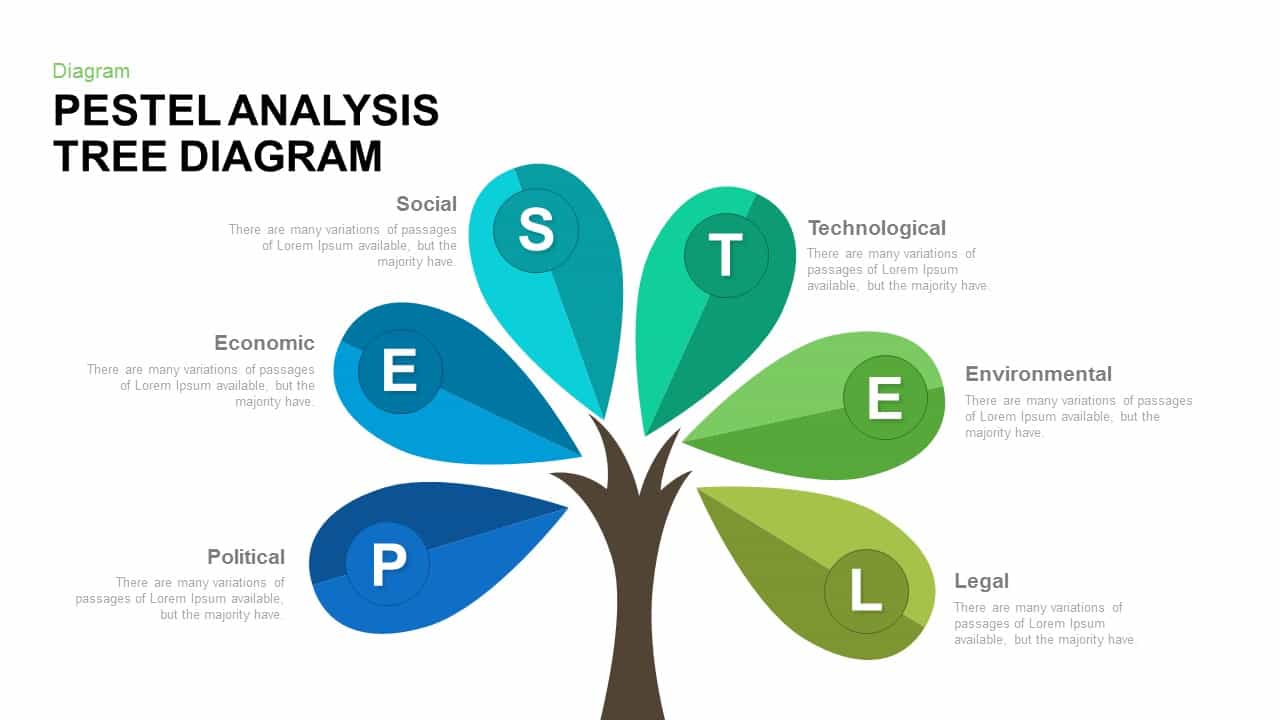
PESTEL Analysis Tree Diagram for PowerPoint & Google Slides
Process
5 Why Fishbone Diagram for Root Cause Analysis in PowerPoint & Google Slides
Process
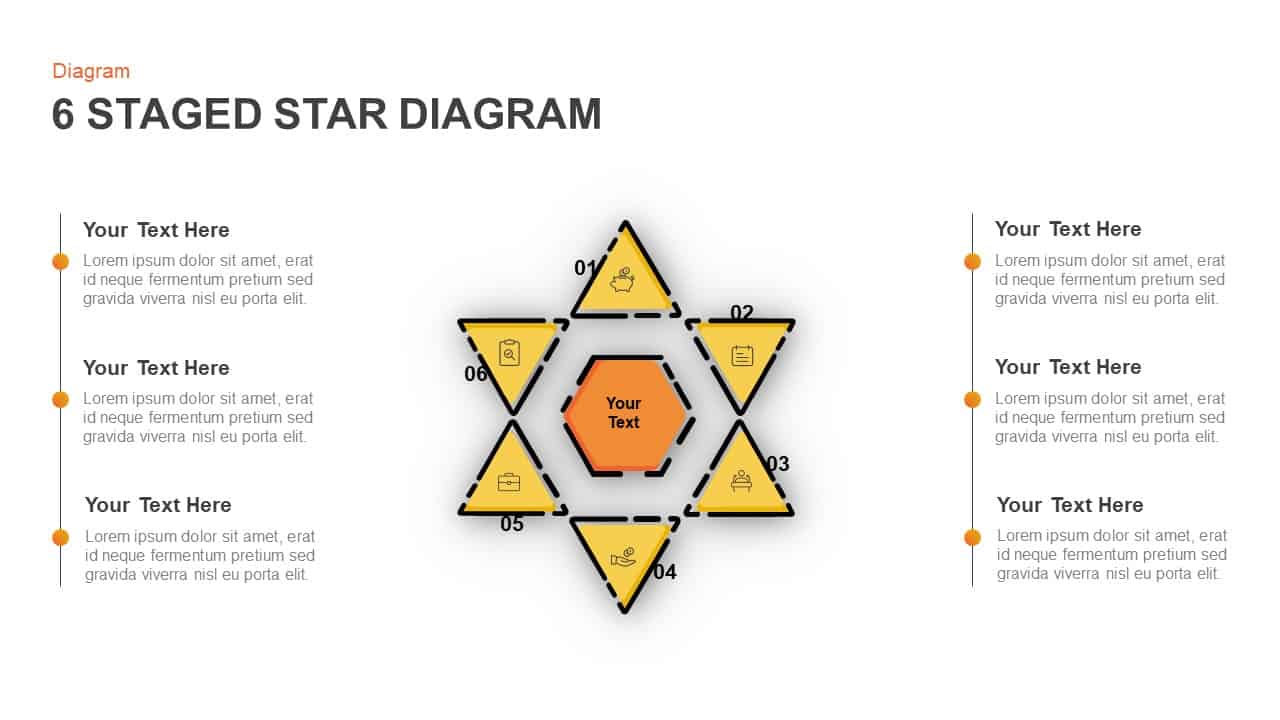
Six-Stage Star Diagram Infographic Template for PowerPoint & Google Slides
Process
Creative Tree Diagram Infographic Template for PowerPoint & Google Slides
Decision Tree
Minimal Process Flow Diagram Infographic Template for PowerPoint & Google Slides
Process
Hub & Spoke Infographic Diagram Template for PowerPoint & Google Slides
Process