Six-Segment 360 Degree View Infographic Template for PowerPoint & Google Slides

Description
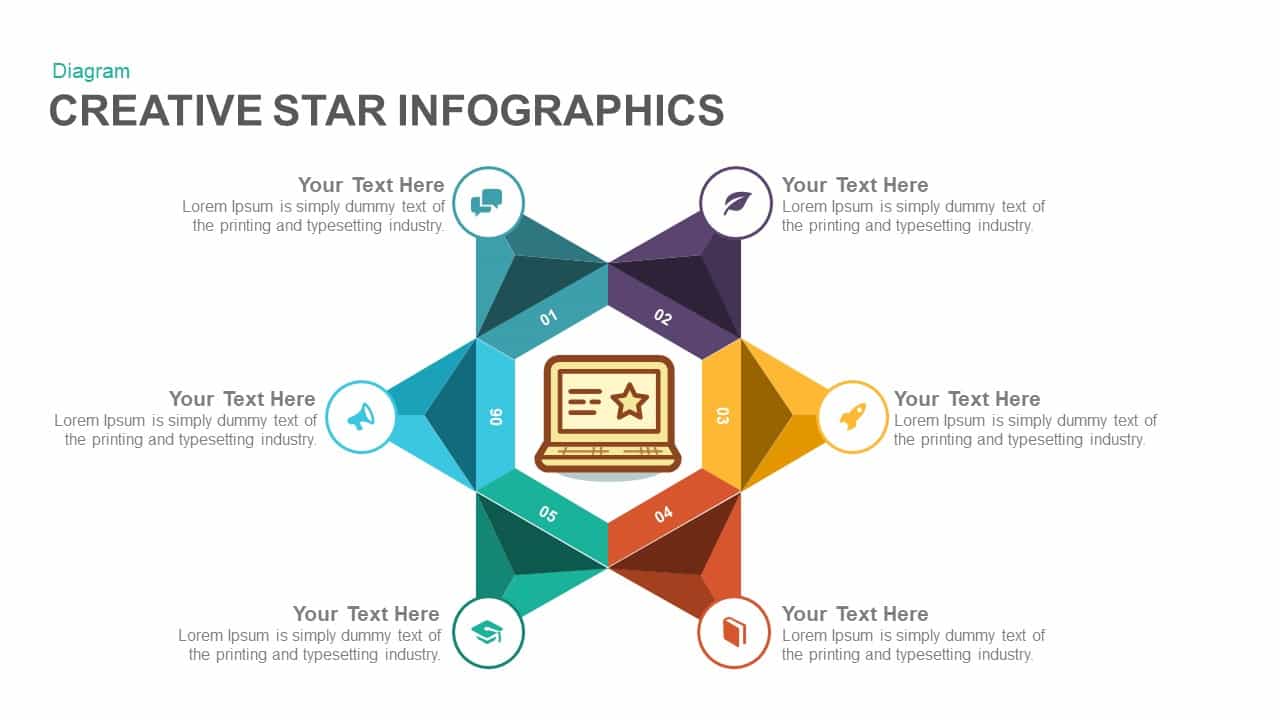
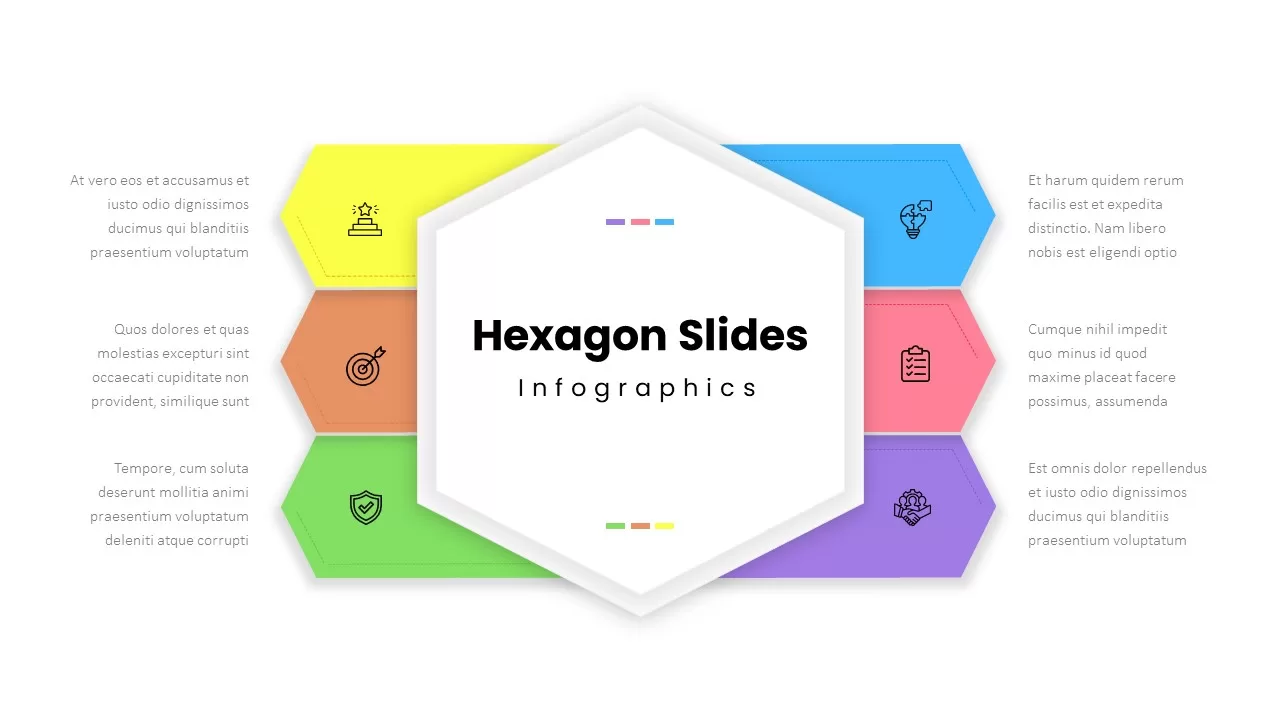
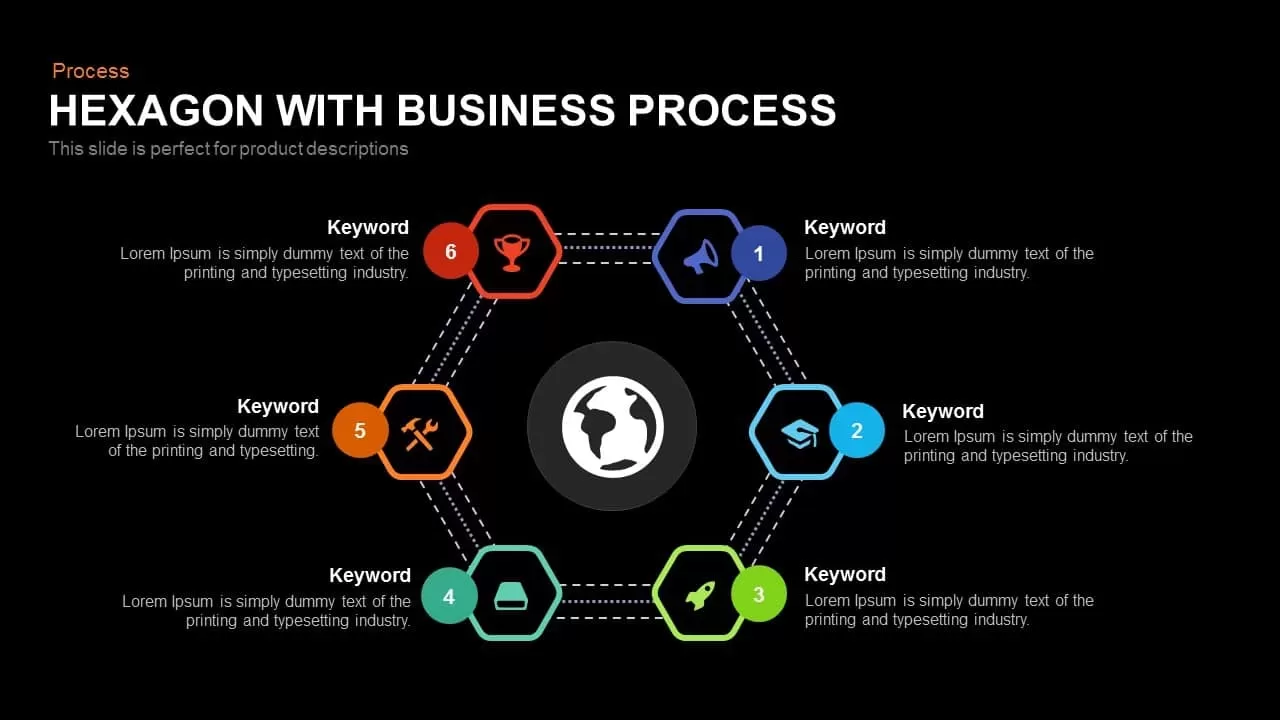
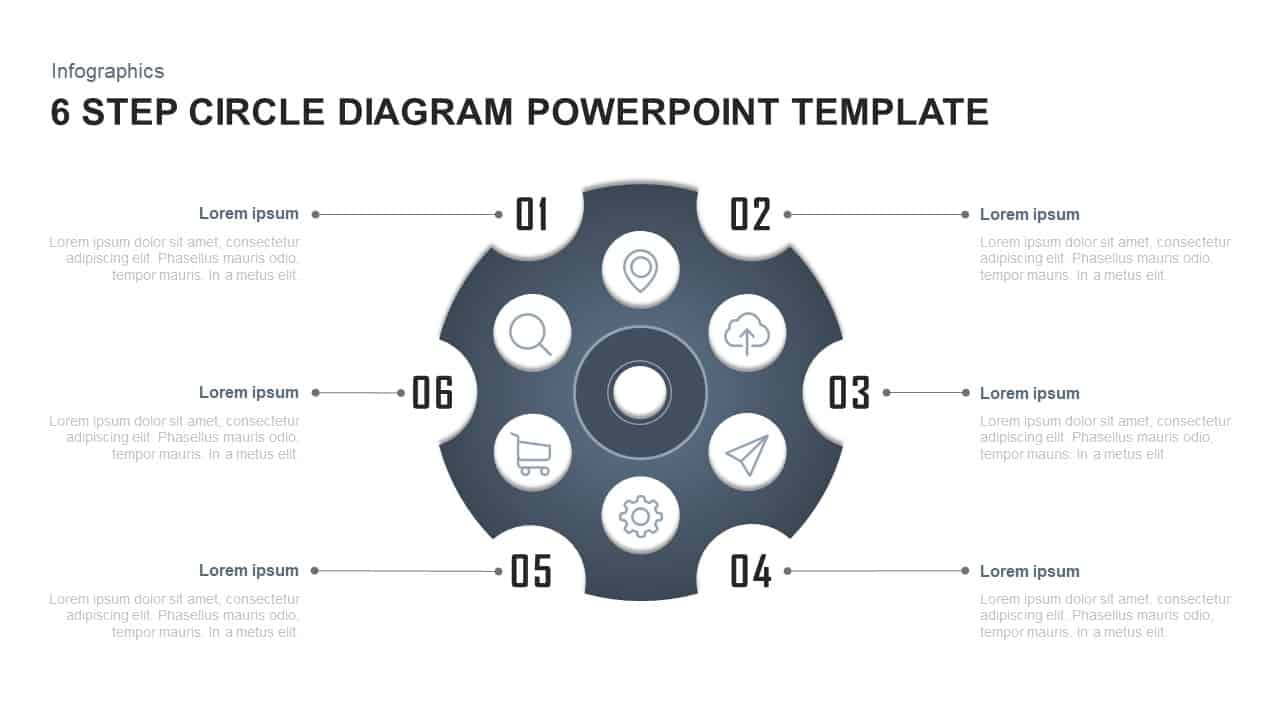
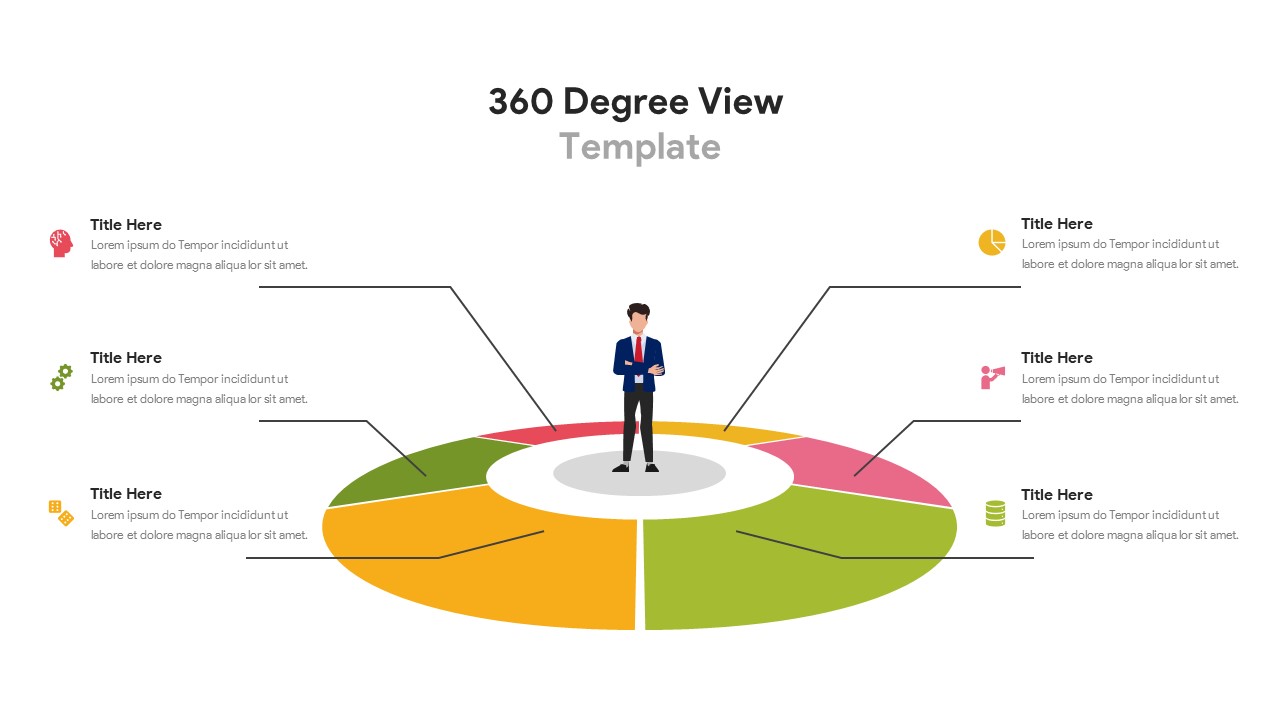
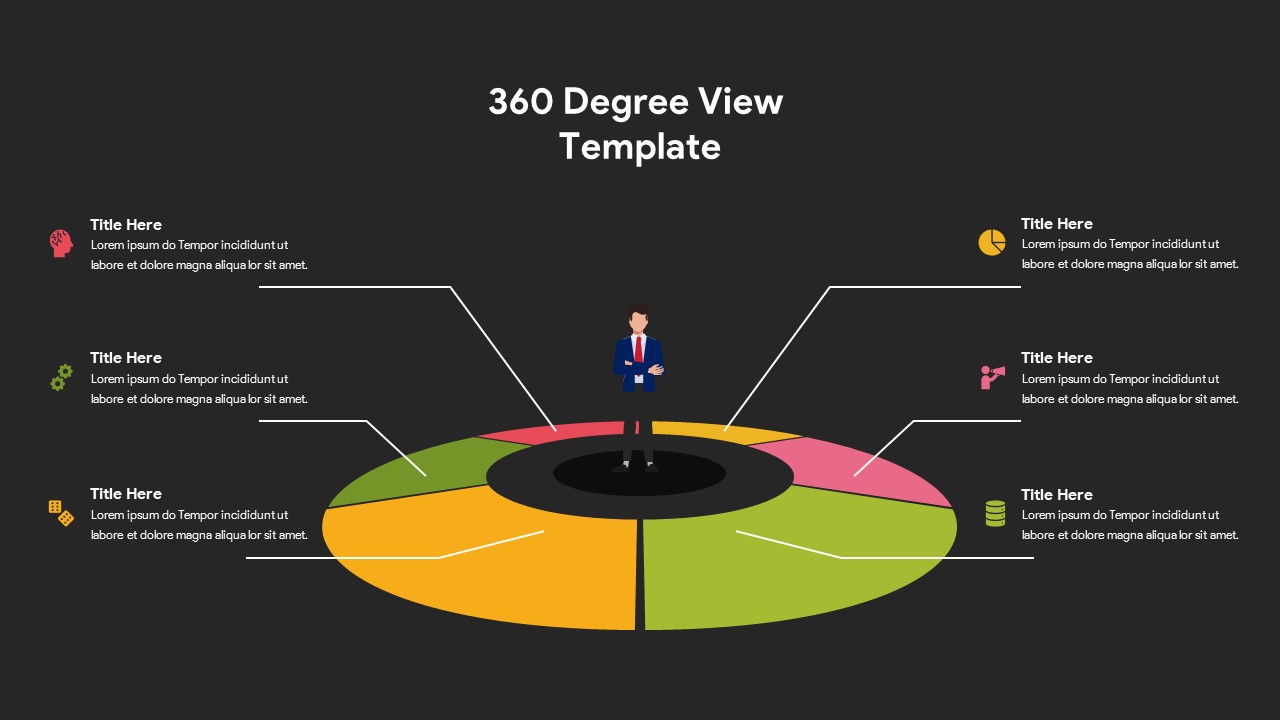
Use this fully customizable six-segment 360 degree view infographic slide to visualize a comprehensive overview of interconnected business elements or project components with clarity and impact. The central circular hub features a custom icon placeholder—perfect for highlighting your core metric, theme, or stakeholder persona—while six evenly spaced segments radiate around the hub, each in a distinct vibrant color. Each segment includes an icon placeholder (for brain, pie chart, megaphone, database, dice, gear) and is linked by fine connector lines to matching text boxes positioned around the chart. The sleek flat design, accented by subtle drop shadows and clean typography, ensures readability and a professional aesthetic across corporate and creative presentations.
Built with vector shapes and master slide layouts in both PowerPoint and Google Slides, this template guarantees seamless customization. Swap out icons, adjust segment colors, edit labels, and reposition text boxes in seconds without losing alignment or quality. Preconfigured animations guide audiences step-by-step through each segment, reinforcing the cyclical 360 degree concept and drawing attention to relationships between elements. Cross-platform compatibility eliminates formatting issues and version-control headaches, enabling teams to collaborate efficiently across devices and presentation environments.
Ideal for executive briefings, strategy workshops, and stakeholder reviews, this slide empowers presenters to illustrate holistic assessments—such as market analysis, customer journey stages, departmental overviews, or product lifecycle phases—in one cohesive view. Use it to map risk factors, performance metrics, or operational workflows, ensuring audiences grasp the full 360 perspective. By combining vibrant visuals with functional precision, this infographic slide enhances storytelling, drives alignment, and elevates data-driven discussions to new levels of clarity and engagement.
Who is it for
Workshop facilitators, marketing directors, product managers, and consultants will benefit from this slide when presenting comprehensive 360° analyses of market segments, customer journeys, performance dashboards, or departmental workflows. Executive teams and cross-functional stakeholders can leverage the holistic view to drive alignment, identify gaps, and prioritize initiatives.
Other Uses
Beyond business assessments, repurpose this infographic for project health checks, risk management reviews, training modules, strategic roadmaps, or investor pitch decks. The flexible layout also supports product roadmap overviews, customer segmentation breakdowns, or portfolio performance snapshots.
Login to download this file

Item ID
SB03179
Related Templates

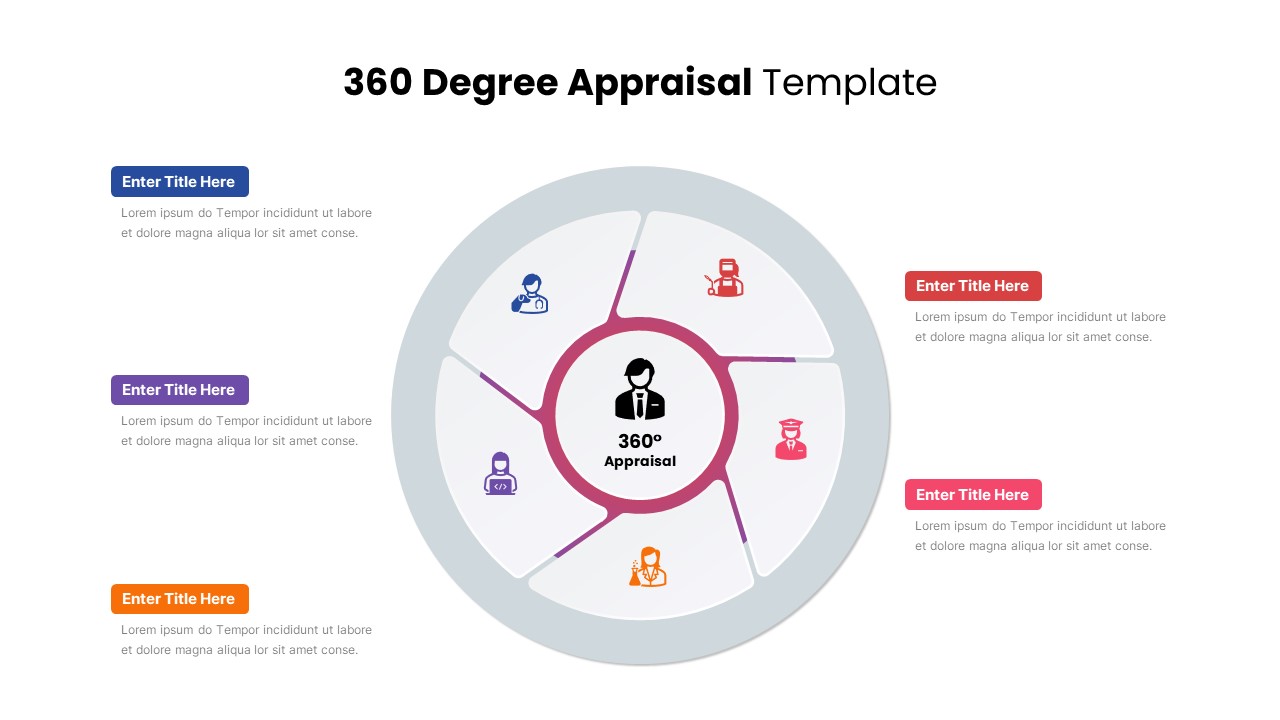
360 Degree Appraisal template for PowerPoint & Google Slides
Business Report
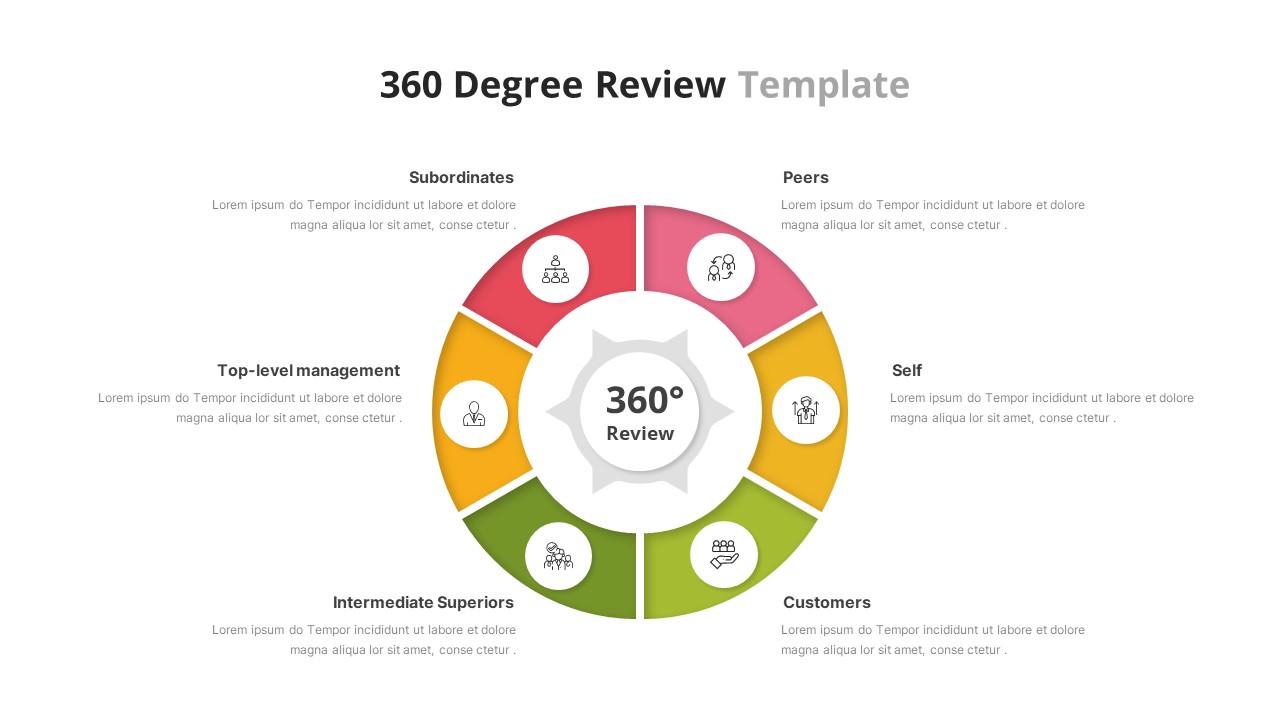
360 Degree Review Template for PowerPoint & Google Slides
Employee Performance
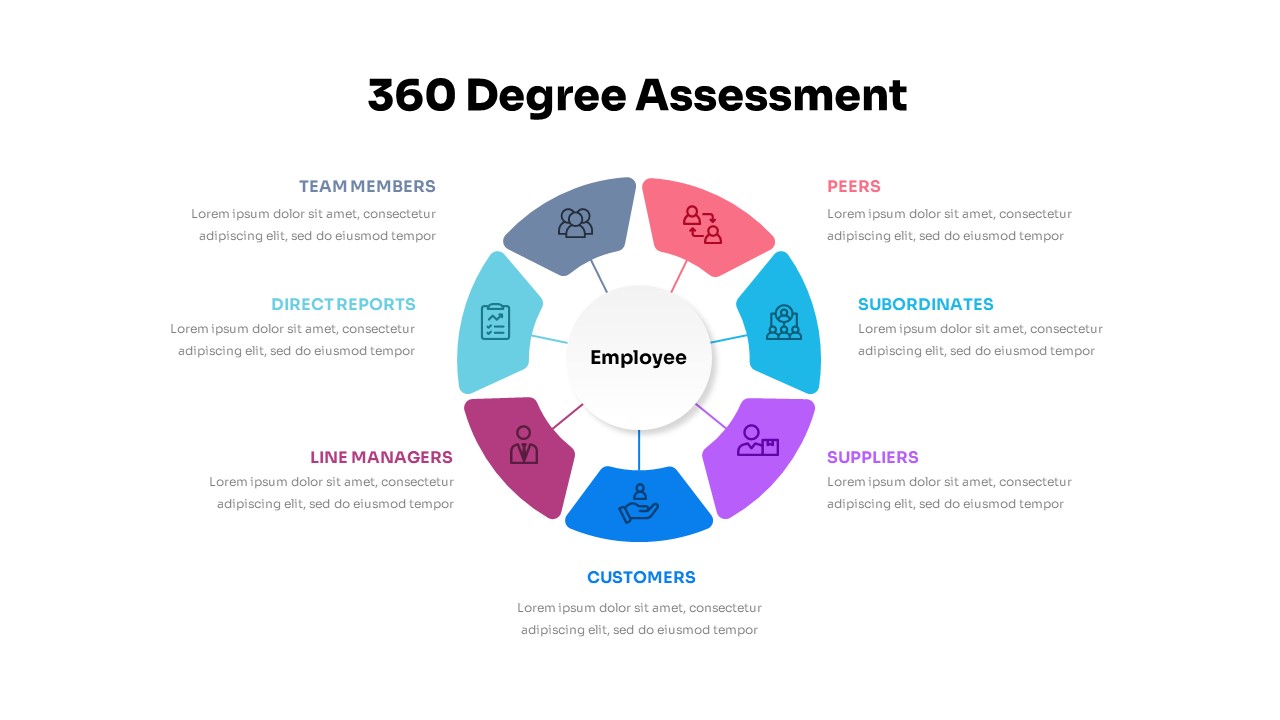
360 Degree Assessment Template for PowerPoint & Google Slides
Employee Performance
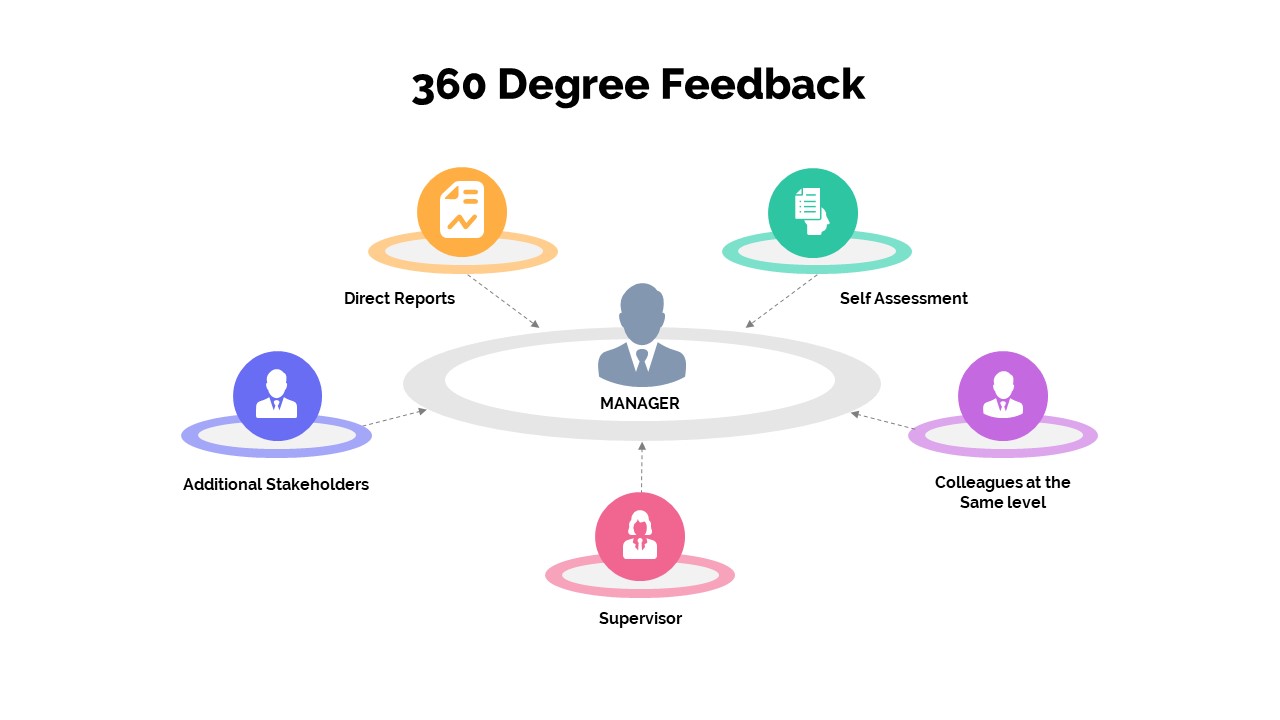
360 Degree Feedback Template for PowerPoint & Google Slides
Employee Performance
Six-Segment Circular Hub Infographic Template for PowerPoint & Google Slides
Circular
Six-Segment Circular Arrow Infographic Template for PowerPoint & Google Slides
Circular
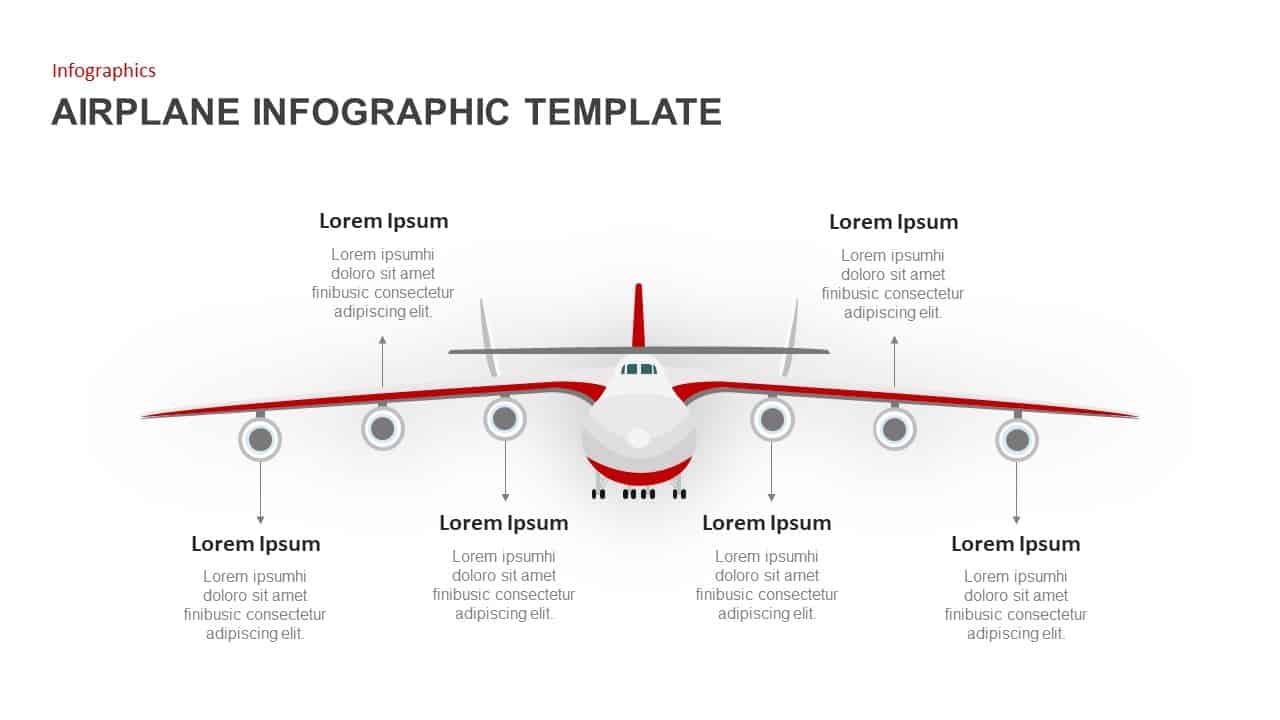
Airplane Front View Callout Infographic Template for PowerPoint & Google Slides
Comparison

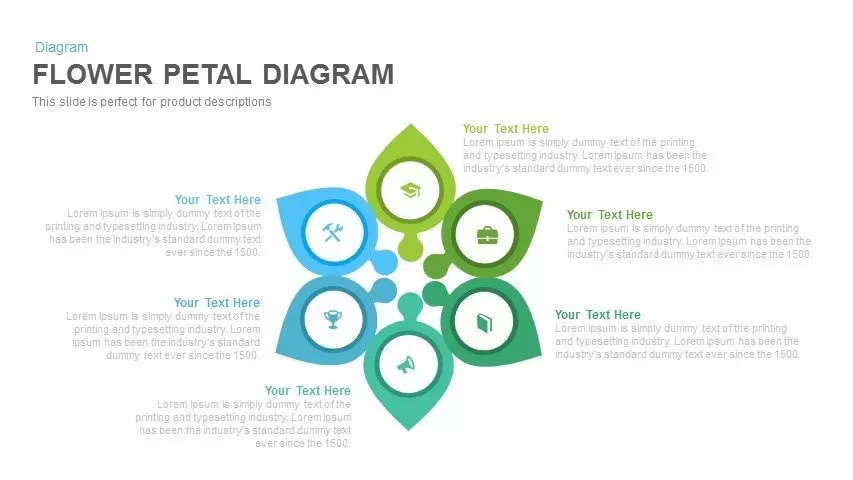
Six-Segment Flower Petal Diagram Template for PowerPoint & Google Slides
Circular
Six Segment Hexagon Circular Diagram Template for PowerPoint & Google Slides
Circular
Circular 3D Cube Six-Segment Diagram Template for PowerPoint & Google Slides
Infographics
Six-Segment Circular Arrow Cycle Template for PowerPoint & Google Slides
Circular
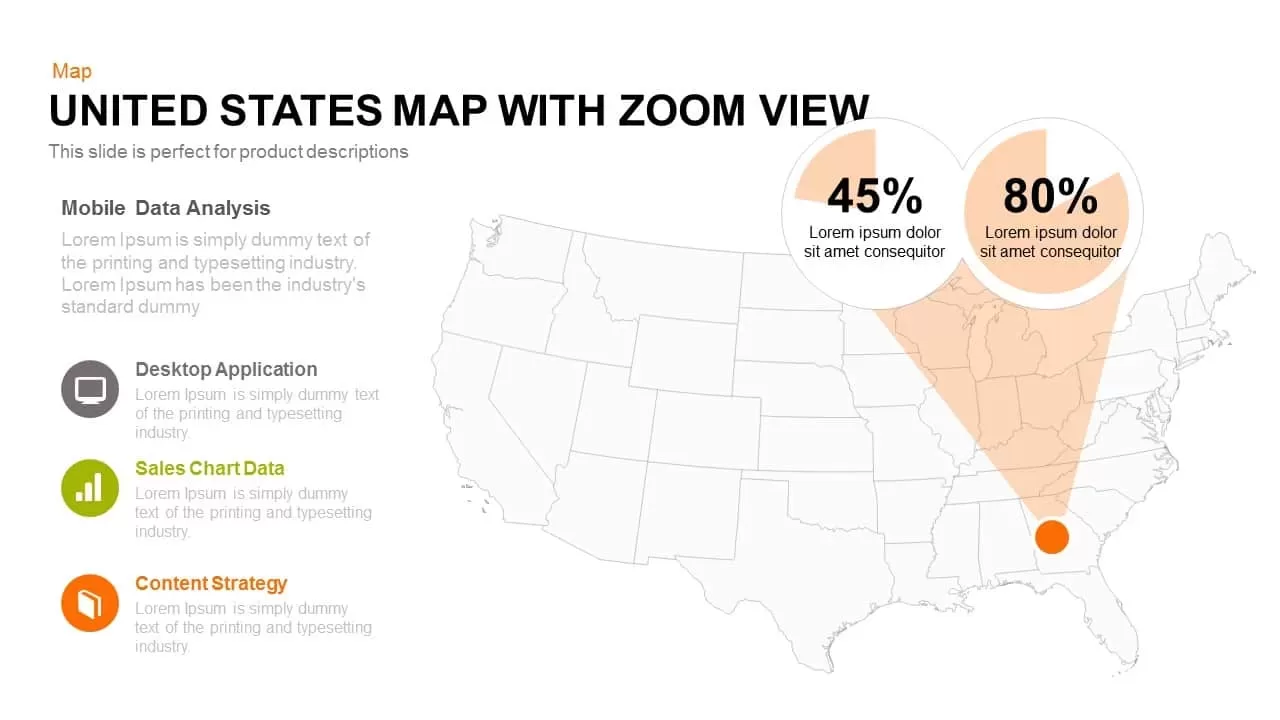
United States Map with Zoom View template for PowerPoint & Google Slides
World Maps
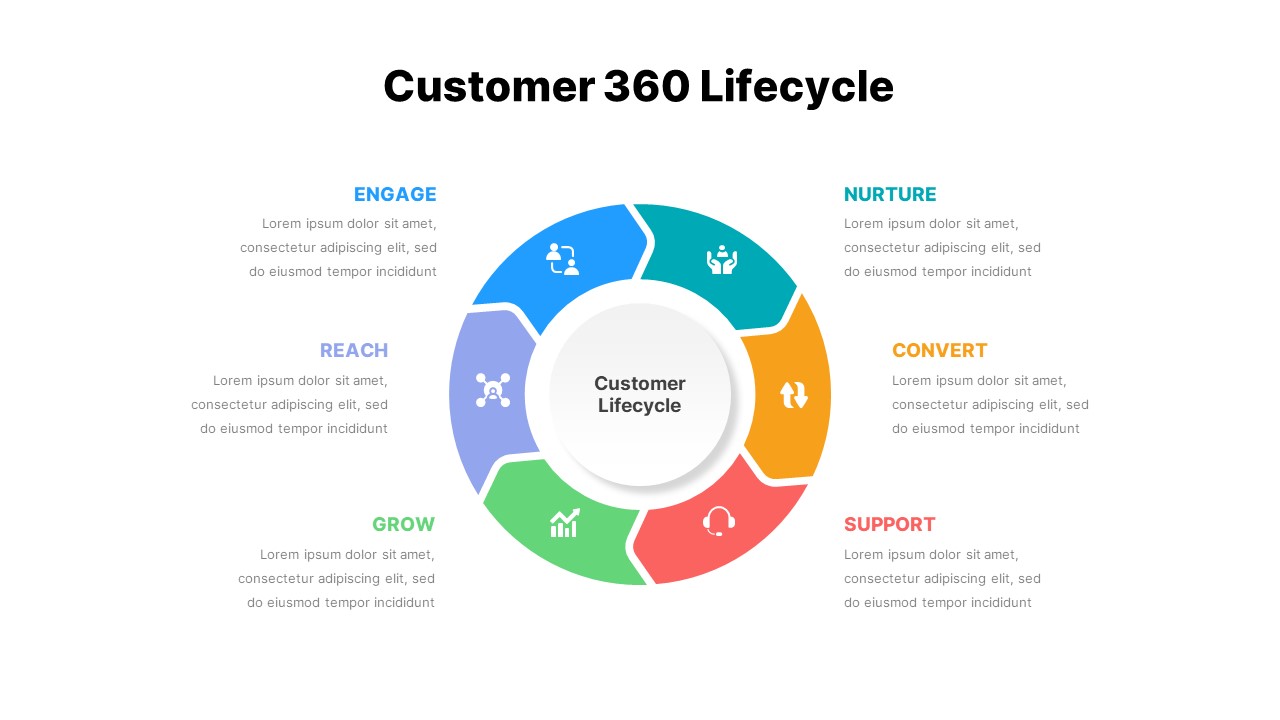
Customer 360 Lifecycle Slide for PowerPoint & Google Slides
Customer Journey
Circle Segment Sales Metrics Infographic Template for PowerPoint & Google Slides
Circular

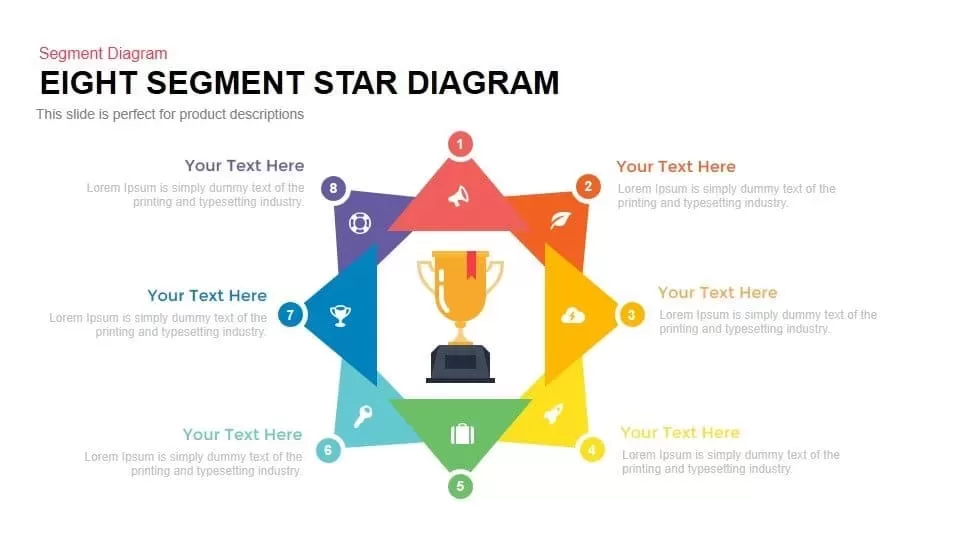
Eight Segment Star Diagram Infographic Template for PowerPoint & Google Slides
Process
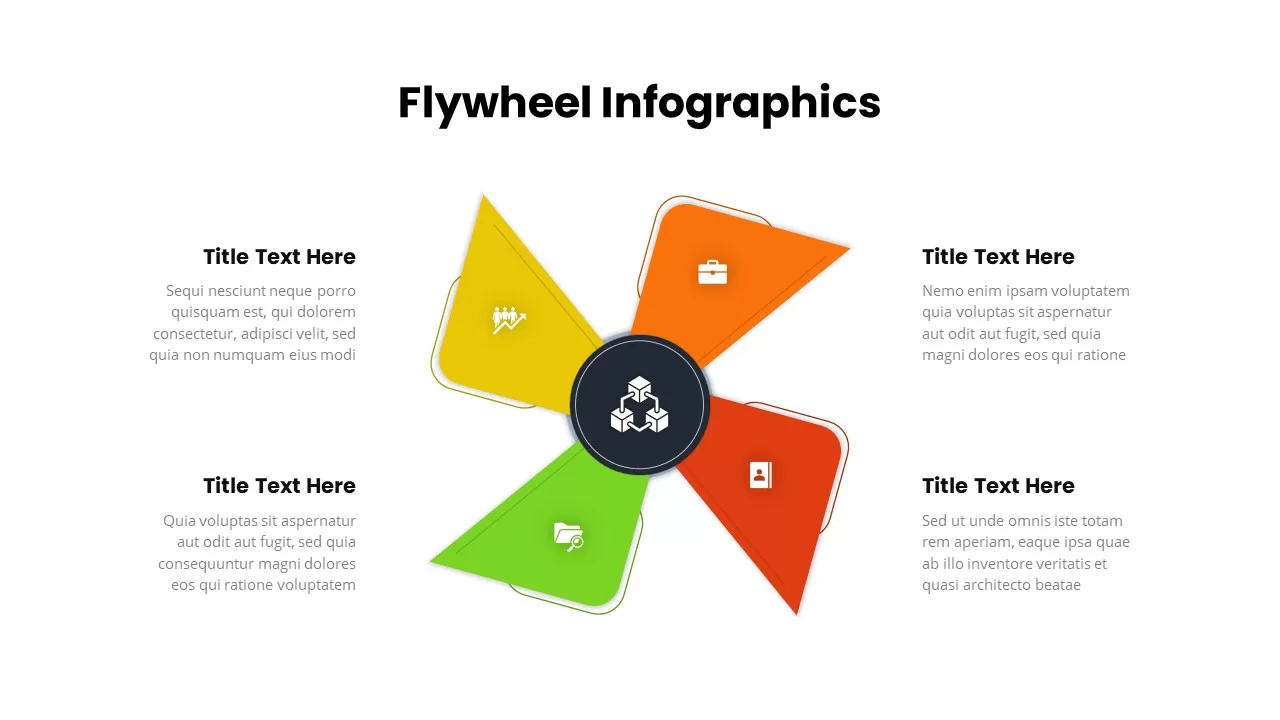
Four-Segment Flywheel Infographic Model Template for PowerPoint & Google Slides
Process
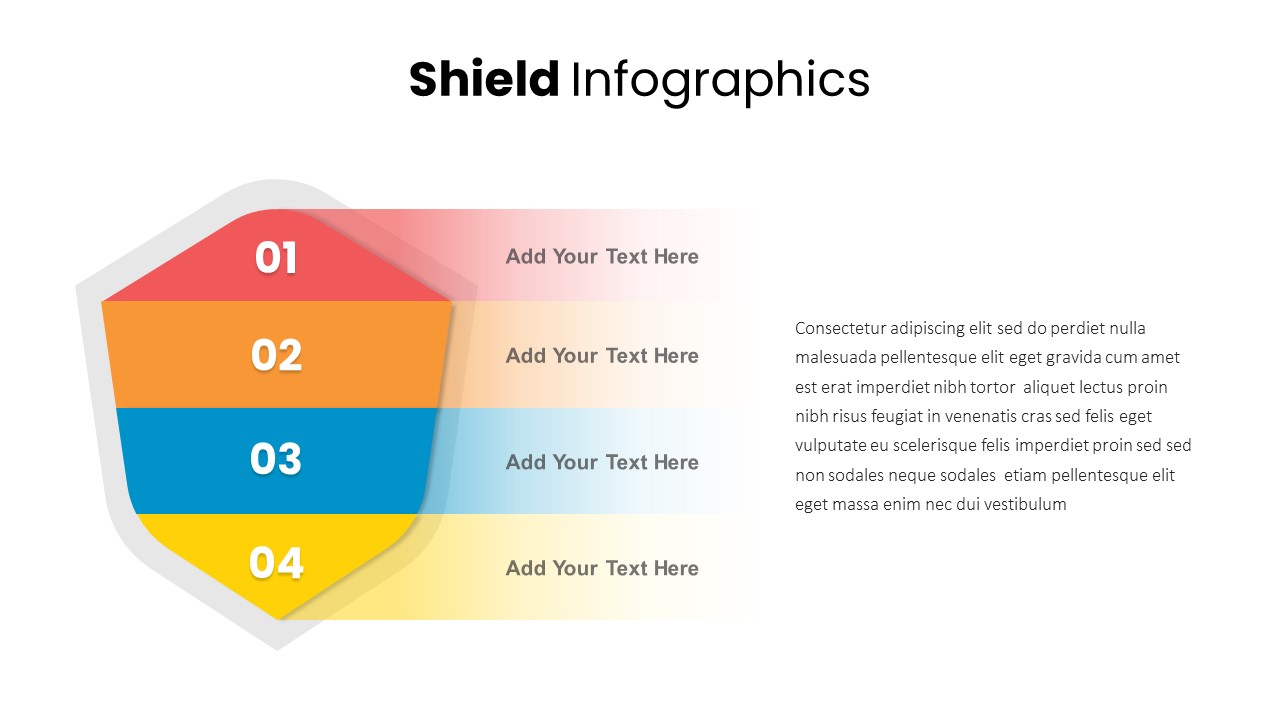
Shield Four-Segment Infographic Template for PowerPoint & Google Slides
Process
Three Segment Donut Chart KPI Infographic Template for PowerPoint & Google Slides
Pie/Donut
Multi-Segment Circle Split Diagram template for PowerPoint & Google Slides
Circular
Pie Segment Diagram Four-Step Process Template for PowerPoint & Google Slides
Pie/Donut
Eight-Segment 3D Arrow Infographics Template for PowerPoint & Google Slides
Arrow
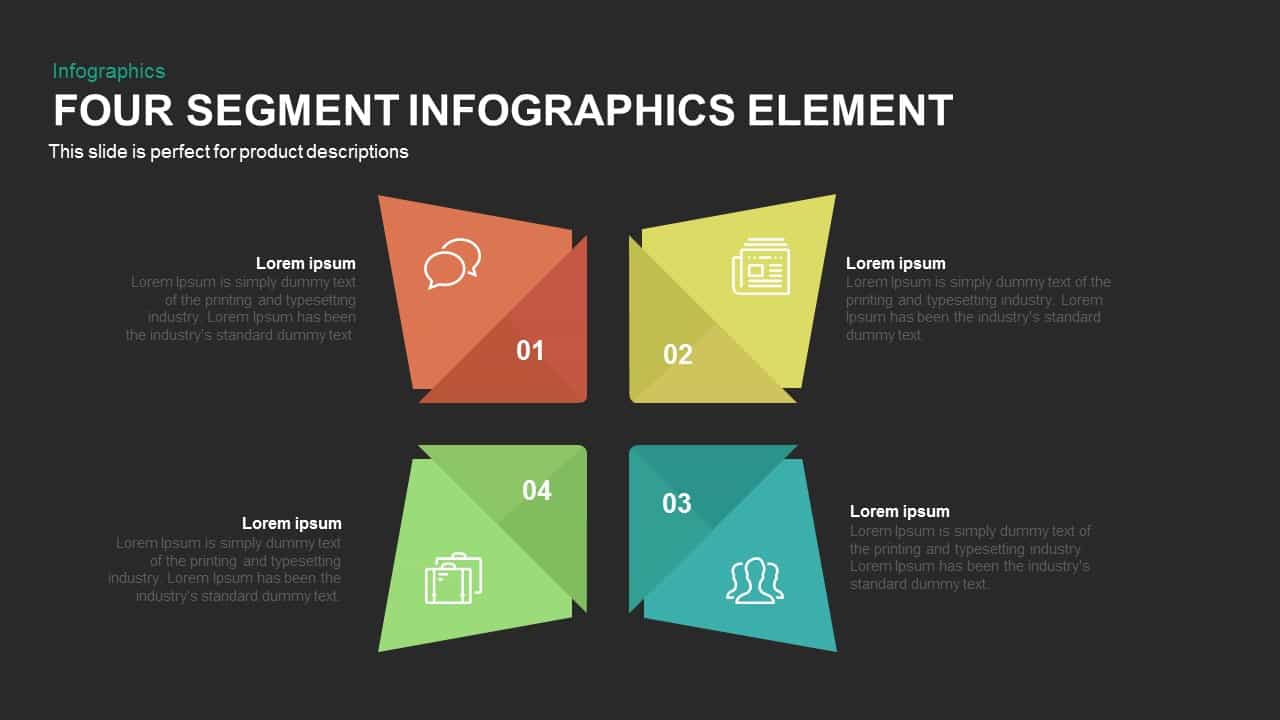
Four Segment Infographics Element Template for PowerPoint & Google Slides
Comparison
Seven-Segment Circular Arrow Diagram Template for PowerPoint & Google Slides
Arrow
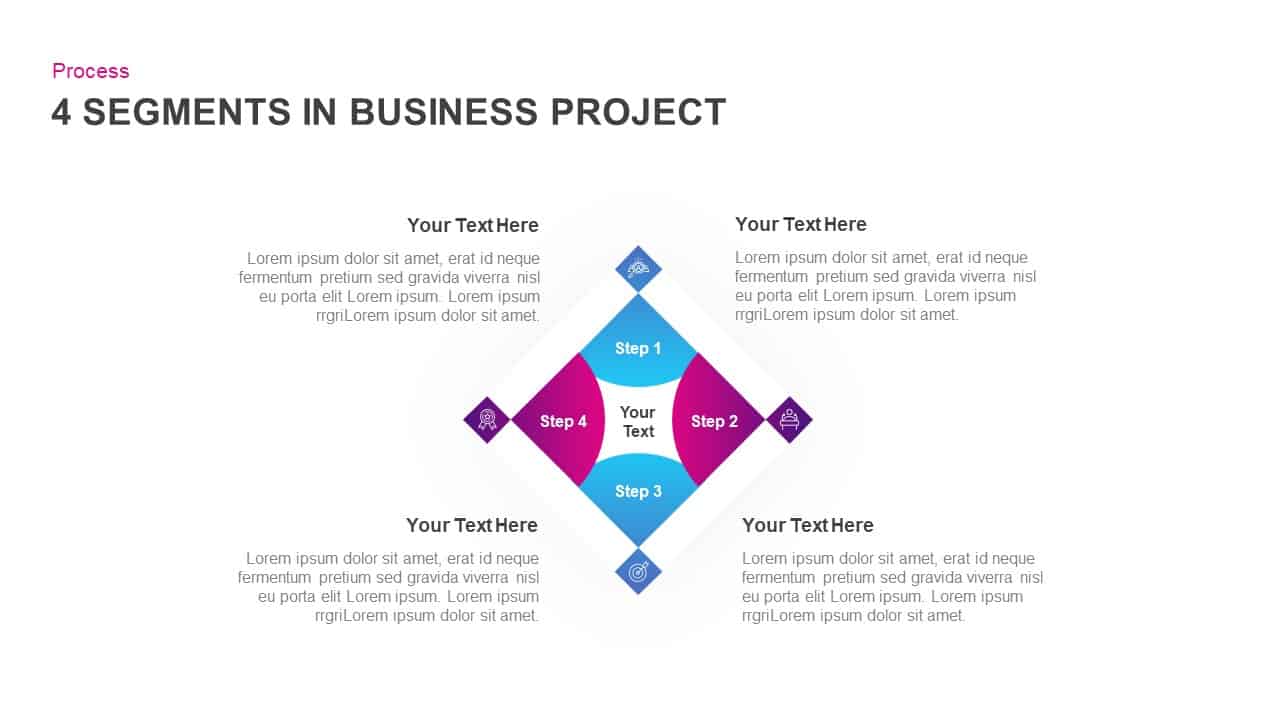
4-Segment Business Project Diamond Diagram Template for PowerPoint & Google Slides
Process
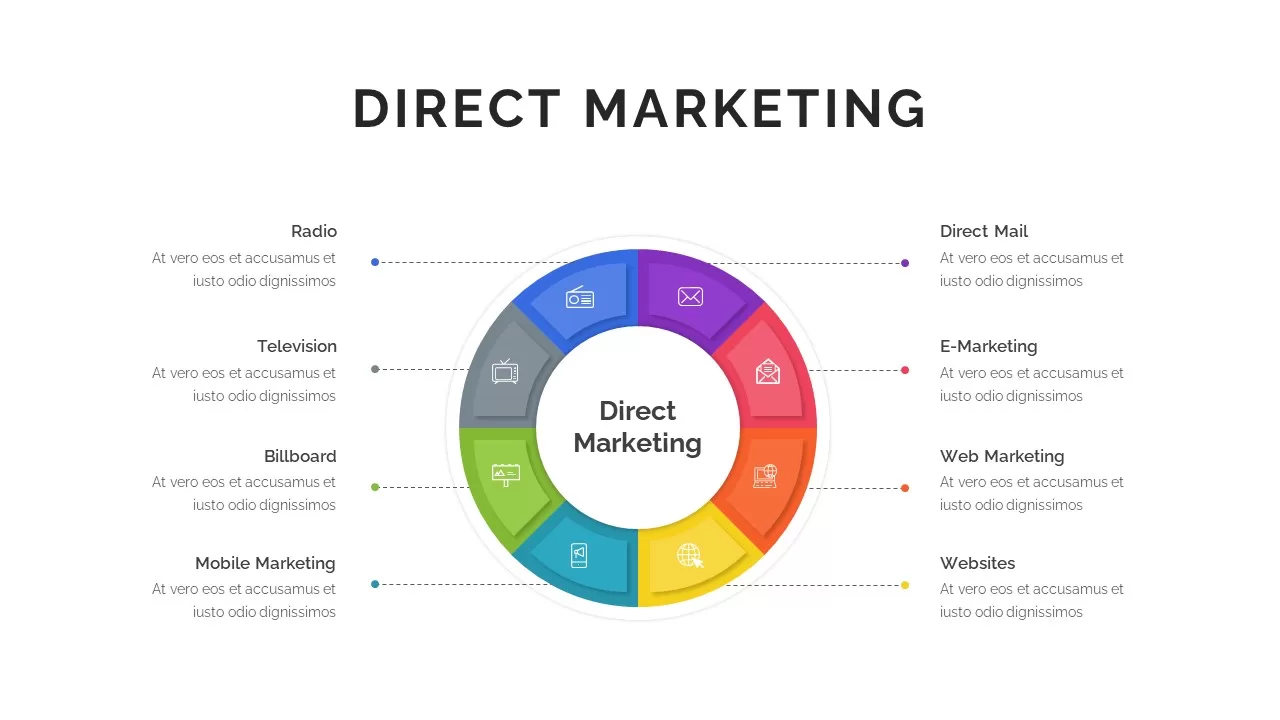
Eight-Segment Direct Marketing Wheel Template for PowerPoint & Google Slides
Circular
Three-Segment Circular Arrow Cycle Template for PowerPoint & Google Slides
Circular
Four-Segment Circular Arrow Cycle Template for PowerPoint & Google Slides
Circular
Colorful Four-Segment Wheel Chart Template for PowerPoint & Google Slides
Circular
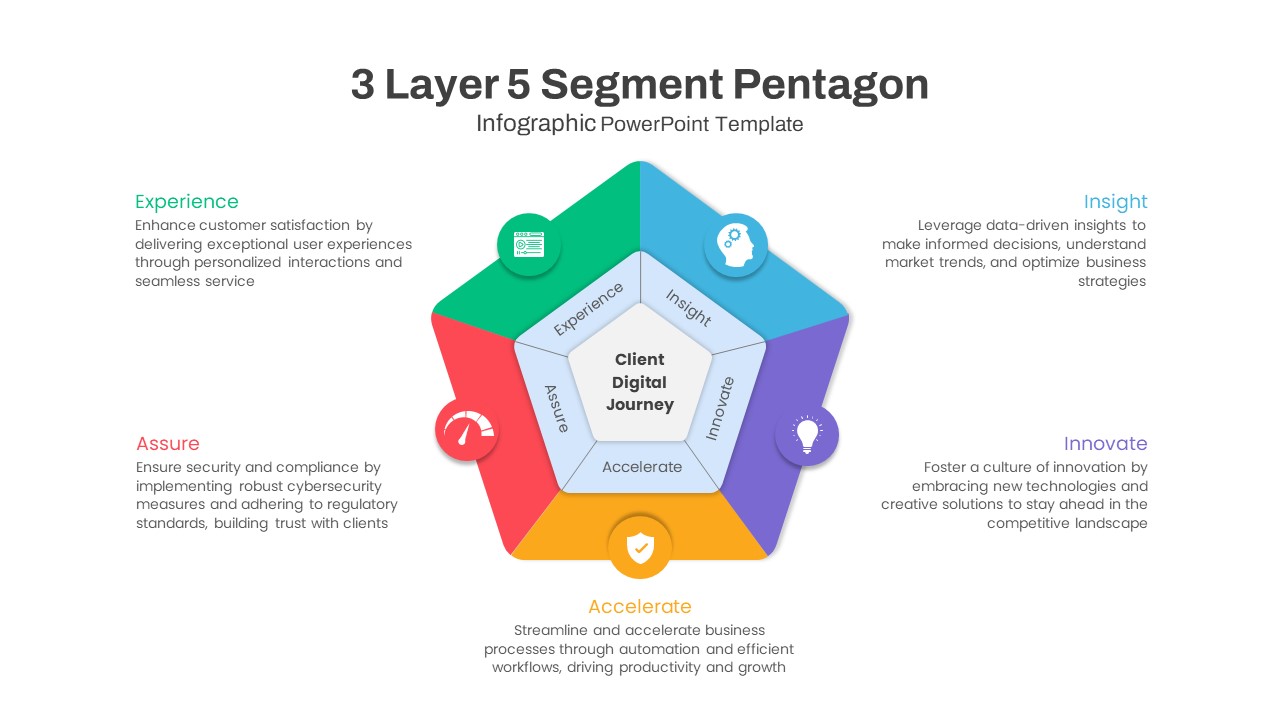
Five-Segment Pentagon Digital Journey Template for PowerPoint & Google Slides
Process
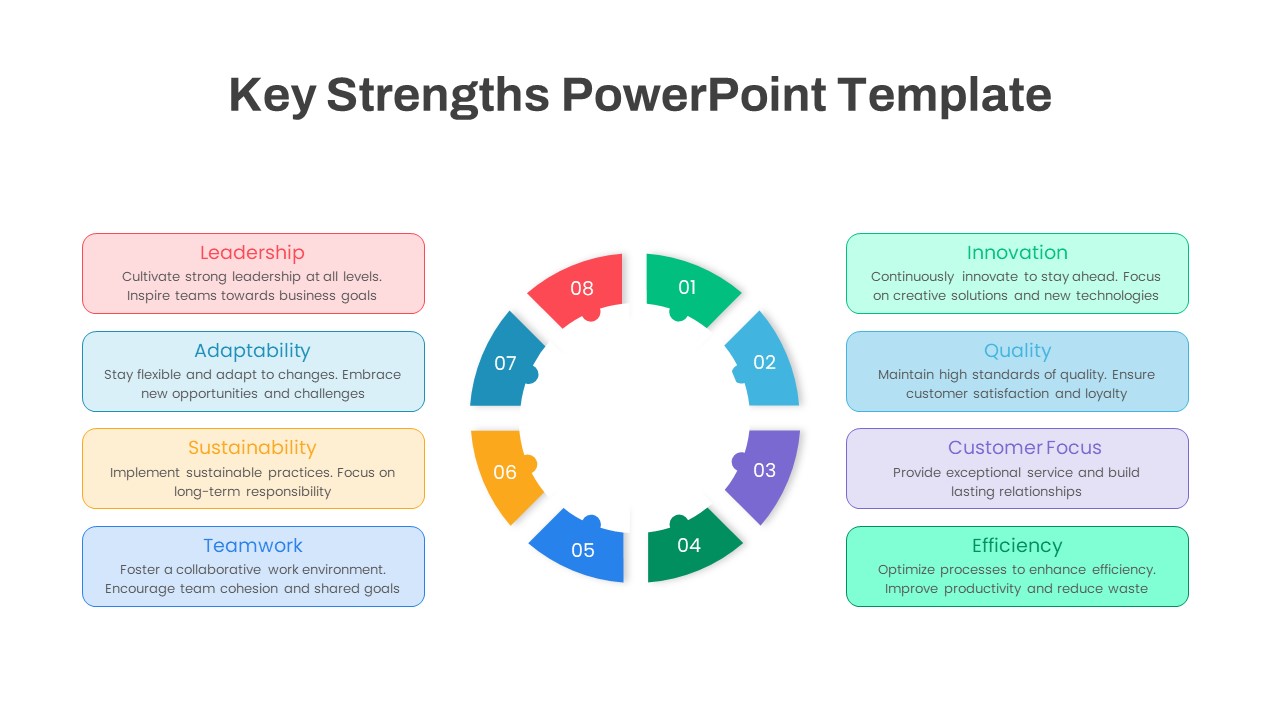
Eight-Segment Key Strengths Diagram Template for PowerPoint & Google Slides
Circular
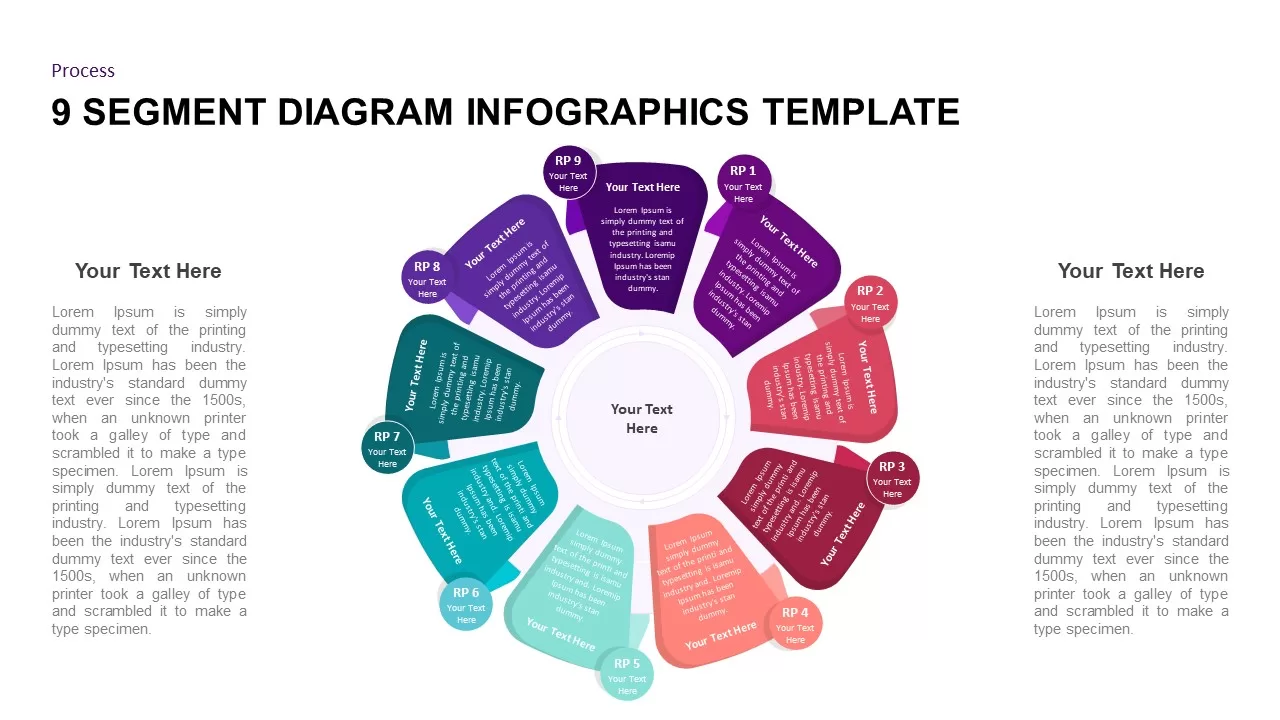
9 Segment Diagram Infographics for PowerPoint & Google Slides
Process
Six Double Diamond Infographic Slides Template for PowerPoint & Google Slides
Process
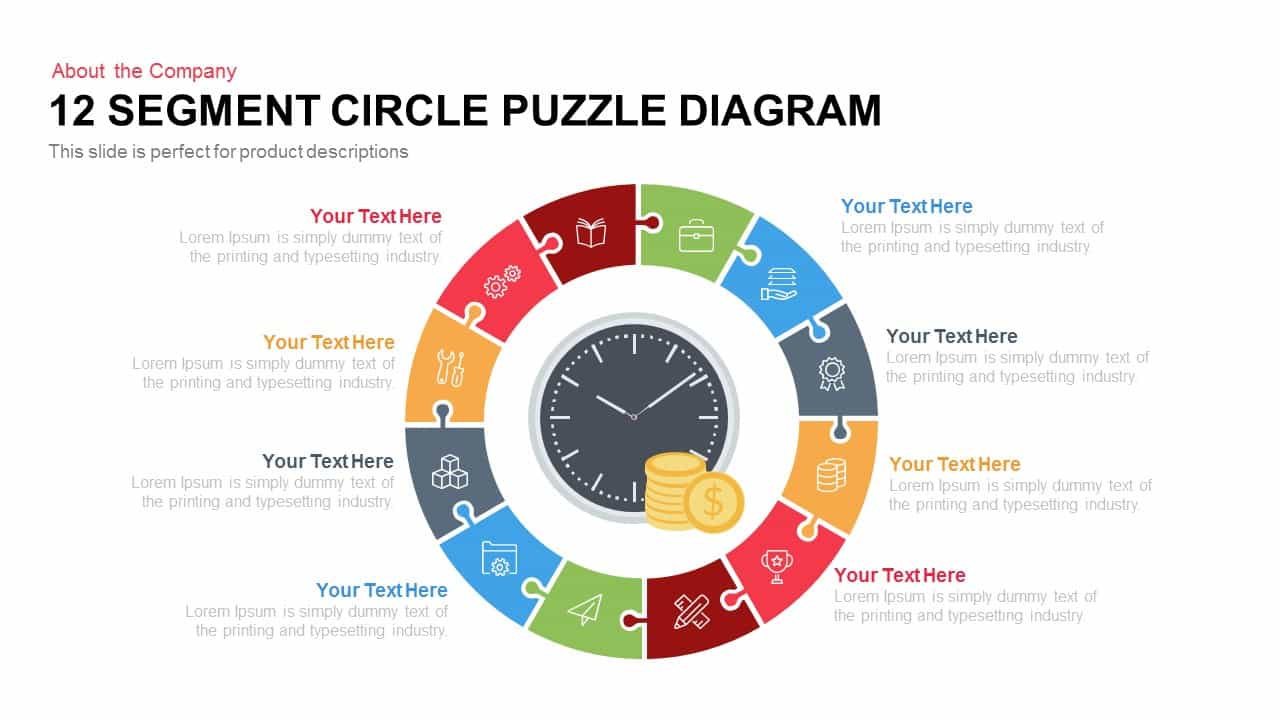
12 Segment Circle Puzzle Diagram Template for PowerPoint and Keynote
Circular
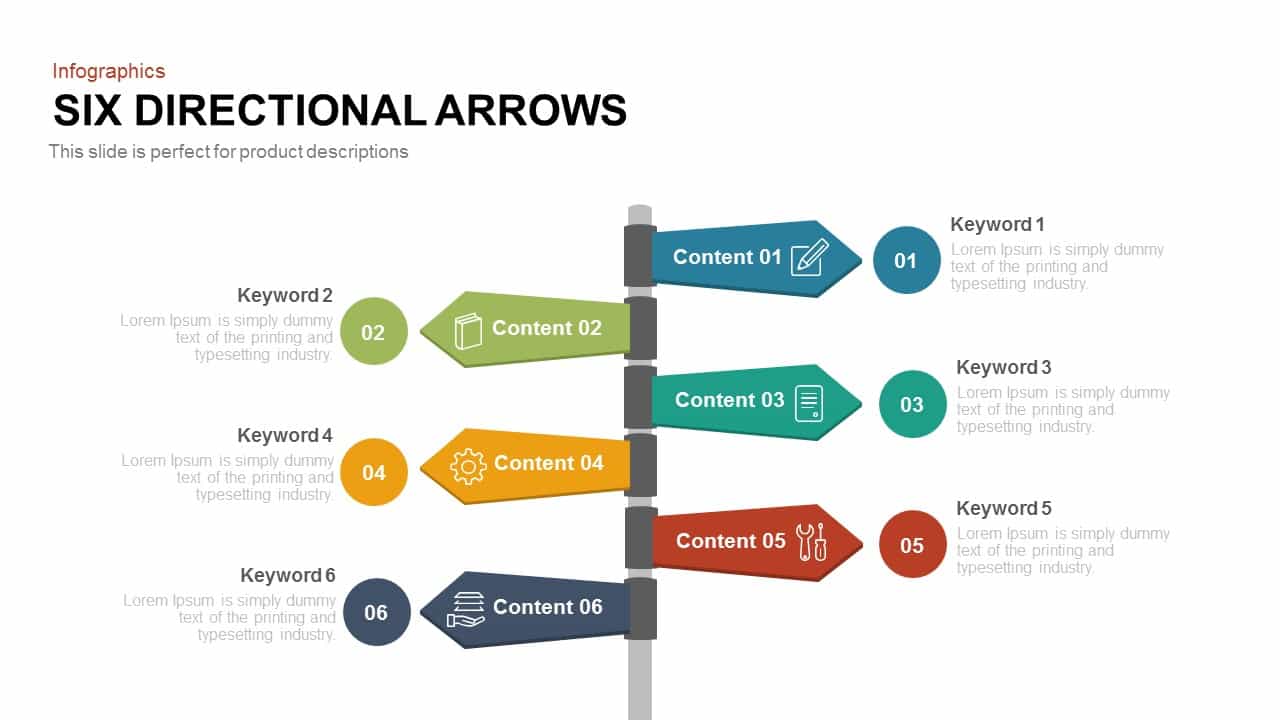
Six Directional Arrows Infographic Template for PowerPoint & Google Slides
Arrow
Six Section Circular Infographic Diagram Template for PowerPoint & Google Slides
Circular
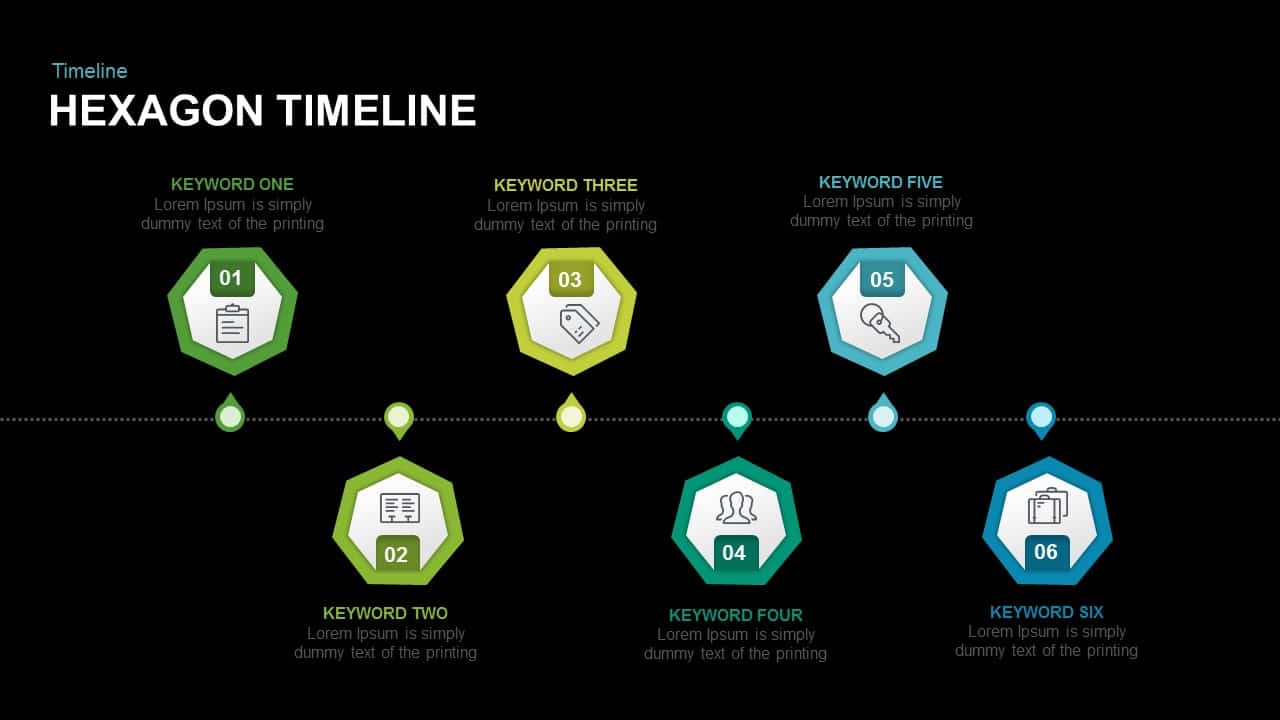
Six-Stage Hexagon Timeline Infographic Template for PowerPoint & Google Slides
Timeline
Six-Section Star Infographic Diagram Template for PowerPoint & Google Slides
Circular
Six-Stage Timeline Infographic Template for PowerPoint & Google Slides
Timeline
Six-Stage Star Diagram Infographic Template for PowerPoint & Google Slides
Process
Six-Step Roadmap Infographic Template for PowerPoint & Google Slides
Roadmap
Six Sigma 6S Process Infographic Diagram Template for PowerPoint & Google Slides
Process
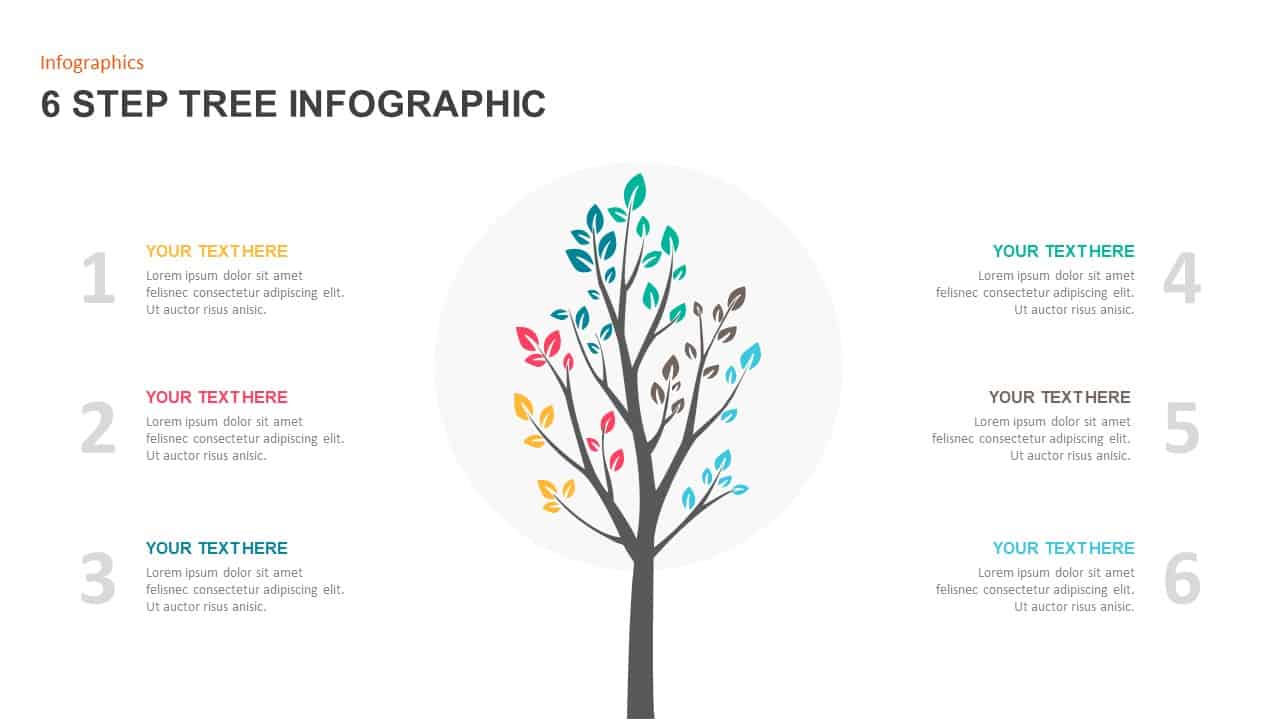
Six-Step Tree Diagram Infographic Template for PowerPoint & Google Slides
Infographics
Six-Circle Process Infographic Diagram Template for PowerPoint & Google Slides
Circular
Six-Stage Road Map Infographic Timeline Template for PowerPoint & Google Slides
Roadmap
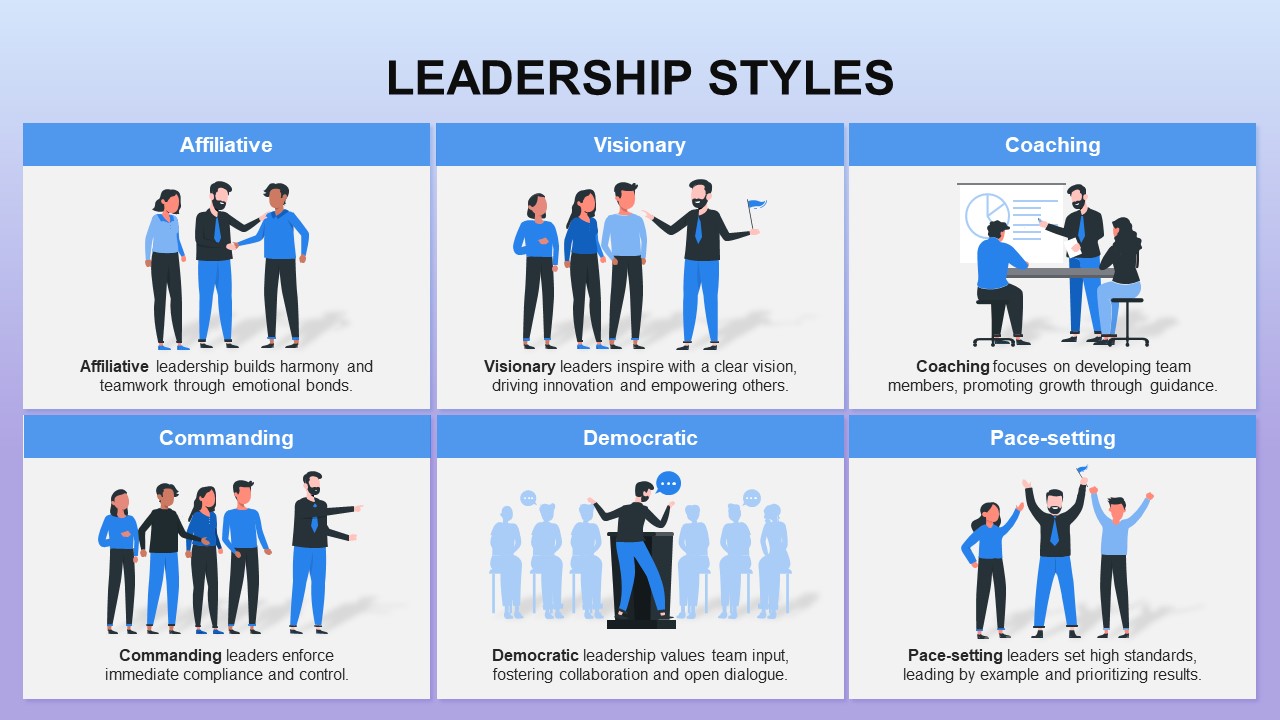
Six Leadership Styles Grid Infographic Template for PowerPoint & Google Slides
Leadership
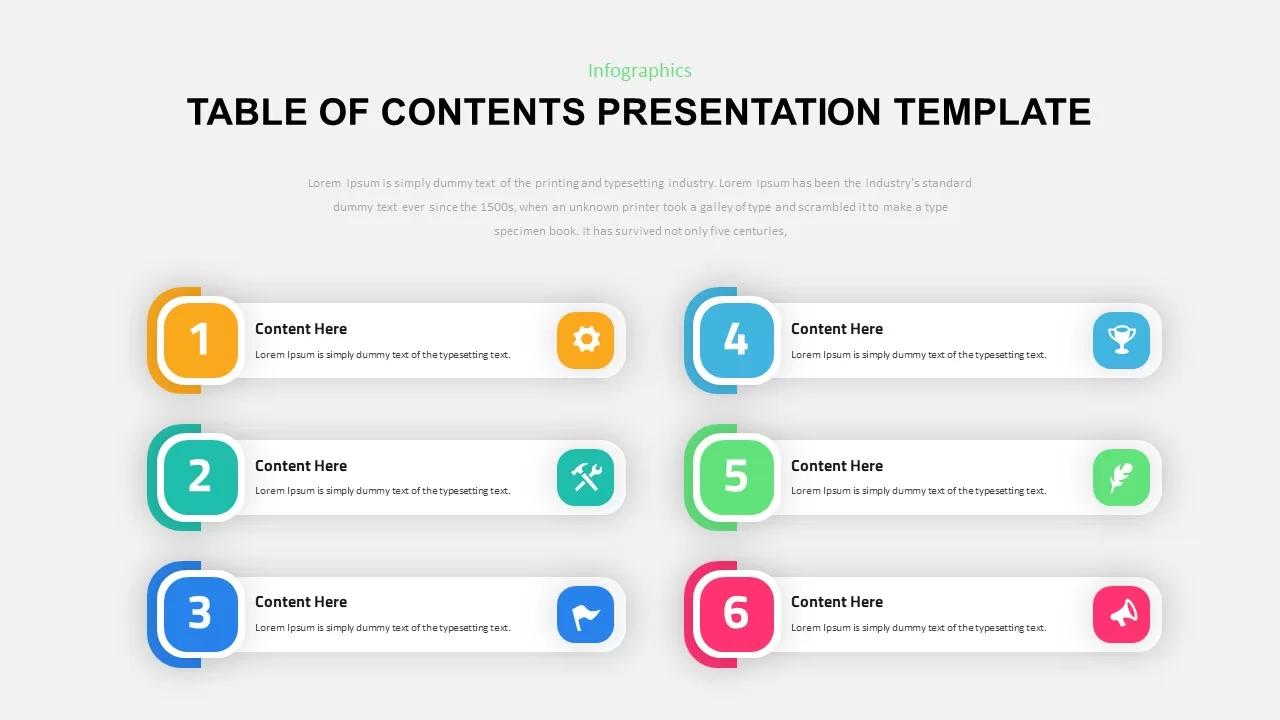
Six-Step Table of Contents Infographic Template for PowerPoint & Google Slides
Agenda
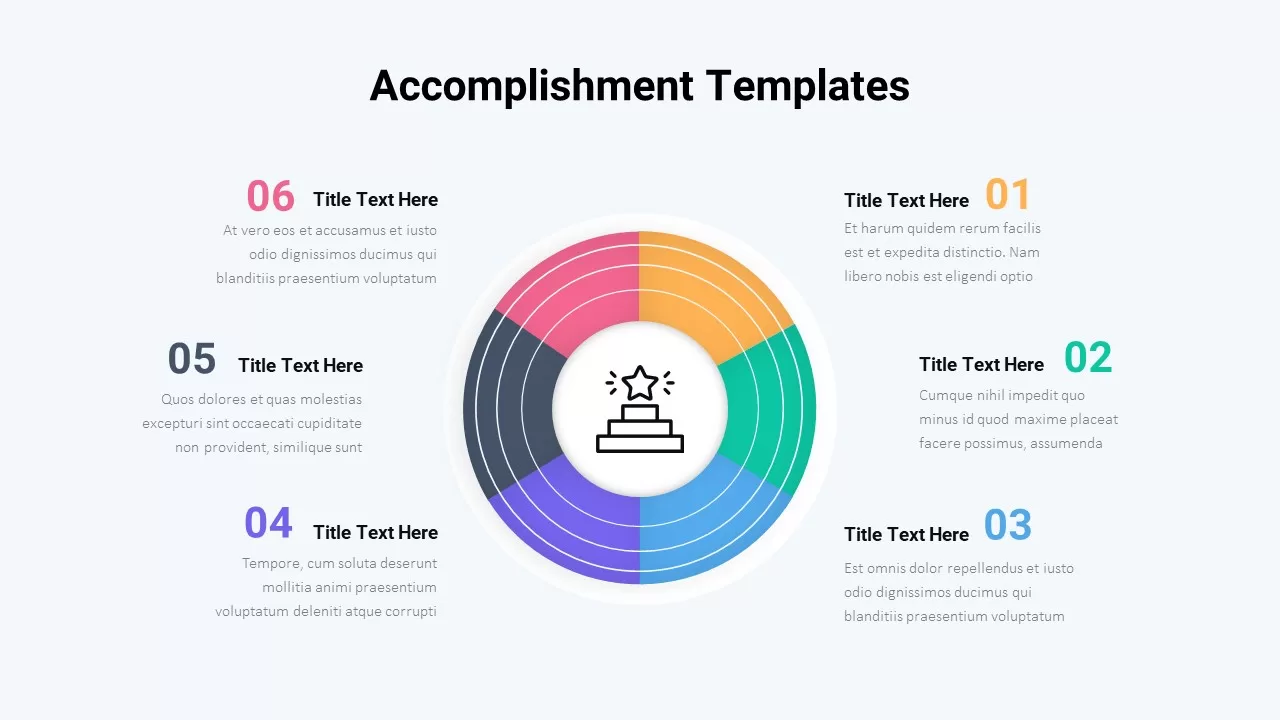
Six-Step Accomplishment Radial Infographic Template for PowerPoint & Google Slides
Accomplishment
Six-Step Hexagon Infographic Layout Template for PowerPoint & Google Slides
Infographics
Six-Layer 3D Block Stack Infographic Template for PowerPoint & Google Slides
Process
Six-Part Hexagon Infographic Layout Template for PowerPoint & Google Slides
Infographics
Six 3D Dice Infographic Template for PowerPoint & Google Slides
Process
Six Core Values Infographic Timeline Template for PowerPoint & Google Slides
Comparison
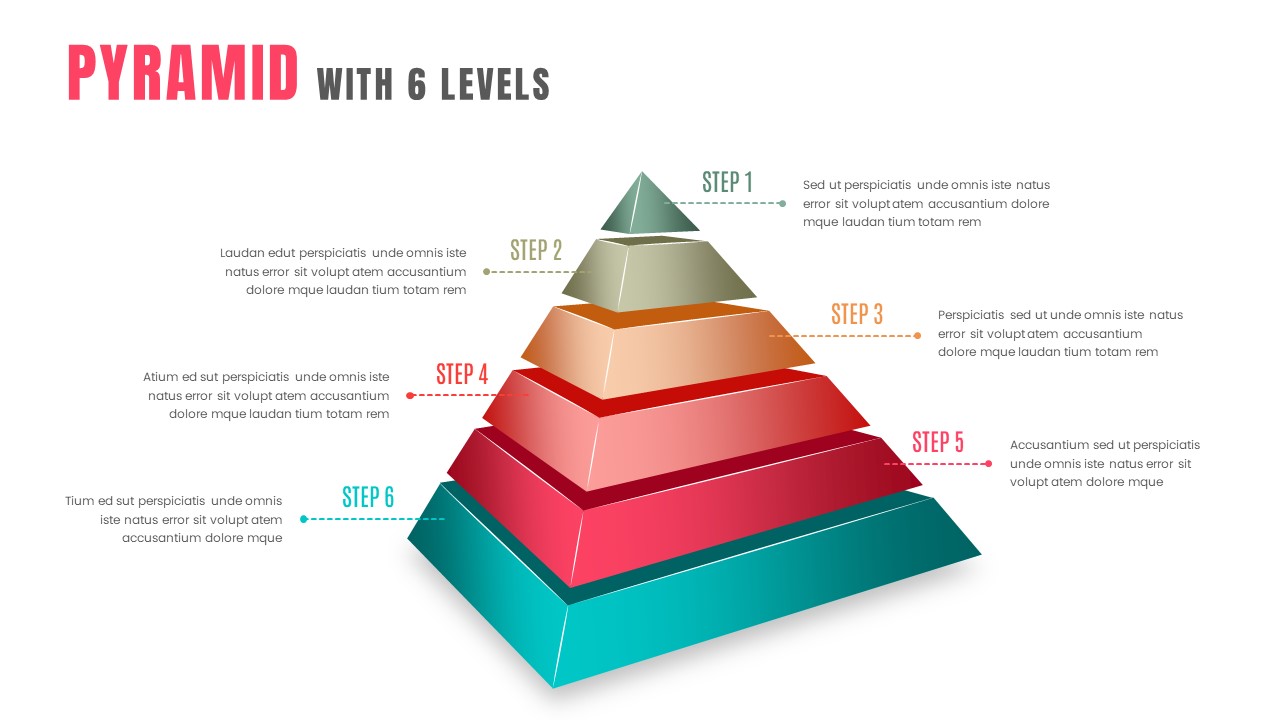
3D Six-Level Pyramid Diagram Infographic Template for PowerPoint & Google Slides
Pyramid
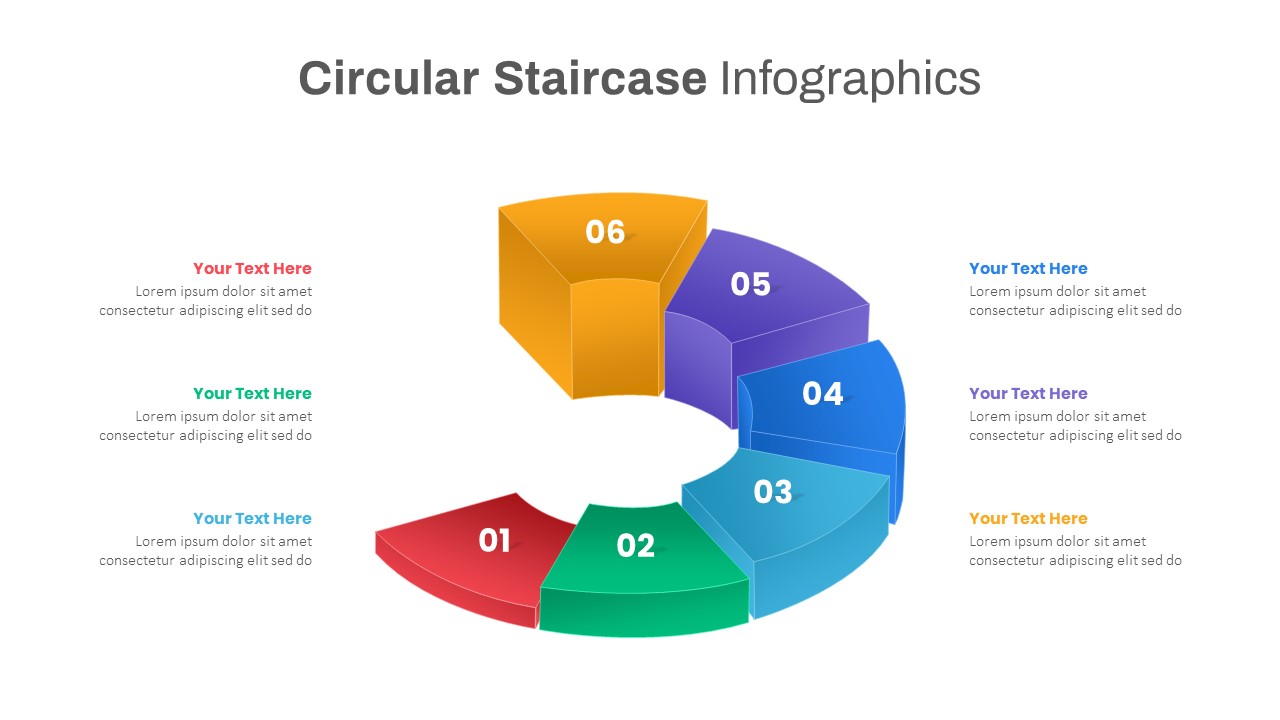
Six-Step Staircase Infographic Template for PowerPoint & Google Slides
Circular
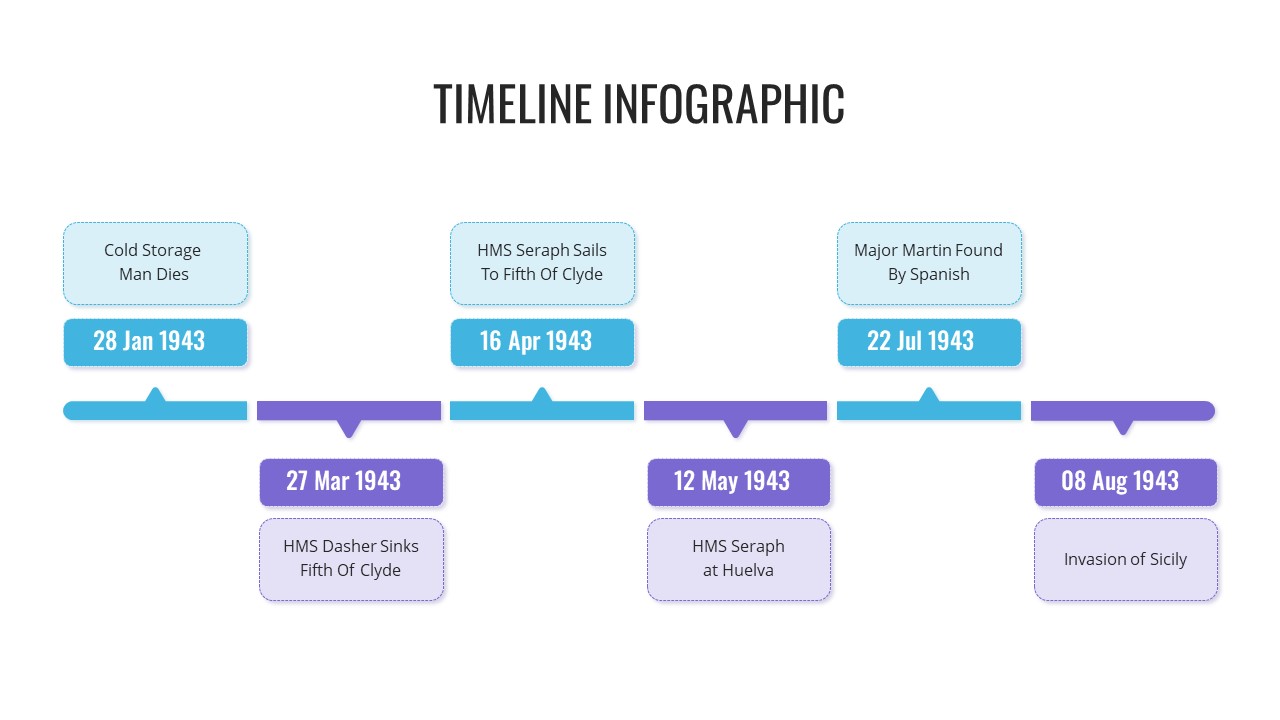
Modern Six-Point Timeline Infographic Template for PowerPoint & Google Slides
Timeline
Six Colorful Gear Shapes Infographic Template for PowerPoint & Google Slides
Process
Free
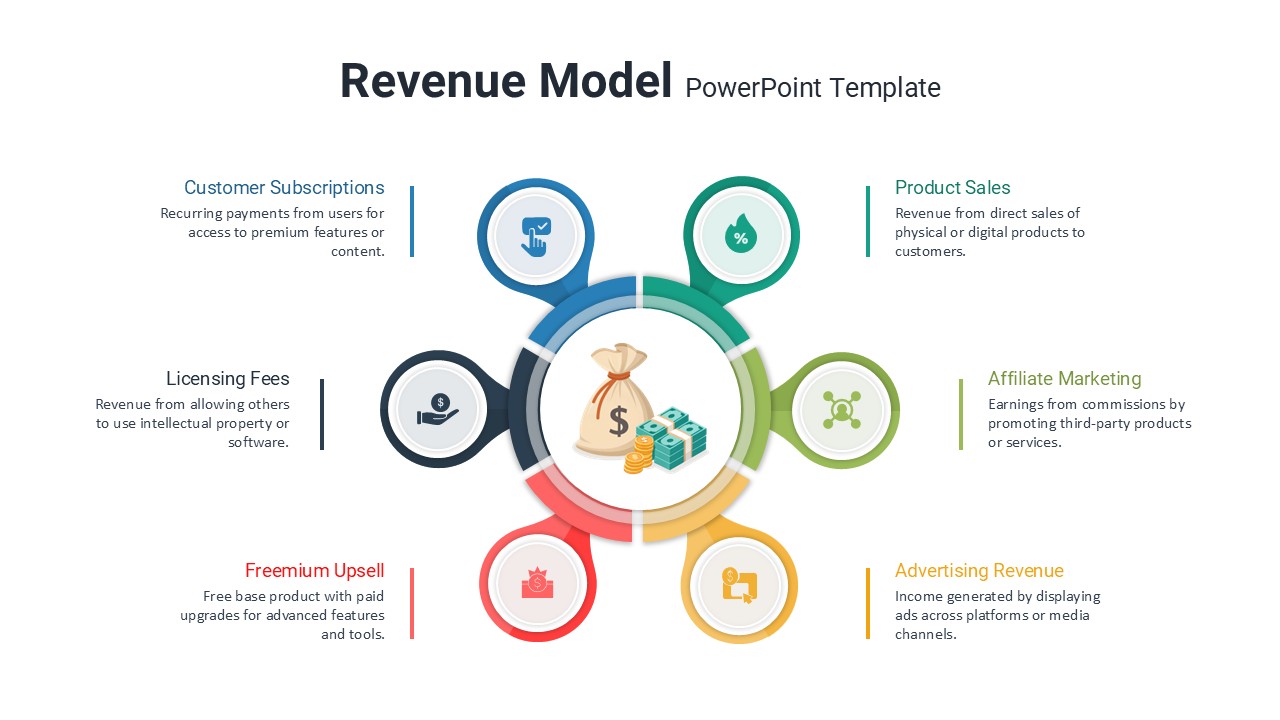
Six Revenue Stream Model Infographic Template for PowerPoint & Google Slides
Circular
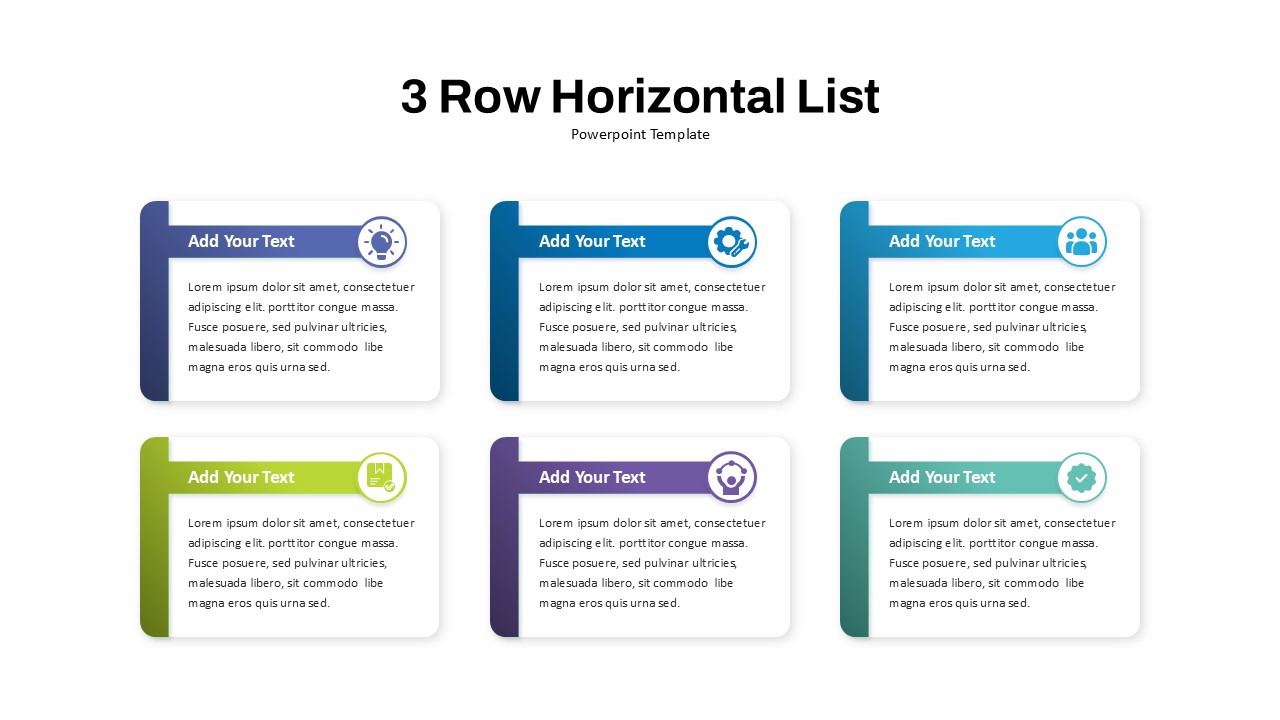
Six-Item Horizontal List Infographic Template for PowerPoint & Google Slides
Process

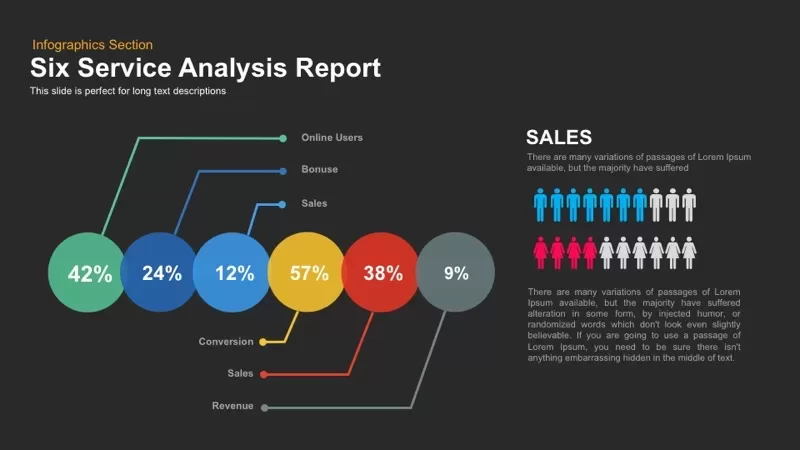
Six Service Analysis Report template for PowerPoint & Google Slides
Infographics
Six Arrow Radial Process Diagram template for PowerPoint & Google Slides
Infographics
Six Step Creative Circular Diagram Template for PowerPoint & Google Slides
Circular
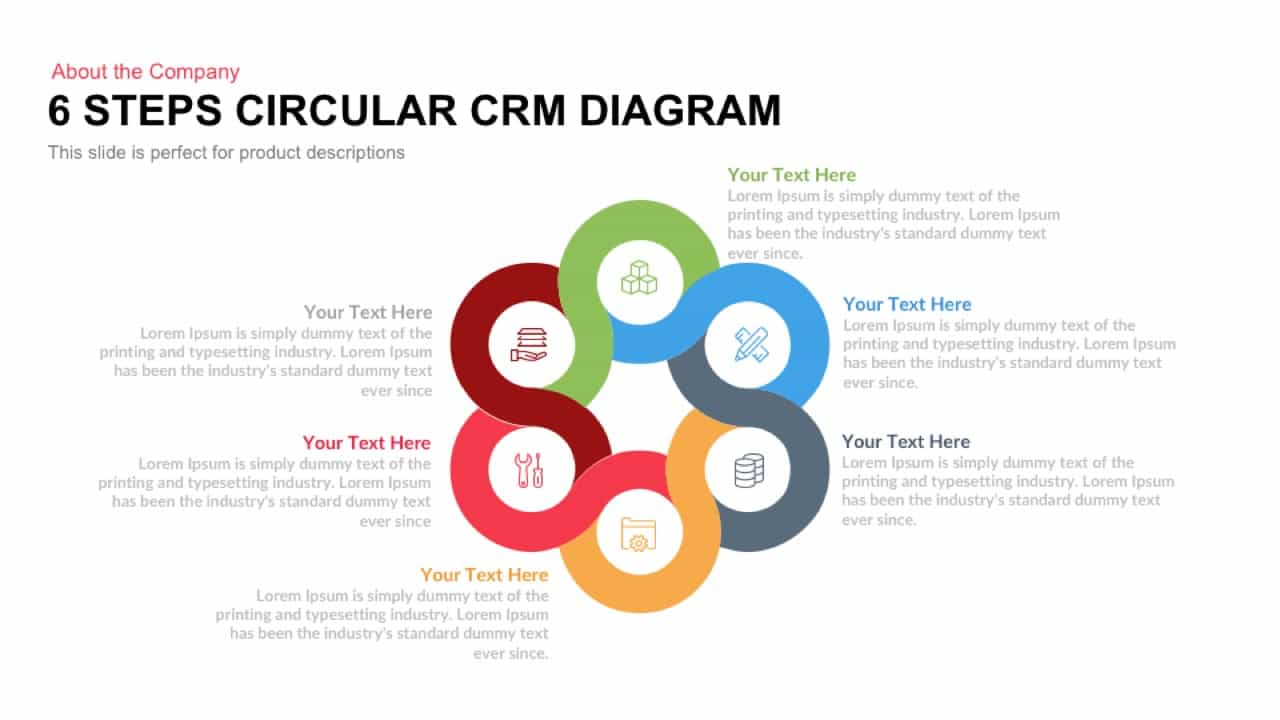
Six Steps Circular CRM Diagram Template for PowerPoint & Google Slides
Customer Journey
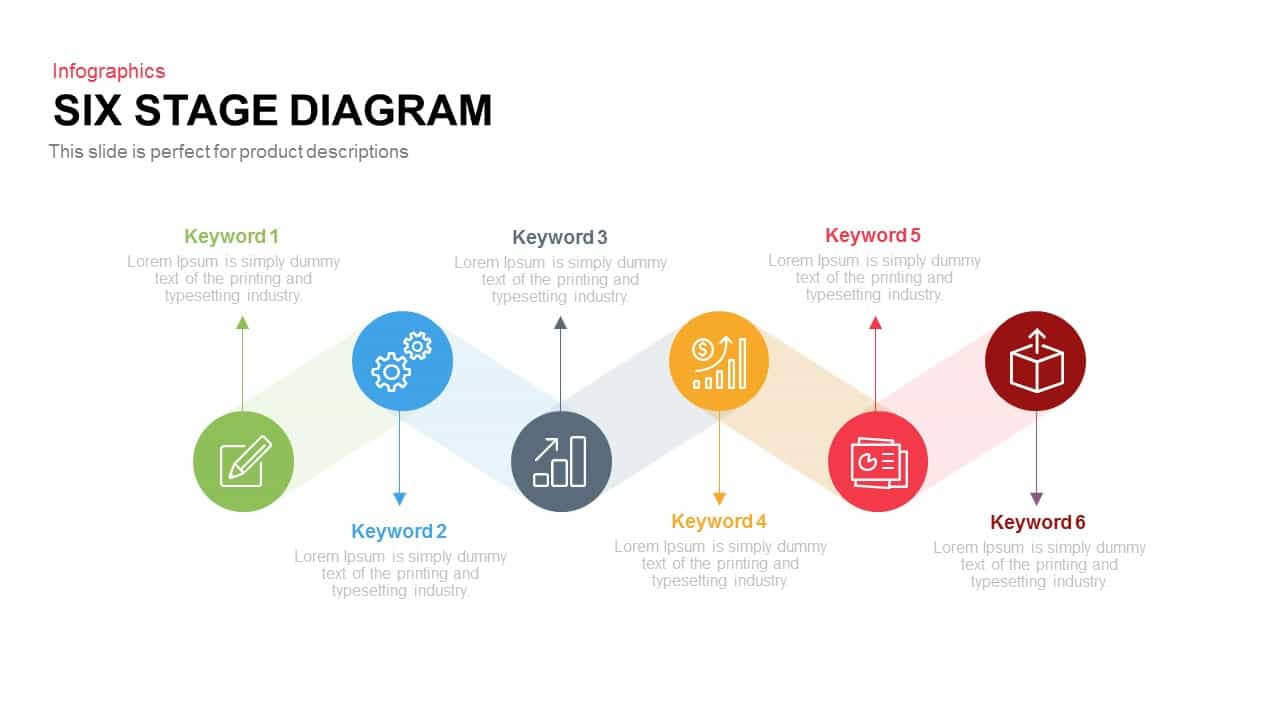
Six Stage Zigzag Process Diagram Template for PowerPoint & Google Slides
Process
Roadmap Six-Step Process Diagram Template for PowerPoint & Google Slides
Roadmap
Global Hexagon Six-Step Business Process Template for PowerPoint & Google Slides
Process
Six-Staged Gear Diagram Framework Template for PowerPoint & Google Slides
Process
Two To Six Textbox Layout Template for PowerPoint & Google Slides
Agenda
Editable Six-Step Bubble Process Diagram Template for PowerPoint & Google Slides
Process
Free Six Stage Bubble Process Diagram template for PowerPoint & Google Slides
Process
Free
Six-Step Two-Sided Arrow Diagram Template for PowerPoint & Google Slides
Process
Six-Step Hexagonal Diagram Slide Template for PowerPoint & Google Slides
Circular
Six-Stage Circle Process Diagram Template for PowerPoint & Google Slides
Process
Six-Step Vertical Process Diagram Template for PowerPoint & Google Slides
Process
Six-Section Professional Agenda Template for PowerPoint & Google Slides
Agenda
Six-Stage Service Process Workflow Template for PowerPoint & Google Slides
Process
Six-Stage Gear Wheel Diagram Template for PowerPoint & Google Slides
Circular
Six-Stage Circular Diagram Process Template for PowerPoint & Google Slides
Circular
Six-Stage Clockwise Circular Diagram Template for PowerPoint & Google Slides
Circular
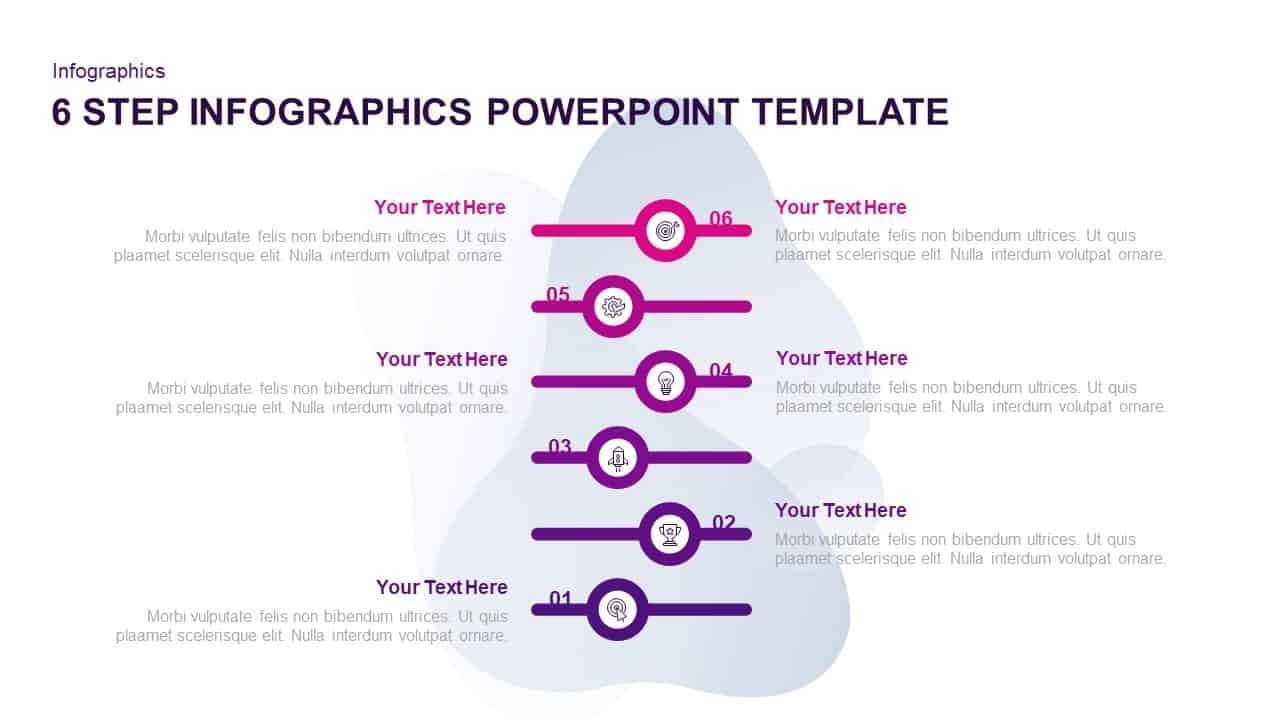
Six-Step Purple Gradient Infographics Template for PowerPoint & Google Slides
Process
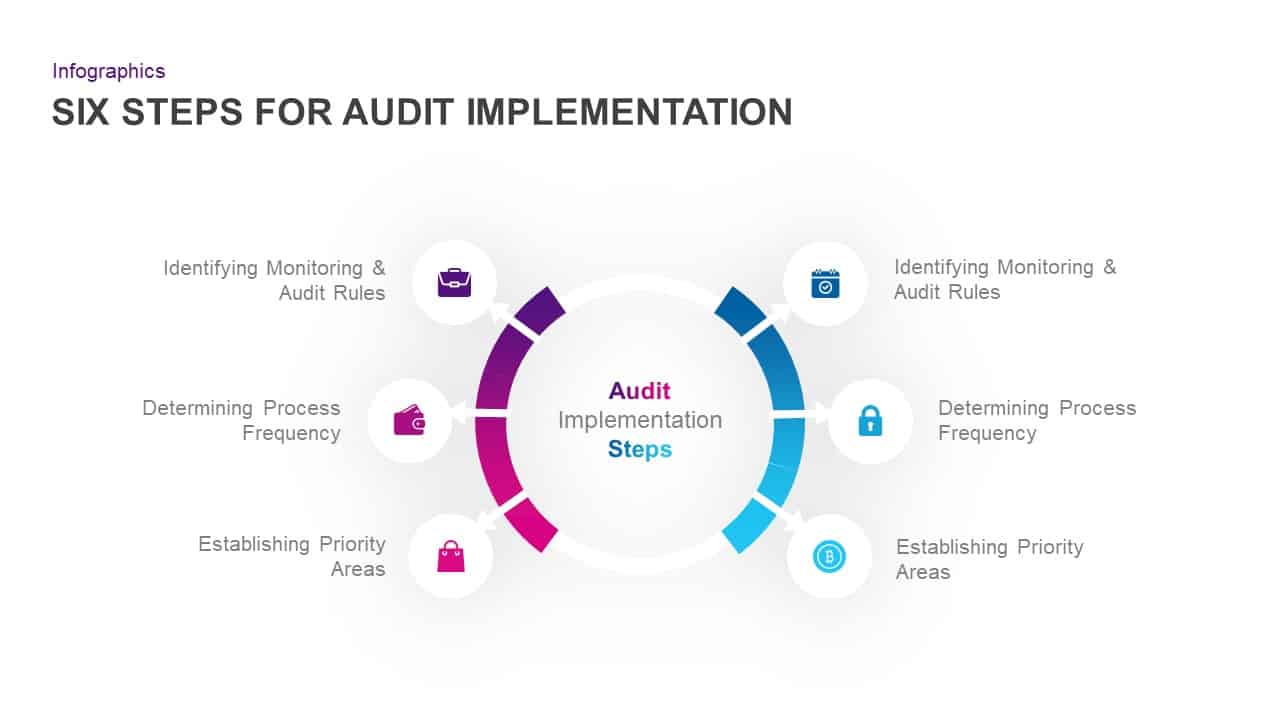
Six-Step Audit Implementation Chart Template for PowerPoint & Google Slides
Circular
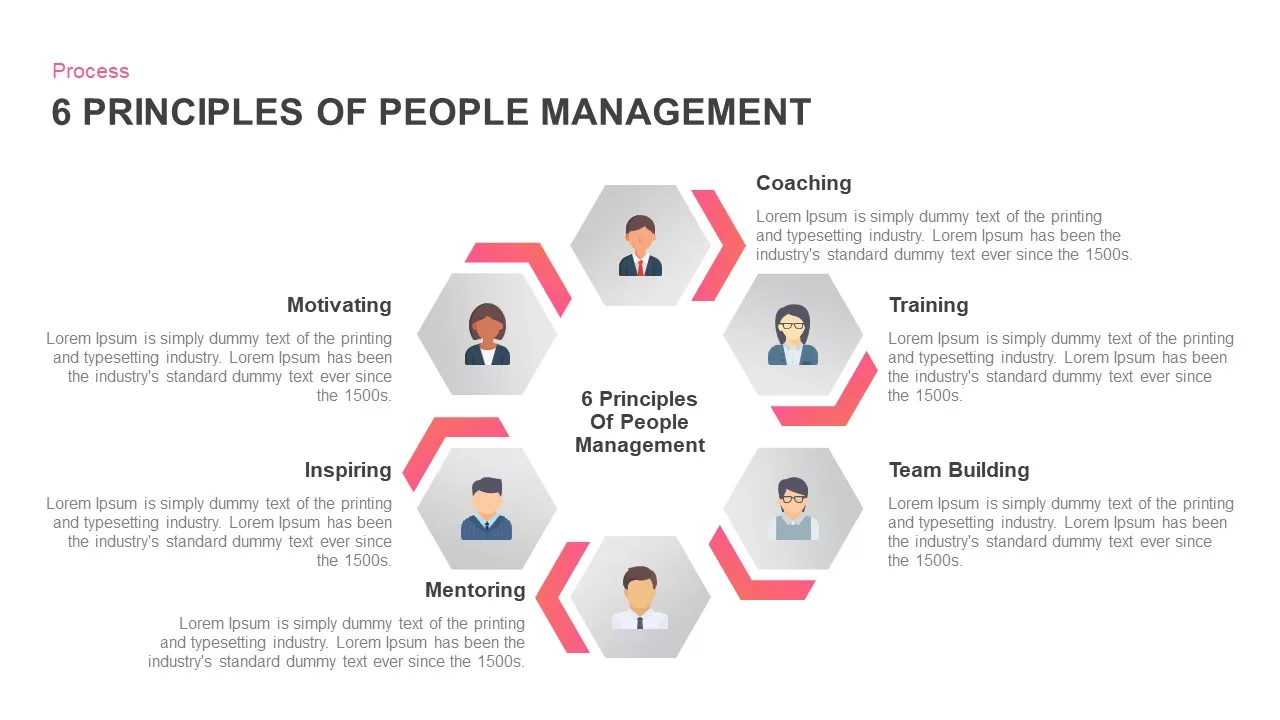
Six Principles of People Management Template for PowerPoint & Google Slides
HR
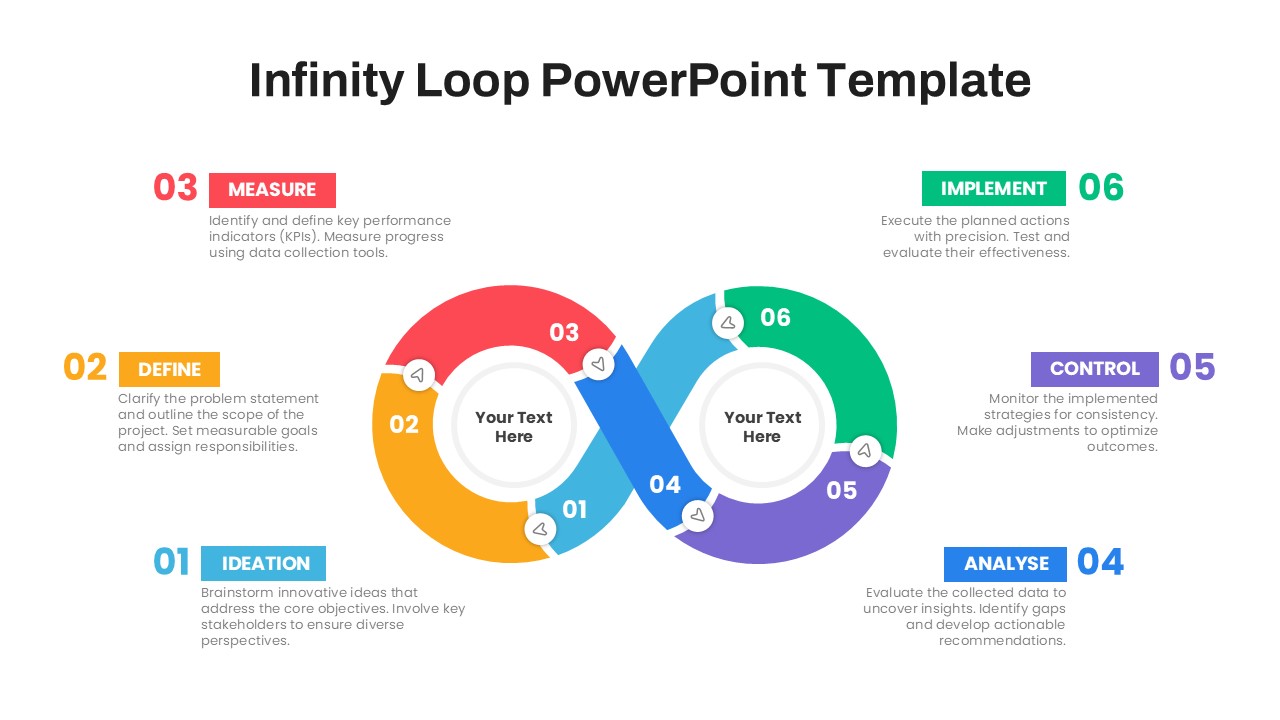
Six-Step Infinity Loop Process Diagram Template for PowerPoint & Google Slides
Process
Stacked Cubes Pyramid Six-Option Diagram Template for PowerPoint & Google Slides
Pyramid
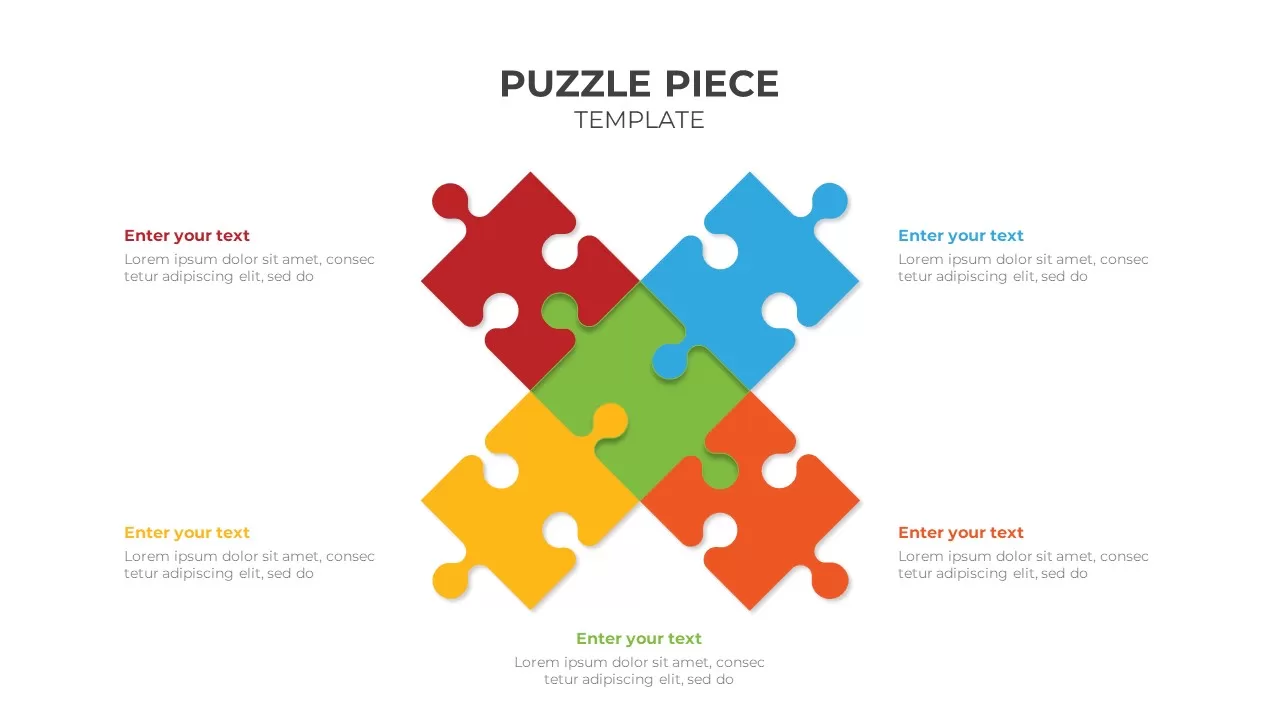
Six-Piece Puzzle Diagram Template for PowerPoint & Google Slides
Process
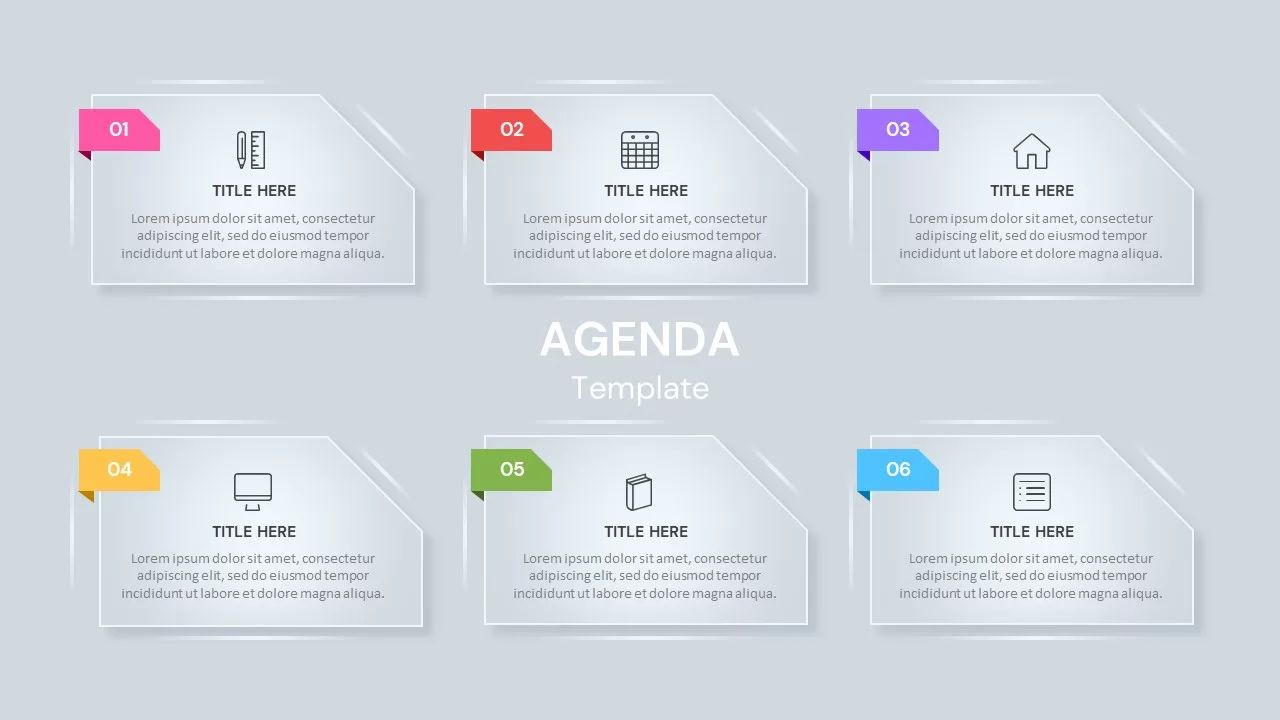
Six-Section Color-Coded Agenda Template for PowerPoint & Google Slides
Agenda
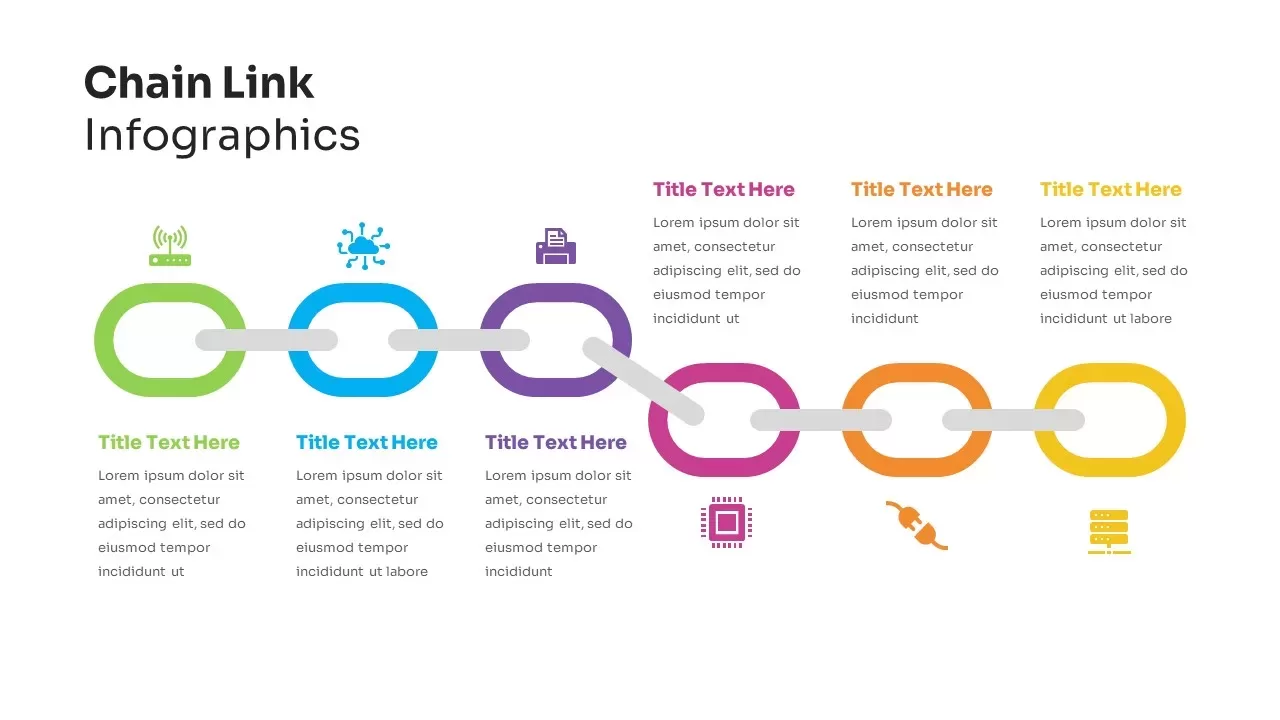
Six-Step Chain Link Technology Process Template for PowerPoint & Google Slides
Process
Six-Step Colorful Flywheel Diagram Template for PowerPoint & Google Slides
Circular
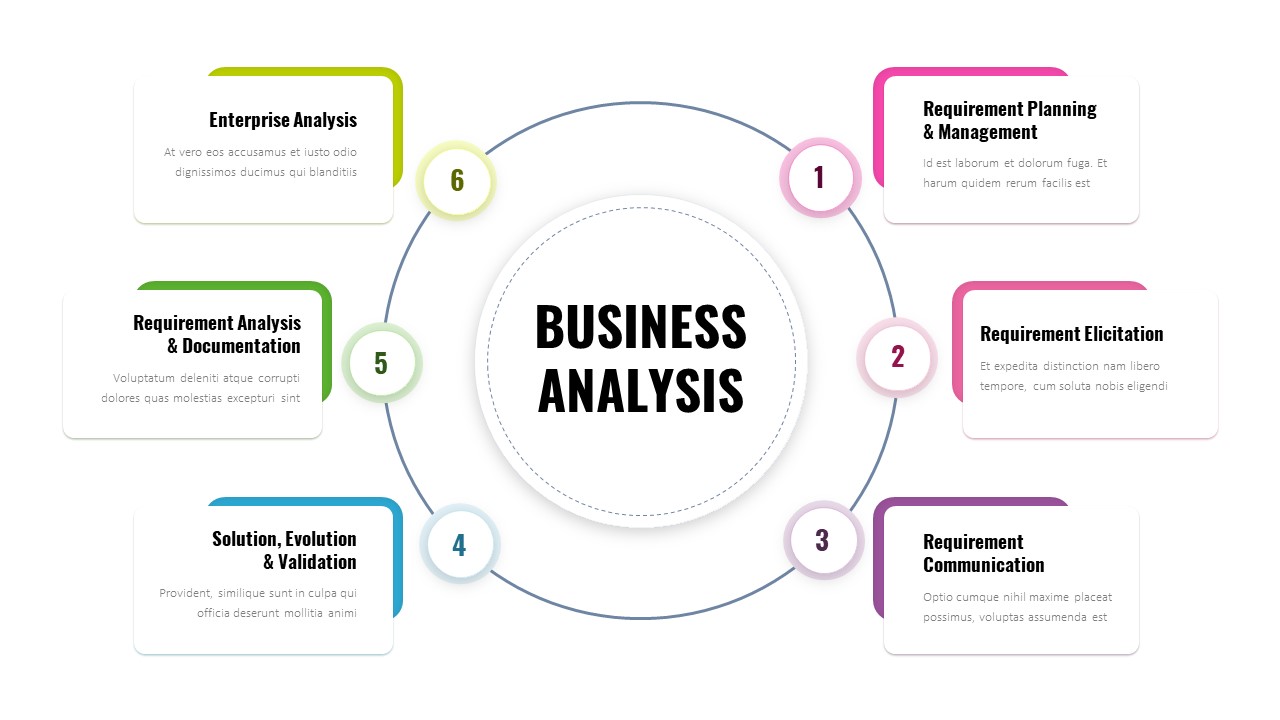
Six-Step Business Analysis Template for PowerPoint & Google Slides
Process
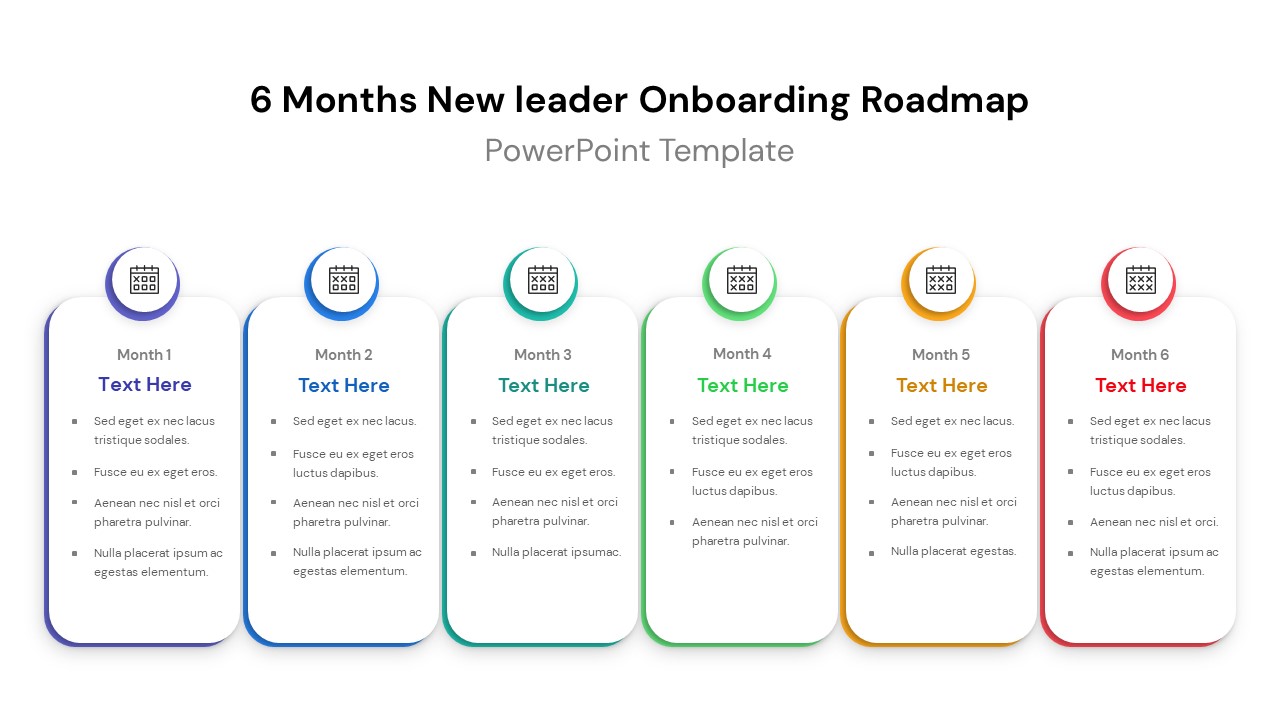
Six-Month New Leader Onboarding Roadmap Template for PowerPoint & Google Slides
Roadmap
Six-Block Capability Statement Template for PowerPoint & Google Slides
Business Report
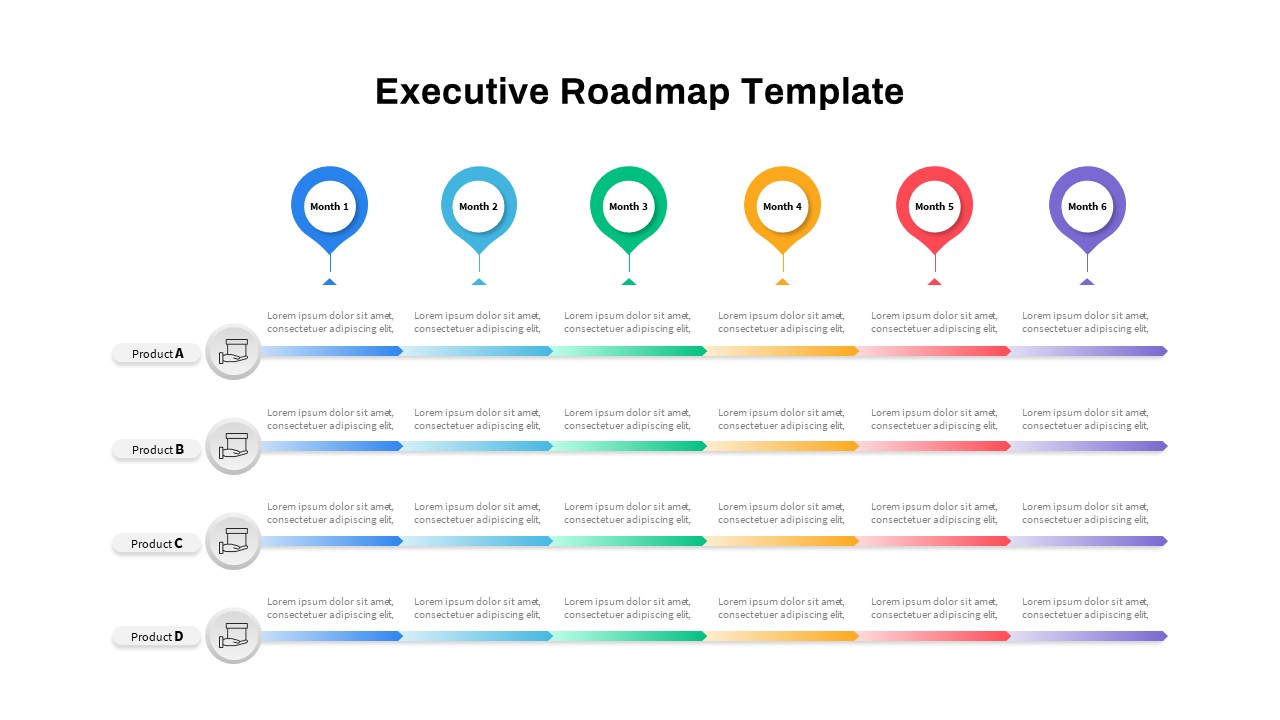
Executive Roadmap Six-Month Timeline Template for PowerPoint & Google Slides
Roadmap
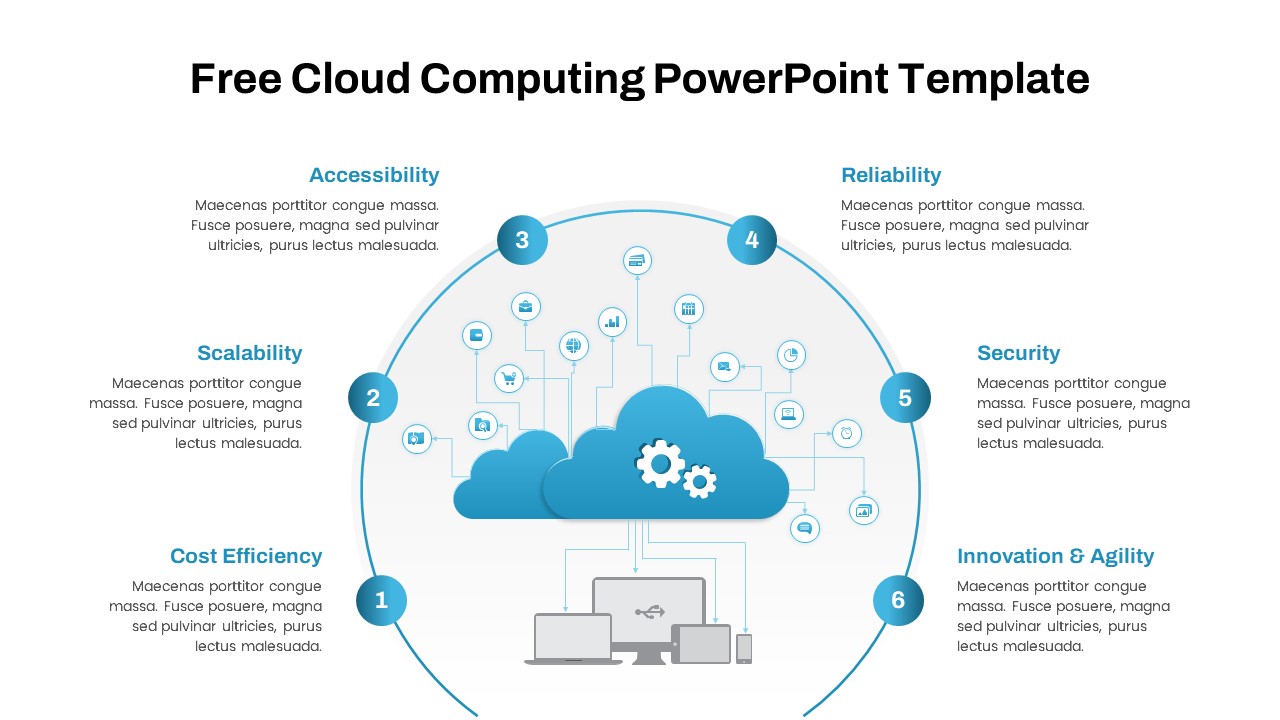
Free Cloud Computing Six-Step Circular Template for PowerPoint & Google Slides
Cloud Computing
Free
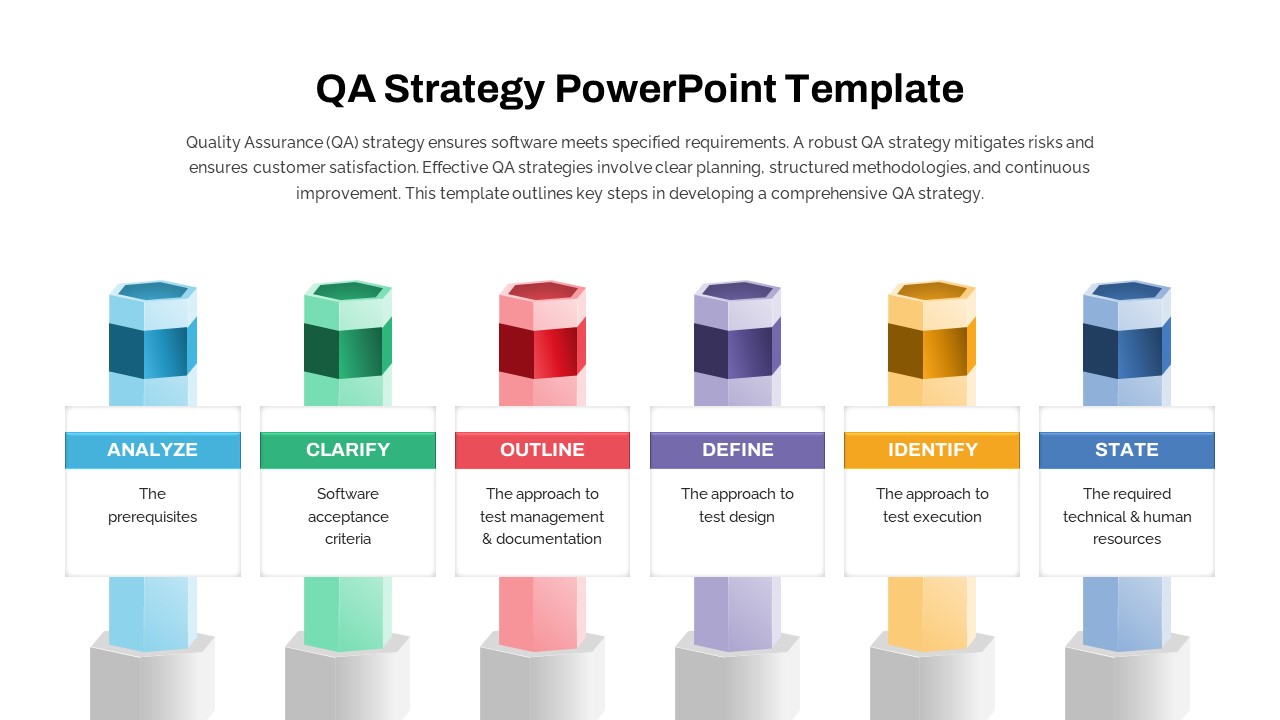
Six-Step QA Strategy Pillar Diagram Template for PowerPoint & Google Slides
Software Development
Free Choice Board Six-Option Layout Template for PowerPoint & Google Slides
Comparison
Free
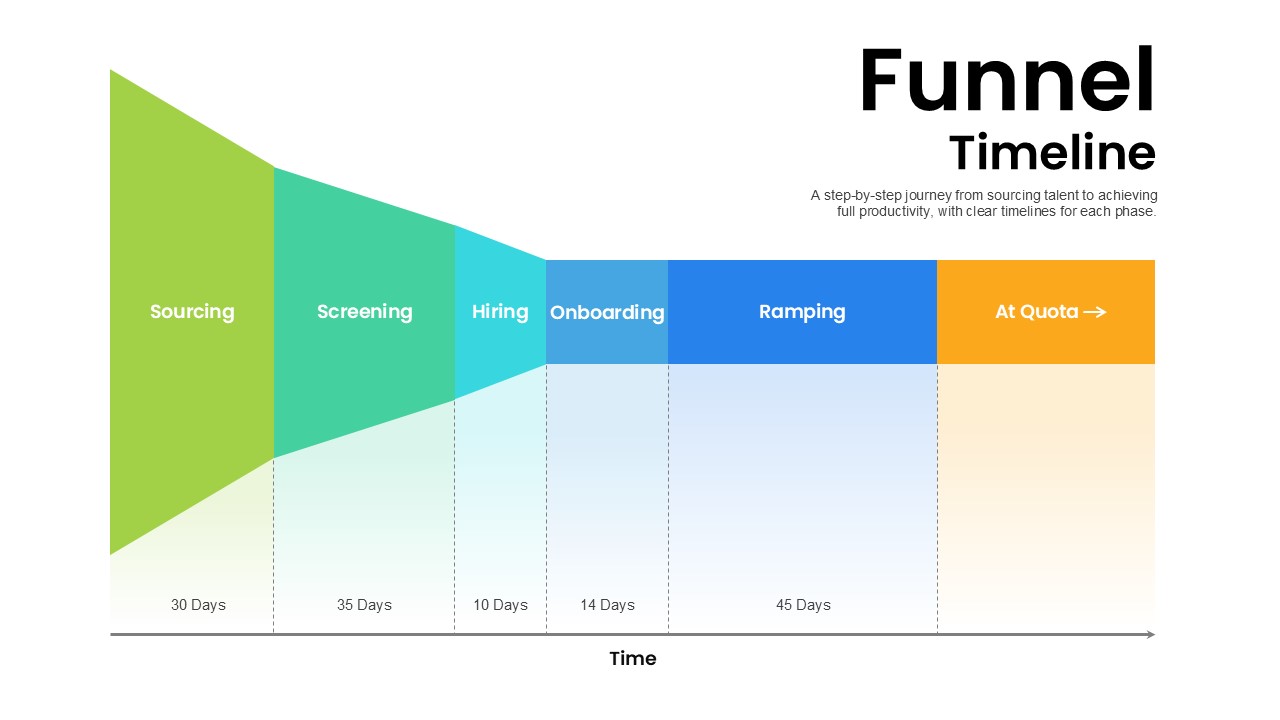
Hiring Funnel Timeline with Six Phases Template for PowerPoint & Google Slides
Recruitment
Six-Row Multi-Column Table Presentation Template for PowerPoint & Google Slides
Table
Six Column Data Table Template for PowerPoint & Google Slides
Table
Six Step Project Workflow Template for PowerPoint & Google Slides
Project
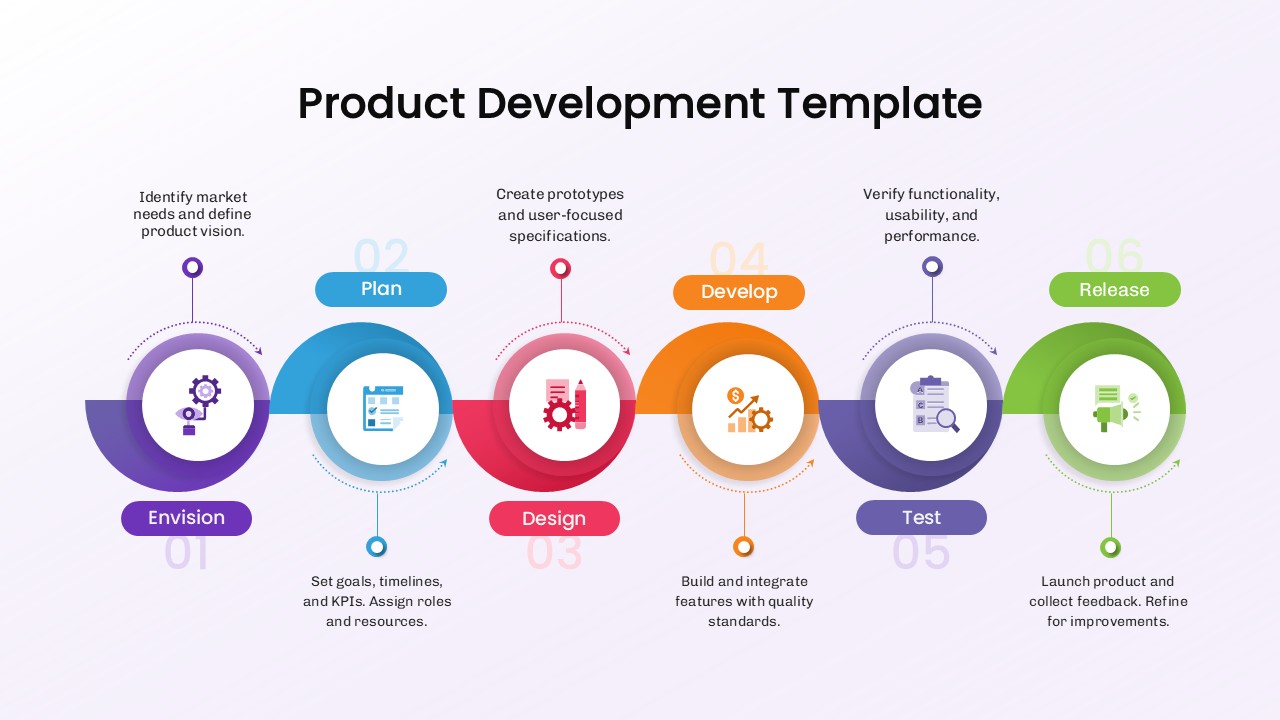
Six Stage Product Development Process Template for PowerPoint & Google Slides
Software Development
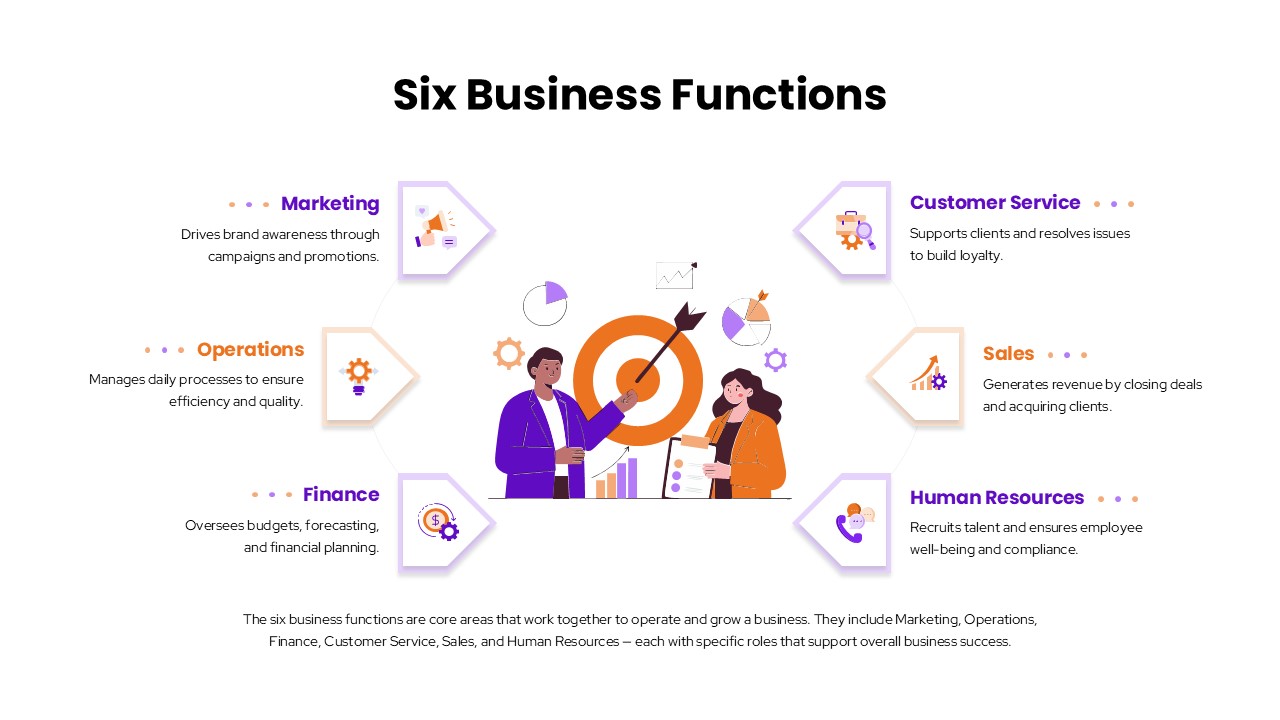
Six Business Functions Template for PowerPoint & Google Slides
Business Strategy