Six Column Table template for PowerPoint & Google Slides
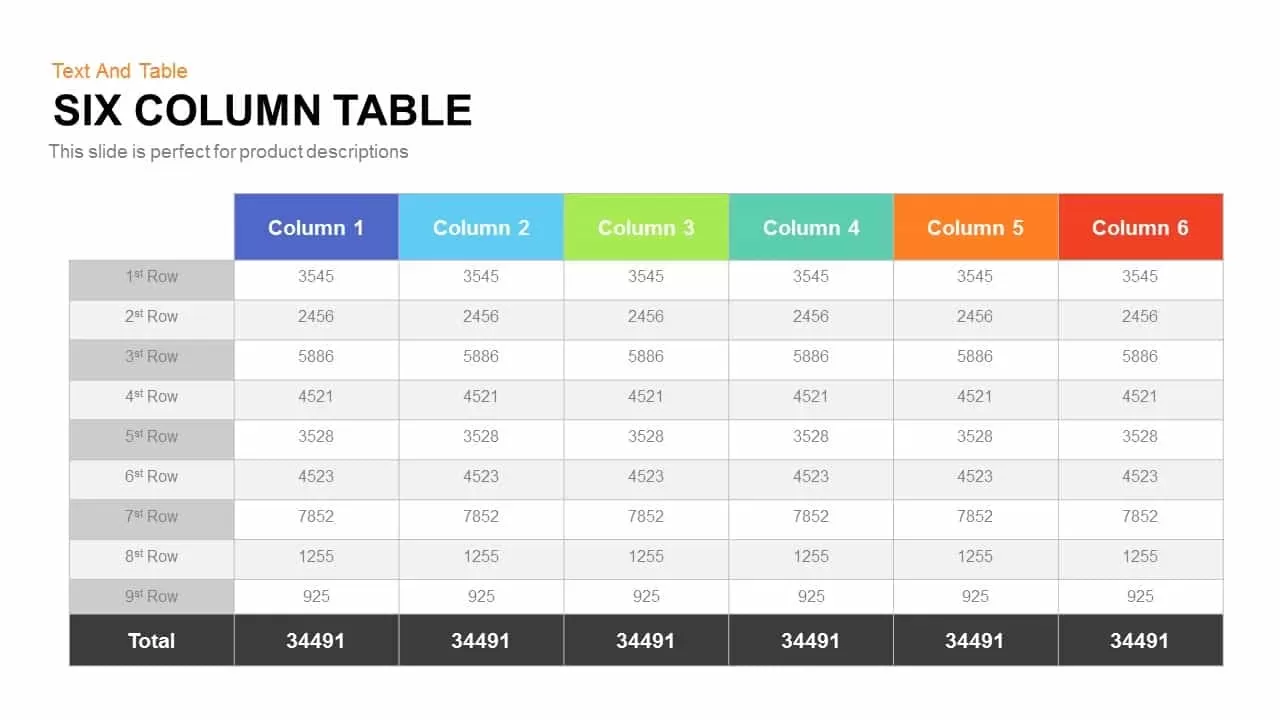
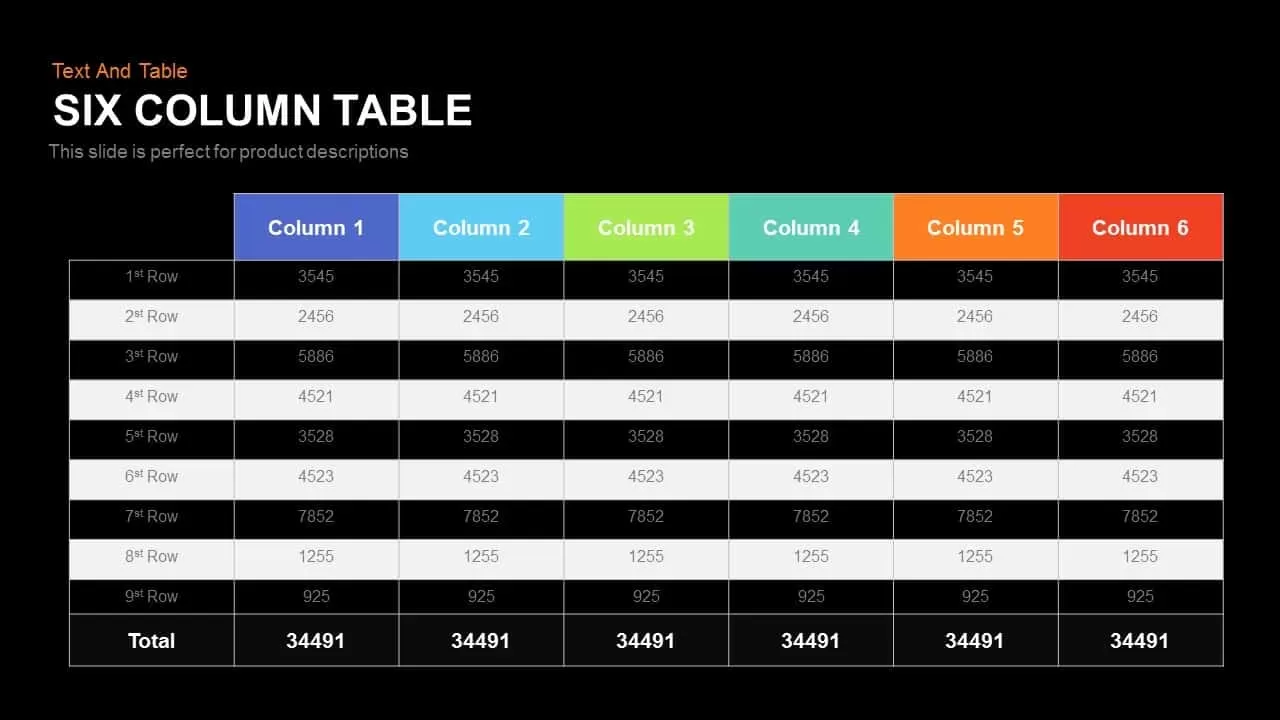
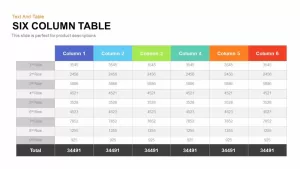
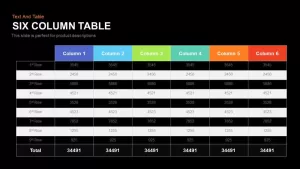
Use this six-column table slide to present detailed product specifications, pricing, or performance metrics in a clear, organized format. The template features six color-coded headers—blue, cyan, green, teal, orange, and red—allowing you to assign unique visual identities to each category or product. Rows alternate between white and light gray backgrounds to enhance readability and guide the viewer’s eye across complex data sets. A prominent total row with contrasting dark background and bold typography highlights cumulative values, making it easy to summarize key figures at a glance.
Built with fully editable master layouts, this slide scales seamlessly between 16:9 and 4:3 aspect ratios and retains razor-sharp clarity on any display. All colors, fonts, and table dimensions can be customized in both PowerPoint and Google Slides, so you can align the design with your brand guidelines. Insert your own text labels—either numeric data or descriptive copy—into the easily adjustable cells, or replace the table with your own data model for KPI reporting, financial summaries, or inventory lists.
Master slide integration ensures rapid theme updates across slides, while placeholder text and icons let you swap in custom visuals without breaking the layout. Leverage this template for product roadmaps, feature comparisons, pricing tables, or inventory audits. Its structured design supports both numeric and text entries, making it a versatile asset for sales pitches, board presentations, or operational reviews.
Who is it for
Product managers, e-commerce specialists, sales and marketing teams, business analysts, and operational managers will benefit from this table slide. It’s ideal for professionals who need to compare multiple products or metrics clearly.
Other Uses
Use this template for comparative pricing tables, inventory tracking, KPI dashboards, budget summaries, feature prioritization charts, vendor evaluations, or product roadmap overviews. It also adapts well to financial reporting, inventory audits, or resource allocation reviews.
Login to download this file

Item ID
SB00298
Related Templates

Six-Row Multi-Column Table Presentation Template for PowerPoint & Google Slides
Table
Six Column Data Table Template for PowerPoint & Google Slides
Table
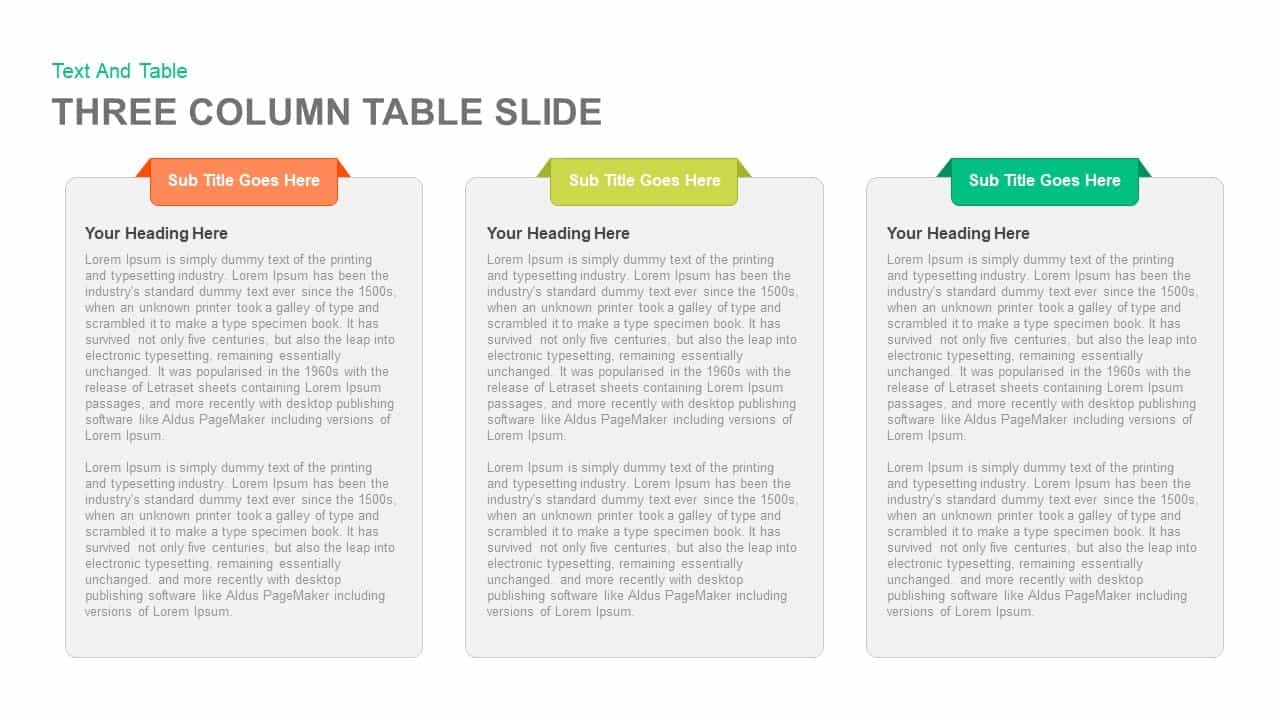
Clean Three-Four Column Table Slide Template for PowerPoint & Google Slides
Business Report
Multi-Column Table Presentation Template for PowerPoint & Google Slides
Table
Colorful Four-Column Table Layout Template for PowerPoint & Google Slides
Table
Five Column Comparison Table Layout Template for PowerPoint & Google Slides
Comparison
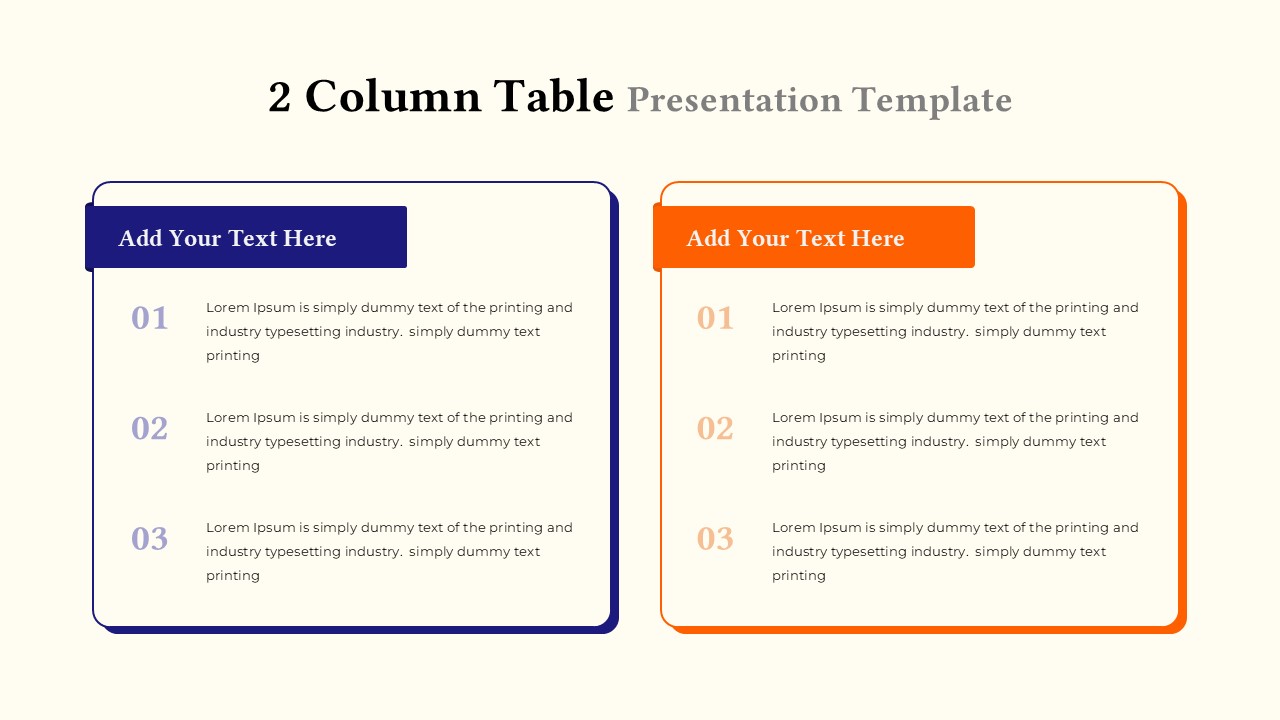
Two-Column Table Presentation Template for PowerPoint & Google Slides
Table

3D Column Chart with Data Table for PowerPoint & Google Slides
Bar/Column
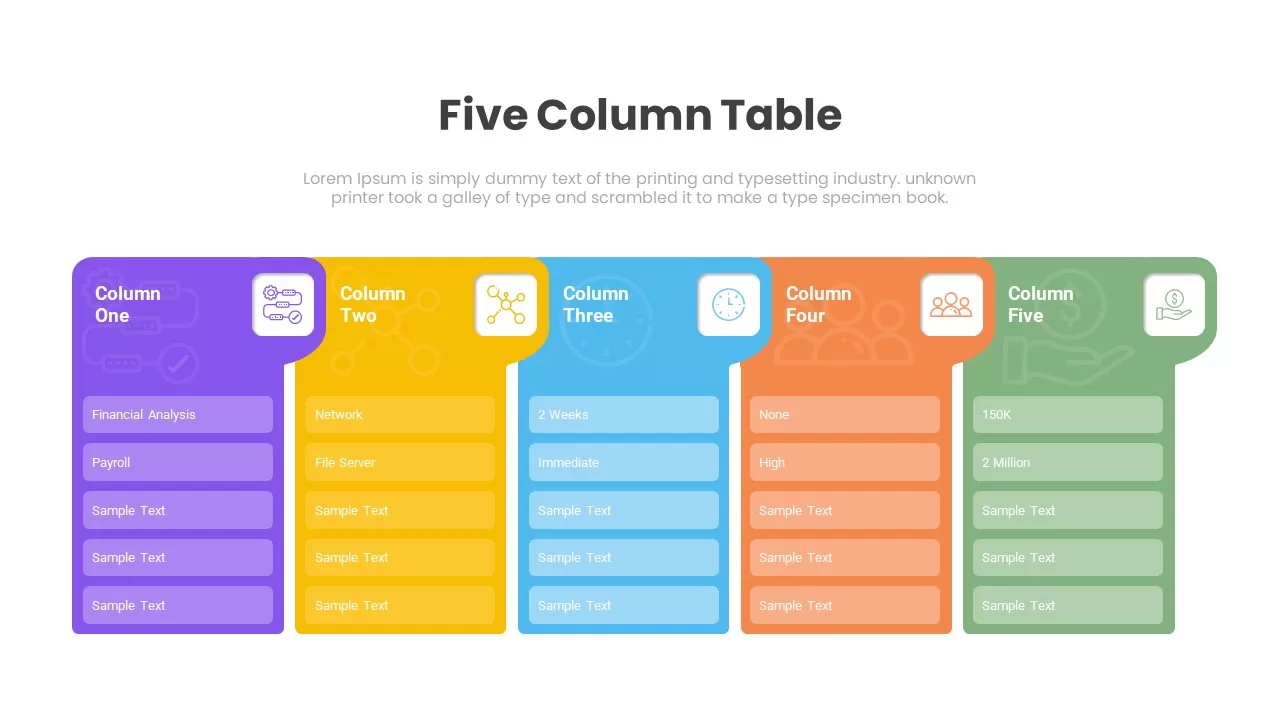
Five Column Table Infographics for PowerPoint & Google Slides
Business
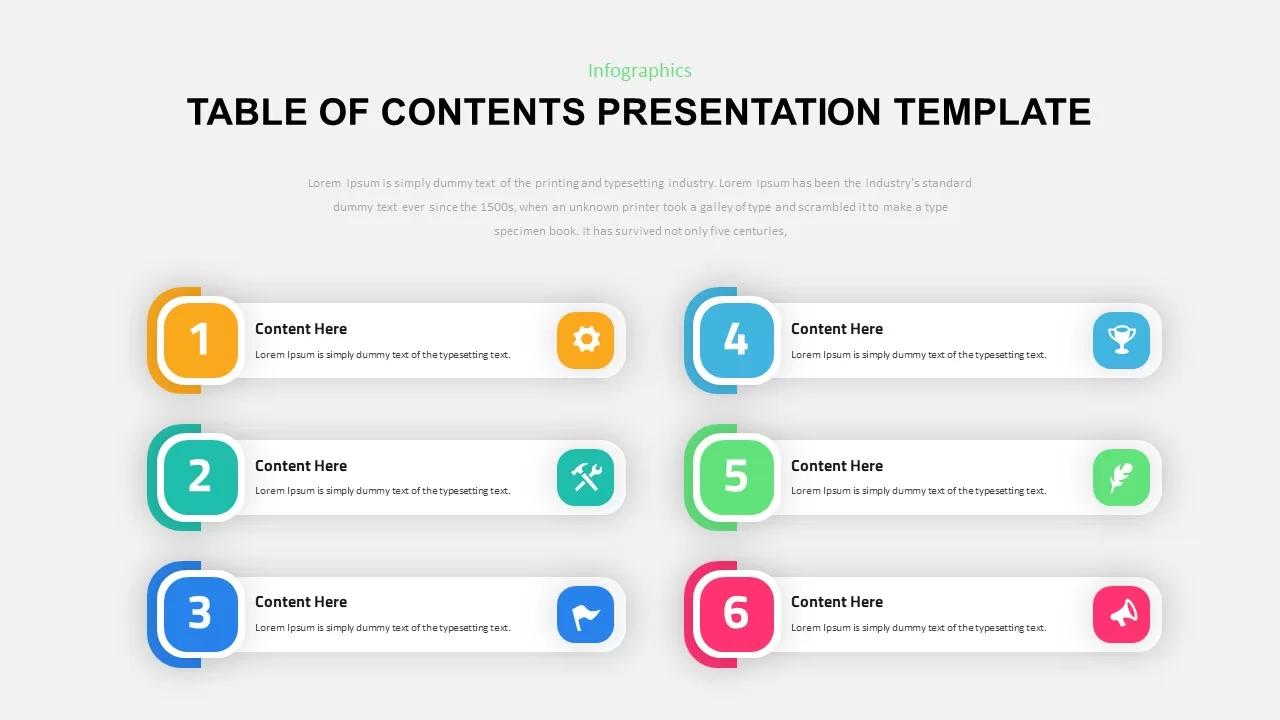
Six-Step Color-Coded Table of Contents Template for PowerPoint & Google Slides
Agenda
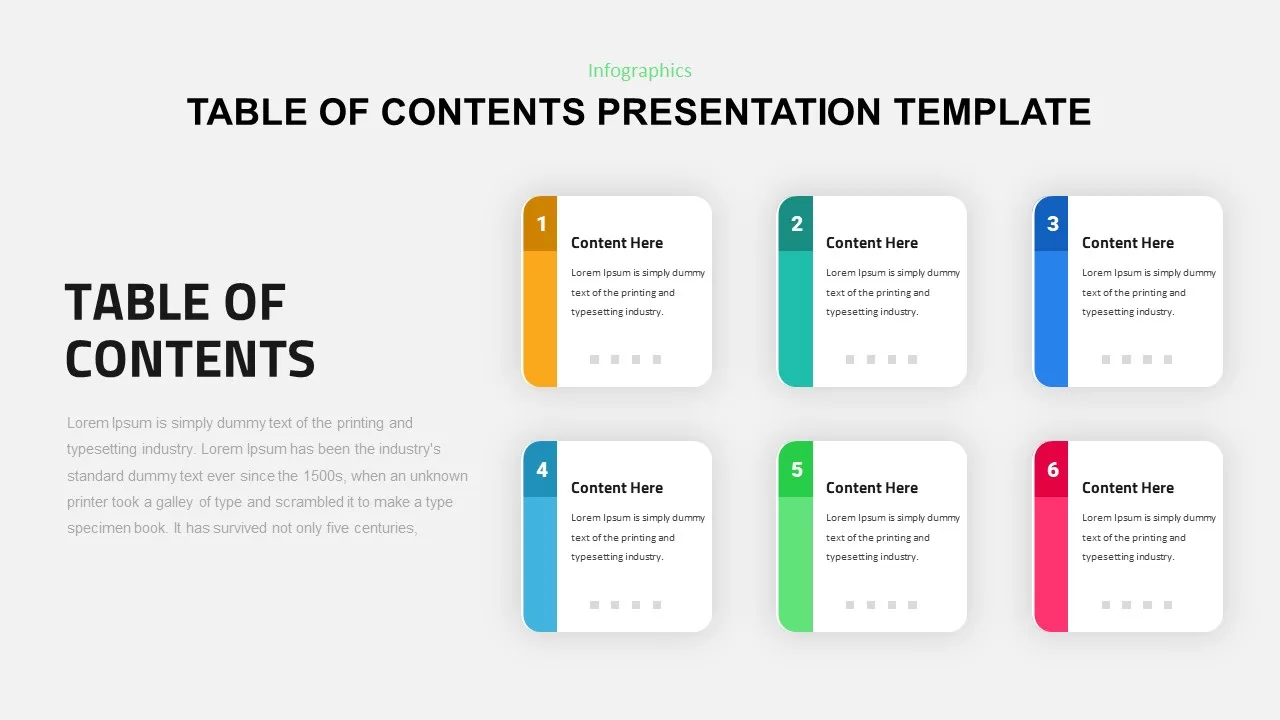
Six-Step Table of Contents Infographic Template for PowerPoint & Google Slides
Agenda
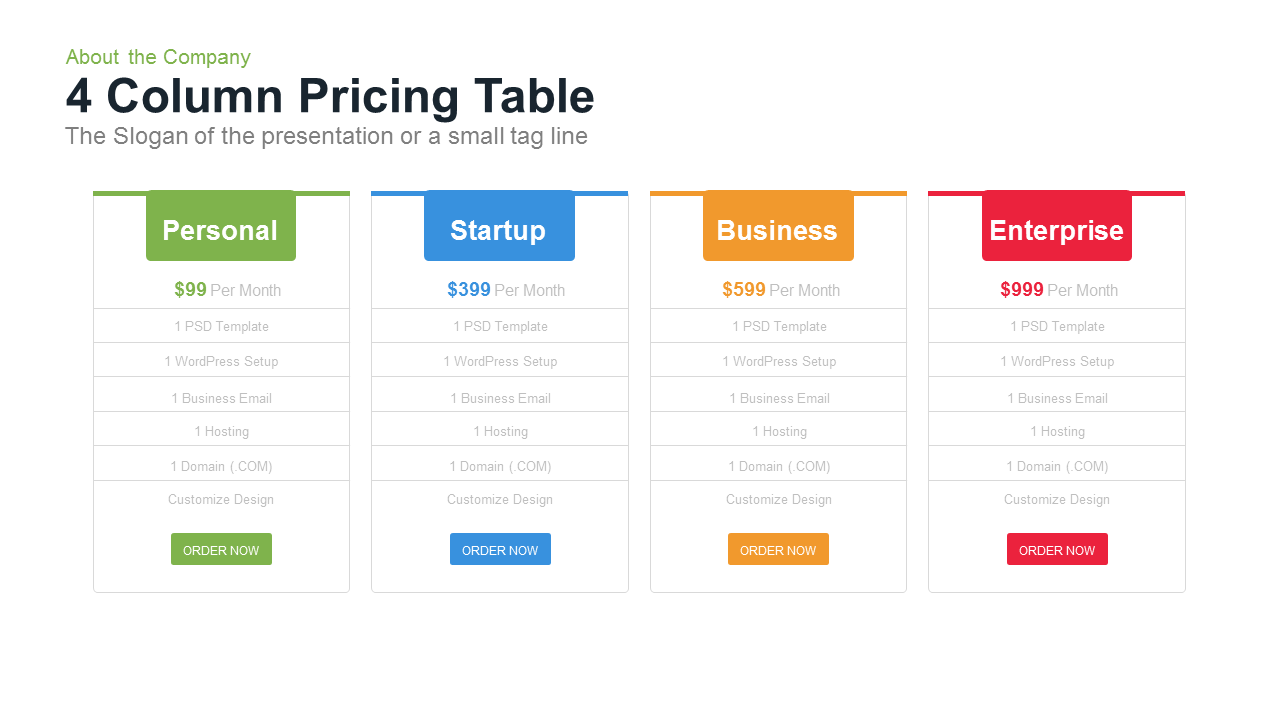
4 Column Pricing template for PowerPoint & Google Slides
Comparison
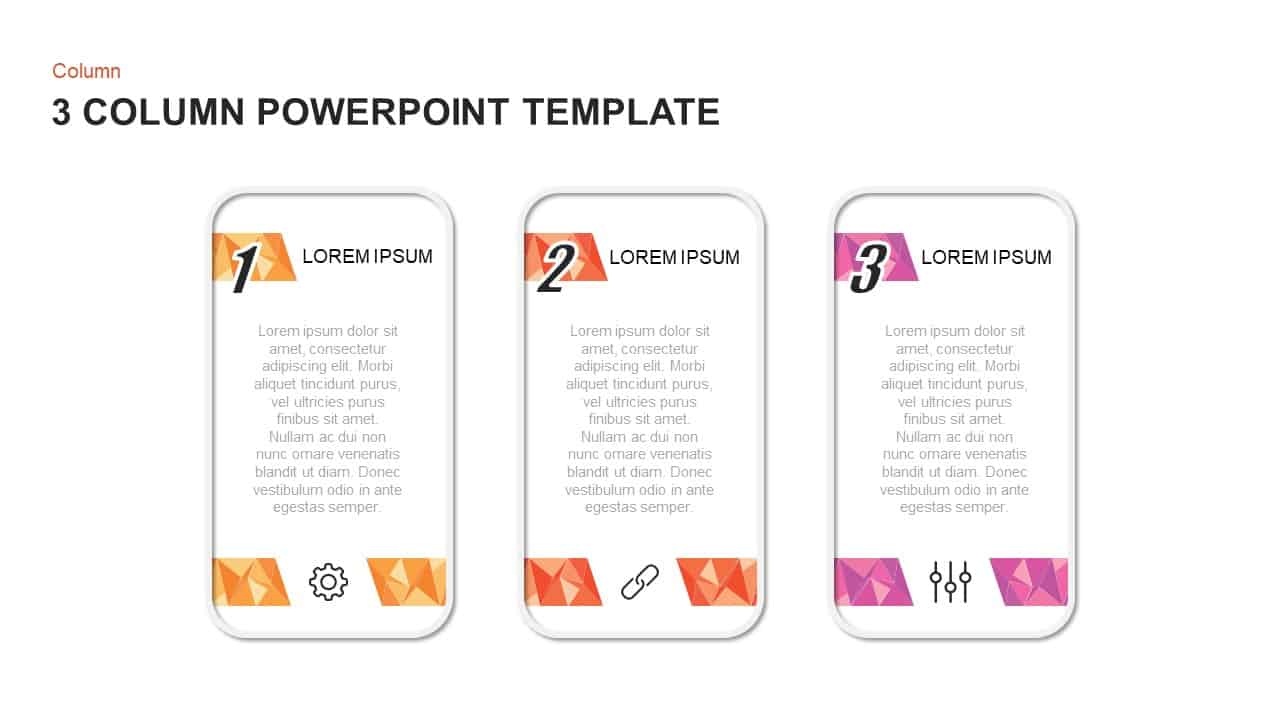
3-Column Comparison template for PowerPoint & Google Slides
Comparison
Three and Four-Column Card Layout Template for PowerPoint & Google Slides
Infographics
Two-Column Comparison Infographic Slide Template for PowerPoint & Google Slides
Comparison
Free Stacked Column Chart Data Visualization Template for PowerPoint & Google Slides
Bar/Column
Free
Free Editable Simple Column Chart Slide Template for PowerPoint & Google Slides
Bar/Column
Free
Minimal Multi-Year Column Chart Template for PowerPoint & Google Slides
Bar/Column
Waterfall Column Chart Analysis Template for PowerPoint & Google Slides
Bar/Column
Professional Clustered Column Chart Template for PowerPoint & Google Slides
Bar/Column
Professional 100% Stacked Column Chart Template for PowerPoint & Google Slides
Bar/Column
Grouped Column Chart Comparison Template for PowerPoint & Google Slides
Bar/Column
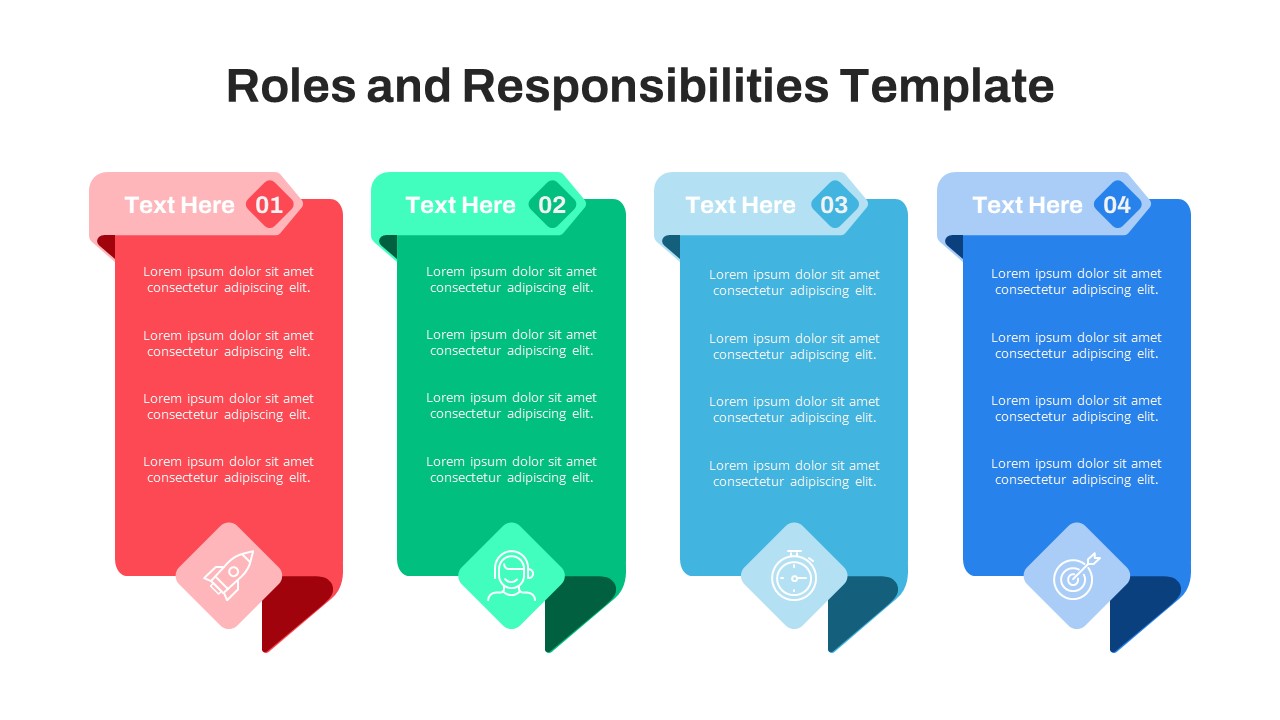
Free Four-Column Roles and Responsibilities Template for PowerPoint & Google Slides
Our Team
Free
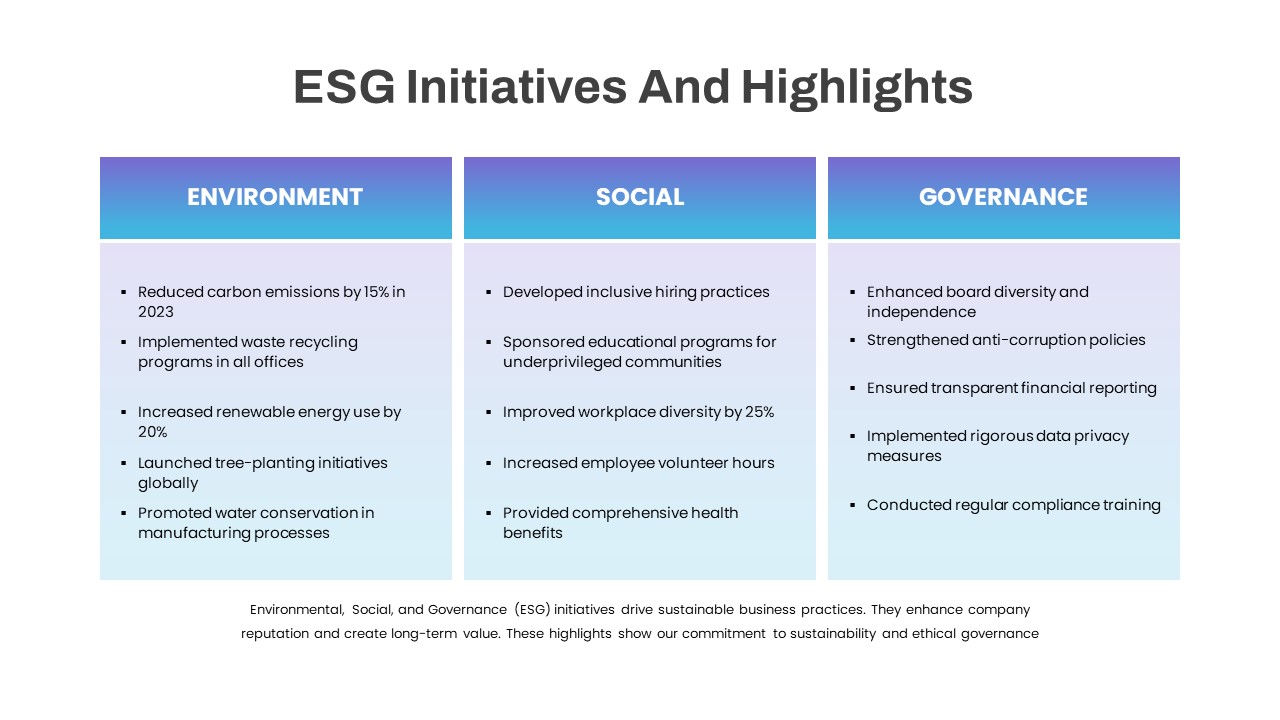
ESG Initiatives Three-Column Template for PowerPoint & Google Slides
Comparison
3D Pyramid Column Chart Infographic Template for PowerPoint & Google Slides
Bar/Column
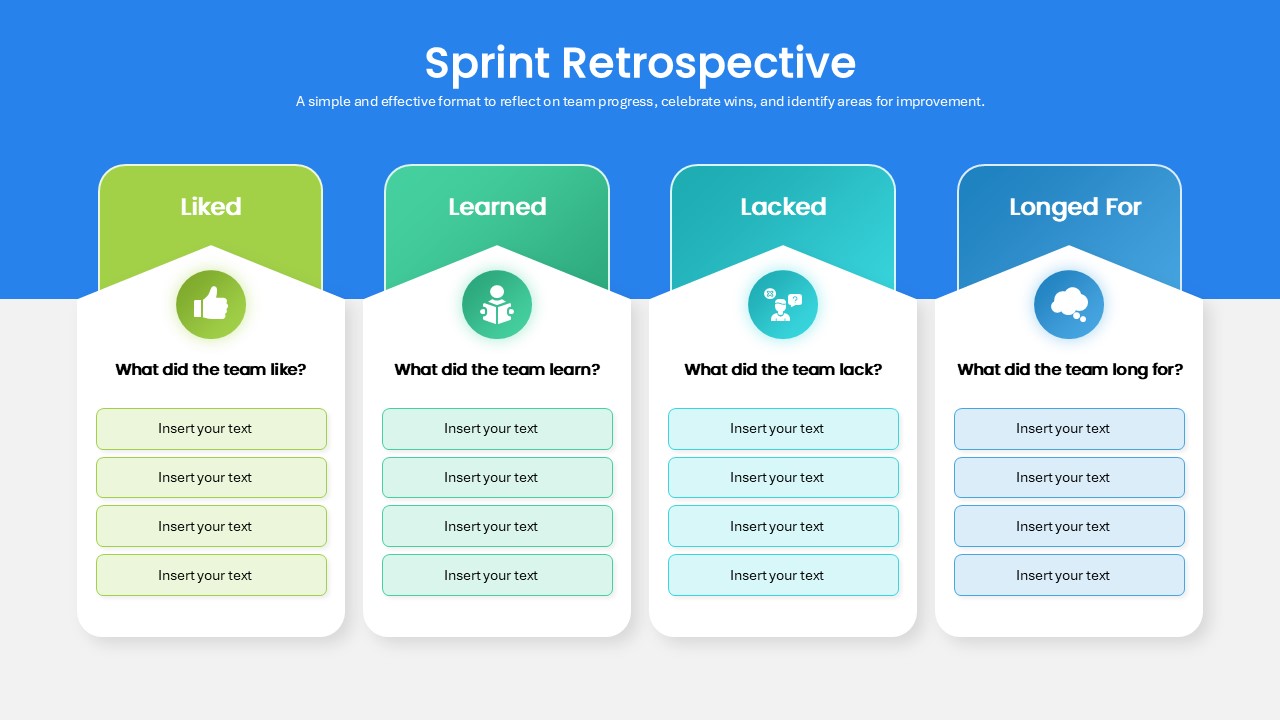
Sprint Retrospective Four-Column Template for PowerPoint & Google Slides
Process
1 to 5 Column infographic pack for PowerPoint & Google Slides
Business

Clustered Column Chart Data Analysis Template for PowerPoint
Bar/Column
Six Double Diamond Infographic Slides Template for PowerPoint & Google Slides
Process
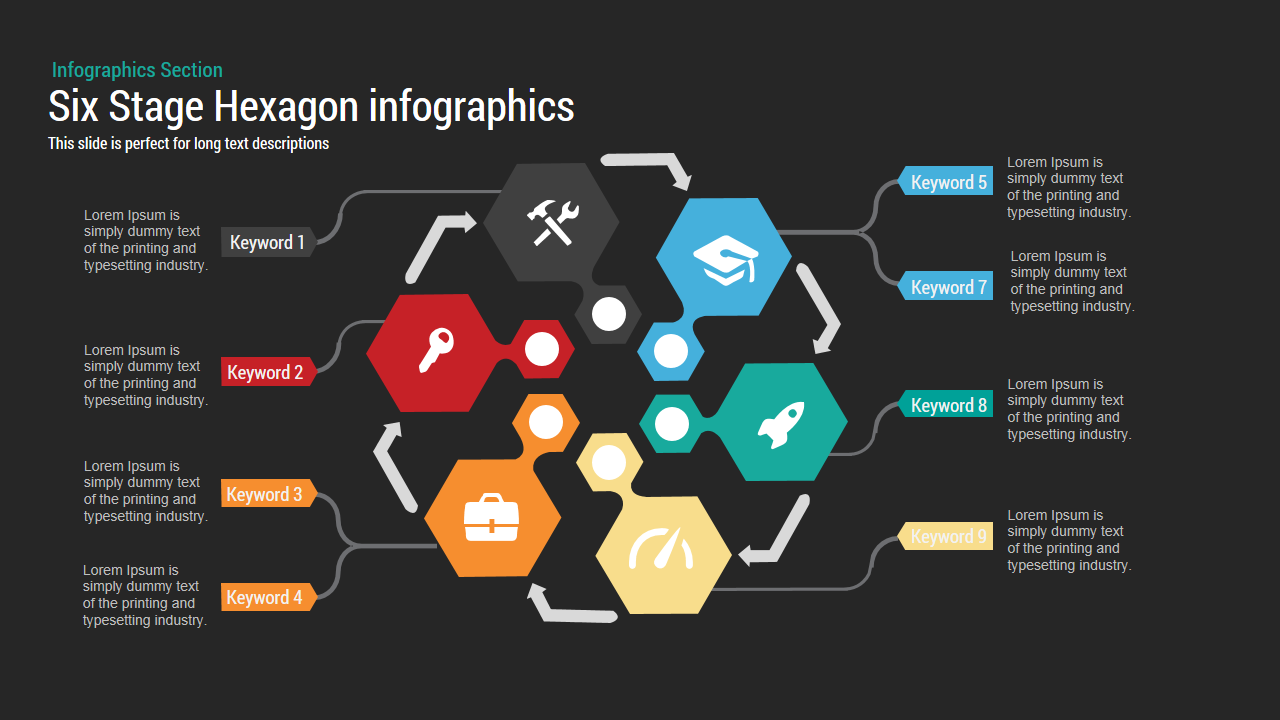
Six-Stage Hexagon template for PowerPoint & Google Slides
Process
Six-Stage Process Infographics Template for PowerPoint & Google Slides
Process
Six Hexagon Stages Process Flow Diagram Template for PowerPoint & Google Slides
Process
Six Directional Arrows Infographic Template for PowerPoint & Google Slides
Arrow

Six-Segment Flower Petal Diagram Template for PowerPoint & Google Slides
Circular
Six Layer Diagram template for PowerPoint & Google Slides
Process
Six-Part Core Values Circular Diagram Template for PowerPoint & Google Slides
Circular
Six-Step Infographics Template for PowerPoint & Google Slides
Process
Six Pointing Arrow Process Diagram Template for PowerPoint & Google Slides
Arrow
Six-Stage Zig-Zag Process Flow Diagram Template for PowerPoint & Google Slides
Process
Six-Part Business Idea Bulb Diagram Template for PowerPoint & Google Slides
Circular
Six-Stage Zig-Zag Roadmap Infographics Template for PowerPoint & Google Slides
Roadmap
Six-Stage Semi-Circle Diagram with Icons Template for PowerPoint & Google Slides
Circular
Six-Sided Shutter Diagram Process Flow Template for PowerPoint & Google Slides
Process
Six-Stage Colorful Spiral Timeline Template for PowerPoint & Google Slides
Timeline
Six-Stage Circular Cycle Diagram Template for PowerPoint & Google Slides
Process
Six-Stage Connected Process Infographics Template for PowerPoint & Google Slides
Process
Six Stage Timeline Infographics Template for PowerPoint & Google Slides
Timeline
Editable Six-Level 3D Pyramid Diagram Template for PowerPoint & Google Slides
Pyramid
Six-Segment Circular Hub Infographic Template for PowerPoint & Google Slides
Circular
Six-Process Circular Arrow Diagram Template for PowerPoint & Google Slides
Circular
Six Staged Circle Diagram template for PowerPoint & Google Slides
Circular
Six-Stage Circular Process Diagram Template for PowerPoint & Google Slides
Process
Six Stage Circular Diagram with Icons Template for PowerPoint & Google Slides
Circular
Six Segment Hexagon Circular Diagram Template for PowerPoint & Google Slides
Circular
Six Sigma Gear Process Diagram Template for PowerPoint & Google Slides
Process
Six Stage Incremental Growth template for PowerPoint & Google Slides
Timeline
Six-Step Lean Manufacturing Process Template for PowerPoint & Google Slides
Process
Three to Six Staged Circular Diagram Template for PowerPoint & Google Slides
Process
Six-Stage Arrow Timeline Diagram Template for PowerPoint & Google Slides
Timeline
Six Stage Hexagon Process Diagram Template for PowerPoint & Google Slides
Process
Six-Stage Timeline Infographic Template for PowerPoint & Google Slides
Timeline
Six-Stage Infinity Loop Process Diagram Template for PowerPoint & Google Slides
Process
Compass-Themed Six-Step Process Diagram Template for PowerPoint & Google Slides
Process
Six-Step Accounting Process Development Template for PowerPoint & Google Slides
Process
Online Targeting Lifecycle Six-Step Template for PowerPoint & Google Slides
Digital Marketing
Six-Stage Circular Flow Diagram Template for PowerPoint & Google Slides
Circular
Six-Stage Star Diagram Infographic Template for PowerPoint & Google Slides
Process
Six-Stage Timeline Infographics Slide Template for PowerPoint & Google Slides
Timeline
Six Sigma 6S Process Diagram Template for PowerPoint & Google Slides
Process
Six-Step Tree Diagram Infographic Template for PowerPoint & Google Slides
Infographics

Six-Stage Infinity Loop Diagram Template for PowerPoint & Google Slides
Process
Six-Step Output Process Diagram Template for PowerPoint & Google Slides
Process
Six-Step Hexagon Design Thinking Models Template for PowerPoint & Google Slides
Circular
Six-Step Circular Diagram Infographics Template for PowerPoint & Google Slides
Circular
Animated Six-Stage 3D Process Diagram Template for PowerPoint & Google Slides
Arrow
Six Thinking Hats Template for PowerPoint & Google Slides
Business Strategy
Colorful Six-Piece Puzzle Diagram Template for PowerPoint & Google Slides
Infographics
Six Thinking Hats Diagram Presentation Template for PowerPoint & Google Slides
Infographics
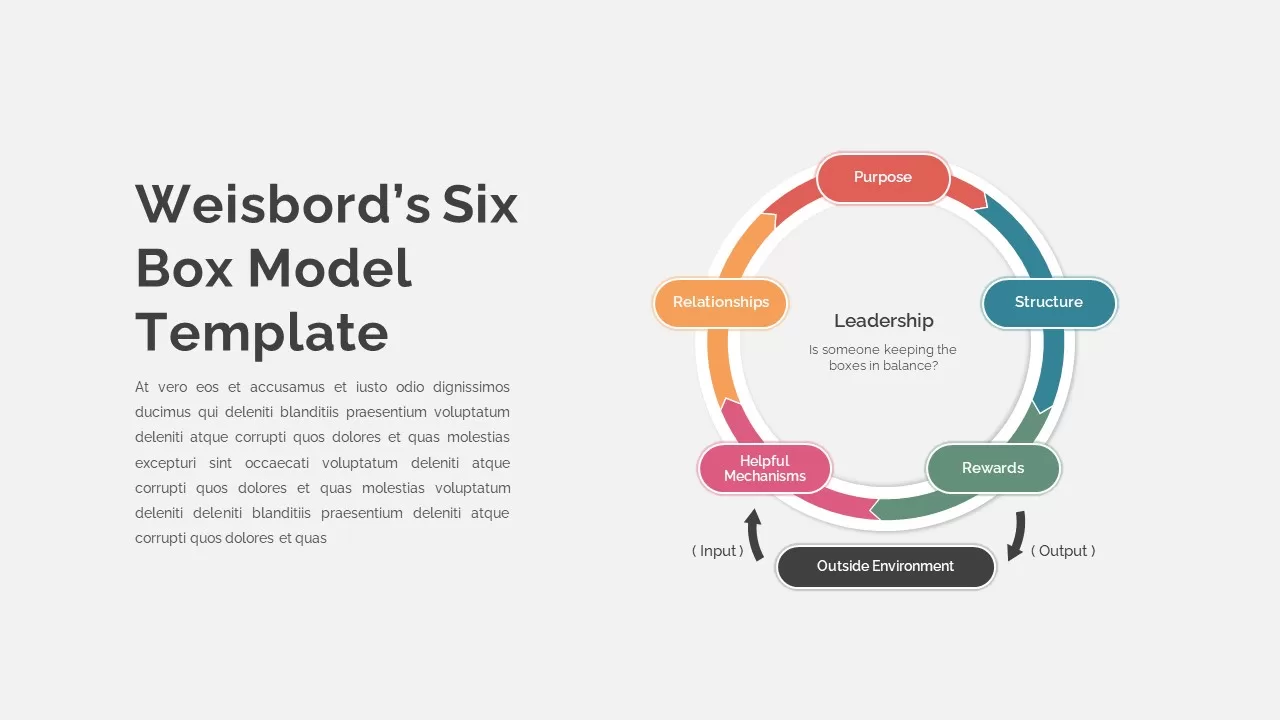
Weisbord’s Six Box Model Infographics Template for PowerPoint & Google Slides
Circular
Six-Segment Circular Arrow Cycle Template for PowerPoint & Google Slides
Circular
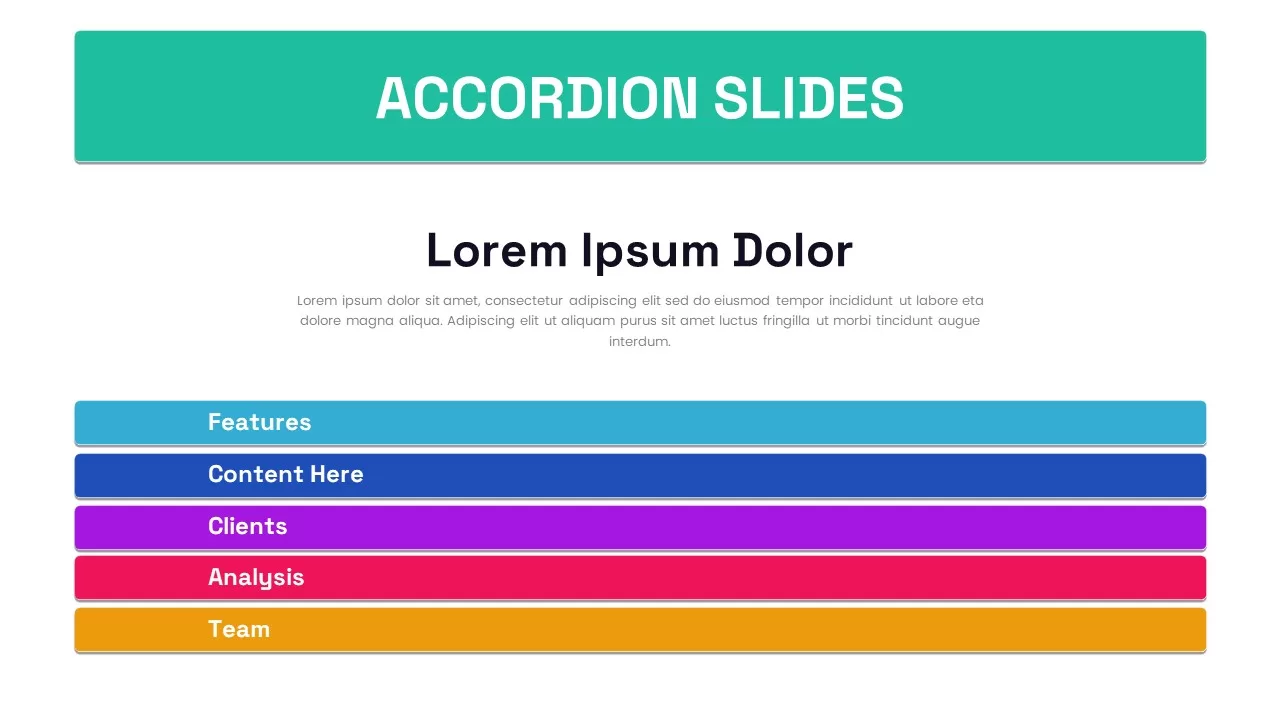
Six-Slide Animated Accordion Pack Template for PowerPoint & Google Slides
Business
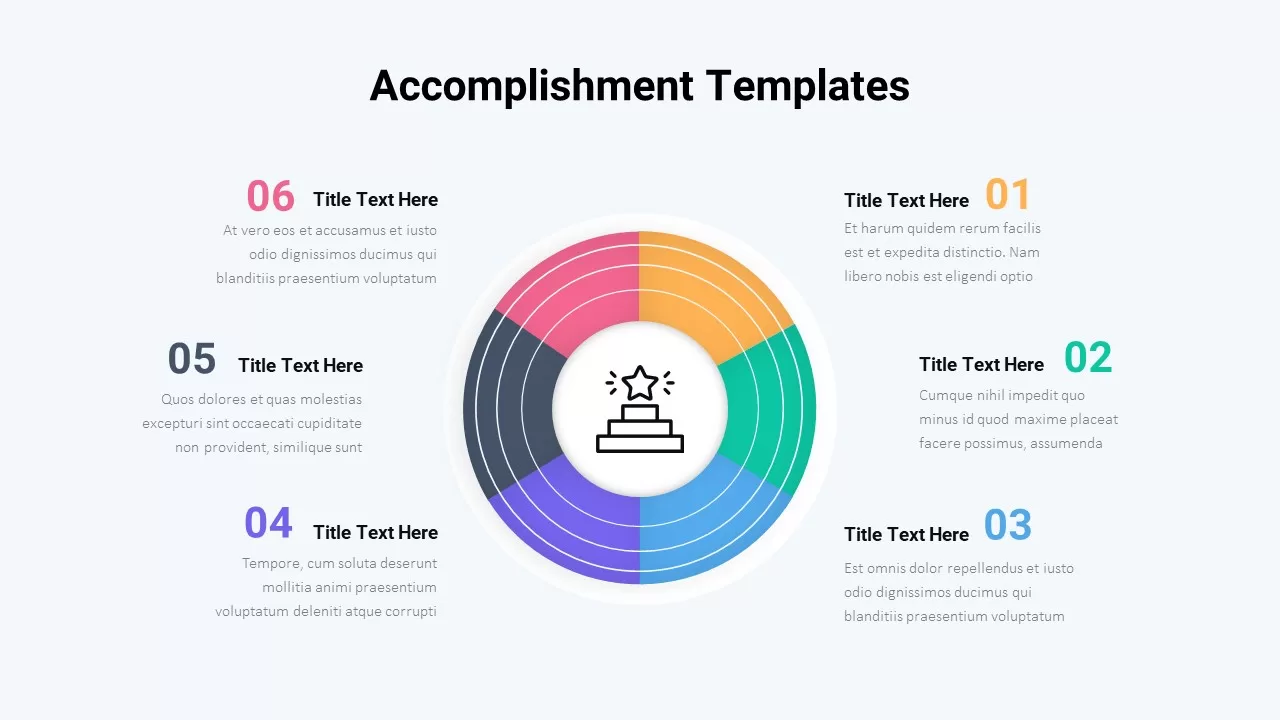
Six-Step Accomplishment Radial Infographic Template for PowerPoint & Google Slides
Accomplishment
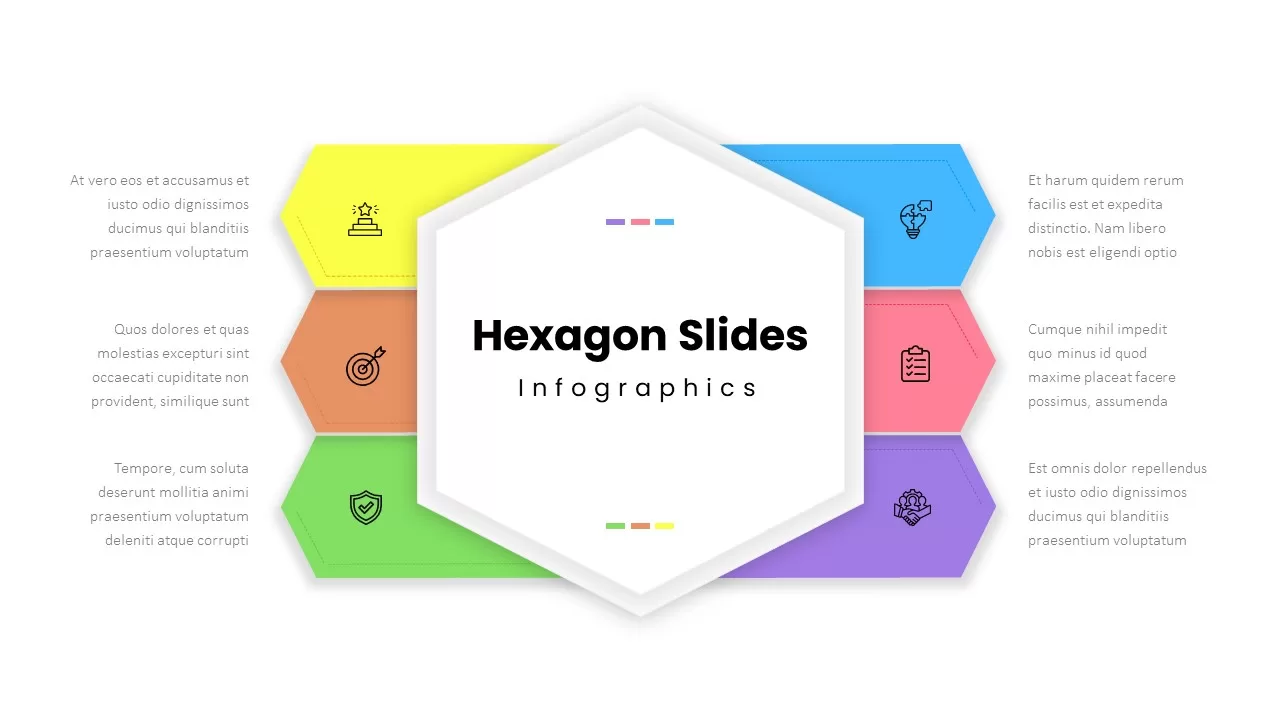
Six-Step Hexagon Infographic Layout Template for PowerPoint & Google Slides
Infographics
Six-Layer 3D Block Stack Infographic Template for PowerPoint & Google Slides
Process
Six-Day Weekly Planner Layout Template for PowerPoint & Google Slides
Infographics
Six 3D Dice Infographic Template for PowerPoint & Google Slides
Process
Six Core Values Infographic Timeline Template for PowerPoint & Google Slides
Comparison
Six-Stage Pyramid Process Slide Template for PowerPoint & Google Slides
Pyramid
Six-Step Social Media Management Process Template for PowerPoint & Google Slides
Process
Six-Month Innovation Roadmap Timeline Template for PowerPoint & Google Slides
Roadmap
Modern Six-Point Timeline Infographic Template for PowerPoint & Google Slides
Timeline
Six-Month Strategic SEO Roadmap Template for PowerPoint & Google Slides
Roadmap
Free Hexagonal Six-Step Business Strategy Template for PowerPoint & Google Slides
Process
Free
Free Six-Part Hub-and-Spoke Benefits Template for PowerPoint & Google Slides
Circular
Free
Free Six-Phase Market Research Process Template for PowerPoint & Google Slides
Process
Free
Six-Point Star Process Diagram Template for PowerPoint & Google Slides
Process
Six-Step Strategic Thrusts Diagram Slide Template for PowerPoint & Google Slides
Process
Six-Step Negotiation Strategy Canvas Template for PowerPoint & Google Slides
Process
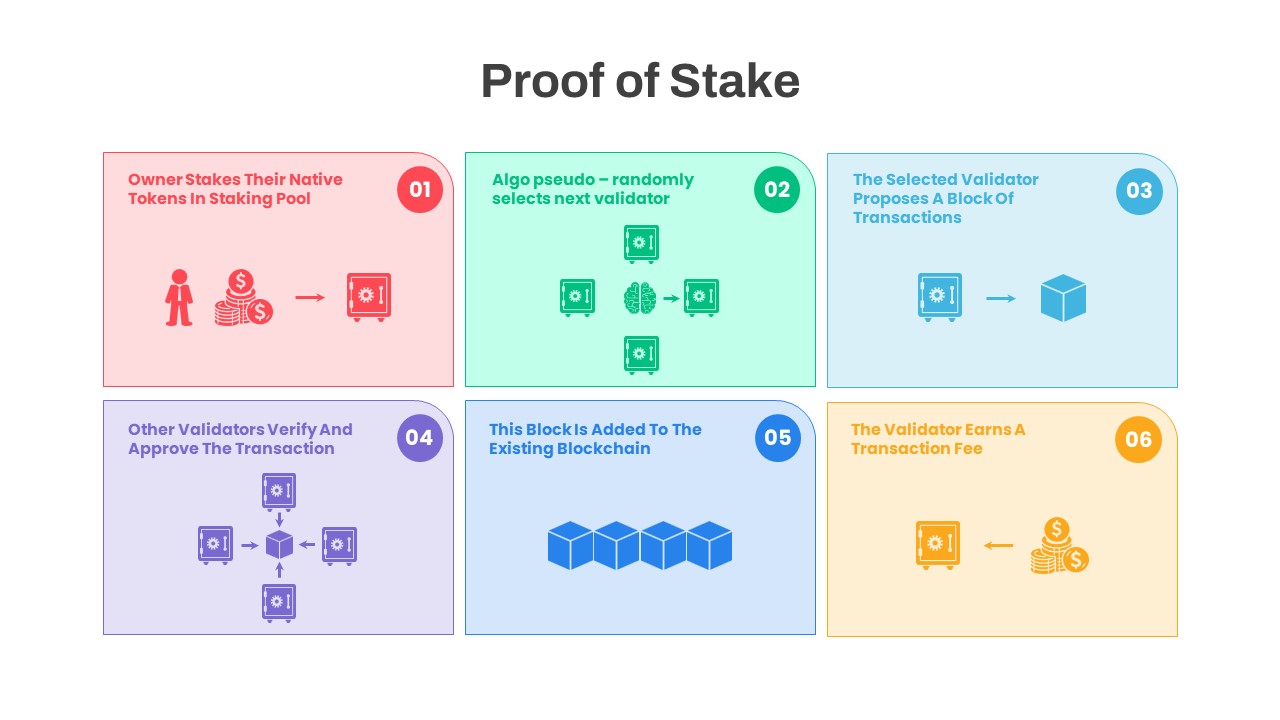
Proof of Stake Six-Step Consensus Template for PowerPoint & Google Slides
Machine Learning
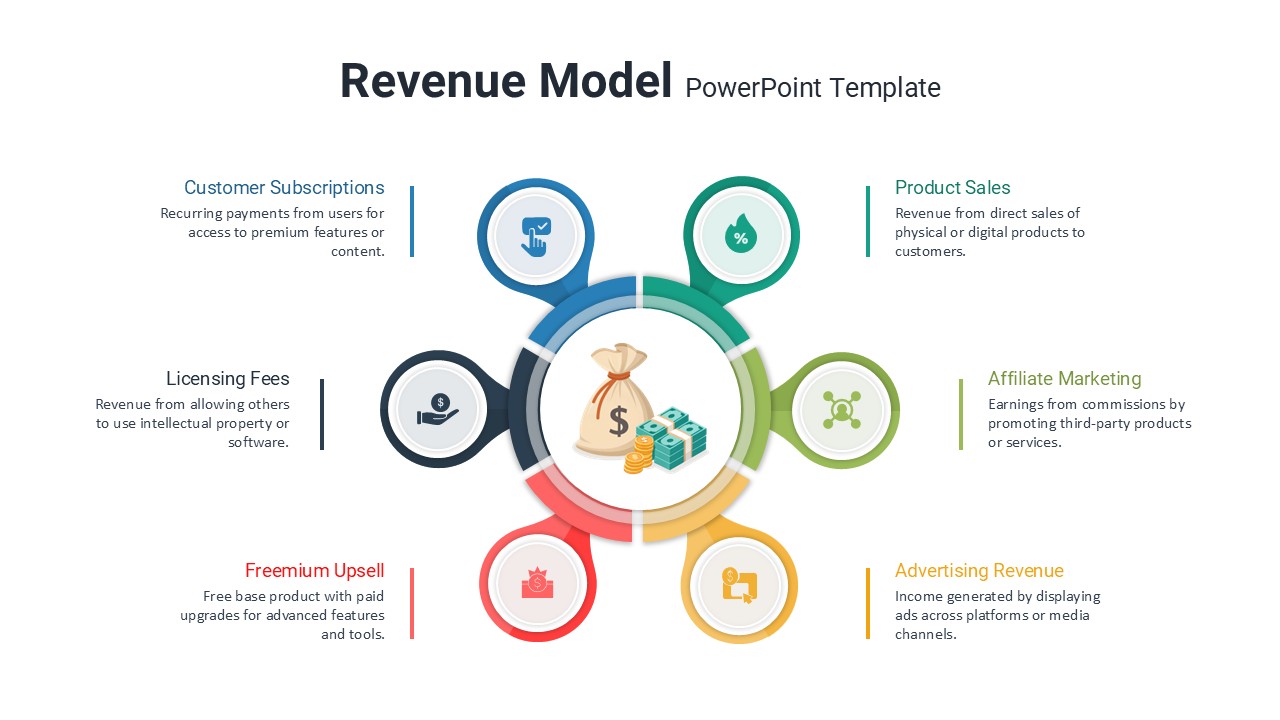
Six Revenue Stream Model Infographic Template for PowerPoint & Google Slides
Circular