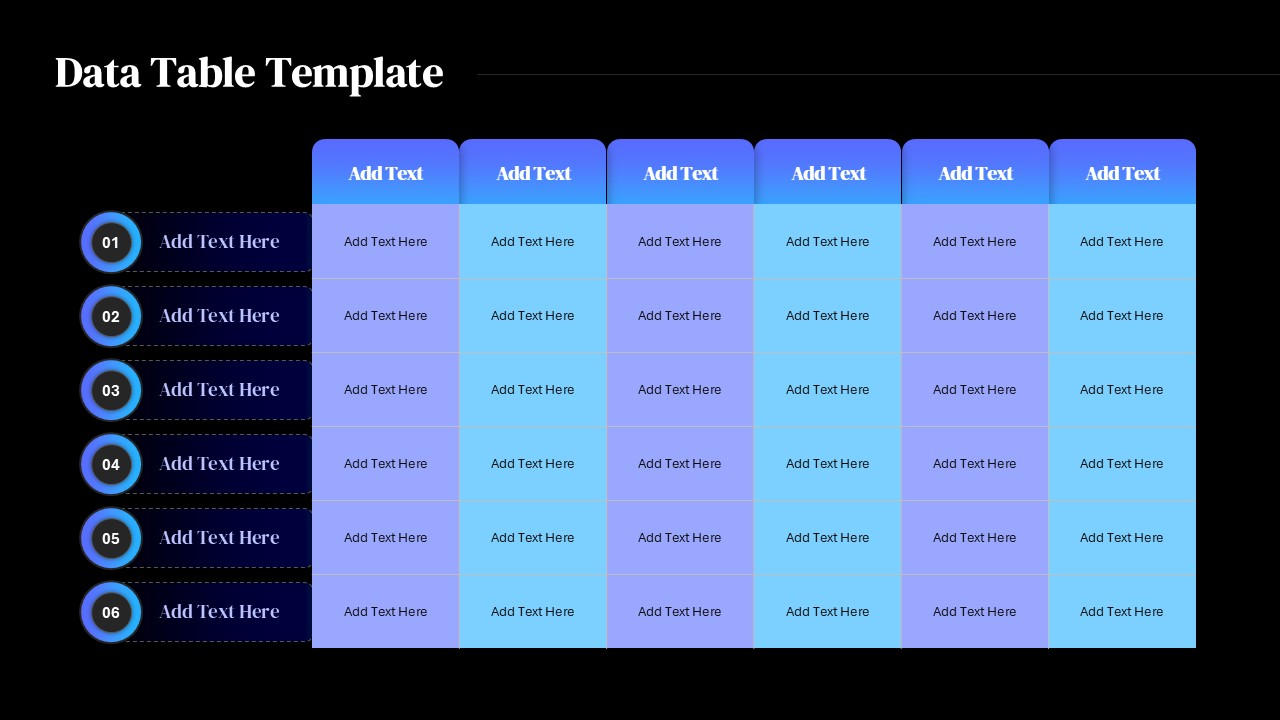
Six Column Data Table Template for PowerPoint & Google Slides

Description
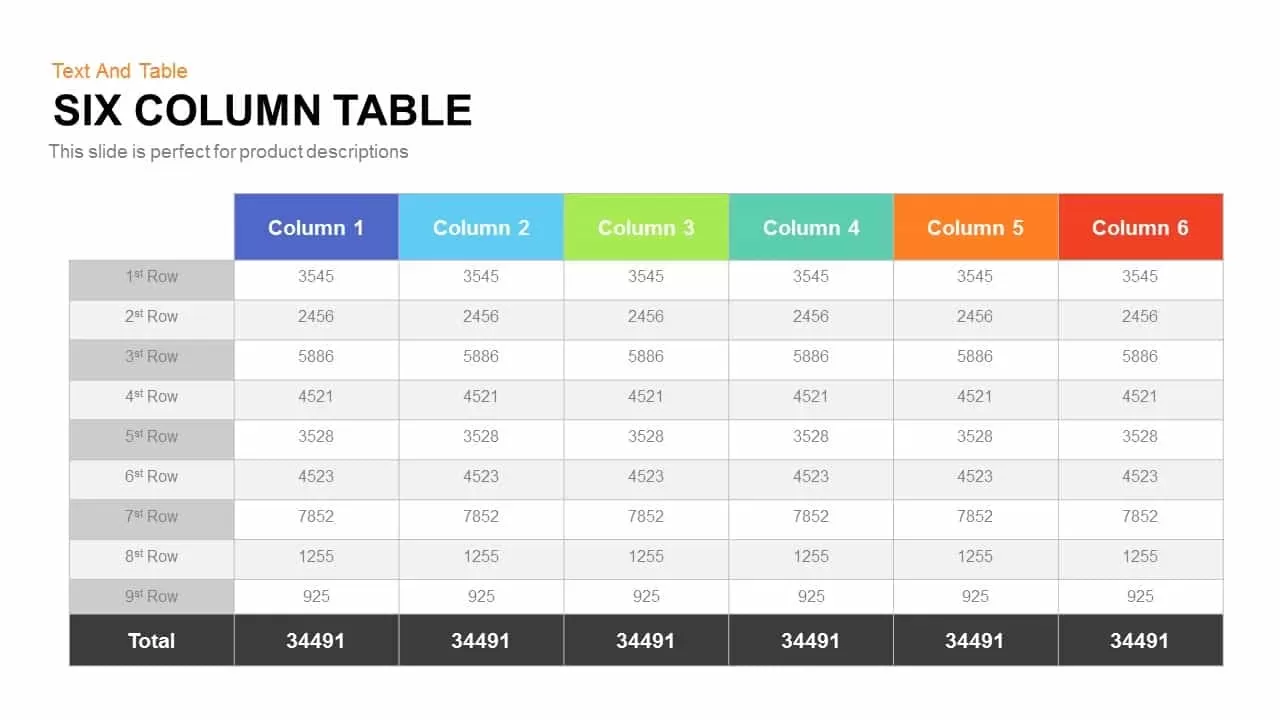
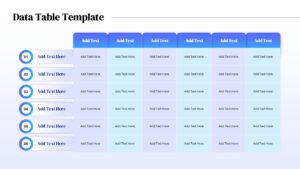
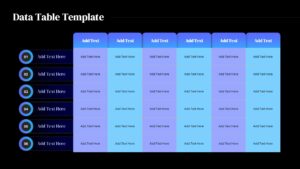
Present complex data in a clean, professional, and easy-to-read format using this six-column data table layout. The slide is designed with numbered rows on the left and six editable column headers, making it ideal for organizing structured information across multiple categories. Each column and row provides clear text placeholders, ensuring your content remains organized and aligned. The table’s soft gradient blue tones with rounded header blocks enhance readability while maintaining a polished, corporate look.
This template allows users to display quantitative or qualitative data in a systematic format, making comparisons across rows and columns effortless. Its balanced grid design ensures that even large datasets are digestible for audiences, whether in boardroom meetings, project updates, or academic presentations. With editable colors, fonts, and layouts, customization is seamless—adapt it to match your brand guidelines or preferred presentation style.
The minimal yet modern design ensures that your data remains the focal point, avoiding visual clutter. Optimized for both PowerPoint and Google Slides, this table maintains clarity on all screen sizes and formats, making it a versatile tool for professionals across industries.
Who is it for
This slide is perfect for business professionals, analysts, educators, project managers, and consultants who need to present structured data, comparisons, or performance reports in a visually engaging manner.
Other Uses
Beyond corporate reporting, this table can be used for academic research summaries, budget allocations, team performance tracking, customer surveys, or event planning checklists. It is also suitable for displaying KPIs, project milestones, or product comparisons in a straightforward manner.
Login to download this file

Item ID
SB05545Designed By
Gopika
Related Templates

3D Column Chart with Data Table for PowerPoint & Google Slides
Bar/Column

Six Column Table template for PowerPoint & Google Slides
Table
Six-Row Multi-Column Table Presentation Template for PowerPoint & Google Slides
Table
Free Stacked Column Chart Data Visualization Template for PowerPoint & Google Slides
Bar/Column
Free
Clean Three-Four Column Table Slide Template for PowerPoint & Google Slides
Business Report
Multi-Column Table Presentation Template for PowerPoint & Google Slides
Table
Colorful Four-Column Table Layout Template for PowerPoint & Google Slides
Table
Five Column Comparison Table Layout Template for PowerPoint & Google Slides
Comparison
Two-Column Table Presentation Template for PowerPoint & Google Slides
Table
Five Column Table Infographics for PowerPoint & Google Slides
Business

Clustered Column Chart Data Analysis Template for PowerPoint
Bar/Column
Business Data Table Template for PowerPoint & Google Slides
Table
Colorful Business Data Comparison Table Template for PowerPoint & Google Slides
Table
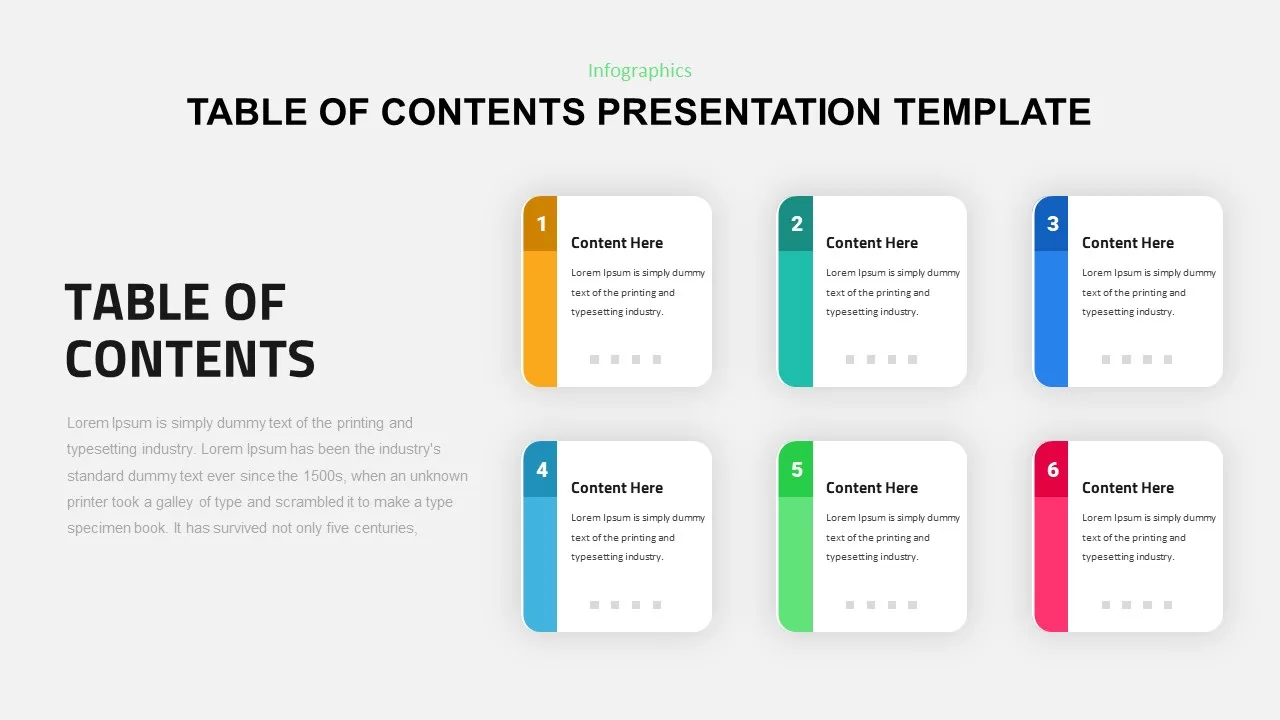
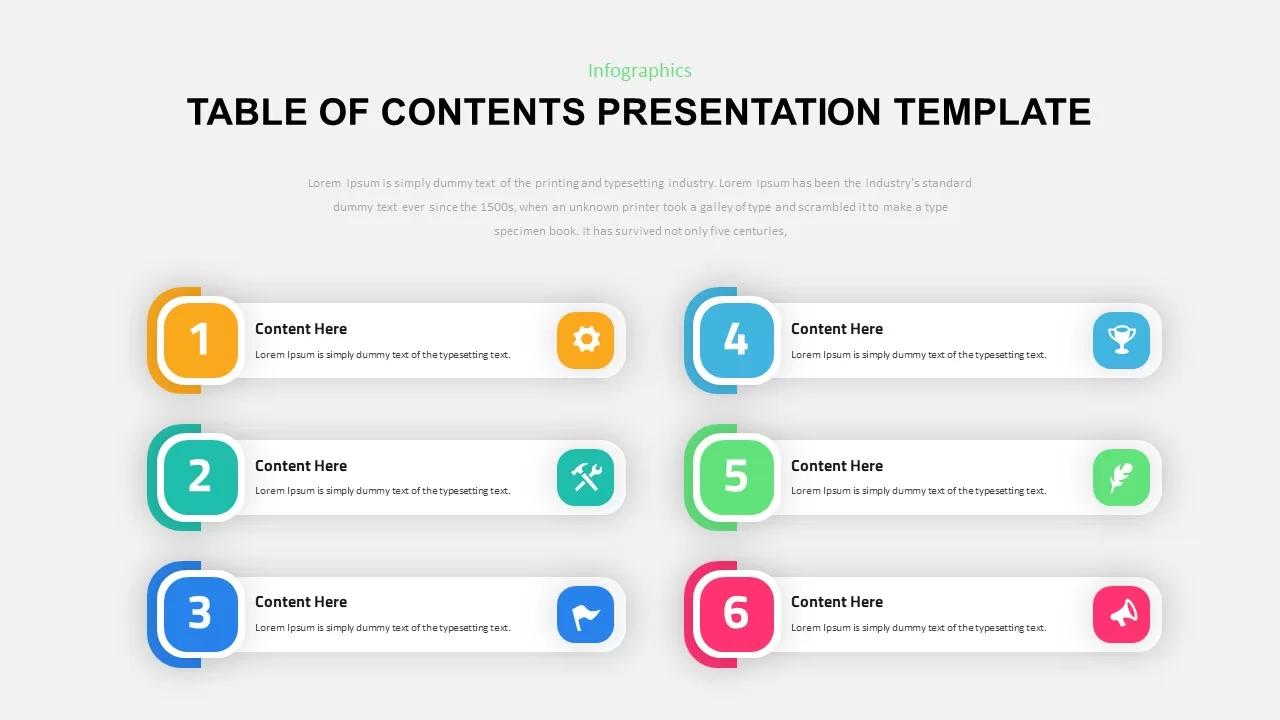
Six-Step Color-Coded Table of Contents Template for PowerPoint & Google Slides
Agenda
Six-Step Table of Contents Infographic Template for PowerPoint & Google Slides
Agenda
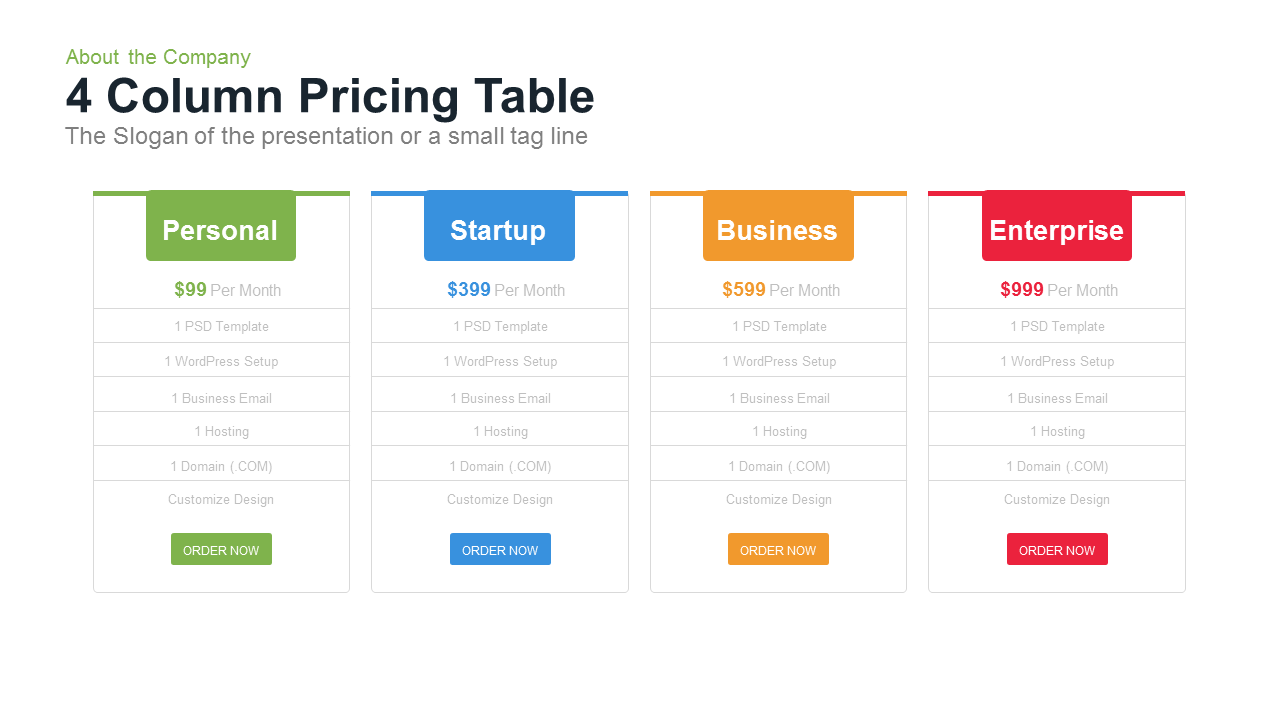
4 Column Pricing template for PowerPoint & Google Slides
Comparison
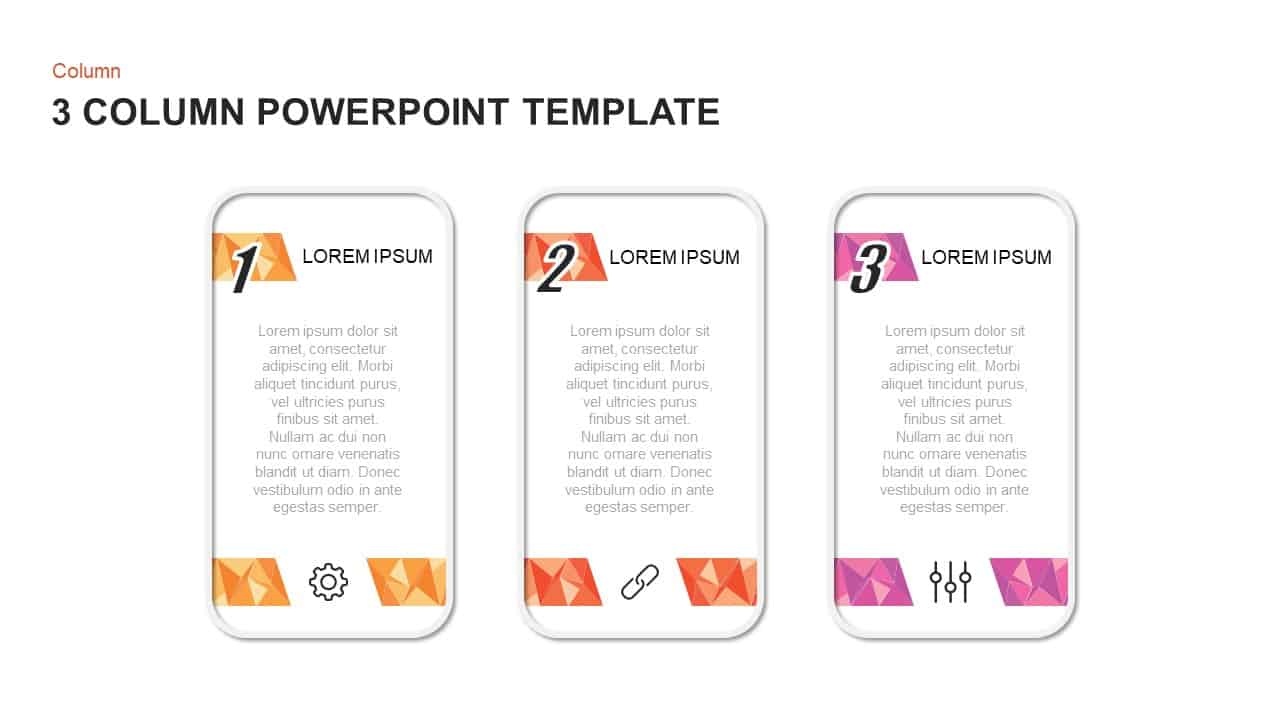
3-Column Comparison template for PowerPoint & Google Slides
Comparison
Three and Four-Column Card Layout Template for PowerPoint & Google Slides
Infographics
Two-Column Comparison Infographic Slide Template for PowerPoint & Google Slides
Comparison
Free Editable Simple Column Chart Slide Template for PowerPoint & Google Slides
Bar/Column
Free
Minimal Multi-Year Column Chart Template for PowerPoint & Google Slides
Bar/Column
Waterfall Column Chart Analysis Template for PowerPoint & Google Slides
Bar/Column
Professional Clustered Column Chart Template for PowerPoint & Google Slides
Bar/Column
Professional 100% Stacked Column Chart Template for PowerPoint & Google Slides
Bar/Column
Grouped Column Chart Comparison Template for PowerPoint & Google Slides
Bar/Column
Free Four-Column Roles and Responsibilities Template for PowerPoint & Google Slides
Our Team
Free
ESG Initiatives Three-Column Template for PowerPoint & Google Slides
Comparison
3D Pyramid Column Chart Infographic Template for PowerPoint & Google Slides
Bar/Column
Sprint Retrospective Four-Column Template for PowerPoint & Google Slides
Process
1 to 5 Column infographic pack for PowerPoint & Google Slides
Business
Six Double Diamond Infographic Slides Template for PowerPoint & Google Slides
Process
Data Science PowerPoint Presentation Template for PowerPoint & Google Slides
Pitch Deck
Data Center PowerPoint Template for PowerPoint & Google Slides
Information Technology
Creative data chart analytics template for PowerPoint & Google Slides
Charts
Mobile Data Analysis Chart template for PowerPoint & Google Slides
Charts
World Map Data template for PowerPoint & Google Slides
World Maps
Circle Chart Data template for PowerPoint & Google Slides
Pie/Donut
Creative Data Analysis Bar Chart template for PowerPoint & Google Slides
Bar/Column

Smartphone Data User template for PowerPoint & Google Slides
Charts
Interactive US Population Data Map Slide Template for PowerPoint & Google Slides
World Maps
3D Bar Chart Data Infographics Template for PowerPoint & Google Slides
Bar/Column
3D Stacked Infographic Layers Data Template for PowerPoint & Google Slides
Pyramid
Circle Graph Data Visualization Template for PowerPoint & Google Slides
Circular
Pencil Bar Chart Data Analysis Template for PowerPoint & Google Slides
Bar/Column
3D Cone Chart Data Visualization template for PowerPoint & Google Slides
Bar/Column
Creative Lab Beakers Data Infographic template for PowerPoint & Google Slides
Infographics

Dynamic Data Dashboard Infographic Template for PowerPoint & Google Slides
Bar/Column
Data Analytics Dashboard Design template for PowerPoint & Google Slides
Bar/Column
Gear Pie Diagram Data Visualization Template for PowerPoint & Google Slides
Pie/Donut
Data-Driven Marketing Cycle Diagram Template for PowerPoint & Google Slides
Customer Journey
Tornado Chart Data Comparison Slide Template for PowerPoint & Google Slides
Bar/Column
Bottle Data Percentage Infographic Template for PowerPoint & Google Slides
Infographics
Immigration Data Dashboard Template for PowerPoint & Google Slides
Bar/Column
Leaf Infographic Data Visualization Template for PowerPoint & Google Slides
Infographics
Mobile Infographics Data Visualization Template for PowerPoint & Google Slides
Infographics
Data Management and Analytics Diagram Template for PowerPoint & Google Slides
Circular
Data Migration Life Cycle Curved Diagram Template for PowerPoint & Google Slides
Process
Medical Infographics Data Visualization Template for PowerPoint & Google Slides
Health
DIKW Data to Wisdom Pyramid Model Template for PowerPoint & Google Slides
Pyramid
Data-driven GDP Growth Infographic Pack Template for PowerPoint & Google Slides
Infographics
KPI Dashboard Data Visualization Template for PowerPoint & Google Slides
Bar/Column
KPI Dashboard Data Overview Slide Template for PowerPoint & Google Slides
Bar/Column
North America Data Map Callouts Template for PowerPoint & Google Slides
World Maps
Professional Heatmap Data Visualization Template for PowerPoint & Google Slides
Infographics
Donut Chart Data Breakdown template for PowerPoint & Google Slides
Pie/Donut

Modern Big Data Infographic Deck Template for PowerPoint & Google Slides
Decks
Waffle Chart Data Visualization Template for PowerPoint & Google Slides
Comparison Chart
Layered Data Governance Maturity Model Template for PowerPoint & Google Slides
Process
Simple Bar Chart Data Visualization Template for PowerPoint & Google Slides
Bar/Column
XY Bubble Chart Data Visualization Template for PowerPoint & Google Slides
Comparison Chart
Simple Area Chart Data Trends Analysis Template for PowerPoint & Google Slides
Comparison Chart
Data Over Time Line Chart template for PowerPoint & Google Slides
Charts
Waterfall Chart Data Visualization Template for PowerPoint & Google Slides
Comparison Chart
Multipurpose Spline Chart Data Trend Template for PowerPoint & Google Slides
Bar/Column
Editable Africa Map Infographic Data Template for PowerPoint & Google Slides
World Maps
UK Counties Map Data Visualization Template for PowerPoint & Google Slides
World Maps
Advanced Data Flow Diagram Pack Template for PowerPoint & Google Slides
Flow Charts
Interactive Jump Line Data Chart Template for PowerPoint & Google Slides
Comparison Chart
Segmented Scatter Chart Data Visualization Template for PowerPoint & Google Slides
Business Strategy
Free Big Data Network Visualization Template for PowerPoint & Google Slides
Circular
Free
Syria Regional Data Map Infographic Template for PowerPoint & Google Slides
World Maps
Data Analysis Bar Chart with Insights Template for PowerPoint & Google Slides
Bar/Column
Free
Data Lake Hub-and-Spoke Diagram Template for PowerPoint & Google Slides
Cloud Computing
ETL Data Pipeline Workflow Diagram Template for PowerPoint & Google Slides
Process
Data Privacy template for PowerPoint & Google Slides
Information Technology
Data Protection Strategies template for PowerPoint & Google Slides
Information Technology
Comprehensive Data & AI Capability Model Template for PowerPoint & Google Slides
AI
Data Flywheel Strategy template for PowerPoint & Google Slides
Business
Data Privacy and Compliance in ML template for PowerPoint & Google Slides
Technology
Data-Driven AI in Insurance Infographic Template for PowerPoint & Google Slides
Circular
AI and Data Ecosystem Map Template for PowerPoint & Google Slides
AI
Data Studio Insights template for PowerPoint & Google Slides
Business Report
Data Protection & Encryption in the Cloud Overview template for PowerPoint & Google Slides
Cloud Computing
Customer Data Platform Workflow Diagram Template for PowerPoint & Google Slides
Information Technology
Data-Driven Marketing Lifecycle Diagram Template for PowerPoint & Google Slides
Process
Data-Driven Decision Making overview template for PowerPoint & Google Slides
Business
First Party Data Overview Template for PowerPoint & Google Slides
Business
Data Governance Roles Pyramid Diagram Template for PowerPoint & Google Slides
Pyramid
Data Gap Analysis Template for PowerPoint & Google Slides
Business
Data-Driven Sales Strategy Diagram Template for PowerPoint & Google Slides
Marketing