Professional Sales Funnel Diagram Template for PowerPoint & Google Slides


Description
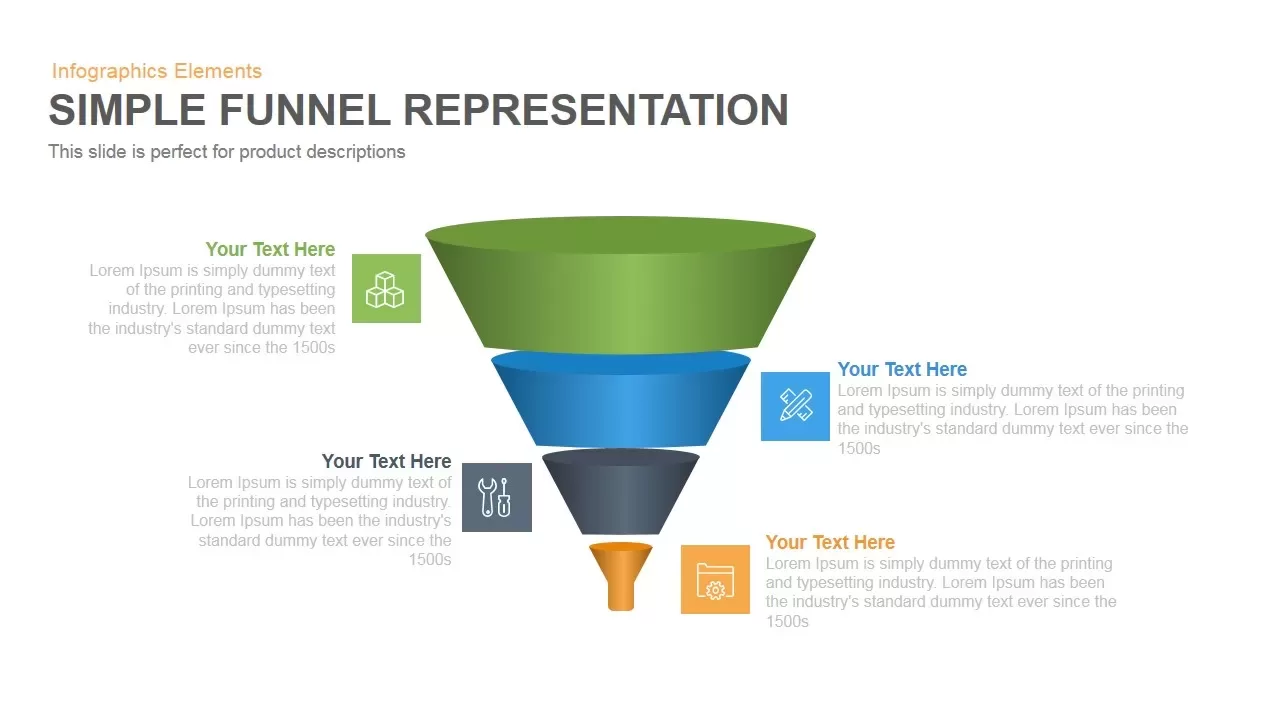
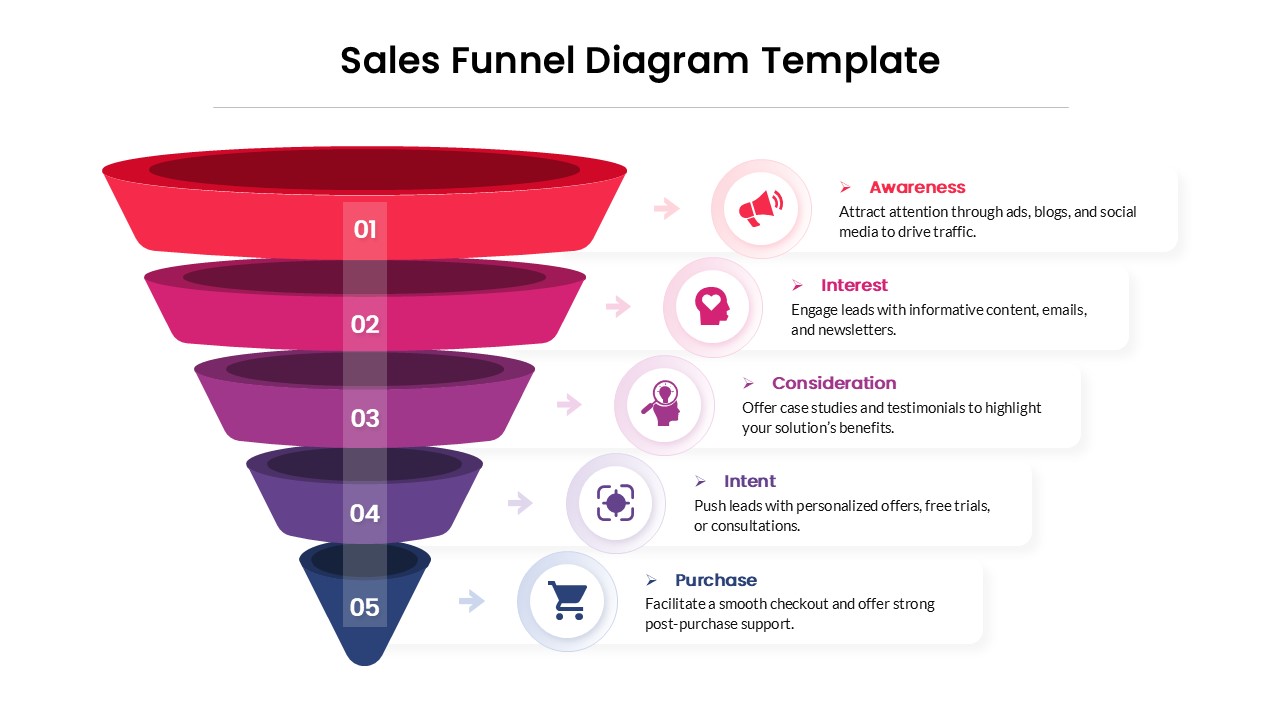
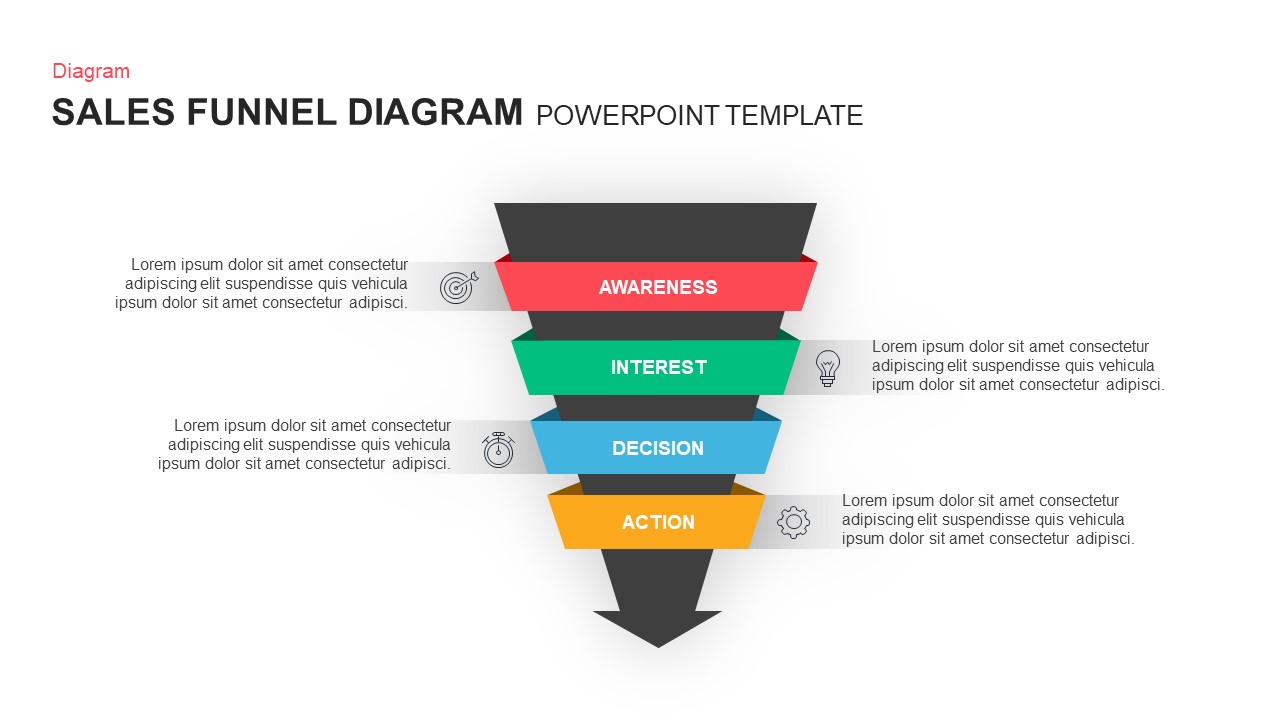
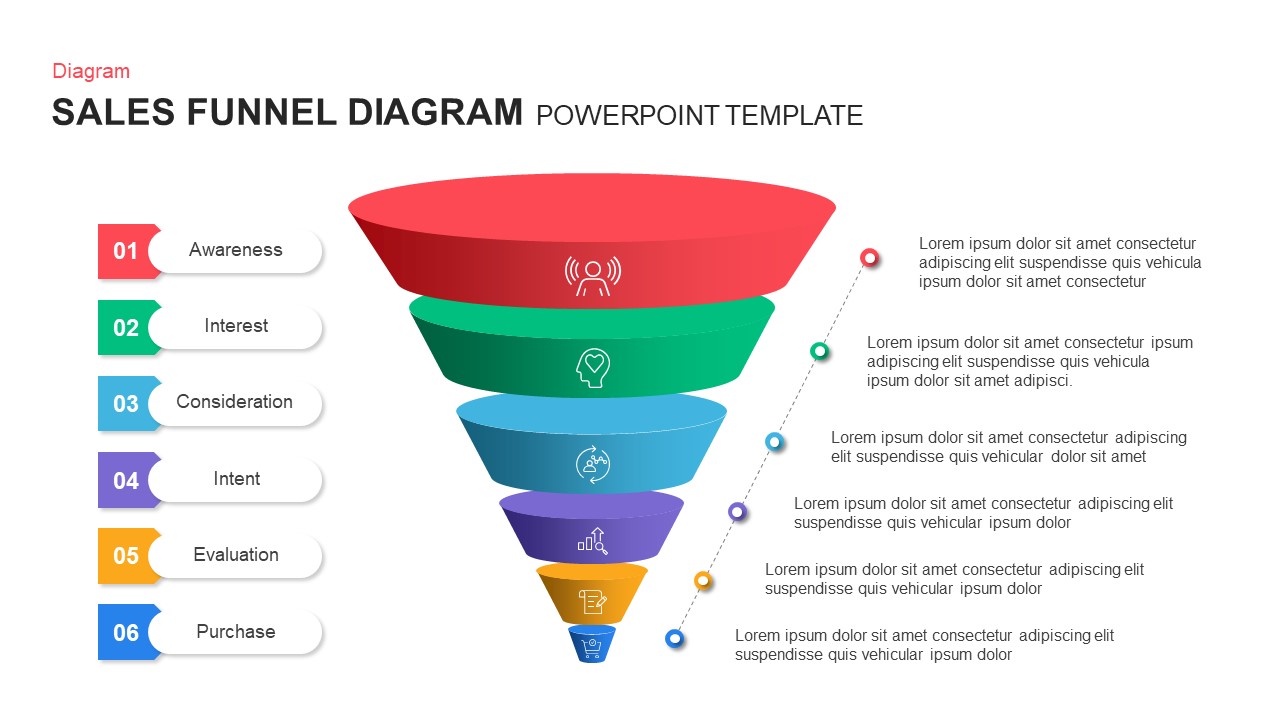
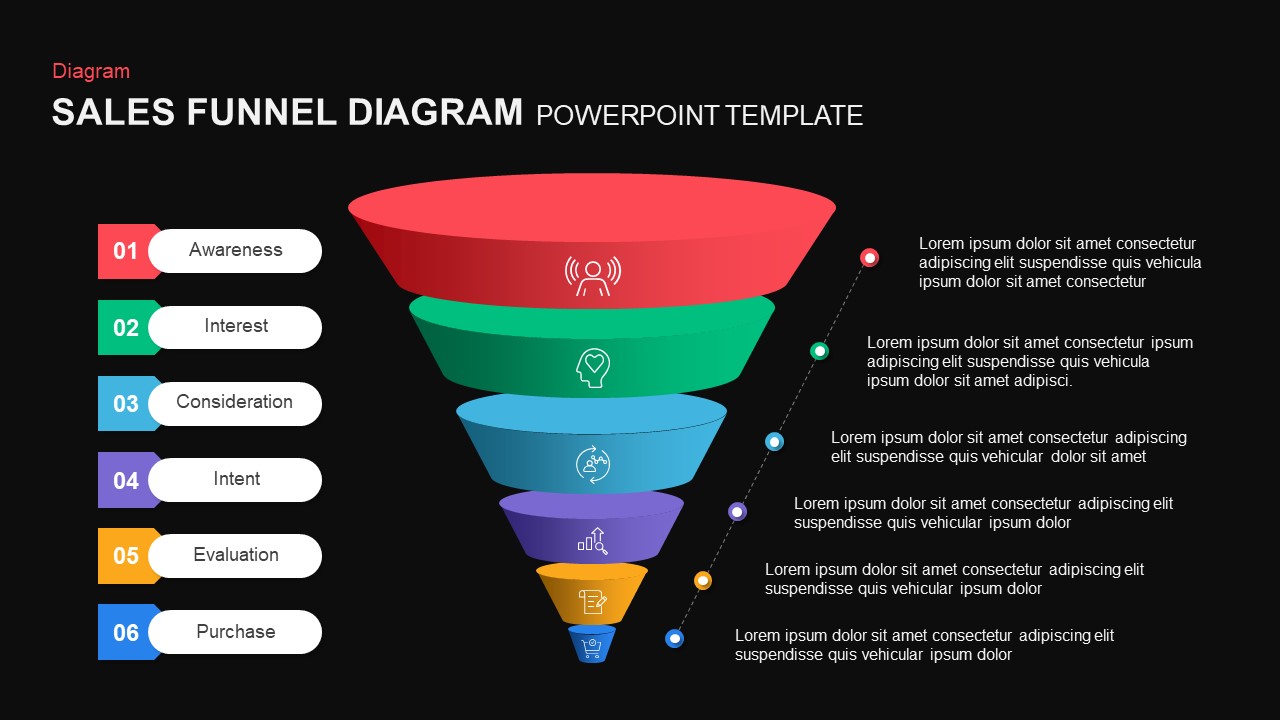
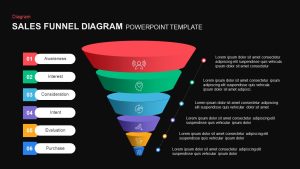
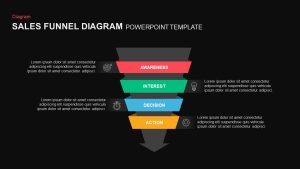
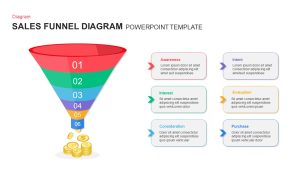
Transform your sales pipeline data into a visually engaging narrative with this sleek funnel diagram slide, designed to illustrate the four critical stages of the buyer’s journey: Awareness, Interest, Decision, and Action. Each funnel segment is rendered as a bold trapezoid—red for Awareness, green for Interest, blue for Decision, and yellow for Action—interspersed with neutral gray layers to reinforce hierarchy and maintain focus. Crisp icon placeholders positioned at each stage enable you to convey key metrics or qualitative highlights, while adjacent callout boxes provide ample room for concise explanations or data points. A subtle drop shadow beneath the funnel adds depth, and a downward arrow at the base signals progression to conversion.
Built entirely with editable vector shapes and master slide layouts, this template delivers full customization without any loss in design quality. Smart Guides and layered grouping ensure perfect alignment when resizing segments, swapping icons, or recoloring elements. SVG icon support allows you to replace placeholder graphics with relevant visuals in seconds, and editable text boxes facilitate quick content updates. The flat design aesthetic and consistent typography integrate seamlessly into corporate branding, while compatibility across PowerPoint and Google Slides guarantees a pixel-perfect experience on any device.
Ideal for marketing meetings, sales workshops, and stakeholder briefings, this slide helps teams visualize funnel metrics, identify drop-off points, and optimize conversion strategies. Use built-in animation presets to sequentially reveal each funnel layer and guide your audience through the buying process. Customize gradient stops or segment widths to reflect real-world data distributions, then duplicate or merge instances to build multi-funnel comparisons, AB testing decks, or campaign performance reports. With this versatile funnel diagram, you can streamline storytelling, reinforce strategic insights, and drive data-driven decisions with clarity and impact.
Who is it for
Sales managers, marketing leaders, and business analysts will benefit from this funnel diagram to communicate lead generation performance, conversion rates, and campaign ROI. Product managers, digital strategists, and executive teams can also use it to align stakeholders on sales objectives, identify process bottlenecks, and support data-driven decision making.
Other Uses
Beyond sales pipelines, repurpose this slide to map customer onboarding sequences, event registration funnels, or recruitment processes. Use it for website conversion analyses, email nurturing workflows, product trial funnels, or membership signup journeys. Adjust segment labels and colors to fit any sequential framework requiring clear stage-by-stage visualization.
Login to download this file

Item ID
SB01264
Related Templates

Professional Four-Stage Funnel Diagram Template for PowerPoint & Google Slides
Funnel
Professional 3D Funnel Infographic Template for PowerPoint & Google Slides
Funnel
Professional Sales Performance Report Template for PowerPoint & Google Slides
Business Report
Professional Sales Meeting Presentation Template for PowerPoint & Google Slides
Pitch Deck
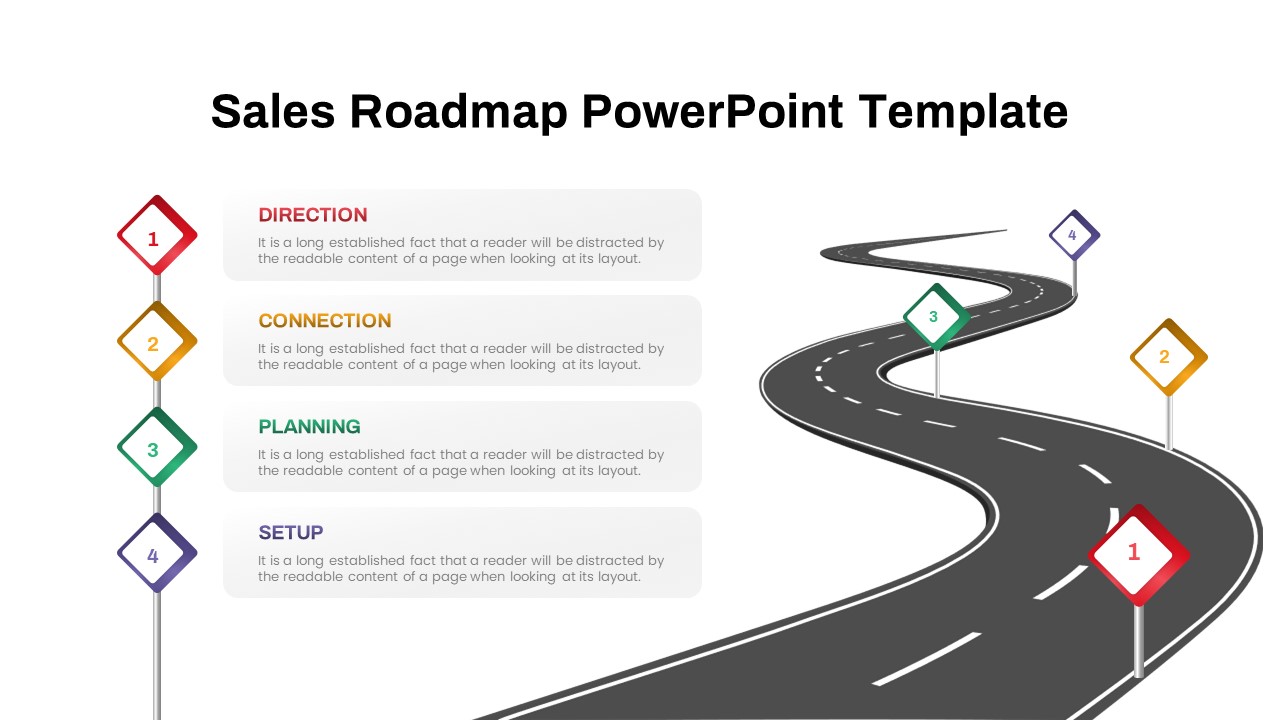
Professional Winding Road Sales Roadmap Template for PowerPoint & Google Slides
Roadmap
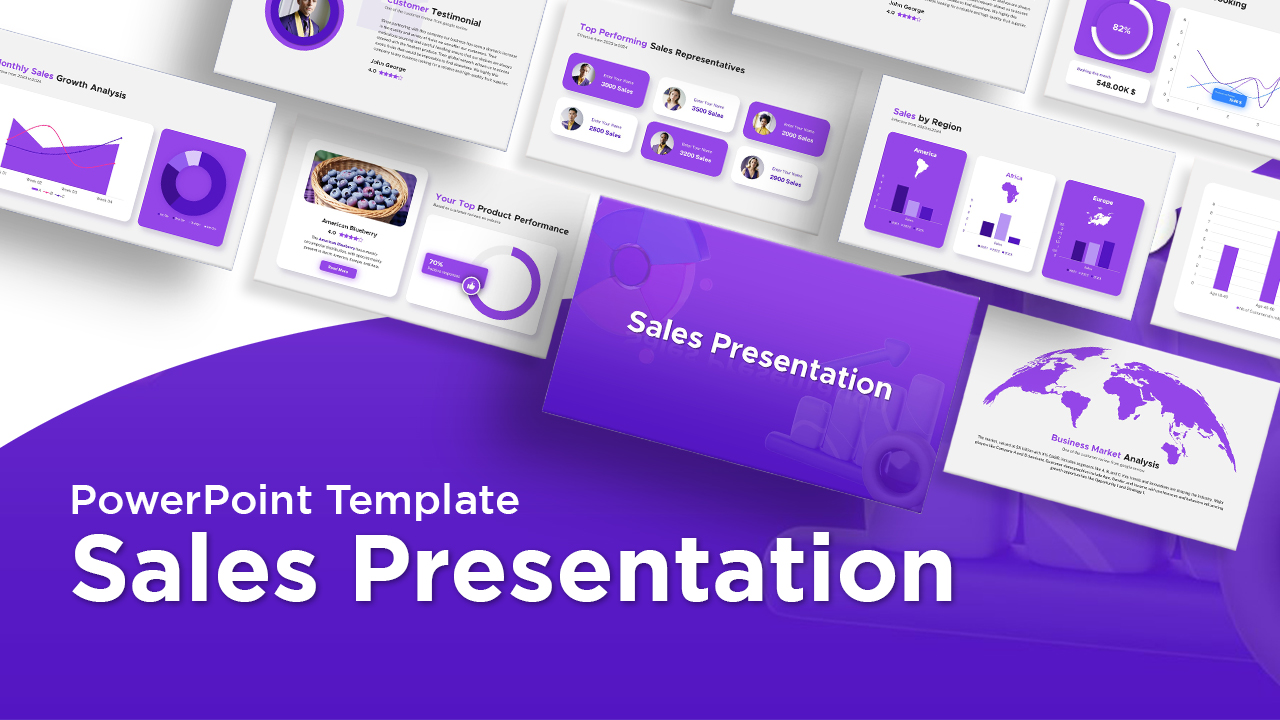
Professional Animated Sales Presentation Template for PowerPoint & Google Slides
Pitch Deck
Sales Process Workflow Funnel Diagram PowerPoint Template for PowerPoint & Google Slides
Funnel
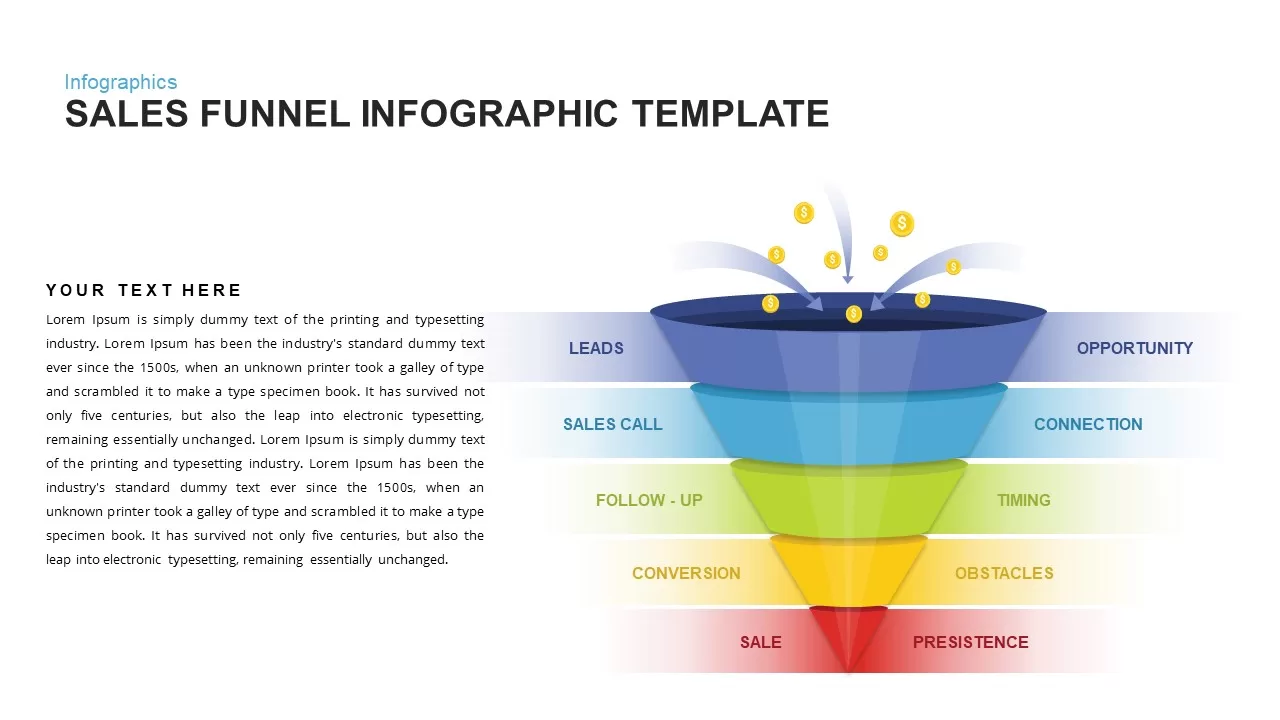
Sales Funnel Infographic Diagram Template for PowerPoint & Google Slides
Funnel
5 Stage Sales Funnel Diagram Template for PowerPoint & Google Slides
Funnel

Sales Funnel Diagram for PowerPoint & Google Slides
Marketing Funnel
4 Level Sales Funnel Diagram Design for PowerPoint & Google Slides
Marketing Funnel
Sales Enablement Funnel diagram for PowerPoint & Google Slides
Funnel
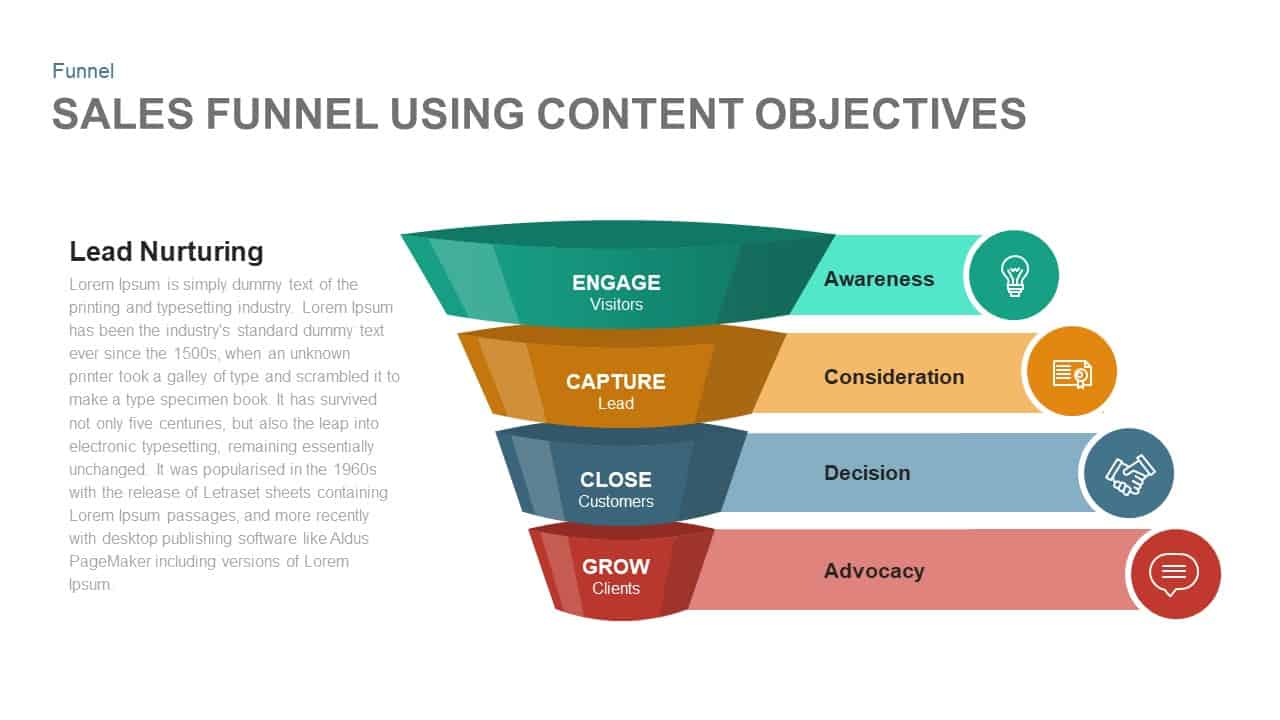
Sales Funnel Using Content Objectives Template for PowerPoint & Google Slides
Funnel
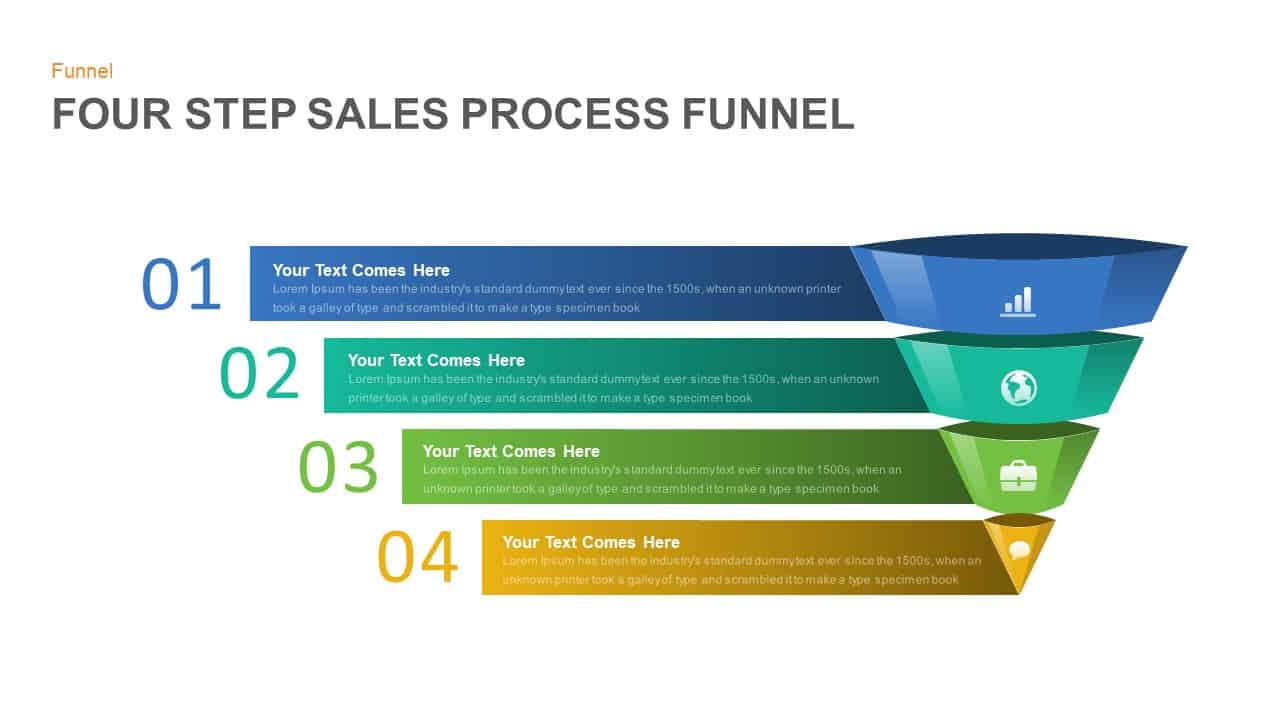
Four Step Sales Process Funnel Template for PowerPoint & Google Slides
Funnel
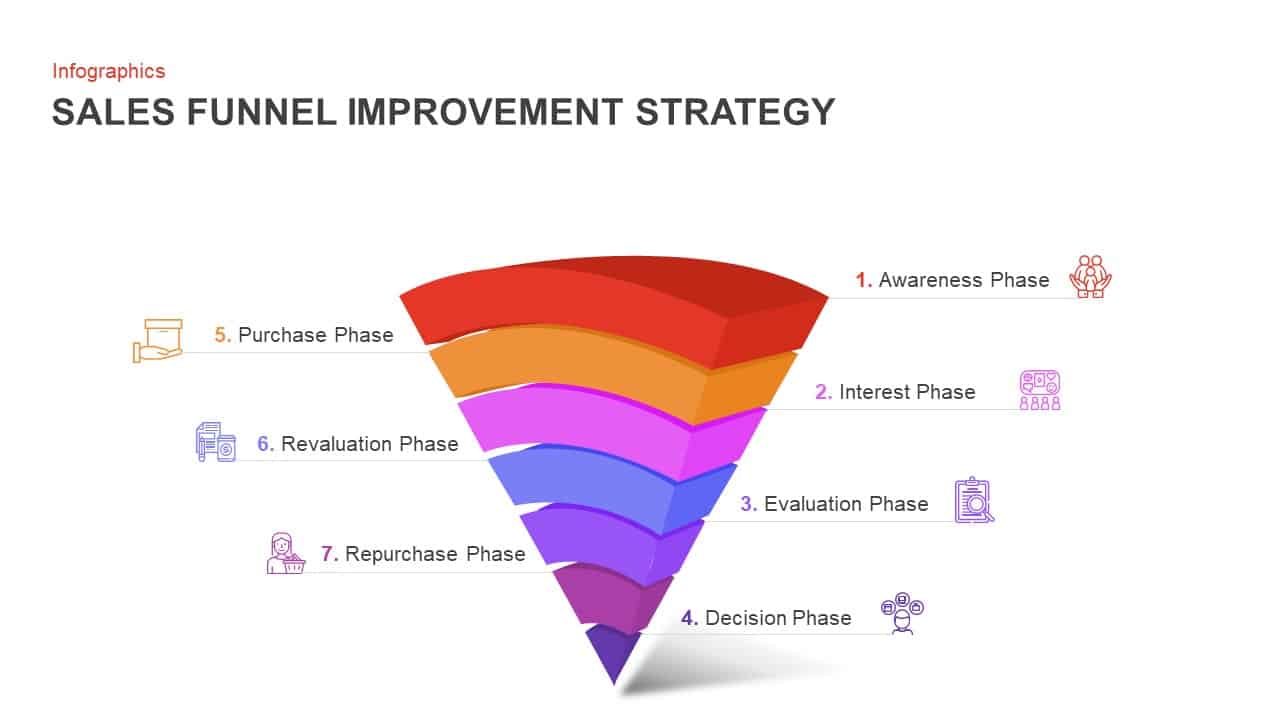
7-Step Sales Funnel Improvement Strategy Template for PowerPoint & Google Slides
Infographics
Inverted Sales Funnel Marketing Stages Template for PowerPoint & Google Slides
Marketing Funnel
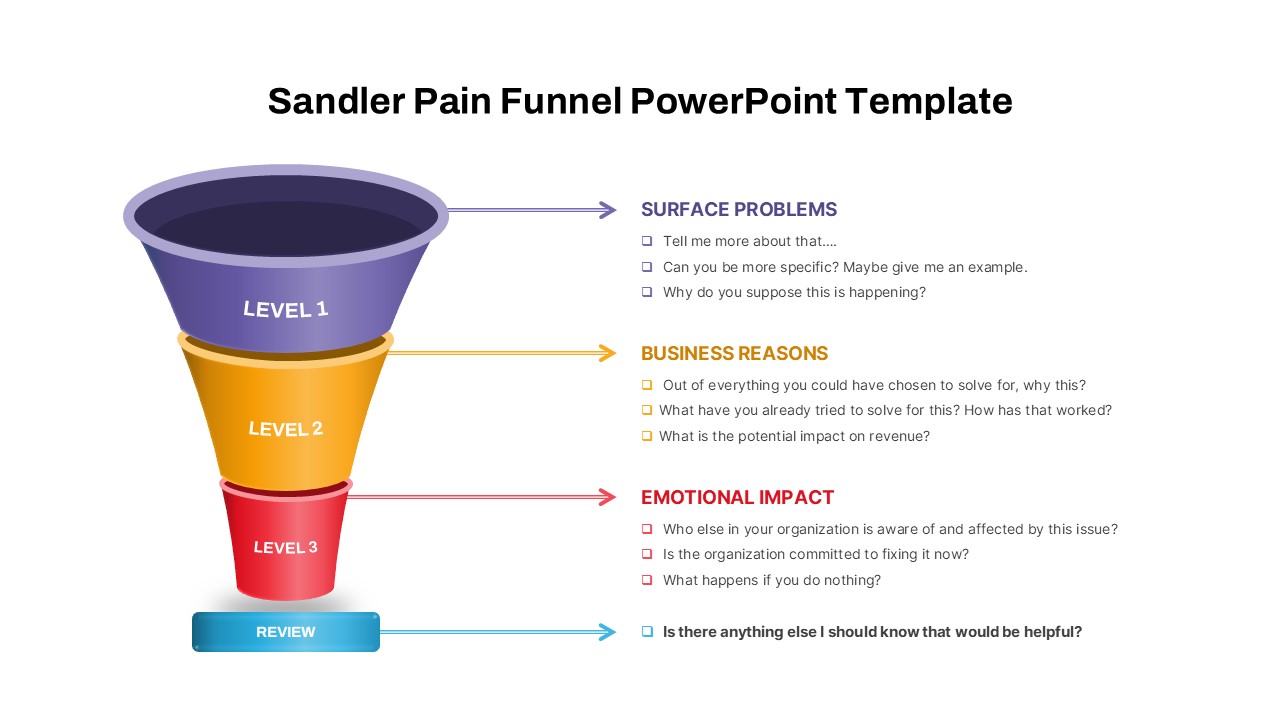
Sandler Pain Funnel Sales Qualification Template for PowerPoint & Google Slides
Funnel
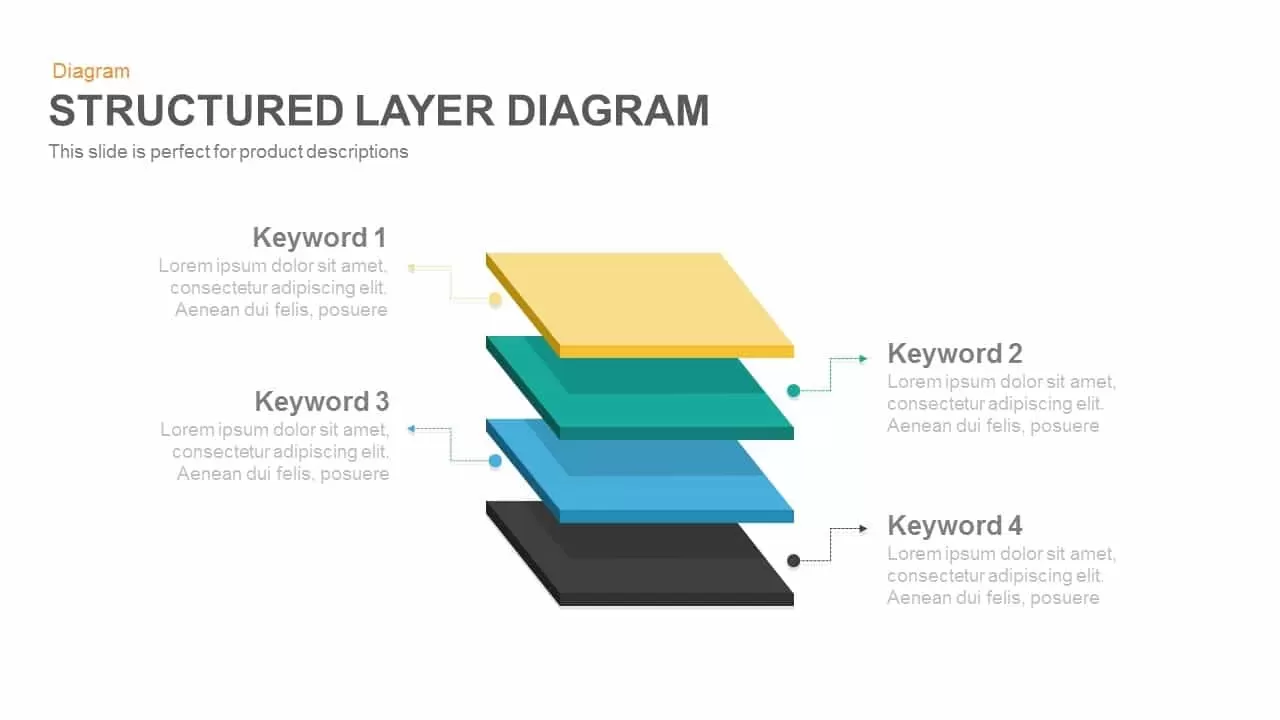
Professional Structured 3D Layer Diagram Template for PowerPoint & Google Slides
Process
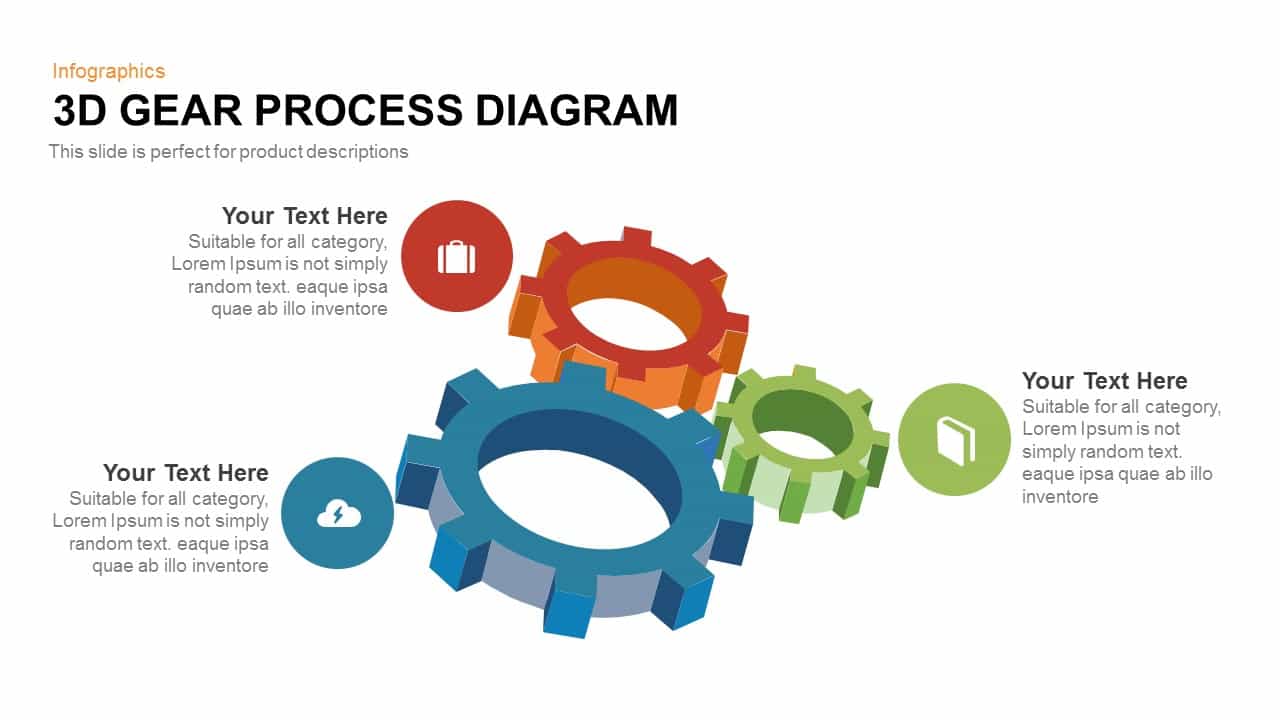
Professional 3D Gear Process Diagram Template for PowerPoint & Google Slides
Process
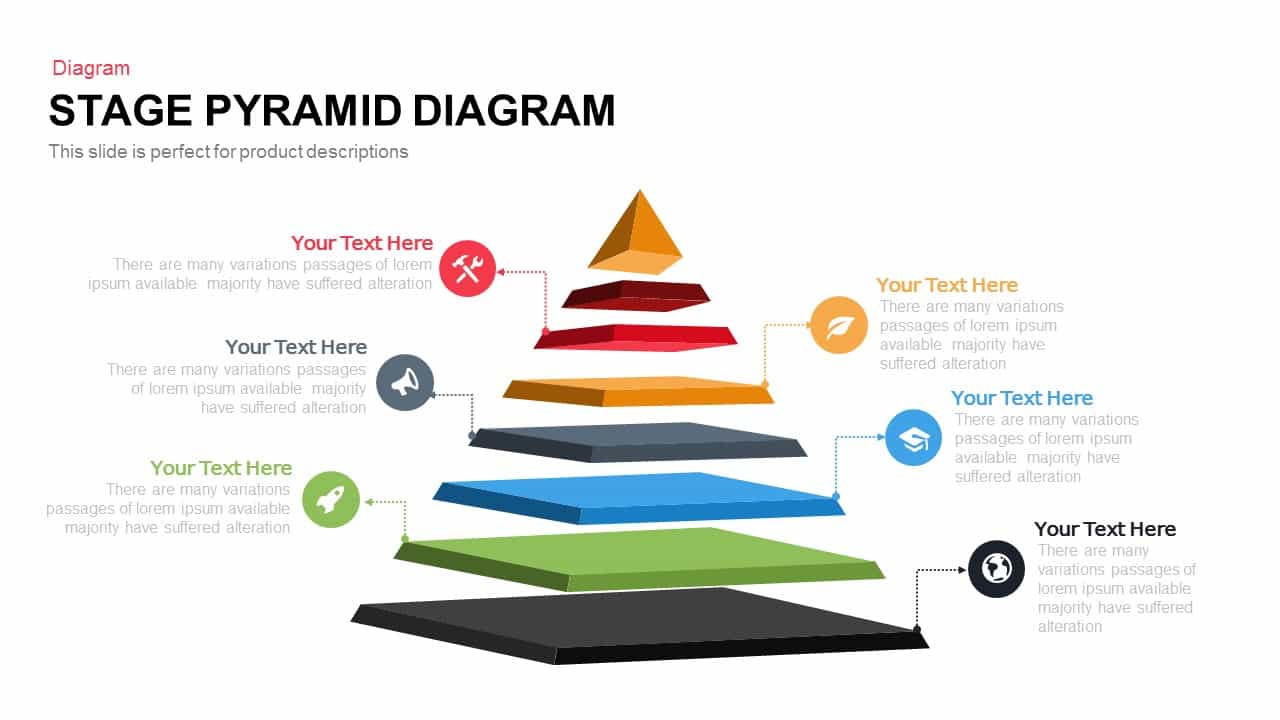
Professional 5-Stage Pyramid Diagram Template for PowerPoint & Google Slides
Pyramid
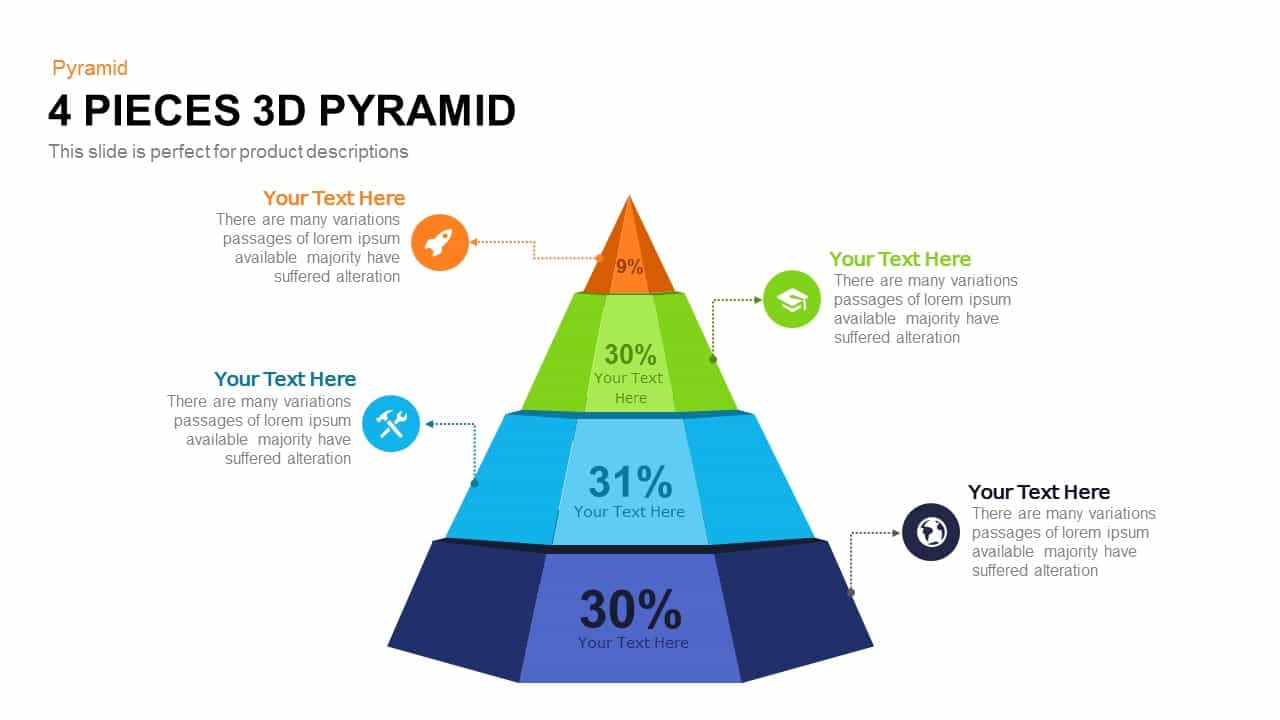
Professional 4-Piece 3D Pyramid Diagram Template for PowerPoint & Google Slides
Pyramid
Professional Security Metaphor Diagram Template for PowerPoint & Google Slides
Information Technology
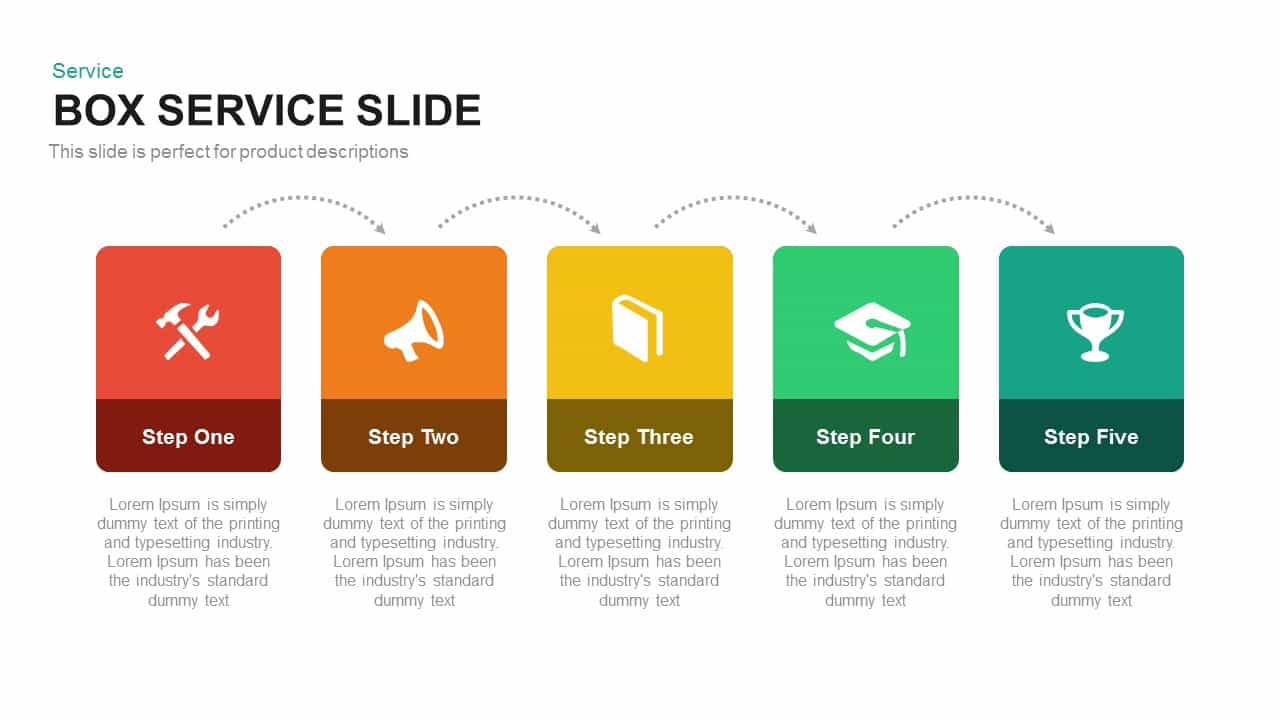
Professional Box Service Diagram Template for PowerPoint & Google Slides
Comparison

Professional PESTEL Analysis Diagram Template for PowerPoint & Google Slides
PEST

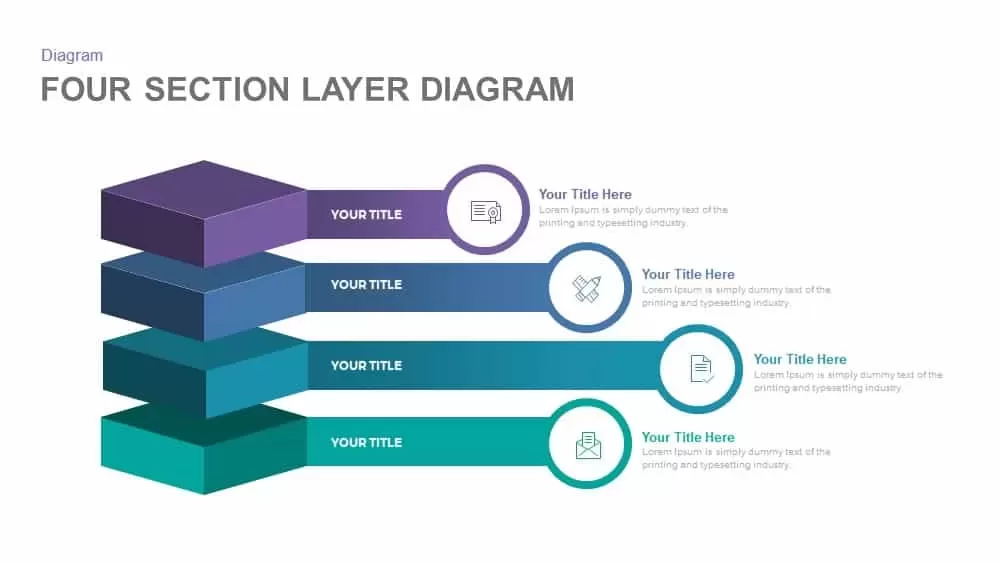
Professional Four-Section Layer Diagram Template for PowerPoint & Google Slides
Process
Professional Organizational Chart Diagram Template for PowerPoint & Google Slides
Org Chart
Professional 6 Circle Venn Diagram Template for PowerPoint & Google Slides
Circular
Free Professional Gantt Chart Pack – 4 Slides Template for PowerPoint & Google Slides
Gantt Chart
Free
Professional Team Efficiency Dashboard Template for PowerPoint & Google Slides
Business Report
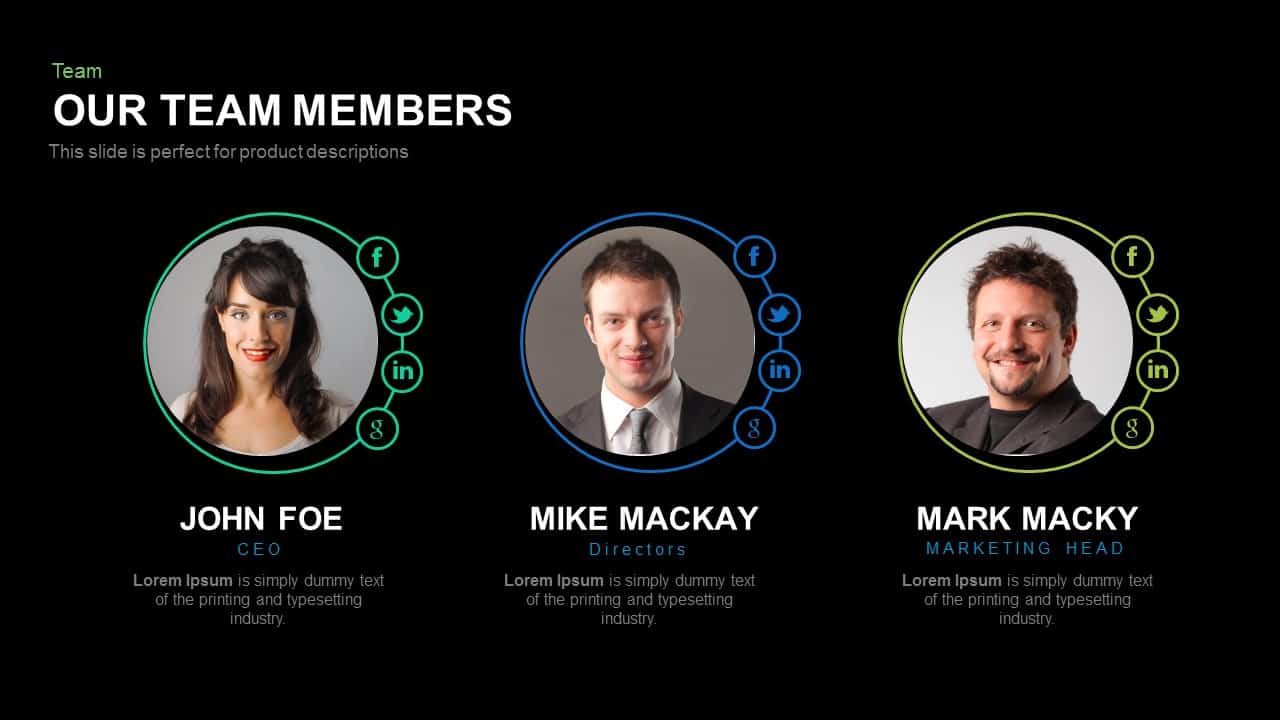
Professional Team Members Slide Template for PowerPoint & Google Slides
Our Team
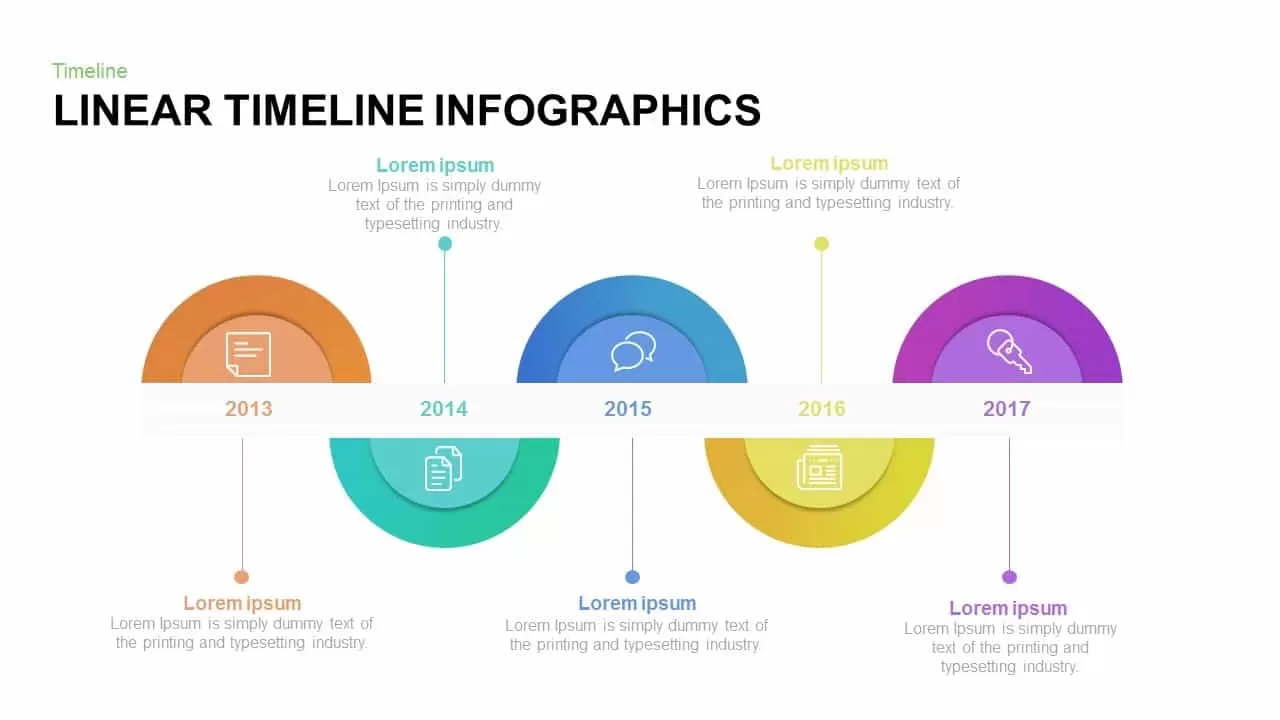
Professional Linear Timeline Infographic Template for PowerPoint & Google Slides
Timeline
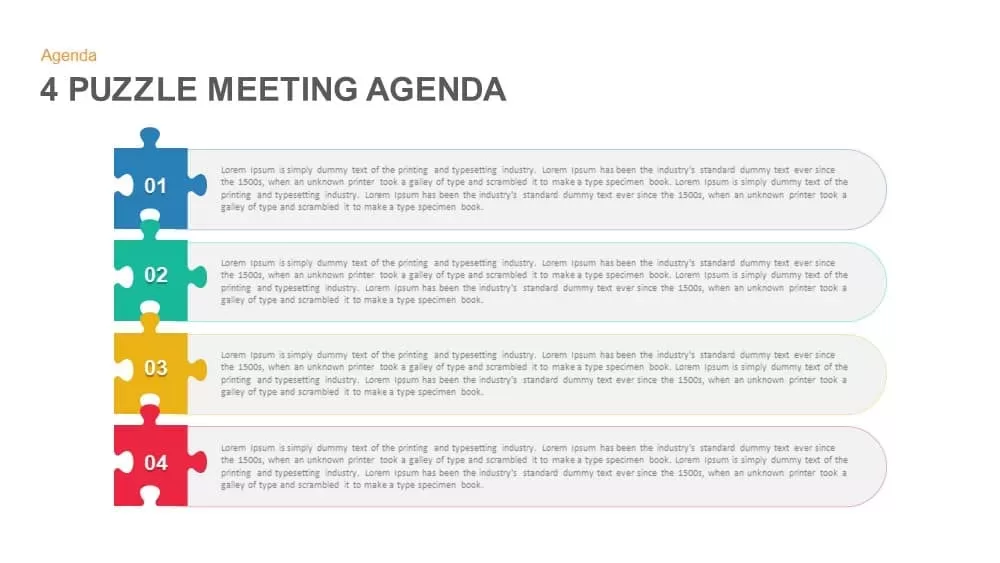
Professional Four Puzzle Meeting Agenda Template for PowerPoint & Google Slides
Agenda
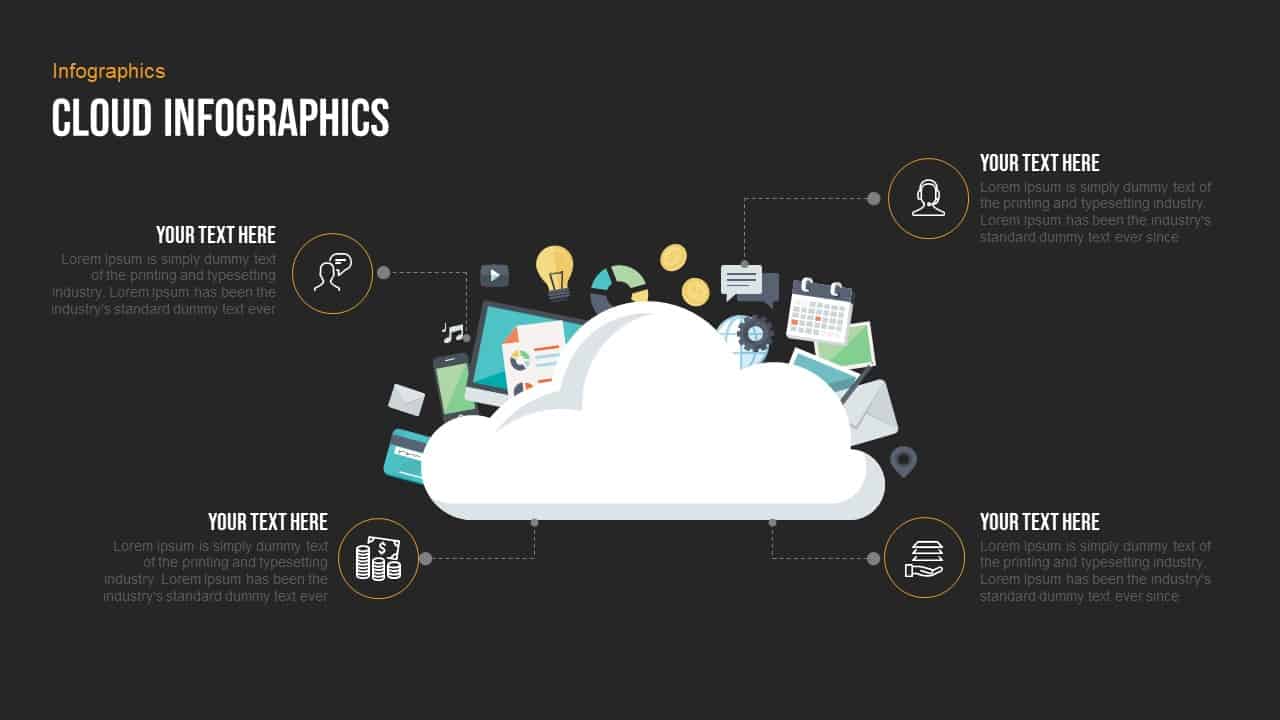
Free Professional Cloud Infographics Template for PowerPoint & Google Slides
Process
Free
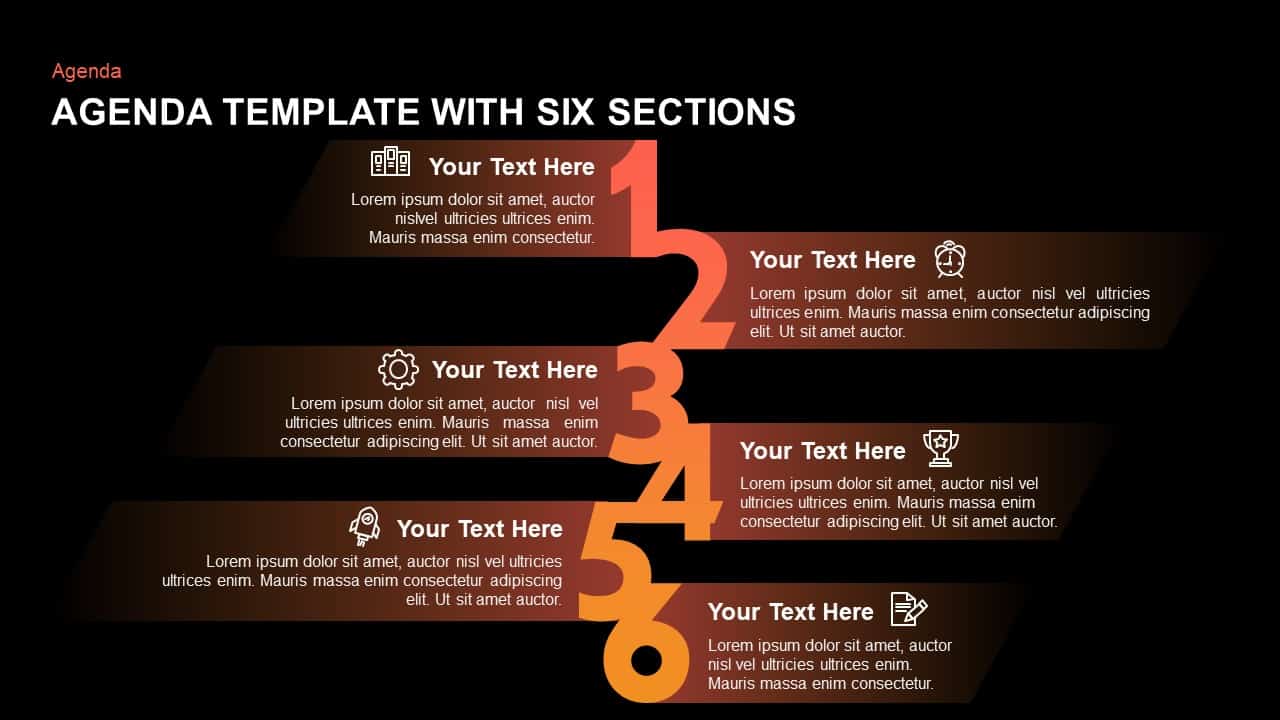
Six-Section Professional Agenda Template for PowerPoint & Google Slides
Agenda
Professional Ten-Step Agenda Slide Template for PowerPoint & Google Slides
Agenda
Professional Pitch Deck Template for PowerPoint & Google Slides
Pitch Deck
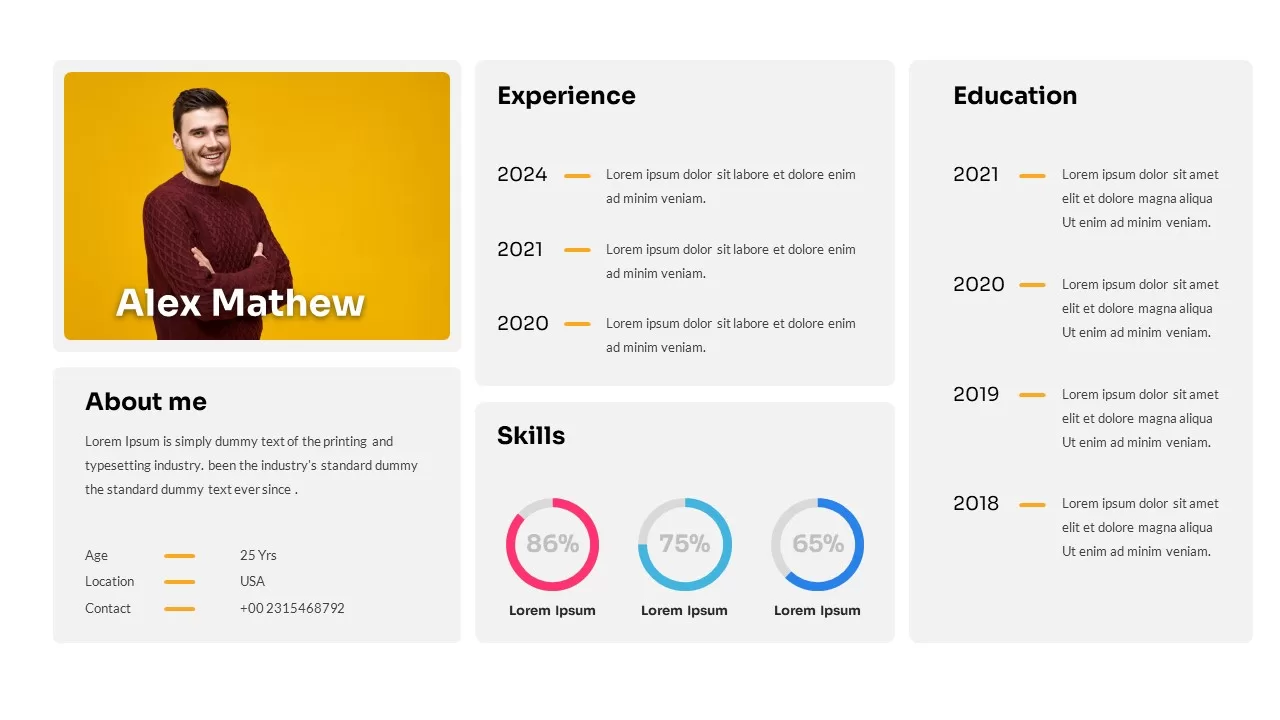
Professional Personal CV Presentation Template for PowerPoint & Google Slides
Company Profile
Professional Mobile App Showcase Deck Template for PowerPoint & Google Slides
Pitch Deck
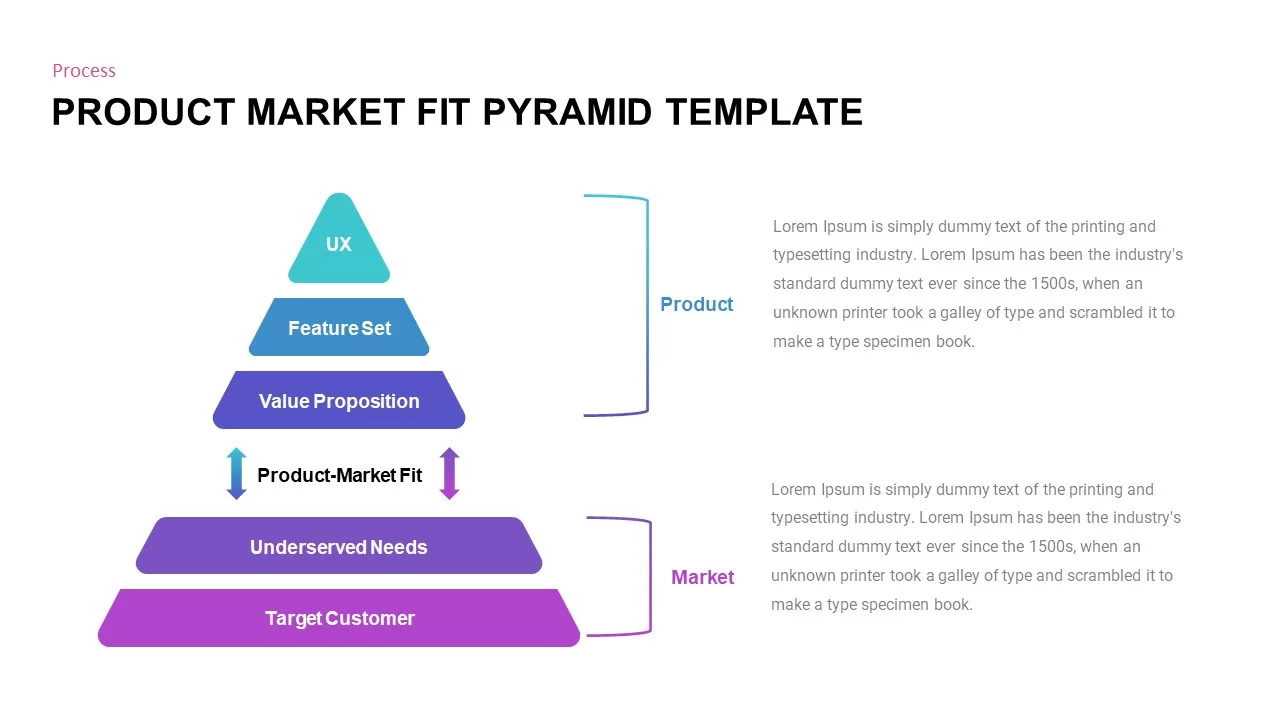
Professional Product Market Fit Pyramid Template for PowerPoint & Google Slides
Pyramid
Professional Book Review Infographic Template for PowerPoint & Google Slides
Business
Professional Portfolio Profile Template for PowerPoint & Google Slides
Decks

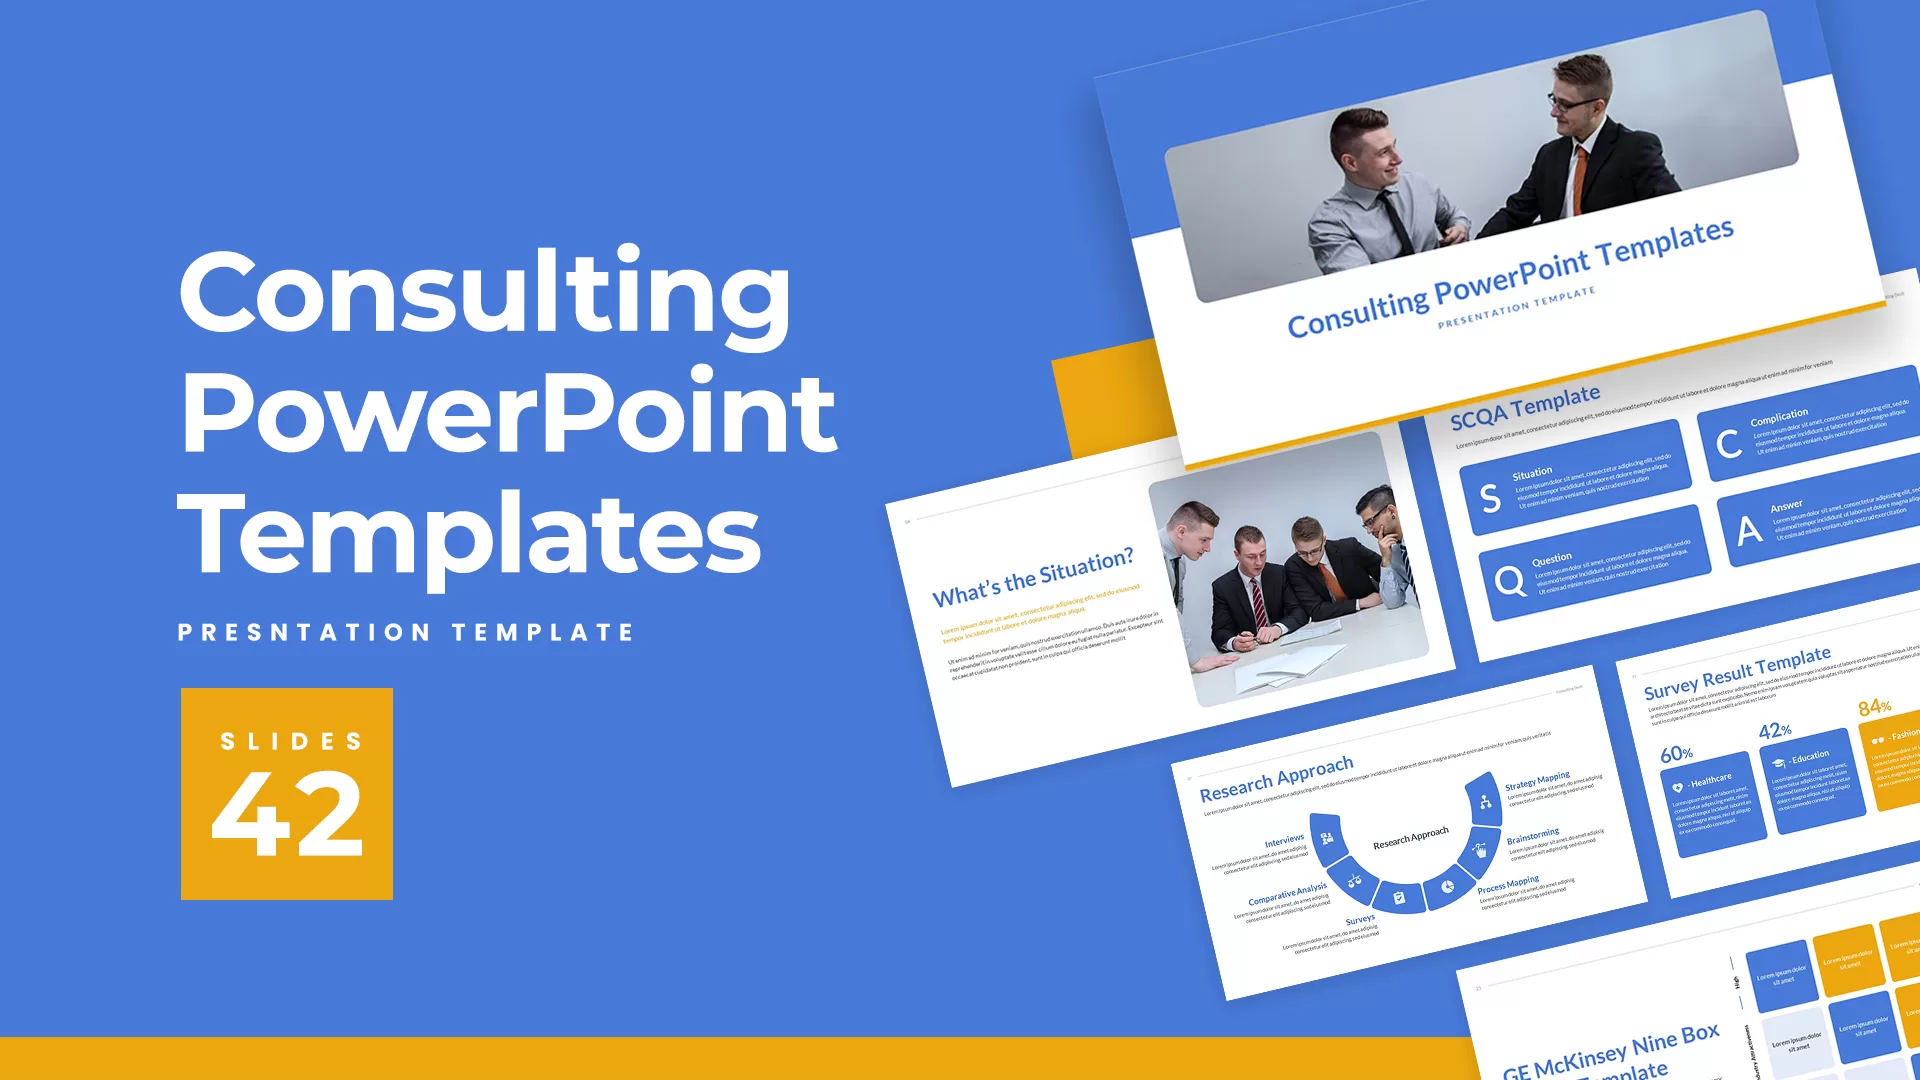
Professional Consulting Deck Presentation Template for PowerPoint & Google Slides
Pitch Deck
Professional Resume Profile Slide Template for PowerPoint & Google Slides
Recruitment
Professional Nurse Infographic Dashboard Template for PowerPoint & Google Slides
Nursing
Professional Risk Heat Map Visualization Template for PowerPoint & Google Slides
Risk Management
Professional Interactive Heat Map Matrix Template for PowerPoint & Google Slides
Comparison Chart
Professional Nurse-Led Healthcare Template for PowerPoint & Google Slides
Nursing
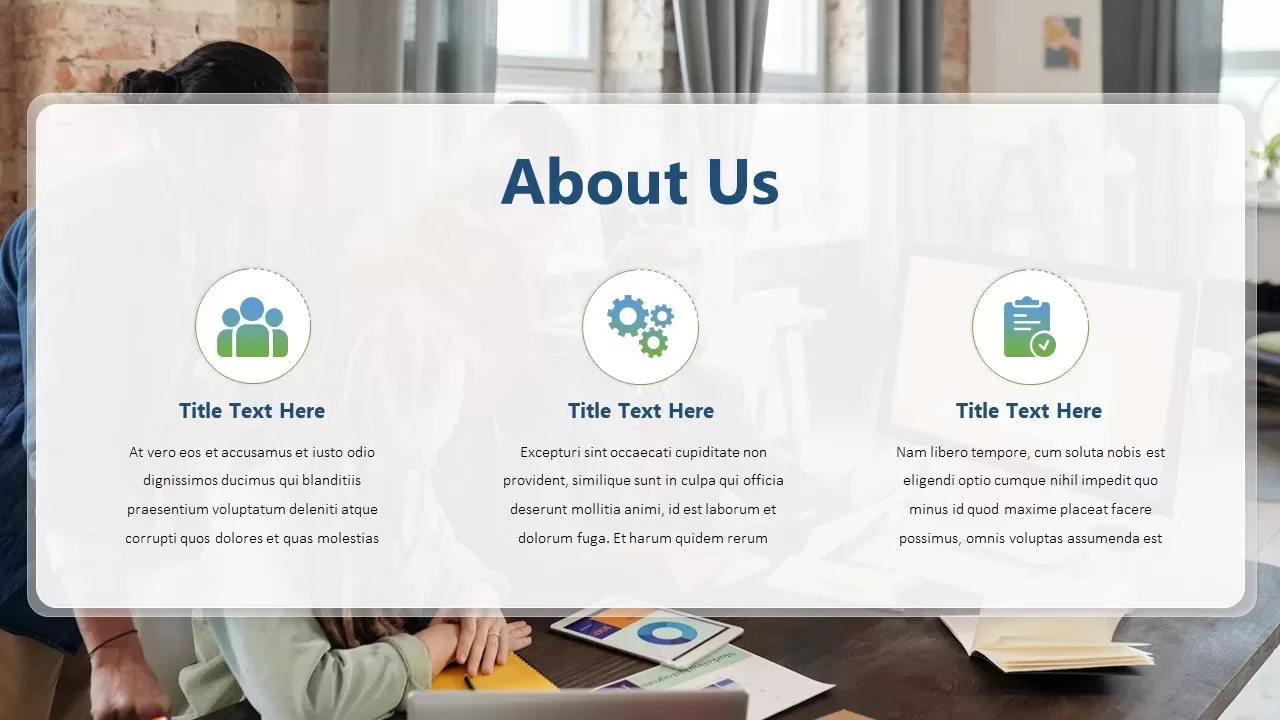
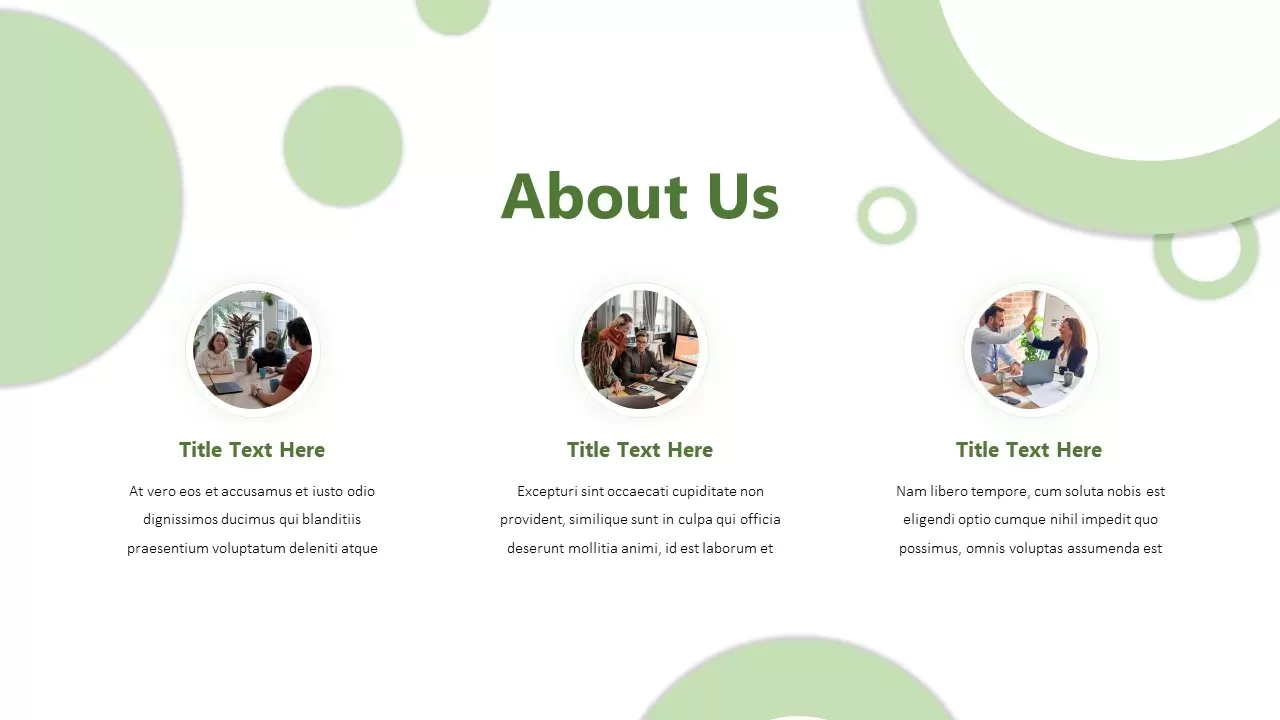
Professional Company About Us Slide Template for PowerPoint & Google Slides
Company Profile
Professional Corporate Company About Us Template for PowerPoint & Google Slides
Graphics
Professional Team Collage & KPI Slide Template for PowerPoint & Google Slides
Business
Professional Heatmap Data Visualization Template for PowerPoint & Google Slides
Infographics
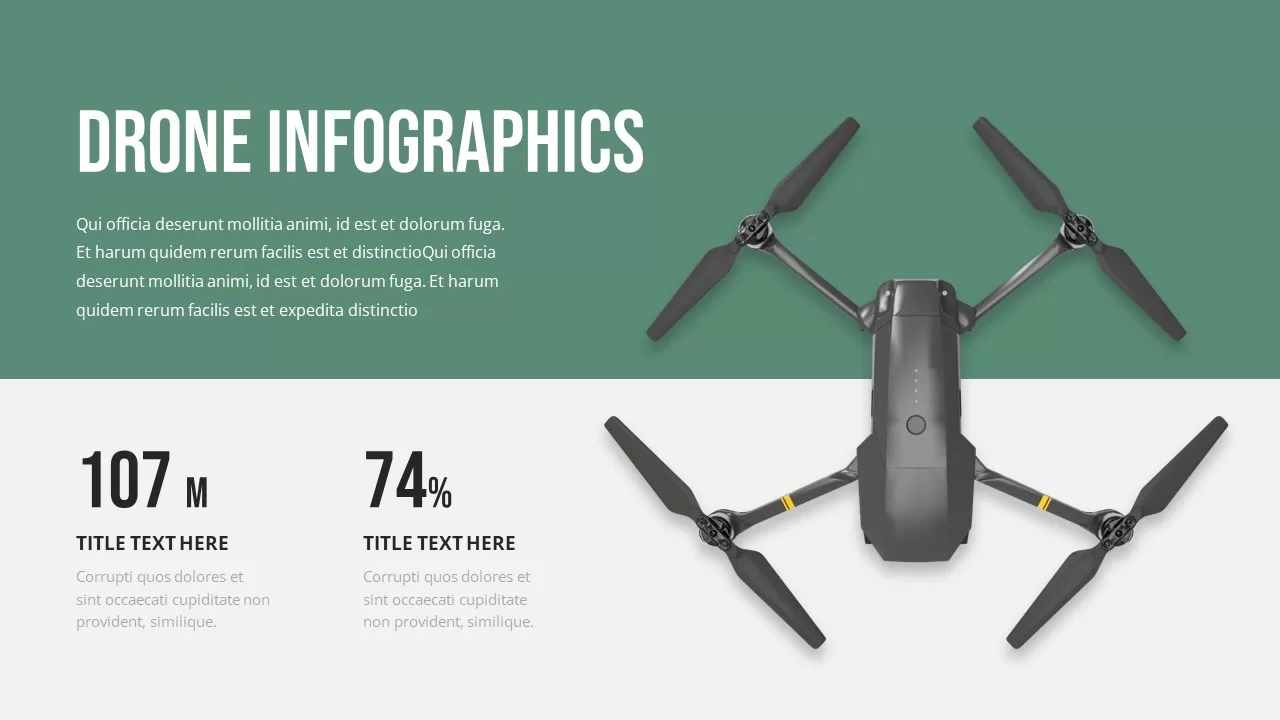
Professional Drone Infographic Slide Template for PowerPoint & Google Slides
Infographics
Professional Corporate Cover Slide Template for PowerPoint & Google Slides
Company Profile
Professional Angular Cover Slide Template for PowerPoint & Google Slides
Company Profile
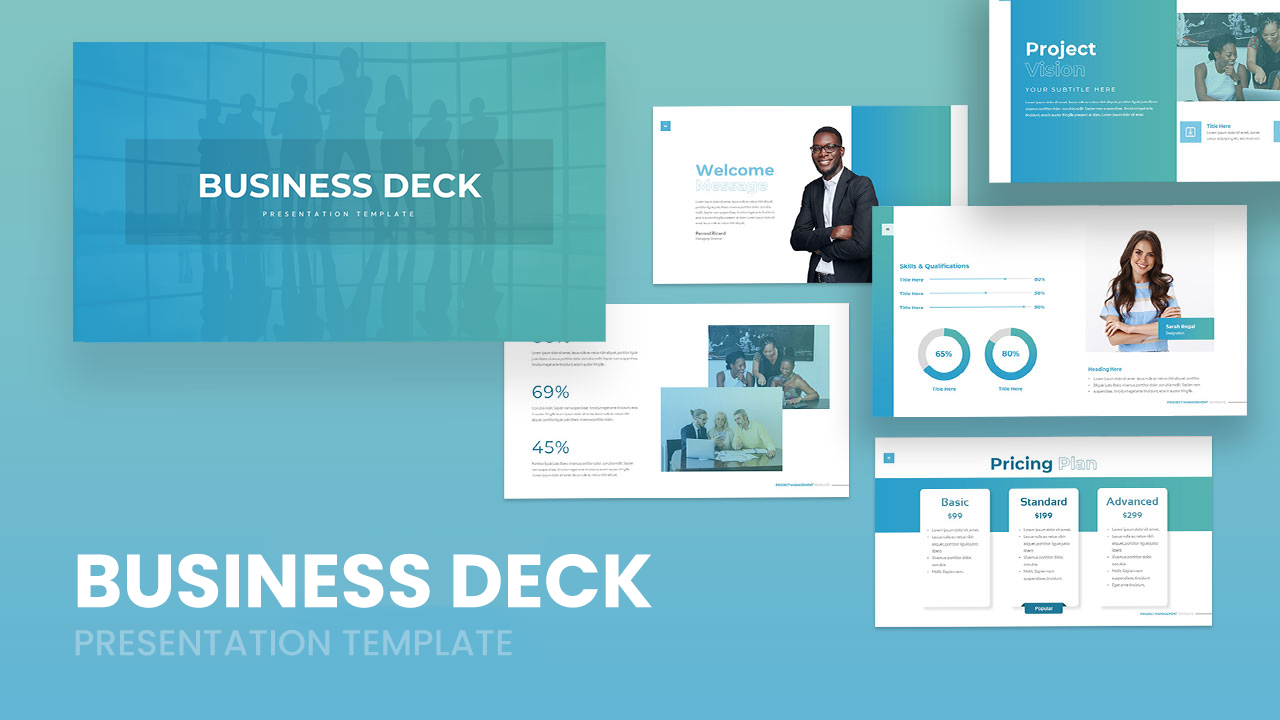
Professional Business Deck Presentation Template for PowerPoint & Google Slides
Company Profile
Professional Portfolio Presentation Deck Template for PowerPoint & Google Slides
Decks
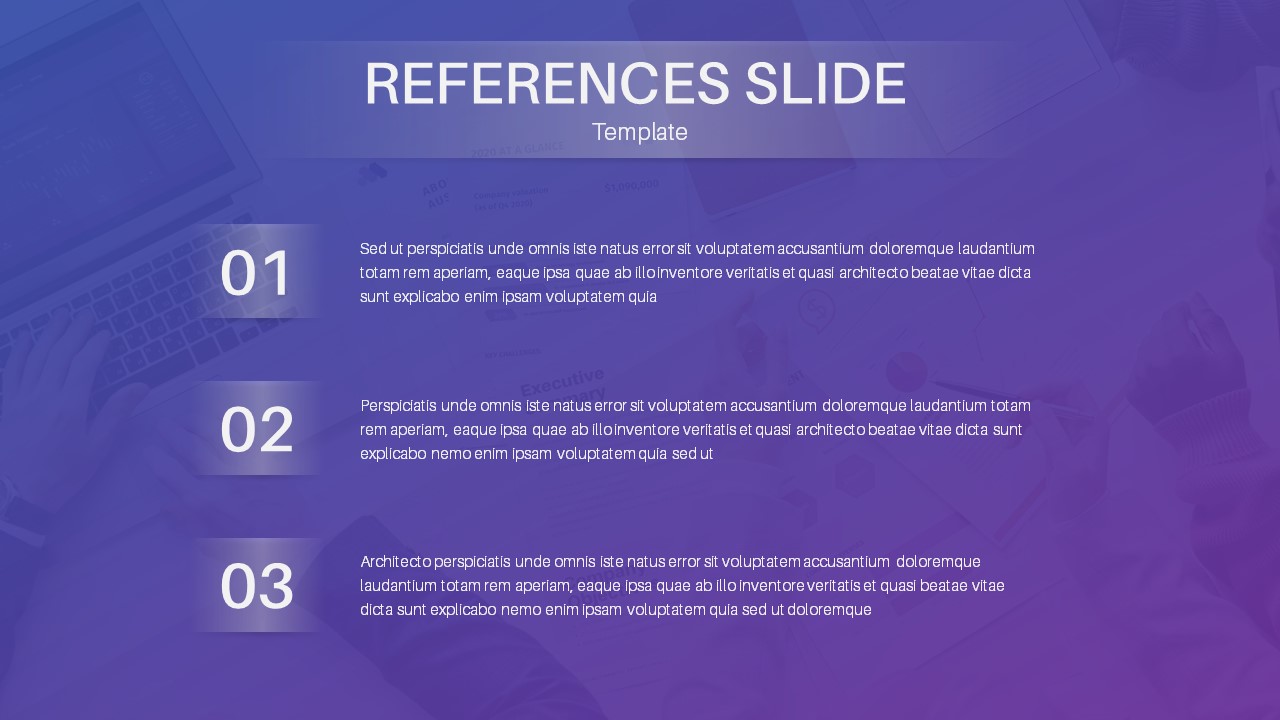
Professional References Slide Layout Template for PowerPoint & Google Slides
Infographics
Professional Photo References Slide Template for PowerPoint & Google Slides
Business
Modern Professional References Slide Template for PowerPoint & Google Slides
Business Report
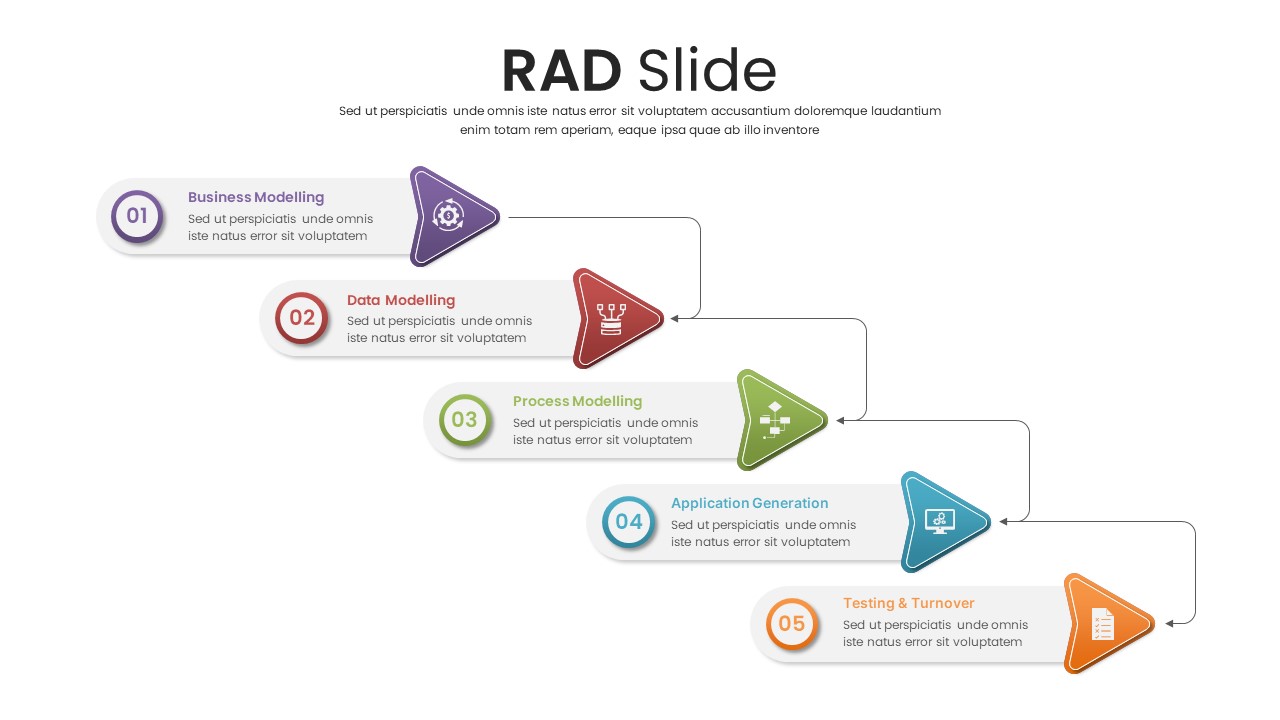
Professional Five-Step RAD Process Slide Template for PowerPoint & Google Slides
Process
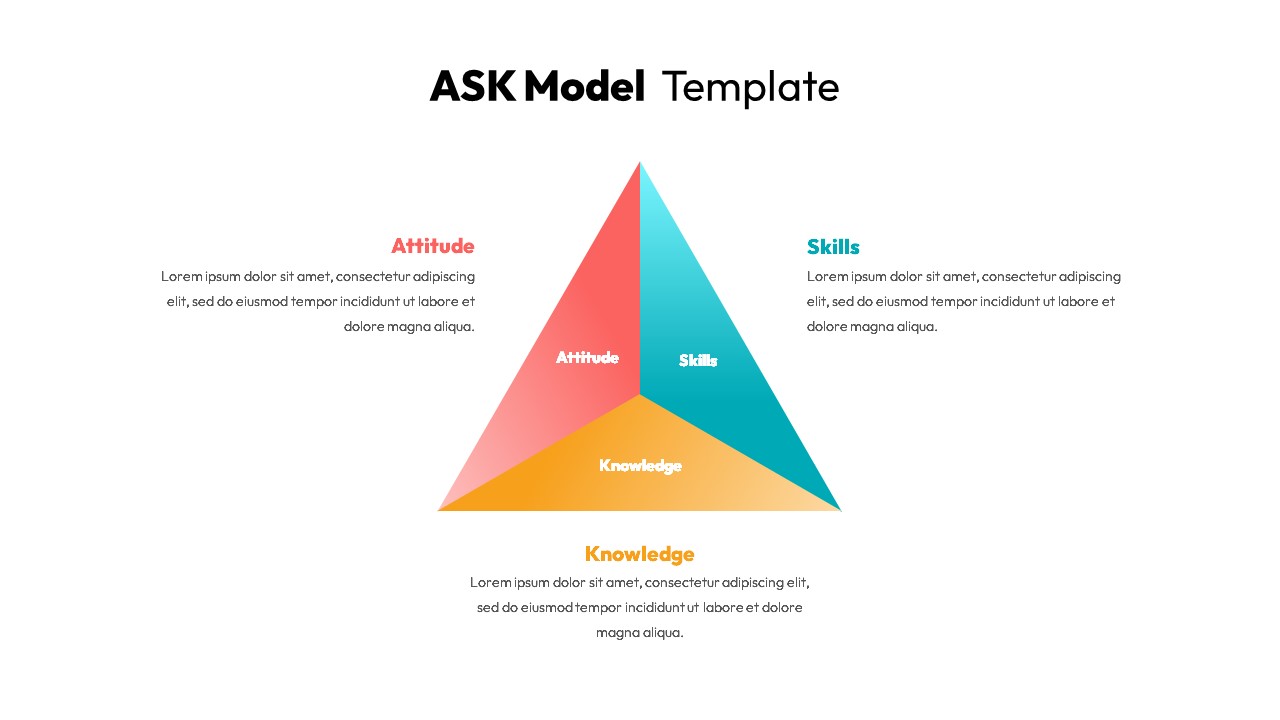
Professional ASK Model Template for PowerPoint & Google Slides
Employee Performance
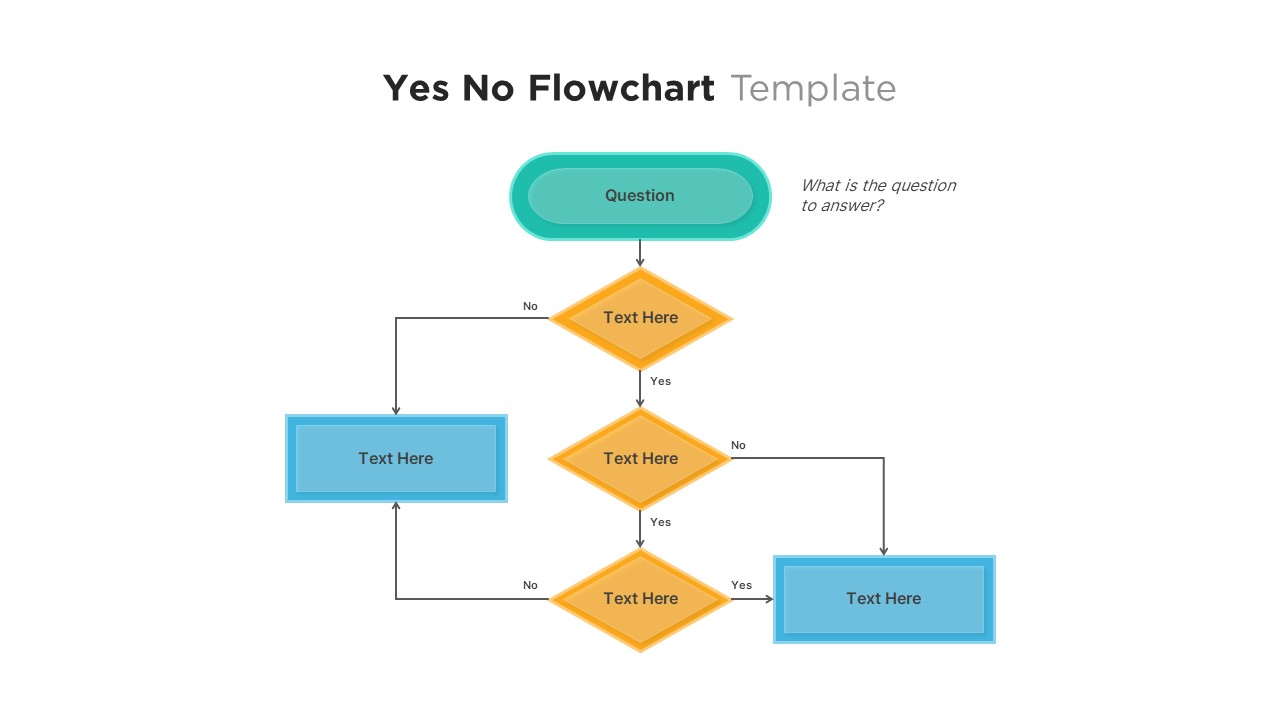
Professional Yes No Decision Flowchart Template for PowerPoint & Google Slides
Flow Charts
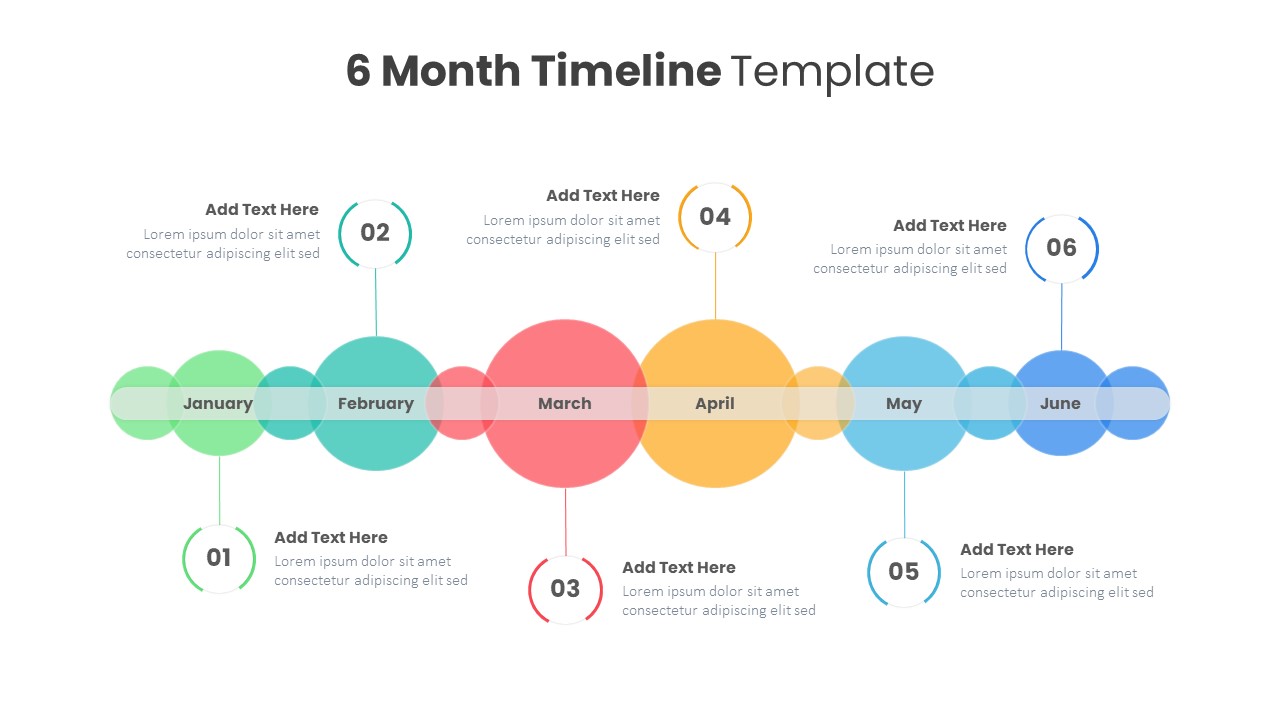
Professional Editable 6 Month Timeline Template for PowerPoint & Google Slides
Timeline
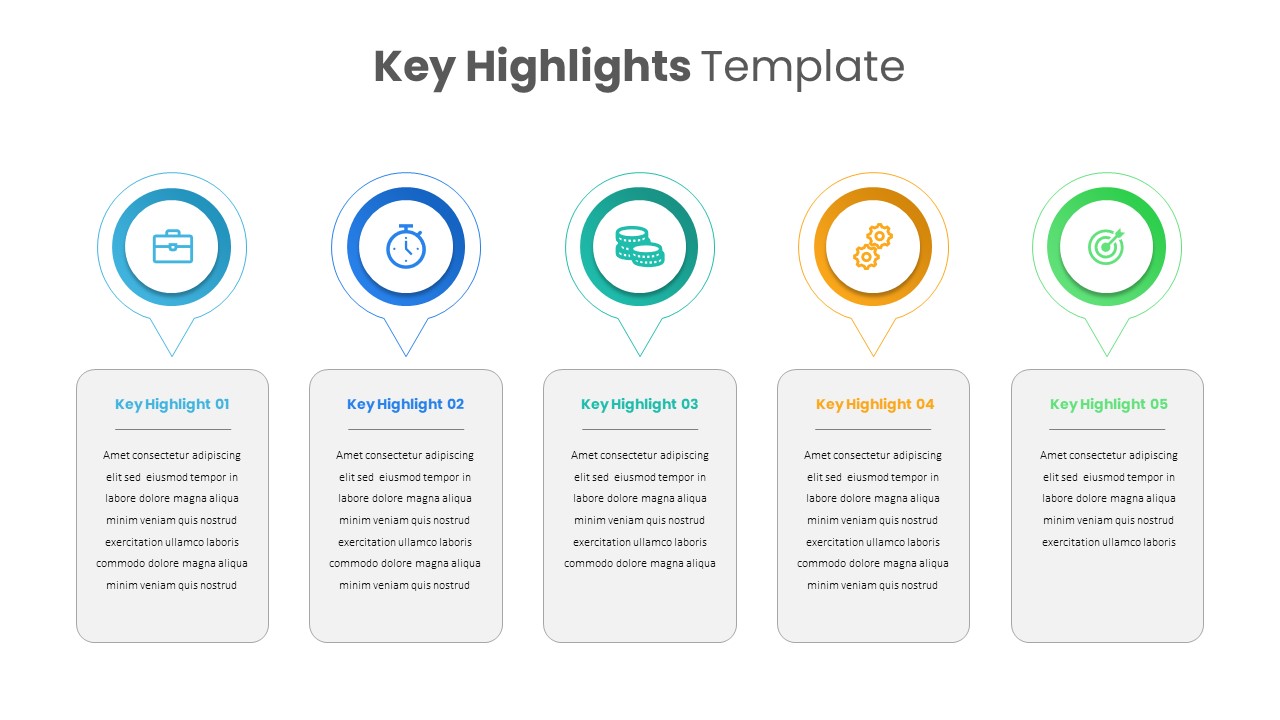
Professional Key Highlights Layout Template for PowerPoint & Google Slides
Business
Professional Golf Presentation Deck Template for PowerPoint & Google Slides
Graphics
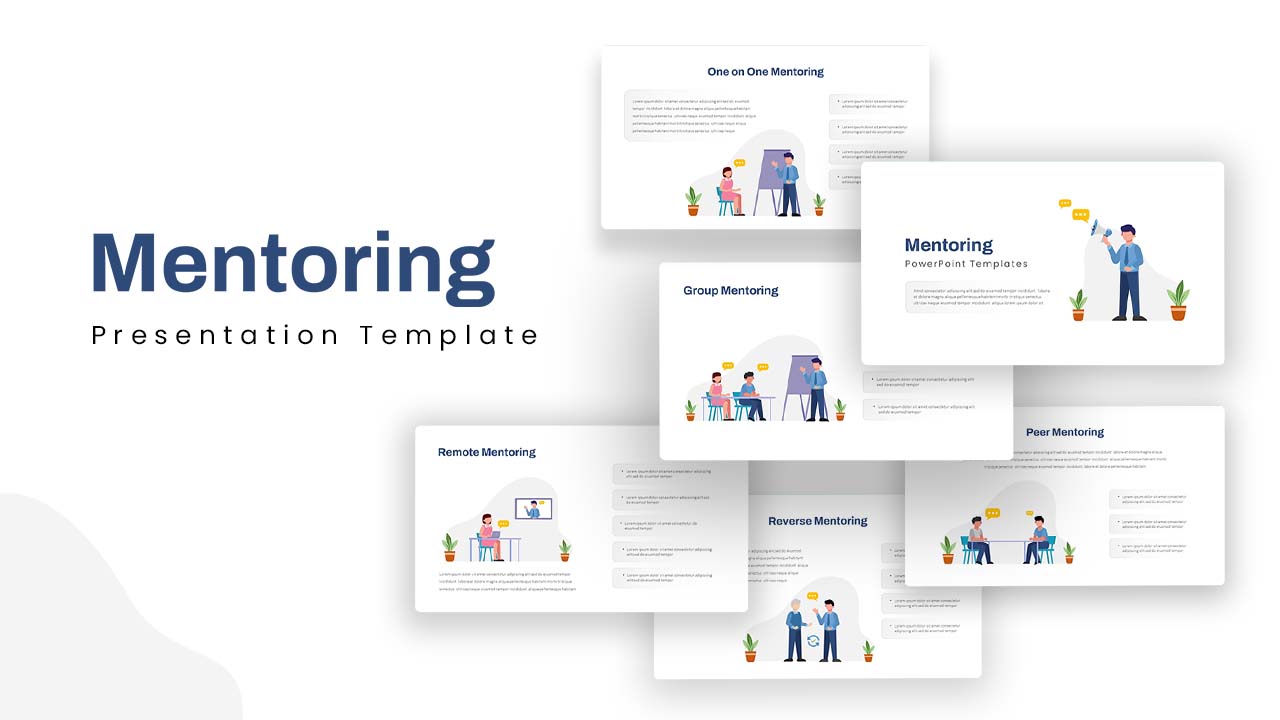
Professional Mentoring Presentation Template for PowerPoint & Google Slides
Leadership
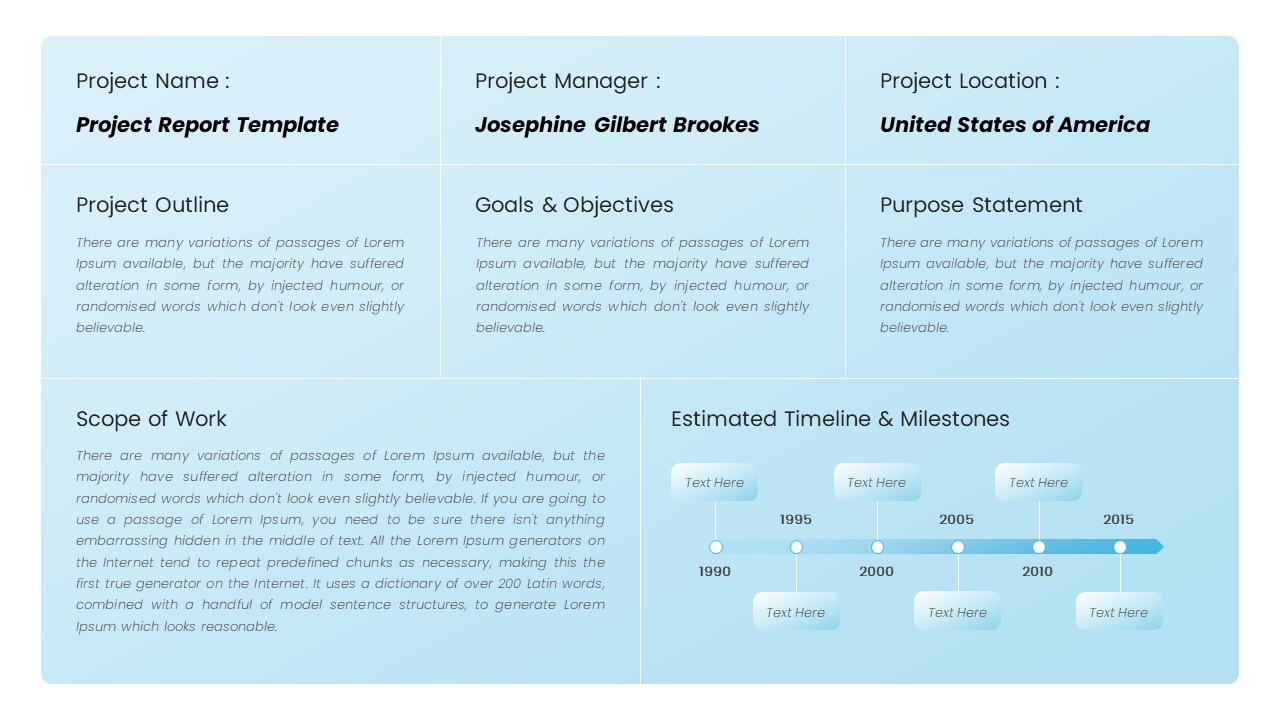
Professional Statement of Work Template for PowerPoint & Google Slides
Project
Professional Project Kickoff Deck Template for PowerPoint & Google Slides
Project
Professional Clustered Column Chart Template for PowerPoint & Google Slides
Bar/Column
Professional 100% Stacked Column Chart Template for PowerPoint & Google Slides
Bar/Column
Professional Quad Chart Layout Template for PowerPoint & Google Slides
Pie/Donut

Professional Dental Clinic Profile Template for PowerPoint & Google Slides
Company Profile
Professional Milestone Timeline Chart Template for PowerPoint & Google Slides
Timeline
Professional Law & Justice Presentation Template for PowerPoint & Google Slides
Company Profile
Professional HR Organization Chart Template for PowerPoint & Google Slides
Org Chart
Professional Photo-Focused Resume Template for PowerPoint & Google Slides
Recruitment
Free
Free Professional Event Planner Slide Deck Template for PowerPoint & Google Slides
Business
Free
McKinsey-Style Professional Business Deck Template for PowerPoint & Google Slides
Business Report
Modern Professional Medical Service Template for PowerPoint & Google Slides
Health
Free Professional Carnival Pitch Deck Template for PowerPoint & Google Slides
Pitch Deck
Free
Free Forest-Themed Professional Presentation Template for PowerPoint & Google Slides
Company Profile
Free
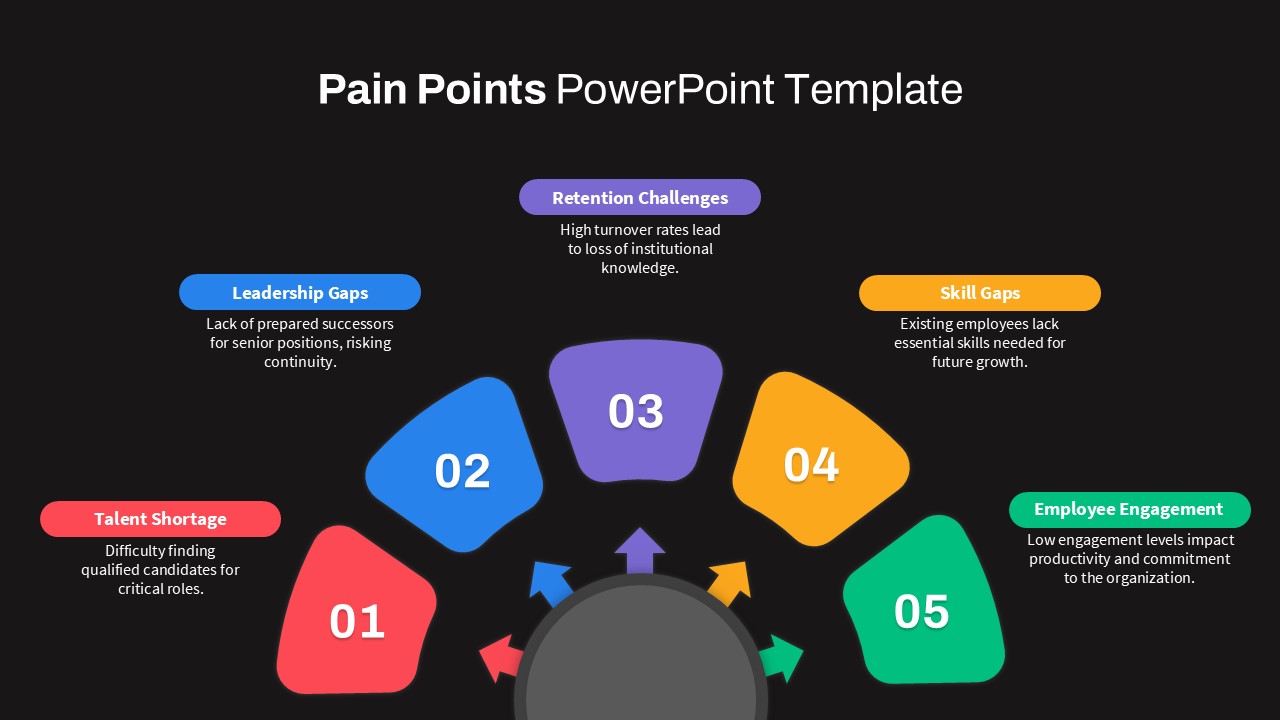
Professional Circular Pain Points Template for PowerPoint & Google Slides
Circular
Professional Green Geometric Background Template for PowerPoint & Google Slides
Background
Ansoff Growth Matrix Professional Template for PowerPoint & Google Slides
Comparison
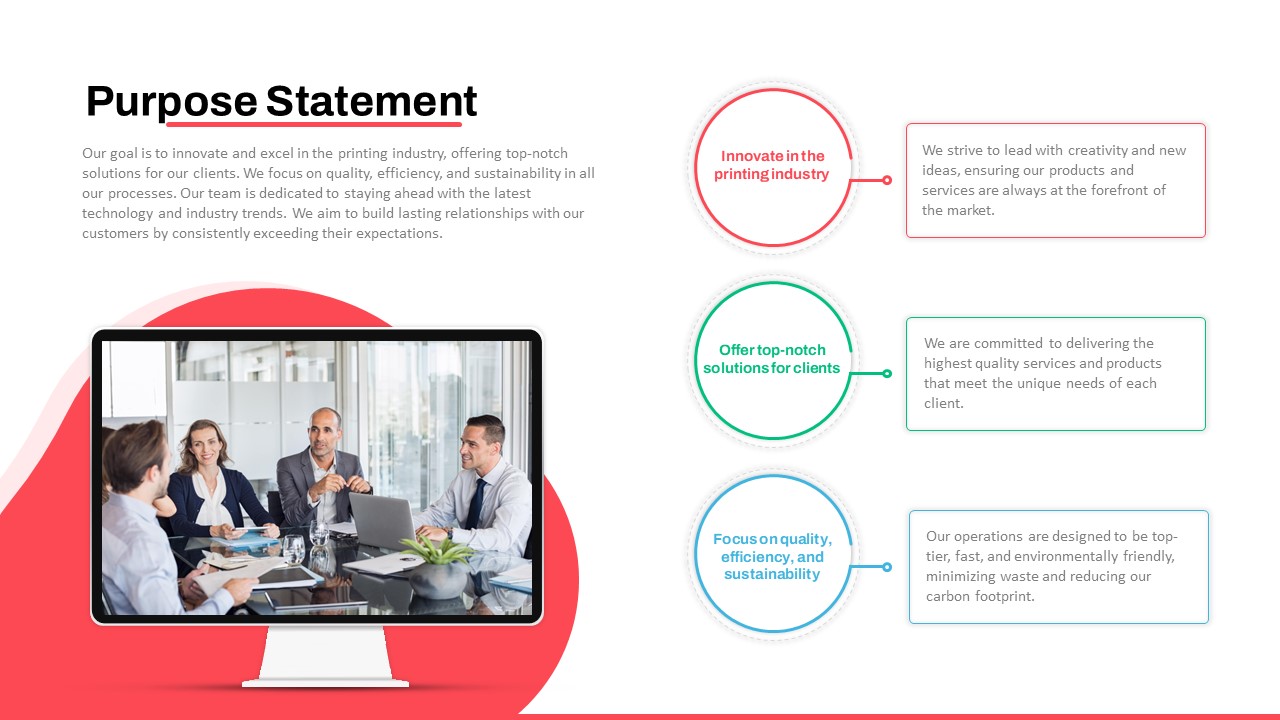
Professional Purpose Statement Slide Template for PowerPoint & Google Slides
Business Proposal
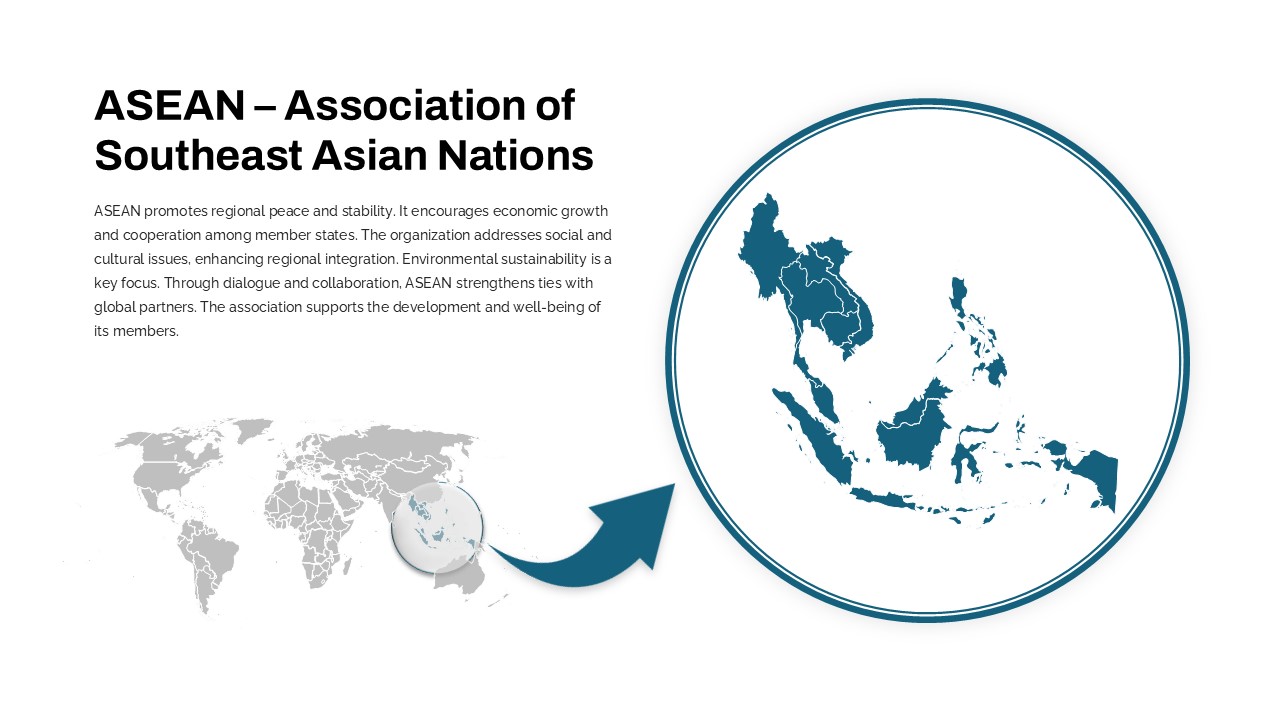
Professional ASEAN Region Zoom Map Slide Template for PowerPoint & Google Slides
World Maps
Professional Town Hall Cover Slide Template for PowerPoint & Google Slides
Graphics
Professional Executive Board Meeting Template for PowerPoint & Google Slides
Business Report

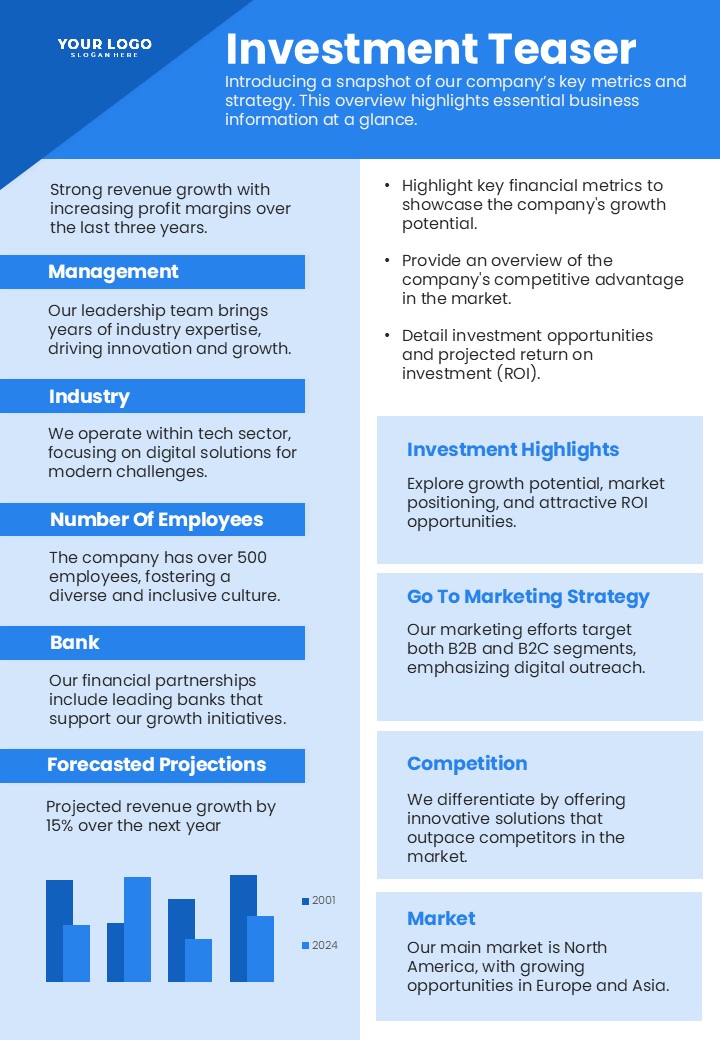
Professional Investment Teaser Slide Template for PowerPoint & Google Slides
Pitch Deck
Professional Table of Organization Chart Template for PowerPoint & Google Slides
Org Chart
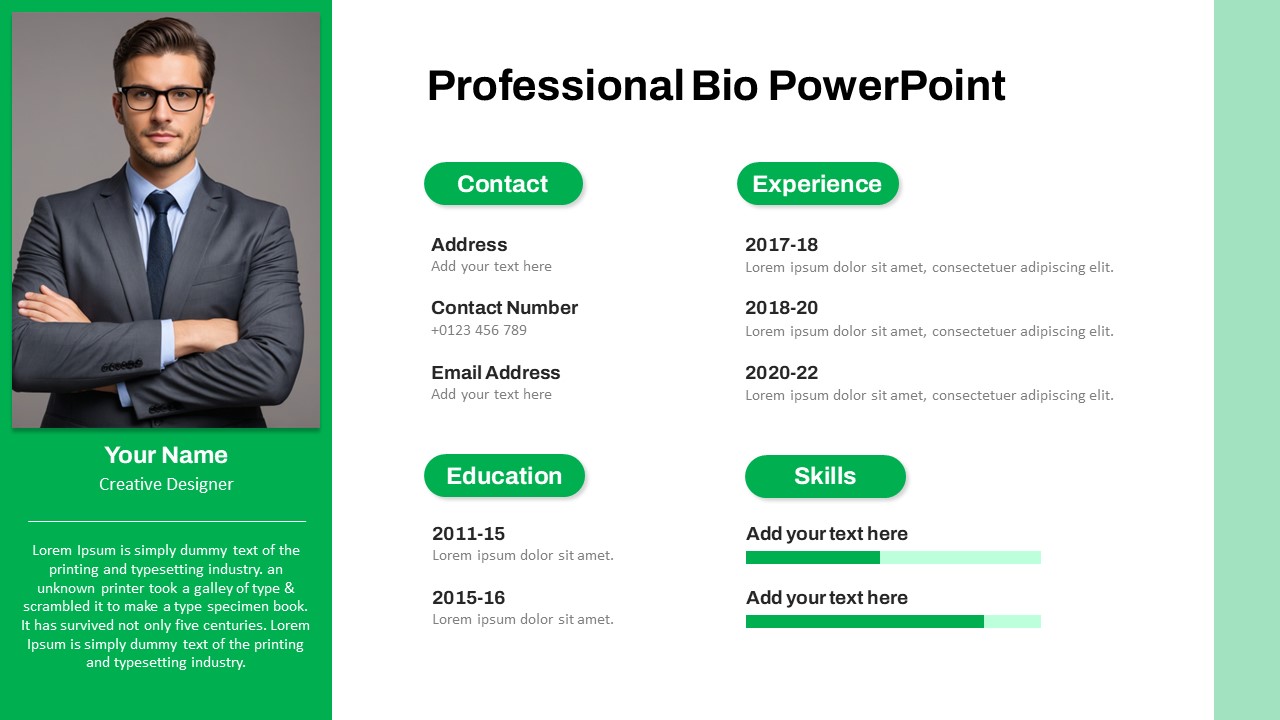
Modern Professional Bio Resume Slide Template for PowerPoint & Google Slides
Recruitment
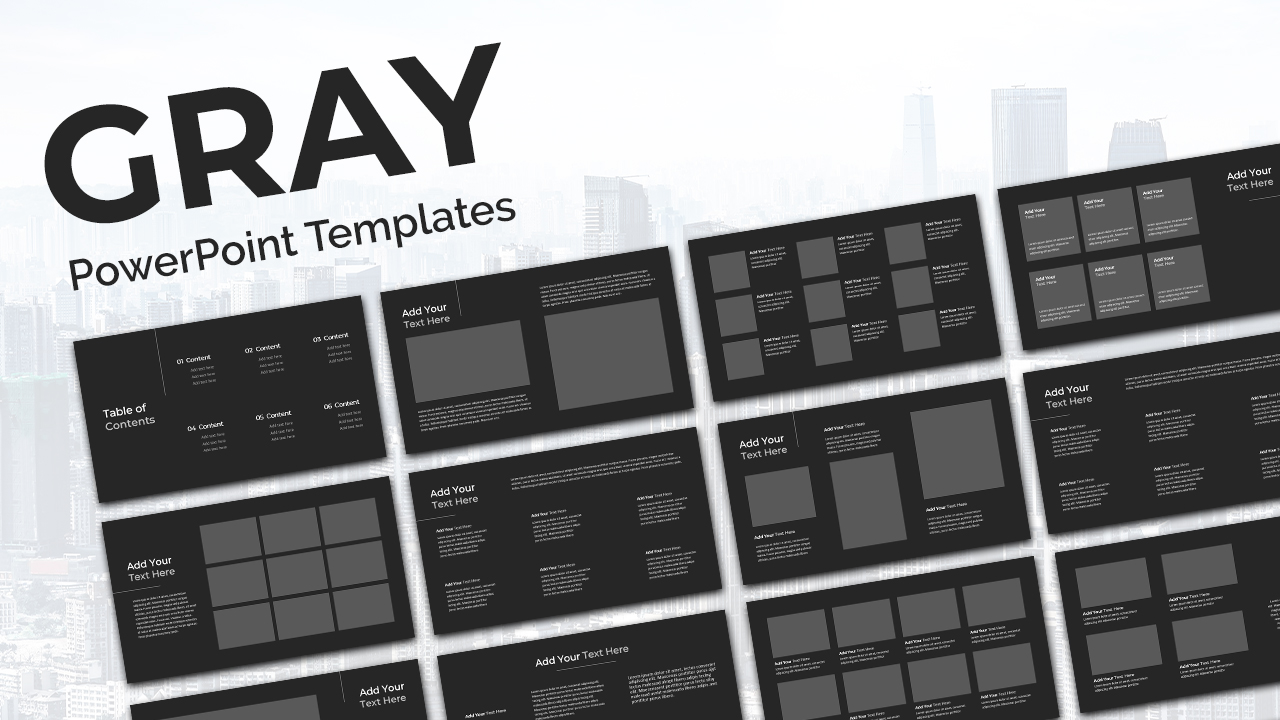
Gray Professional Deck template for PowerPoint & Google Slides
Pitch Deck
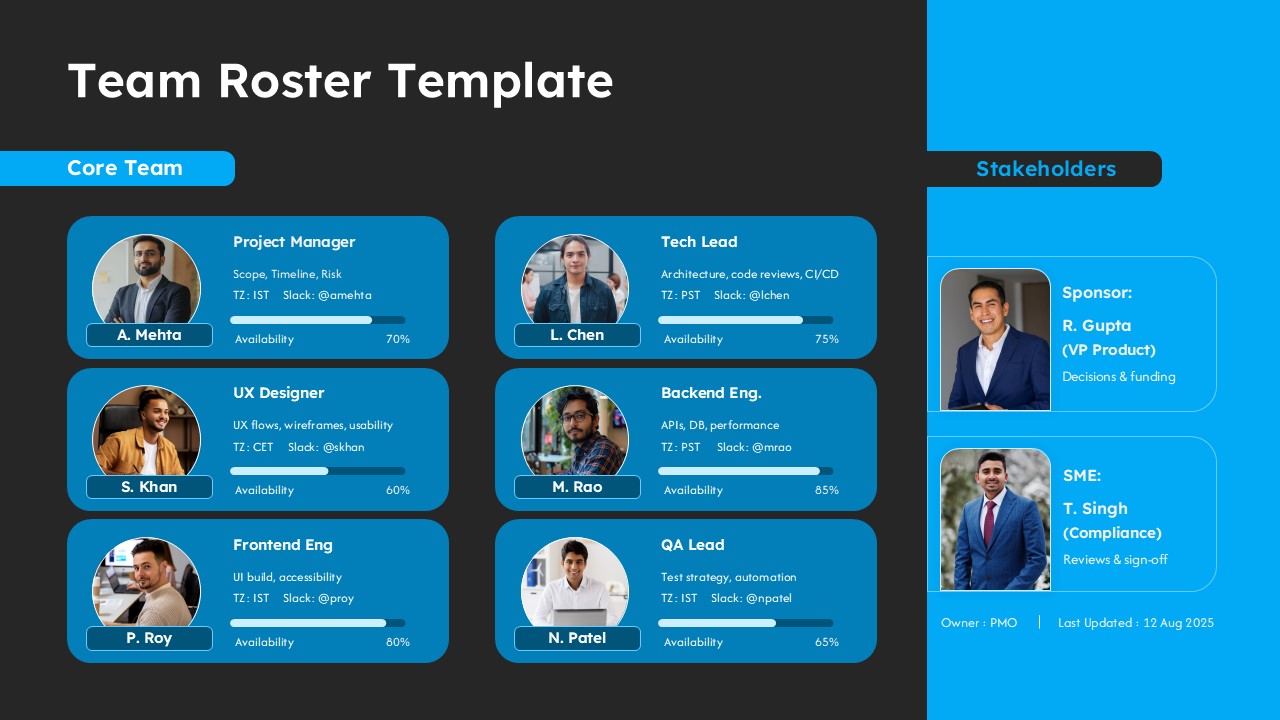
Professional Team Roster Template for PowerPoint & Google Slides
Our Team
Professional Business Slide for PowerPoint & Google Slides
Company Profile
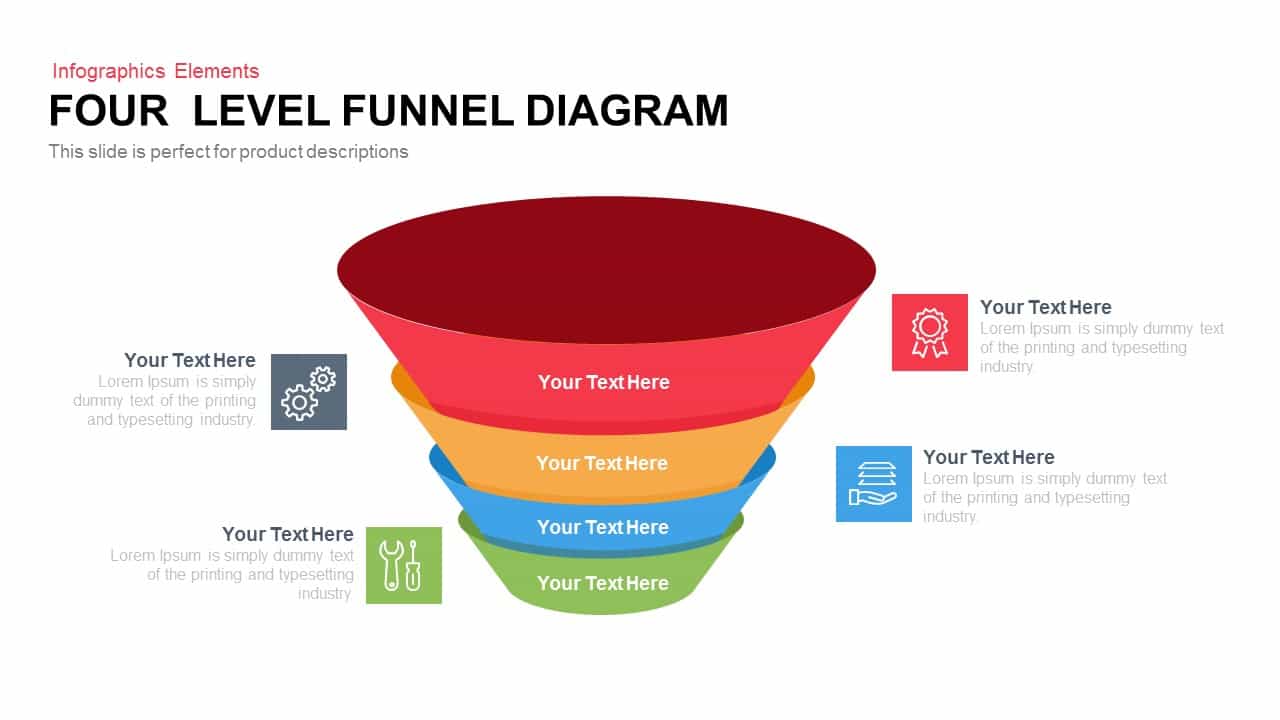
4 Level Funnel Diagram Template for PowerPoint & Google Slides
Funnel
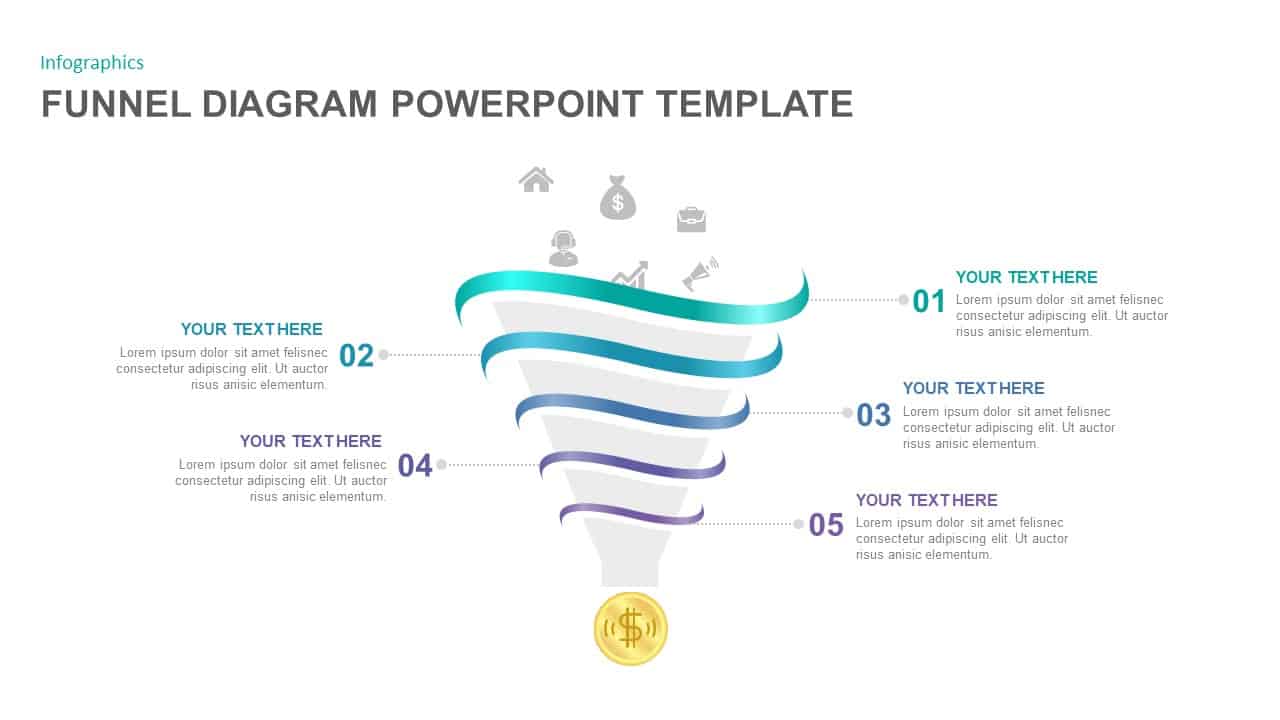
5-Step Colorful Funnel Diagram Template for PowerPoint & Google Slides
Funnel
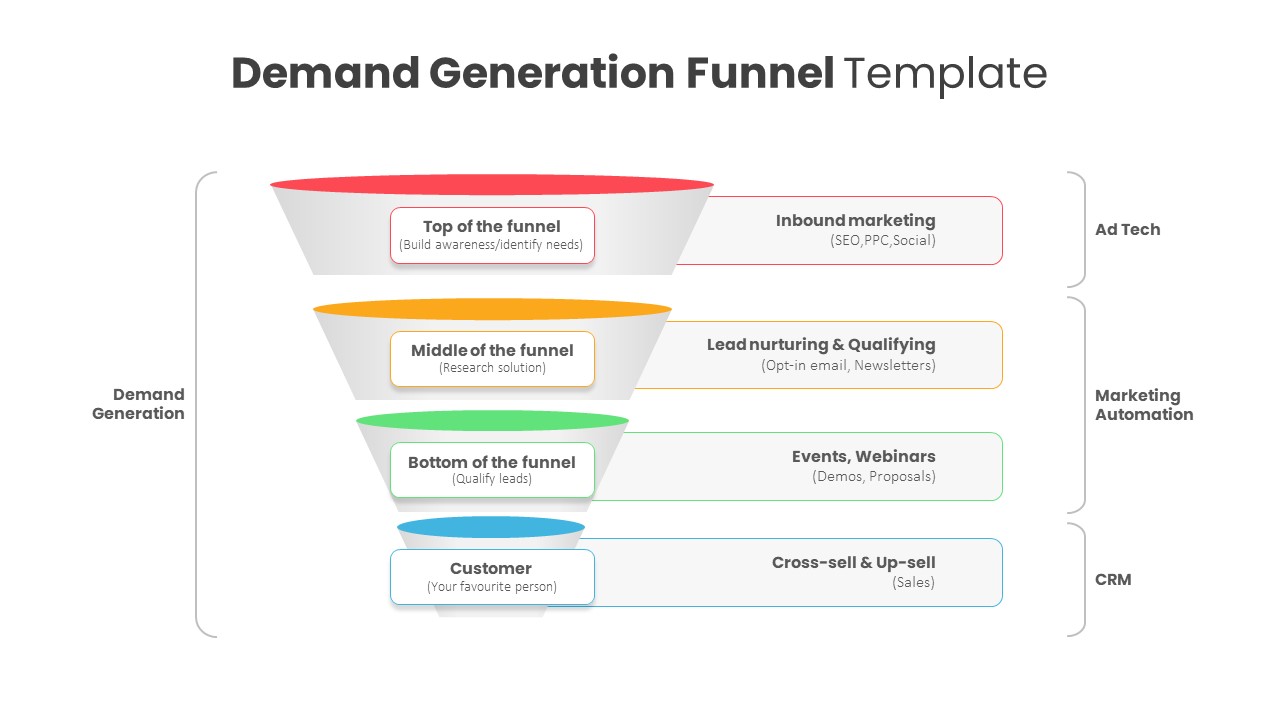
Demand Generation Funnel Diagram Template for PowerPoint & Google Slides
Funnel
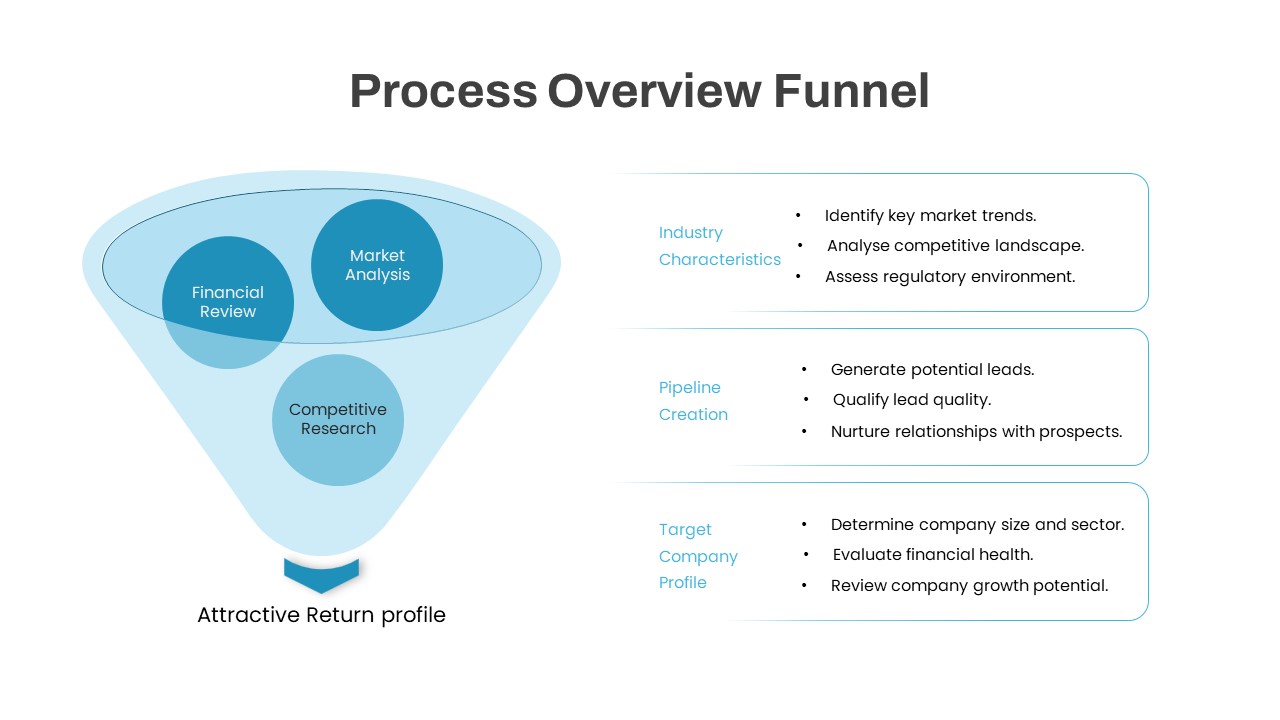
Process Overview Funnel Diagram Template for PowerPoint & Google Slides
Funnel
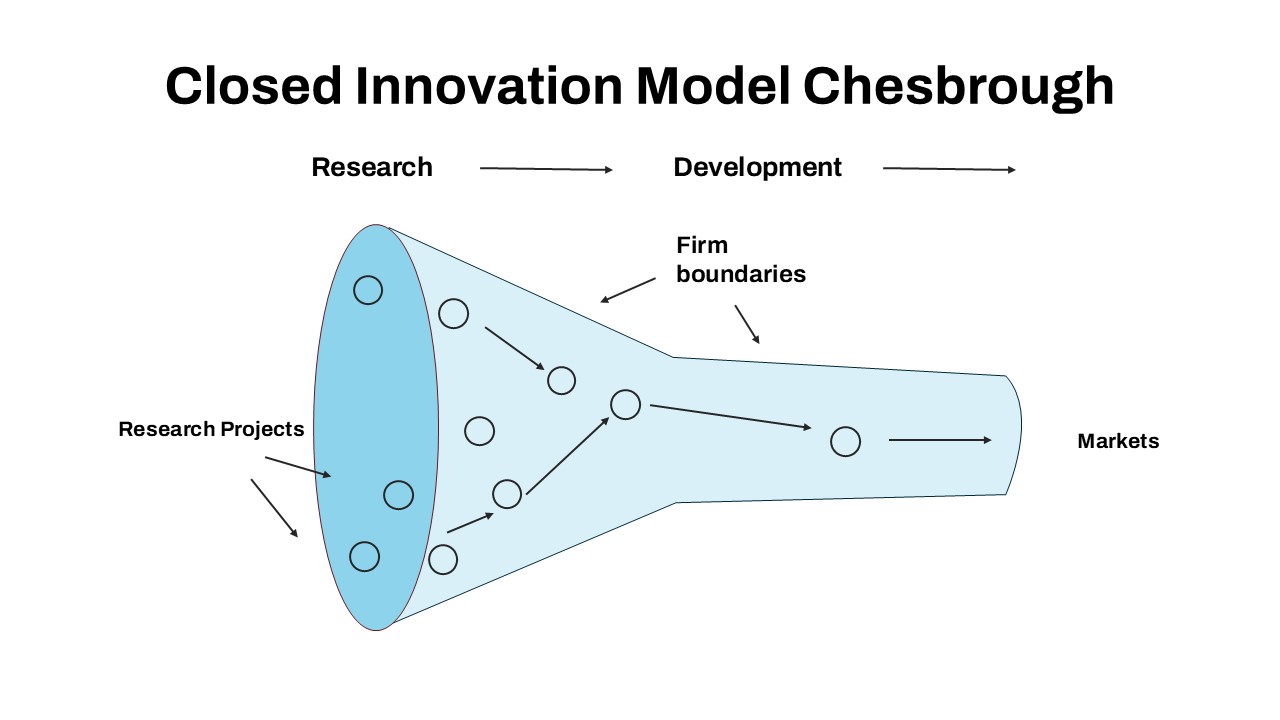
Closed Innovation Model Funnel Diagram Template for PowerPoint & Google Slides
Funnel
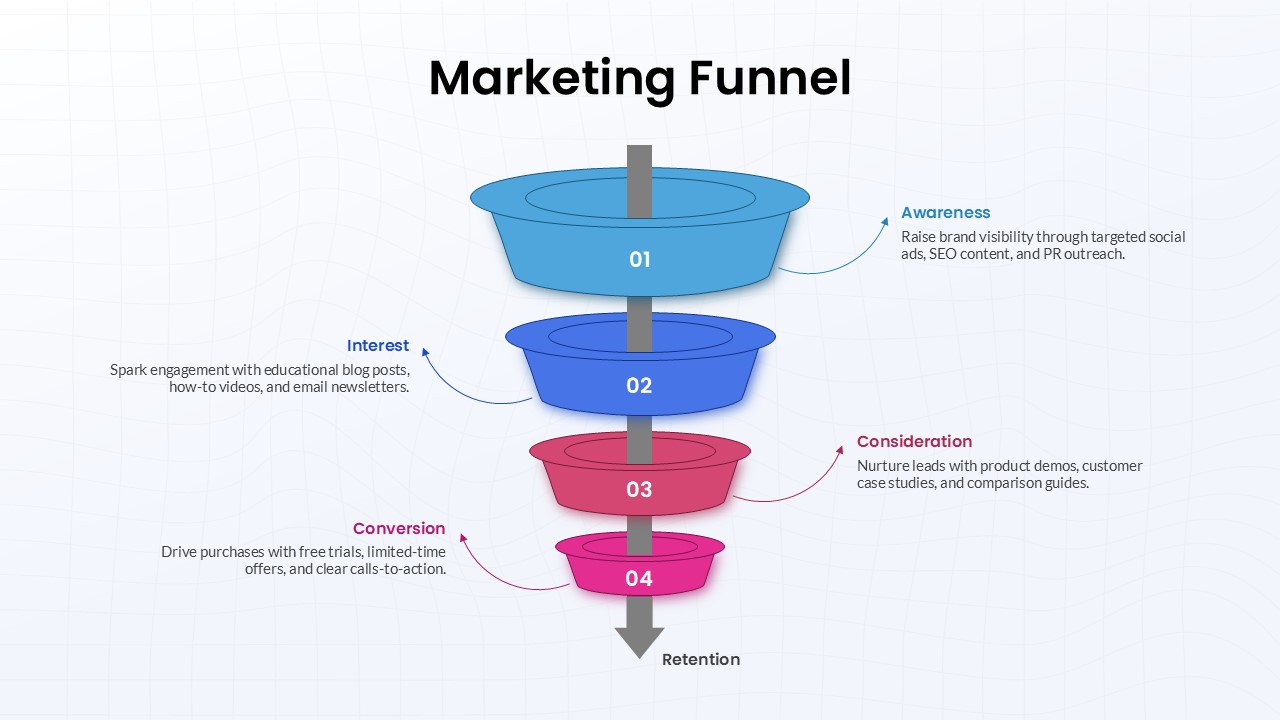
Four-Stage Marketing Funnel Diagram Template for PowerPoint & Google Slides
Marketing Funnel