Quarterly Financial Report Dashboard Template for PowerPoint & Google Slides
Description
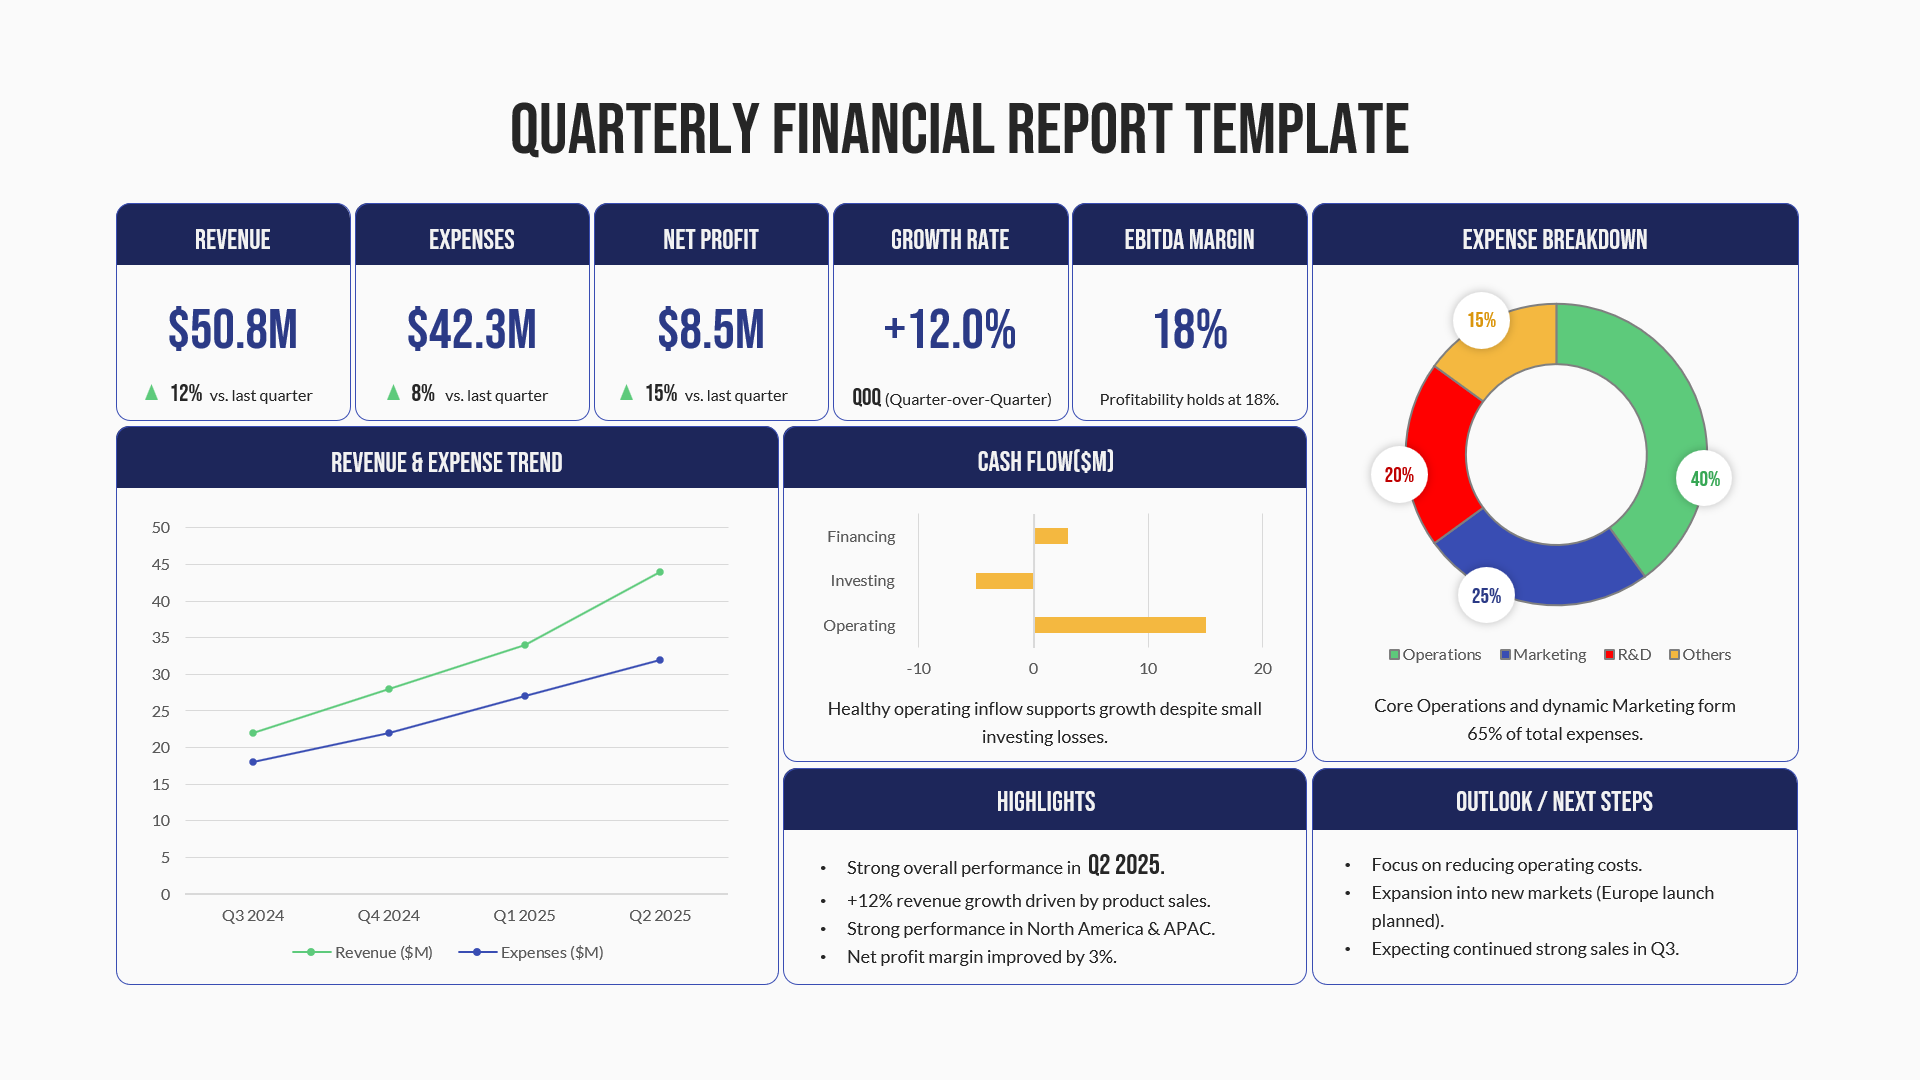
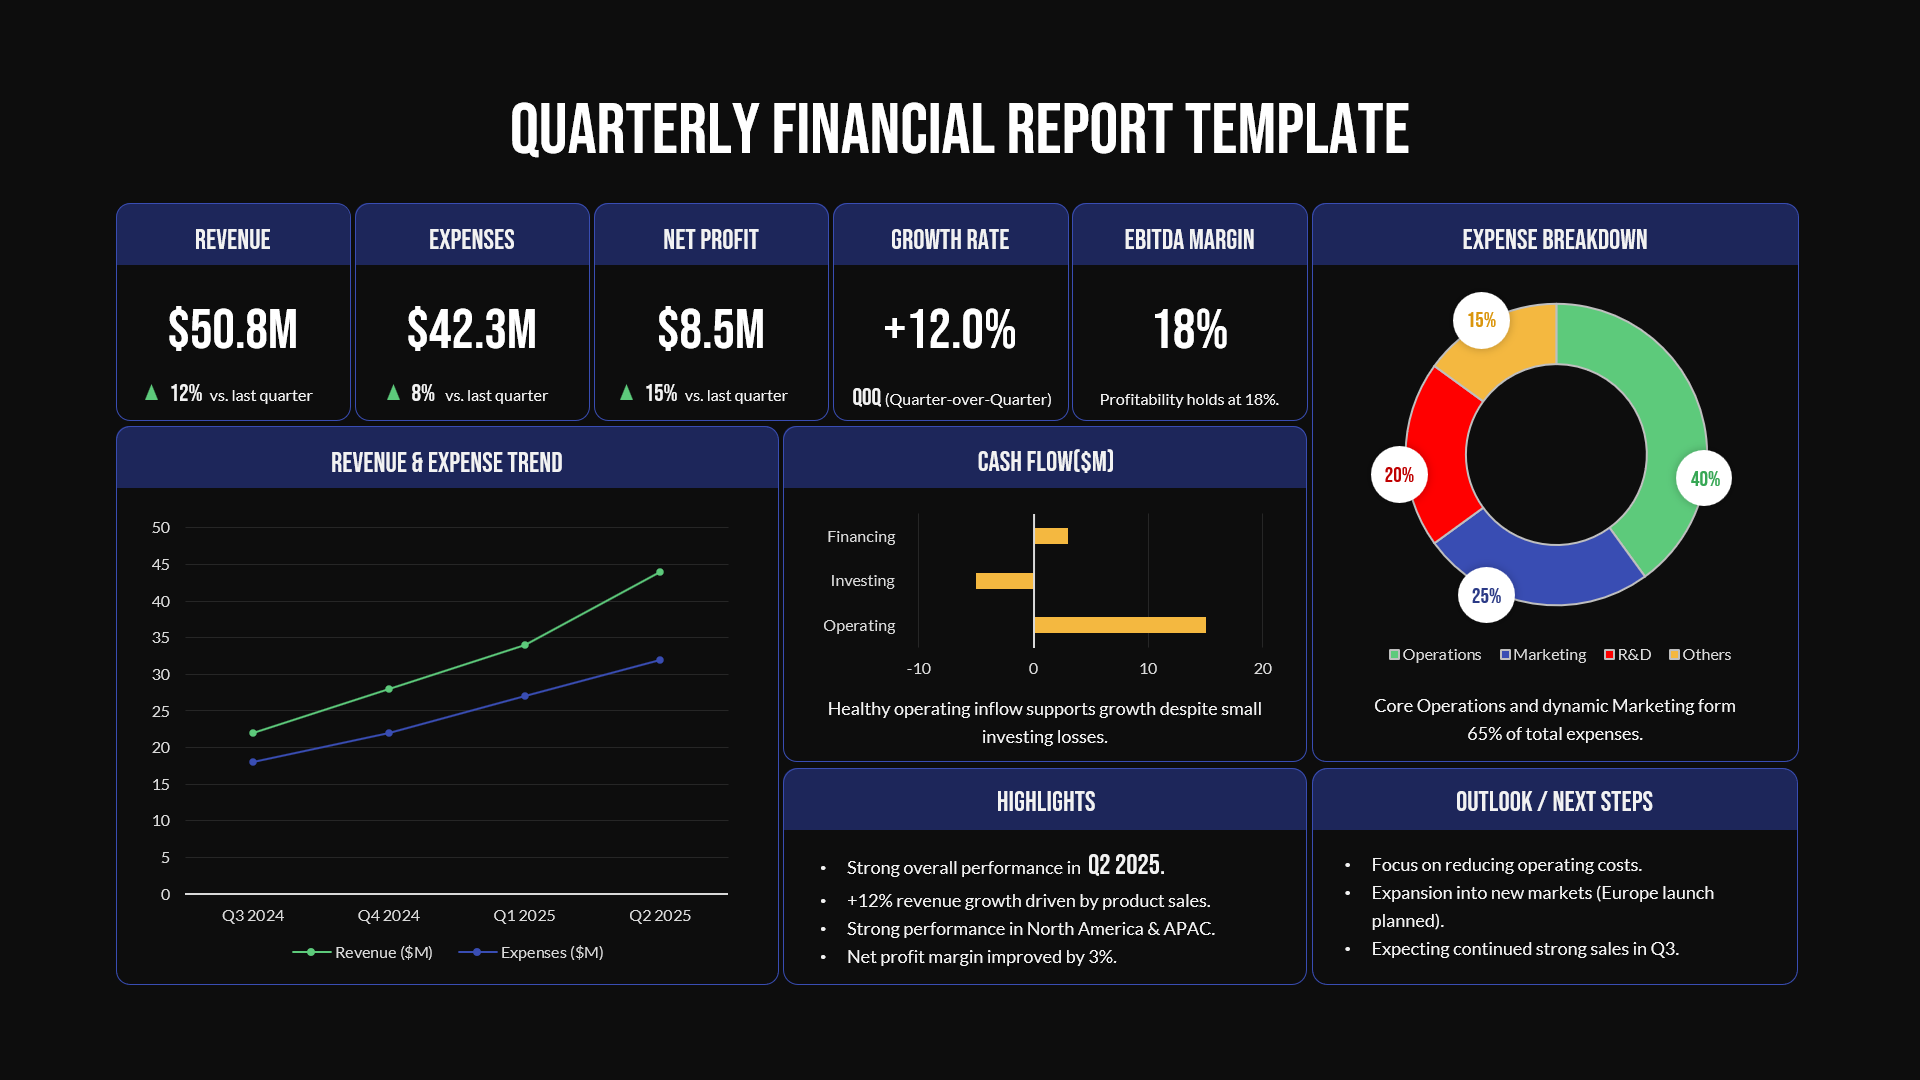
Present your company’s quarterly performance with clarity using this comprehensive Quarterly Financial Report dashboard slide. The layout highlights essential KPIs, including Revenue, Expenses, Net Profit, Growth Rate, and EBITDA Margin, displayed in structured metric cards for quick executive review. A detailed revenue and expense trend chart visualizes quarterly progression, while a cash flow bar chart outlines operating, investing, and financing activities to provide a complete financial snapshot.
An expense breakdown donut chart categorizes spending across Operations, Marketing, R&D, and Others, making cost distribution easy to interpret at a glance. Complementary sections for Highlights and Outlook / Next Steps allow you to summarize key achievements and outline forward-looking strategies. The balanced grid layout, professional typography, and clean color contrast ensure data remains the focal point while maintaining a polished corporate aesthetic. Fully editable charts, text placeholders, and data fields enable you to update figures, adjust labels, and tailor insights to your organization’s reporting standards. Optimized for both PowerPoint and Google Slides, this slide guarantees consistent formatting and presentation-ready visuals across platforms.
Who is it for
This dashboard is ideal for CFOs, finance managers, business analysts, and executive teams delivering quarterly reviews to stakeholders or board members. Startup founders, investors, and consultants can also use it to communicate financial performance clearly and confidently.
Other Uses
Beyond quarterly reporting, repurpose this slide for annual summaries, investor updates, budget reviews, financial forecasting sessions, or performance evaluation meetings. The modular layout supports KPI tracking, departmental cost analysis, and strategic planning discussions across industries.
Login to download this file

Item ID
SB05714Designed By
Niranjana
Related Templates

Quarterly Financial Summary Dashboard Template for PowerPoint & Google Slides
Business Report
Free Quarterly Business Review Dashboard Template for PowerPoint & Google Slides
Business
Free
Quarterly Business Review Dashboard Template for PowerPoint & Google Slides
Pitch Deck
Free Monthly Report PowerPoint Template for PowerPoint & Google Slides
Business Report
Free
Banking Financial Overview Dashboard Template for PowerPoint & Google Slides
Finance
Financial Report Metaphor Illustration Template for PowerPoint & Google Slides
Finance
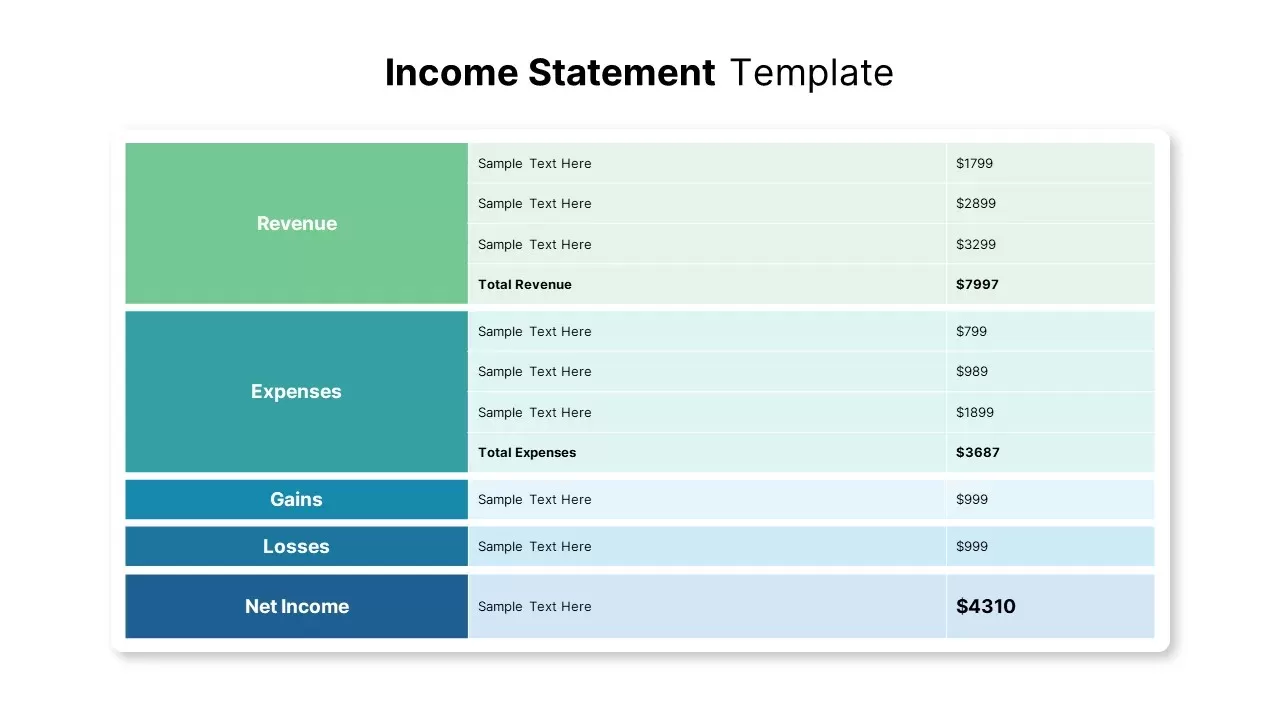
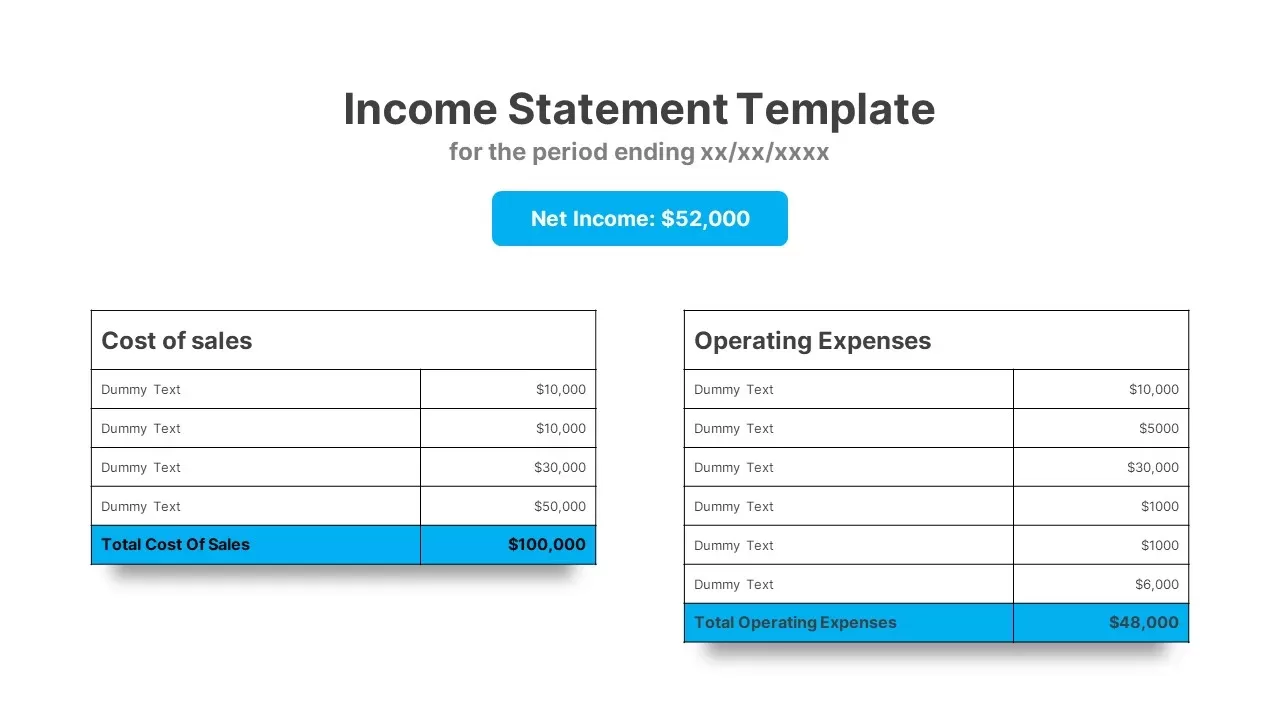
Income Statement Financial Report Template for PowerPoint & Google Slides
Business Report
Modern Project Status Report Dashboard Template for PowerPoint & Google Slides
Project Status
Weekly Status Report Dashboard Template for PowerPoint & Google Slides
HR
One Pager Annual Report Dashboard Template for PowerPoint & Google Slides
Business Report
HR Report Dashboard Template for PowerPoint & Google Slides
Employee Performance
Project Status Dashboard Report Template for PowerPoint & Google Slides
Project Status

Employee Headcount Dashboard Report Template for PowerPoint & Google Slides
Employee Performance
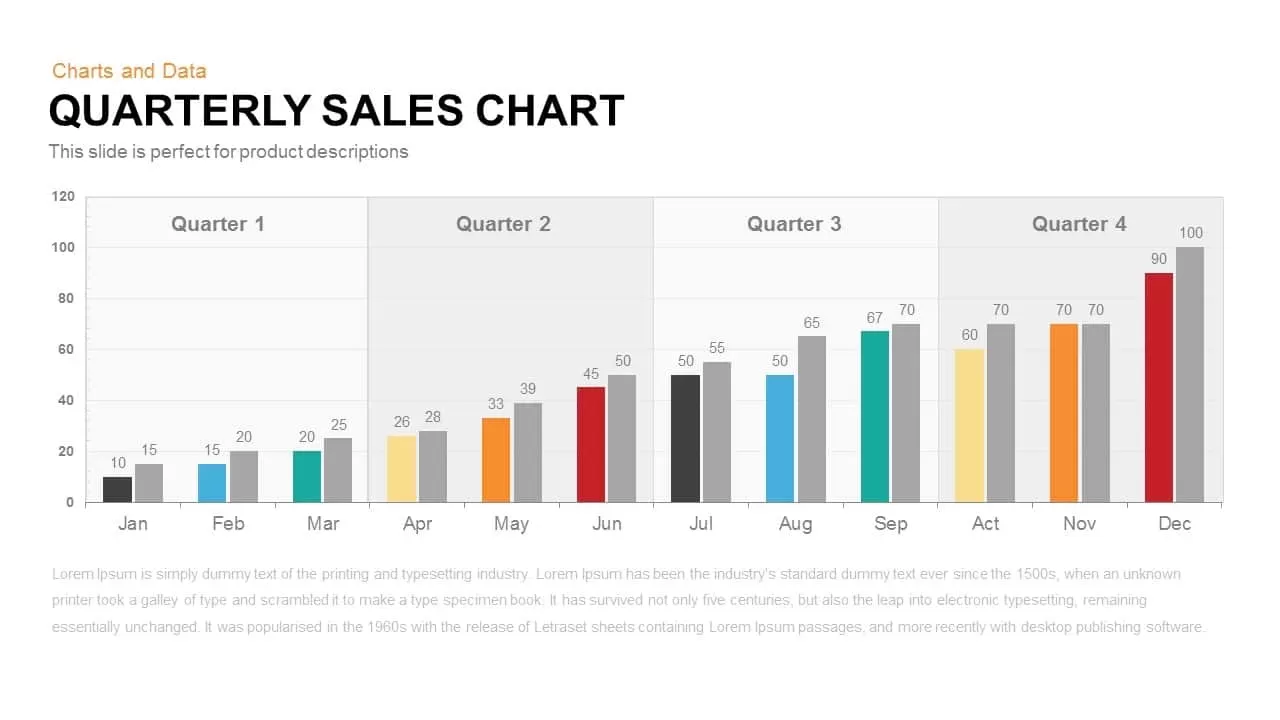
Quarterly Sales template for PowerPoint & Google Slides
Bar/Column
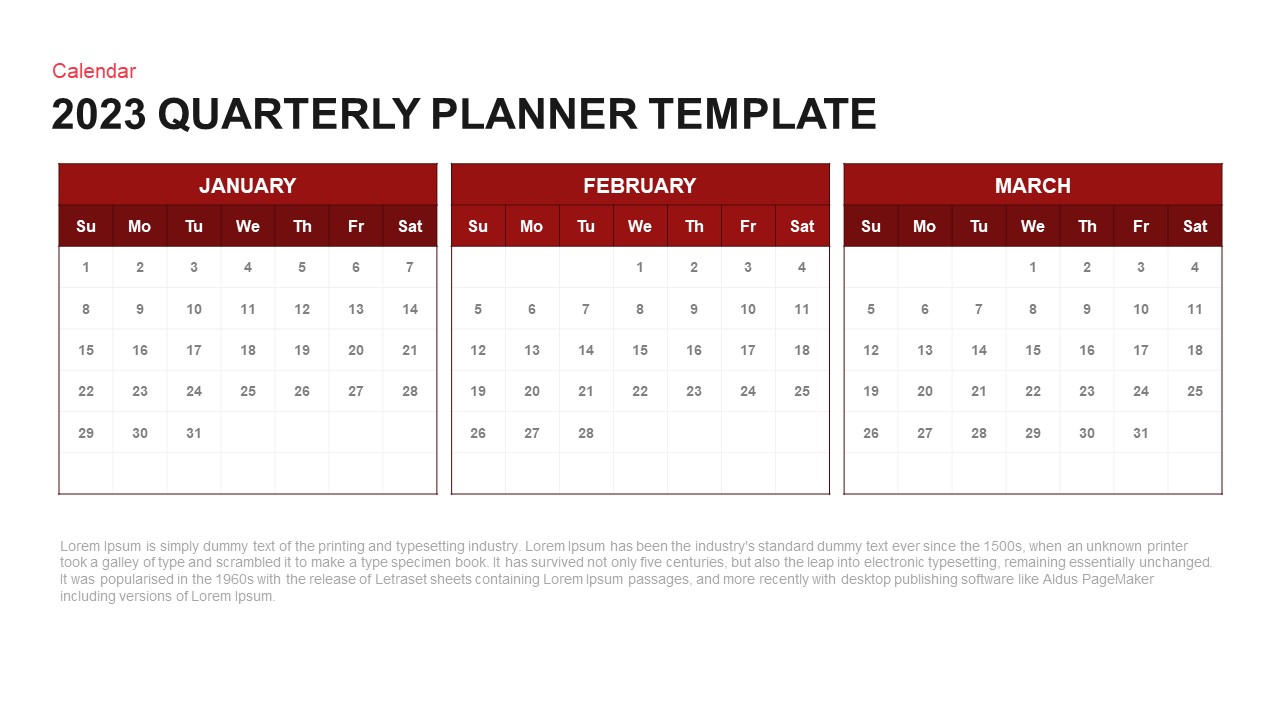
Quarterly Planner Calendar Layout Template for PowerPoint & Google Slides
Project
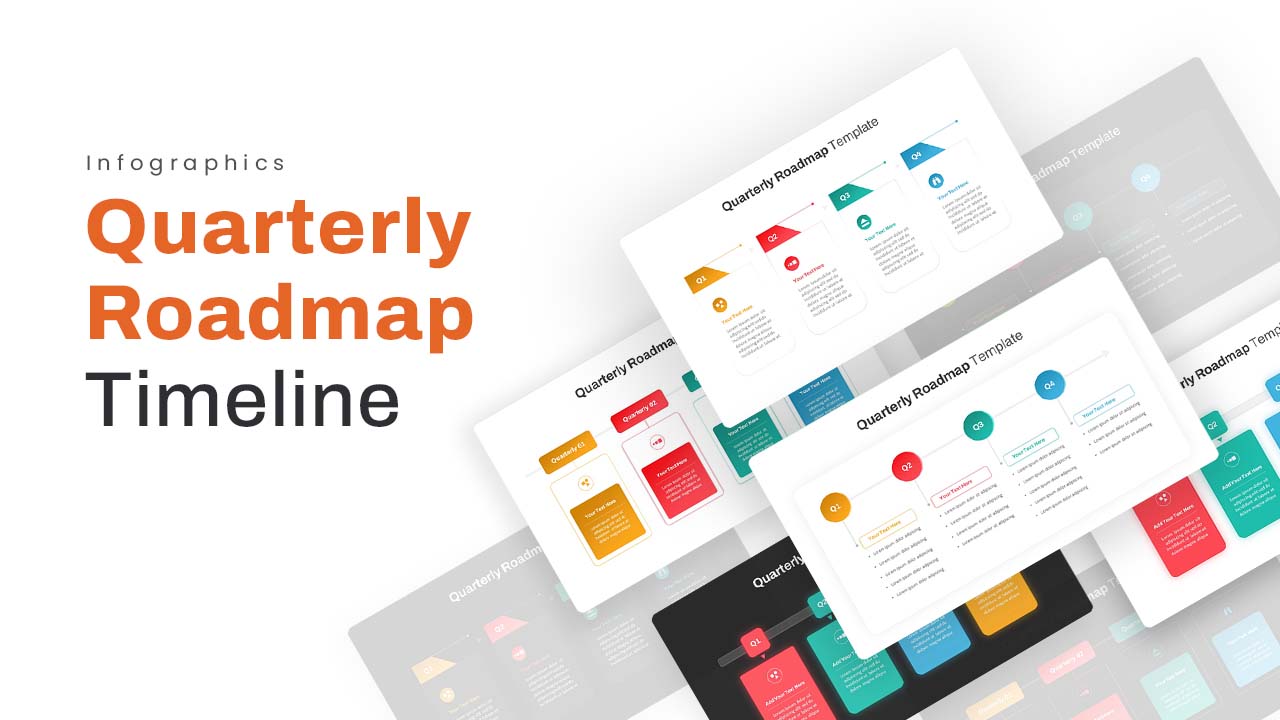
Quarterly Roadmap Timeline Infographic Template for PowerPoint & Google Slides
Timeline
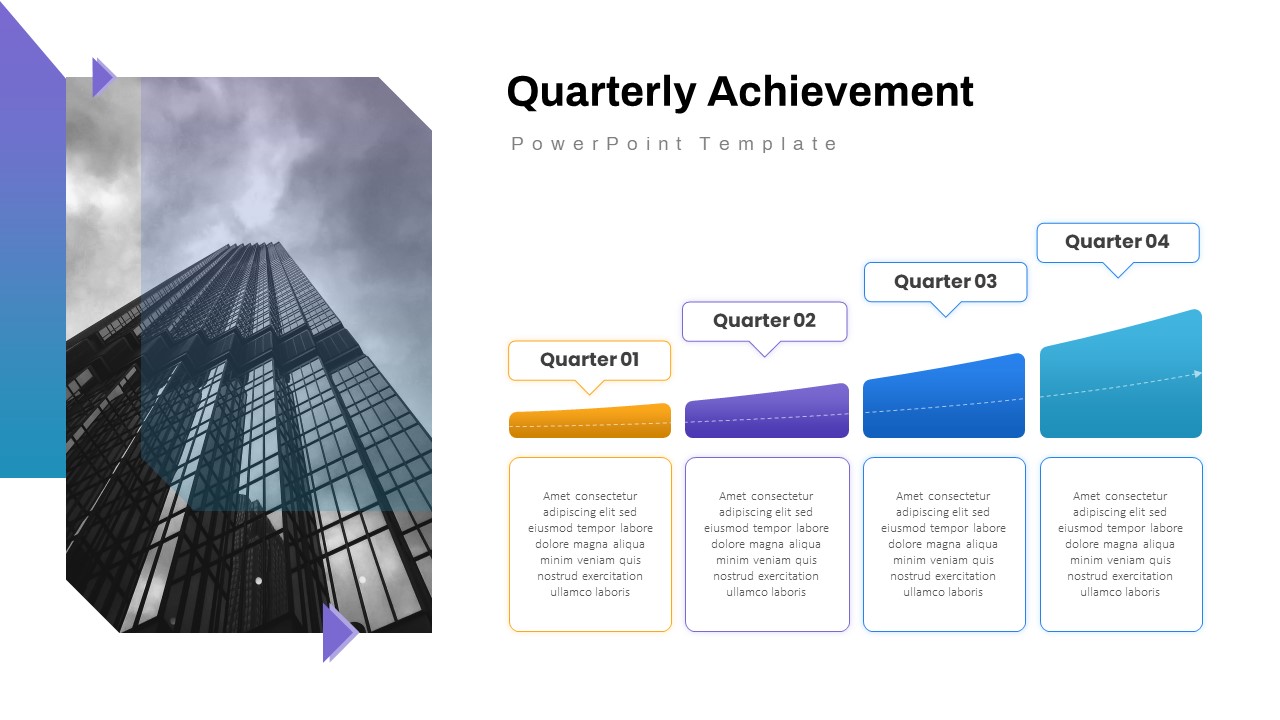
Quarterly Achievement Progress Template for PowerPoint & Google Slides
Accomplishment
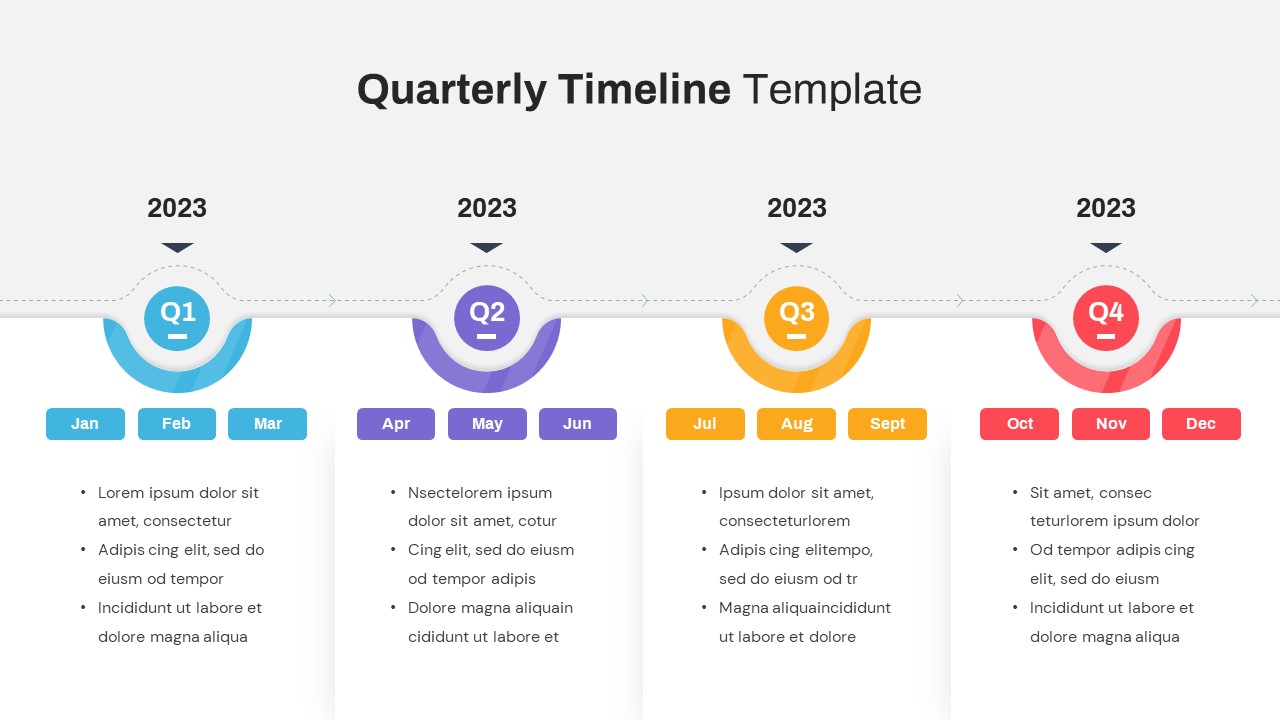
Quarterly Timeline Infographic Template for PowerPoint & Google Slides
Timeline
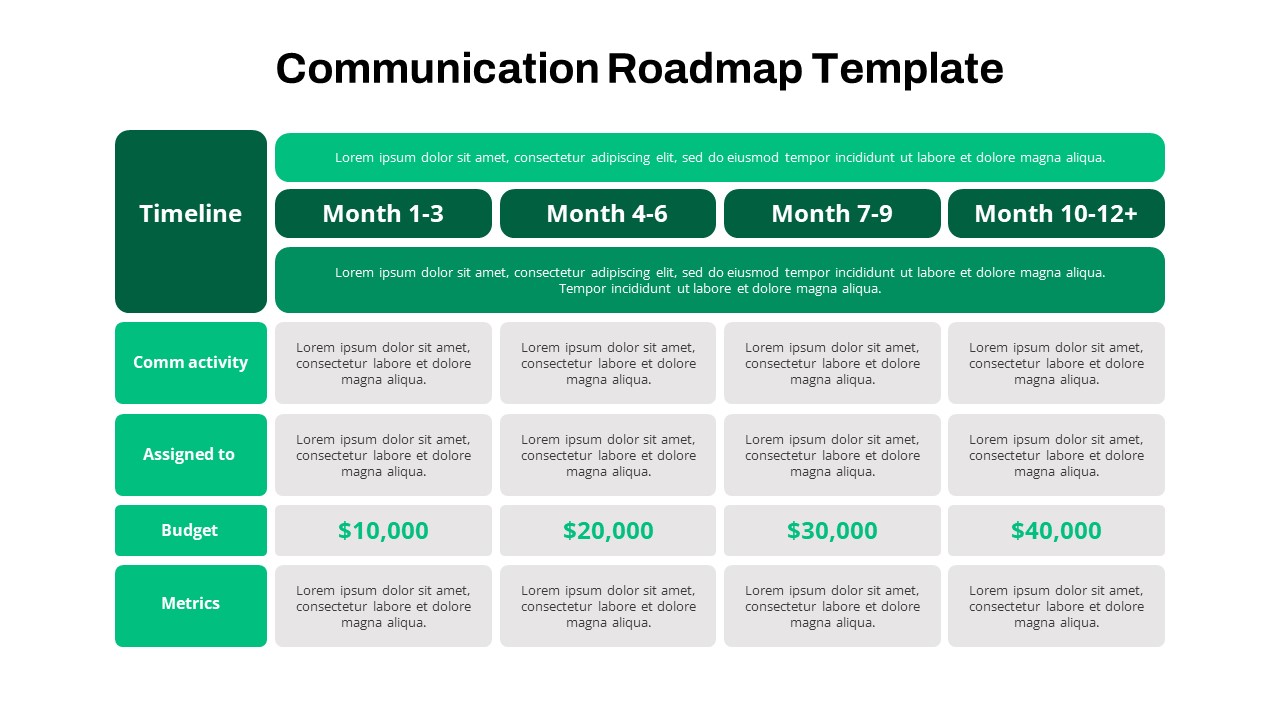
Quarterly Communication Roadmap Grid Template for PowerPoint & Google Slides
Marketing
Quarterly Credit Loss Provisions Chart Template for PowerPoint & Google Slides
Bar/Column
Quarterly Gross Profit Rate Chart Template for PowerPoint & Google Slides
Revenue
Quarterly Network Volume Analysis Template for PowerPoint & Google Slides
Business Report
Quarterly Revenue Comparison Bar Chart Template for PowerPoint & Google Slides
Bar/Column

Quarterly Net Interest Income Growth Template for PowerPoint & Google Slides
Bar/Column
Quarterly Sales Review Bar Chart Template for PowerPoint & Google Slides
Bar/Column
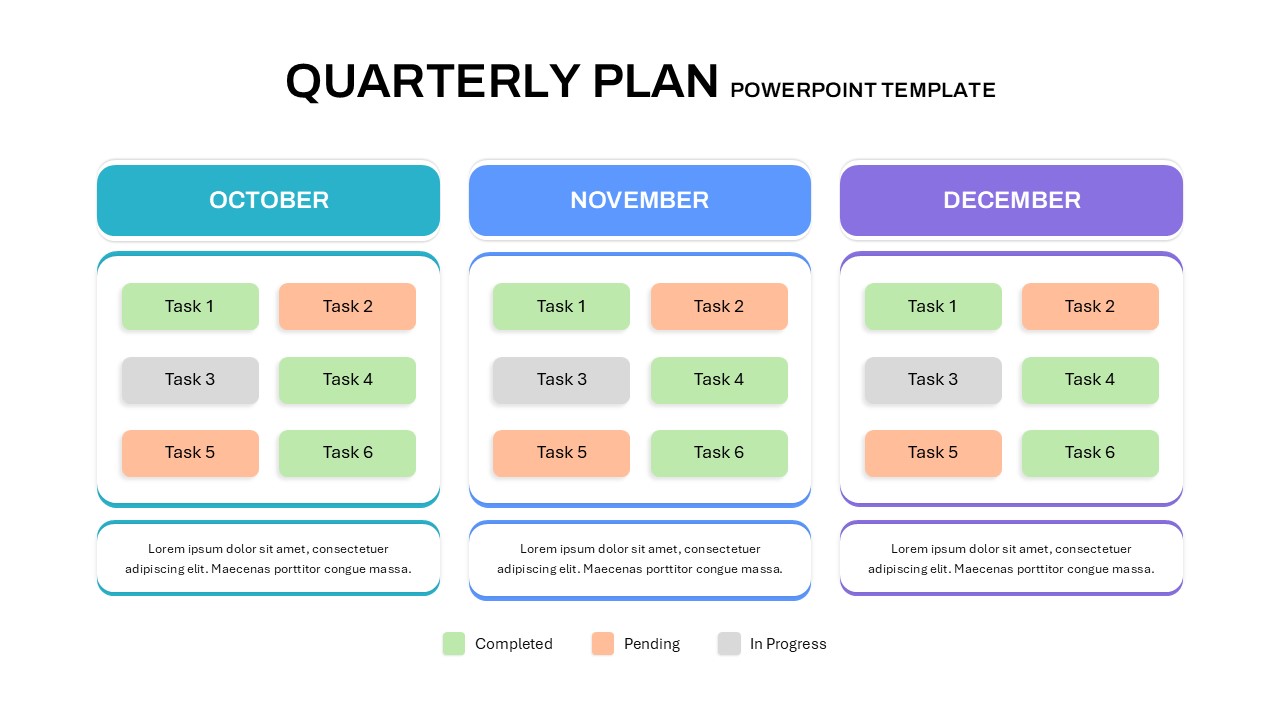
Quarterly Plan Template for PowerPoint & Google Slides
Project Status
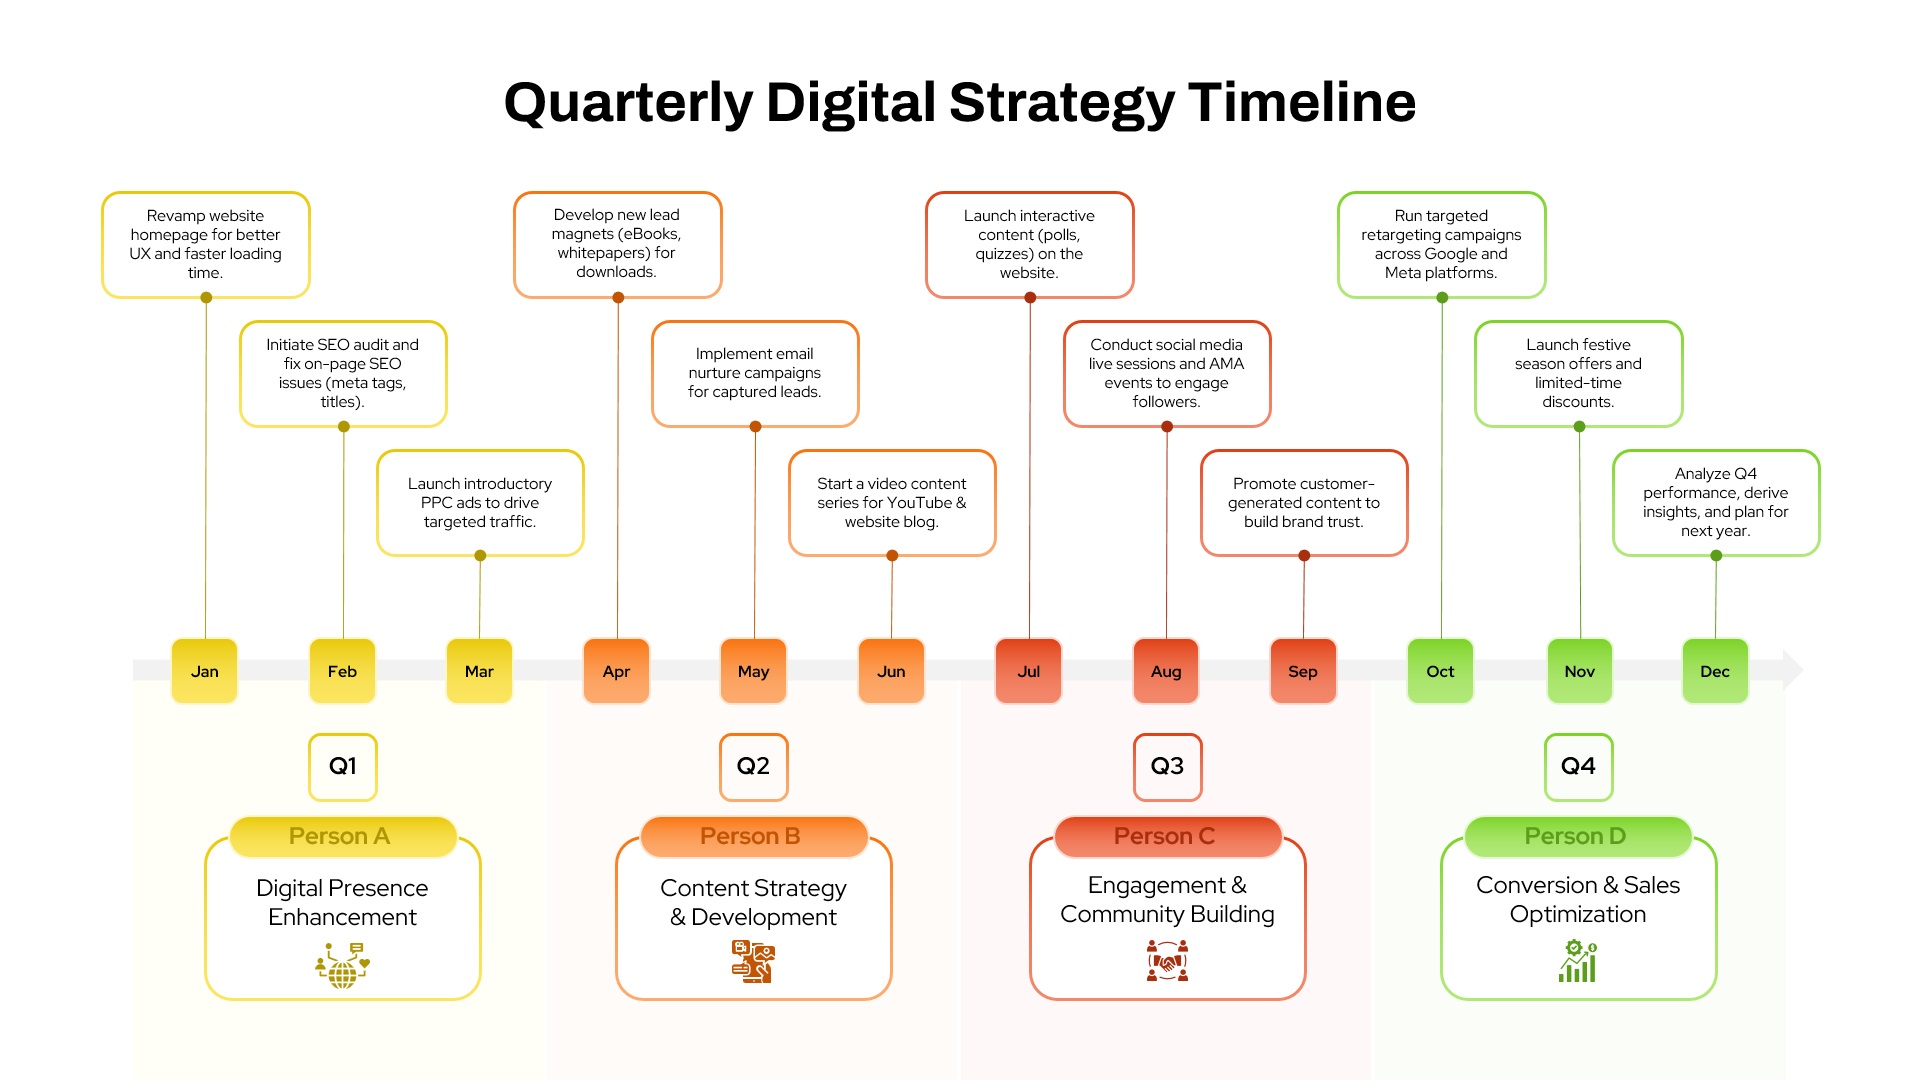
Quarterly Digital Strategy Timeline template for PowerPoint & Google Slides
Digital Marketing
Quarterly Gantt Chart with Today Marker Template for PowerPoint & Google Slides
Gantt Chart
Quarterly Comparison Pie Chart Template for PowerPoint & Google Slides
Pie/Donut
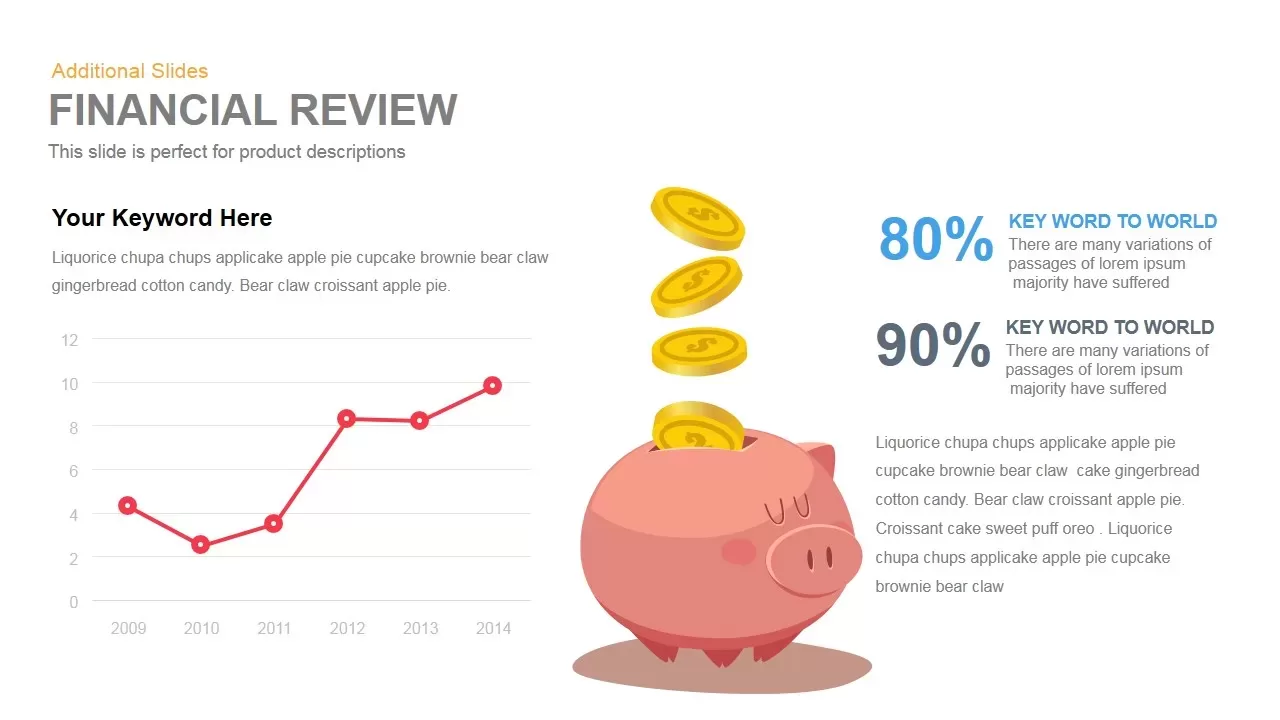
Financial Review template for PowerPoint & Google Slides
Finance

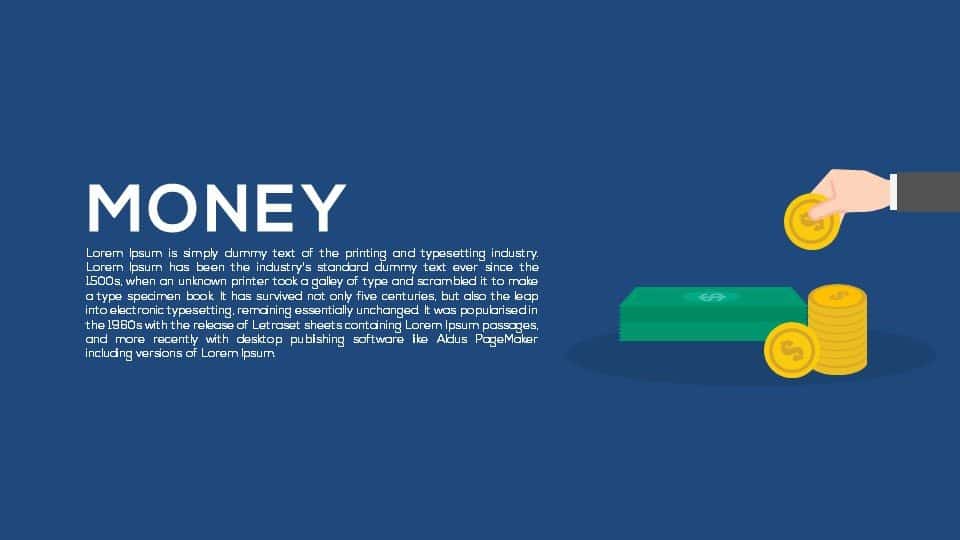
Money Metaphor Financial Overview Template for PowerPoint & Google Slides
Finance
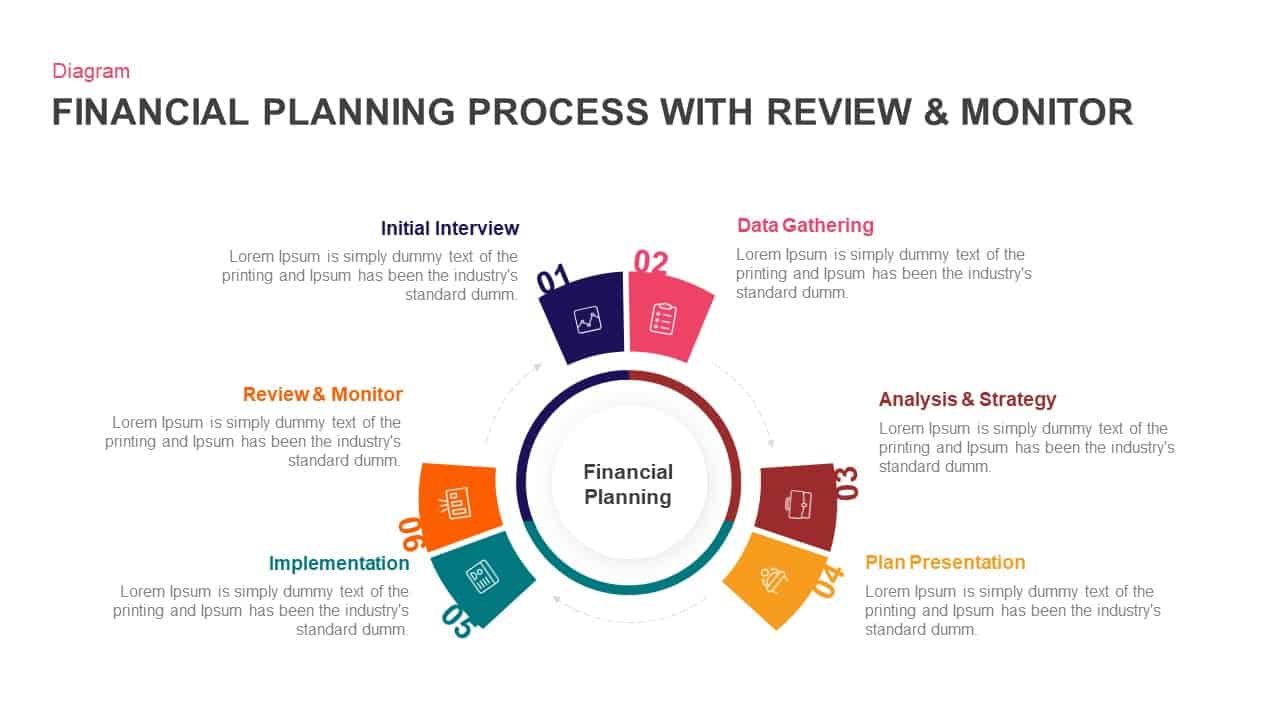
Financial Planning Circular Process Template for PowerPoint & Google Slides
Process
5-Stage Financial Growth Timeline Template for PowerPoint & Google Slides
Timeline
Financial Agreement Signing Flow Diagram Template for PowerPoint & Google Slides
Process
Income Statement Financial Reporting Template for PowerPoint & Google Slides
Finance
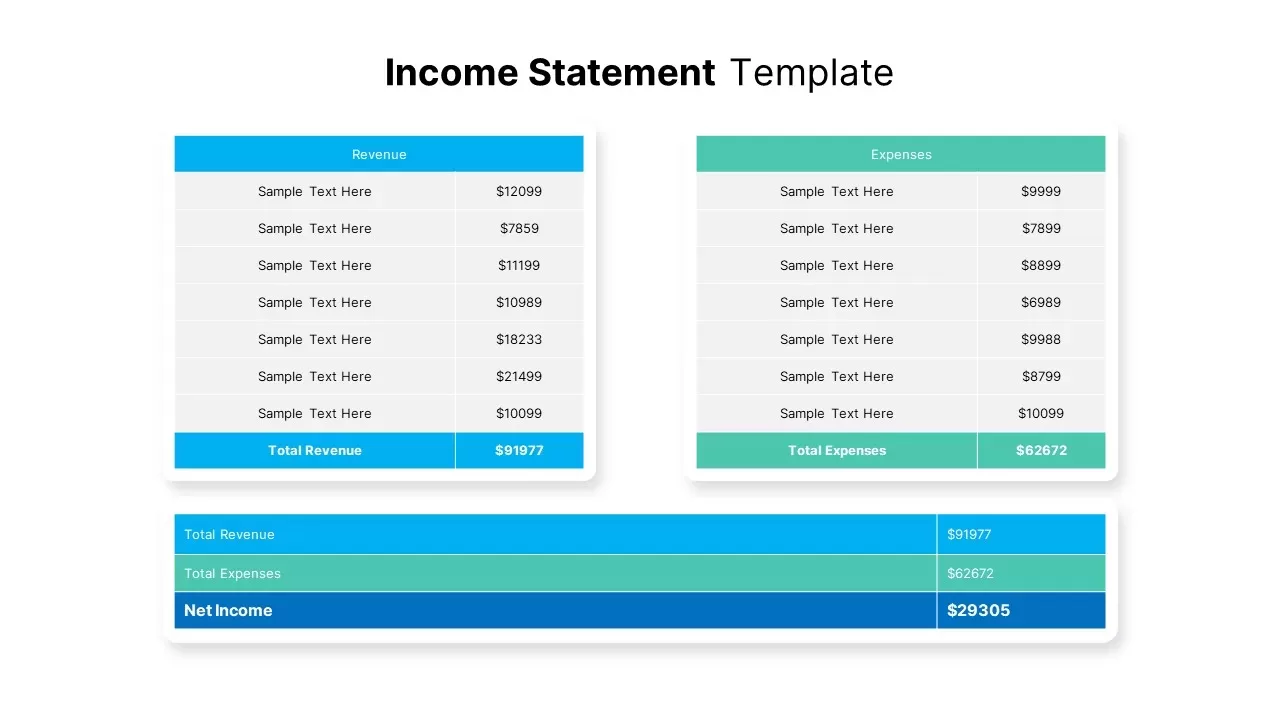
Income Statement Financial Summary Template for PowerPoint & Google Slides
Business Report
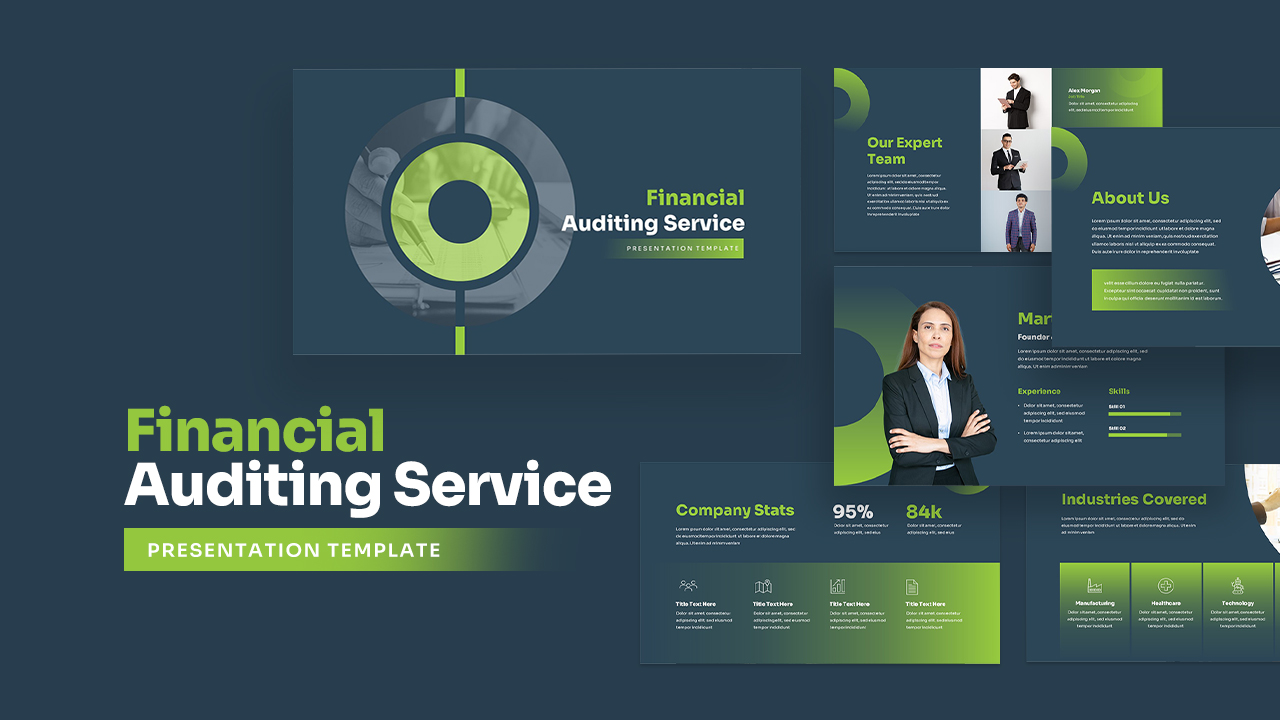
Corporate Financial Auditing Service Template for PowerPoint & Google Slides
Finance

Financial Advisory Service Pitch Deck Template for PowerPoint & Google Slides
Finance
Financial Institutions Presentation Template for PowerPoint & Google Slides
Company Profile
Financial Consulting Company Profile Template for PowerPoint & Google Slides
Finance
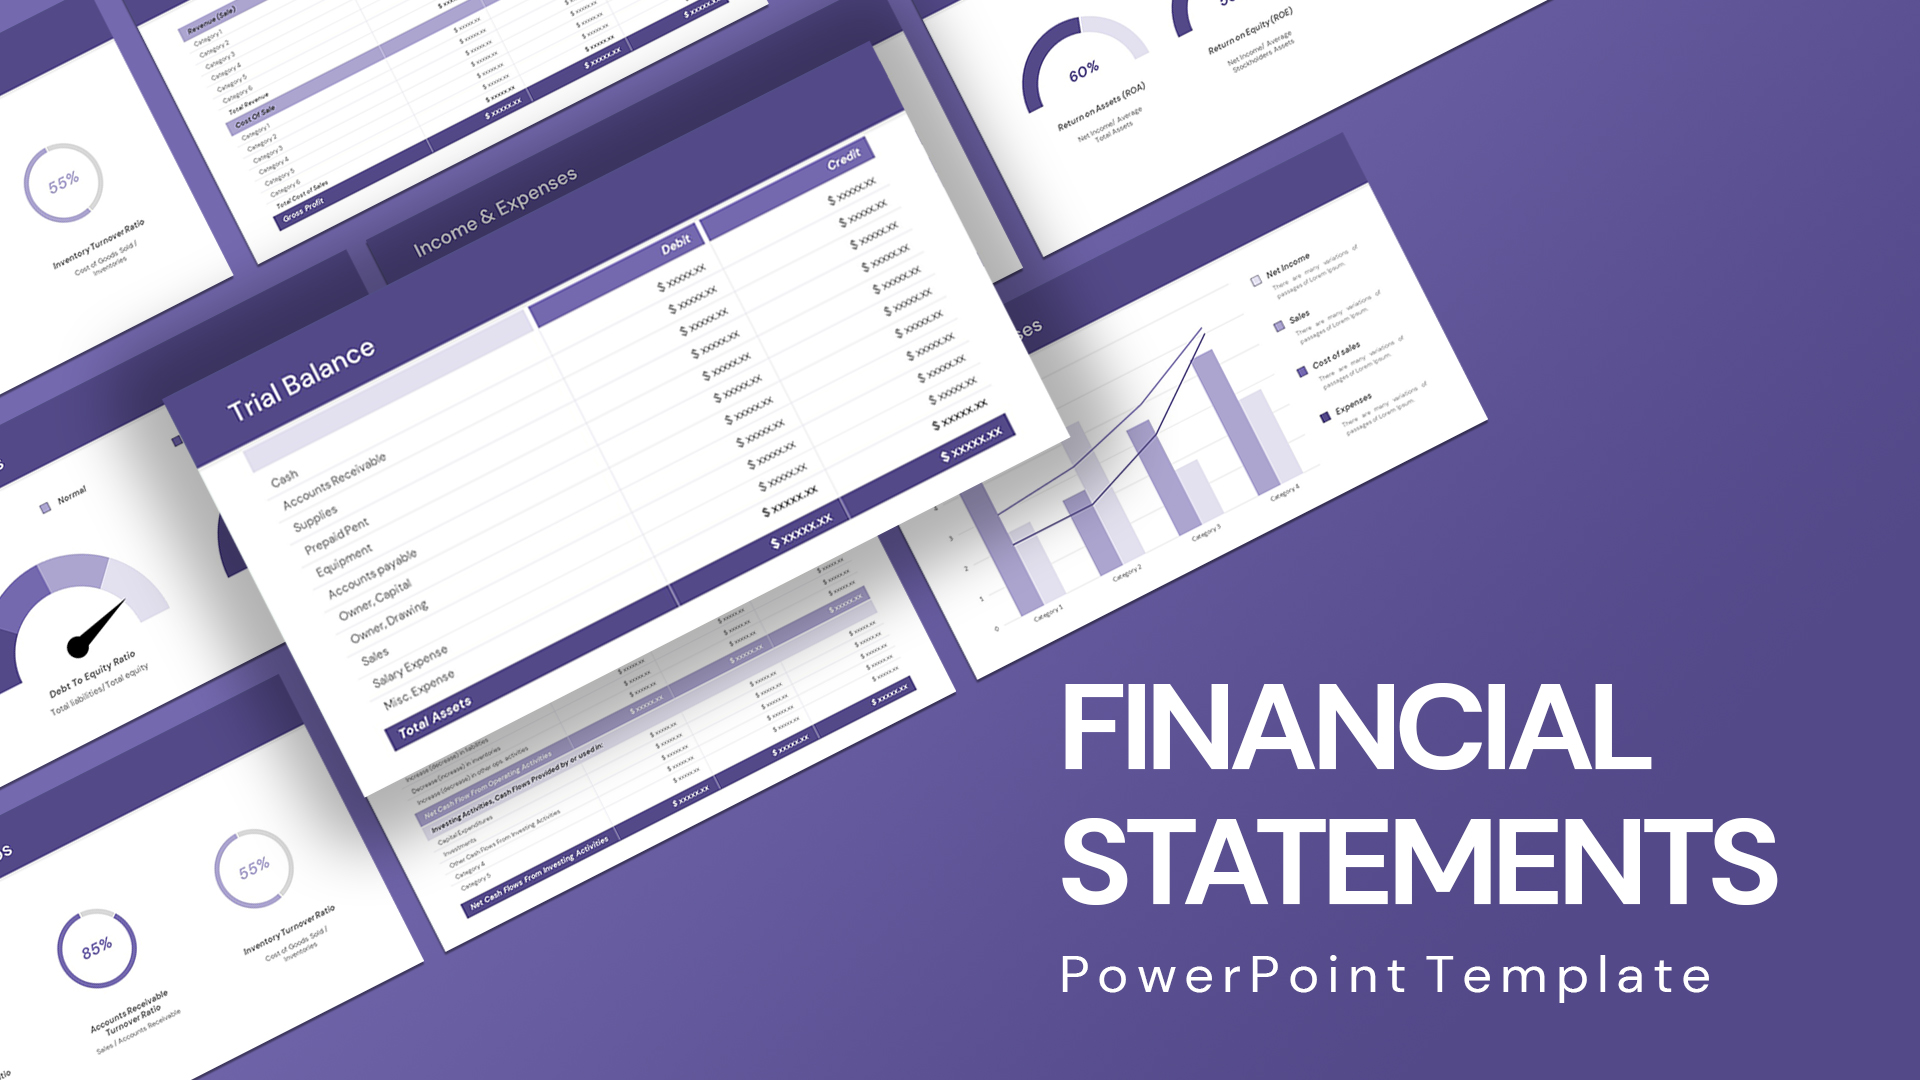
Comprehensive Financial Statements Template for PowerPoint & Google Slides
Finance
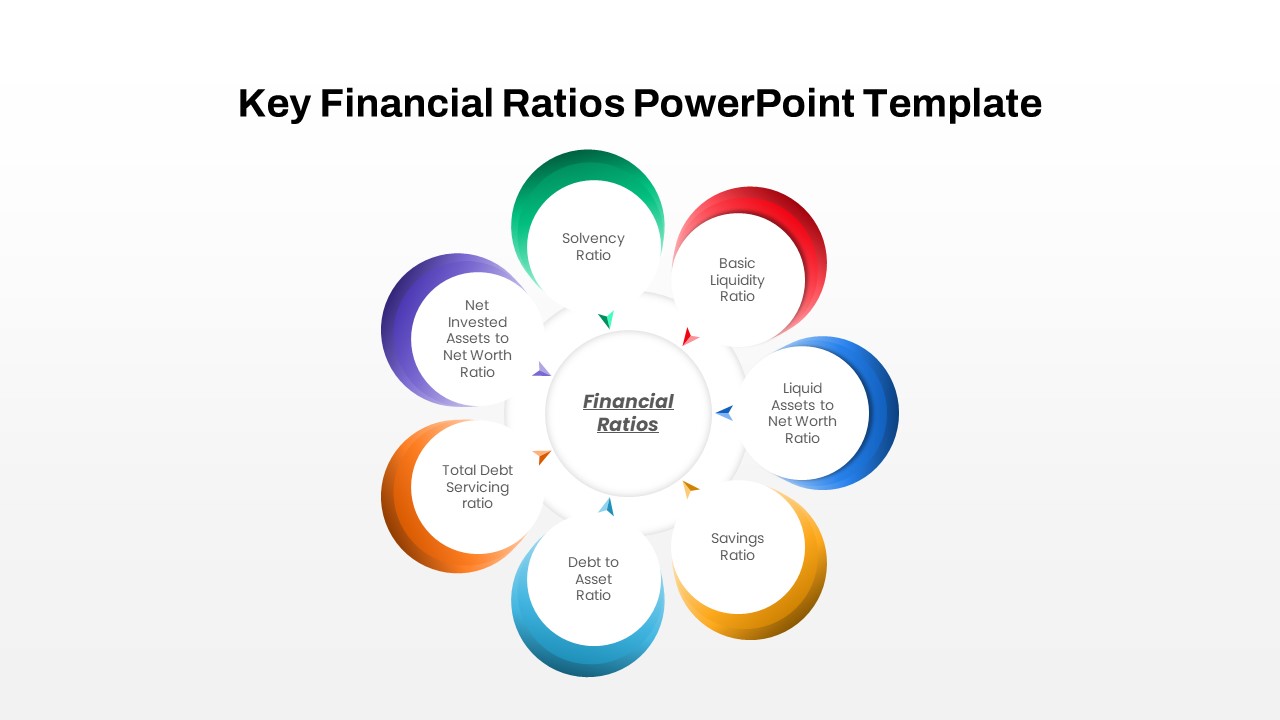
Circular Financial Ratios Infographic Template for PowerPoint & Google Slides
Finance
Sunk Costs Financial Concept Diagram Template for PowerPoint & Google Slides
Finance
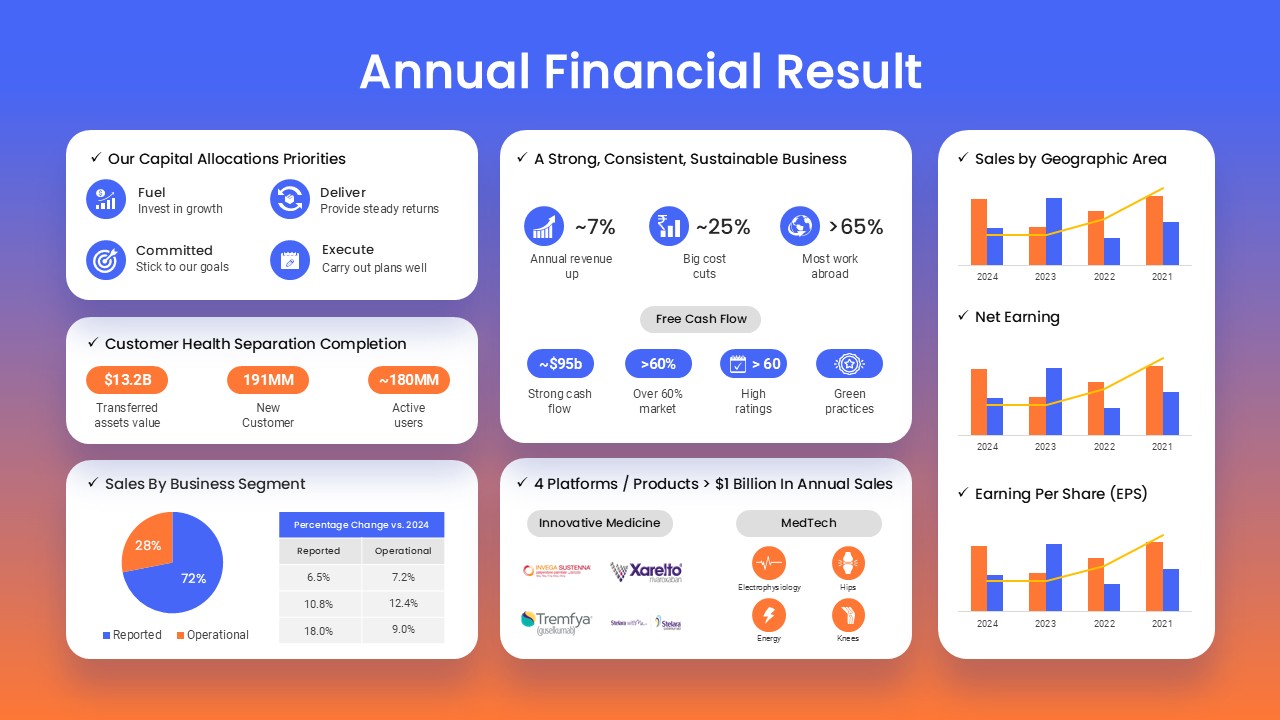
Annual Financial Results Slide Deck Template for PowerPoint & Google Slides
Finance
Dynamic Financial Analysis Line Chart Template for PowerPoint & Google Slides
Finance
Financial Snapshot & Metrics Overview Template for PowerPoint & Google Slides
Finance
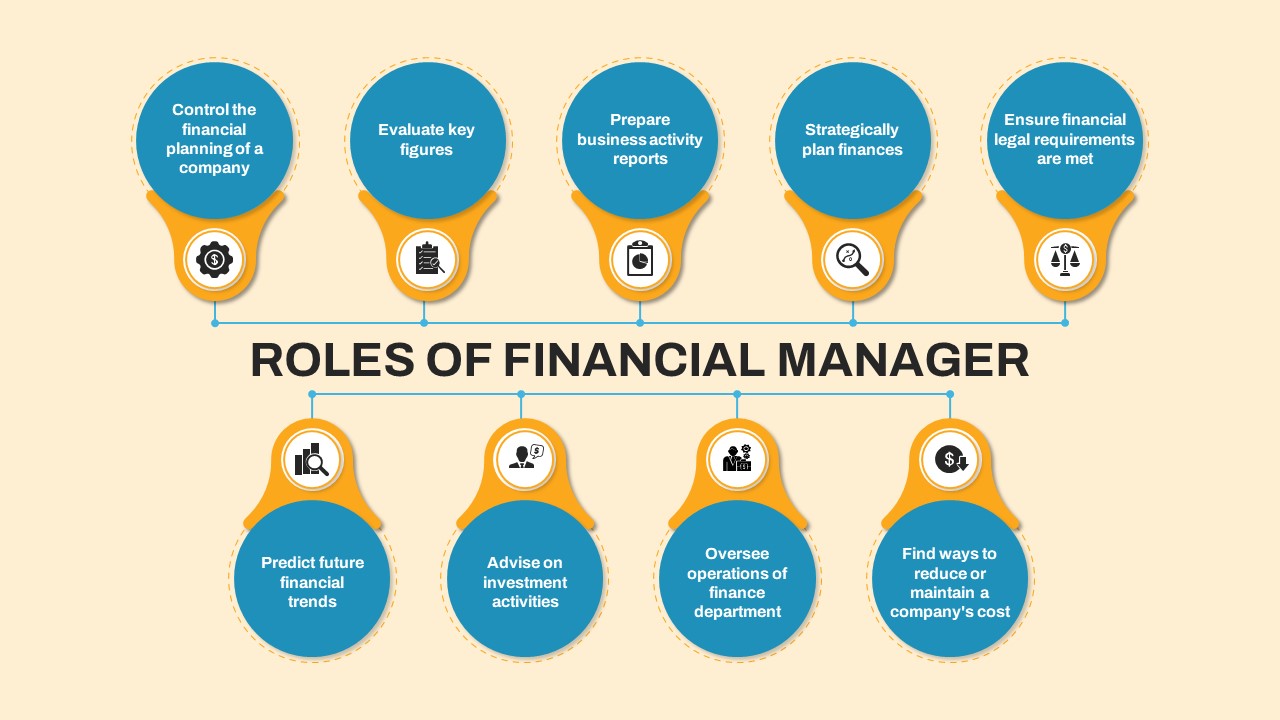
Financial Manager Roles Template for PowerPoint & Google Slides
Process
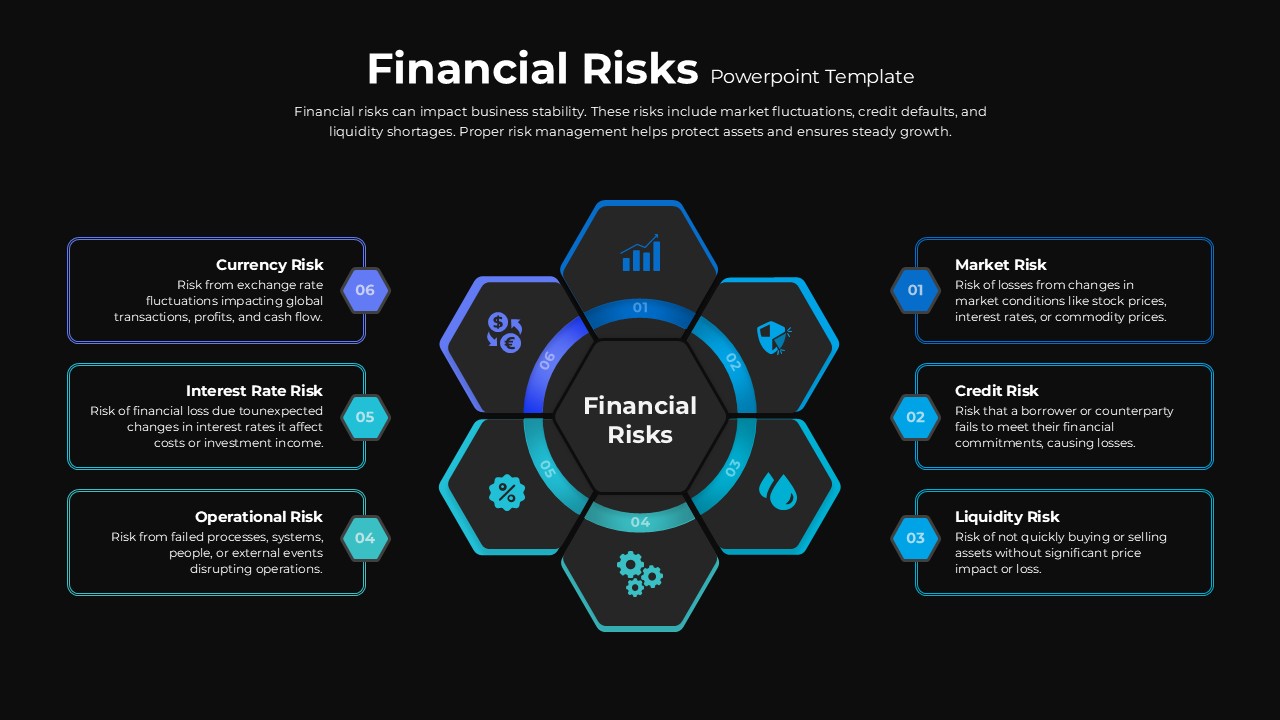
Financial Risks Hexagon Diagram Template for PowerPoint & Google Slides
Risk Management
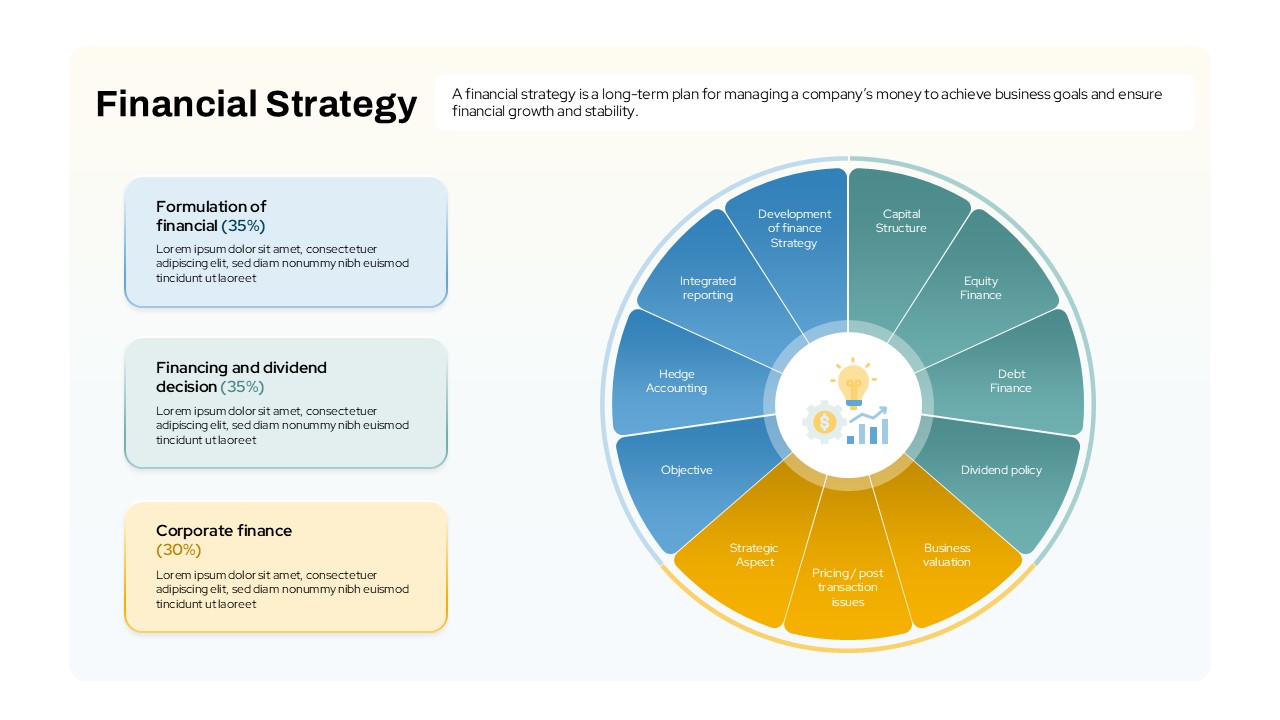
Financial Strategy template for PowerPoint & Google Slides
Business Strategy
Financial Gap Analysis Framework Template for PowerPoint & Google Slides
Finance
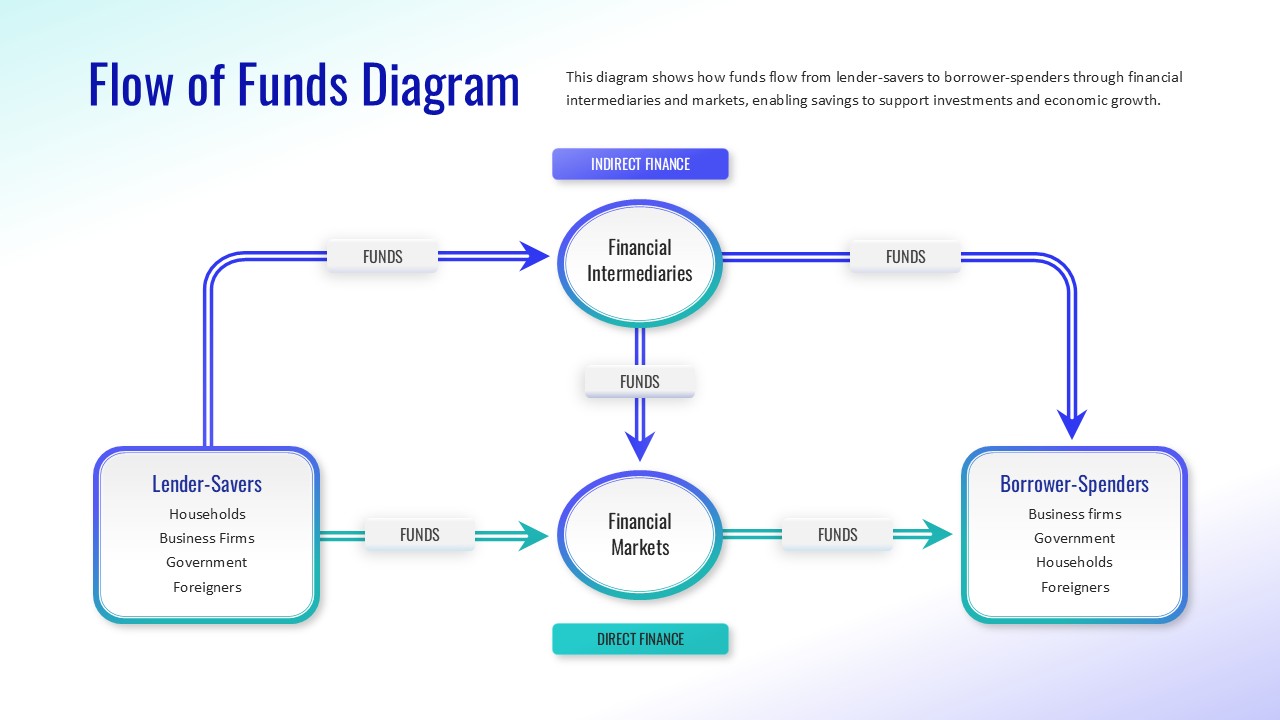
Flow of Funds Financial System Diagram Template for PowerPoint & Google Slides
Finance
Stacked Area Chart with Financial Highlights for PowerPoint & Google Slides
Finance
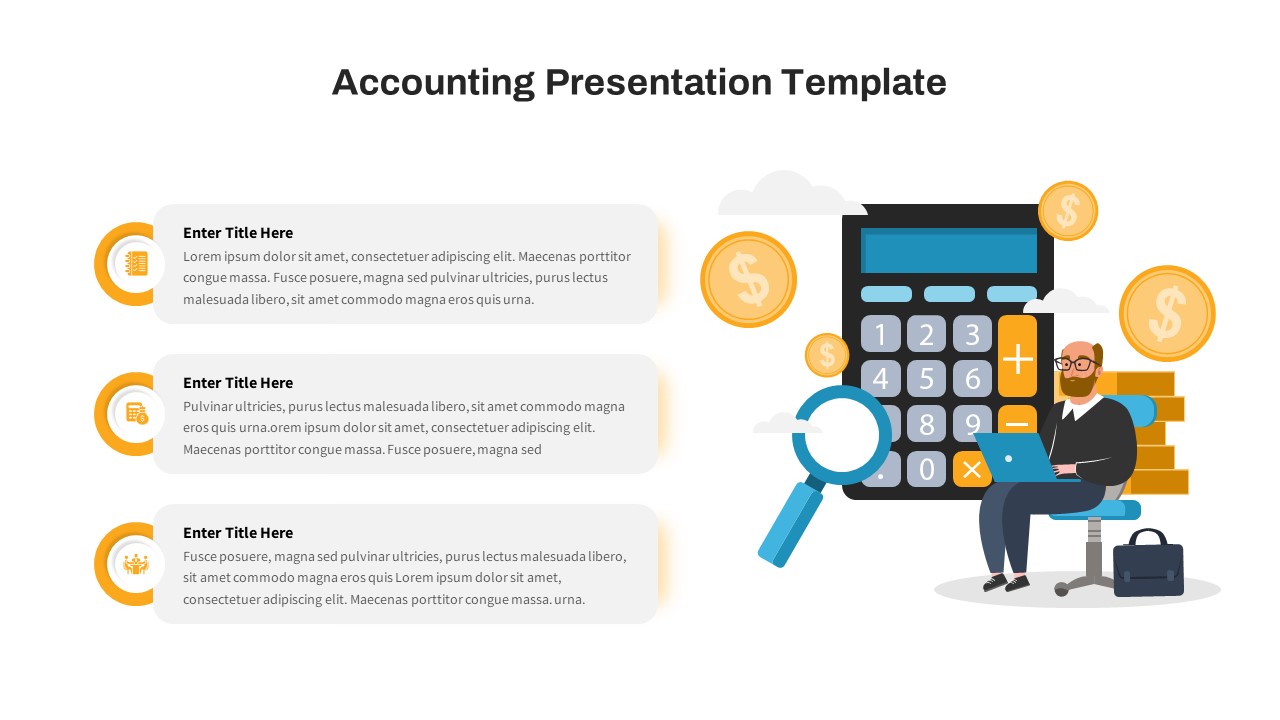
Free Financial Accounting Overview Slide for PowerPoint & Google Slides
Accounting
Free
Free KPI Dashboard PowerPoint Template for PowerPoint & Google Slides
Charts
Free
E-commerce Analytics Dashboard Template for PowerPoint & Google Slides
Bar/Column

Dynamic Data Dashboard Infographic Template for PowerPoint & Google Slides
Bar/Column
Product Usage Analytics Dashboard Chart Template for PowerPoint & Google Slides
Bar/Column
Data Analytics Dashboard Design template for PowerPoint & Google Slides
Bar/Column
Business Dashboard Analytics & KPIs Template for PowerPoint & Google Slides
Bar/Column
Professional Team Efficiency Dashboard Template for PowerPoint & Google Slides
Business Report
Website Performance Dashboard template for PowerPoint & Google Slides
Charts
Sales Performance Dashboard template for PowerPoint & Google Slides
Business Report
Immigration Data Dashboard Template for PowerPoint & Google Slides
Bar/Column
Employee Skill Analysis Dashboard Template for PowerPoint & Google Slides
Employee Performance
Net Promoter Score Dashboard Template for PowerPoint & Google Slides
Customer Experience
Performance KPI Dashboard Slide Template for PowerPoint & Google Slides
Business Report
Bull and Bear Stock Market Dashboard Template for PowerPoint & Google Slides
Infographics
KPI Dashboard Overview template for PowerPoint & Google Slides
Finance
KPI Dashboard Data Visualization Template for PowerPoint & Google Slides
Bar/Column
KPI Dashboard Data Overview Slide Template for PowerPoint & Google Slides
Bar/Column
Heat Map Risk Matrix Dashboard Template for PowerPoint & Google Slides
Comparison Chart
Project Status Dashboard Table Template for PowerPoint & Google Slides
Project Status
Project Status Dashboard with Metrics Template for PowerPoint & Google Slides
Project Status
Colorful Project Status Dashboard Template for PowerPoint & Google Slides
Project Status
One Pager Project Status Dashboard Template for PowerPoint & Google Slides
Project Status
Social Media Analytics Dashboard Template for PowerPoint & Google Slides
Digital Marketing
Social Media Statistics 2023 Dashboard Template for PowerPoint & Google Slides
Comparison
Mastodon Metrics Infographic Dashboard Template for PowerPoint & Google Slides
Business Report
Michigan County Map with KPI Dashboard Template for PowerPoint & Google Slides
World Maps
Monthly Business Review Dashboard Deck Template for PowerPoint & Google Slides
Business Report
DevOps KPI Dashboard Performance Metrics Template for PowerPoint & Google Slides
Software Development
Purchasing KPI Metrics Dashboard Template for PowerPoint & Google Slides
Business Report
Procurement KPI Dashboard & Metrics Template for PowerPoint & Google Slides
Business Report
Project Progress Dashboard Pie Charts Template for PowerPoint & Google Slides
Project
Monthly Sales Performance Dashboard Template for PowerPoint & Google Slides
Charts
Budget Forecast Dashboard & Donut Charts Template for PowerPoint & Google Slides
Pie/Donut
Risk Level Gauge Comparison Dashboard Template for PowerPoint & Google Slides
Comparison
Inventory Management Dashboard Template for PowerPoint & Google Slides
Process
Employee Performance Metrics Dashboard Template for PowerPoint & Google Slides
Employee Performance
Project Tracking Dashboard Table Template for PowerPoint & Google Slides
Project Status
Action Items Management Dashboard Table Template for PowerPoint & Google Slides
Project Status
Electronic Health Records Dashboard template for PowerPoint & Google Slides
Health
Customer Interview Insights Dashboard Template for PowerPoint & Google Slides
Customer Experience
Account Overview Dashboard template for PowerPoint & Google Slides
Business
Dashboard Project Status Template for PowerPoint & Google Slides
Project Status
Project Status Template Dashboard with Gauge for PowerPoint & Google Slides
Project Status
Task Completion Rate Dashboard Template for PowerPoint & Google Slides
Business
Project Status Dashboard with RAG Legend Template for PowerPoint & Google Slides
Project Status
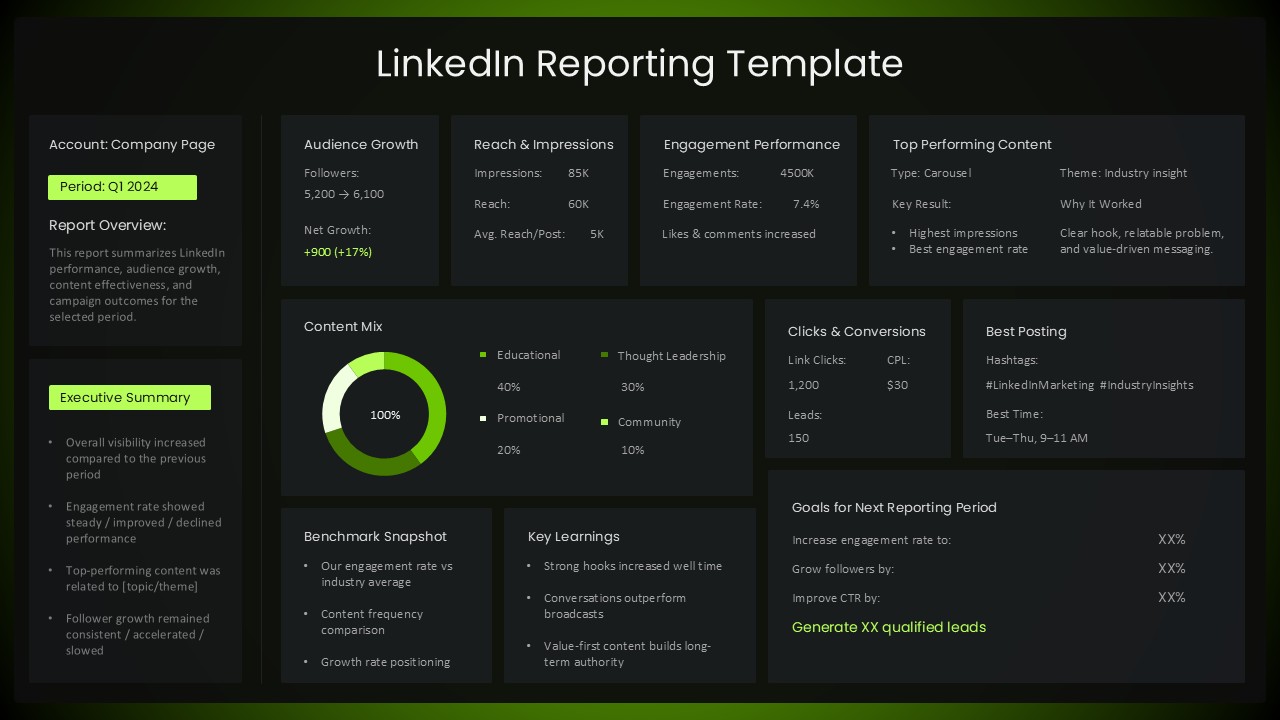
LinkedIn Performance Reporting Dashboard Template for PowerPoint & Google Slides
Digital Marketing
4DX Scoreboard KPI Gauge Dashboard Template for PowerPoint & Google Slides
Business Strategy