Project Tracking Dashboard Table Template for PowerPoint & Google Slides
Description
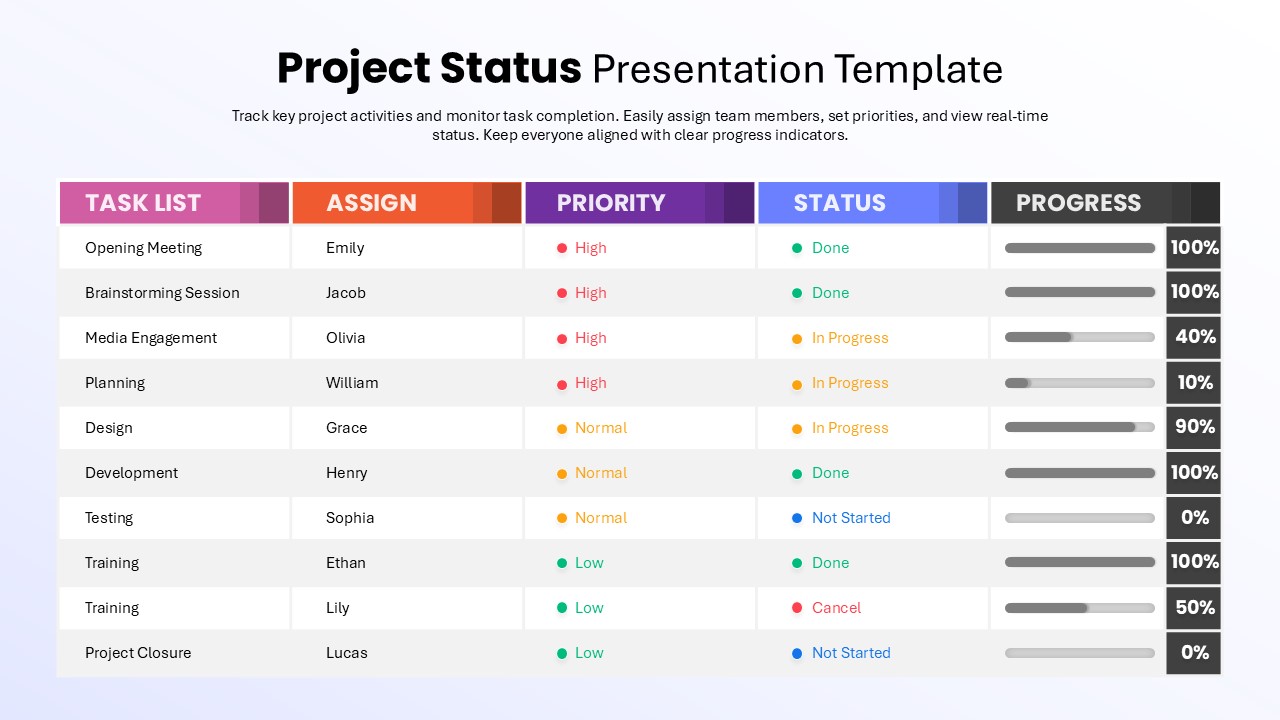
Track project tasks and deadlines with this comprehensive project tracking slide. The left side features a structured table with columns for Task Description, Assigned, Start Date, and Deadline, each row marked by color-coded status indicators (green for complete, amber for in progress, red for not started). On the right, a monthly summary table displays counts for Completed, In Progress, and Not Started tasks, with matching green, orange, and red headers, while summary cards below highlight key metrics such as total completed, active, and pending tasks. Designed on a clean white canvas with a bold blue header row and subtle drop shadows, this template ensures high readability and professional aesthetics.
Built for efficiency, the slide leverages master layouts, editable placeholders, and auto-align guides that let you add or remove tasks, update dates, or adjust status dots in seconds. Fully vector-based and optimized for both PowerPoint and Google Slides, the design preserves formatting integrity across devices, eliminating version-control issues. Use drag-and-drop icons and custom color schemes to match your brand identity, or extend the table with additional columns for priority, effort, or owner. Predefined grid layouts and snap-to alignment simplify customization, while uniform typography maintains a cohesive look across your presentation.
Who is it for
Project managers, team leads, and program directors will find this slide indispensable for weekly status reviews, sprint retrospectives, or stakeholder updates. Operations teams and PMO groups can leverage the clear table layout for resource allocation and timeline tracking.
Other Uses
Repurpose this slide for sales pipeline overviews, recruitment pipelines, client onboarding checklists, or training schedules. Adapt the table to monitor budget allocations, compliance audits, or maintenance logs with minimal effort.
Login to download this file

Item ID
SB04925
Related Templates

Dynamic Project Status Tracking Table Template for PowerPoint & Google Slides
Project Status
Incident Tracking Dashboard for PowerPoint & Google Slides
Business Plan
Project Status Dashboard Table Template for PowerPoint & Google Slides
Project Status
Project Status Update Dashboard Table Template for PowerPoint & Google Slides
Project Status
Sprint Status Tracking Template for PowerPoint & Google Slides
Infographics
Production Schedule with Delay Tracking Template for PowerPoint & Google Slides
Project Status
Applicant Tracking System Timeline Template for PowerPoint & Google Slides
Process
Action Items Management Dashboard Table Template for PowerPoint & Google Slides
Project Status

Project Management Dashboard Template for PowerPoint & Google Slides
Project
Modern Project Status Report Dashboard Template for PowerPoint & Google Slides
Project Status
Project Status Dashboard with Metrics Template for PowerPoint & Google Slides
Project Status
Colorful Project Status Dashboard Template for PowerPoint & Google Slides
Project Status
Project Status Dashboard Template for PowerPoint & Google Slides
Project Status
One Pager Project Status Dashboard Template for PowerPoint & Google Slides
Project Status
Weekly Project Status Dashboard Template for PowerPoint & Google Slides
Project Status
Project Progress Dashboard Pie Charts Template for PowerPoint & Google Slides
Project
Project Status Dashboard Report Template for PowerPoint & Google Slides
Project Status
Project Status Dashboard Template for PowerPoint & Google Slides
Project Status
Dashboard Project Status Template for PowerPoint & Google Slides
Project Status
Project Status Template Dashboard with Gauge for PowerPoint & Google Slides
Project Status
Project Status Dashboard with RAG Legend Template for PowerPoint & Google Slides
Project Status
Construction Project Dashboard Template for PowerPoint & Google Slides
Project
Project Status Table Template for PowerPoint & Google Slides
Project Status
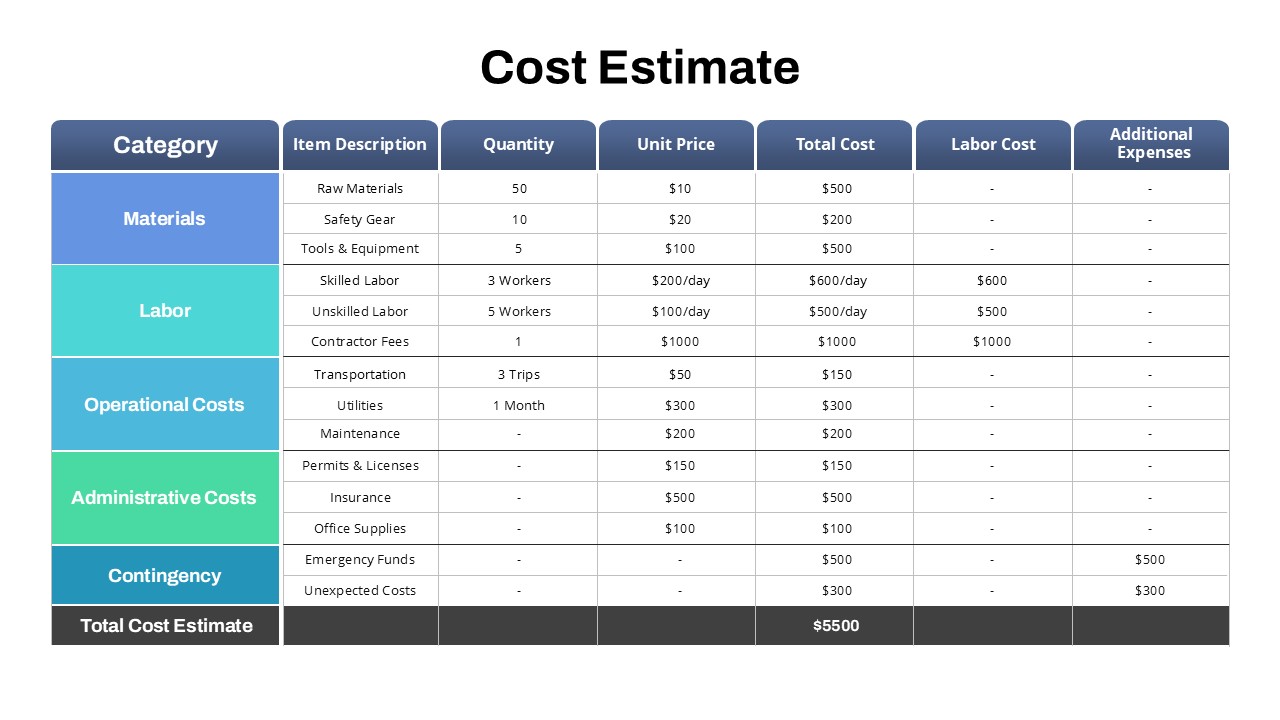
Project Detailed Cost Estimate Table Template for PowerPoint & Google Slides
Project
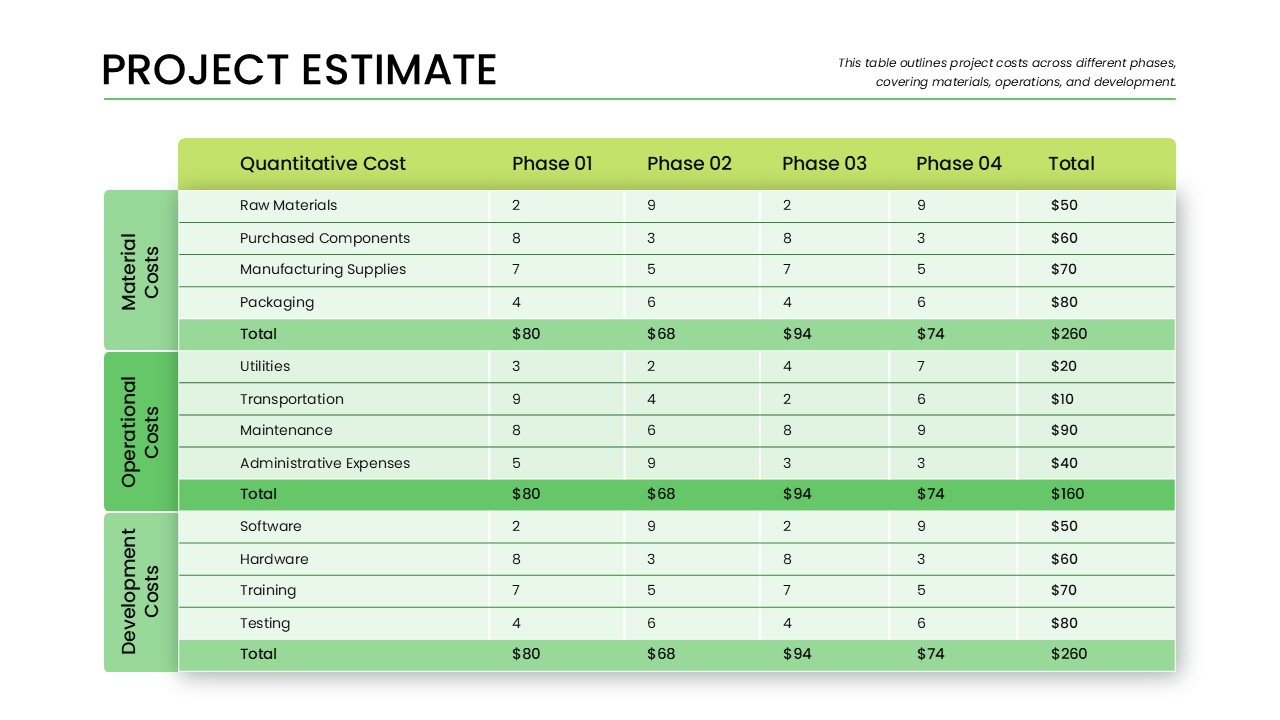
Phase-Wise Project Estimate Table Template for PowerPoint & Google Slides
Business Report
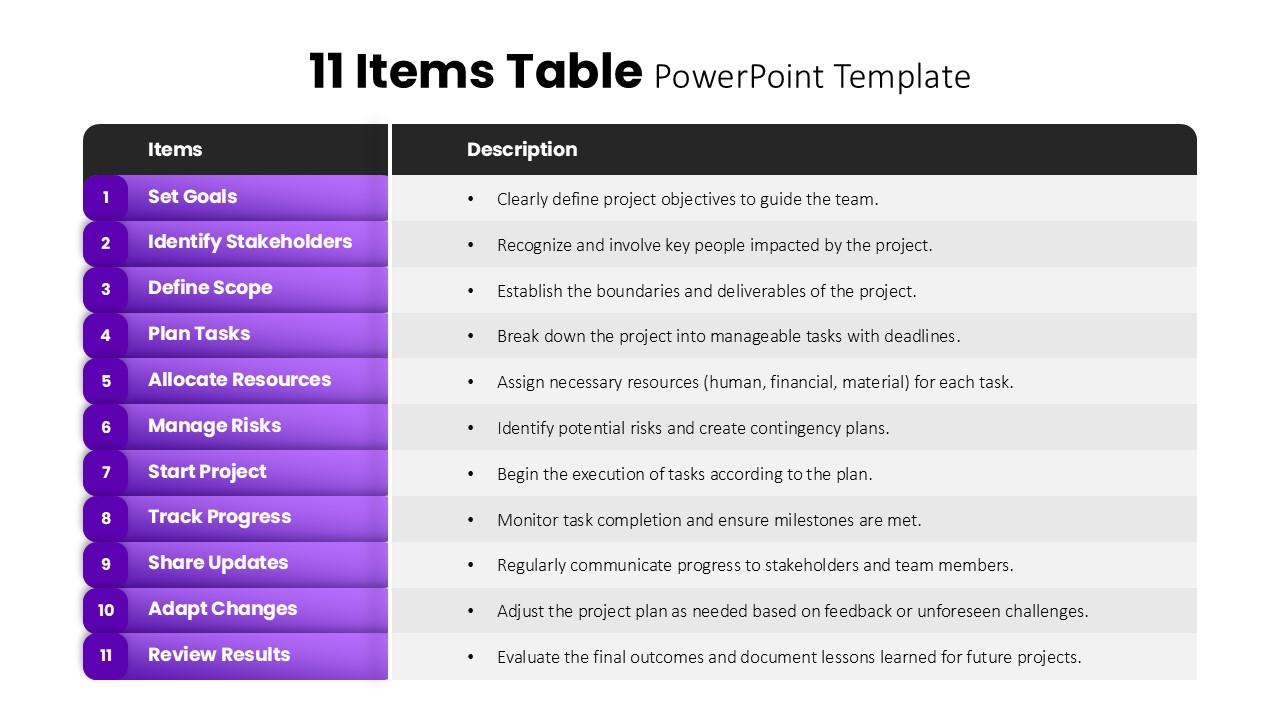
11 Items Table Project Planning Steps template for PowerPoint & Google Slides
Business
Free KPI Dashboard PowerPoint Template for PowerPoint & Google Slides
Charts
Free
E-commerce Analytics Dashboard Template for PowerPoint & Google Slides
Bar/Column
Dynamic Data Dashboard Infographic Template for PowerPoint & Google Slides
Bar/Column
Product Usage Analytics Dashboard Chart Template for PowerPoint & Google Slides
Bar/Column
Data Analytics Dashboard Design template for PowerPoint & Google Slides
Bar/Column

Efficiency KPI Dashboard Metaphor Template for PowerPoint & Google Slides
Infographics
Business Dashboard Analytics & KPIs Template for PowerPoint & Google Slides
Bar/Column

Professional Team Efficiency Dashboard Template for PowerPoint & Google Slides
Business Report
Website Performance Dashboard template for PowerPoint & Google Slides
Charts
Sales Performance Dashboard template for PowerPoint & Google Slides
Business Report
Immigration Data Dashboard Template for PowerPoint & Google Slides
Bar/Column
Employee Skill Analysis Dashboard Template for PowerPoint & Google Slides
Employee Performance
Sales Growth Dashboard: KPI Gauge & Line Template for PowerPoint & Google Slides
Revenue
Social Media Performance Dashboard Template for PowerPoint & Google Slides
Bar/Column

Net Promoter Score Dashboard Template for PowerPoint & Google Slides
Customer Experience
Performance KPI Dashboard Slide Template for PowerPoint & Google Slides
Business Report
Bull and Bear Stock Market Dashboard Template for PowerPoint & Google Slides
Infographics
KPI Dashboard template for PowerPoint & Google Slides
Business Report
KPI Dashboard Overview template for PowerPoint & Google Slides
Finance
KPI Dashboard Data Visualization Template for PowerPoint & Google Slides
Bar/Column
KPI Dashboard Data Overview Slide Template for PowerPoint & Google Slides
Bar/Column
Professional Nurse Infographic Dashboard Template for PowerPoint & Google Slides
Nursing
Interactive Benchmarking Gauge Dashboard Template for PowerPoint & Google Slides
Pie/Donut
Heat Map Risk Matrix Dashboard Template for PowerPoint & Google Slides
Comparison Chart
Weekly Update Schedule Dashboard Template for PowerPoint & Google Slides
Agenda
Weekly Status Report Dashboard Template for PowerPoint & Google Slides
HR
Free Metro UI Dashboard Infographic Template for PowerPoint & Google Slides
Business Report
Free
Website Performance Monitoring Dashboard Template for PowerPoint & Google Slides
Business Report
One Pager Annual Report Dashboard Template for PowerPoint & Google Slides
Business Report
Social Media Analytics Dashboard Template for PowerPoint & Google Slides
Digital Marketing
Social Media Statistics 2023 Dashboard Template for PowerPoint & Google Slides
Comparison
Mastodon Metrics Infographic Dashboard Template for PowerPoint & Google Slides
Business Report
Soccer Match Stats Dashboard Slide Template for PowerPoint & Google Slides
Graphics
Employee Satisfaction Survey Dashboard Template for PowerPoint & Google Slides
Employee Performance
Customer Satisfaction KPI Dashboard Template for PowerPoint & Google Slides
Customer Experience
Freight Logistics Dashboard Infographic Template for PowerPoint & Google Slides
Comparison Chart
Free Quarterly Business Review Dashboard Template for PowerPoint & Google Slides
Business
Free
Cost Cutting Savings Dashboard Template for PowerPoint & Google Slides
Pie/Donut
Macroeconomic Indicators Dashboard Template for PowerPoint & Google Slides
PEST
Free Monthly Report PowerPoint Template for PowerPoint & Google Slides
Business Report
Free
Michigan County Map with KPI Dashboard Template for PowerPoint & Google Slides
World Maps
Quarterly Financial Summary Dashboard Template for PowerPoint & Google Slides
Business Report
Banking Financial Overview Dashboard Template for PowerPoint & Google Slides
Finance
Quarterly Business Review Dashboard Template for PowerPoint & Google Slides
Pitch Deck
Monthly Business Review Dashboard Deck Template for PowerPoint & Google Slides
Business Report
DevOps KPI Dashboard Performance Metrics Template for PowerPoint & Google Slides
Software Development
Purchasing KPI Metrics Dashboard Template for PowerPoint & Google Slides
Business Report
Procurement KPI Dashboard & Metrics Template for PowerPoint & Google Slides
Business Report
Monthly Sales Performance Dashboard Template for PowerPoint & Google Slides
Charts
HR Report Dashboard Template for PowerPoint & Google Slides
Employee Performance
Budget Forecast Dashboard & Donut Charts Template for PowerPoint & Google Slides
Pie/Donut
Risk Level Gauge Comparison Dashboard Template for PowerPoint & Google Slides
Comparison
Inventory Management Dashboard Template for PowerPoint & Google Slides
Process
Digital Marketing KPIs Dashboard Dark Template for PowerPoint & Google Slides
Business Report
Employee Performance Metrics Dashboard Template for PowerPoint & Google Slides
Employee Performance
Turnover Analysis Dashboard Template for PowerPoint & Google Slides
Employee Performance
Electronic Health Records Dashboard template for PowerPoint & Google Slides
Health
Customer Interview Insights Dashboard Template for PowerPoint & Google Slides
Customer Experience
Account Overview Dashboard template for PowerPoint & Google Slides
Business
Cohort Analysis Retention Dashboard Template for PowerPoint & Google Slides
Comparison Chart
Task Completion Rate Dashboard Template for PowerPoint & Google Slides
Business
End of Year Review Dashboard Template for PowerPoint & Google Slides
Business Report
Employee Headcount Dashboard Report Template for PowerPoint & Google Slides
Employee Performance
4DX Scoreboard KPI Gauge Dashboard Template for PowerPoint & Google Slides
Business Strategy
Dashboard Templates for PowerPoint & Google Slides
Bar/Column
Free Infographic Statistics Dashboard Slide for PowerPoint & Google Slides
Bar/Column
Free
Engineering Maintenance Dashboard Slide for PowerPoint & Google Slides
Software Development
Patient-Satisfaction KPI Dashboard for PowerPoint & Google Slides
Business
MVP Product Roadmap Delivery Dashboard for PowerPoint & Google Slides
Roadmap

Free Data Analytics Dashboard Template for PowerPoint
Charts
Free
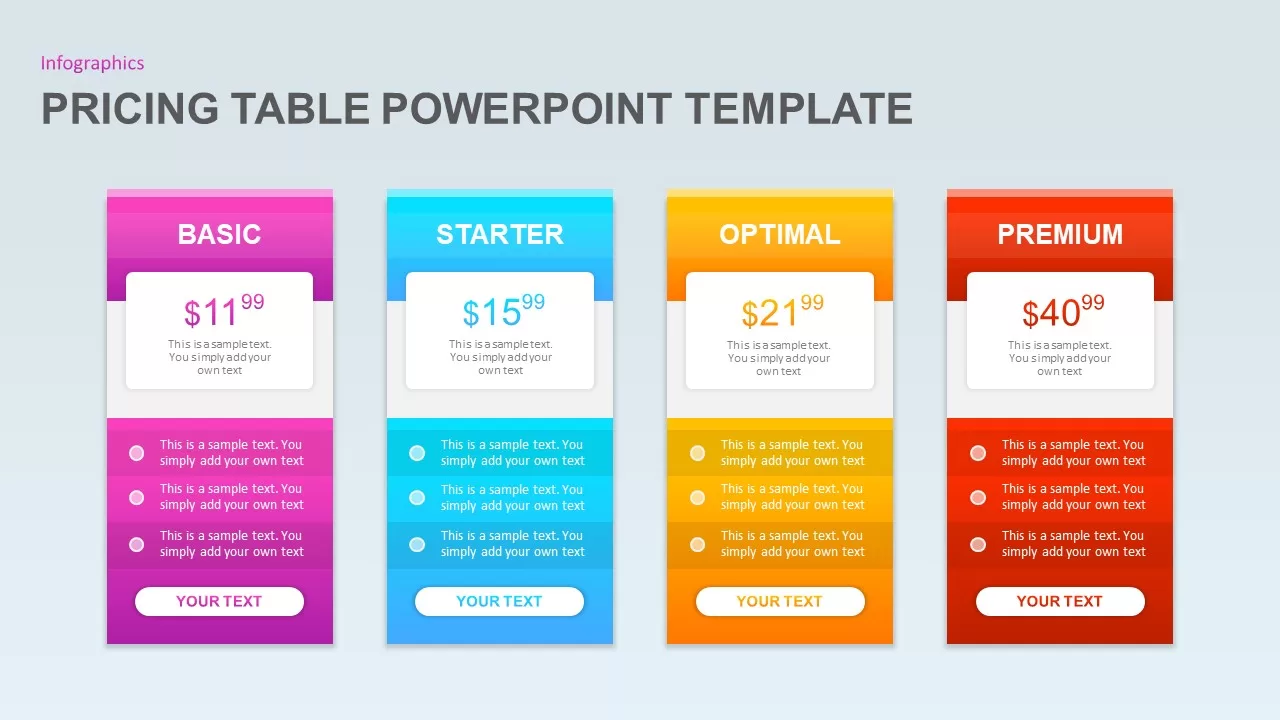
Pricing Table PowerPoint Template for PowerPoint & Google Slides
Infographics
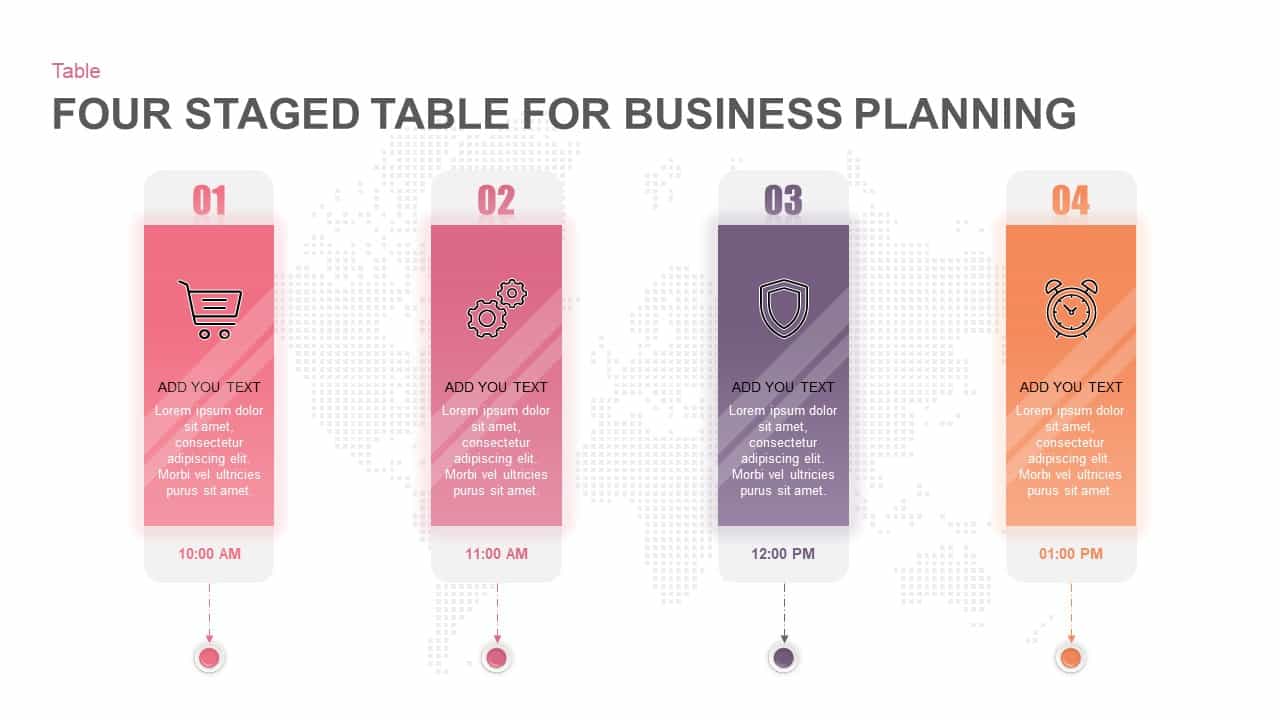
Four-Stage Business Planning Table Template for PowerPoint & Google Slides
Business Plan
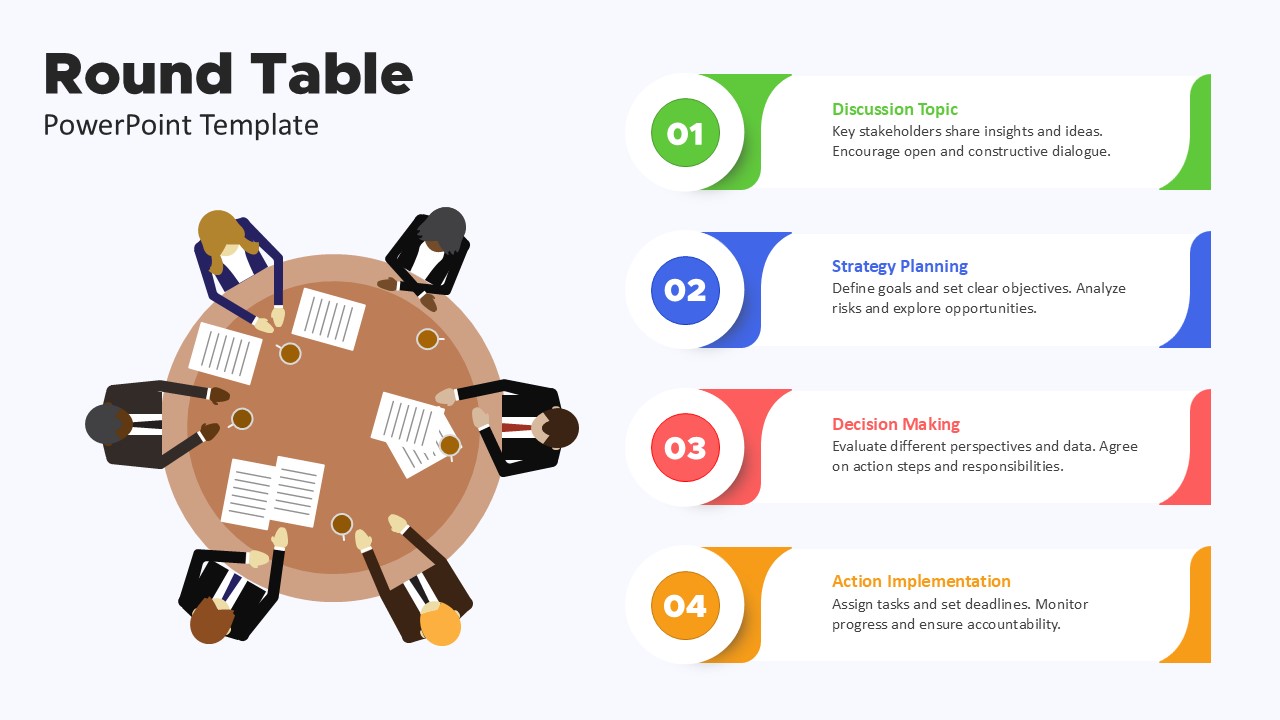
Title: Round Table Meeting Discussion Process Template for PowerPoint & Google Slides
Process
Sales Growth Comparison Chart & Table Template for PowerPoint & Google Slides
Bar/Column