Project Status Dashboard with RAG Legend Template for PowerPoint & Google Slides


Description
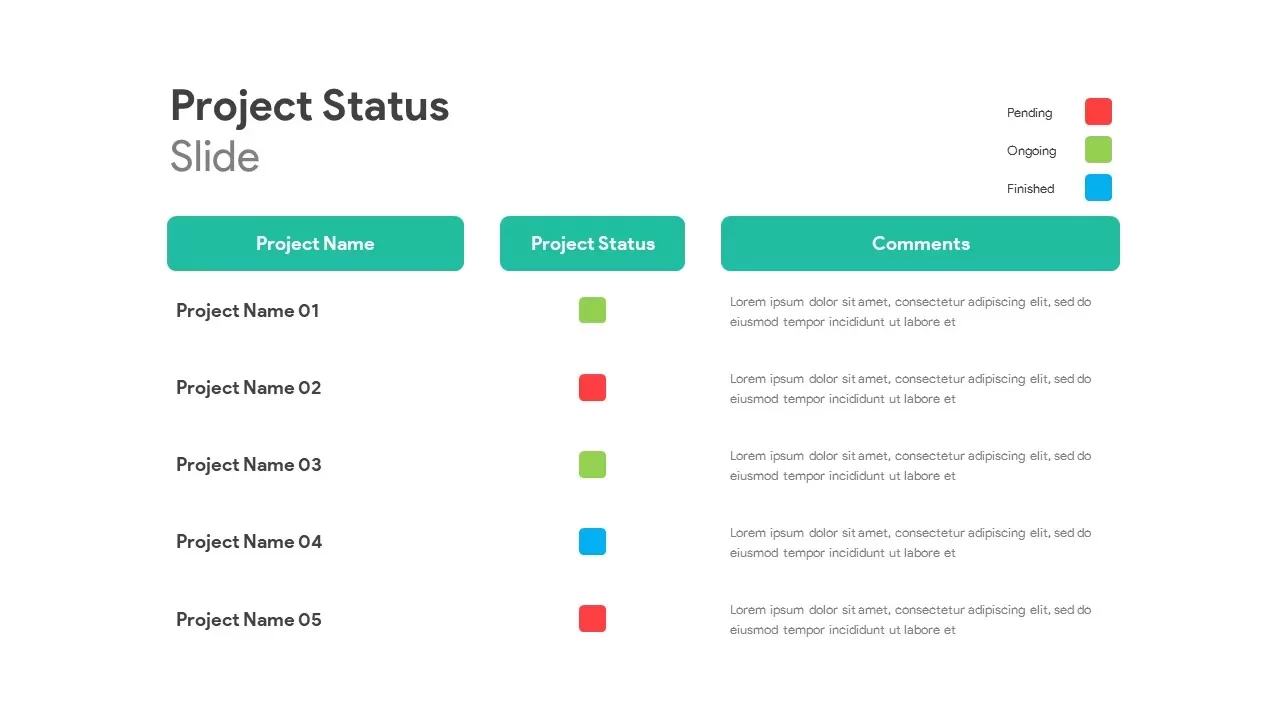
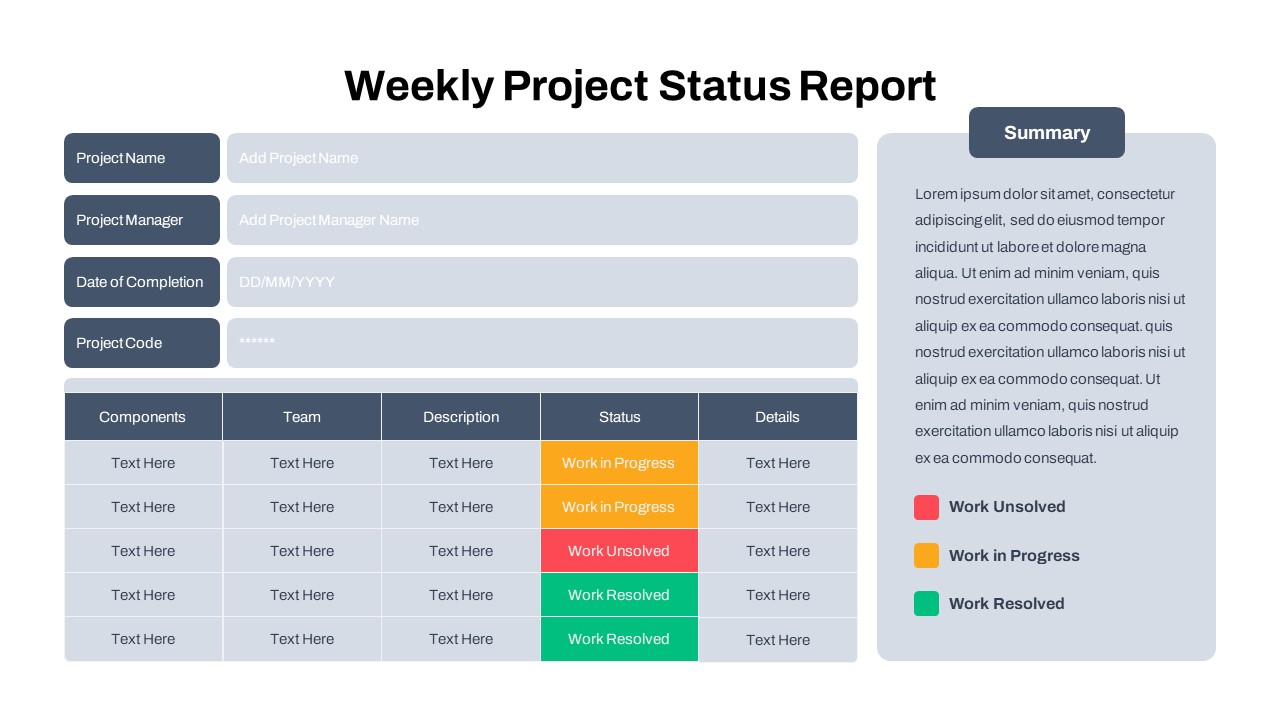
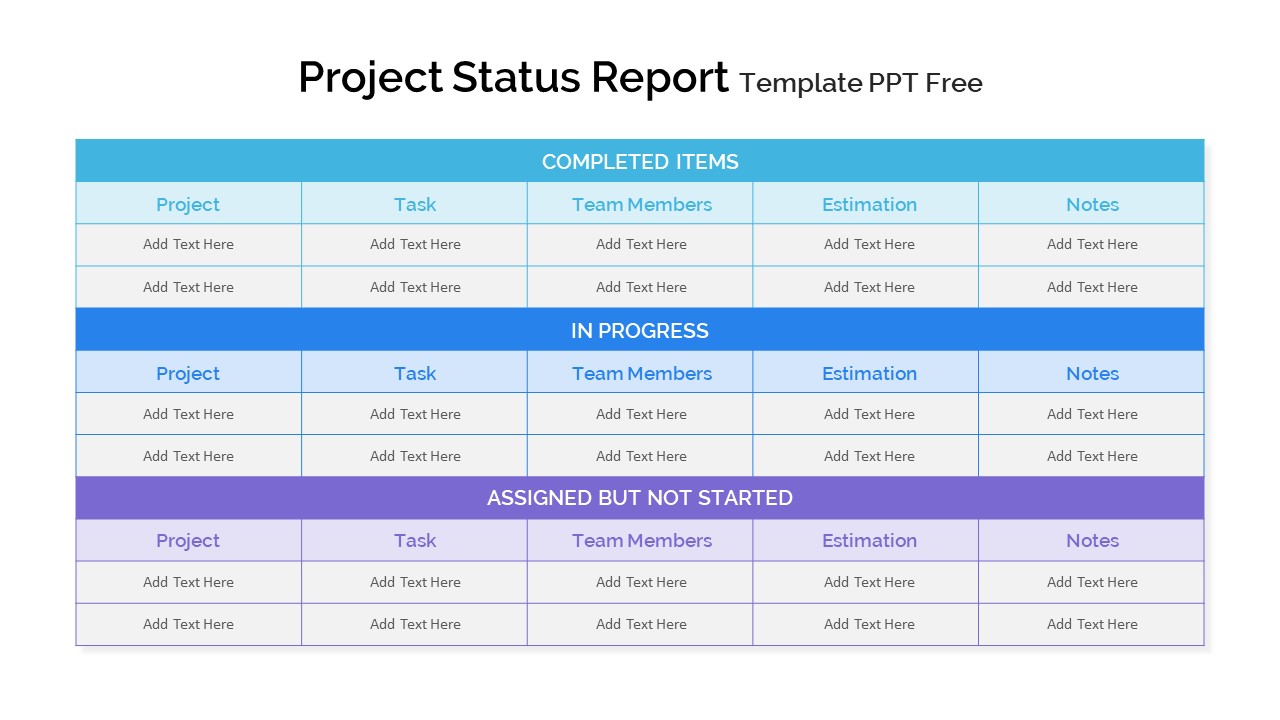
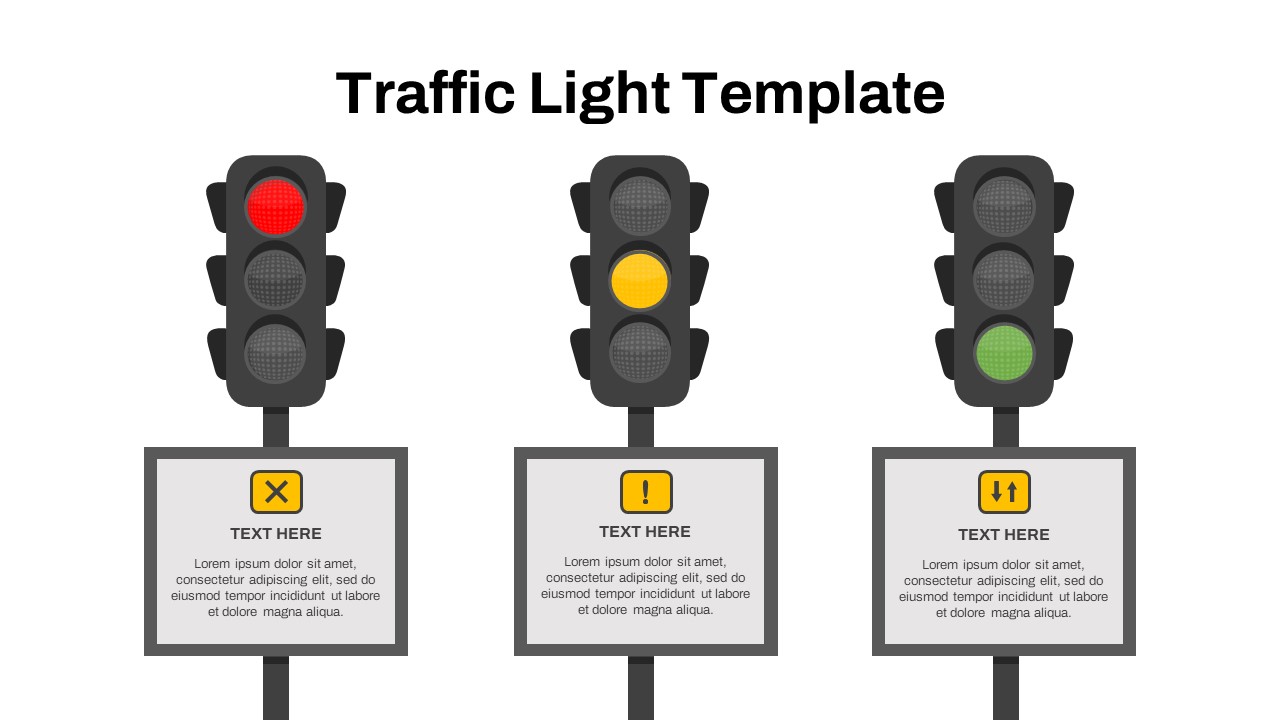
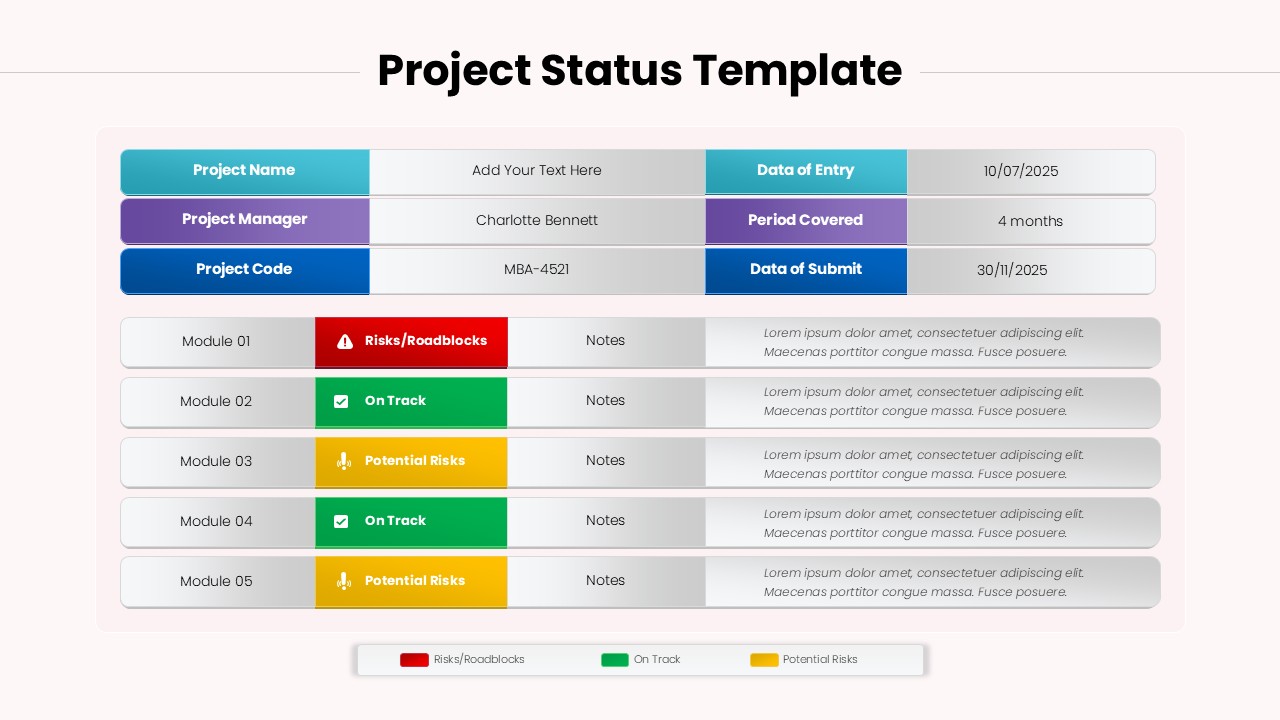
Show progress at a glance with this project status dashboard built on a clean, three-column matrix. The header captures essentials—Project Name, Project Manager, Project Code, Date of Entry/Submit, and Period Covered—so every update is anchored with context. Below, five module rows combine a labeled track with color-coded status chips and a spacious notes field. The traffic-light legend standardizes reporting: red marks Risks/Roadblocks, yellow flags Potential Risks, and green confirms On Track. Intuitive icons reinforce meaning for quick scanning in meetings or on shared screens.
Rounded cards, soft gradients, and clear typography make information pop on dark backgrounds while remaining presentation-ready. All shapes, colors, and text placeholders are fully editable; rename modules, duplicate rows, or swap icons to match your workflow. Use the legend to keep stakeholders aligned on thresholds, then record narrative updates in the notes column to capture decisions, dependencies, and next steps. The single-slide format is ideal for weekly standups and executive checkpoints: paste metrics, link tickets, and export to PDF in seconds.
Designed for PowerPoint and Google Slides, the layout preserves spacing and contrast across devices. Smart alignment and consistent paddings maintain readability even when content length varies. Customize the RAG palette to match internal criteria, attach due dates within notes, or convert row labels from “Module” to sprints, workstreams, or deliverables. With minimal edits, the slide scales from a single initiative to a lightweight portfolio report by duplicating pages and filtering per owner—turning disparate updates into a structured view of schedule health and risk exposure.
Who is it for
Project managers, PMO leaders, product owners, and team leads who need clear, repeatable status reporting. Consultants and agencies can adapt it for client updates and executive briefings.
Other Uses
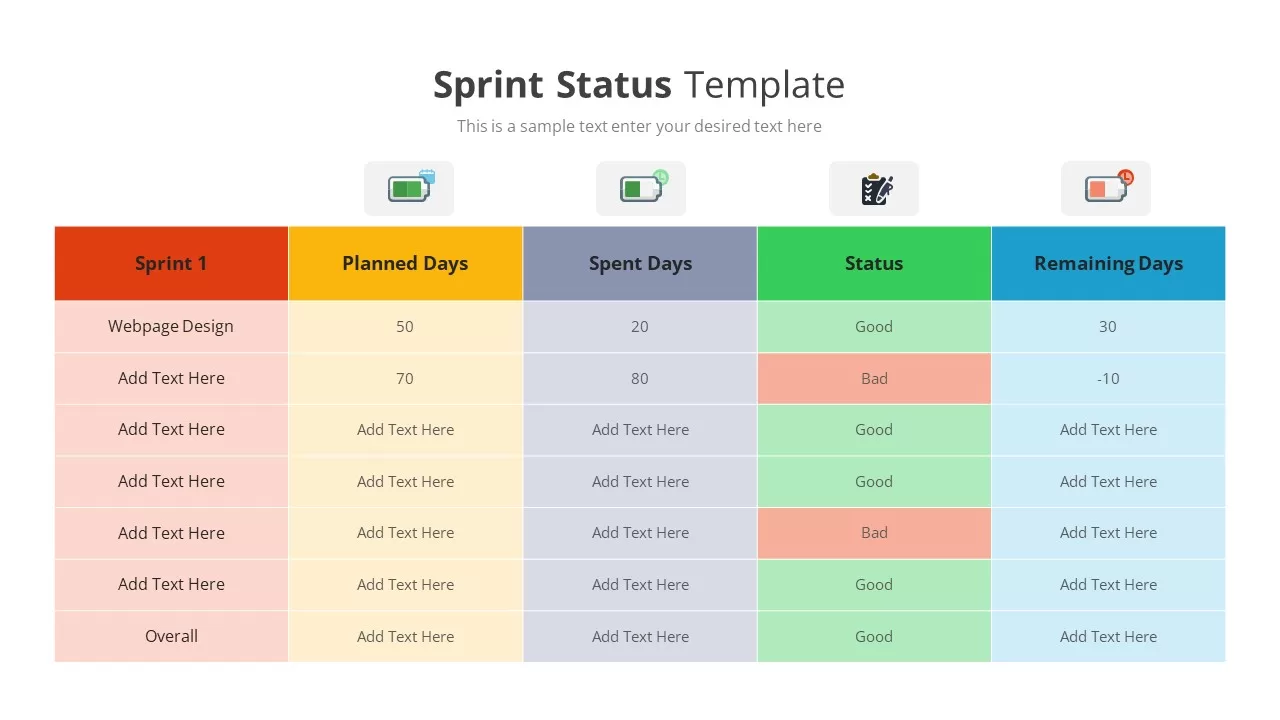
Rebrand for sprint tracking, risk logs, release readiness checks, marketing campaign health, IT rollout oversight, or vendor workstream reviews across programs.
Login to download this file

Item ID
SB05557Designed By
Filda
Related Templates

RAG Status Infographic Comparison Template for PowerPoint & Google Slides
Project
Asia Map with KPI Metrics and Legend Template for PowerPoint & Google Slides
World Maps
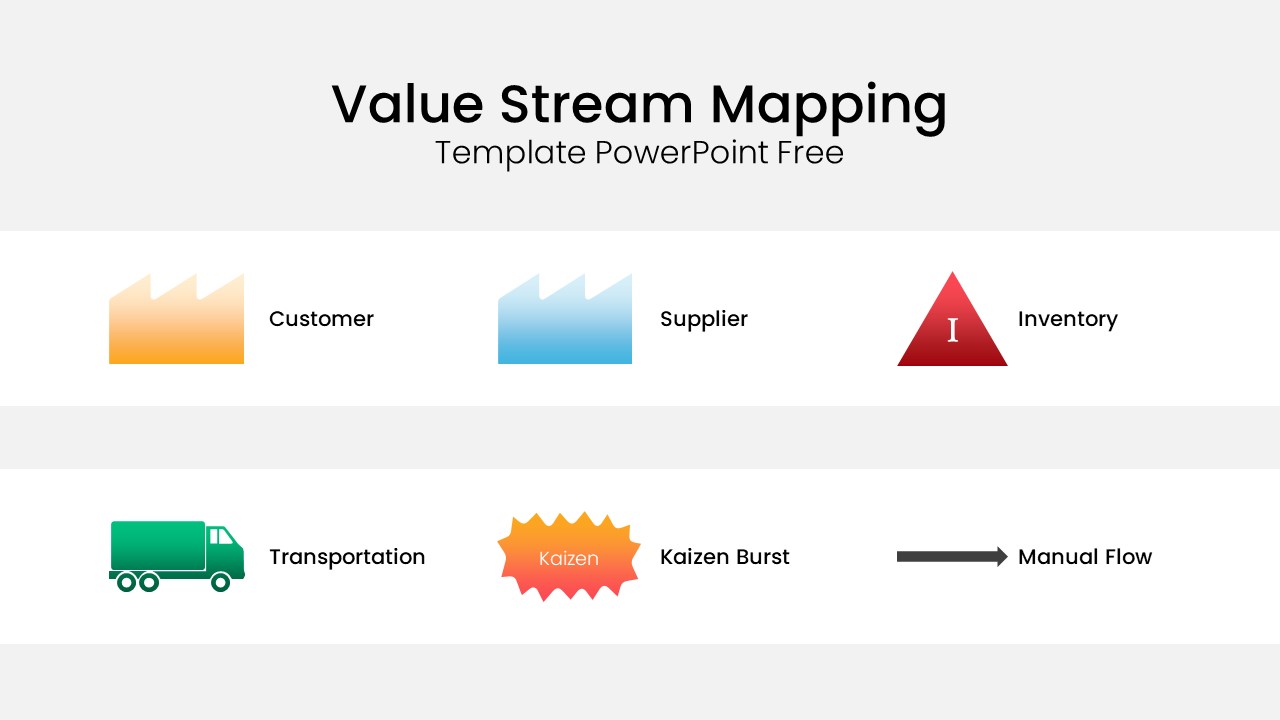
Value Stream Mapping Symbol Legend Template for PowerPoint & Google Slides
Charts
Free
Modern Project Status Report Dashboard Template for PowerPoint & Google Slides
Project Status
Project Status Dashboard Table Template for PowerPoint & Google Slides
Project Status
Project Status Dashboard with Metrics Template for PowerPoint & Google Slides
Project Status
Colorful Project Status Dashboard Template for PowerPoint & Google Slides
Project Status
Project Status Dashboard Template for PowerPoint & Google Slides
Project Status
One Pager Project Status Dashboard Template for PowerPoint & Google Slides
Project Status
Weekly Project Status Dashboard Template for PowerPoint & Google Slides
Project Status
Project Status Dashboard Report Template for PowerPoint & Google Slides
Project Status
Project Status Update Dashboard Table Template for PowerPoint & Google Slides
Project Status
Project Status Dashboard Template for PowerPoint & Google Slides
Project Status
Dashboard Project Status Template for PowerPoint & Google Slides
Project Status
Project Status Template Dashboard with Gauge for PowerPoint & Google Slides
Project Status
Weekly Status Report Dashboard Template for PowerPoint & Google Slides
HR
Clean Minimal Project Status Update Template for PowerPoint & Google Slides
Project
Color-Coded Project Status Template for PowerPoint & Google Slides
Project Status
Color-Coded Project Status Slide Template for PowerPoint & Google Slides
Project Status
Project Status Table Template for PowerPoint & Google Slides
Project Status
Circular Project Status Template for PowerPoint & Google Slides
Project Status
Horizontal Timeline Project Status Template for PowerPoint & Google Slides
Project Status
Free Simple Weekly Project Status Report Template for PowerPoint & Google Slides
Project Status
Free
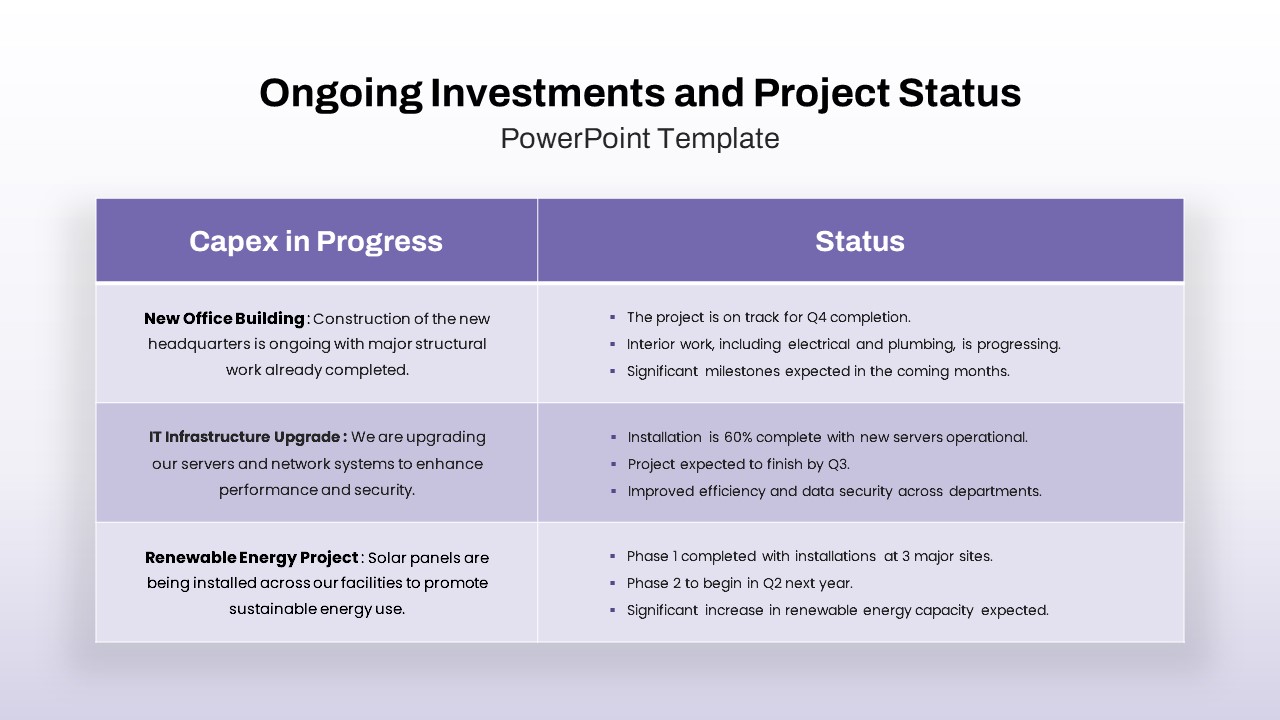
Ongoing Investments and Project Status Template for PowerPoint & Google Slides
Project Status
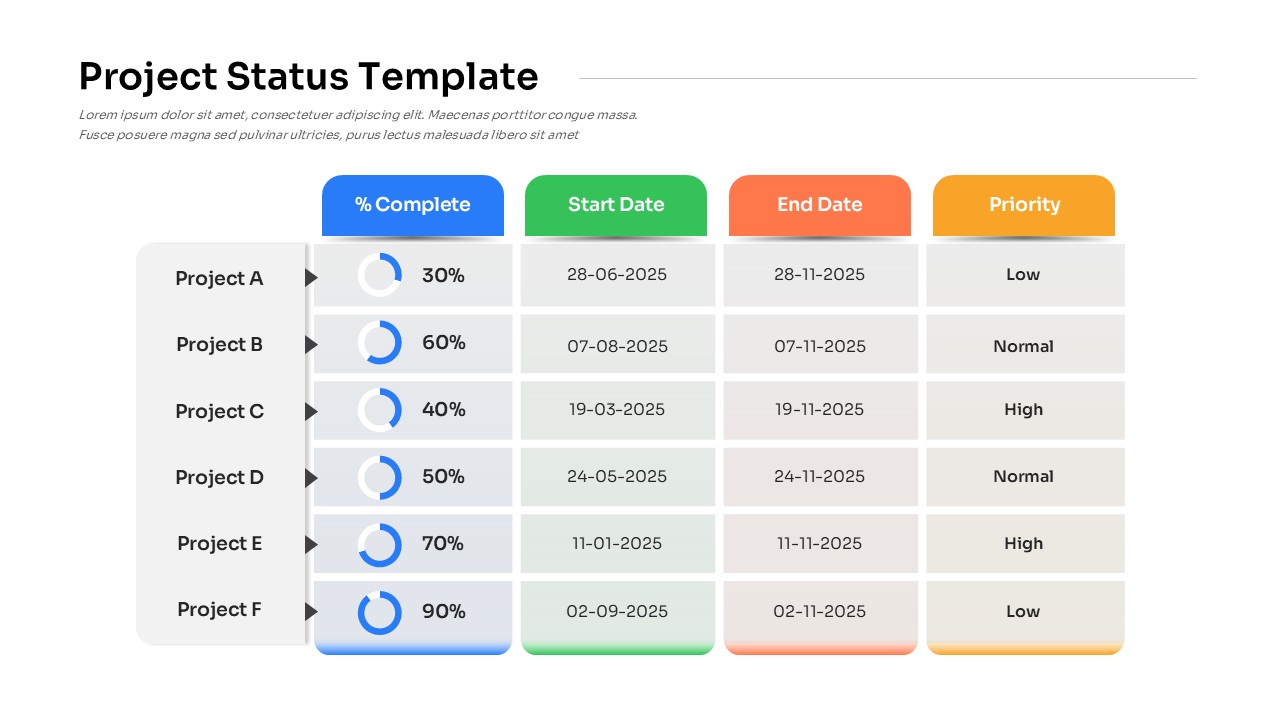
Dynamic Project Status Tracking Table Template for PowerPoint & Google Slides
Project Status
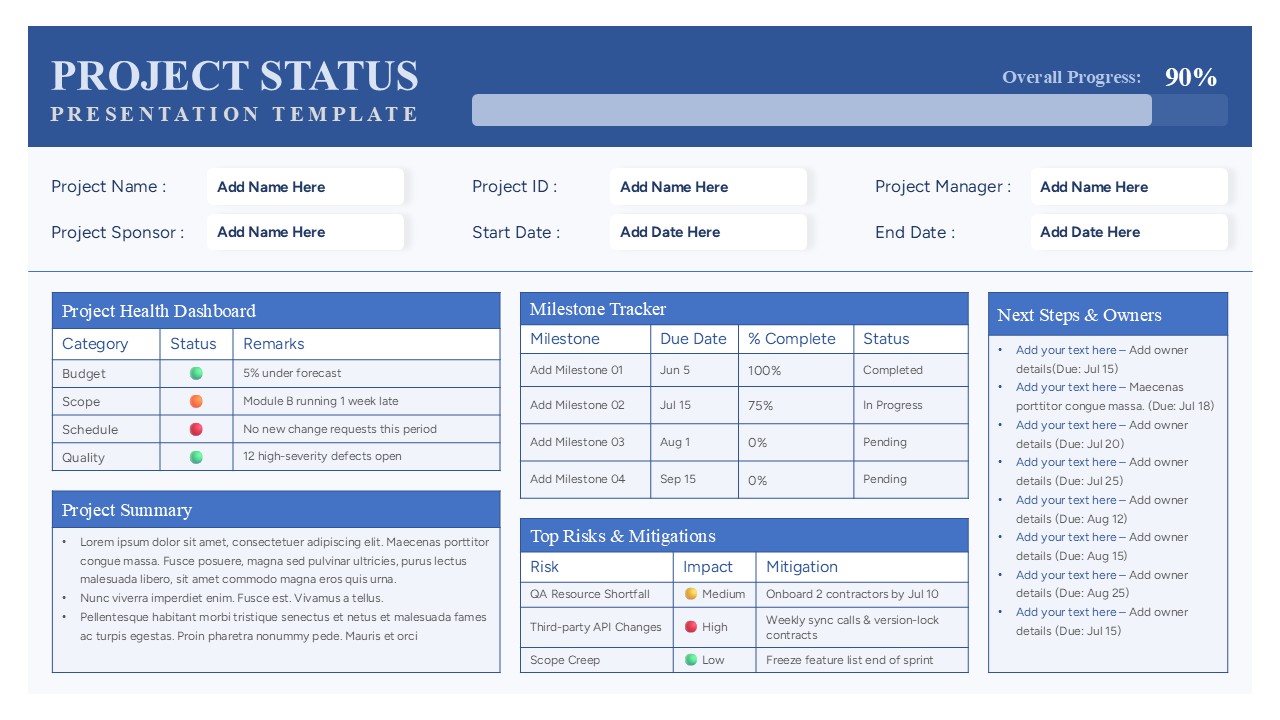
Comprehensive Project Status Report Template for PowerPoint & Google Slides
Project Status
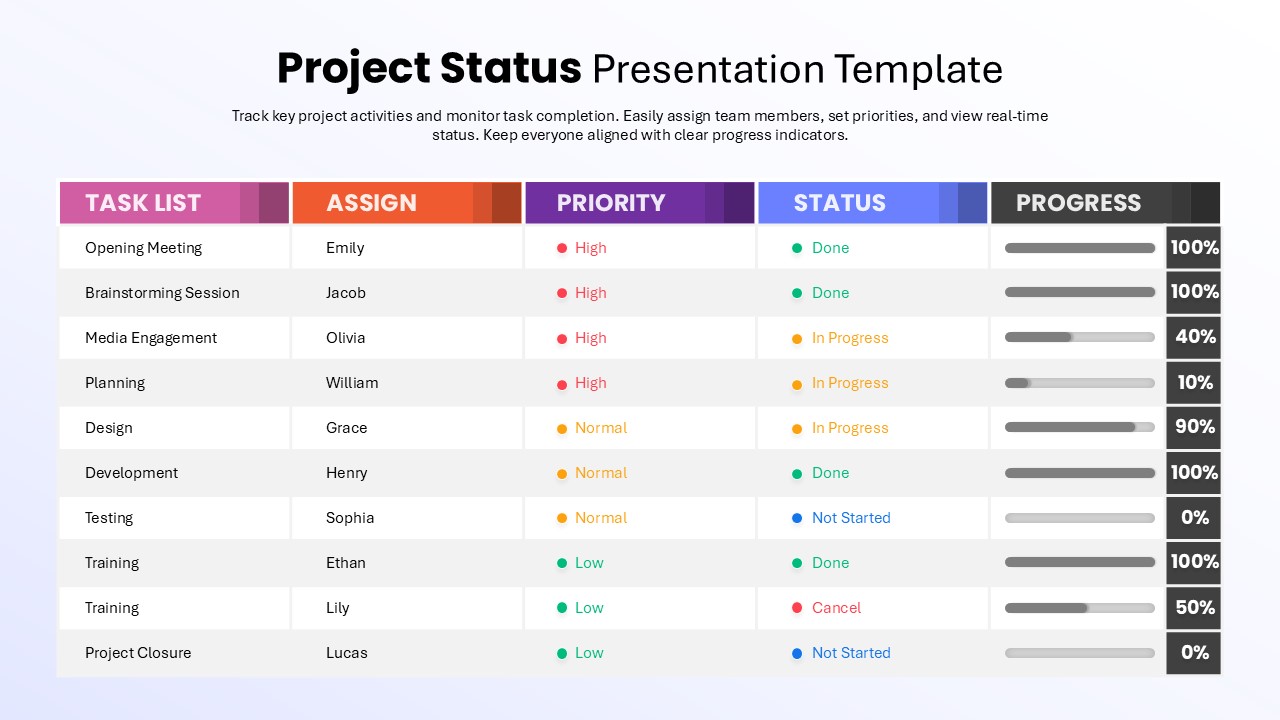
Project Status with Progress & Priority Template for PowerPoint & Google Slides
Table
Project Status Report Tracker Slide for PowerPoint & Google Slides
Project Status

Project Management Dashboard Template for PowerPoint & Google Slides
Project
Project Progress Dashboard Pie Charts Template for PowerPoint & Google Slides
Project
Project Tracking Dashboard Table Template for PowerPoint & Google Slides
Project Status
Construction Project Dashboard Template for PowerPoint & Google Slides
Project
Sprint Status Tracking Template for PowerPoint & Google Slides
Infographics
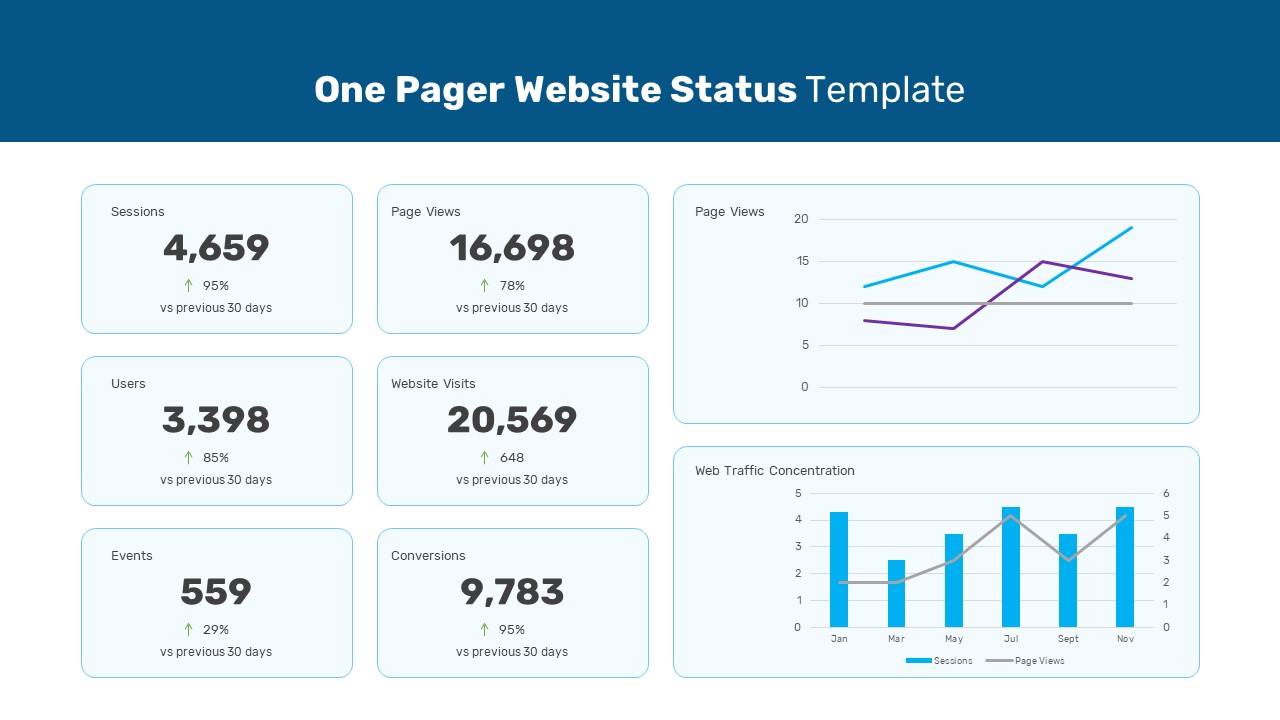
One Pager Website Status Template for PowerPoint & Google Slides
Digital Marketing
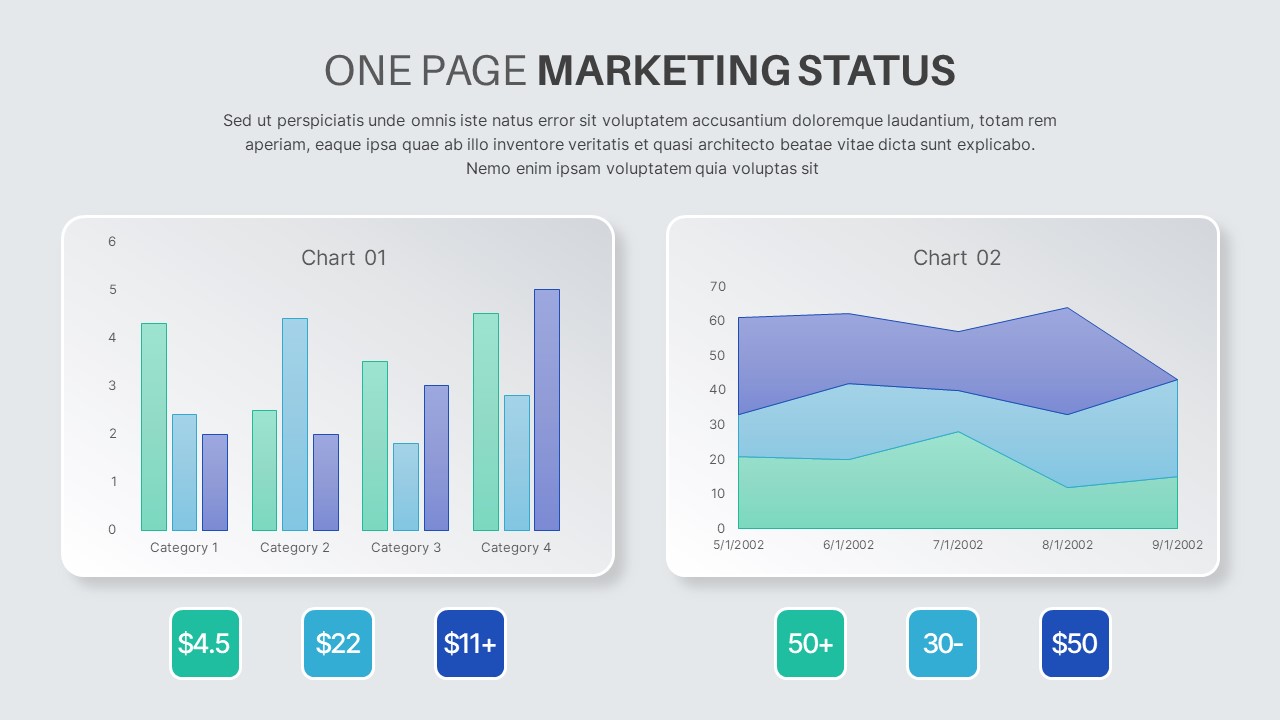
One Page Marketing Status Template for PowerPoint & Google Slides
Marketing
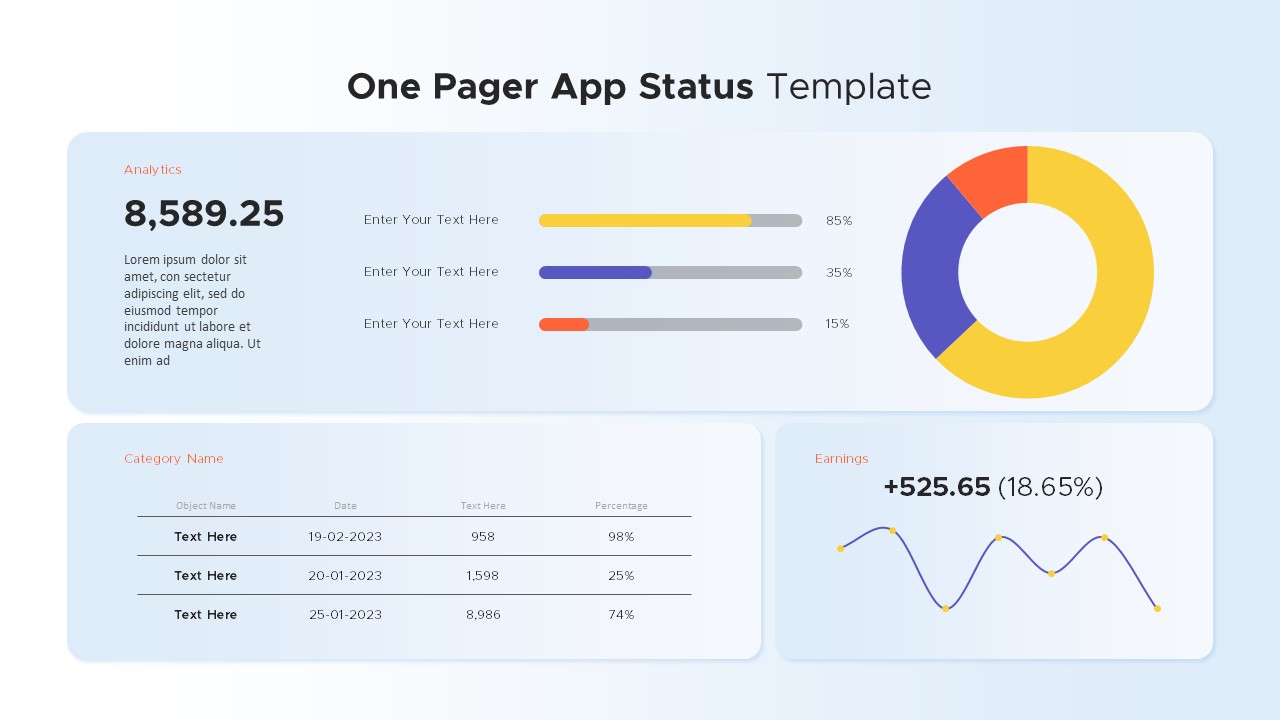
One Pager App Status template for PowerPoint & Google Slides
Business Report
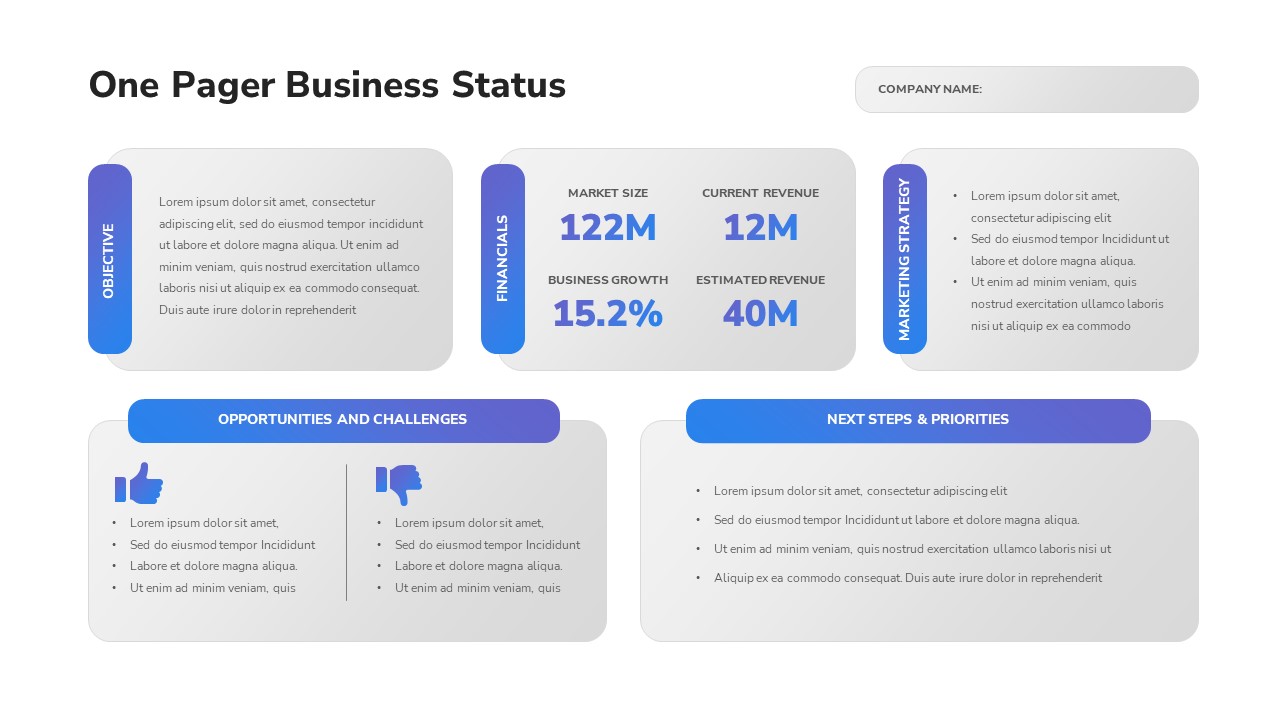
One-Pager Business Status Report Slide Template for PowerPoint & Google Slides
Business Report
Free Traffic Light Status Indicator Slide Template for PowerPoint & Google Slides
Project Status
Free
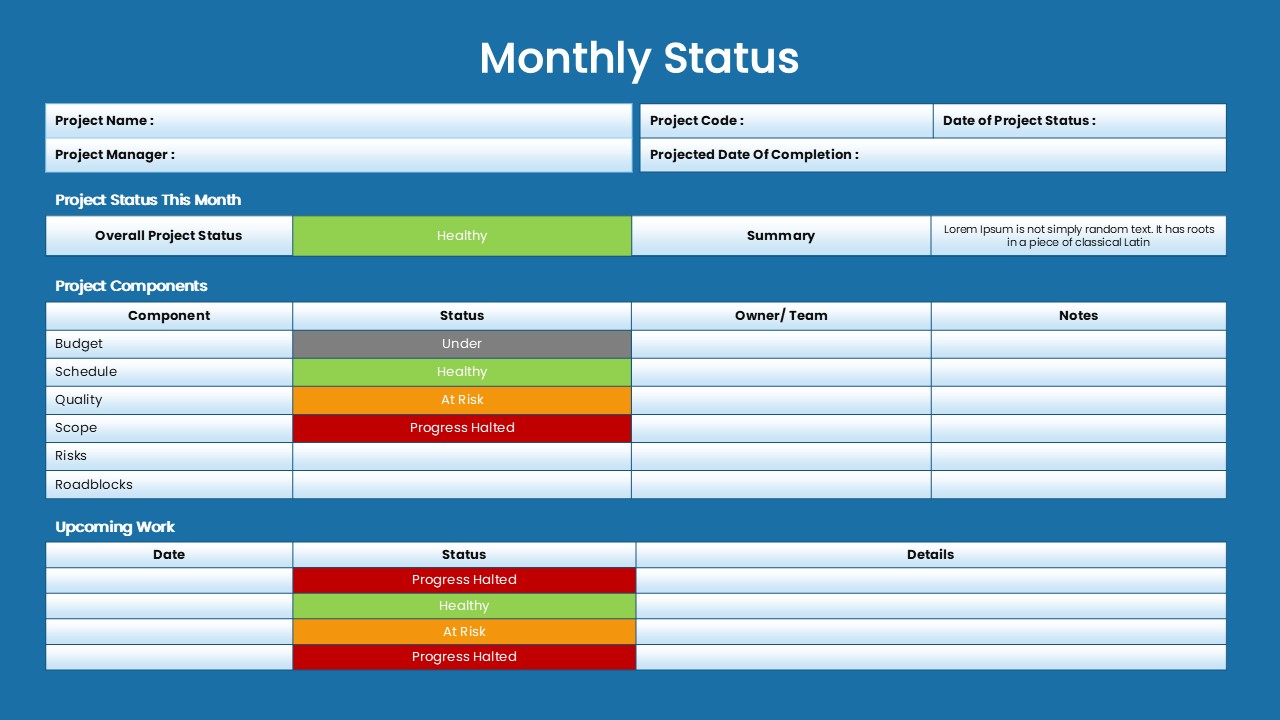
Monthly Status Report Template for PowerPoint & Google Slides
Project Status
Free KPI Dashboard PowerPoint Template for PowerPoint & Google Slides
Charts
Free
E-commerce Analytics Dashboard Template for PowerPoint & Google Slides
Bar/Column
Dynamic Data Dashboard Infographic Template for PowerPoint & Google Slides
Bar/Column
Product Usage Analytics Dashboard Chart Template for PowerPoint & Google Slides
Bar/Column
Data Analytics Dashboard Design template for PowerPoint & Google Slides
Bar/Column

Efficiency KPI Dashboard Metaphor Template for PowerPoint & Google Slides
Infographics
Business Dashboard Analytics & KPIs Template for PowerPoint & Google Slides
Bar/Column

Website Performance Dashboard template for PowerPoint & Google Slides
Charts
Sales Performance Dashboard template for PowerPoint & Google Slides
Business Report
Immigration Data Dashboard Template for PowerPoint & Google Slides
Bar/Column
Employee Skill Analysis Dashboard Template for PowerPoint & Google Slides
Employee Performance
Sales Growth Dashboard: KPI Gauge & Line Template for PowerPoint & Google Slides
Revenue
Social Media Performance Dashboard Template for PowerPoint & Google Slides
Bar/Column

Net Promoter Score Dashboard Template for PowerPoint & Google Slides
Customer Experience
Bull and Bear Stock Market Dashboard Template for PowerPoint & Google Slides
Infographics
KPI Dashboard template for PowerPoint & Google Slides
Business Report
KPI Dashboard Overview template for PowerPoint & Google Slides
Finance
KPI Dashboard Data Visualization Template for PowerPoint & Google Slides
Bar/Column
KPI Dashboard Data Overview Slide Template for PowerPoint & Google Slides
Bar/Column
Professional Nurse Infographic Dashboard Template for PowerPoint & Google Slides
Nursing
Interactive Benchmarking Gauge Dashboard Template for PowerPoint & Google Slides
Pie/Donut
Heat Map Risk Matrix Dashboard Template for PowerPoint & Google Slides
Comparison Chart
Weekly Update Schedule Dashboard Template for PowerPoint & Google Slides
Agenda
Free Metro UI Dashboard Infographic Template for PowerPoint & Google Slides
Business Report
Free
Website Performance Monitoring Dashboard Template for PowerPoint & Google Slides
Business Report
One Pager Annual Report Dashboard Template for PowerPoint & Google Slides
Business Report
Social Media Analytics Dashboard Template for PowerPoint & Google Slides
Digital Marketing
Social Media Statistics 2023 Dashboard Template for PowerPoint & Google Slides
Comparison
Mastodon Metrics Infographic Dashboard Template for PowerPoint & Google Slides
Business Report
Soccer Match Stats Dashboard Slide Template for PowerPoint & Google Slides
Graphics
Employee Satisfaction Survey Dashboard Template for PowerPoint & Google Slides
Employee Performance
Customer Satisfaction KPI Dashboard Template for PowerPoint & Google Slides
Customer Experience
Freight Logistics Dashboard Infographic Template for PowerPoint & Google Slides
Comparison Chart
Free Quarterly Business Review Dashboard Template for PowerPoint & Google Slides
Business
Free
Cost Cutting Savings Dashboard Template for PowerPoint & Google Slides
Pie/Donut
Macroeconomic Indicators Dashboard Template for PowerPoint & Google Slides
PEST
Free Monthly Report PowerPoint Template for PowerPoint & Google Slides
Business Report
Free
Michigan County Map with KPI Dashboard Template for PowerPoint & Google Slides
World Maps
Quarterly Financial Summary Dashboard Template for PowerPoint & Google Slides
Business Report
Banking Financial Overview Dashboard Template for PowerPoint & Google Slides
Finance
Quarterly Business Review Dashboard Template for PowerPoint & Google Slides
Pitch Deck
Monthly Business Review Dashboard Deck Template for PowerPoint & Google Slides
Business Report
DevOps KPI Dashboard Performance Metrics Template for PowerPoint & Google Slides
Software Development
Procurement KPI Dashboard & Metrics Template for PowerPoint & Google Slides
Business Report
Monthly Sales Performance Dashboard Template for PowerPoint & Google Slides
Charts
HR Report Dashboard Template for PowerPoint & Google Slides
Employee Performance
Budget Forecast Dashboard & Donut Charts Template for PowerPoint & Google Slides
Pie/Donut
Risk Level Gauge Comparison Dashboard Template for PowerPoint & Google Slides
Comparison
Inventory Management Dashboard Template for PowerPoint & Google Slides
Process
Digital Marketing KPIs Dashboard Dark Template for PowerPoint & Google Slides
Business Report
Employee Performance Metrics Dashboard Template for PowerPoint & Google Slides
Employee Performance
Turnover Analysis Dashboard Template for PowerPoint & Google Slides
Employee Performance
Action Items Management Dashboard Table Template for PowerPoint & Google Slides
Project Status
Electronic Health Records Dashboard template for PowerPoint & Google Slides
Health
Customer Interview Insights Dashboard Template for PowerPoint & Google Slides
Customer Experience
Account Overview Dashboard template for PowerPoint & Google Slides
Business
Cohort Analysis Retention Dashboard Template for PowerPoint & Google Slides
Comparison Chart
Task Completion Rate Dashboard Template for PowerPoint & Google Slides
Business
End of Year Review Dashboard Template for PowerPoint & Google Slides
Business Report
Employee Headcount Dashboard Report Template for PowerPoint & Google Slides
Employee Performance
4DX Scoreboard KPI Gauge Dashboard Template for PowerPoint & Google Slides
Business Strategy