Progress Bar Graph Layout Design for PowerPoint & Google Slides

Description
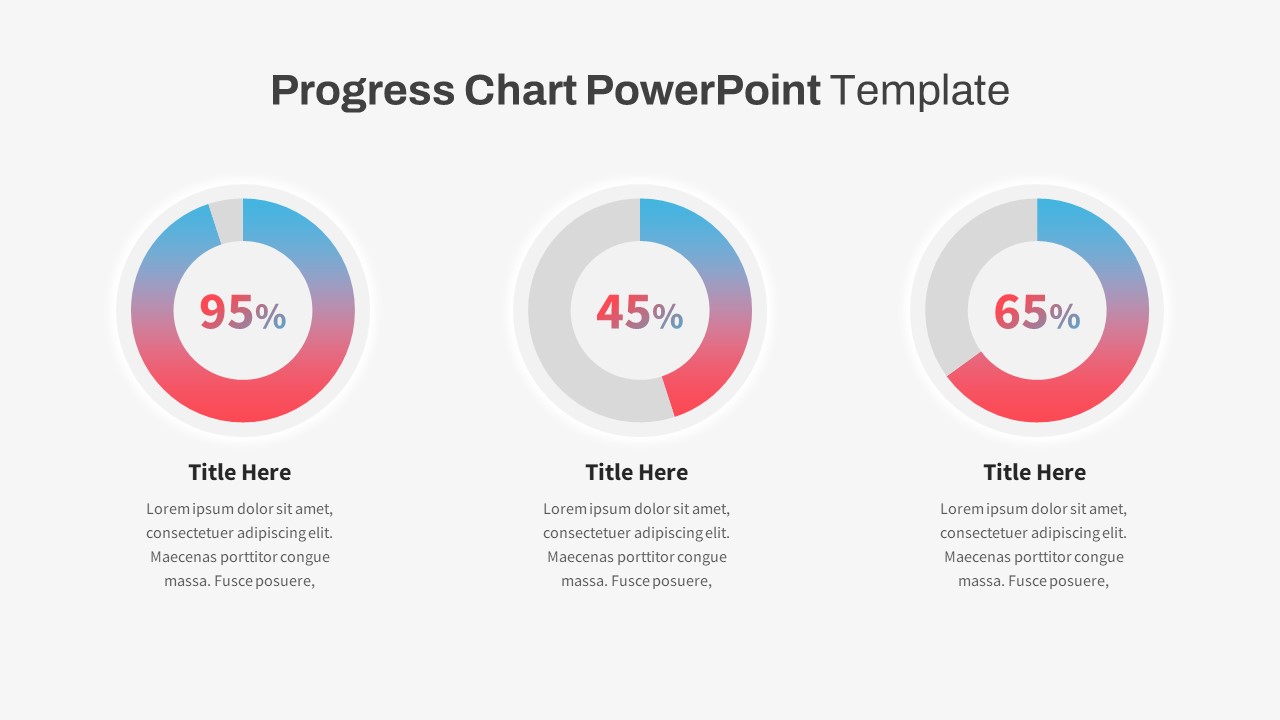
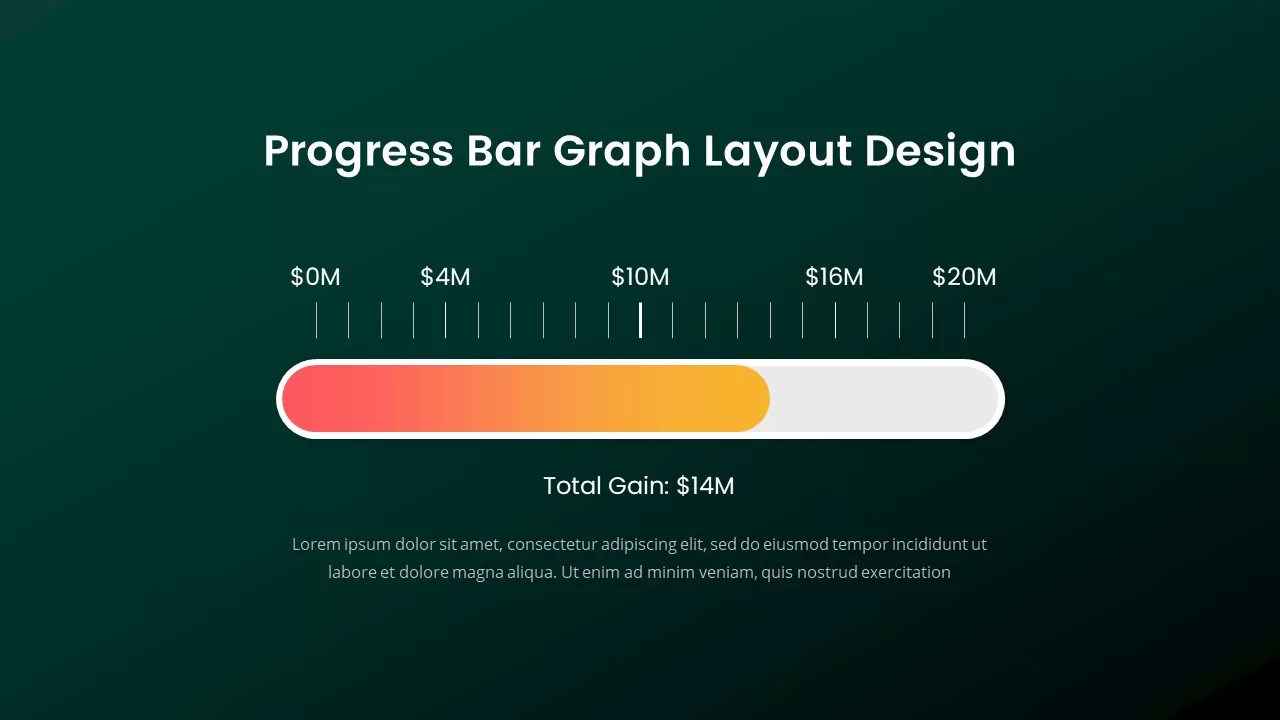
This sleek and modern progress bar graph layout design slide is perfect for showcasing data progression with clarity and style. Designed with a vibrant gradient color scheme that transitions from red to orange, the progress bar allows for easy visualization of key metrics. The backdrop features a clean and minimalistic design, with a choice of soothing color variations—light blue or dark green—offering flexibility to suit different presentation styles and themes.
Whether you need to represent project milestones, sales progress, or financial goals, this graph layout ensures that your audience can easily grasp the information. The dynamic bar clearly indicates the current total, providing an engaging and visual way to track performance over time. Accompanied by a text area for additional context, this slide provides a balanced structure for both detailed explanations and high-level overviews.
This template is perfect for business presentations, project status updates, financial reporting, or any scenario where progress needs to be clearly communicated in a concise, visual format. The slide’s simple, editable components make it easy to update values, adjust colors, or incorporate your own branding.
Who is it for
This slide is ideal for business analysts, project managers, sales teams, and financial planners who need to visually present progress or performance metrics. It’s also a useful tool for consultants, marketers, and anyone looking to display performance benchmarks or progress over time.
Other Uses
Beyond tracking project progress, this design can be used for showing any form of achievement, from fundraising goals and campaign targets to team performance or product milestones. Customize it for showcasing a range of metrics in different industries, including sales progress, product development stages, or customer engagement goals.
Login to download this file

Item ID
SB02243
Related Templates

Progress Bar Infographic for PowerPoint & Google Slides
Business
Progress Bar infographic pack for PowerPoint & Google Slides
Business
Timeline Roadmap with Progress Bar Template for PowerPoint & Google Slides
Timeline
Progress Bar and Milestone Visualization Template for PowerPoint & Google Slides
Timeline

3D Bar Graph Infographic Template for PowerPoint & Google Slides
Bar/Column
Five Options Business Bar Graph for PowerPoint & Google Slides
Business Report

Blank Bar Graph Template for PowerPoint & Google Slides
Bar/Column
iPad App Mockup with Progress Metrics Template for PowerPoint & Google Slides
Bar/Column
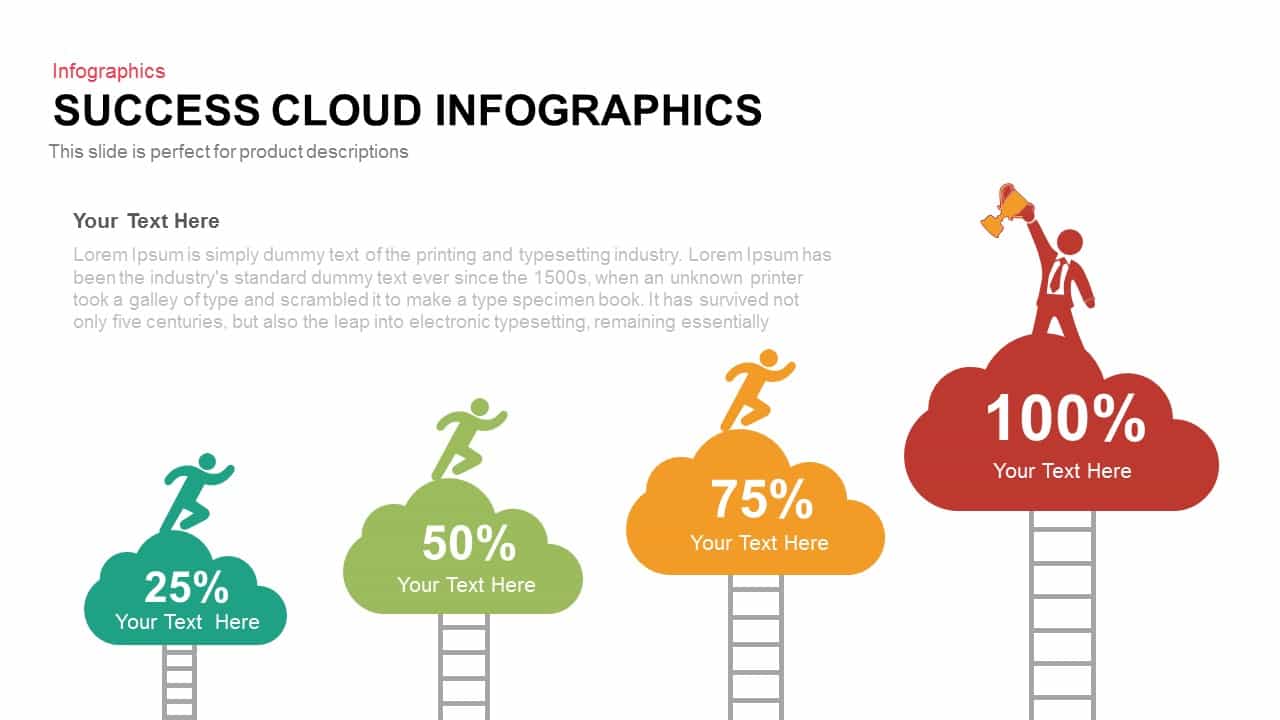
Success Cloud Progress Infographics Template for PowerPoint & Google Slides
Charts

Growth Arrow for Progress & Growth template for PowerPoint & Google Slides
Arrow
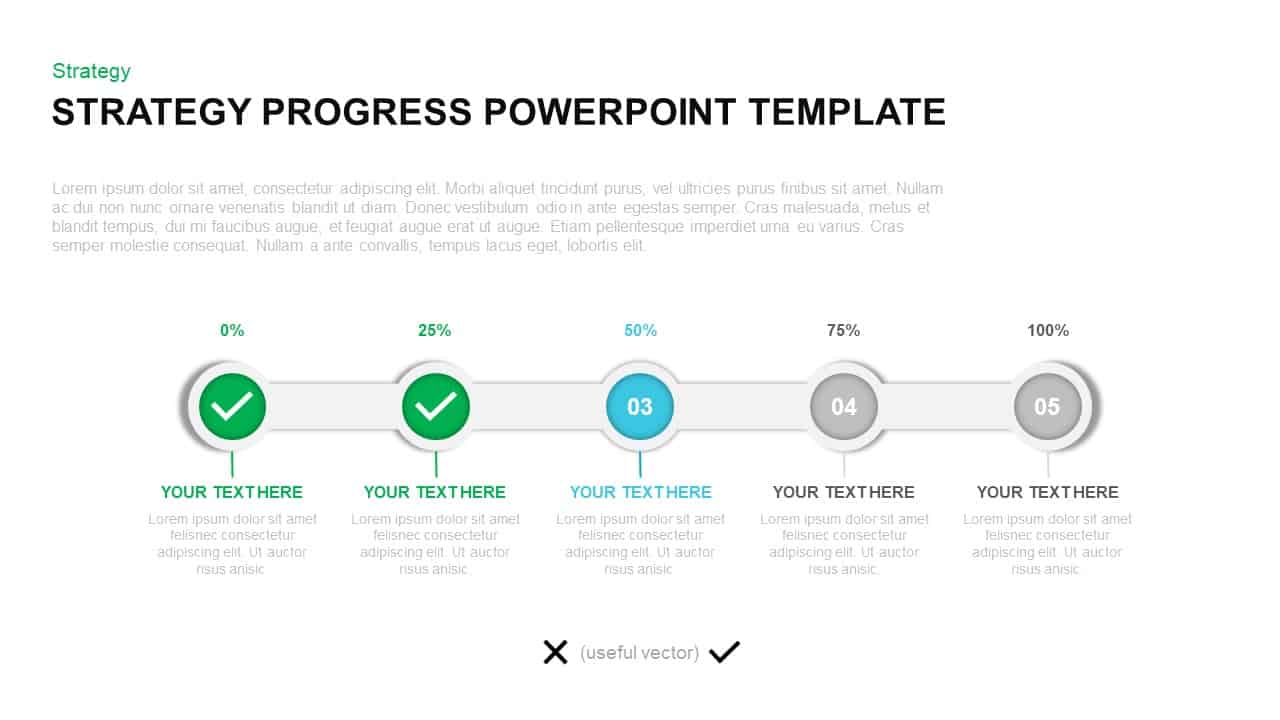
Strategy Progress Timeline Template for PowerPoint & Google Slides
Process
Performance Review Progress Management Template for PowerPoint & Google Slides
Process
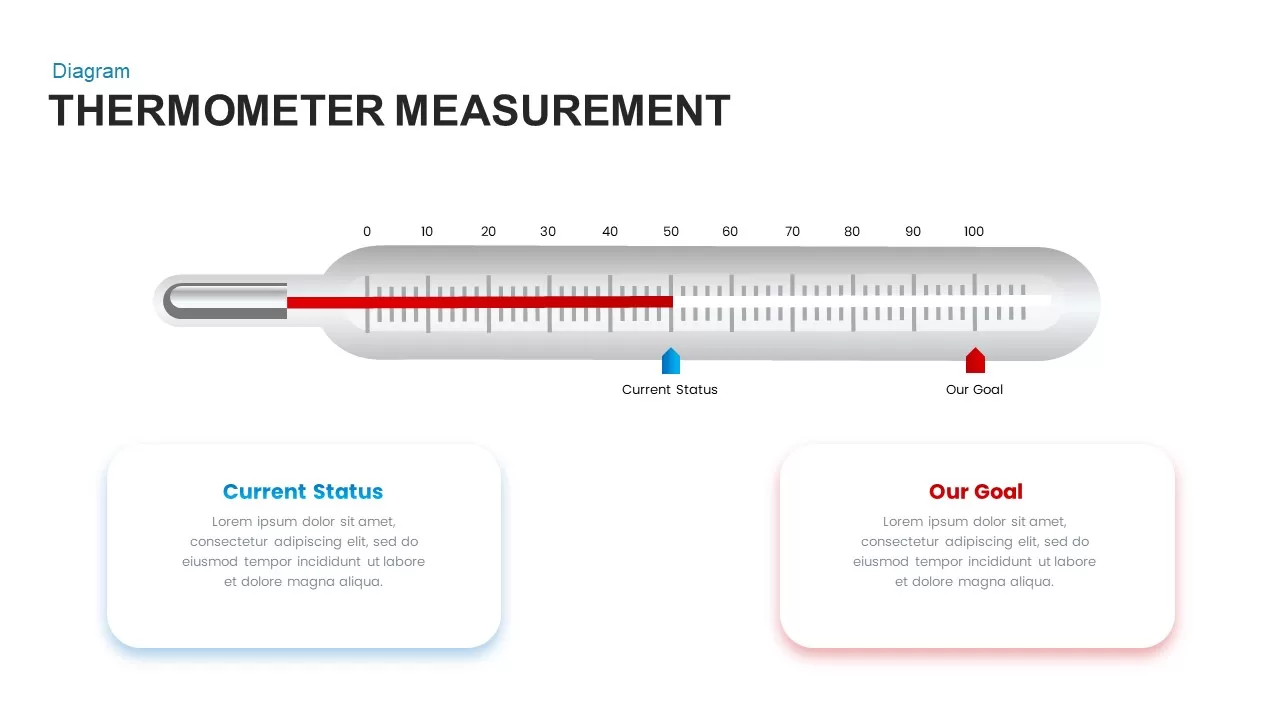
Thermometer Gauge Progress Measurement Template for PowerPoint & Google Slides
Comparison
Free Curved Arrow Progress Chart template for PowerPoint & Google Slides
Project
Free
Dynamic Statistics & Progress Charts Template for PowerPoint & Google Slides
Pie/Donut
Agriculture Infographics Slide with Progress Rings & Metrics Template for PowerPoint & Google Slides
Pie/Donut
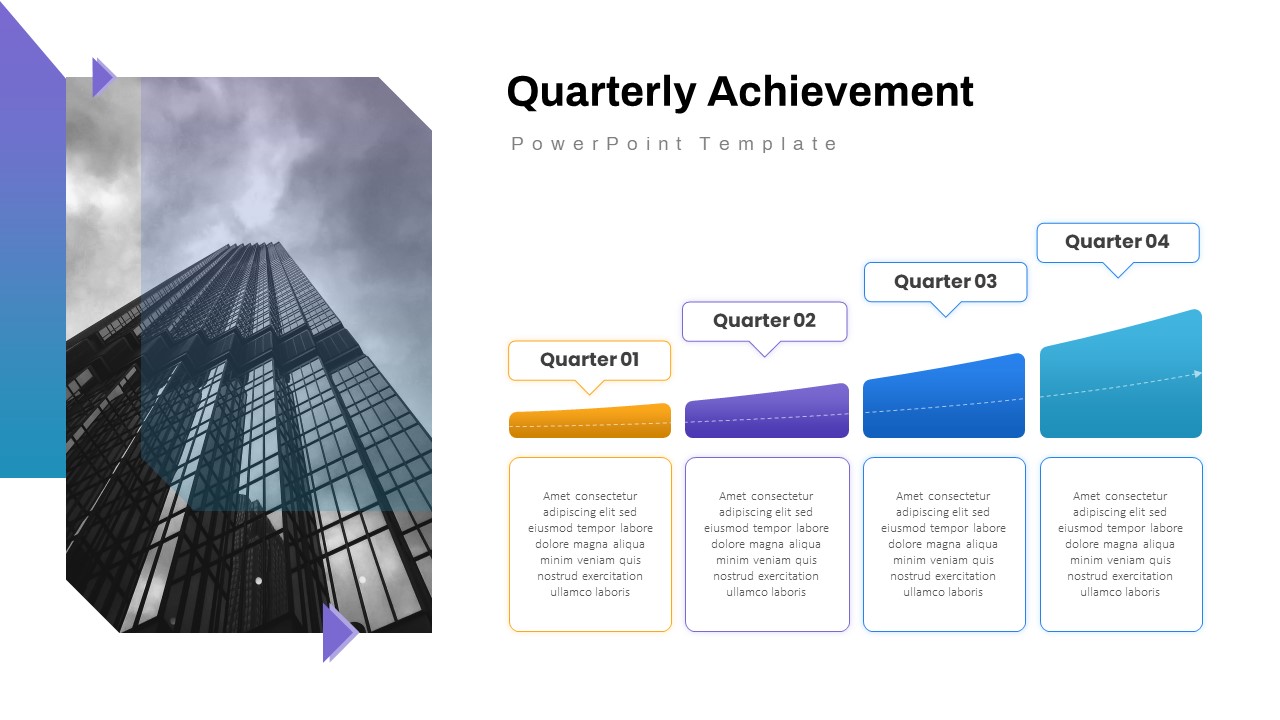
Quarterly Achievement Progress Template for PowerPoint & Google Slides
Accomplishment
Progress Chart Slide for PowerPoint & Google Slides
Charts
Project Progress Dashboard Pie Charts Template for PowerPoint & Google Slides
Project
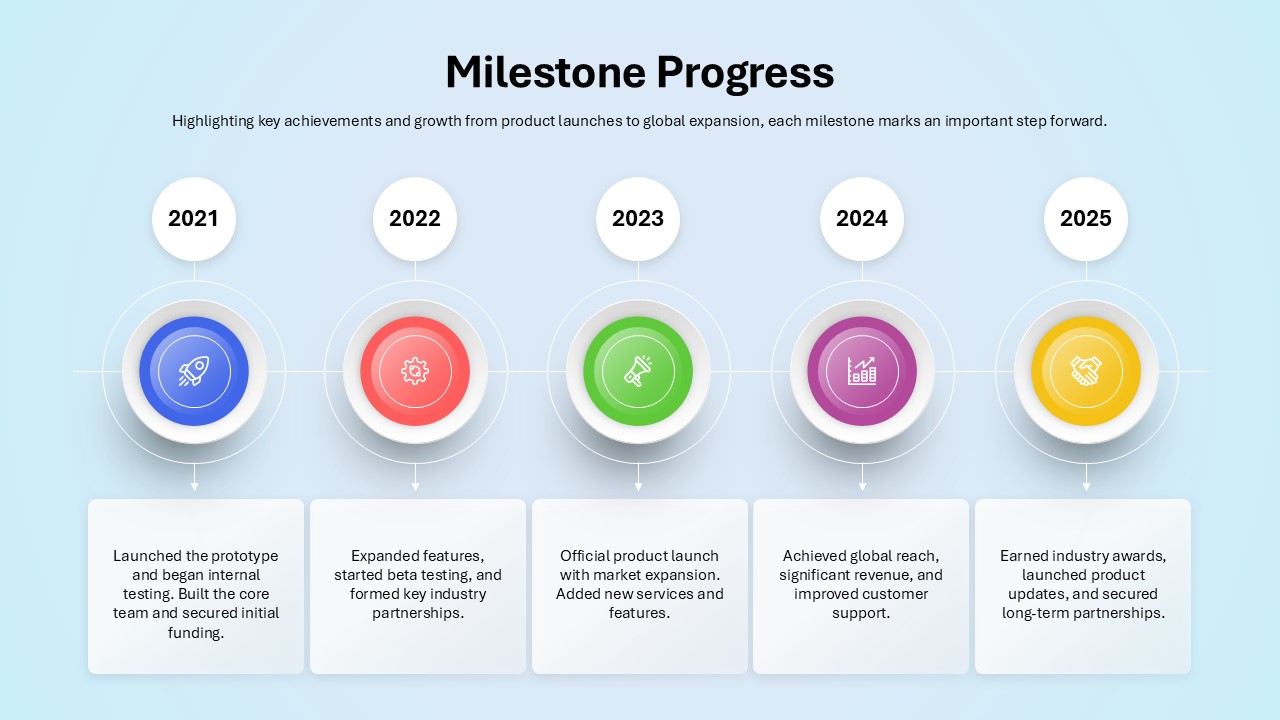
Milestone Progress template for PowerPoint & Google Slides
Business Plan
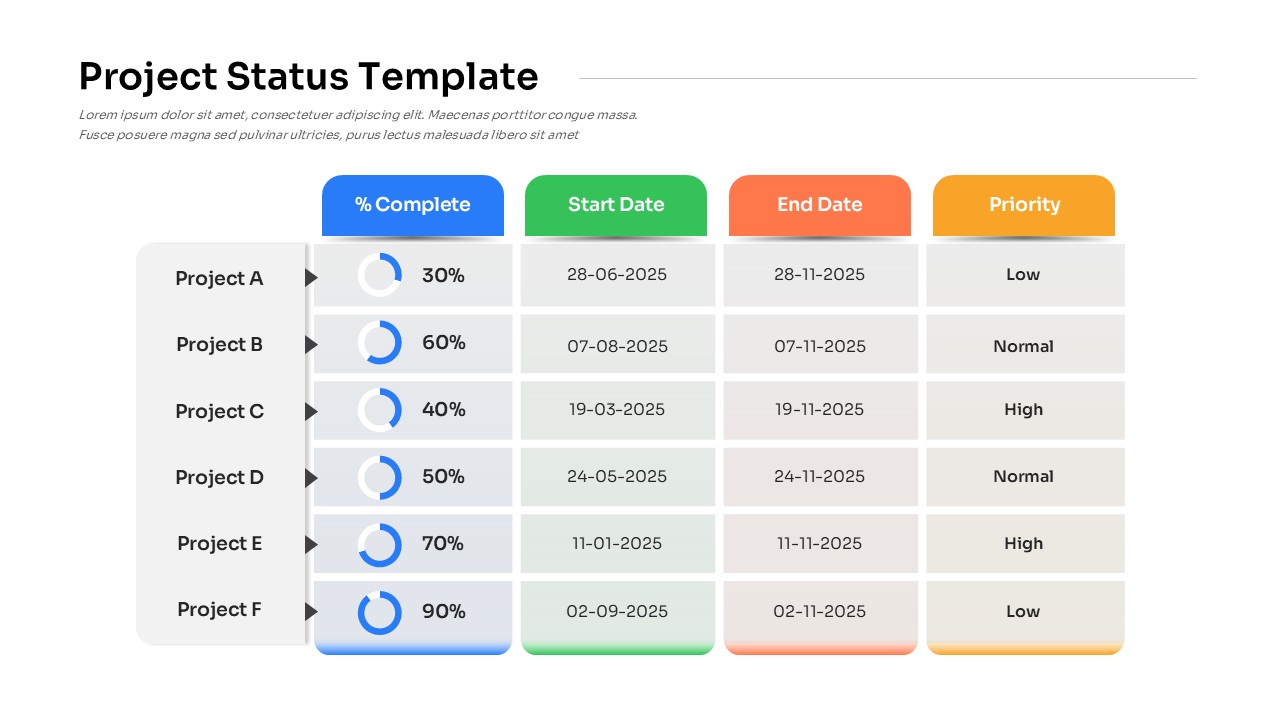
Project Status with Progress & Priority Template for PowerPoint & Google Slides
Table
Line Graph Analysis template for PowerPoint & Google Slides
Charts
Circle Graph Data Visualization Template for PowerPoint & Google Slides
Circular
Multi-Series Curved Line Graph Analytics Template for PowerPoint & Google Slides
Comparison Chart
Curved Line Graph for PowerPoint & Google Slides
Timeline
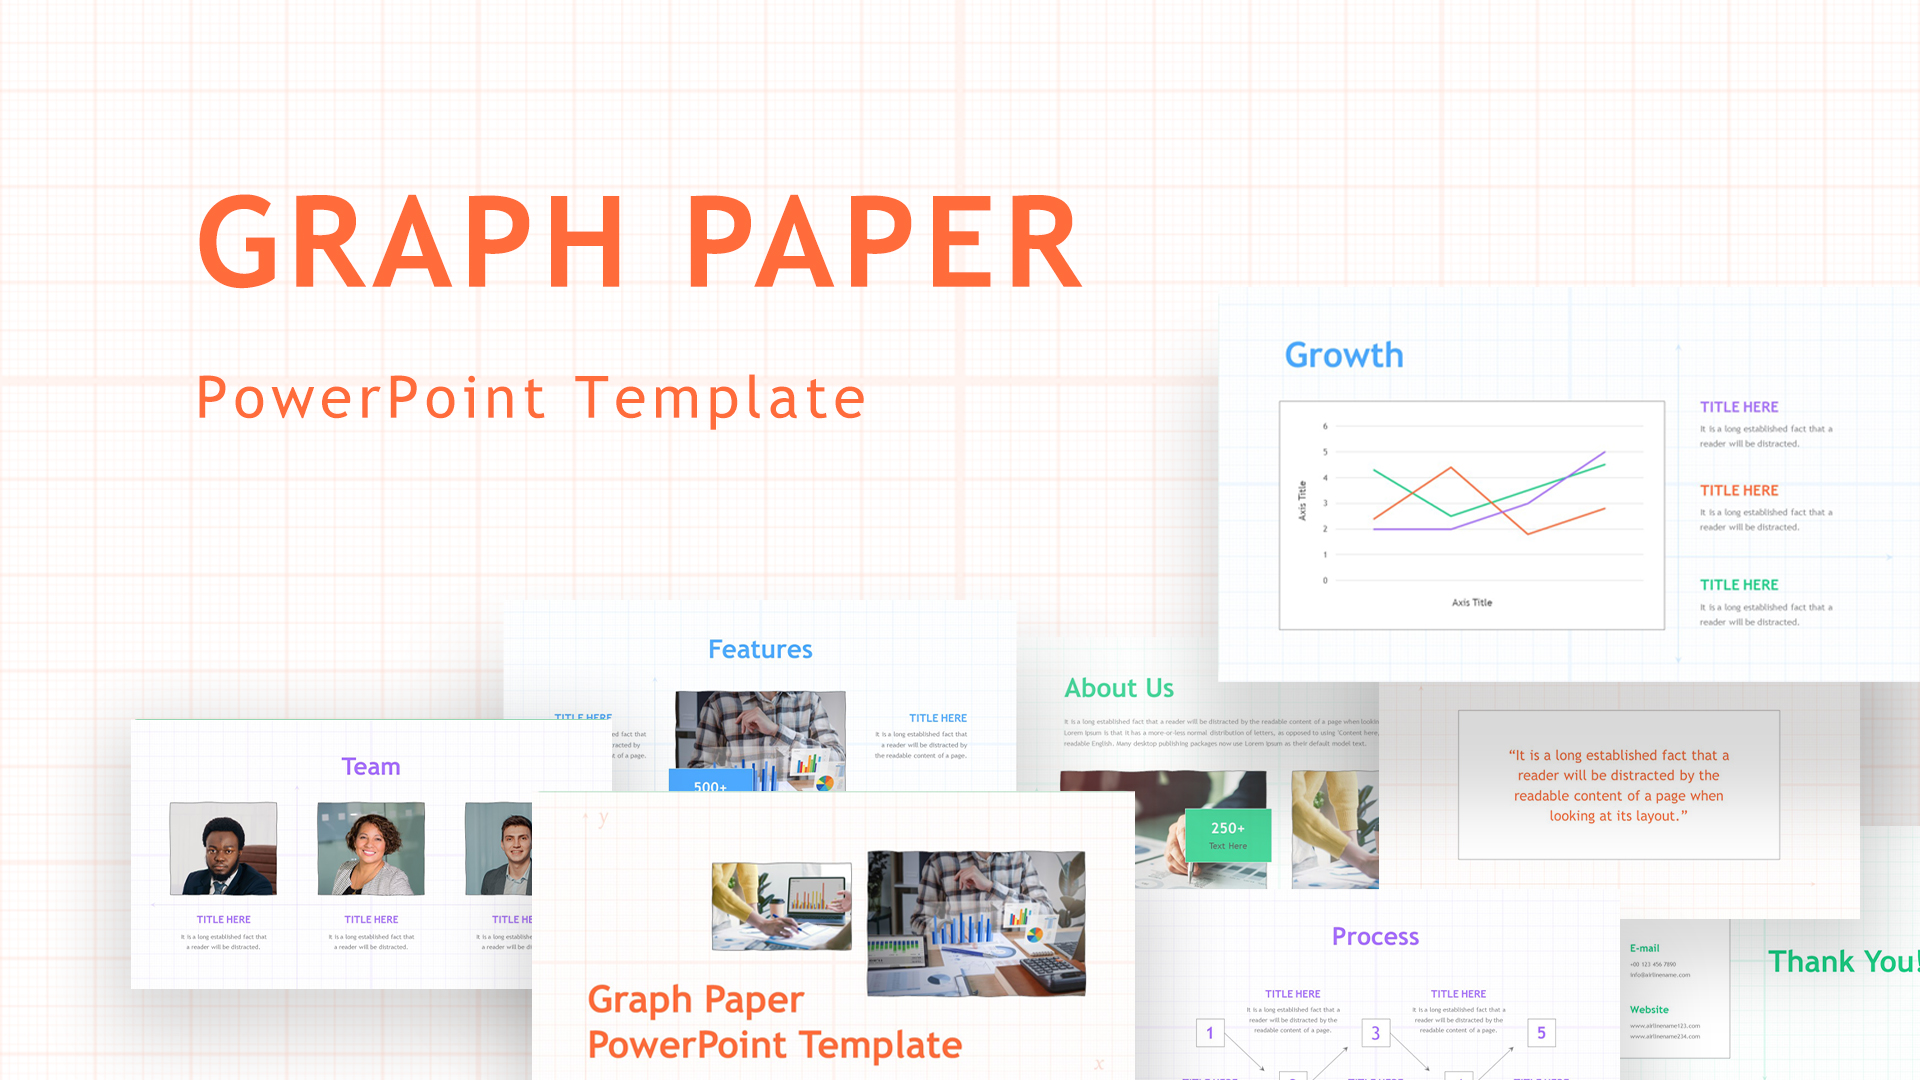
Graph Paper Background Presentation Template for PowerPoint & Google Slides
Company Profile
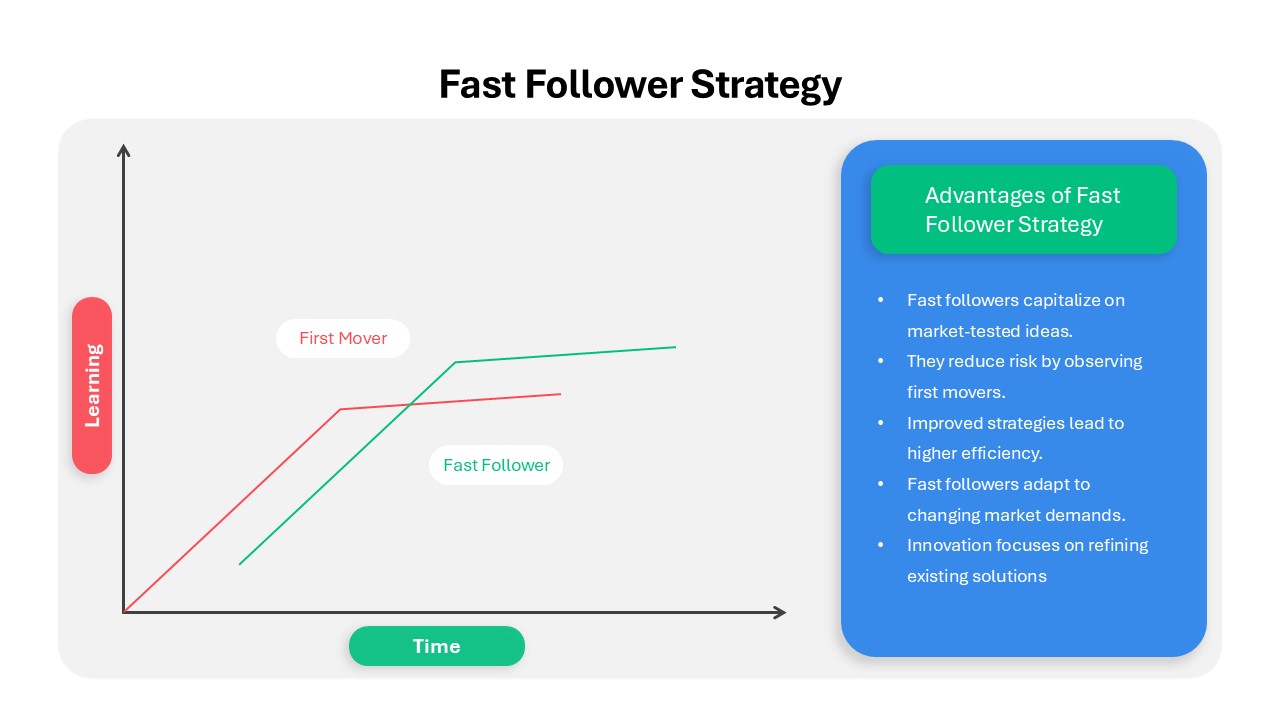
Fast Follower Strategy Line Graph Template for PowerPoint & Google Slides
Comparison Chart
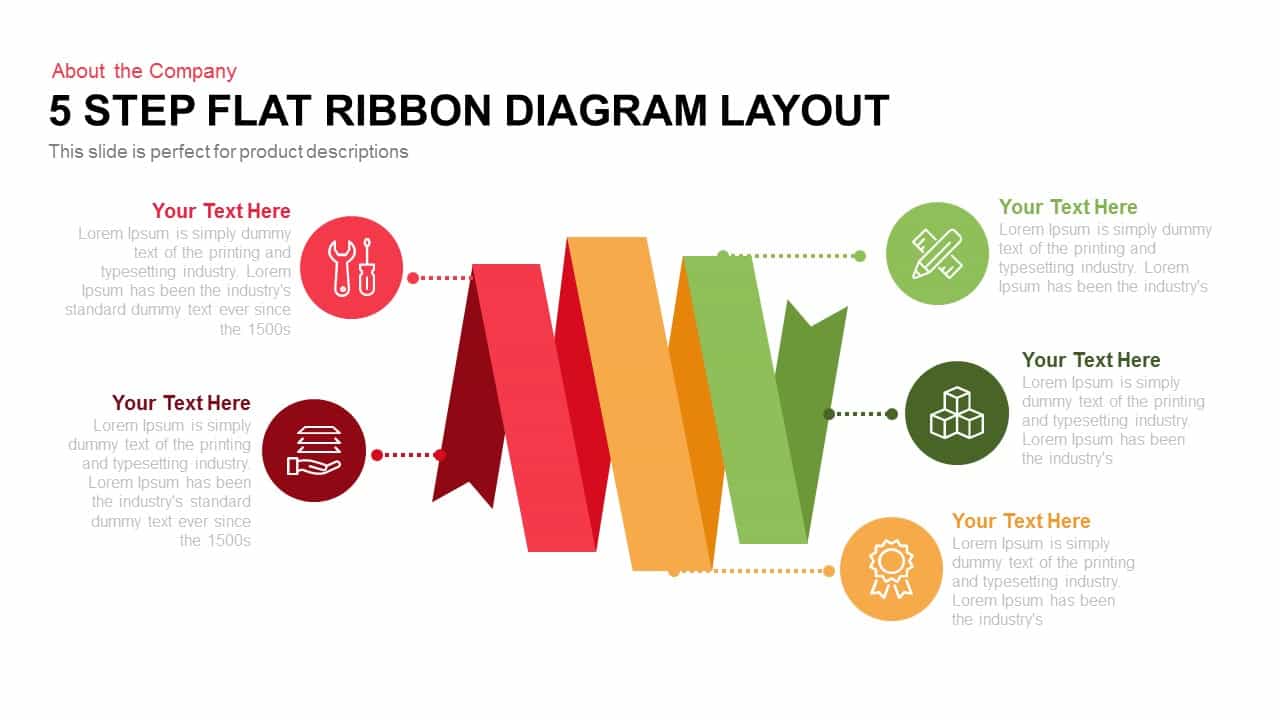
Five-Step Flat Ribbon Diagram Layout template for PowerPoint & Google Slides
Process
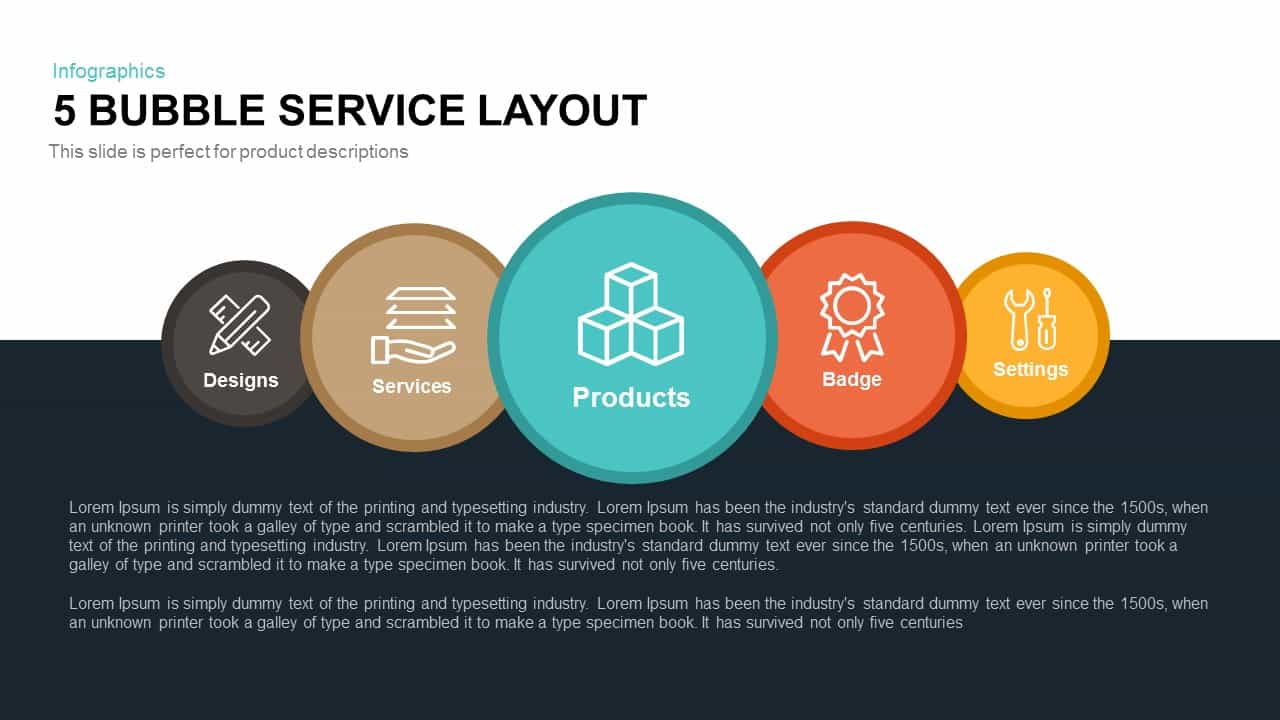
5 Bubble Service Layout Diagram Template for PowerPoint & Google Slides
Process
Multi-layout Circle Spoke Diagram Template for PowerPoint & Google Slides
Circular

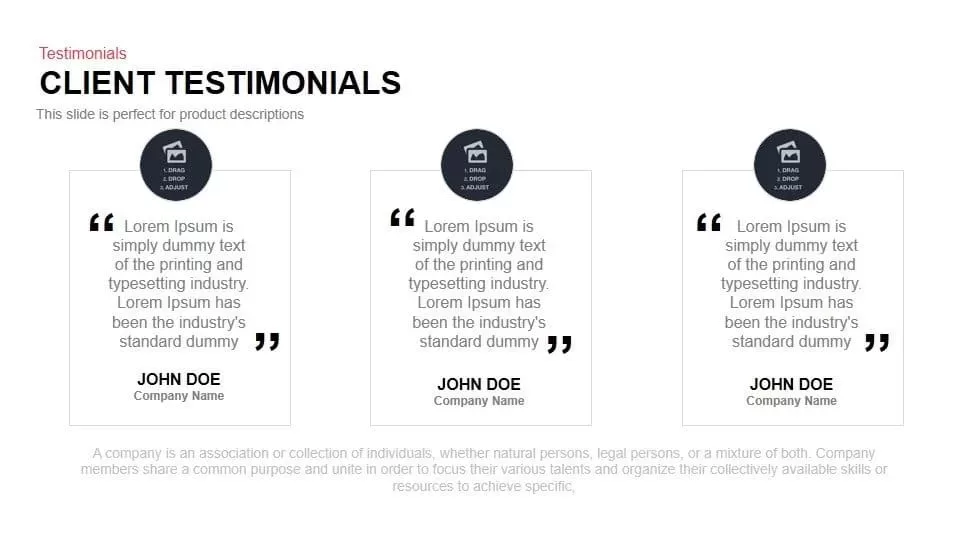
Client Testimonials Feedback Layout Template for PowerPoint & Google Slides
Infographics
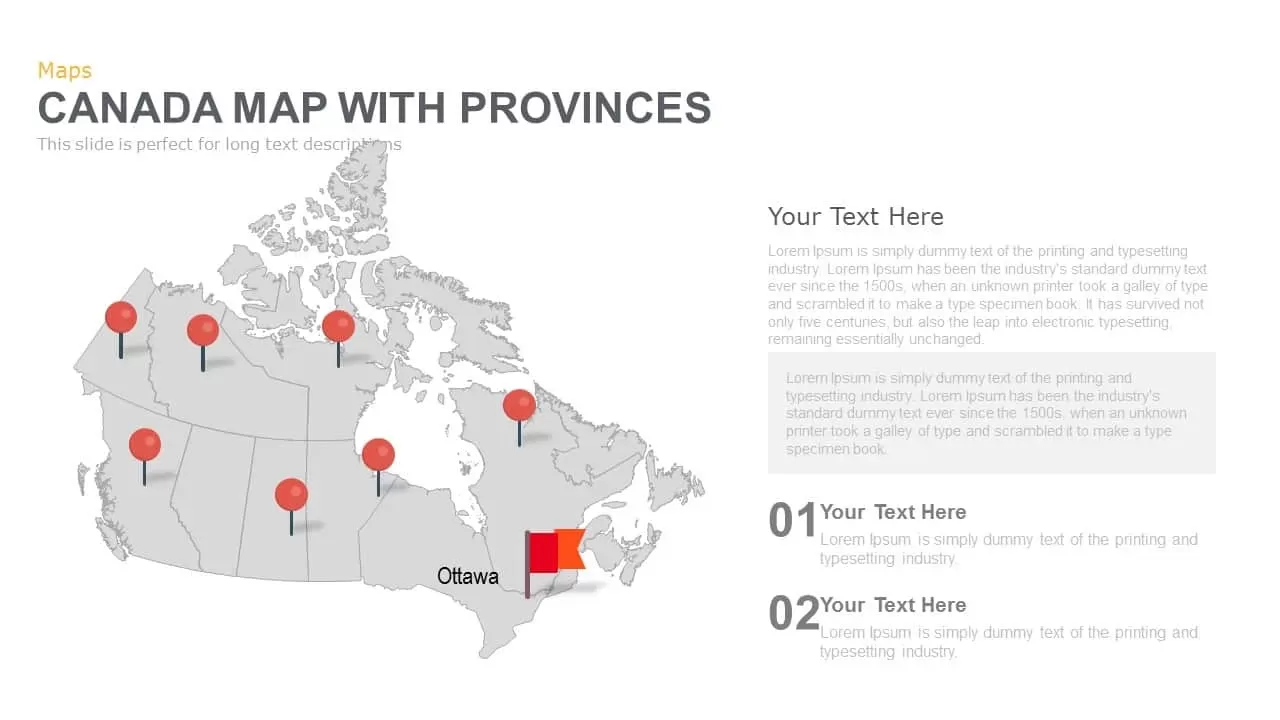
Canada Provinces Map Multi-Layout Template for PowerPoint & Google Slides
World Maps
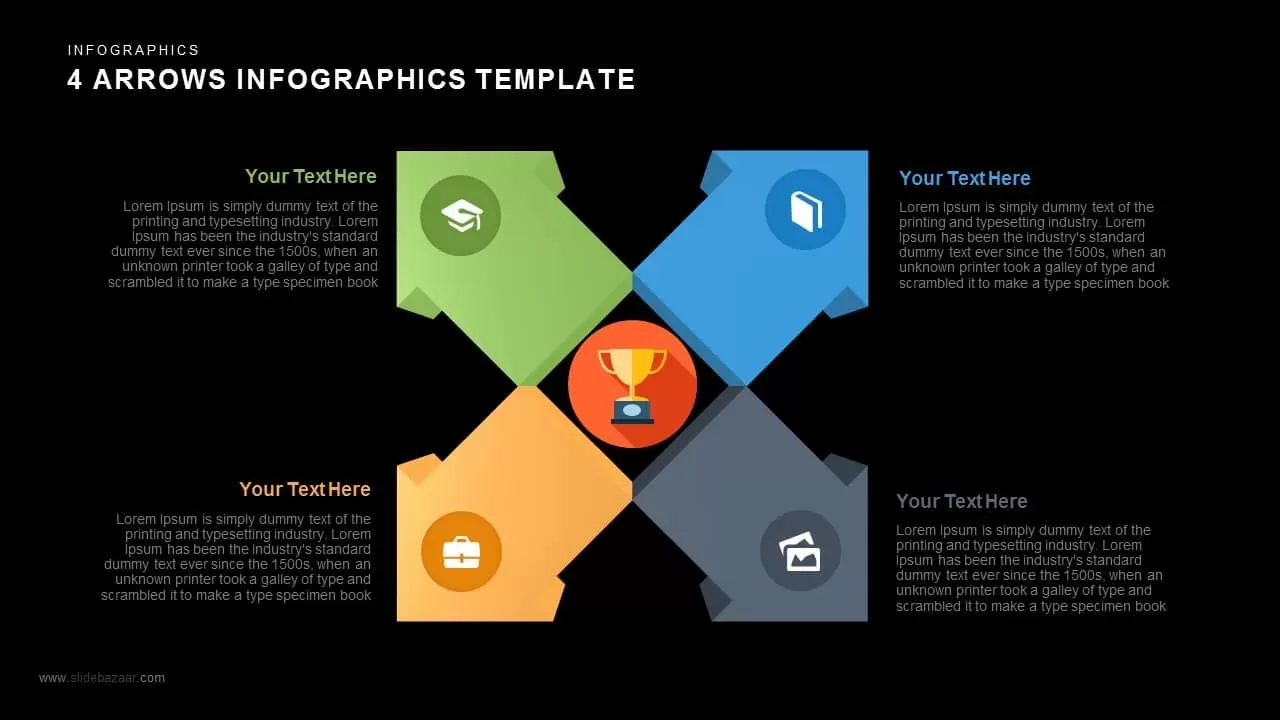
Four Arrows Layout Infographic with Icon Template for PowerPoint & Google Slides
Arrow
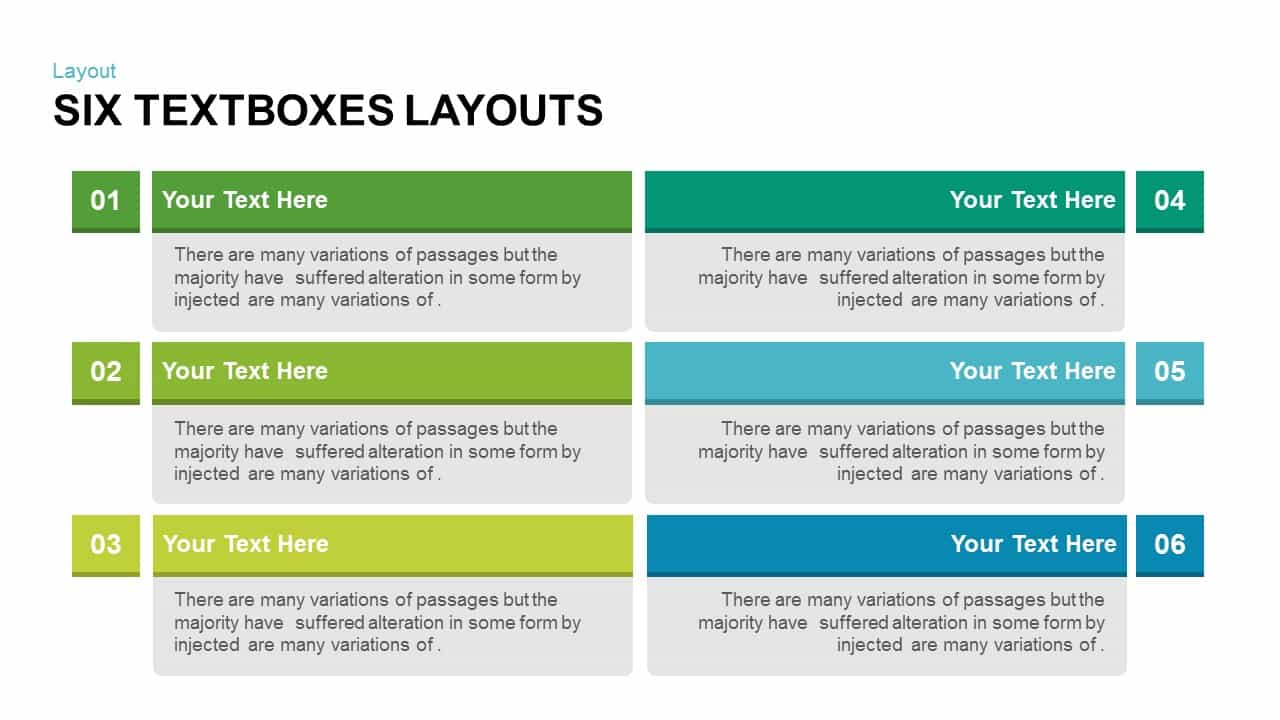
Two To Six Textbox Layout Template for PowerPoint & Google Slides
Agenda
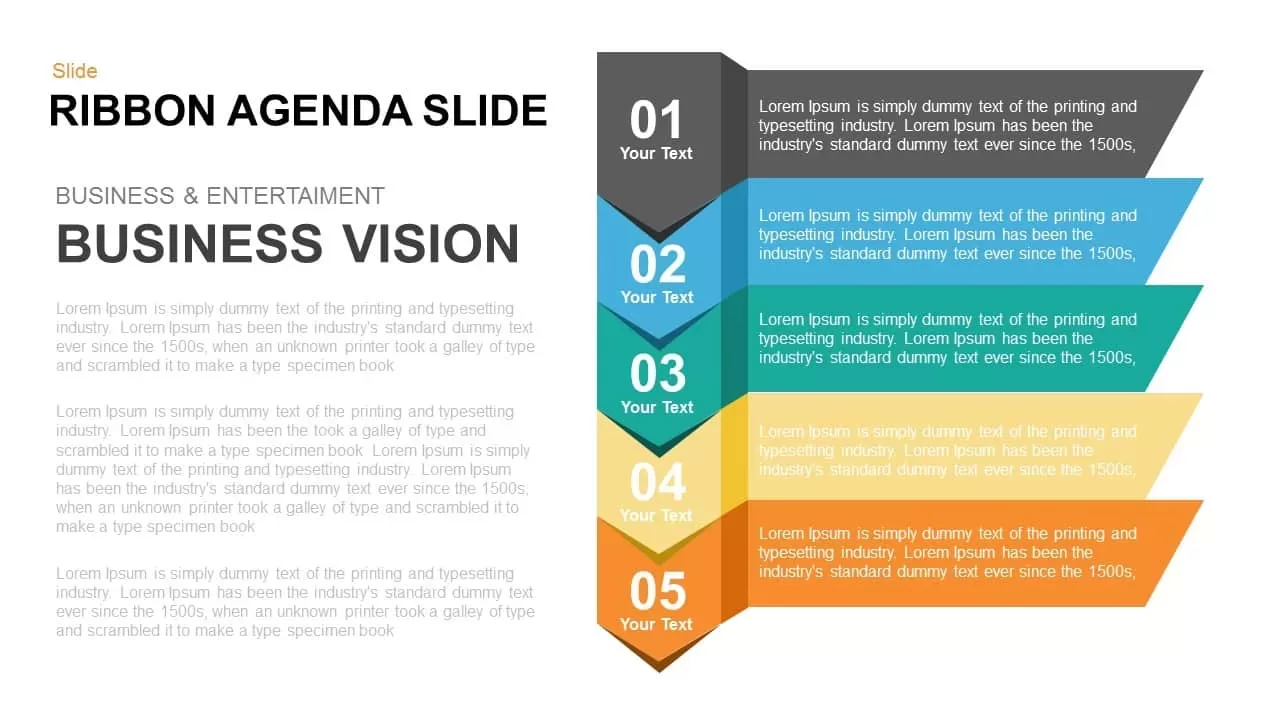
Dynamic Five-Step Ribbon Agenda Layout Template for PowerPoint & Google Slides
Agenda
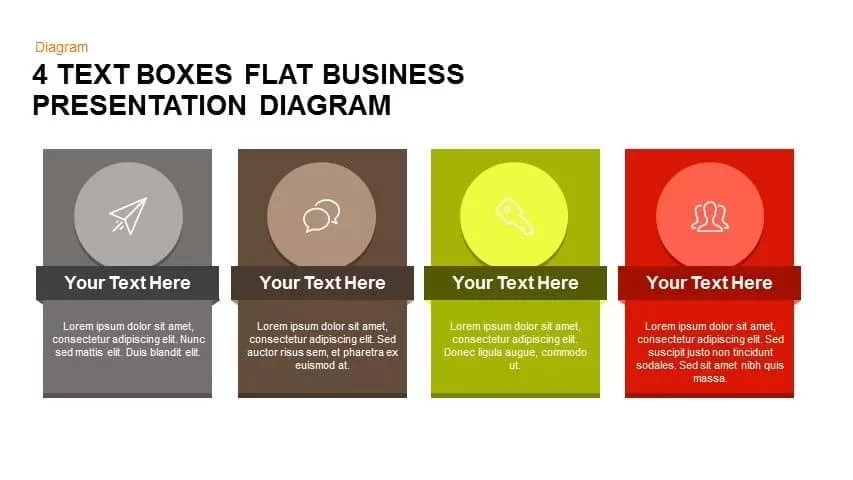
Flat Four-Box Business Layout Diagram Template for PowerPoint & Google Slides
Process
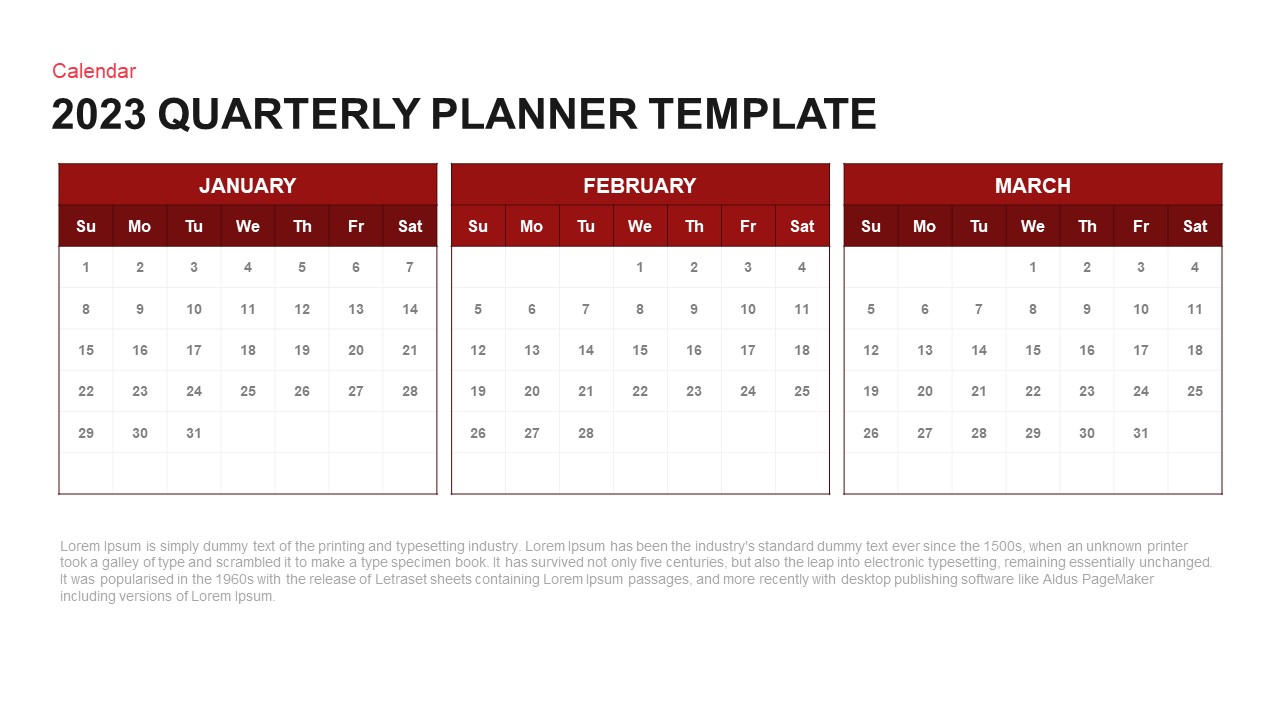
Quarterly Planner Calendar Layout Template for PowerPoint & Google Slides
Project
PESTLE Analysis Table Layout Diagram Template for PowerPoint & Google Slides
PEST
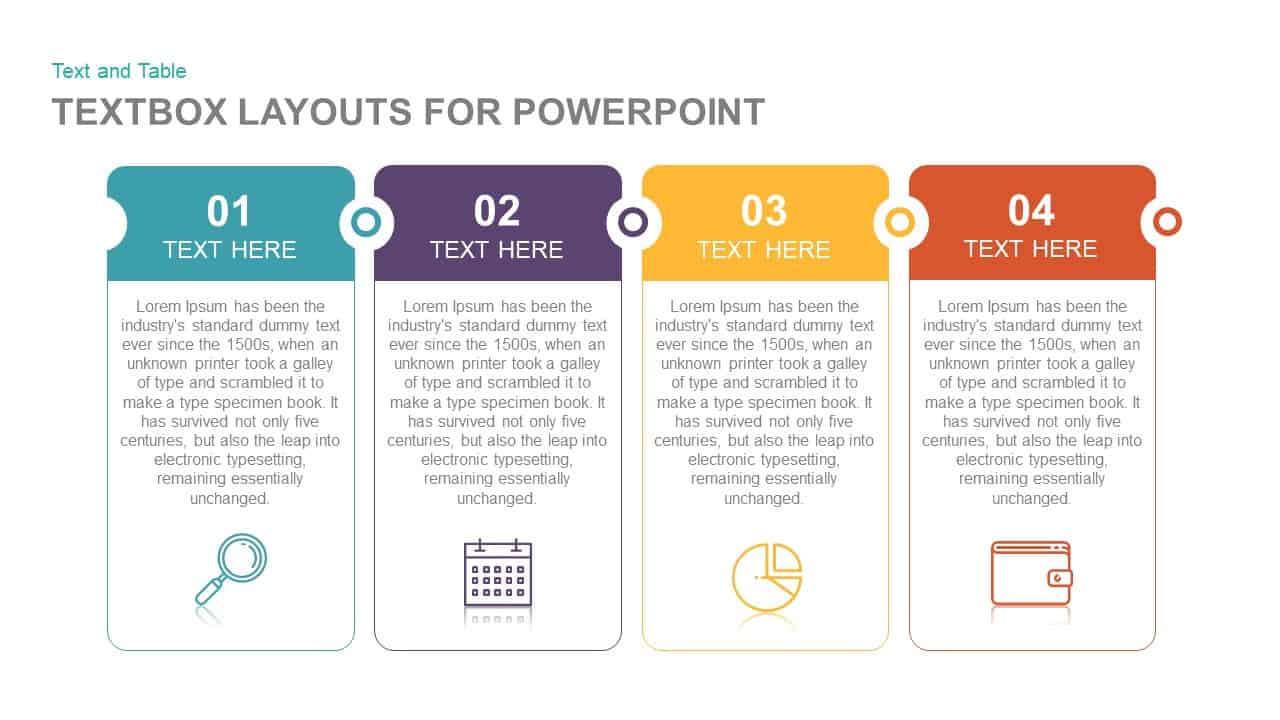
Four-Step Textbox Layout Diagram Template for PowerPoint & Google Slides
Business Report
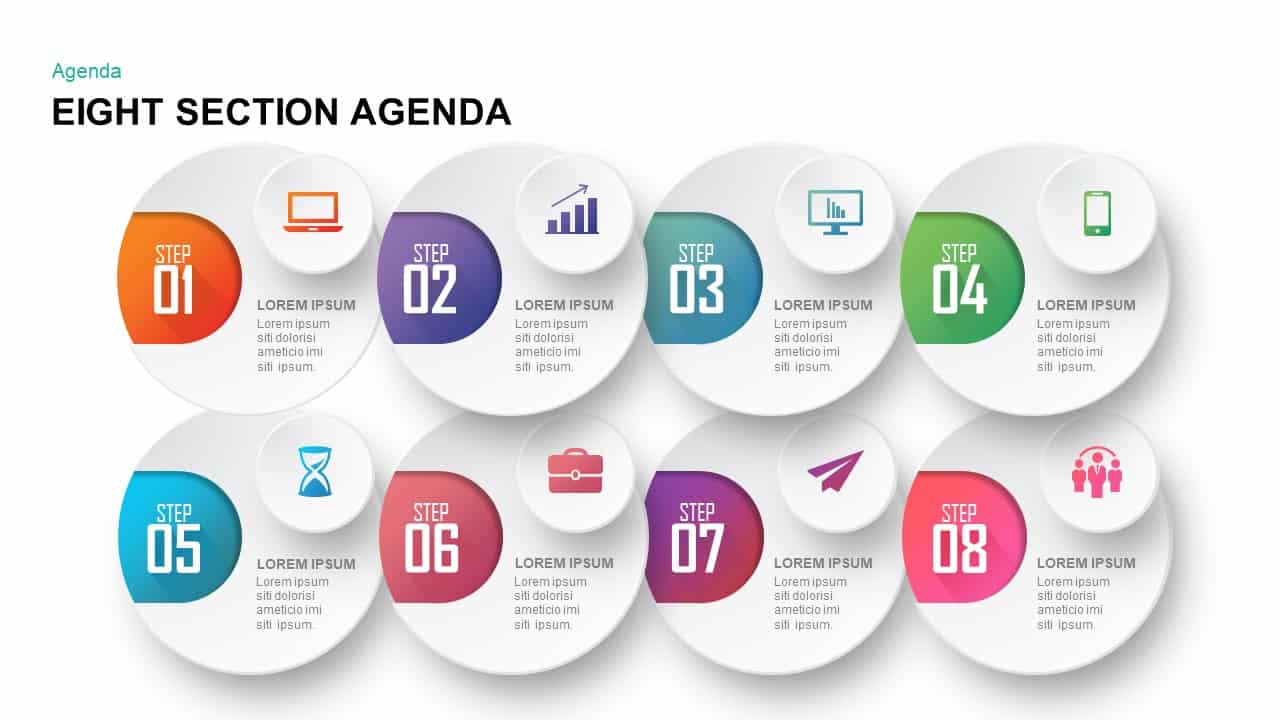
Eight Section Agenda Slide Layout Template for PowerPoint & Google Slides
Agenda
Numbered List Layout Slide Template for PowerPoint & Google Slides
Agenda
Modern 5-Stage Folder Agenda Layout Template for PowerPoint & Google Slides
Agenda
Self Presentation Resume Layout Template for PowerPoint & Google Slides
Recruitment
Free Comic Book Panel Layout Template for PowerPoint & Google Slides
Free
Free
Yearly Calendar Layout Template for PowerPoint & Google Slides
Graphics
Free
Modern Four-Step Agenda Slide Layout Template for PowerPoint & Google Slides
Agenda
Four-Step Business Agenda Slide Layout Template for PowerPoint & Google Slides
Agenda
3D Five-Step Roadmap Diagram Slide Layout Template for PowerPoint & Google Slides
Roadmap
Colorful Vertical SWOT Analysis Layout Template for PowerPoint & Google Slides
SWOT
Colorful Four-Year Timeline Layout Template for PowerPoint & Google Slides
Timeline
Staggered Five-Hexagon Agenda Layout Template for PowerPoint & Google Slides
Agenda
Colorful Five-Year Timeline Layout Template for PowerPoint & Google Slides
Timeline
Layered Circular Four-Step Agenda Slide Layout Template for PowerPoint & Google Slides
Agenda
Four-Layout Day-to-Day Operations Template for PowerPoint & Google Slides
Process
Multi-Step Infographic Process Layout Template for PowerPoint & Google Slides
Process
Six-Step Hexagon Infographic Layout Template for PowerPoint & Google Slides
Infographics
Six-Part Hexagon Infographic Layout Template for PowerPoint & Google Slides
Infographics
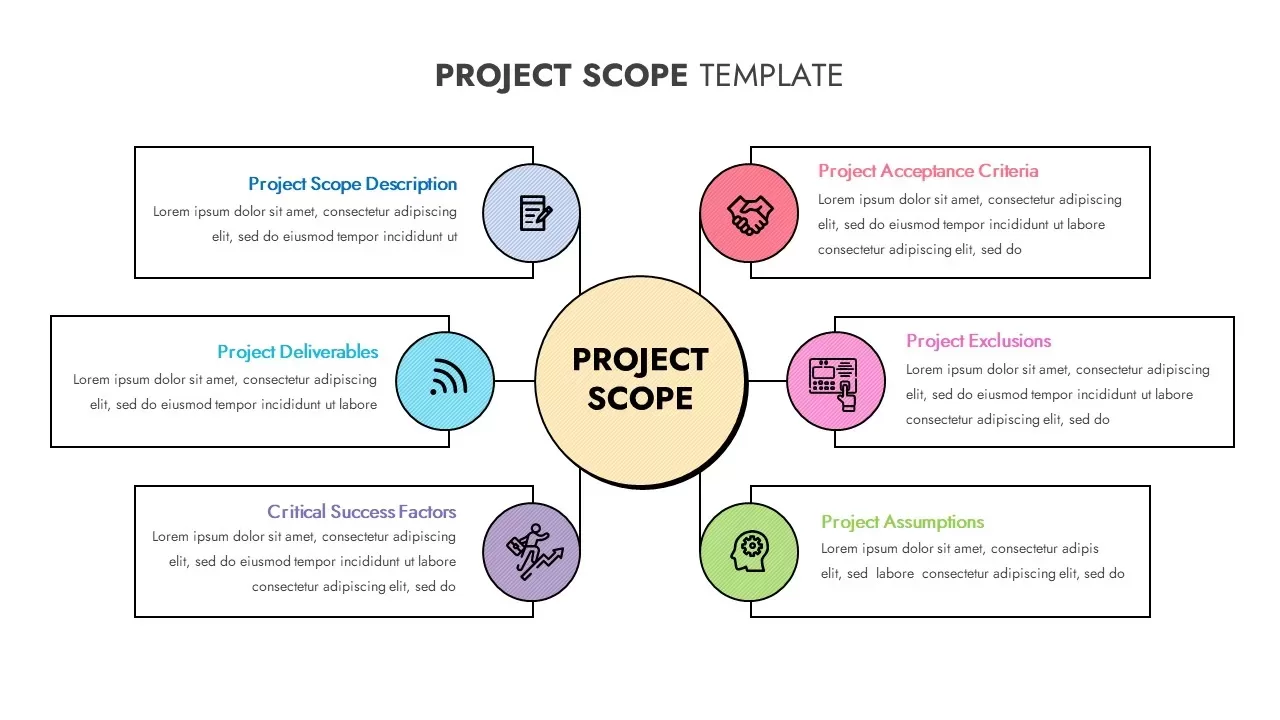
Project Scope Hub & Spoke Layout Template for PowerPoint & Google Slides
Process
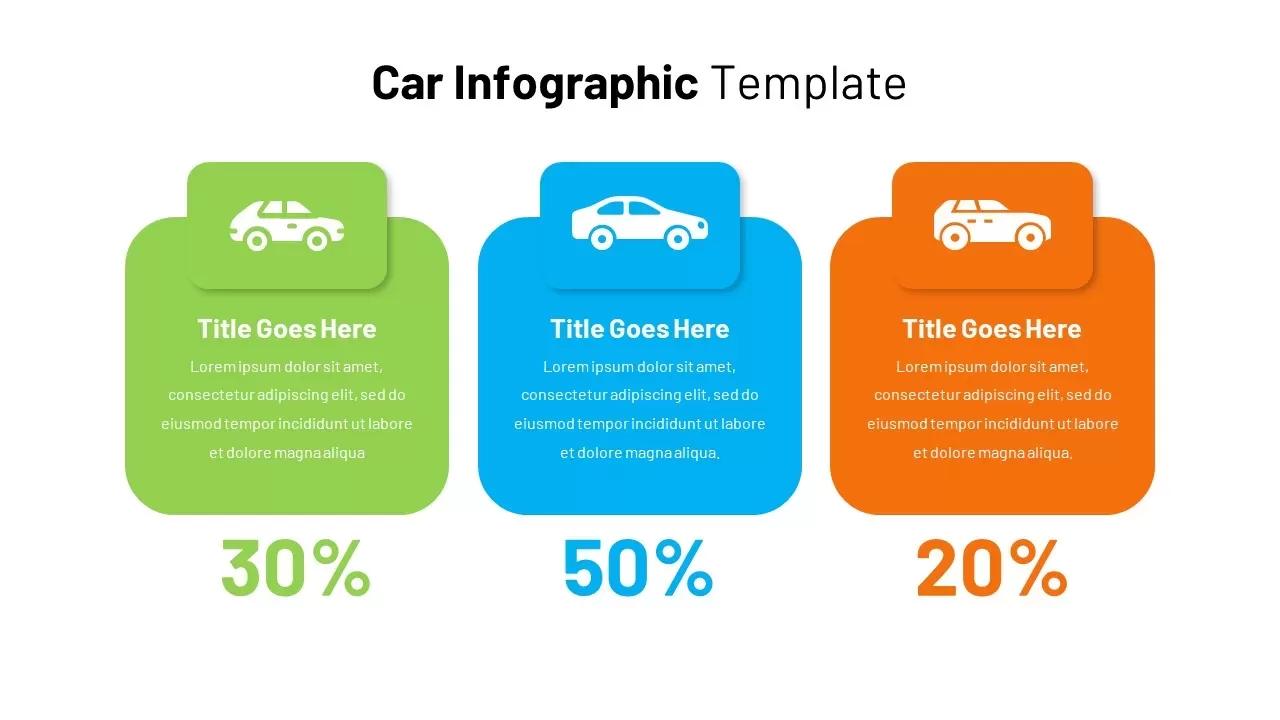
Automotive Infographic Multi-Layout Template for PowerPoint & Google Slides
Comparison
Photo Collage Slide Layout Template for PowerPoint & Google Slides
Business
Photo Gallery Team Introduction Layout Template for PowerPoint & Google Slides
Graphics
Elegant Diamond Photo Grid Layout Template for PowerPoint & Google Slides
Graphics
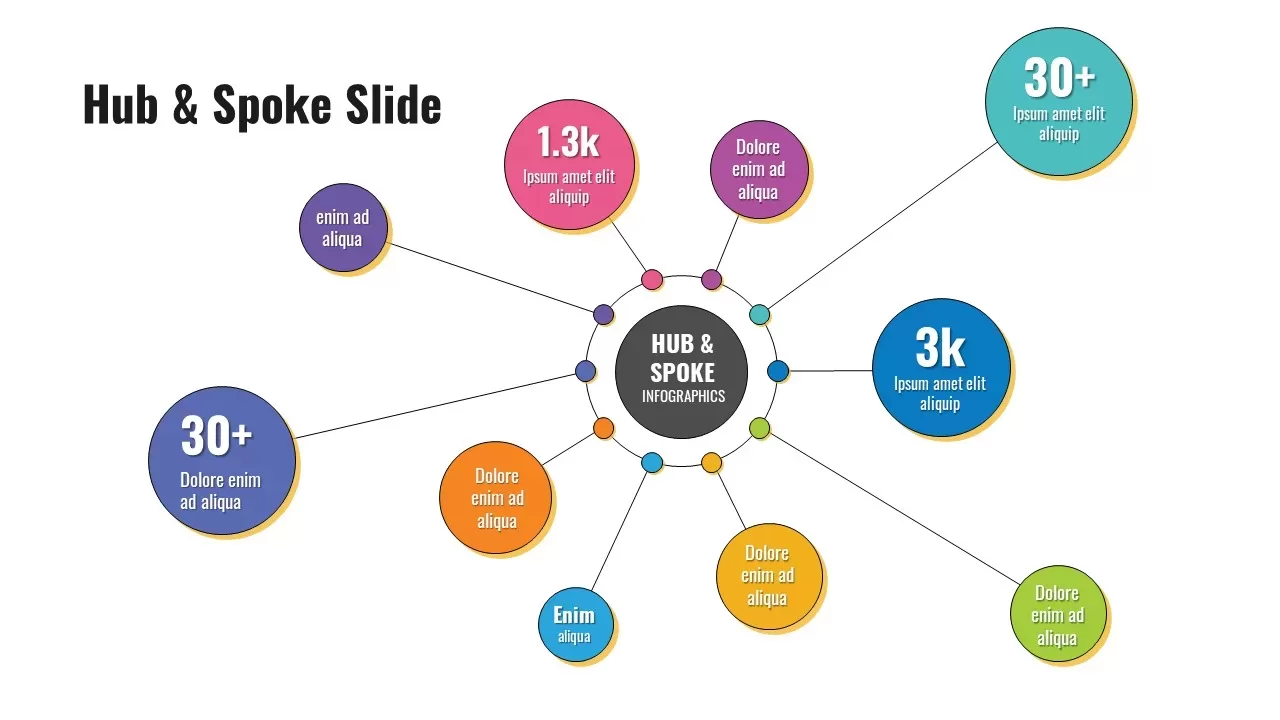
Hub-and-Spoke Infographic Layout Template for PowerPoint & Google Slides
Circular
Modern Mosaic Photo Grid Layout Template for PowerPoint & Google Slides
Graphics
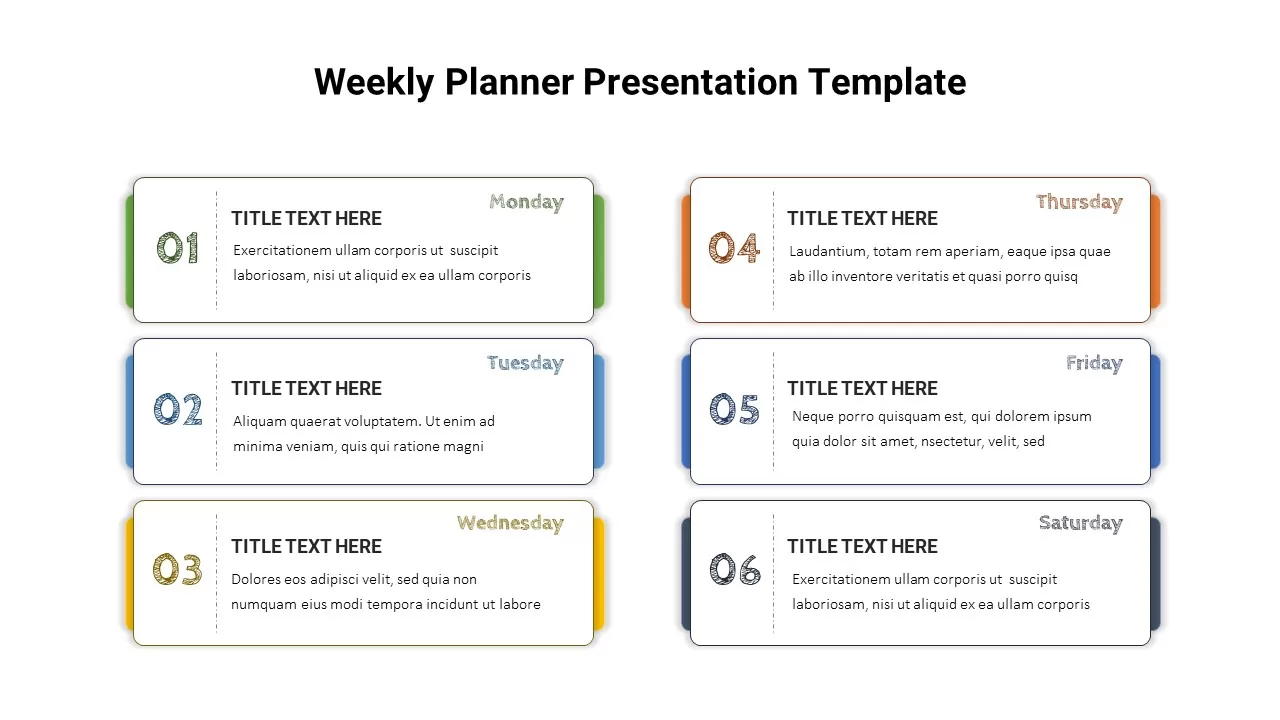
Six-Day Weekly Planner Layout Template for PowerPoint & Google Slides
Infographics
Creative Photo Collage Grid Layout Template for PowerPoint & Google Slides
Graphics
Dark Photo Collage Gallery Layout Template for PowerPoint & Google Slides
Graphics
Green Photo Collage Masonry Layout Template for PowerPoint & Google Slides
Graphics
Elegant Stacked Photo Collage Layout Template for PowerPoint & Google Slides
Graphics
Dessert Photo Collage Grid Layout Template for PowerPoint & Google Slides
Graphics
Modern Cosmetics Photo Collage Layout Template for PowerPoint & Google Slides
Graphics
Circular Organizational Structure Layout Template for PowerPoint & Google Slides
Org Chart
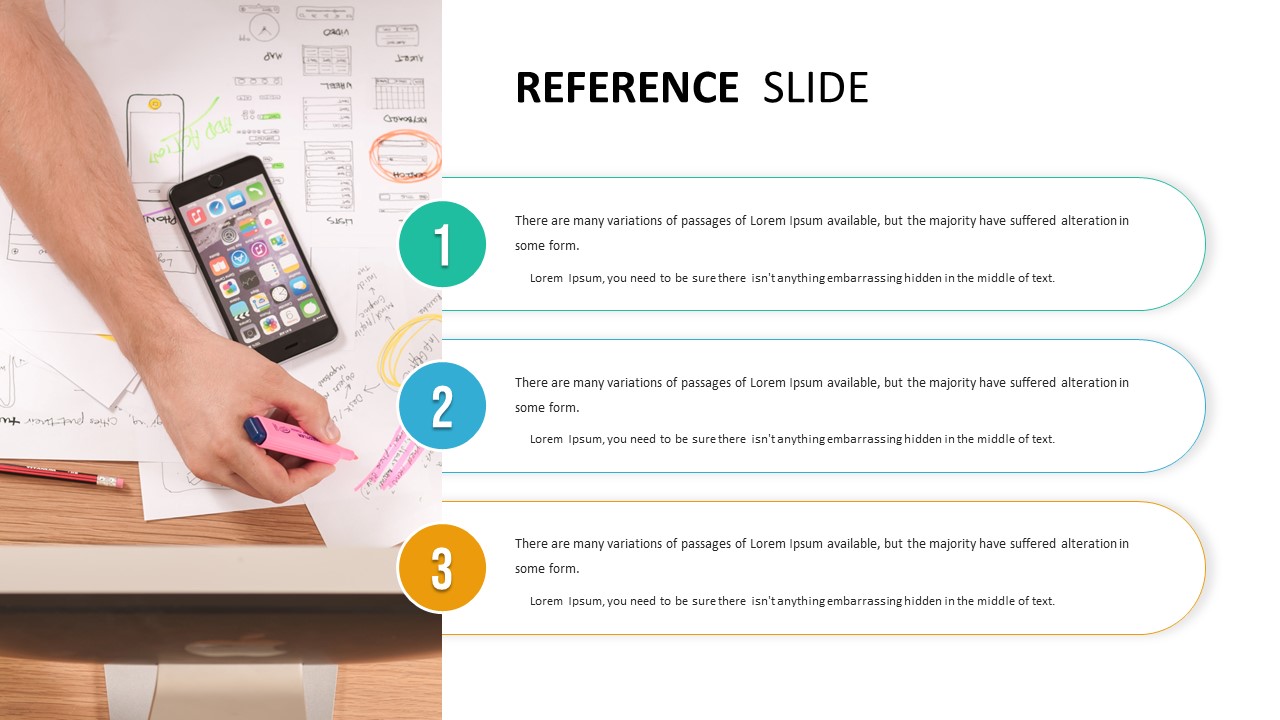
Three-Step Reference Slide Layout Template for PowerPoint & Google Slides
Infographics
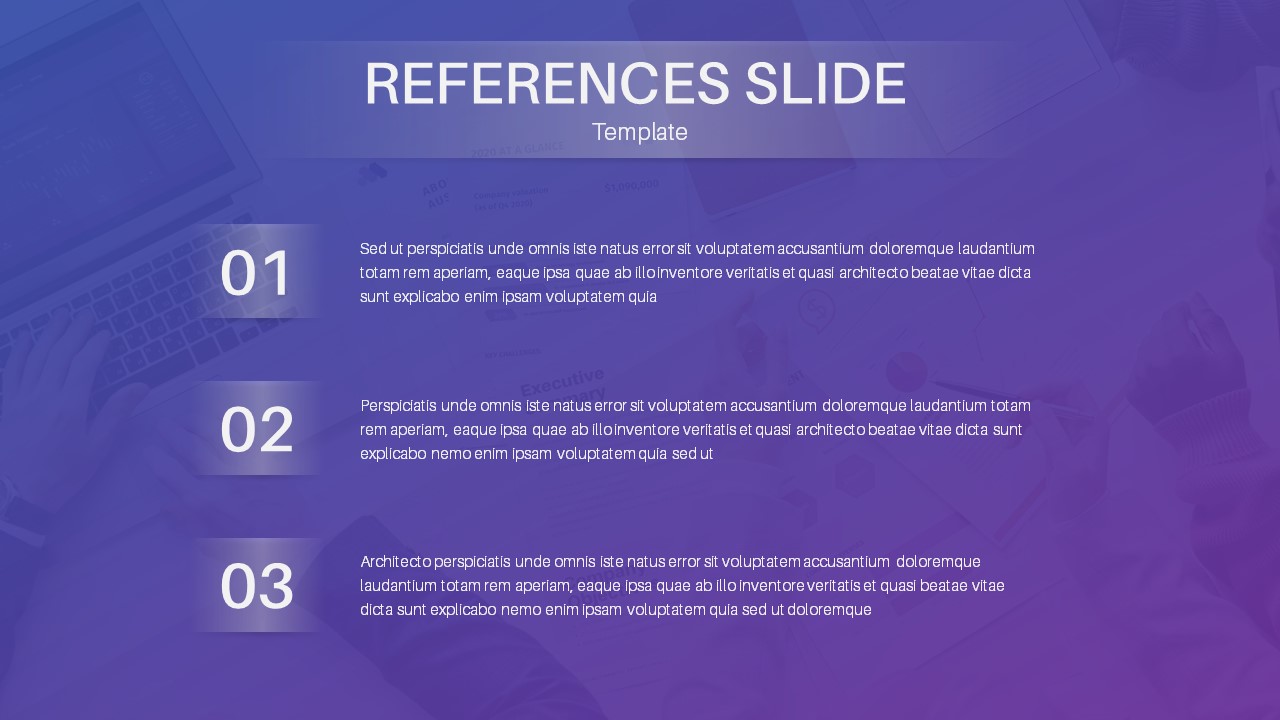
Professional References Slide Layout Template for PowerPoint & Google Slides
Infographics
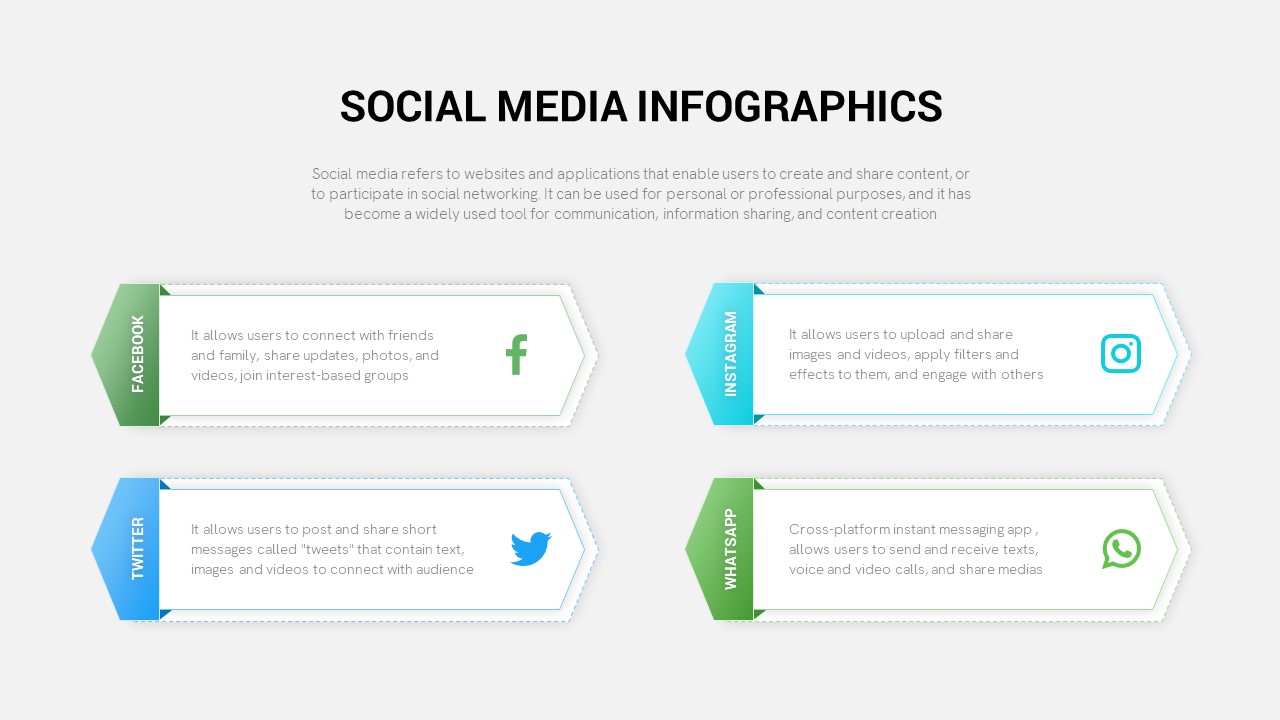
Social Media Infographic Arrow Layout Template for PowerPoint & Google Slides
Arrow
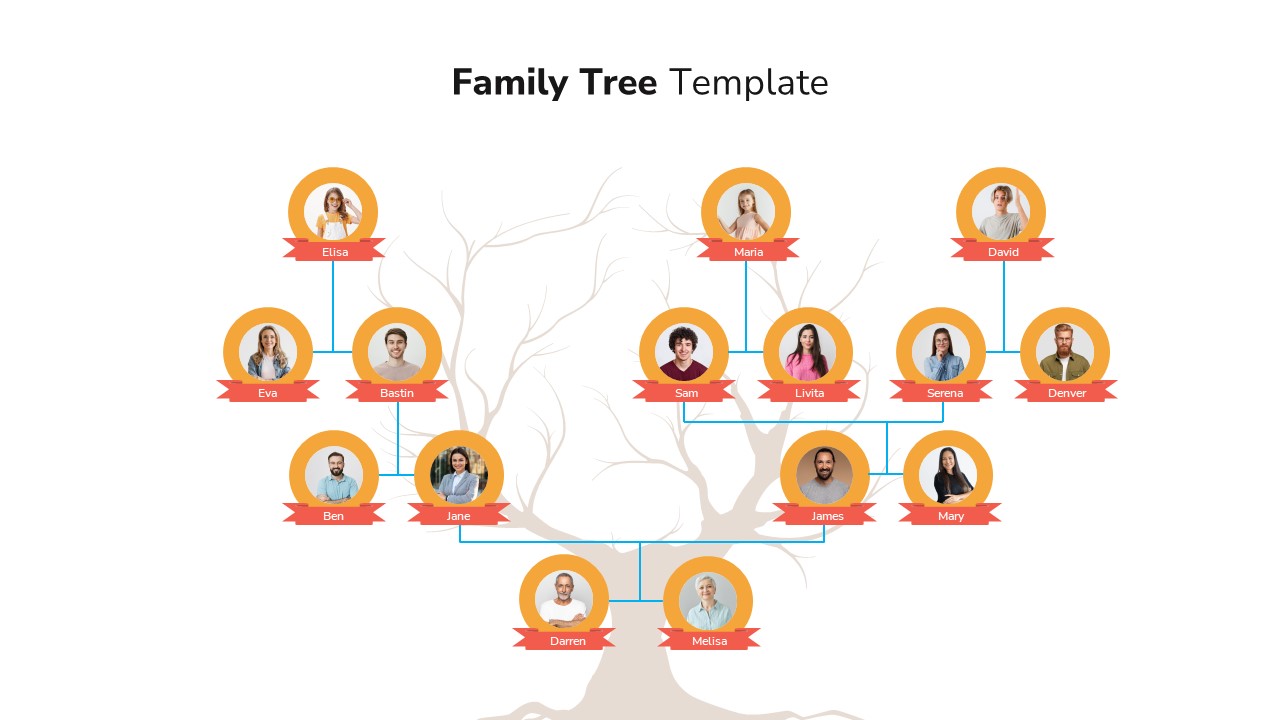
Classic Family Tree Diagram Layout Template for PowerPoint & Google Slides
Infographics
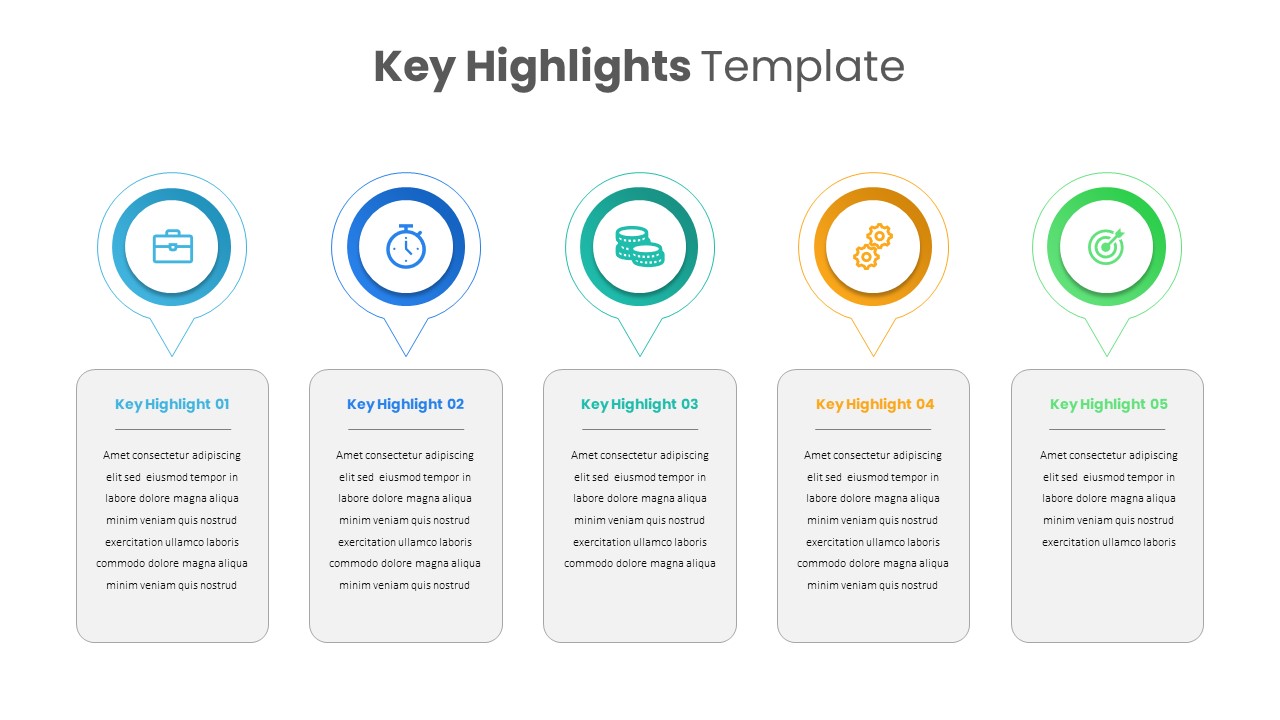
Professional Key Highlights Layout Template for PowerPoint & Google Slides
Business
Professional Quad Chart Layout Template for PowerPoint & Google Slides
Pie/Donut
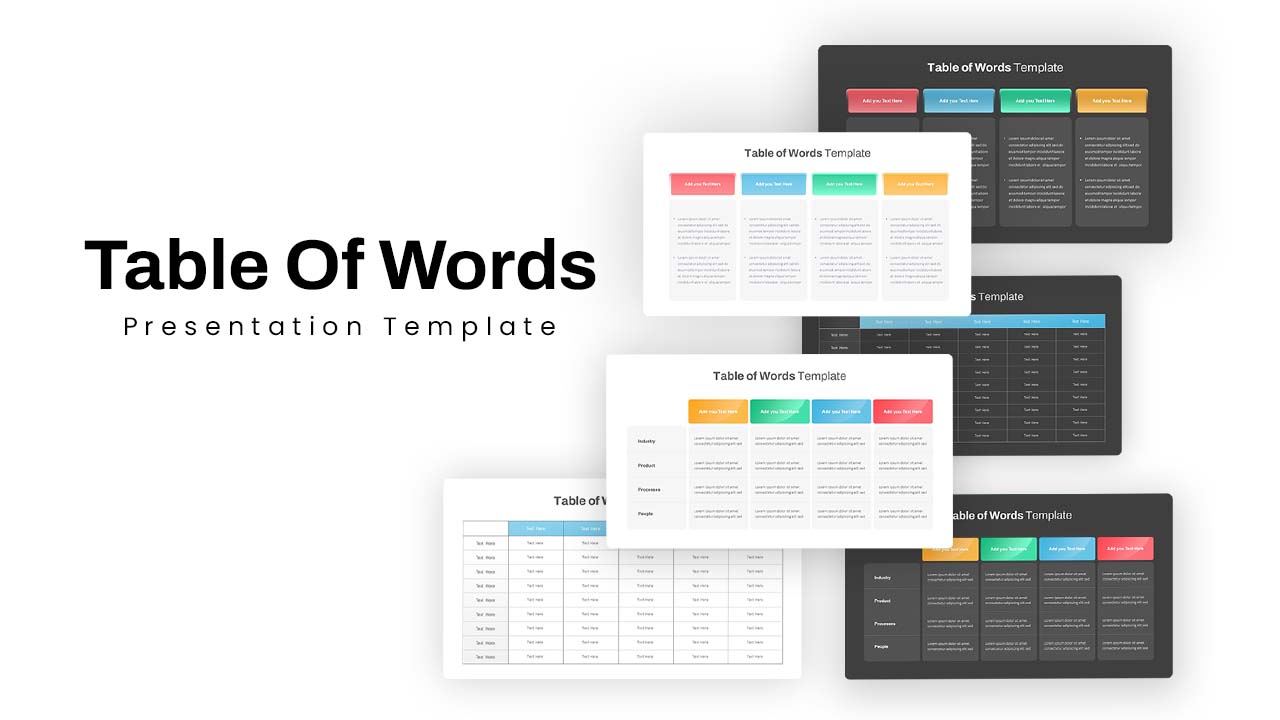
Versatile Table of Words Layout Template for PowerPoint & Google Slides
Table
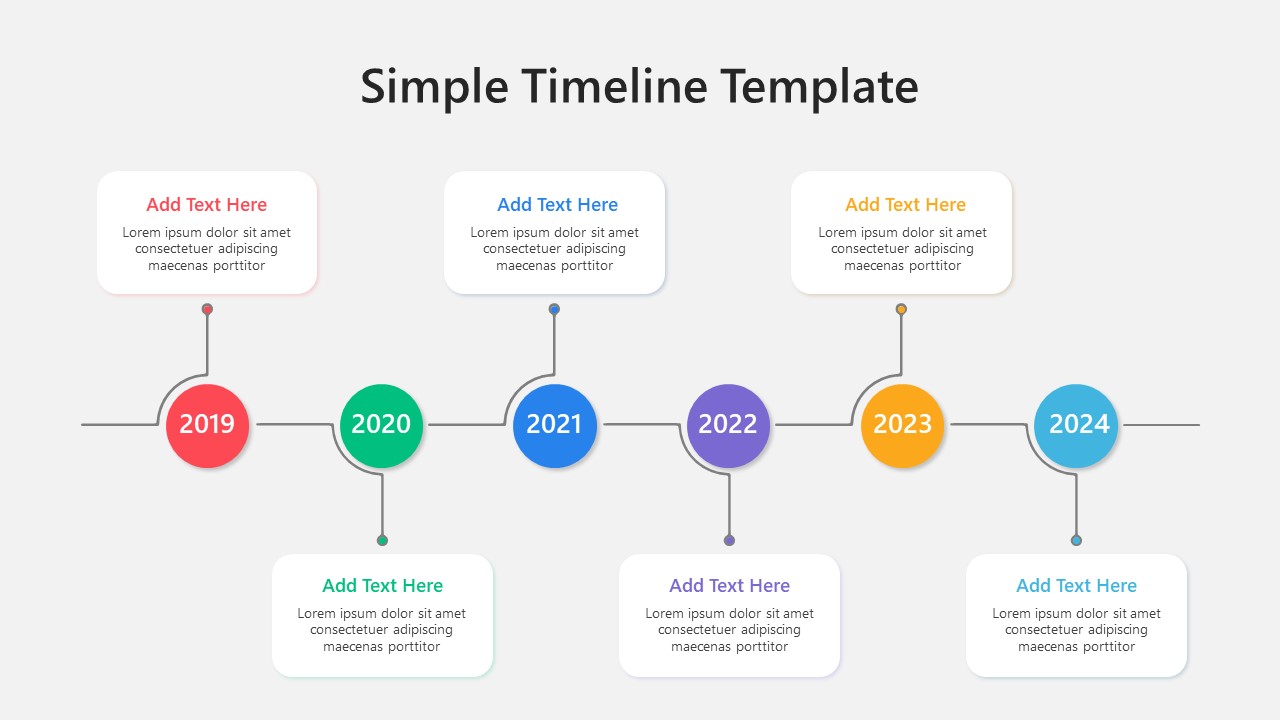
Multi-Color Milestone Timeline Layout Template for PowerPoint & Google Slides
Timeline
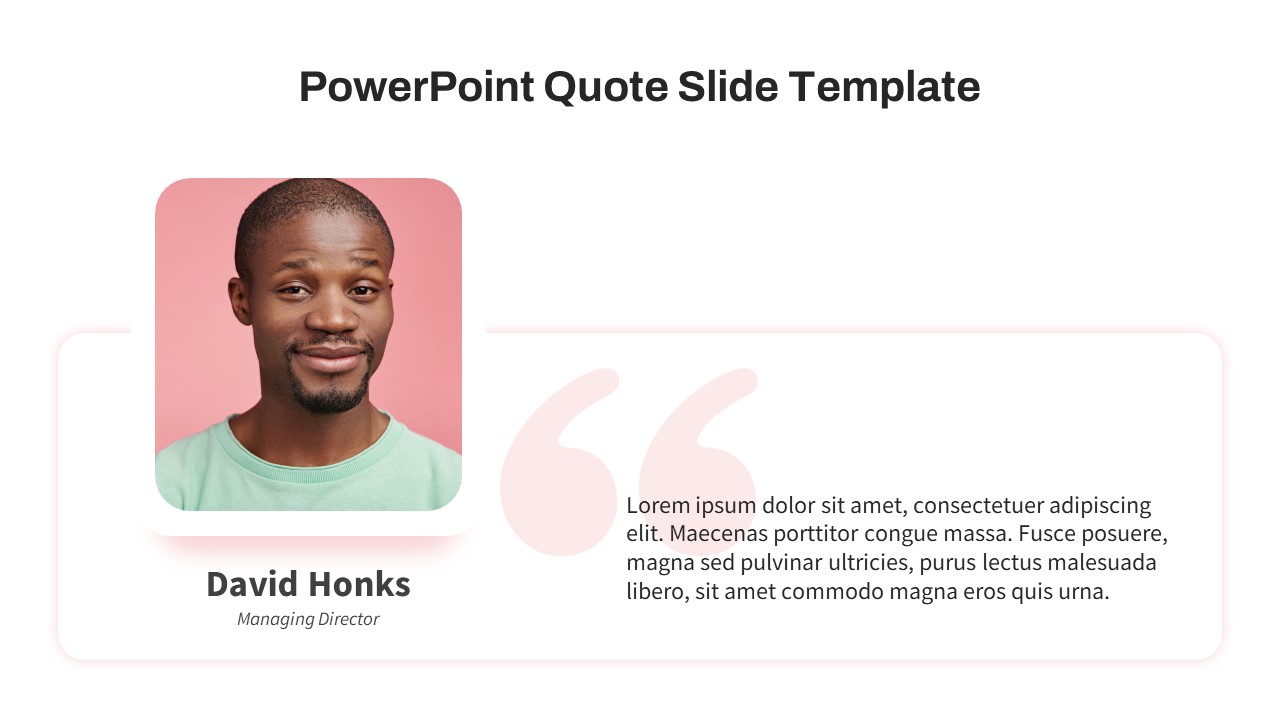
Free Elegant Executive Quote Slide Layout Template for PowerPoint & Google Slides
Our Team
Free
Free Balanced Scorecard Quadrant KPI Layout Template for PowerPoint & Google Slides
Employee Performance
Free
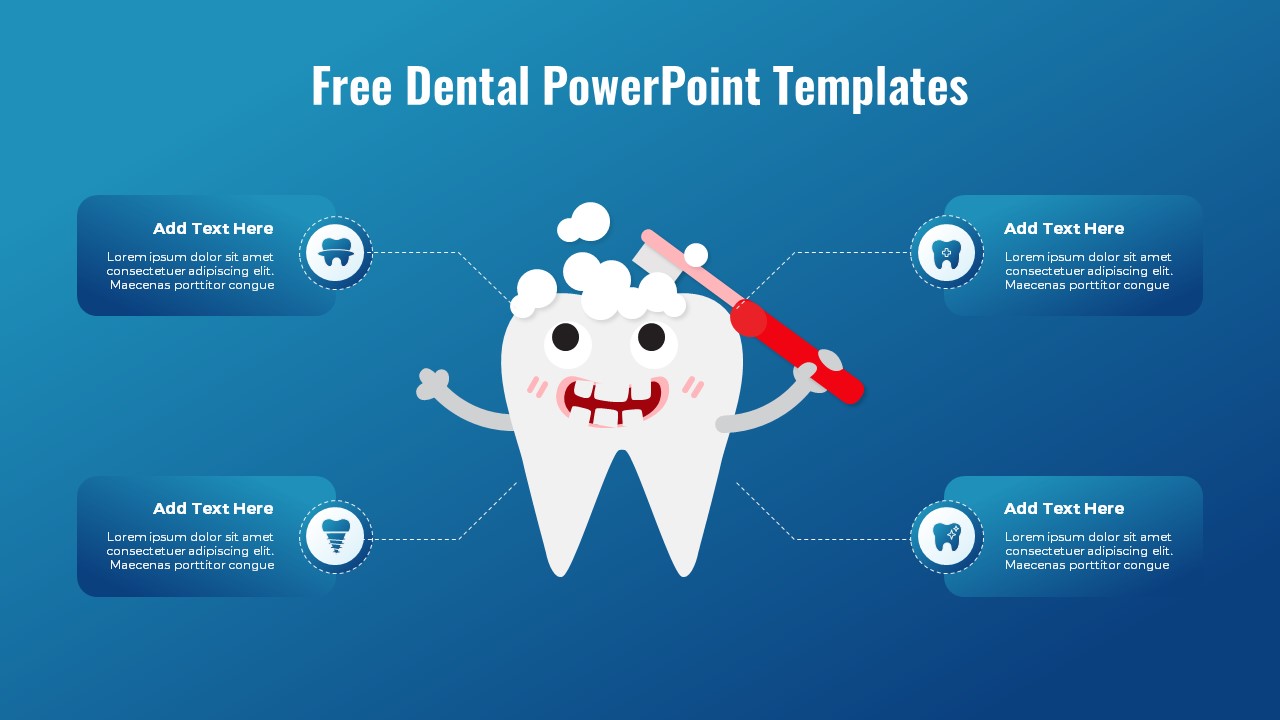
Free Cute Dental Health Infographic Layout for PowerPoint & Google Slides
Health
Free
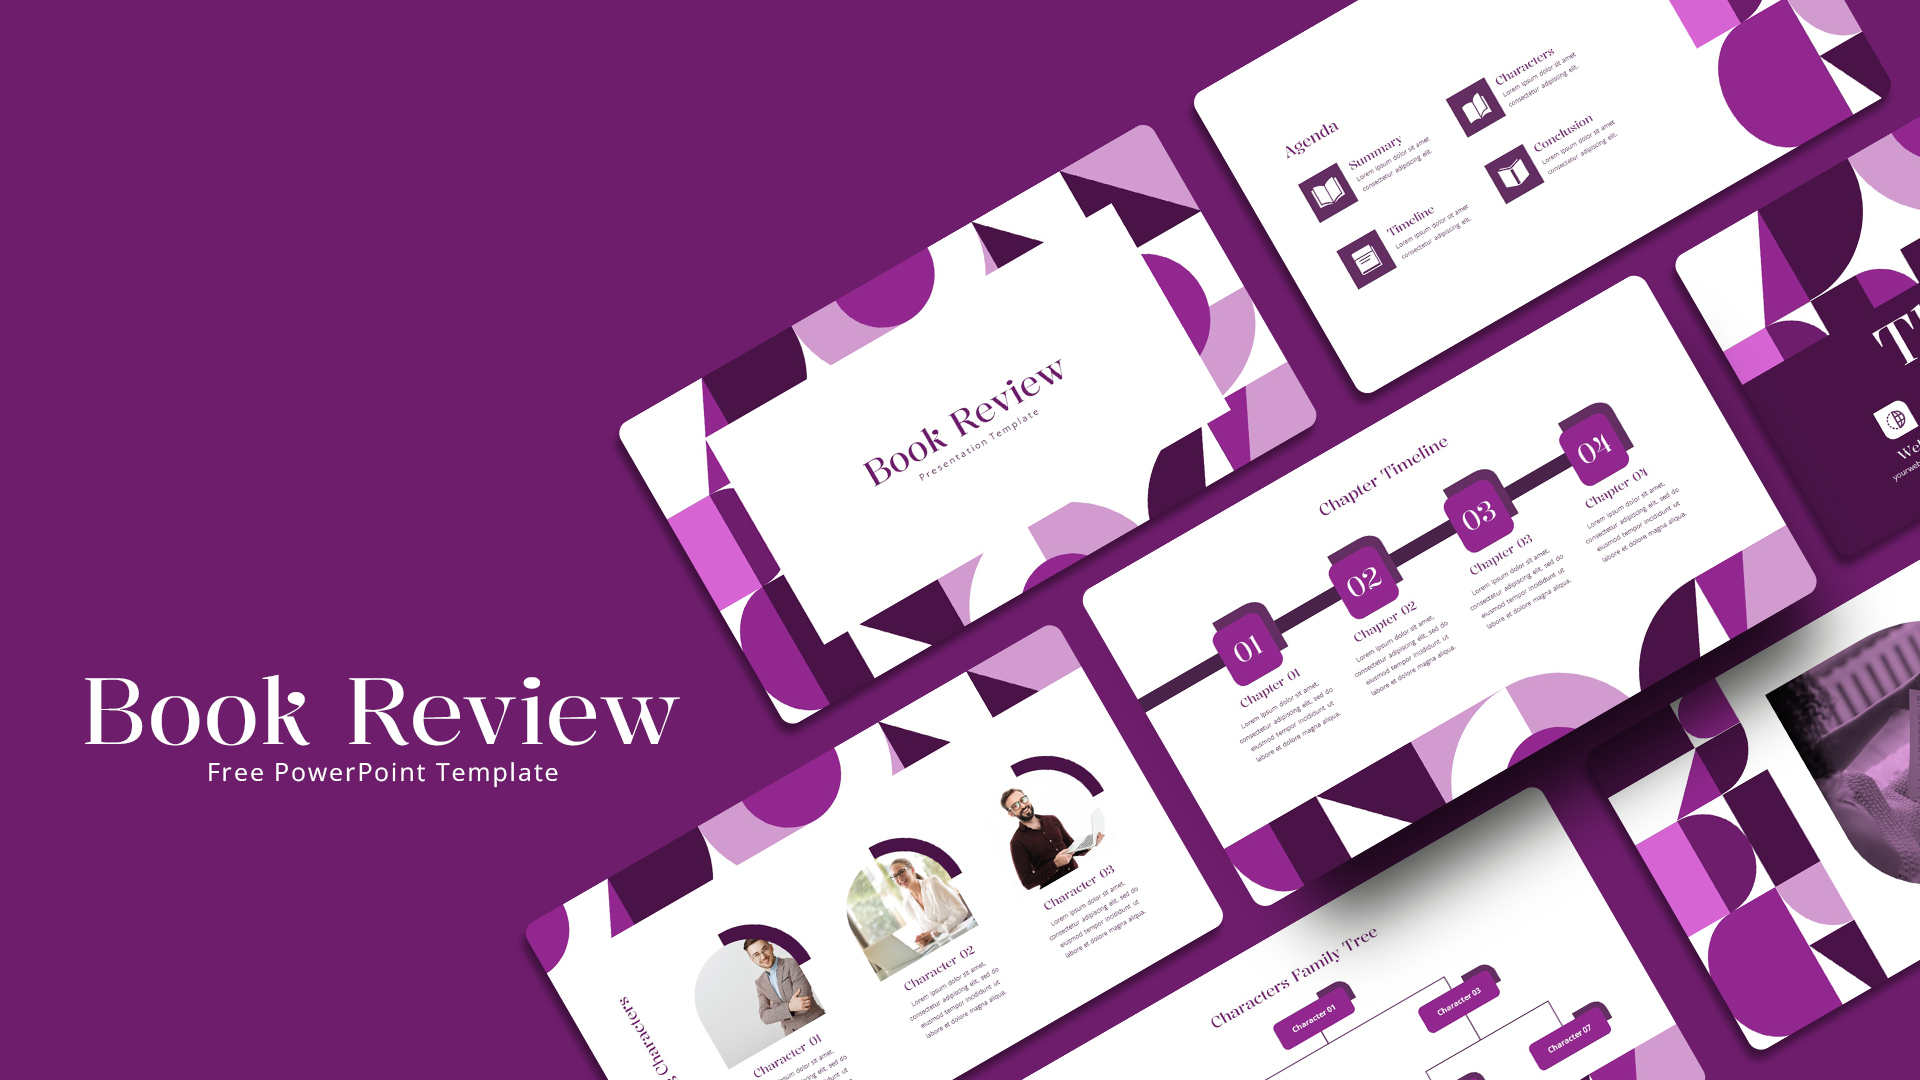
Free Stylized Book Review Layout for PowerPoint & Google Slides
Company Profile
Free
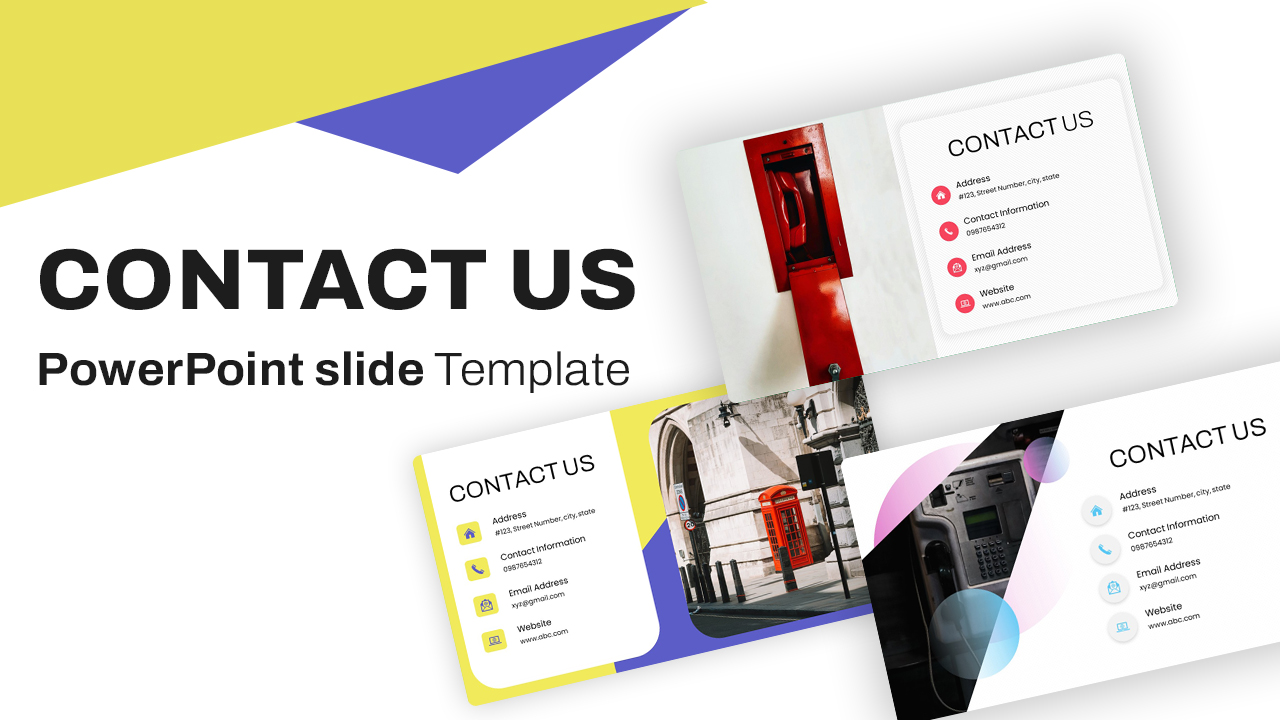
Free Modern Contact Us Slide Layout for PowerPoint & Google Slides
Business
Free
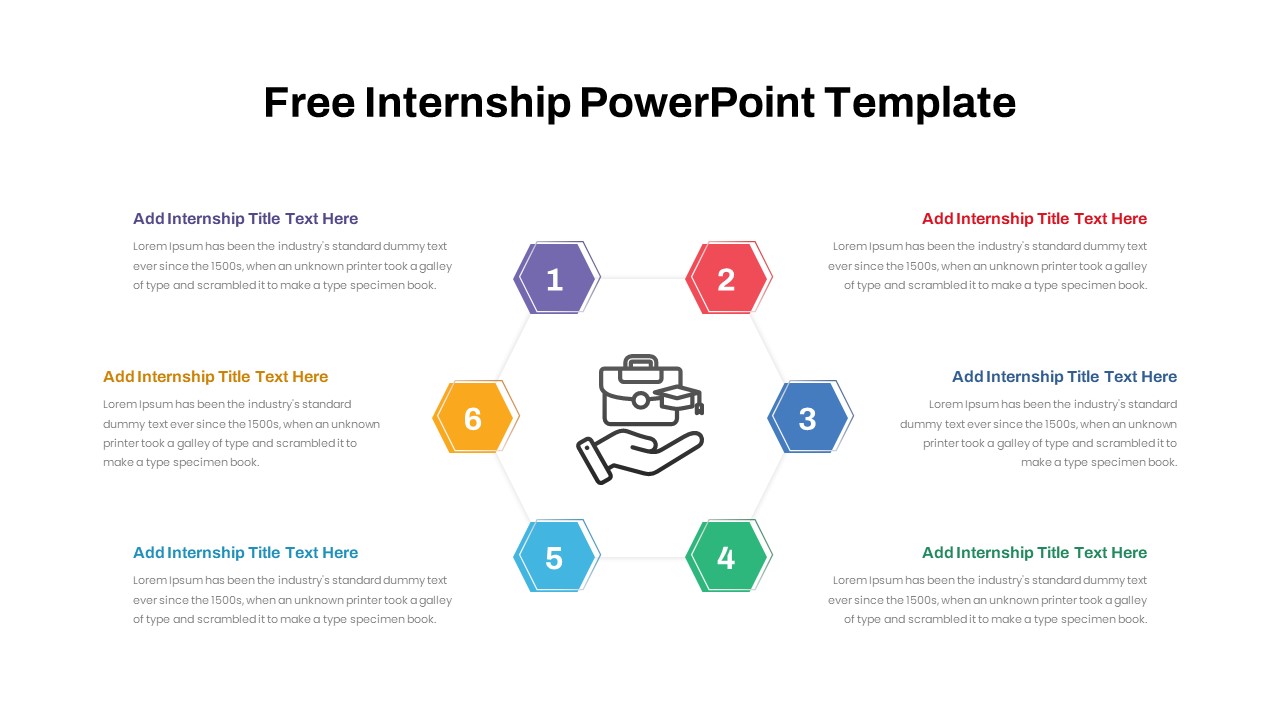
Free Internship Program Hexagon Layout for PowerPoint & Google Slides
Recruitment
Free
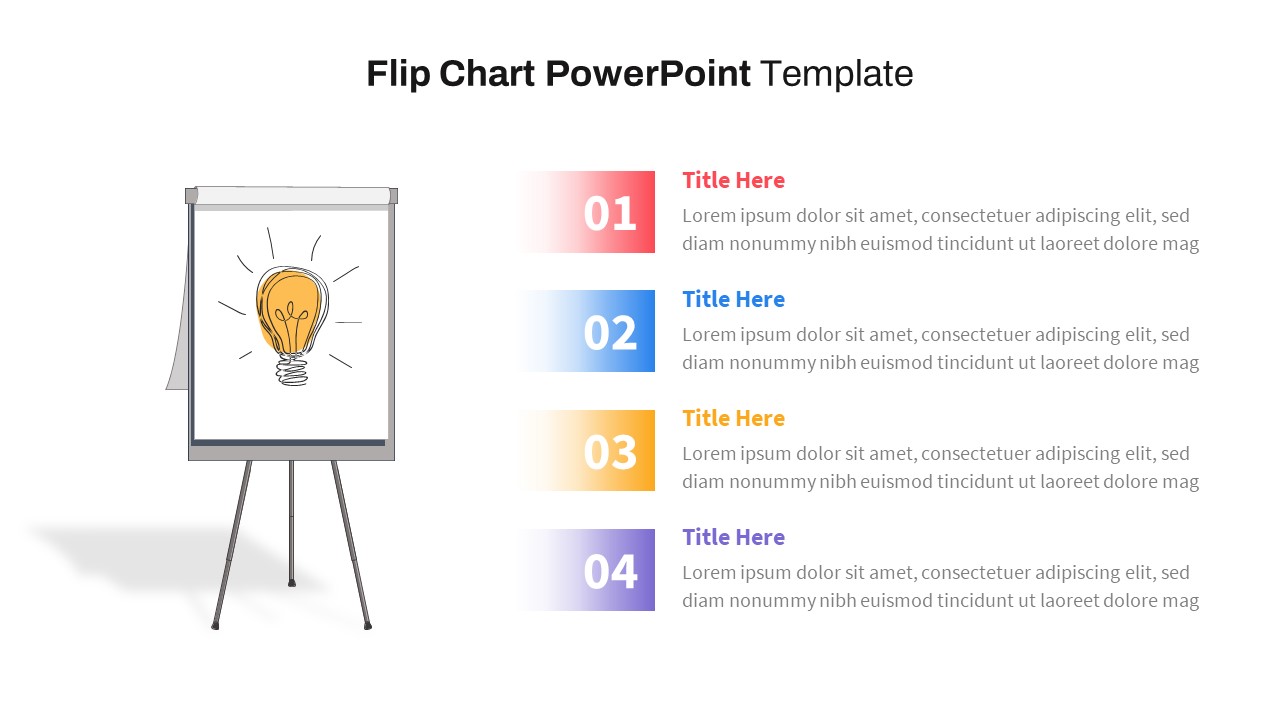
Flip Chart Four-Step List Layout Template for PowerPoint & Google Slides
Process
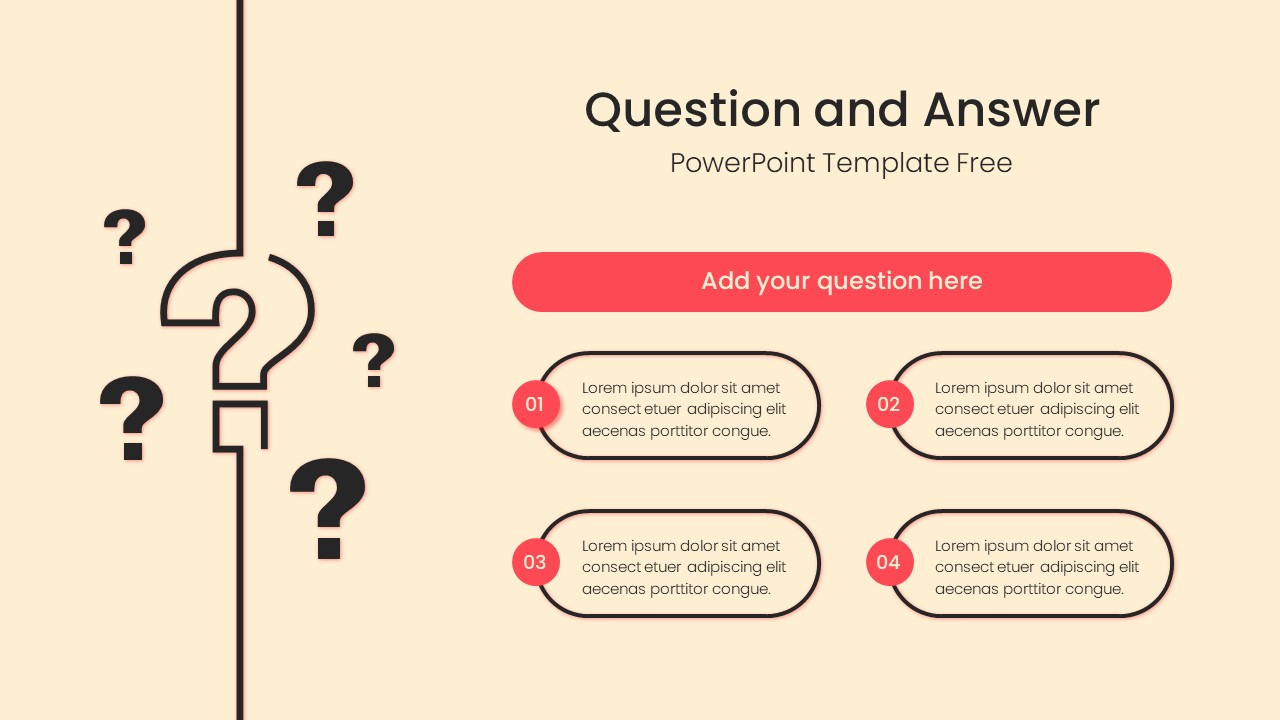
Free Q&A Layout with Four Answer Pods Template for PowerPoint & Google Slides
Free
Free
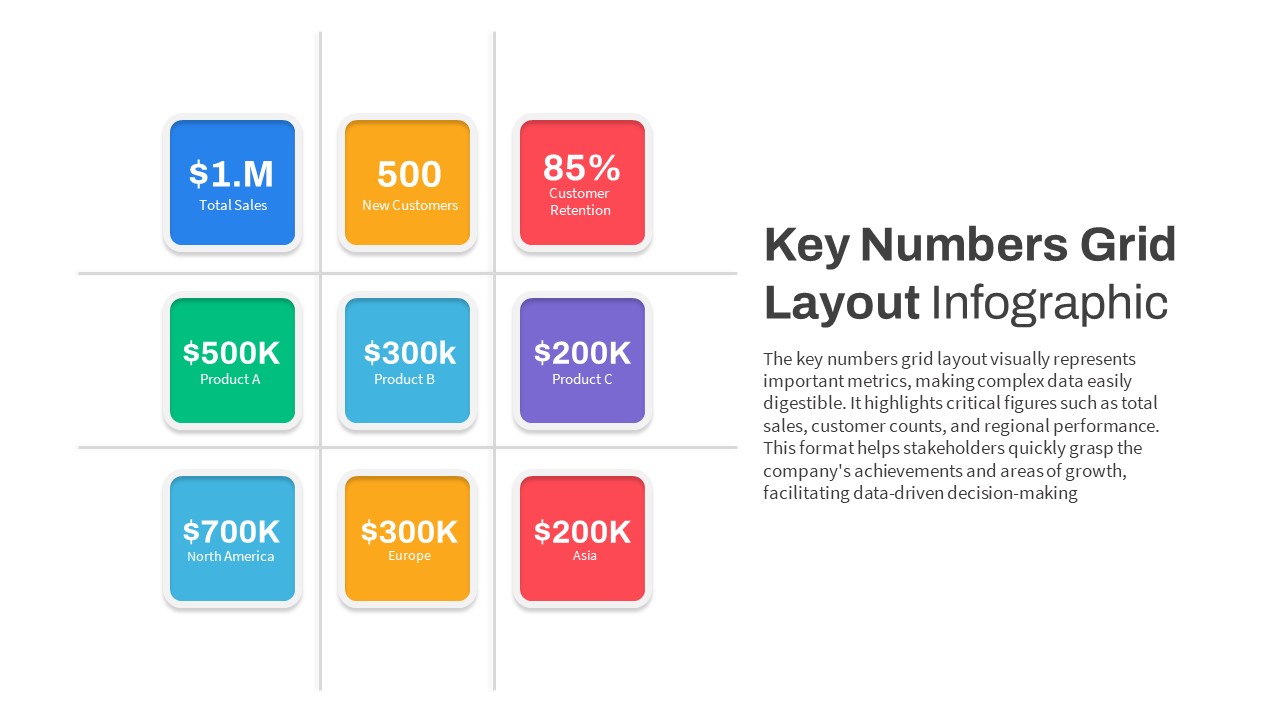
Key Numbers Grid Layout Infographic Template for PowerPoint & Google Slides
Business Report
Medical Hexagon Layout Presentation Template for PowerPoint & Google Slides
Health
Today’s Panelists Profile Layout Template for PowerPoint & Google Slides
Our Team
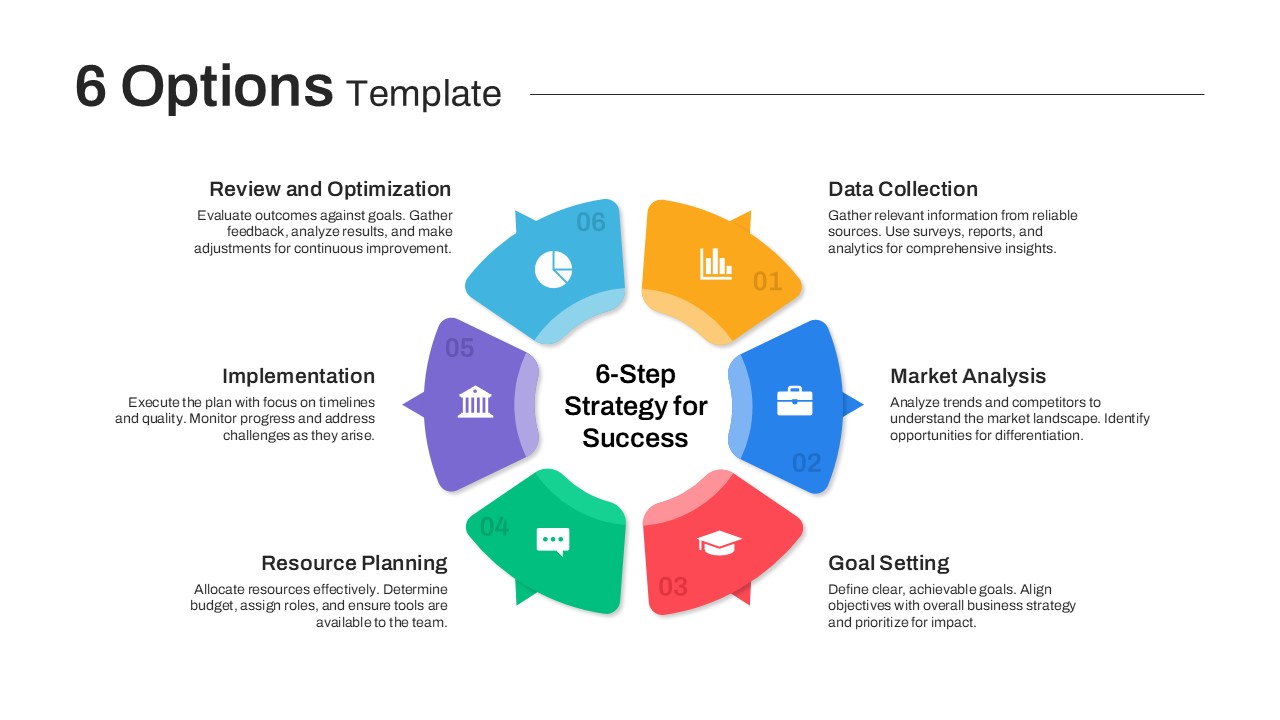
Versatile 6 Options Infographic Layout Template for PowerPoint & Google Slides
Process
Discussion Points Layout Template for PowerPoint & Google Slides
Agenda
Our Principles Slide with Icons Layout Template for PowerPoint & Google Slides
Vision and Mission
Free Choice Board Six-Option Layout Template for PowerPoint & Google Slides
Comparison
Free
Training Plan Table Layout Template for PowerPoint & Google Slides
Employee Performance
Our Team Profile Layout Template for PowerPoint & Google Slides
Our Team
Colorful Four-Column Table Layout Template for PowerPoint & Google Slides
Table
Five Column Comparison Table Layout Template for PowerPoint & Google Slides
Comparison
Team & Expertise Profile Layout Template for PowerPoint & Google Slides
Our Team