Progress Bar Infographic for PowerPoint & Google Slides


Description
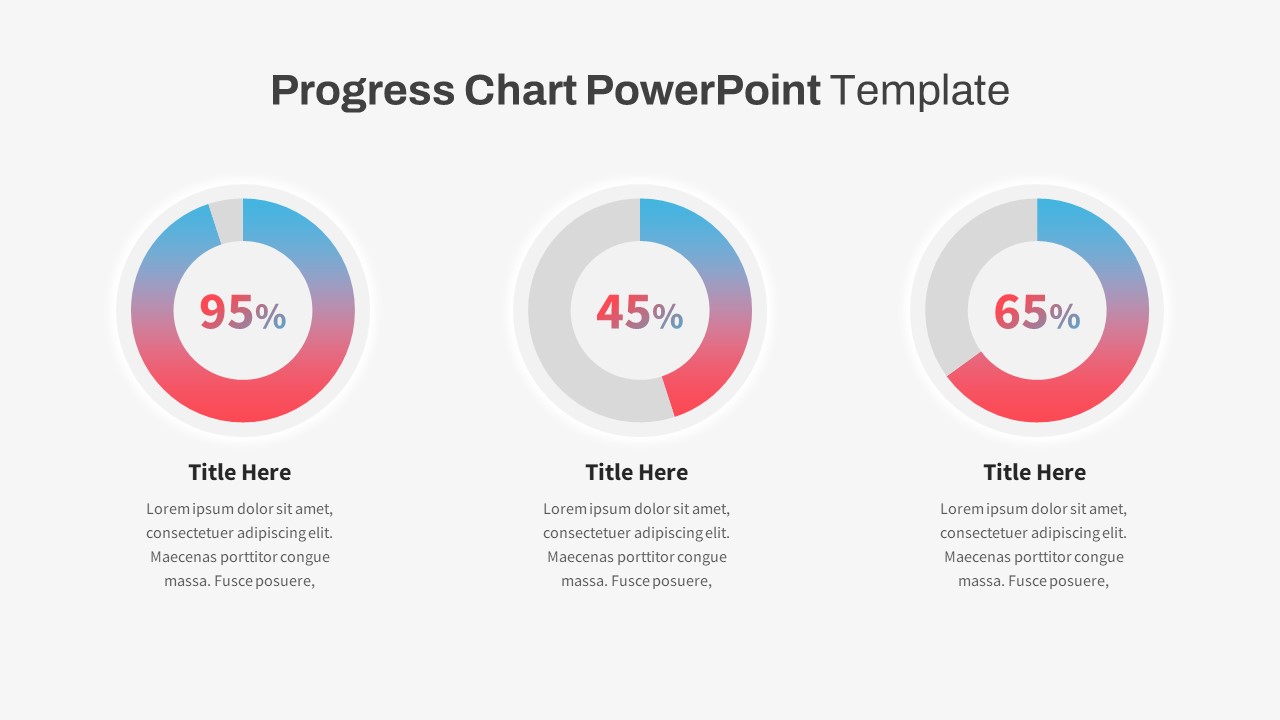
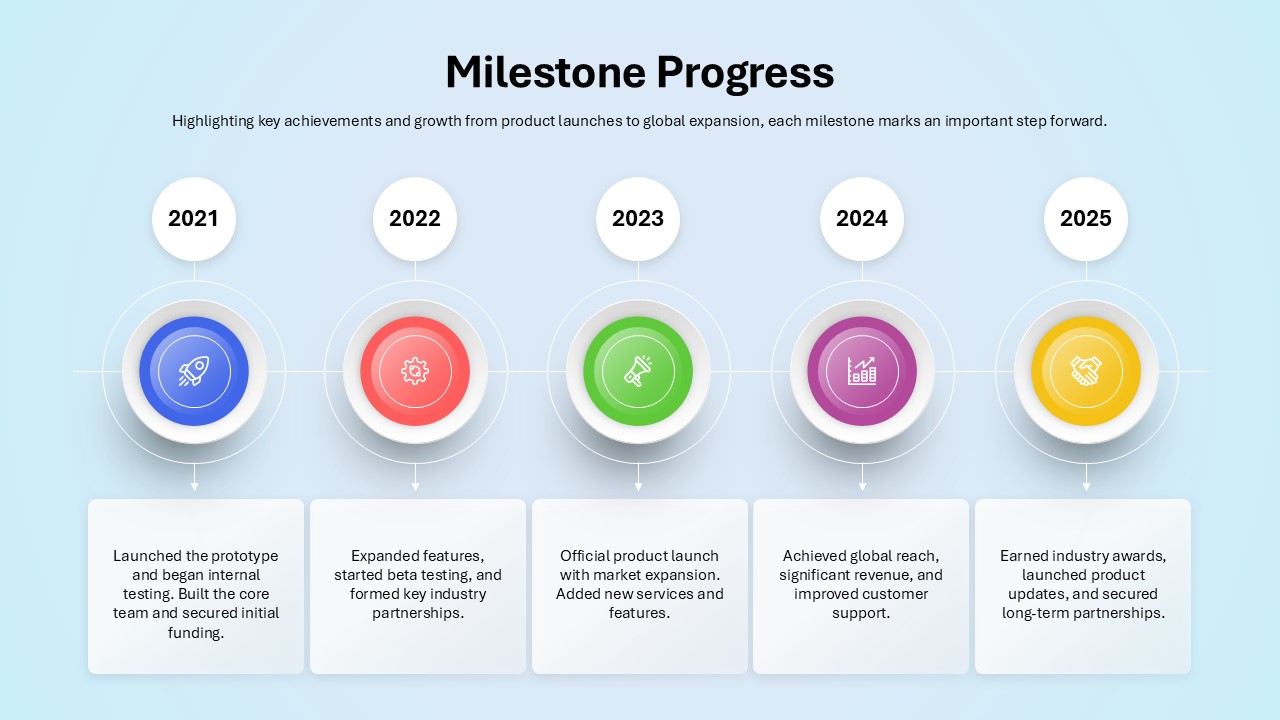
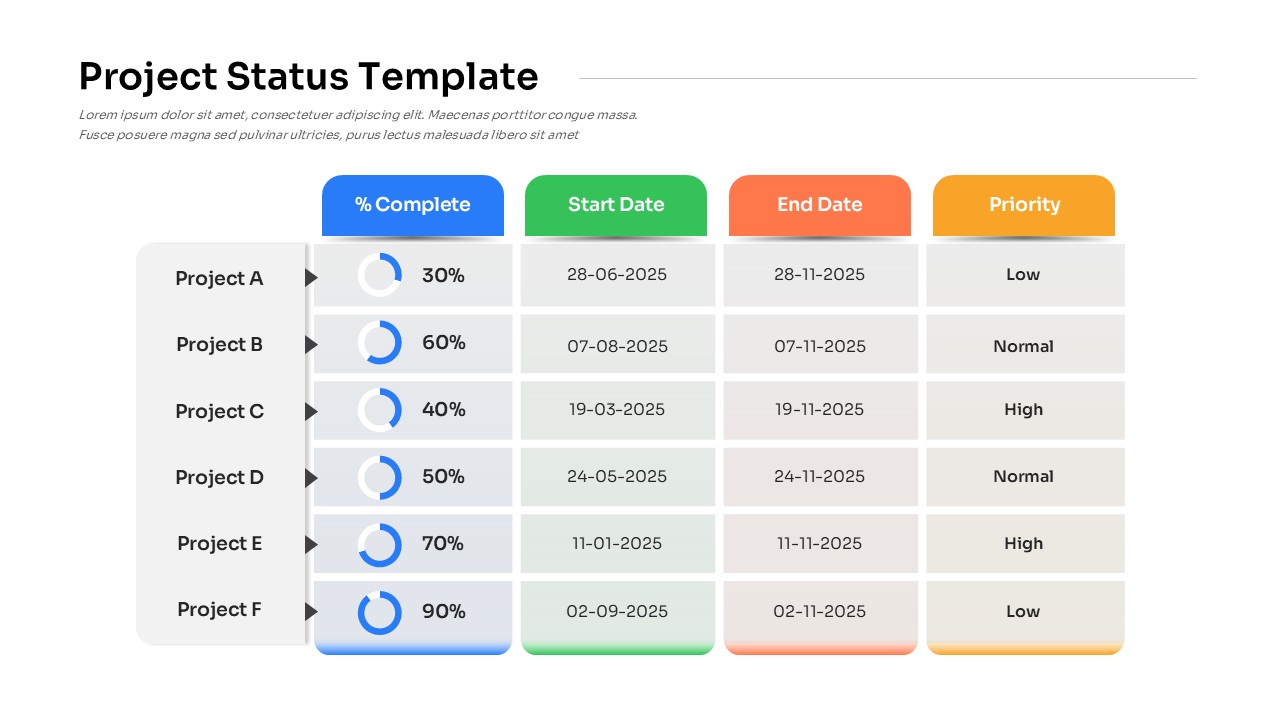
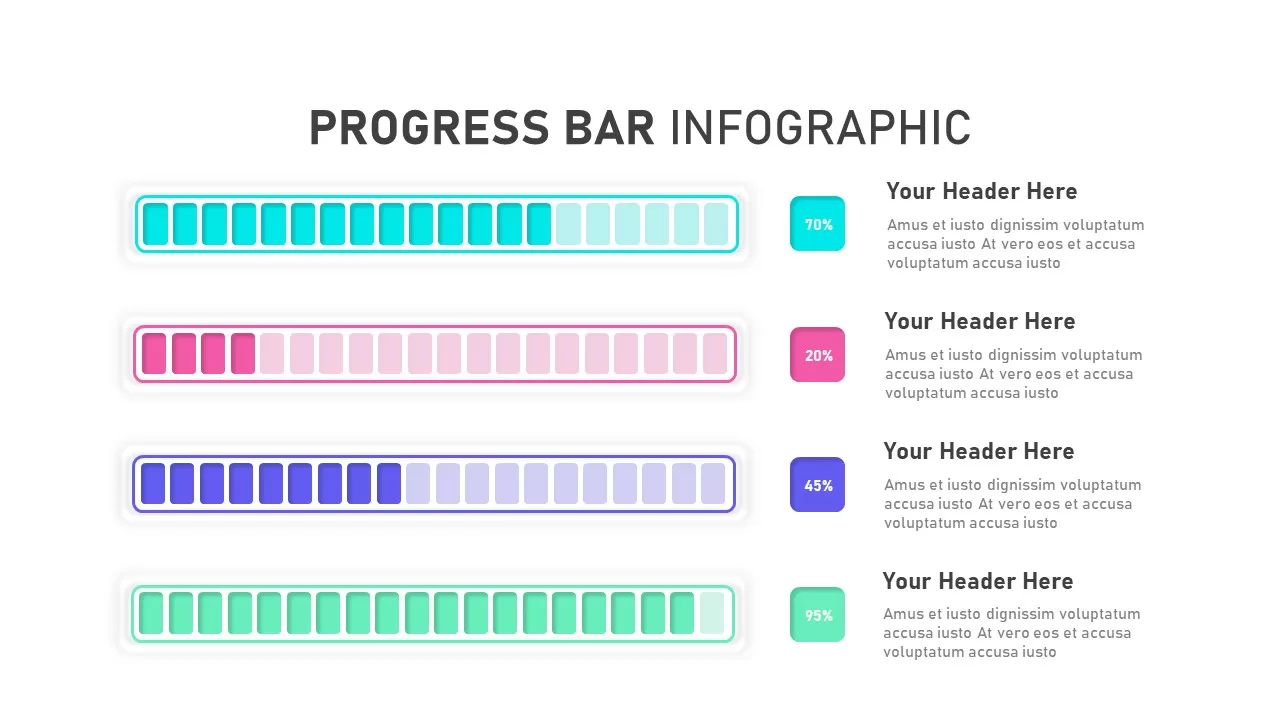
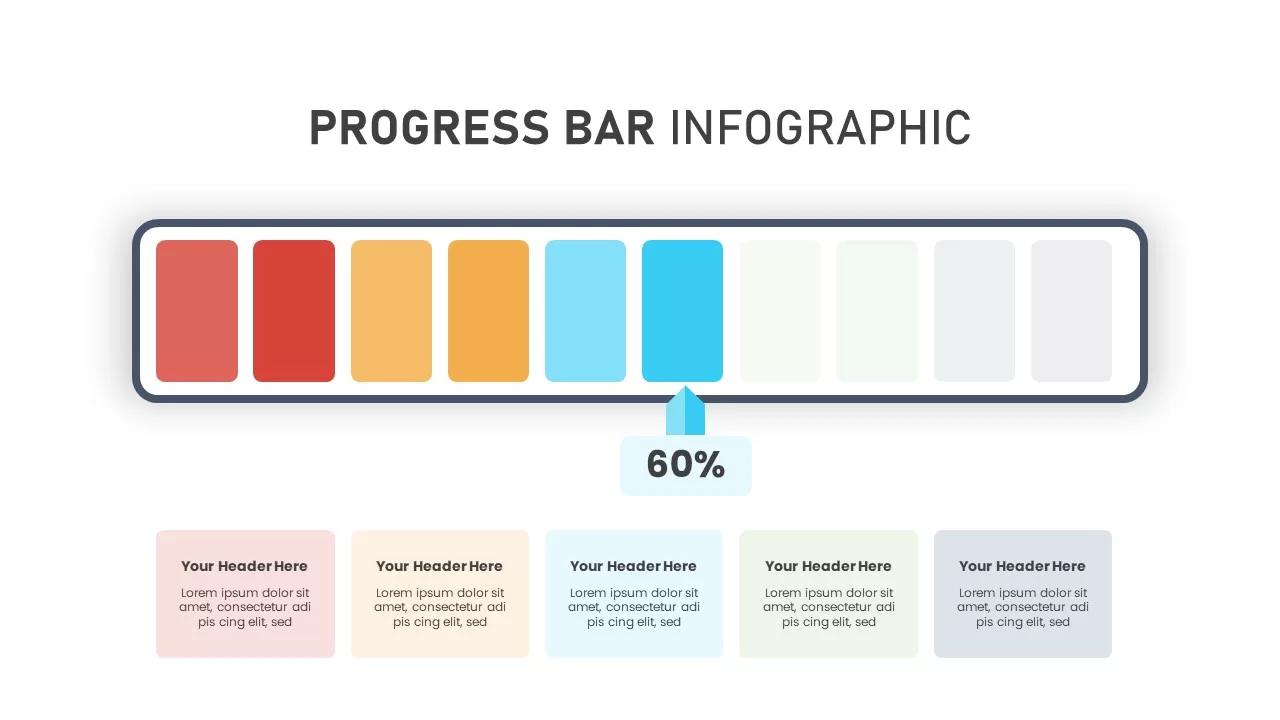
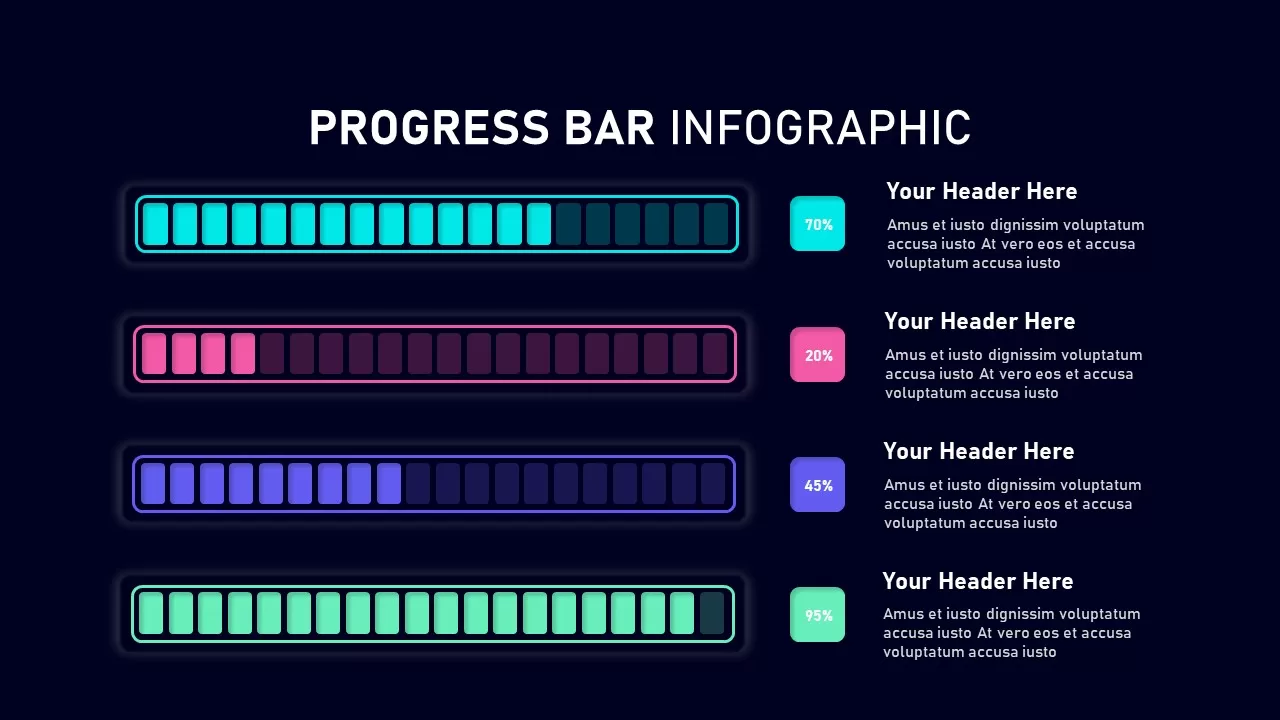
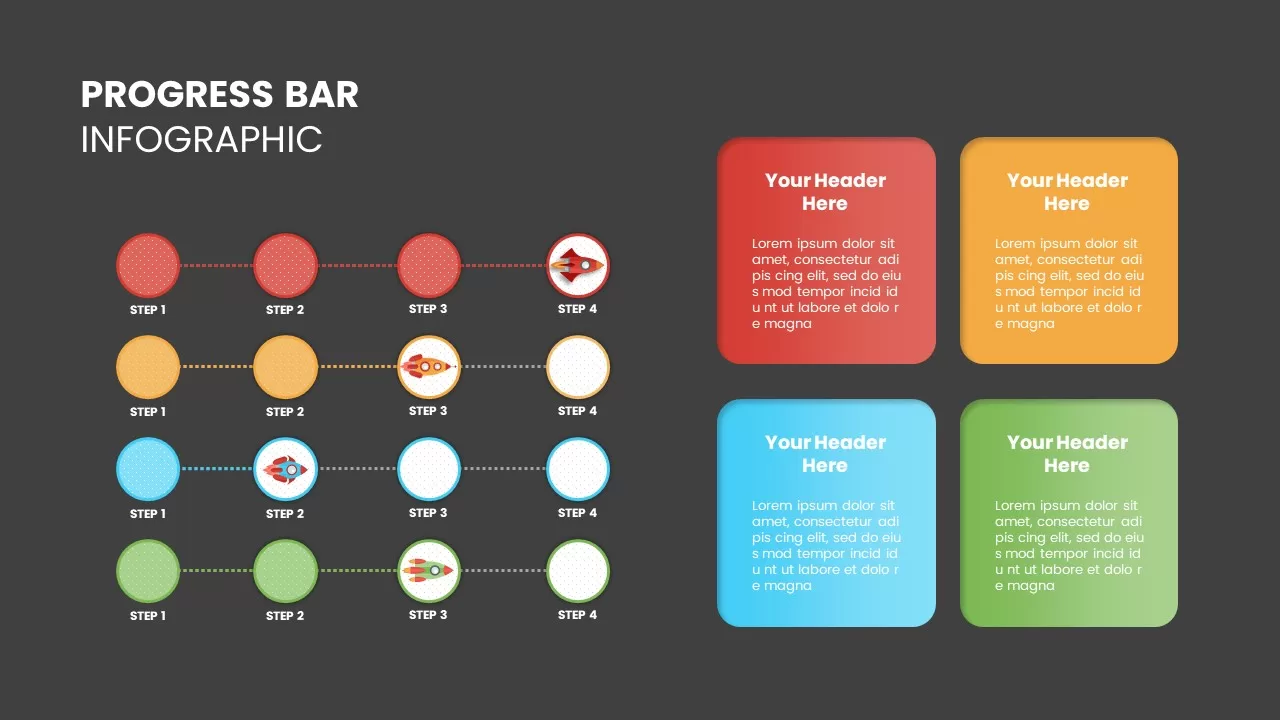
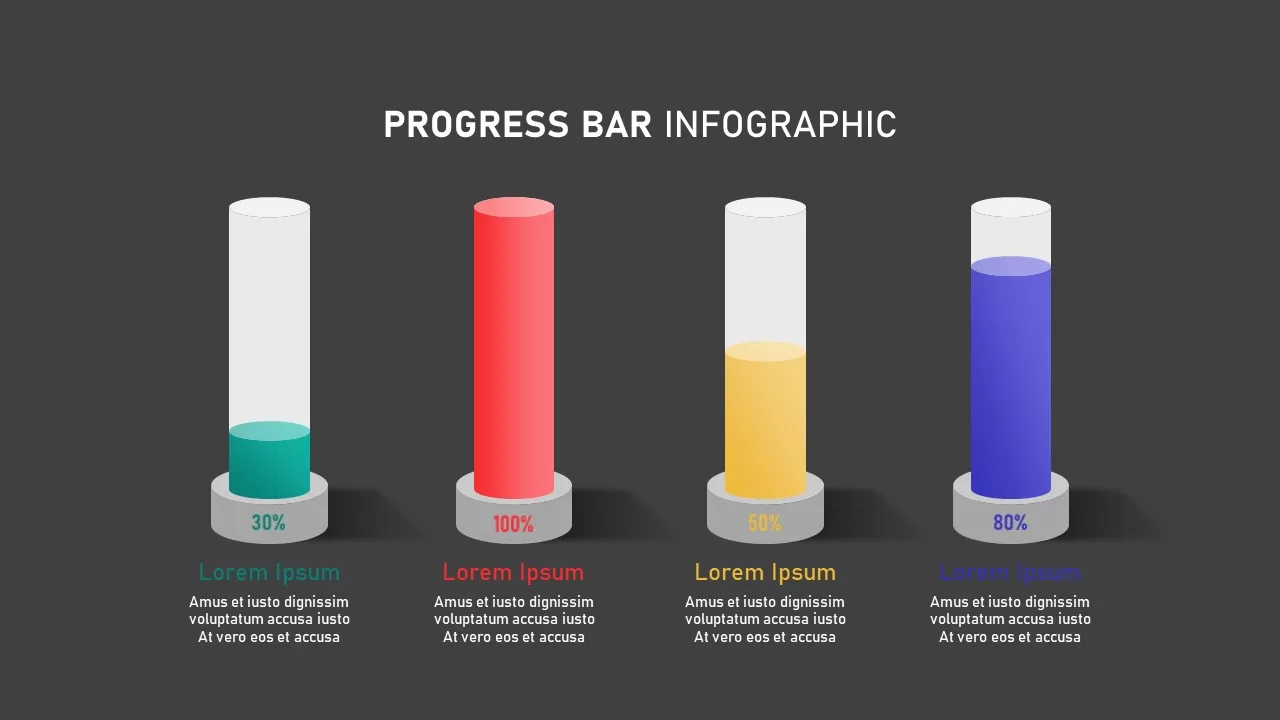
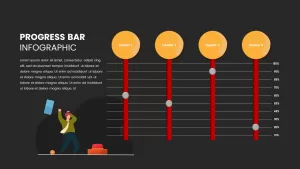
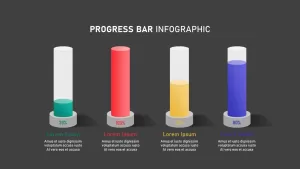
This pack of 10 infographic slides features dynamic and visually engaging progress bar designs, ideal for tracking progress, performance, or milestones. The slides include various progress bar formats, such as circular, linear, and segmented bars, with customizable colors to represent different levels of completion. Perfect for showcasing project status, team achievements, sales progress, or goal tracking, these slides enable you to present data in a clear and accessible way. Whether you’re communicating project timelines, sales goals, or any other measurable objective, these slides will add a professional touch to your presentation while keeping the audience engaged. Each slide is fully editable, allowing for easy customization of percentages, colors, and labels to fit your specific needs.
Who is it for
This infographic pack is perfect for project managers, business analysts, marketers, and team leaders who need to visualize and communicate progress or completion status. It’s also useful for educators and students presenting data, tracking achievements, or discussing measurable goals. Whether in a corporate environment, classroom, or team meeting, these slides provide an effective visual tool for progress tracking.
Other Uses
These slides can be adapted for a wide range of purposes, such as showcasing sales targets, project milestones, KPI tracking, task completion, or performance evaluations. Additionally, they can be used to illustrate customer satisfaction, budget tracking, or product development stages, making them a versatile tool for presentations across different sectors.
Login to download this file

Item ID
SB02280
Related Templates

Progress Bar infographic pack for PowerPoint & Google Slides
Business
Progress Bar Graph Layout Design for PowerPoint & Google Slides
Charts
Timeline Roadmap with Progress Bar Template for PowerPoint & Google Slides
Timeline
Progress Bar and Milestone Visualization Template for PowerPoint & Google Slides
Timeline
iPad App Mockup with Progress Metrics Template for PowerPoint & Google Slides
Bar/Column
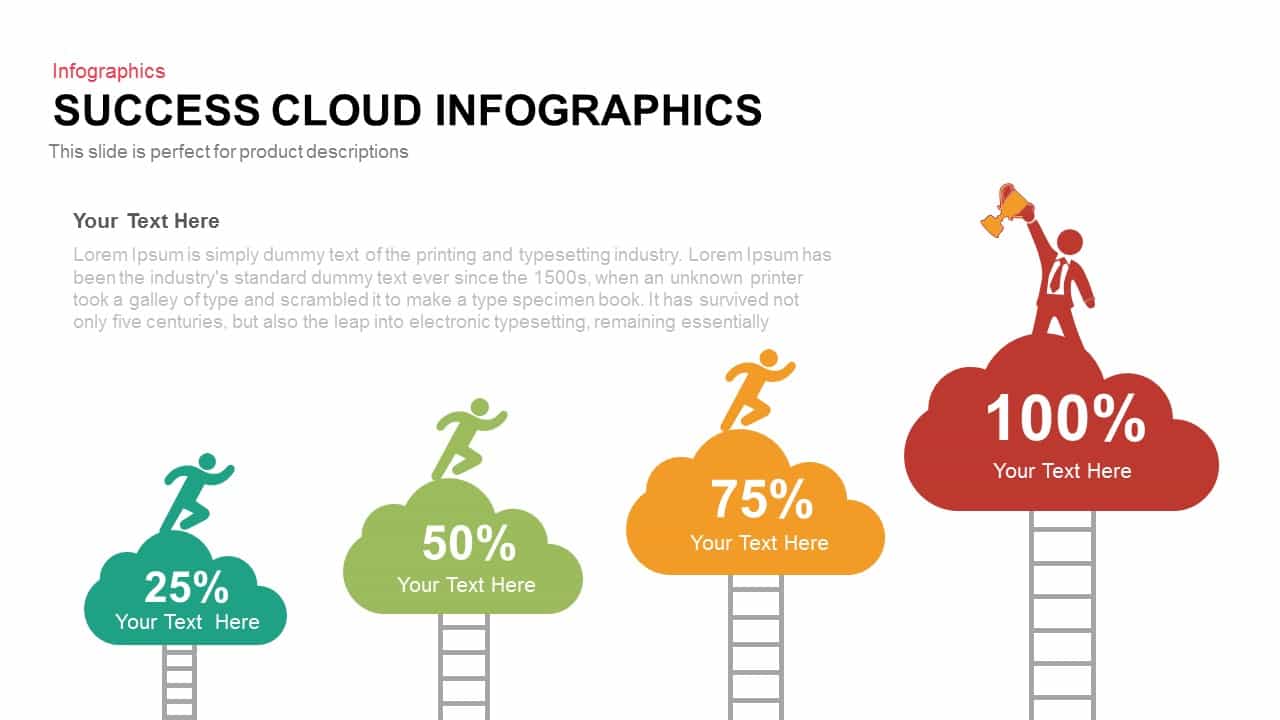
Success Cloud Progress Infographics Template for PowerPoint & Google Slides
Charts

Growth Arrow for Progress & Growth template for PowerPoint & Google Slides
Arrow
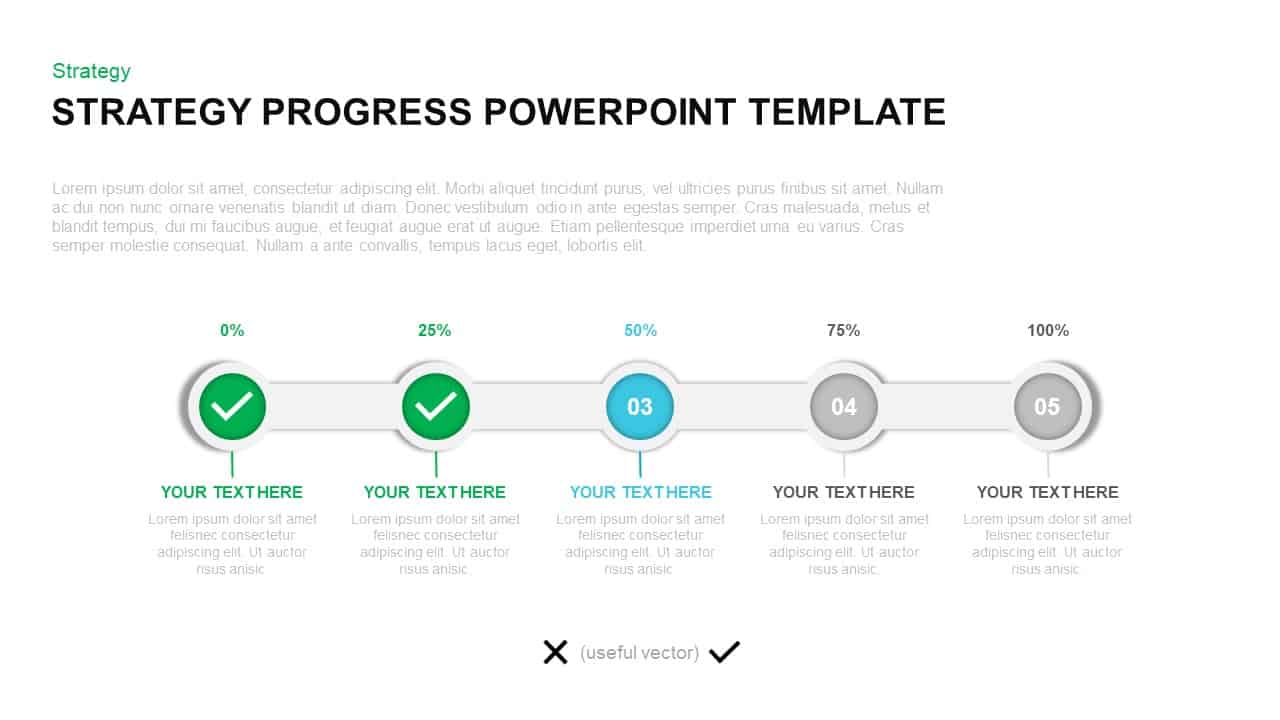
Strategy Progress Timeline Template for PowerPoint & Google Slides
Process
Performance Review Progress Management Template for PowerPoint & Google Slides
Process
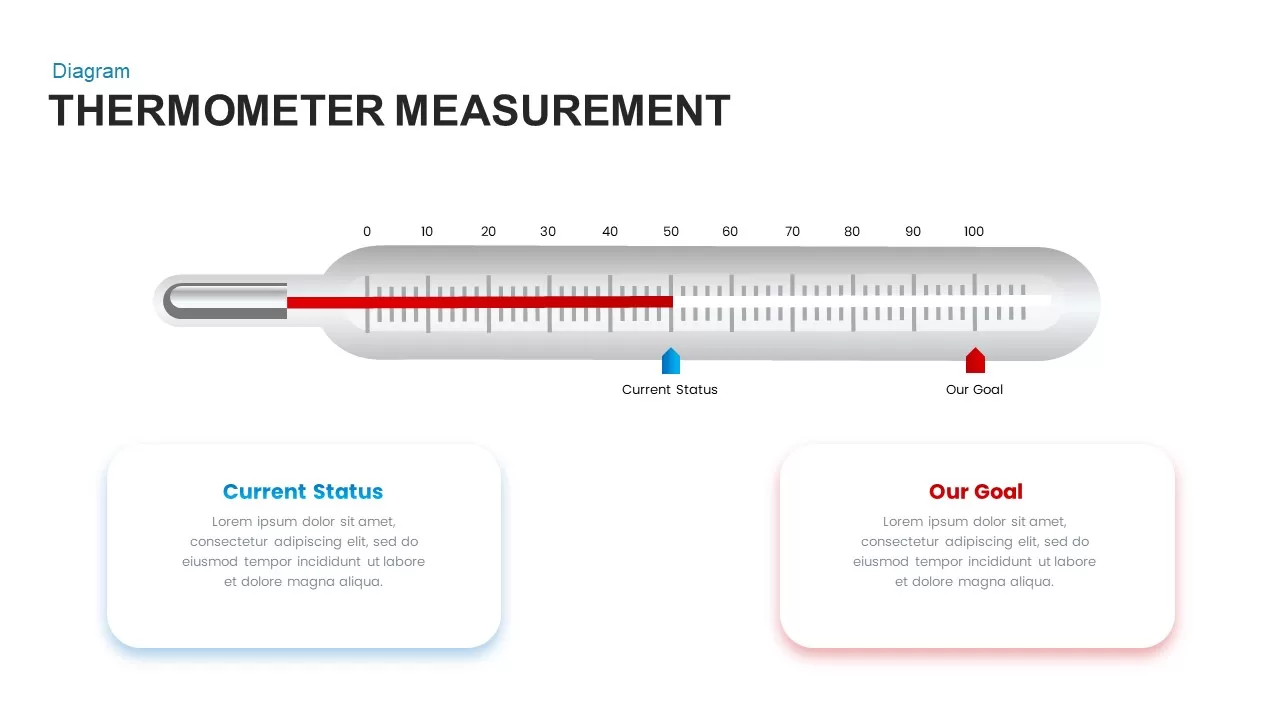
Thermometer Gauge Progress Measurement Template for PowerPoint & Google Slides
Comparison
Free Curved Arrow Progress Chart template for PowerPoint & Google Slides
Project
Free
Dynamic Statistics & Progress Charts Template for PowerPoint & Google Slides
Pie/Donut
Agriculture Infographics Slide with Progress Rings & Metrics Template for PowerPoint & Google Slides
Pie/Donut
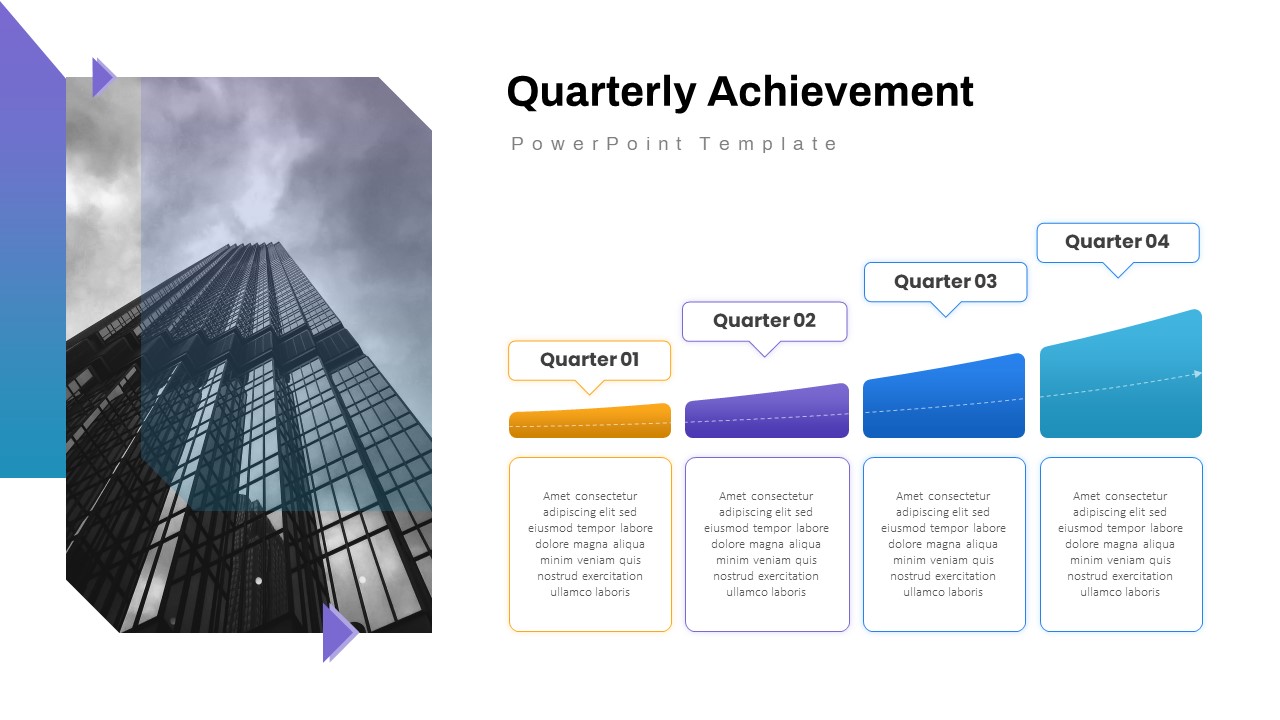
Quarterly Achievement Progress Template for PowerPoint & Google Slides
Accomplishment
Progress Chart Slide for PowerPoint & Google Slides
Charts
Project Progress Dashboard Pie Charts Template for PowerPoint & Google Slides
Project
Milestone Progress template for PowerPoint & Google Slides
Business Plan
Project Status with Progress & Priority Template for PowerPoint & Google Slides
Table

3D Bar Graph Infographic Template for PowerPoint & Google Slides
Bar/Column
Statistics Infographic & KPI Bar Chart Template for PowerPoint & Google Slides
Bar/Column
Bar Chart Sample template for PowerPoint & Google Slides
Bar/Column
Creative Data Analysis Bar Chart template for PowerPoint & Google Slides
Bar/Column
3D Bar Chart Data Infographics Template for PowerPoint & Google Slides
Bar/Column
Creative Bar Chart template for PowerPoint & Google Slides
Charts
Comparison Bar Chart template for PowerPoint & Google Slides
Comparison Chart
Three-Year Bar Chart template for PowerPoint & Google Slides
Charts
3D Cylinder Bar Chart Template for PowerPoint & Google Slides
Bar/Column
Pencil Bar Chart Data Analysis Template for PowerPoint & Google Slides
Bar/Column

Monthly Reports Bar Chart template for PowerPoint & Google Slides
Bar/Column
Colorful Radial Bar Chart Template for PowerPoint & Google Slides
Bar/Column
Sales Bar Chart for PowerPoint & Google Slides
Bar/Column
Interactive Product Comparison Bar Chart Template for PowerPoint & Google Slides
Bar/Column
Bar Data Chart Slide for PowerPoint & Google Slides
Bar/Column
Radial Bar Chart Diagram for PowerPoint & Google Slides
Bar/Column
Five-Stage Vertical Bar Process Template for PowerPoint & Google Slides
Process
For and Against Vote Count Bar Chart Template for PowerPoint & Google Slides
Bar/Column
Entertainment Industry Revenue Bar Chart Template for PowerPoint & Google Slides
Bar/Column
Distracting Factors at Work Bar Chart Template for PowerPoint & Google Slides
Bar/Column
Stacked Bar Chart for PowerPoint & Google Slides
Bar/Column
100% Stacked Bar Chart for PowerPoint & Google Slides
Bar/Column
Multi-Series Stacked Bar Chart Template for PowerPoint & Google Slides
Bar/Column
Monthly Recurring Revenue KPI Bar Chart Template for PowerPoint & Google Slides
Bar/Column
Combination Bar and Line Chart Template for PowerPoint & Google Slides
Bar/Column
Animated Clustered Bar Chart Template for PowerPoint & Google Slides
Bar/Column
Animated Stacked Bar Chart Template for PowerPoint & Google Slides
Bar/Column
Simple Bar Chart Data Visualization Template for PowerPoint & Google Slides
Bar/Column
Clustered Bar Chart Comparison Template for PowerPoint & Google Slides
Bar/Column
Waterfall Bar Chart Analysis Template for PowerPoint & Google Slides
Bar/Column
Business Timeline Comparison Bar Chart Template for PowerPoint & Google Slides
Comparison Chart
Year-over-Year Stacked Gender Bar Chart Template for PowerPoint & Google Slides
Bar/Column
Mirror Bar Chart Comparison Template for PowerPoint & Google Slides
Bar/Column
Dynamic Bar-of-Pie Chart Comparison Template for PowerPoint & Google Slides
Pie/Donut
Expanding Margins Analysis Bar Chart Template for PowerPoint & Google Slides
Charts
Quarterly Revenue Comparison Bar Chart Template for PowerPoint & Google Slides
Bar/Column
Quarterly Sales Review Bar Chart Template for PowerPoint & Google Slides
Bar/Column
Data Analysis Bar Chart with Insights Template for PowerPoint & Google Slides
Bar/Column
Free
Horizontal Bar Chart Slide with Icons Template for PowerPoint & Google Slides
Bar/Column
Two-Option Bar Chart Comparison Table Template for PowerPoint & Google Slides
Comparison
Bar Gantt Chart Template for PowerPoint & Google Slides
Gantt Chart
Five Options Business Bar Graph for PowerPoint & Google Slides
Business Report
USA Map with Bar Chart Template for PowerPoint & Google Slides
World Maps

Blank Bar Graph Template for PowerPoint & Google Slides
Bar/Column
3D Cylinder Bar Chart Visualization Template for PowerPoint
Bar/Column
Google Ads Optimization & Performance Infographic Template for PowerPoint & Google Slides
Digital Marketing
SQ3R Study Strategy Infographic Slides Template for PowerPoint & Google Slides
Business Strategy
Six Double Diamond Infographic Slides Template for PowerPoint & Google Slides
Process
Sales Process Infographic Slides Pack Template for PowerPoint & Google Slides
Process
Casino/Poker Chips Infographic Slides template for PowerPoint & Google Slides
Business Strategy
Agenda Infographic Pack of 2 Slides Template for PowerPoint & Google Slides
Agenda
Quad Chart Infographic Pack of 8 Slides Template for PowerPoint & Google Slides
Comparison Chart
Four Options Infographic Slides Template for PowerPoint & Google Slides
Comparison
Game Plan Infographic Slides Pack Template for PowerPoint & Google Slides
Infographics
Teamwork PowerPoint Infographic Template for PowerPoint & Google Slides
Leadership
Kite Infographic PowerPoint Template for PowerPoint & Google Slides
Process
Workflow PowerPoint Process infographic for PowerPoint & Google Slides
Process
Free Infographic Deck PowerPoint Pack for PowerPoint & Google Slides
Infographics
Free
Magnifying Glass Arrows Infographic Template for PowerPoint & Google Slides
Arrow
Three Four Five Stage Timeline Infographic Template for PowerPoint & Google Slides
Timeline
Creative Lab Beakers Data Infographic template for PowerPoint & Google Slides
Infographics
Dynamic Data Dashboard Infographic Template for PowerPoint & Google Slides
Bar/Column
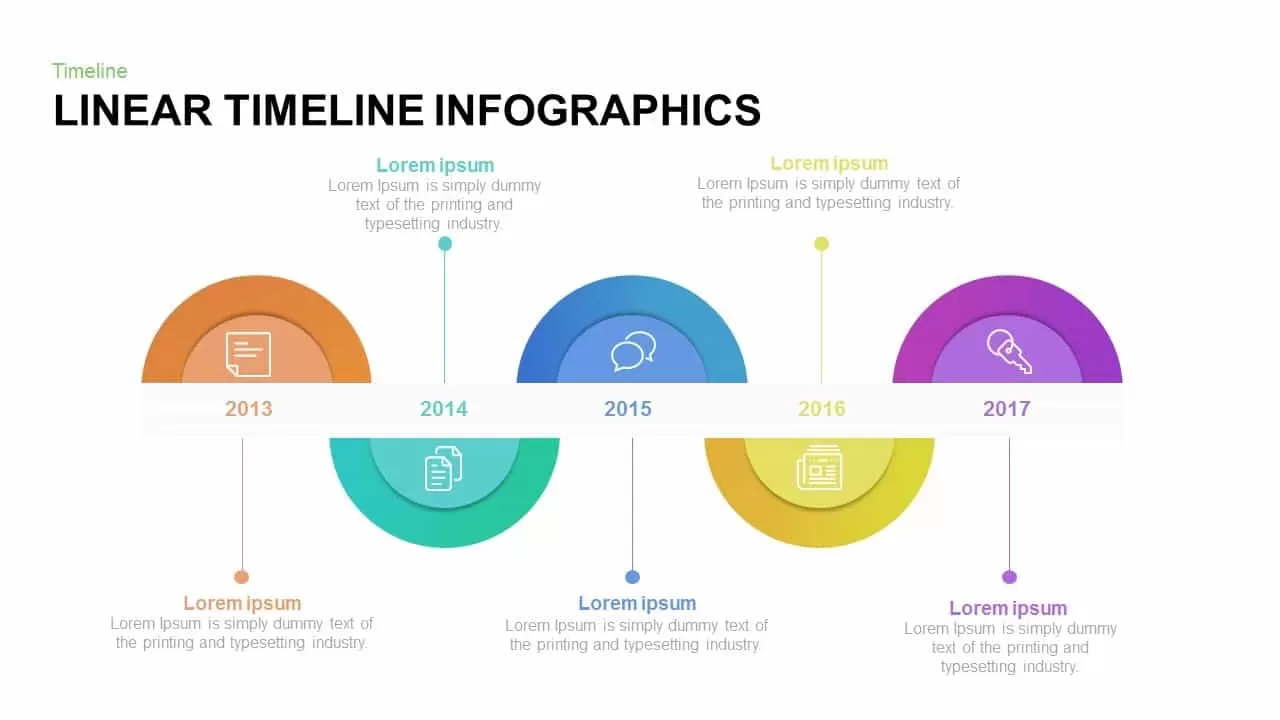
Professional Linear Timeline Infographic Template for PowerPoint & Google Slides
Timeline
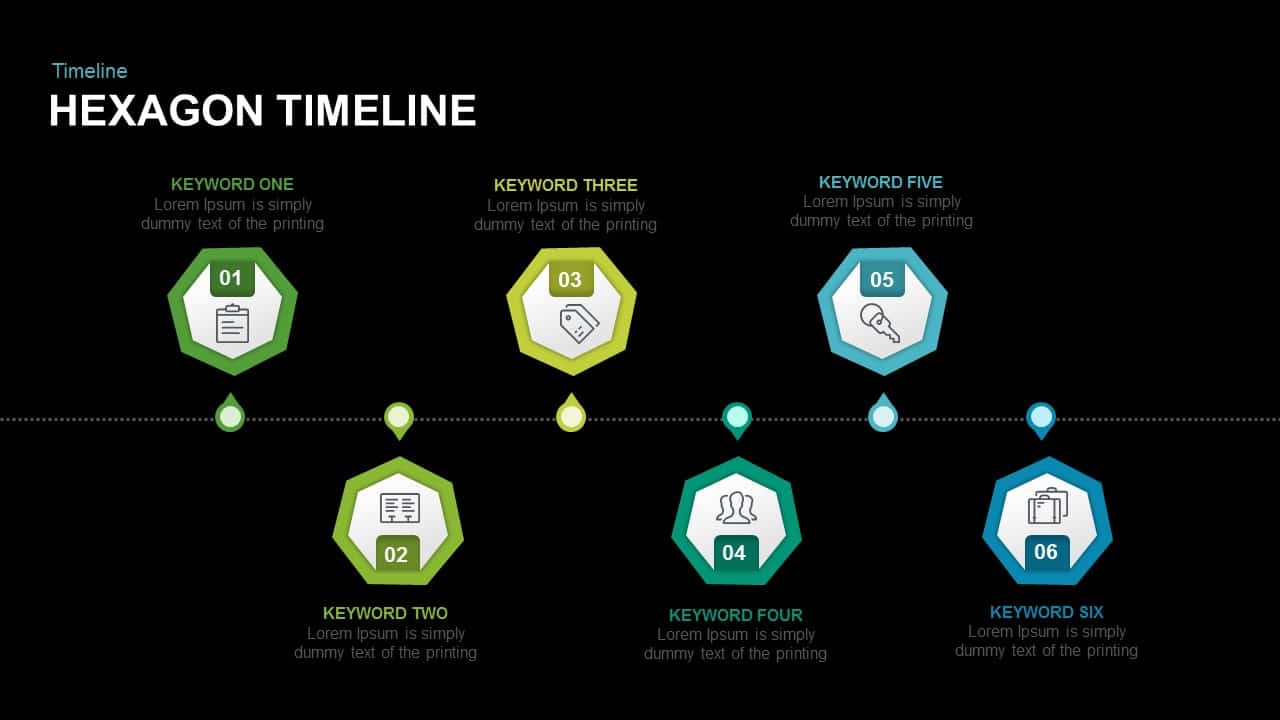
Six-Stage Hexagon Timeline Infographic Template for PowerPoint & Google Slides
Timeline
Eight-Step Circular Diagram Infographic Template for PowerPoint & Google Slides
Circular
Multi-Year Timeline Infographic Template for PowerPoint & Google Slides
Timeline
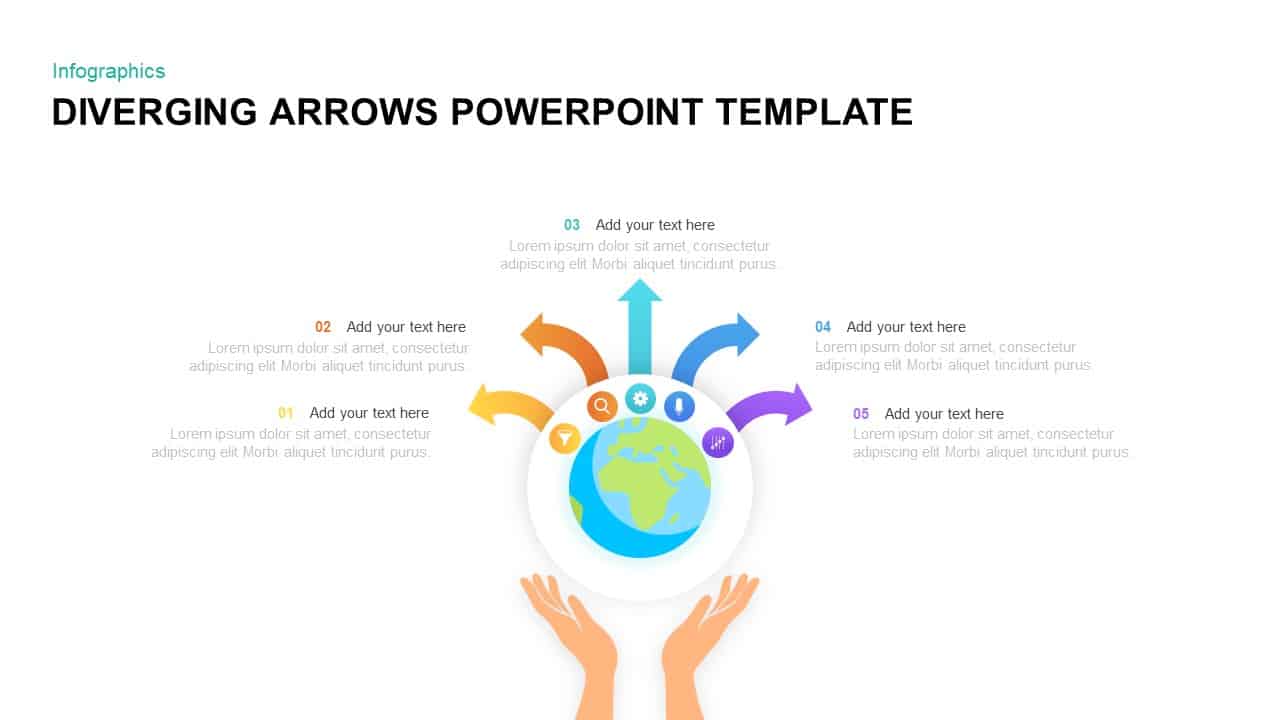
Diverging Globe Arrows Infographic Template for PowerPoint & Google Slides
Arrow
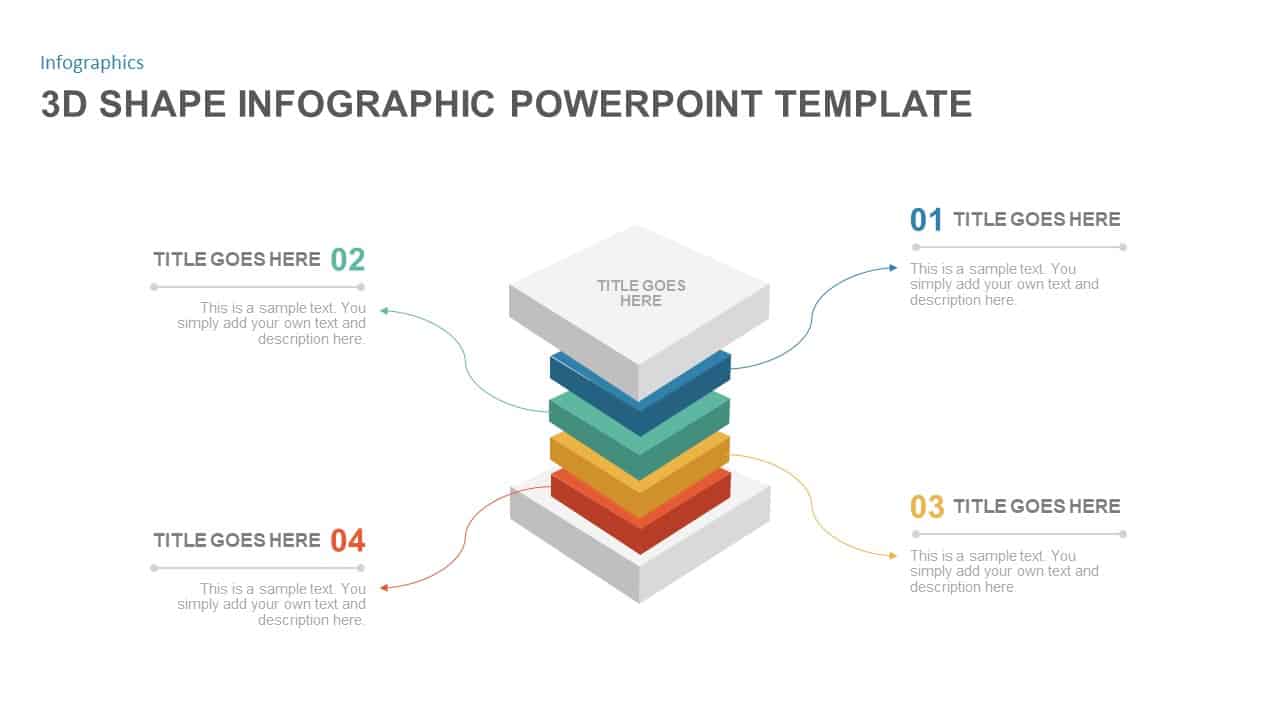
3D Layered Infographic Diagram Template for PowerPoint & Google Slides
Infographics
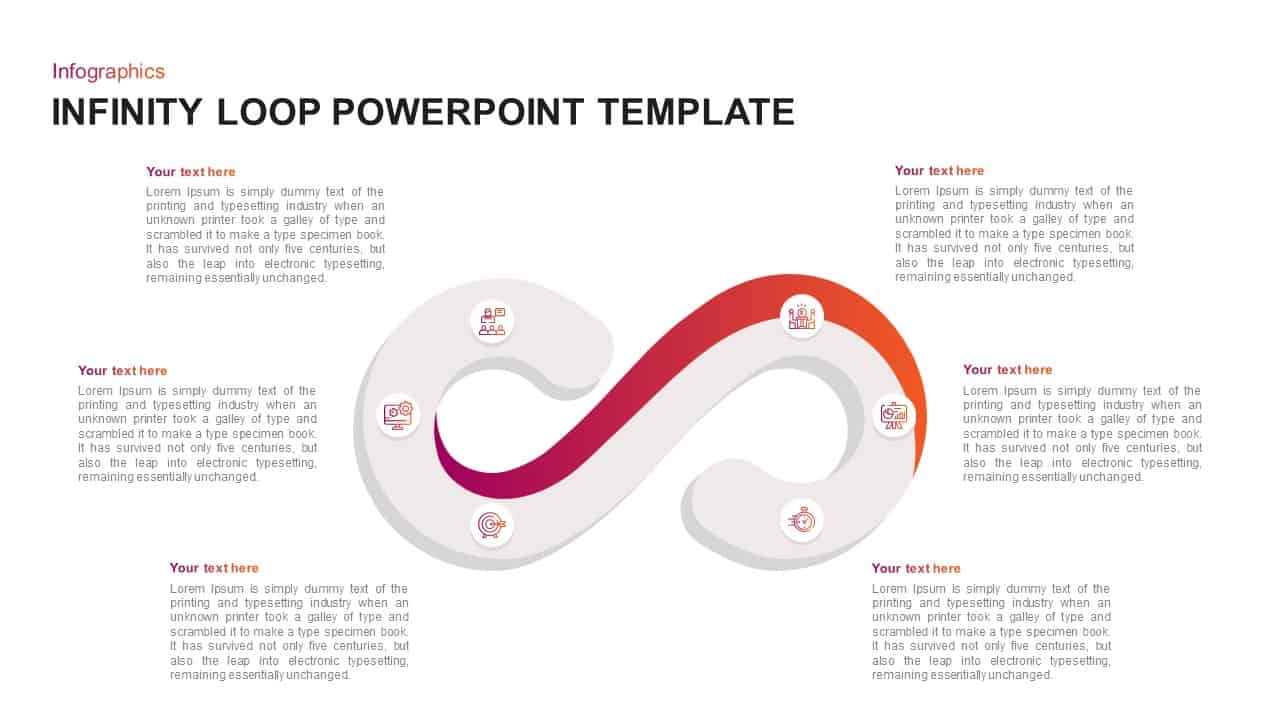
Infinity Loop Infographic template for PowerPoint & Google Slides
Process

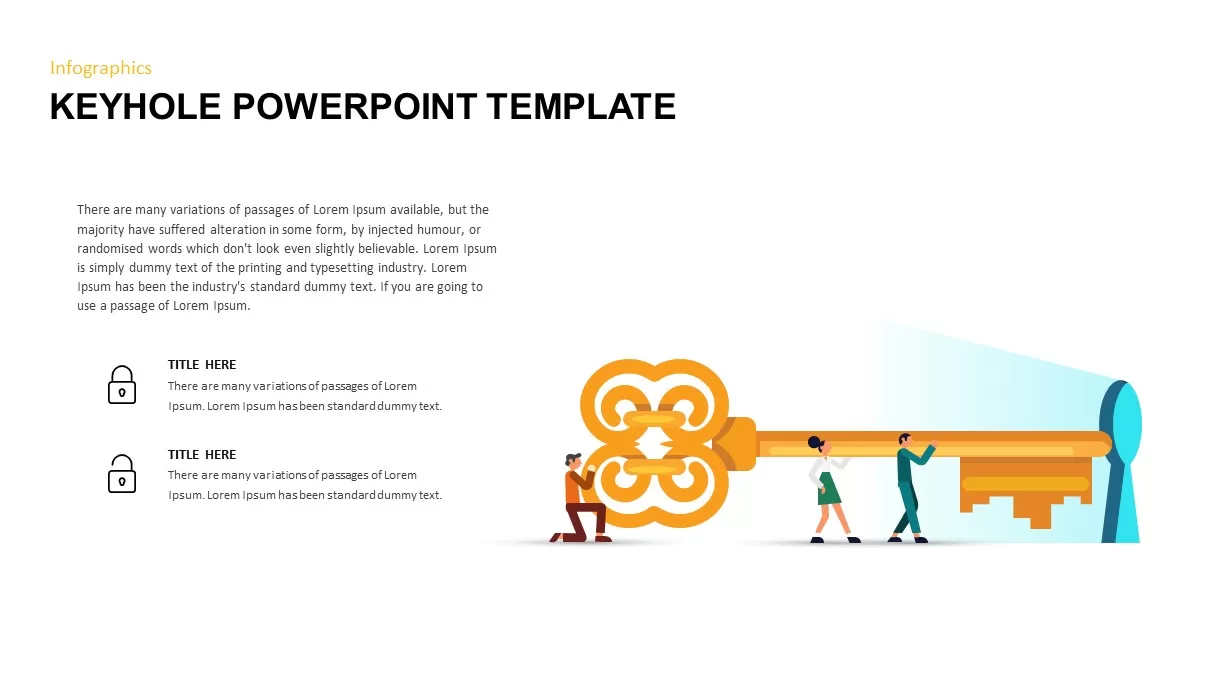
Keyhole Infographic Process Diagram Template for PowerPoint & Google Slides
Process
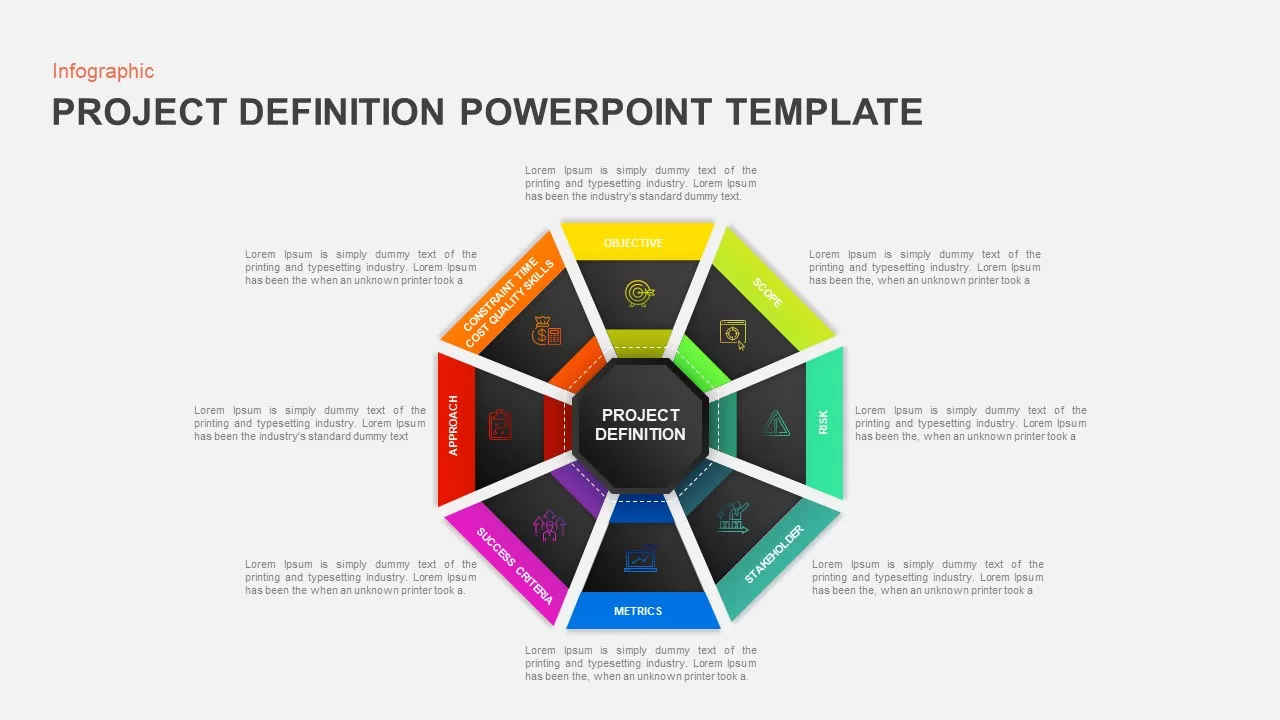
Octagonal Project Definition Infographic Template for PowerPoint & Google Slides
Process
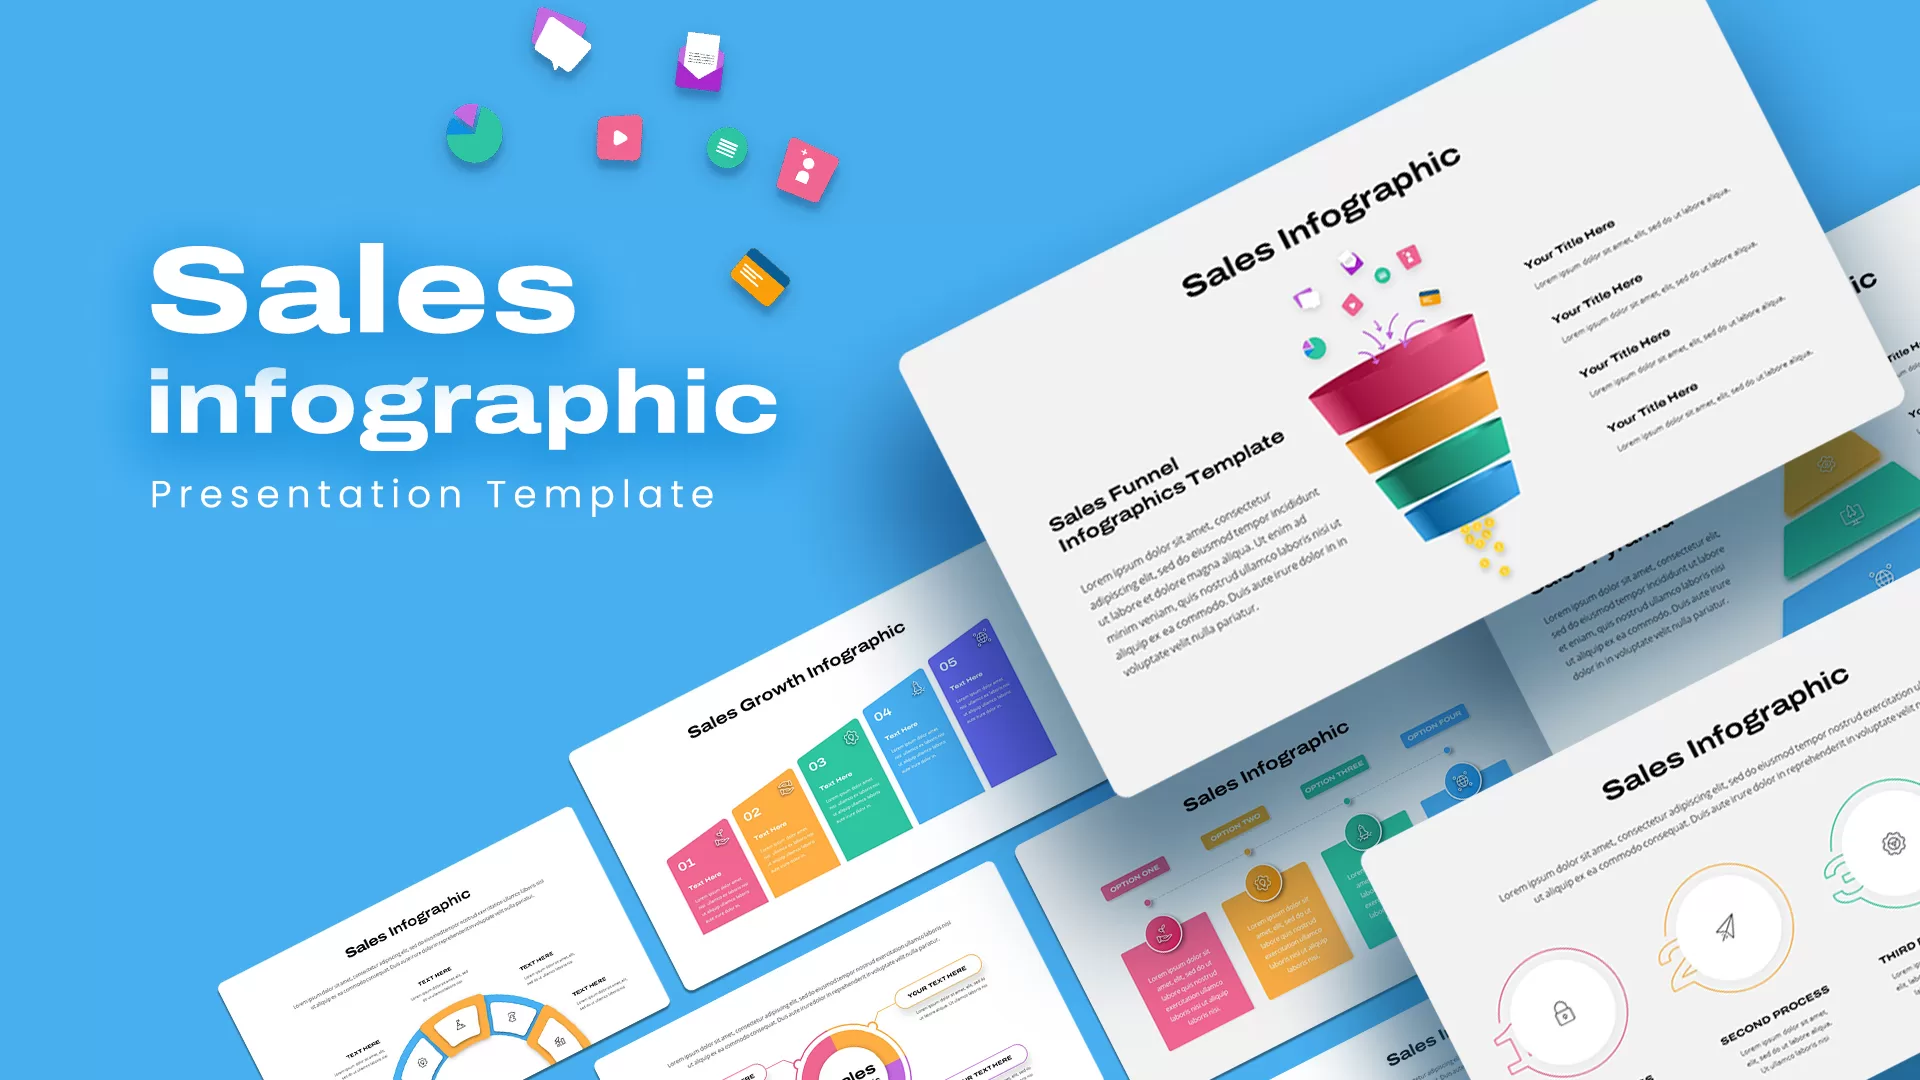
Sales Infographic pack for PowerPoint & Google Slides
Business
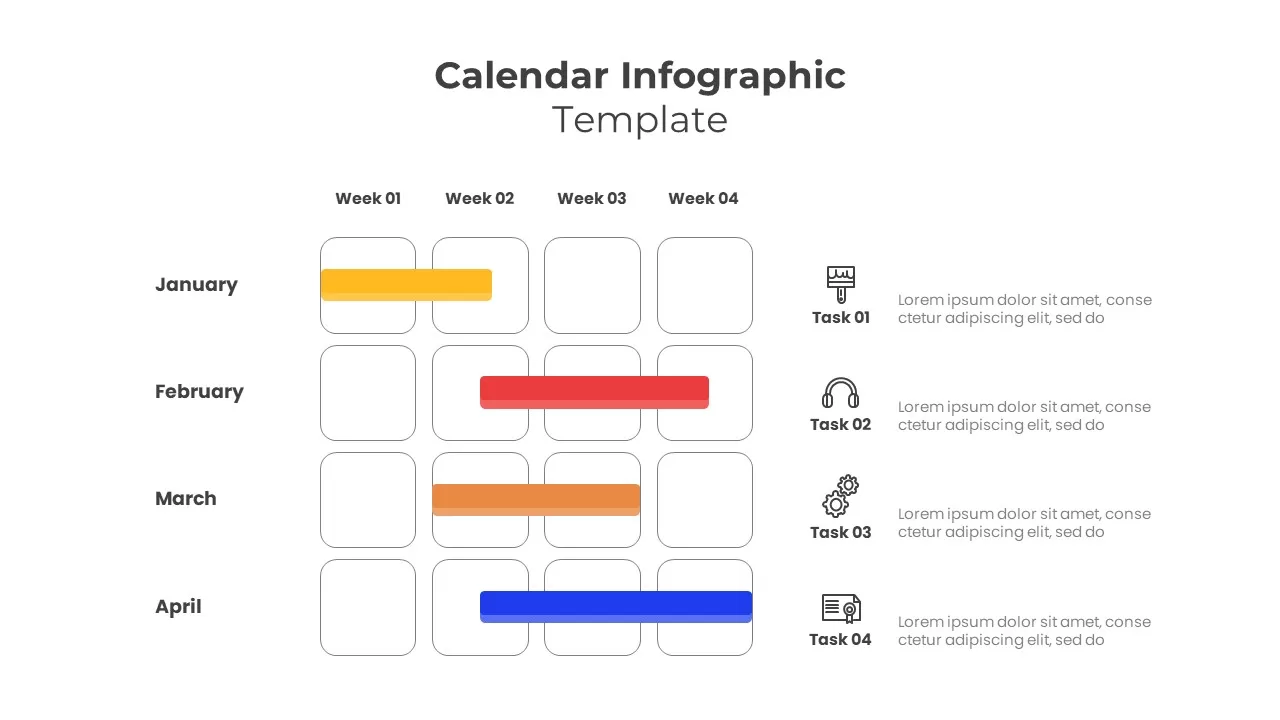
Task Scheduling Calendar Infographic Template for PowerPoint & Google Slides
Agenda

Free Five-Step Circular Timeline Infographic Template for PowerPoint & Google Slides
Timeline
Free
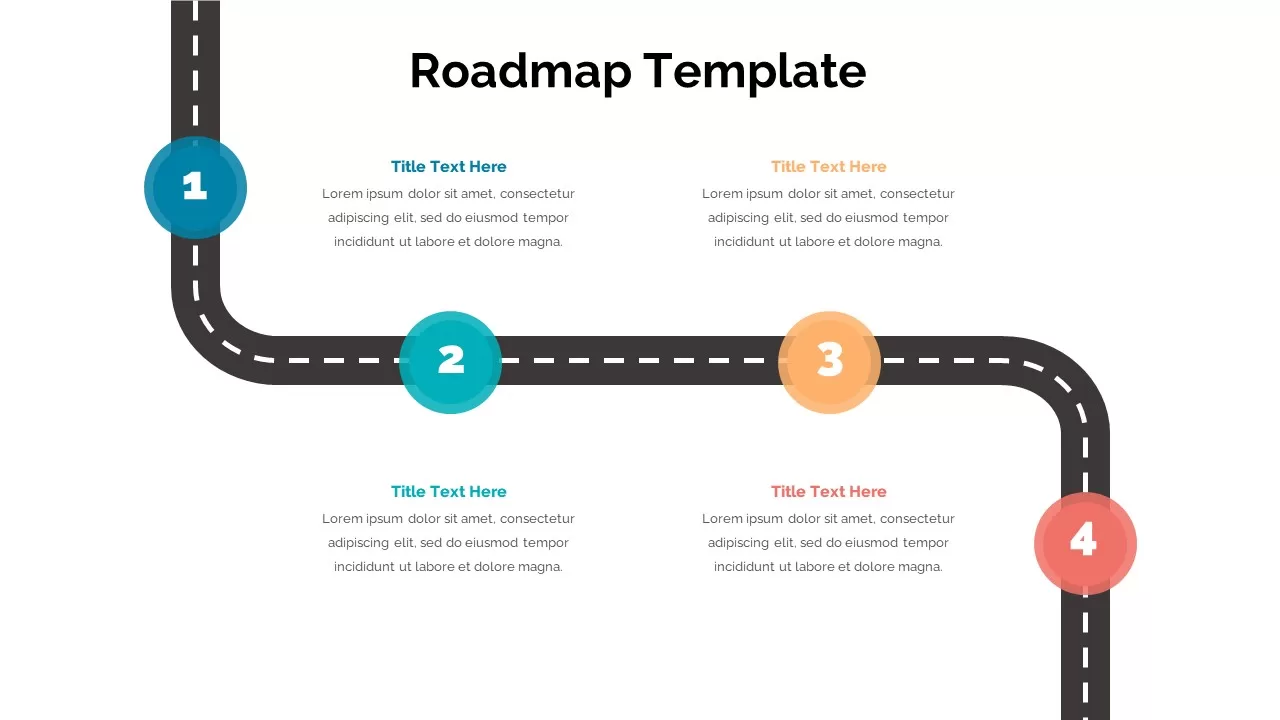
Roadmap Infographic template for PowerPoint & Google Slides
Roadmap
Professional Nurse Infographic Dashboard Template for PowerPoint & Google Slides
Nursing
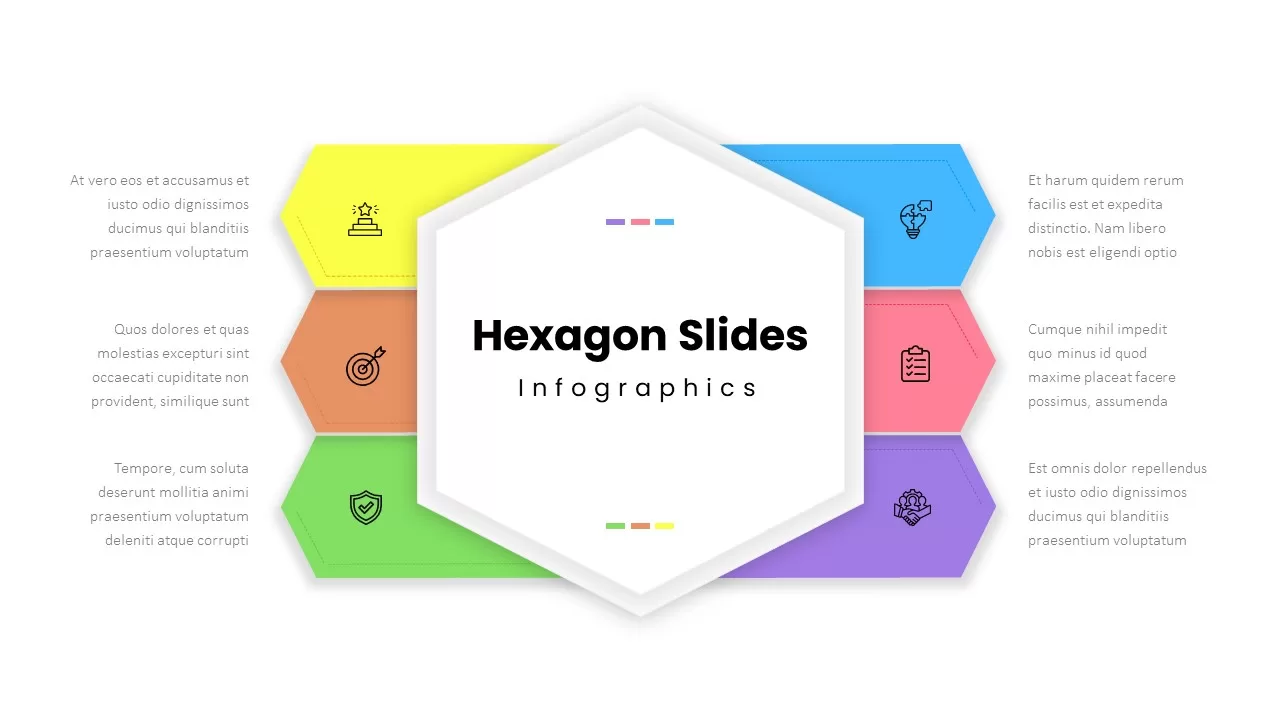
Six-Step Hexagon Infographic Layout Template for PowerPoint & Google Slides
Infographics
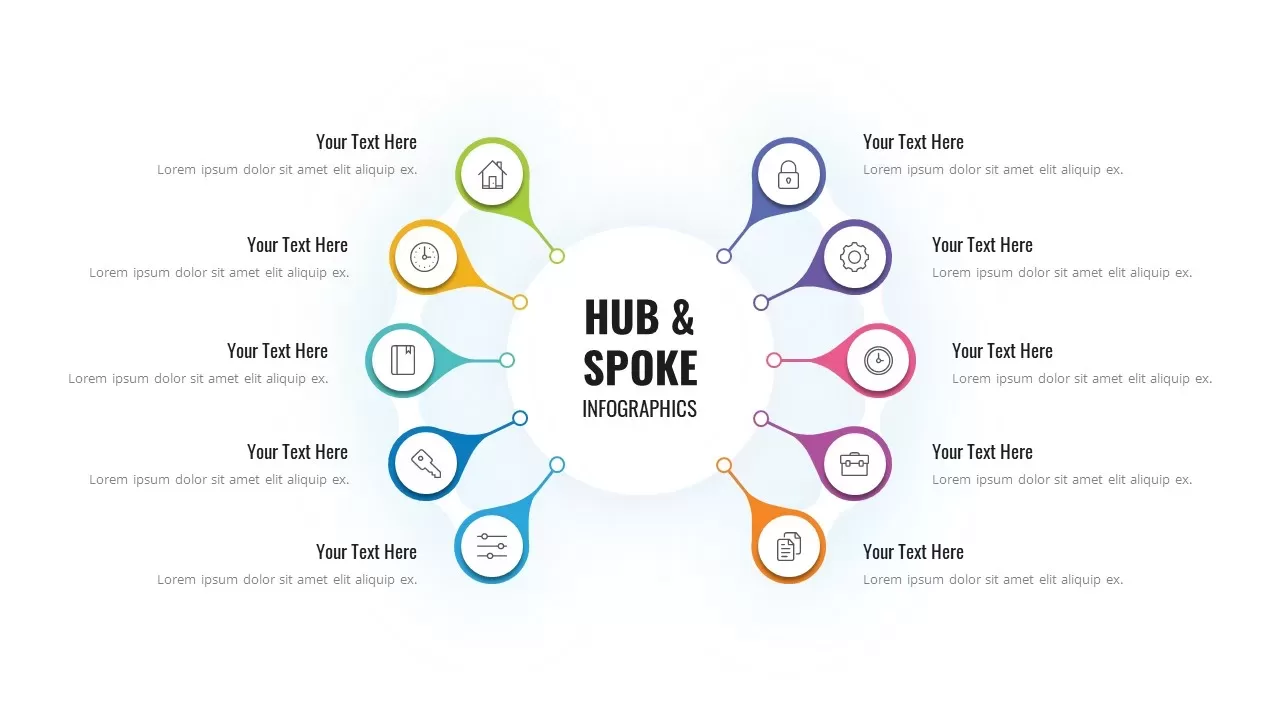
Colorful Hub-and-Spoke Infographic Template for PowerPoint & Google Slides
Circular
Free Metro UI Dashboard Infographic Template for PowerPoint & Google Slides
Business Report
Free
Animated Multi-Gear Cluster Infographic Template for PowerPoint & Google Slides
Process
Shield Four-Segment Infographic Template for PowerPoint & Google Slides
Process
VUCA vs BANI Comparison Infographic Template for PowerPoint & Google Slides
Comparison