Porter’s Value Chain Analysis Diagram Template for PowerPoint & Google Slides
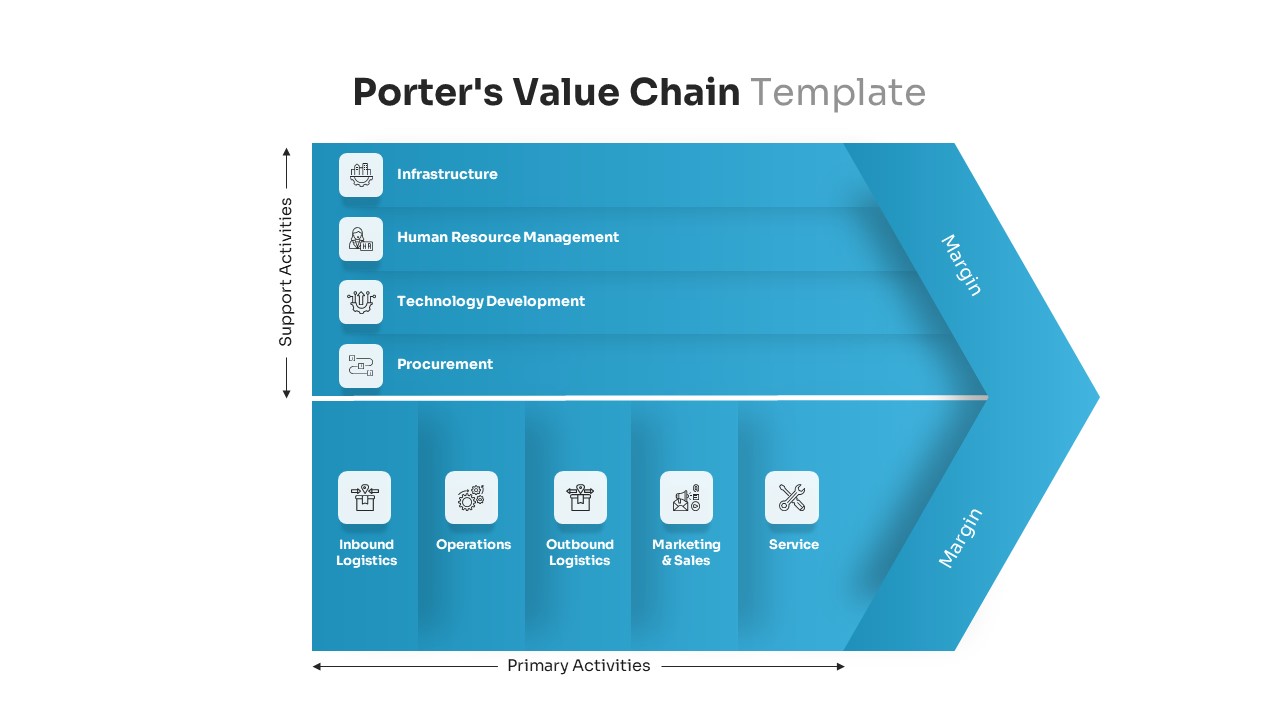
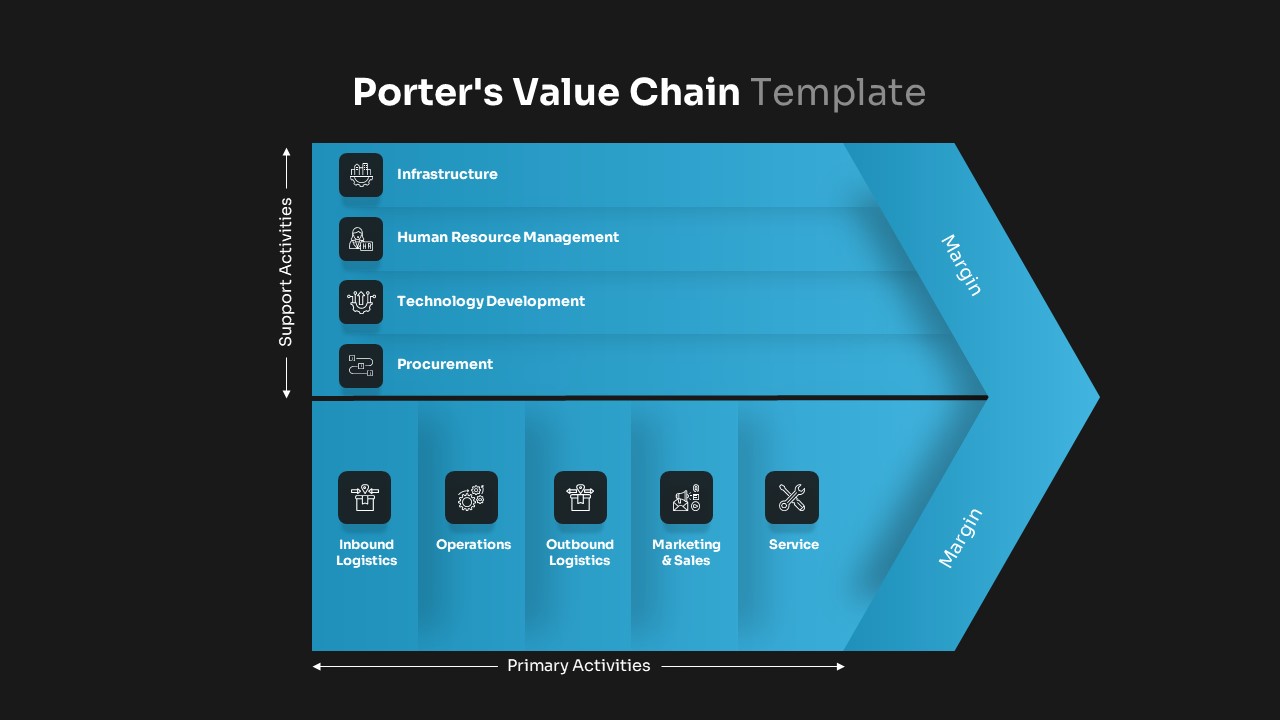
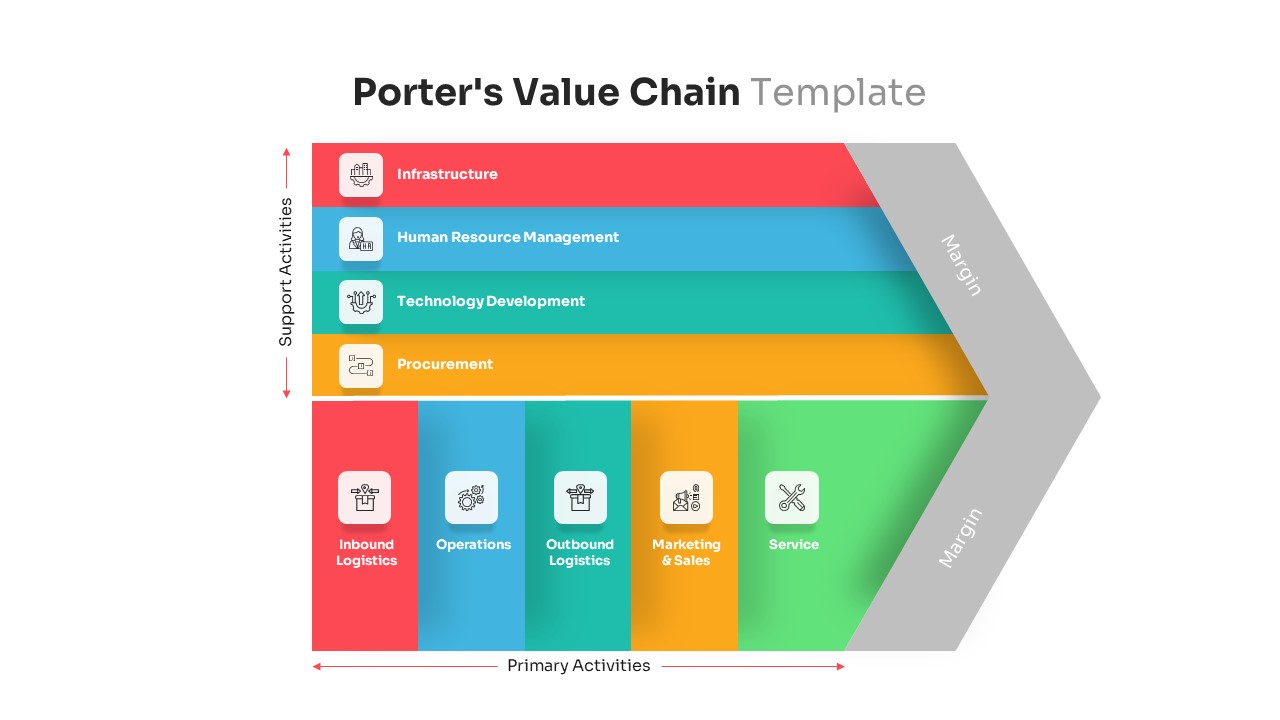
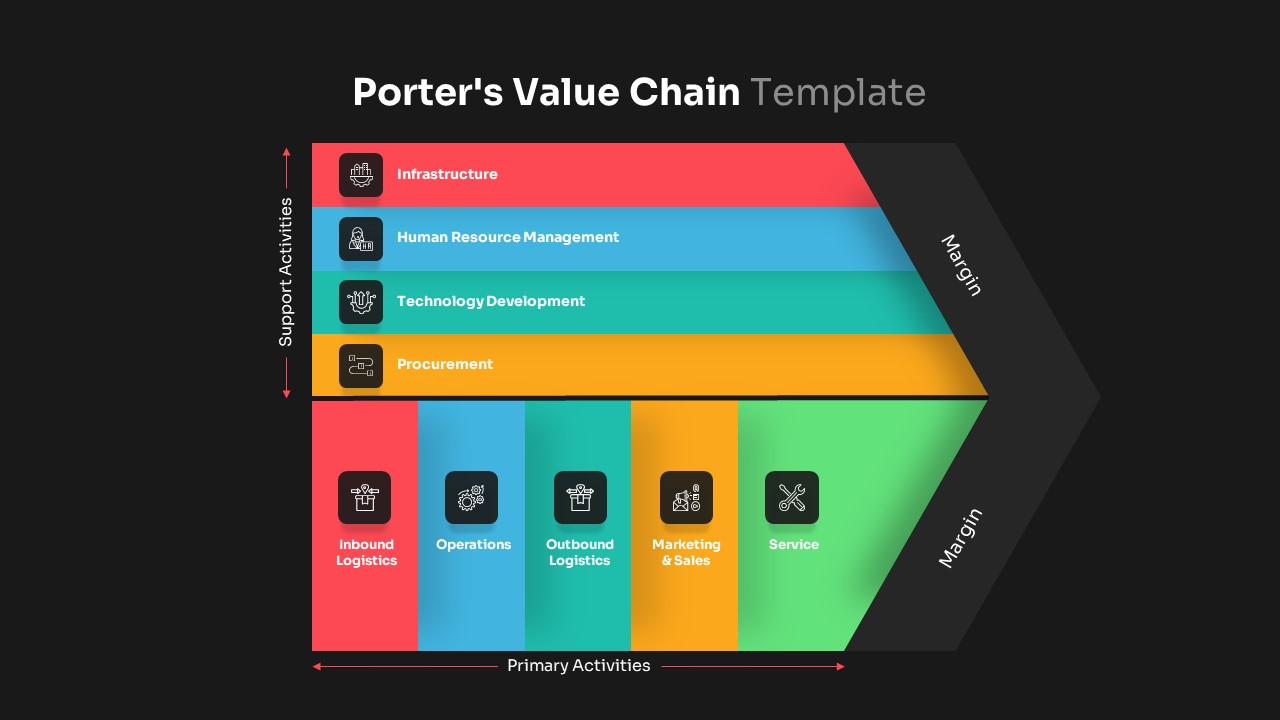


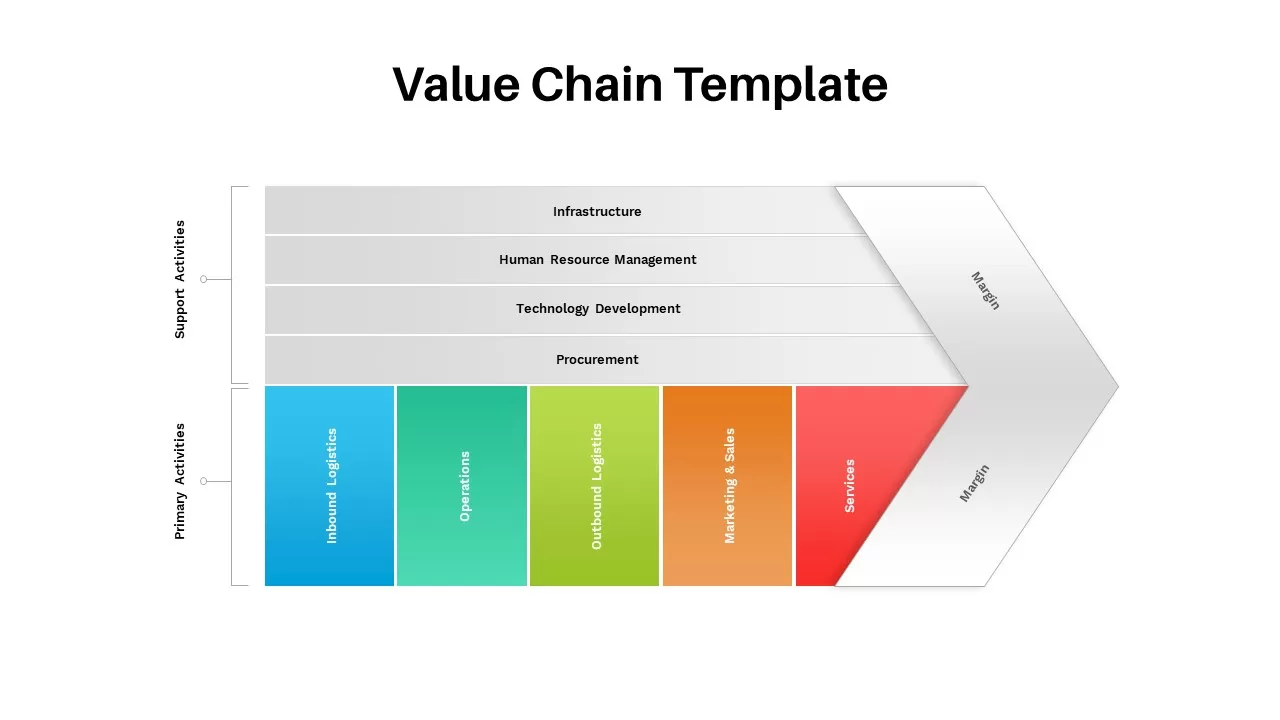
Utilize this comprehensive Value Chain Analysis slide to visually represent the key support and primary activities that drive your organization’s competitive advantage. This template organizes Infrastructure, Human Resource Management, Technology Development, and Procurement into clearly labeled, gradient-filled panels along the top, while Inbound Logistics, Operations, Outbound Logistics, Marketing & Sales, and Service are arranged across the bottom to map primary functions. A bold directional arrow on the right emphasizes margin potential, reinforcing the link between activity series and value creation. Each segment contains a crisp icon within a white rounded square, delivering immediate visual cues and supporting rapid comprehension. The cohesive blue gradient design balances modern aesthetics with professional clarity, ensuring consistent branding across PowerPoint and Google Slides presentations.
Designed for ease of customization, this asset features editable shapes, integrated icon placeholders, and text fields with master-slide integration for seamless updates. Swap icons, adjust color gradients, or modify labels in seconds to align with organizational terminology or industry context. The slide’s logical flow from left to right guides audiences through the value chain narrative, simplifying stakeholder education, strategic workshops, or boardroom discussions. Electric gradient fills and subtle drop shadows add depth without compromising minimalism, while standardized typography ensures readability at any scale or resolution.
Beyond traditional value chain demonstrations, this template adapts to a wide range of strategic analyses and operational reviews. Repurpose panels to illustrate process workflows, supply chain staging, product lifecycle phases, or cost breakdowns. Use the margin arrow to highlight profit levers, efficiency improvements, or post-implementation gains. Whether preparing investor briefings, strategic planning documents, or academic lectures on business strategy, this slide streamlines content delivery and enhances audience engagement with maximum impact and minimal effort.
Who is it for
Business strategists, management consultants, and operations managers will benefit from this slide when mapping organizational activities and communicating value creation. Entrepreneurs, MBA students, and supply chain analysts can leverage the intuitive layout to analyze efficiency and profit levers.
Other Uses
Apart from value chain presentations, repurpose this template for process workflows, product lifecycle stages, or cost breakdowns. Highlight risk assessments, departmental responsibilities, or performance metrics in training sessions or academic lectures.
Login to download this file

Item ID
SB00348
Related Templates

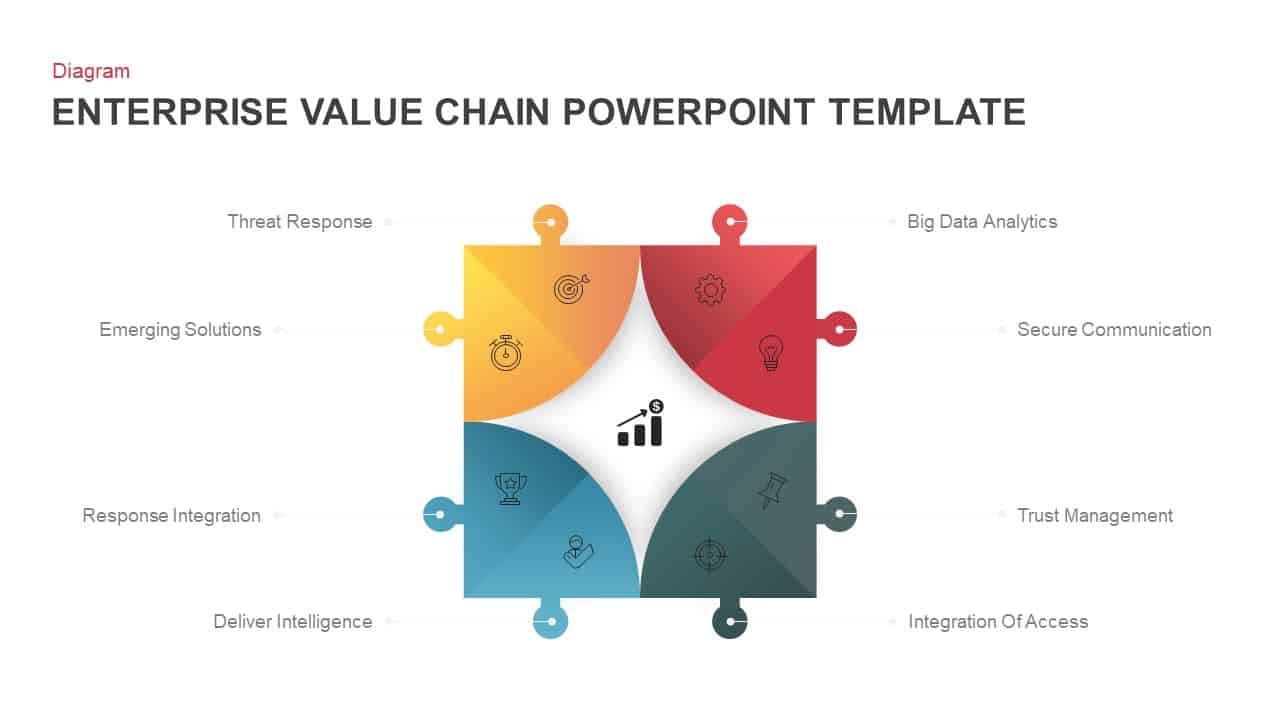
Enterprise Value Chain Puzzle Diagram Template for PowerPoint & Google Slides
Business Models
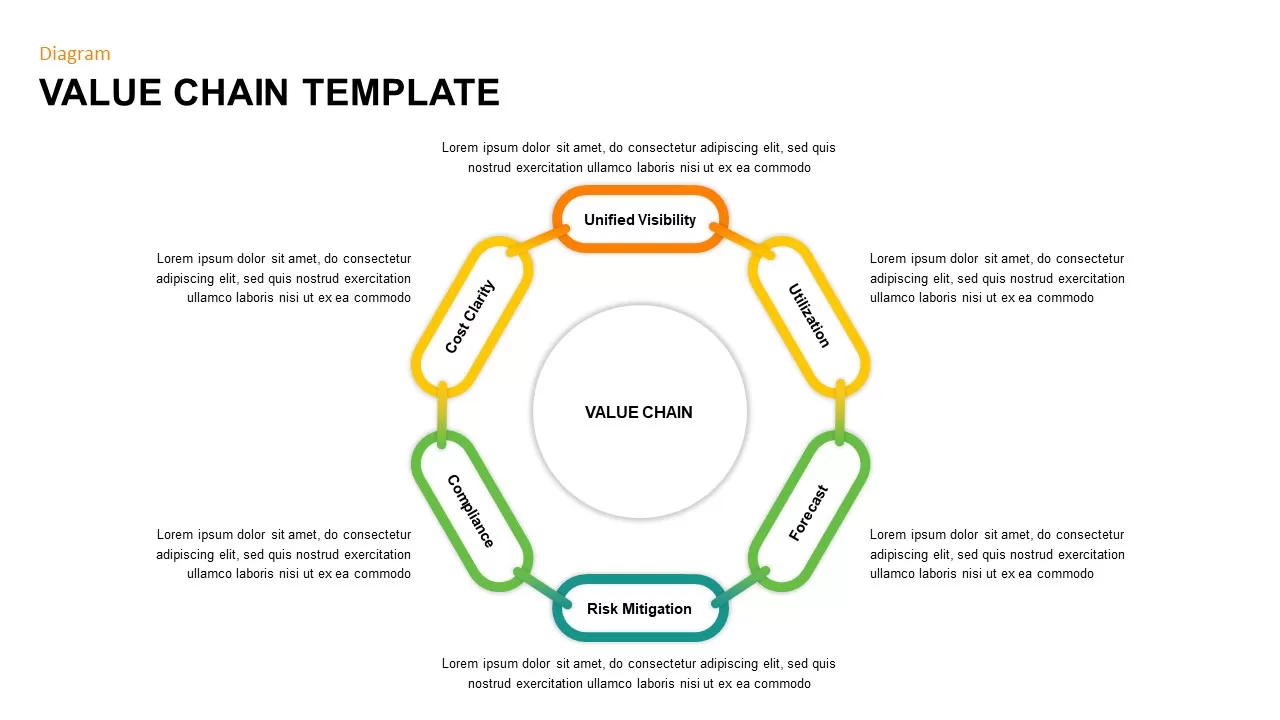
Value Chain Circular Process Diagram Template for PowerPoint & Google Slides
Business Models
Value Chain Diagram template for PowerPoint & Google Slides
Business Strategy
Value Chain Template for PowerPoint & Google Slides
Business Strategy
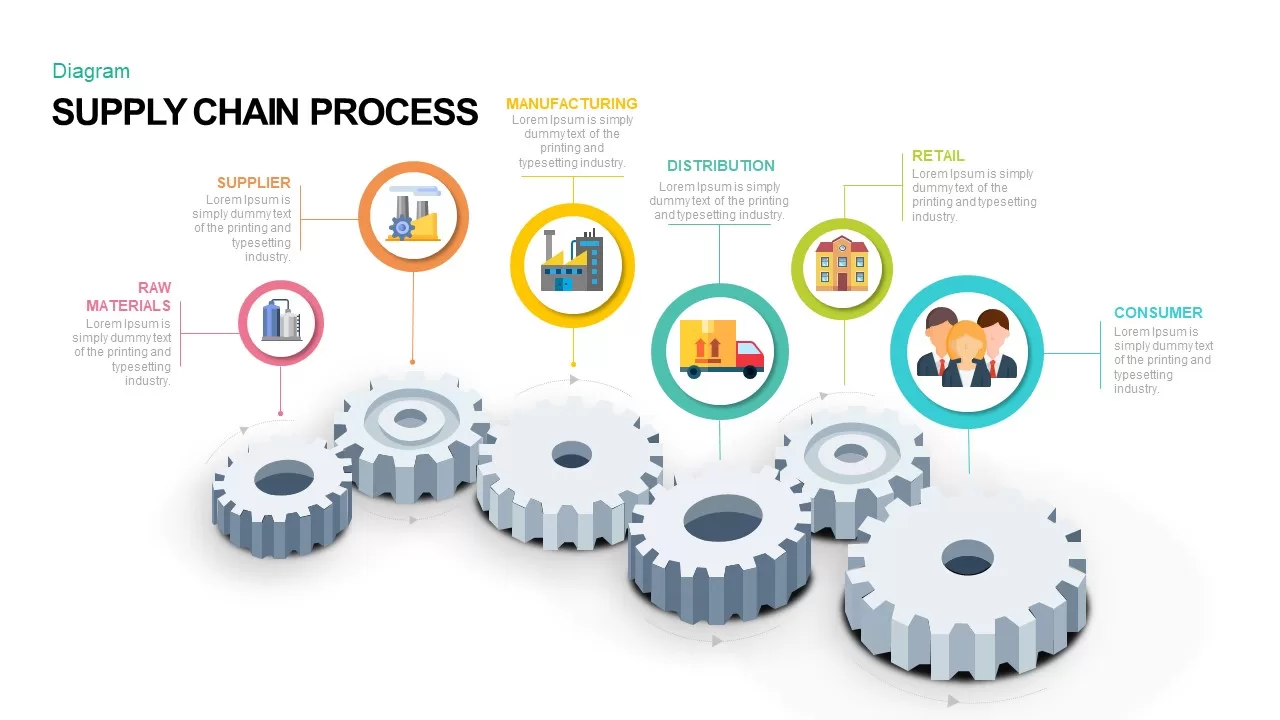
Supply Chain Process Gear Diagram Template for PowerPoint & Google Slides
Process
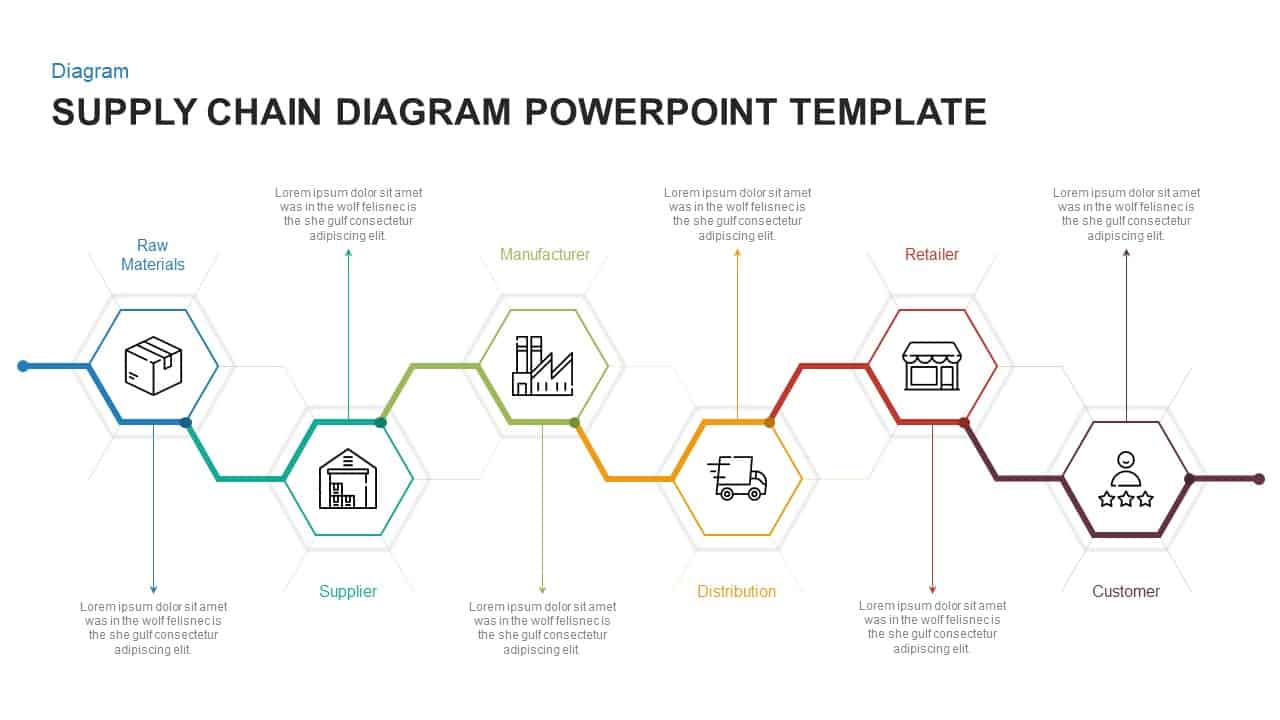
Hexagonal Supply Chain Diagram Template for PowerPoint & Google Slides
Process
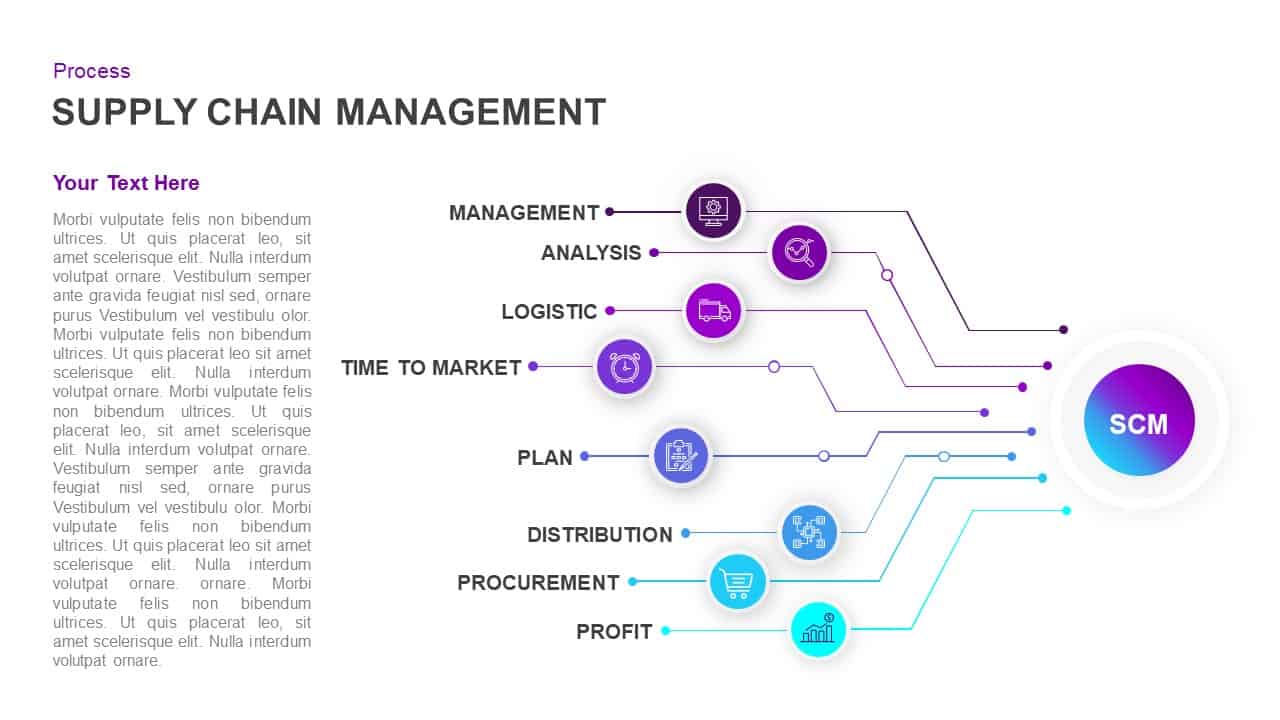
Supply Chain Management Process Diagram Template for PowerPoint & Google Slides
Process
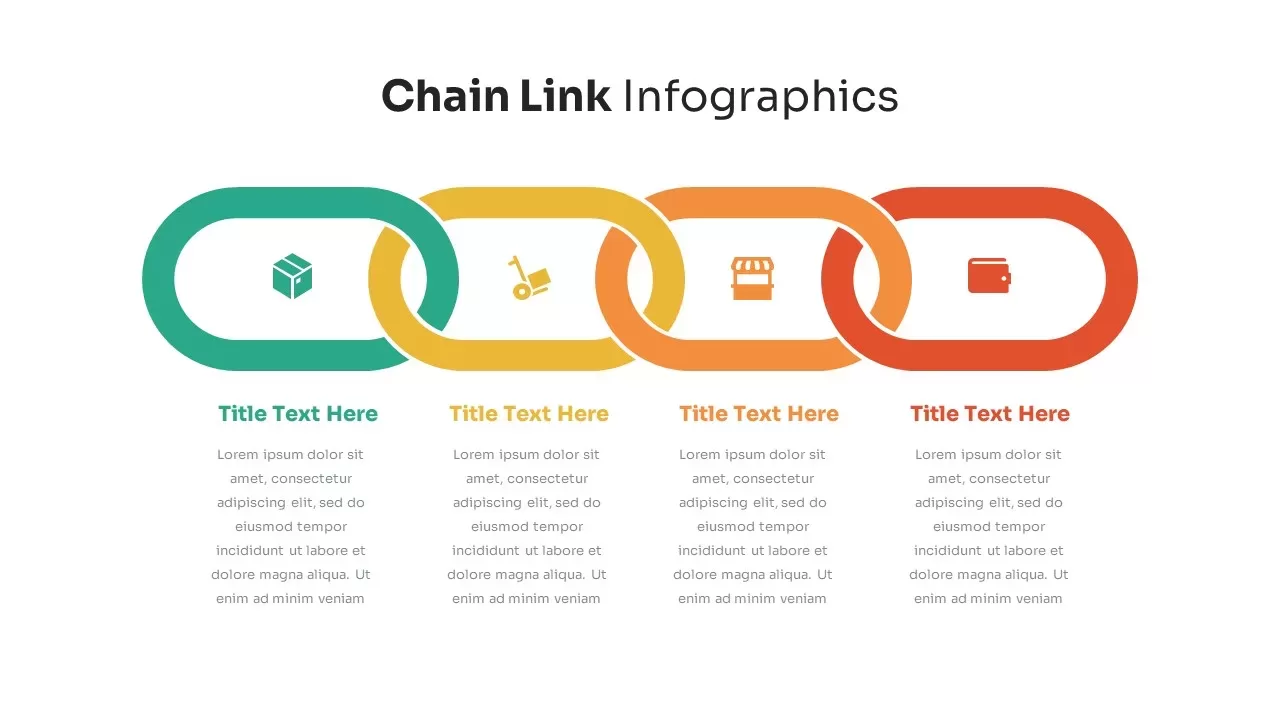
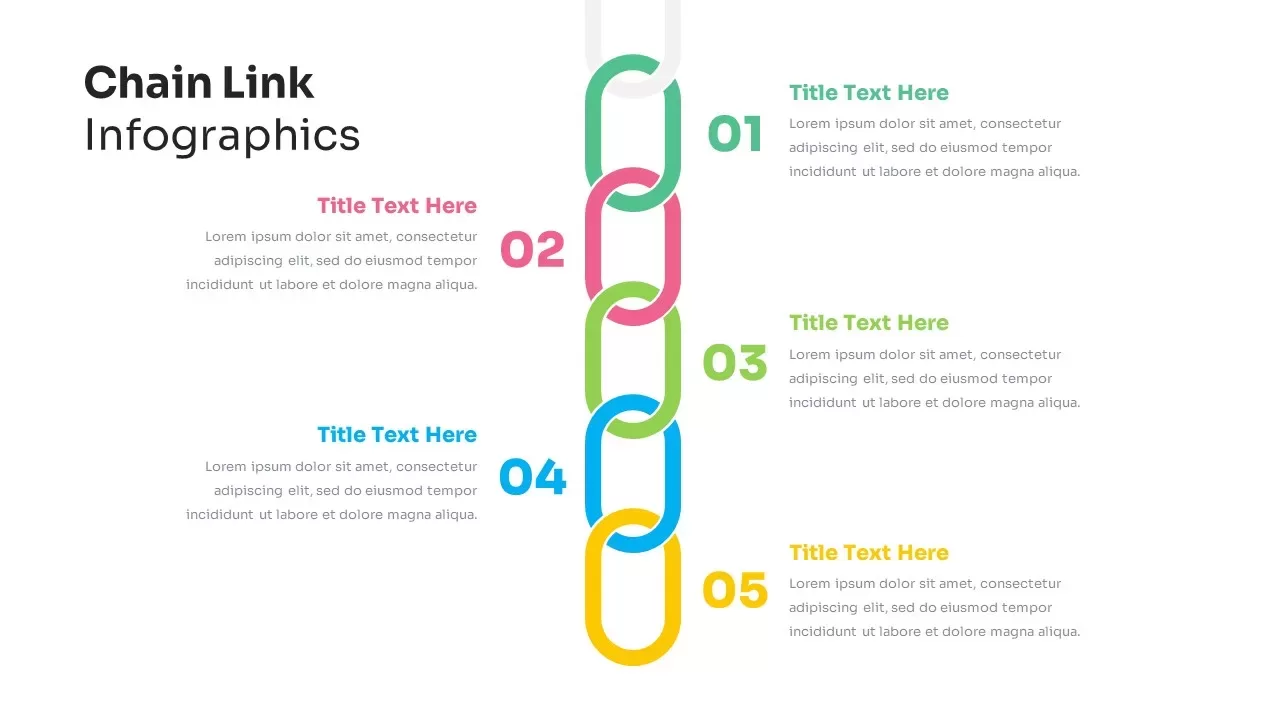
Chain Link Process Infographic Diagram Template for PowerPoint & Google Slides
Process
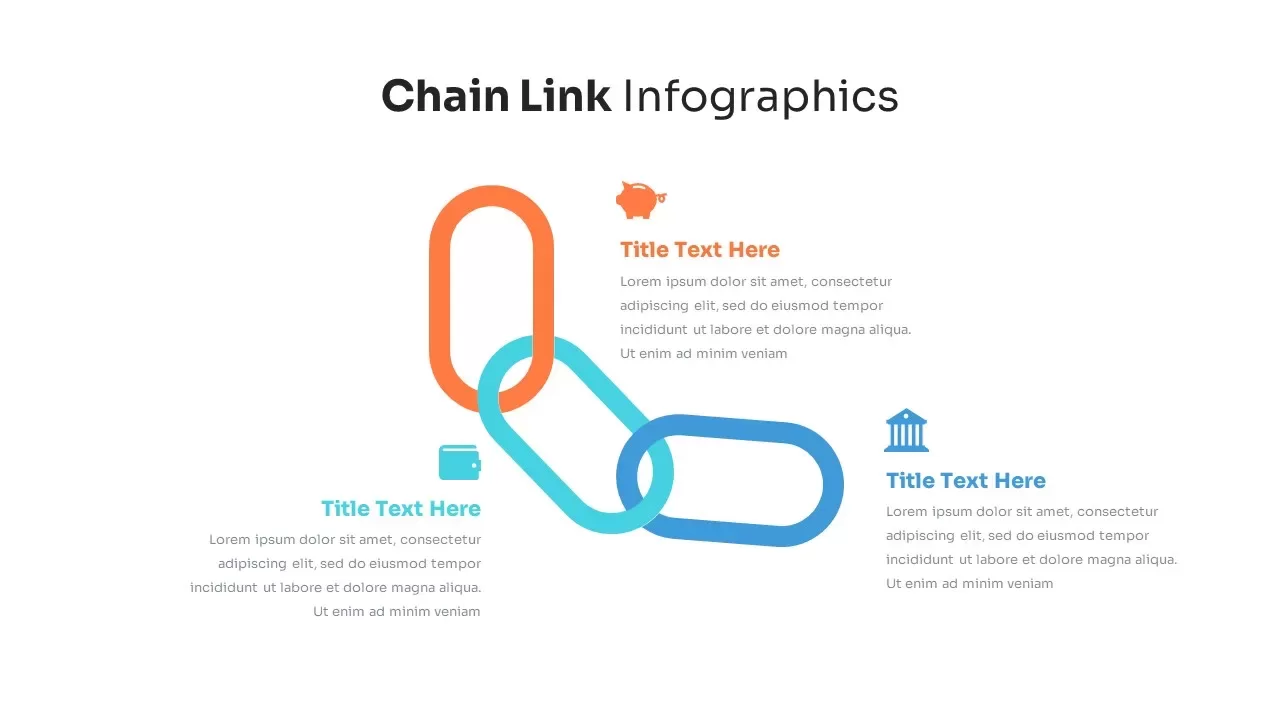
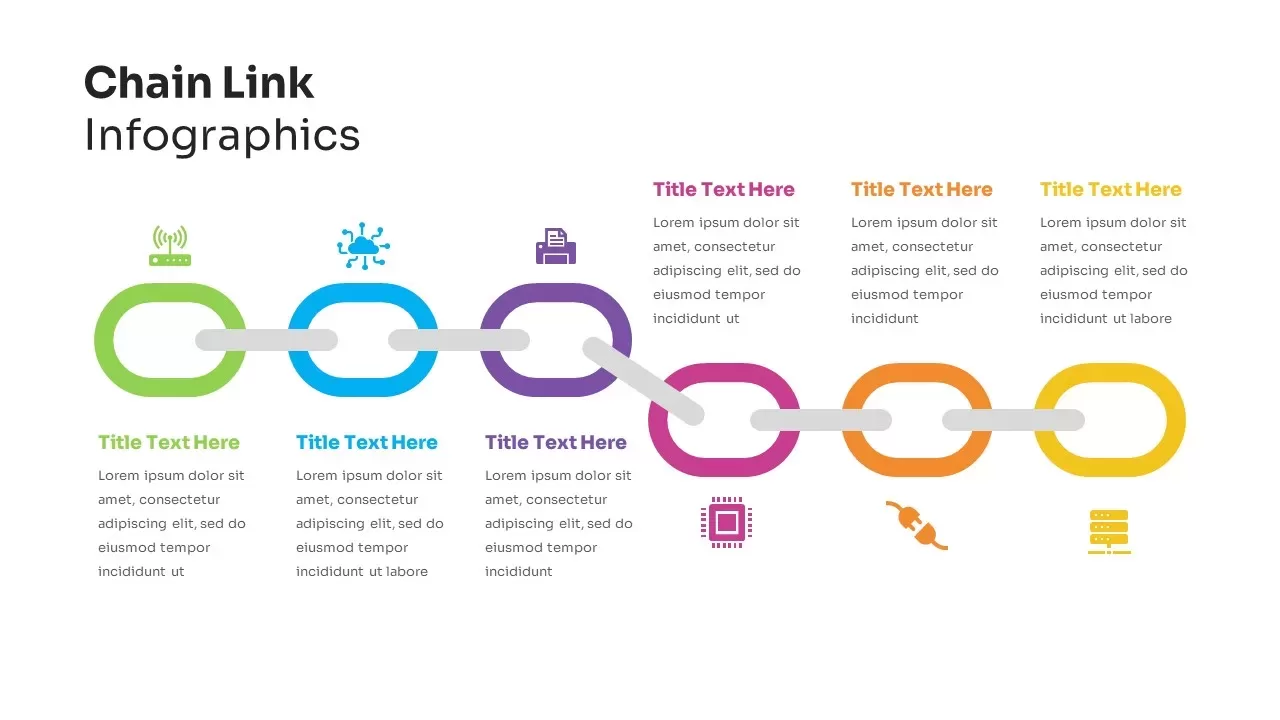
Chain Link Process Infographic Diagram Template for PowerPoint & Google Slides
Process
Chain Link Process Infographic Diagram Template for PowerPoint & Google Slides
Process
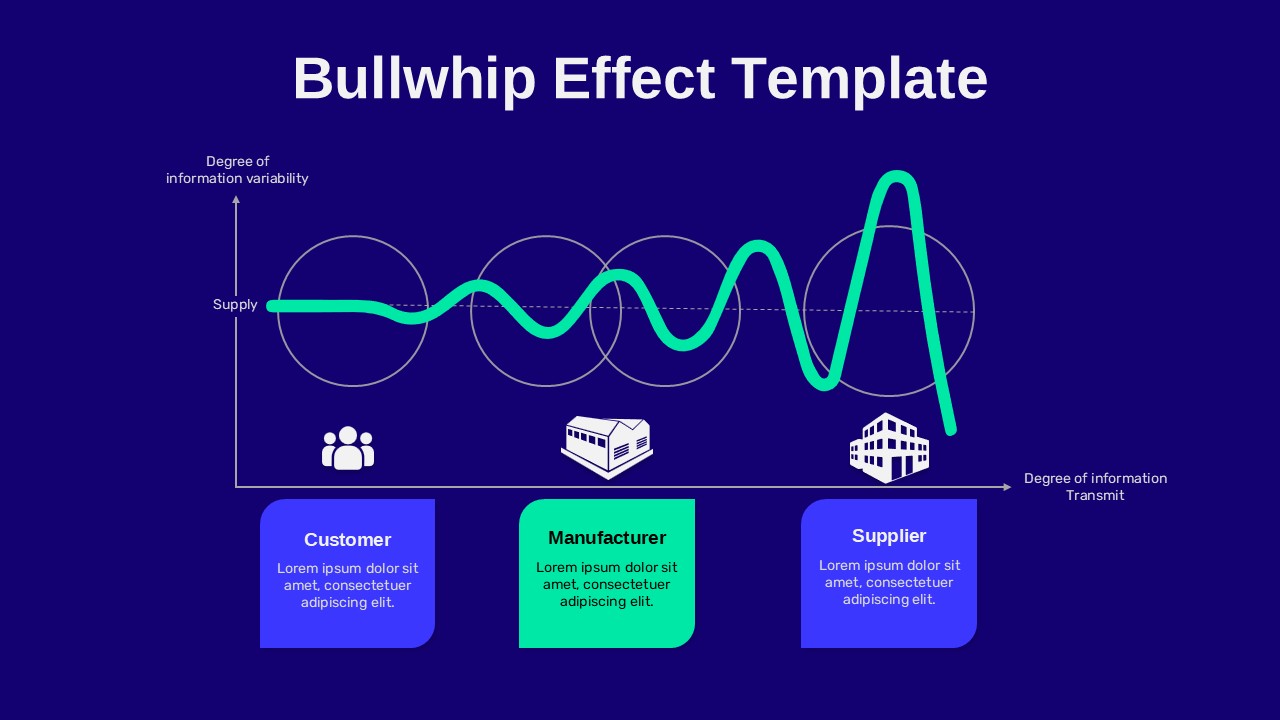
Bullwhip Effect Supply Chain Variability Diagram Template for PowerPoint & Google Slides
Business Models
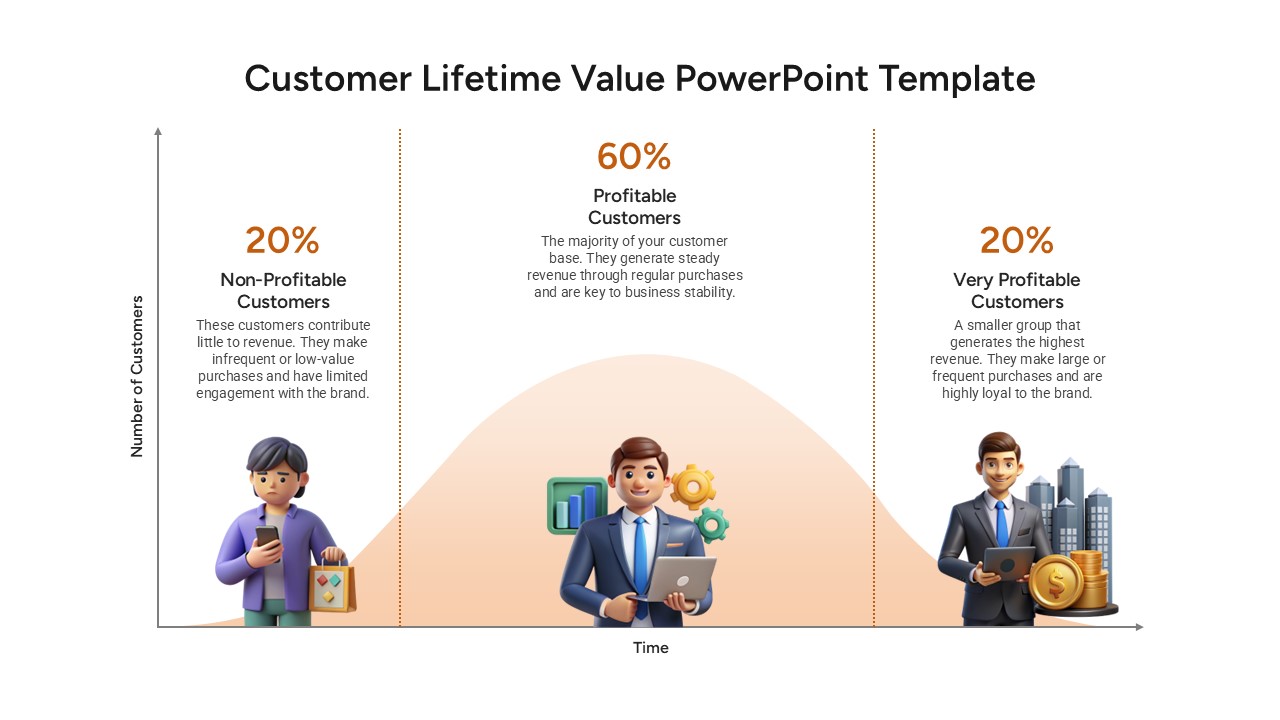
Customer Lifetime Value Analysis for PowerPoint & Google Slides
Customer Journey
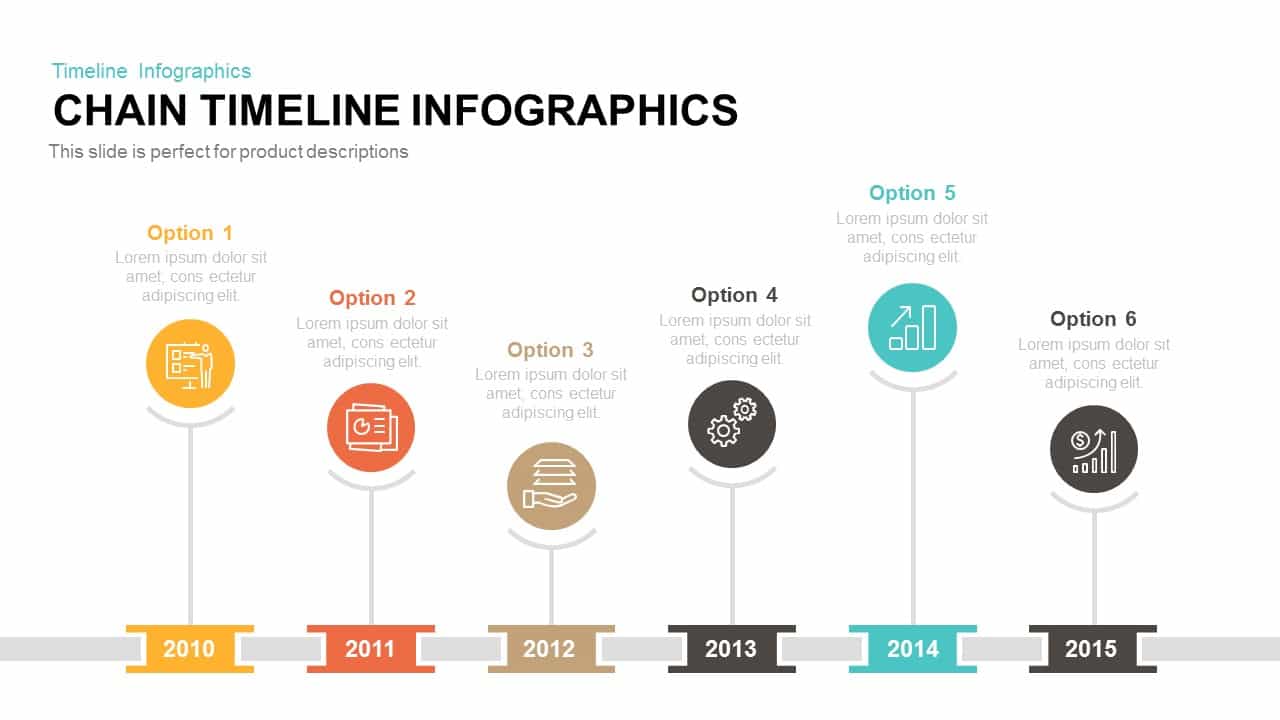
Chain Timeline template for PowerPoint & Google Slides
Timeline
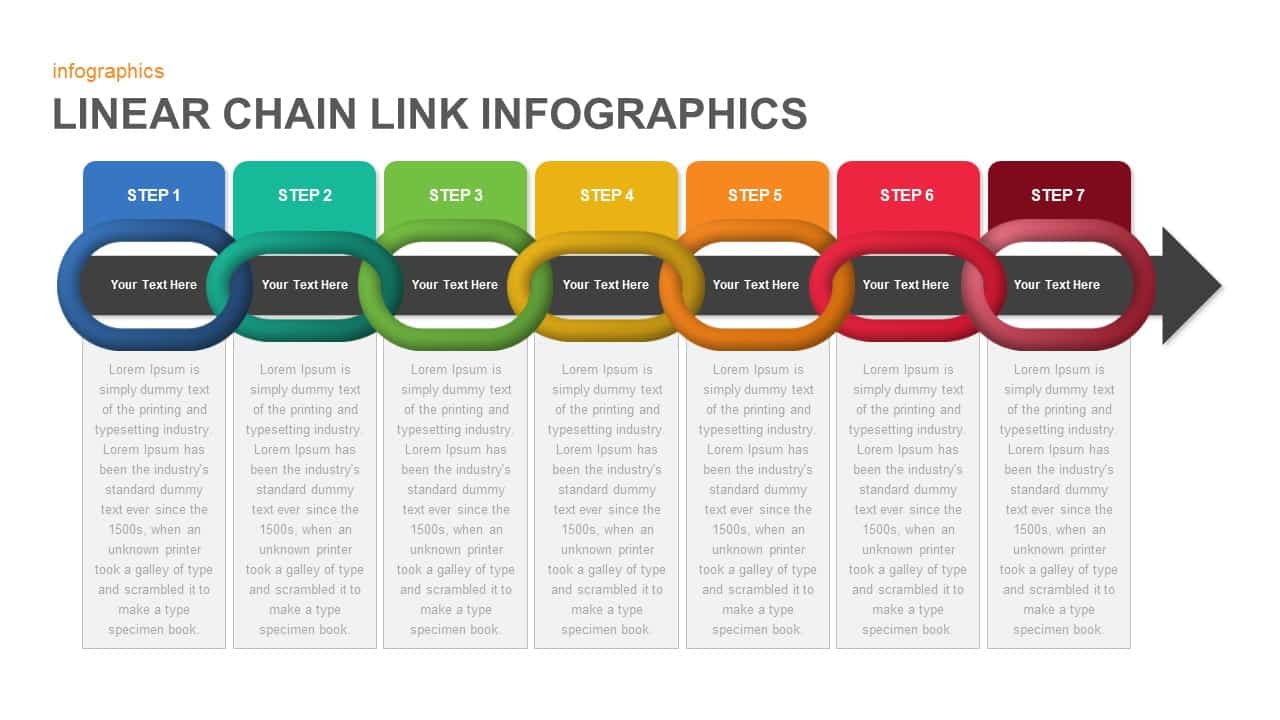
Linear Chain Link Infographics Template for PowerPoint & Google Slides
Process
Logistics and Supply Chain Management Template for PowerPoint & Google Slides
Process
Supply Chain Analytics Process Template for PowerPoint & Google Slides
Process
Supply Chain Management Logistics Cover Template for PowerPoint & Google Slides
Pitch Deck
Supply Chain Circular Process Infographics Template for PowerPoint & Google Slides
Business Strategy
Five-Step Chain Link Process Infographic Template for PowerPoint & Google Slides
Process
Six-Step Chain Link Technology Process Template for PowerPoint & Google Slides
Process
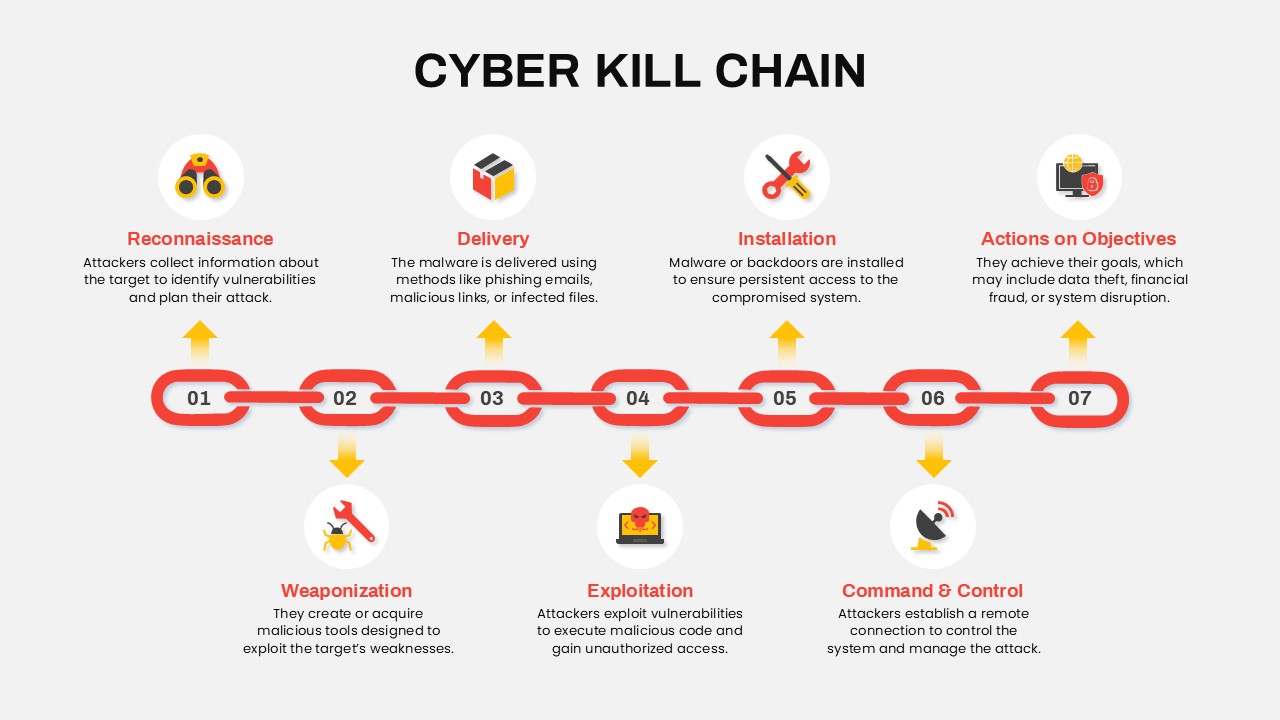
Cyber Kill Chain Template for PowerPoint & Google Slides
Information Technology
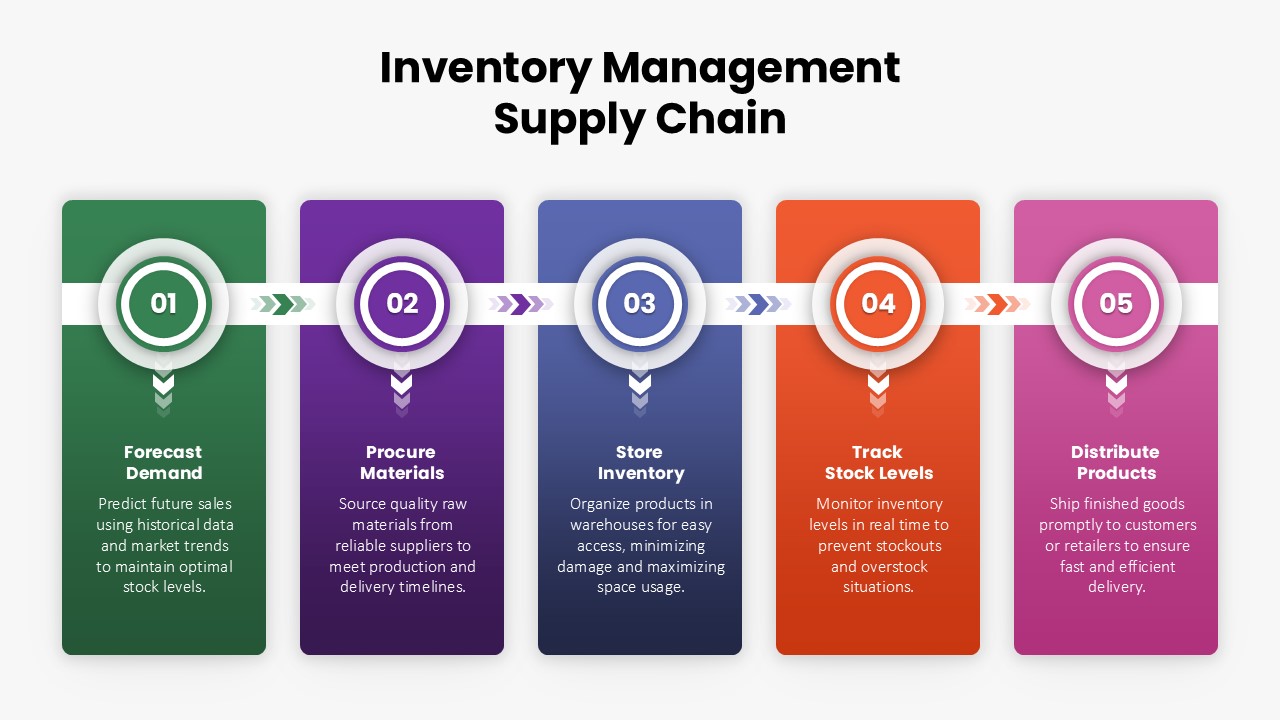
Inventory Management Supply Chain Template for PowerPoint & Google Slides
Process
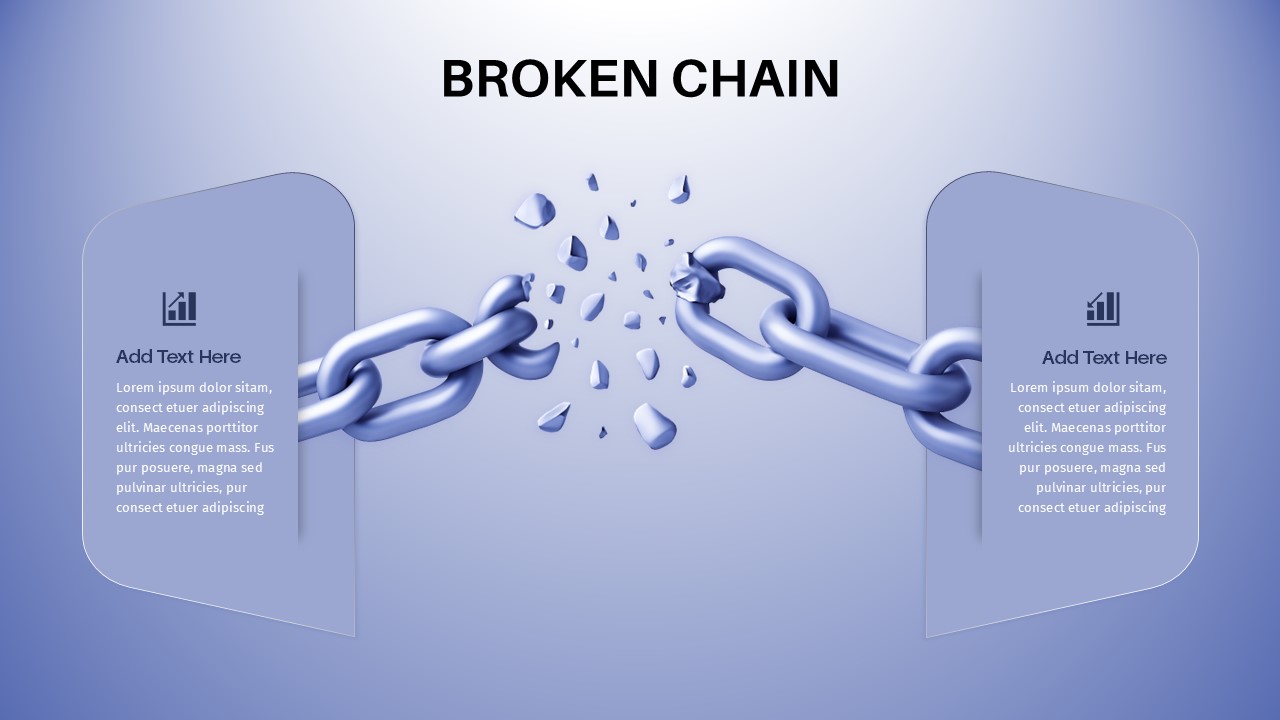
Broken Chain Concept template for PowerPoint & Google Slides
Business
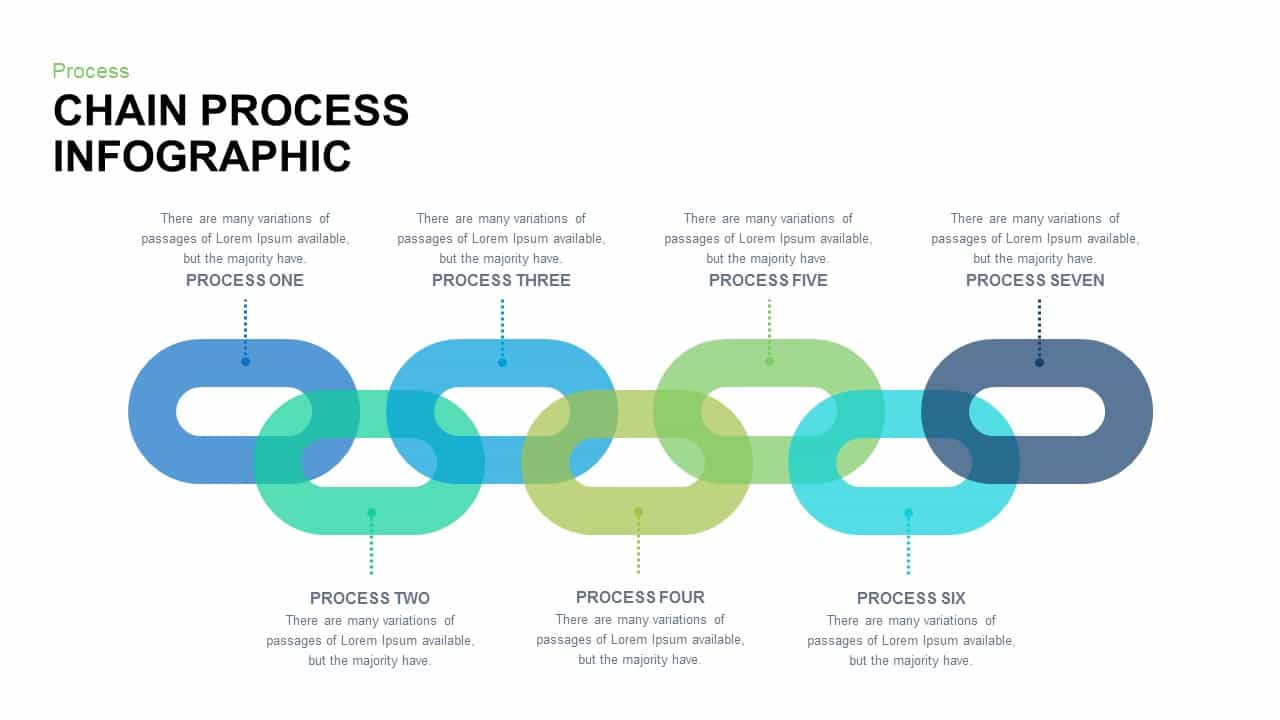
Chain Process Infographic for PowerPoint & Google Slides
Process
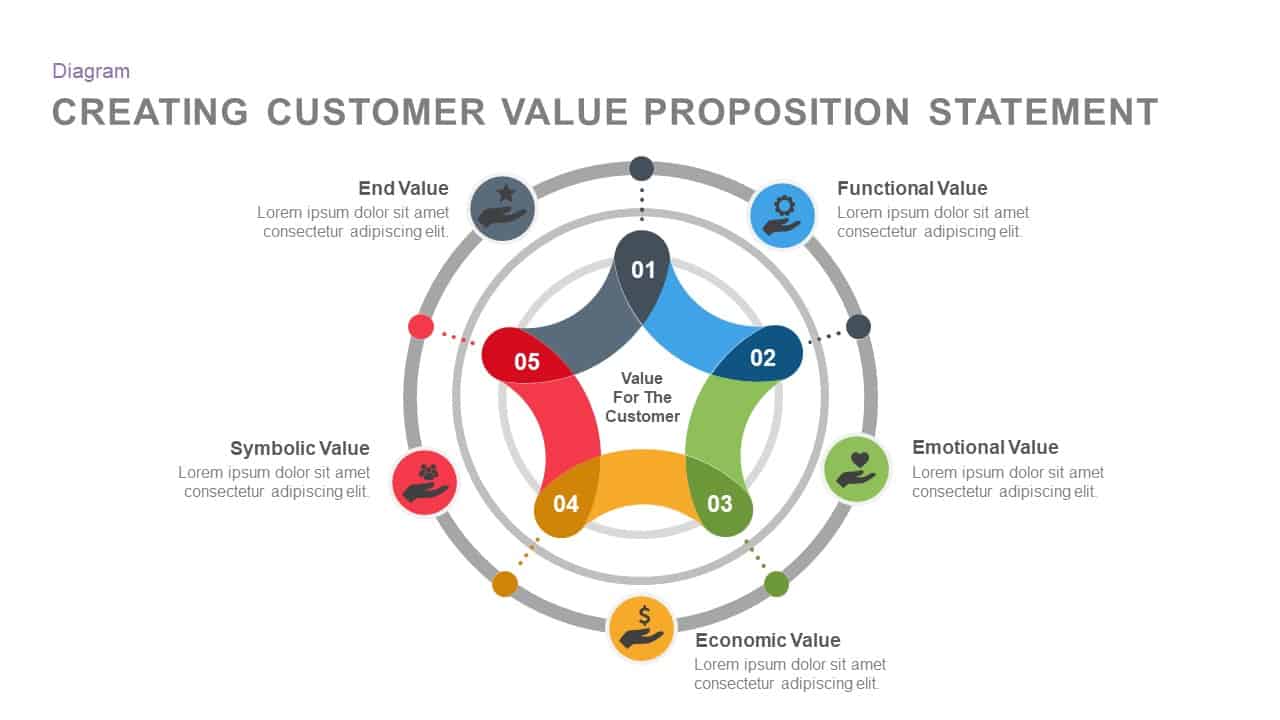
Customer Value Proposition Diagram Template for PowerPoint & Google Slides
Circular

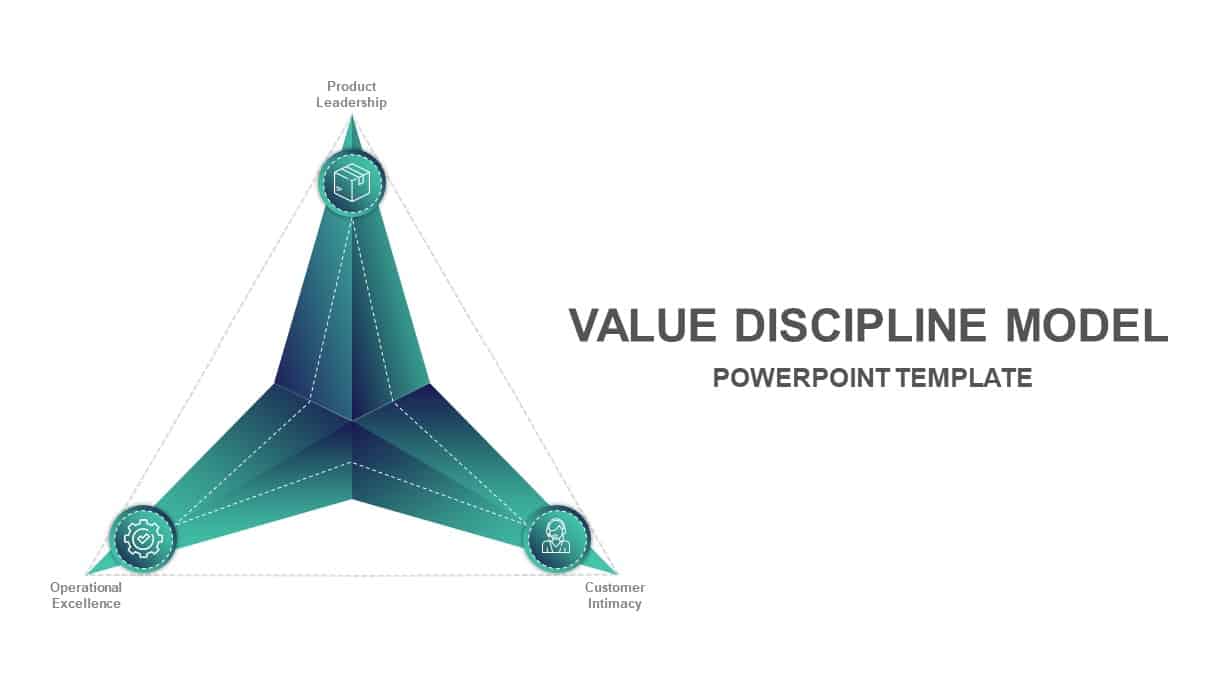
Value Discipline Strategy Diagram Template for PowerPoint & Google Slides
Comparison
Free Value Proposition Diagram Template for PowerPoint & Google Slides
Business Strategy
Free
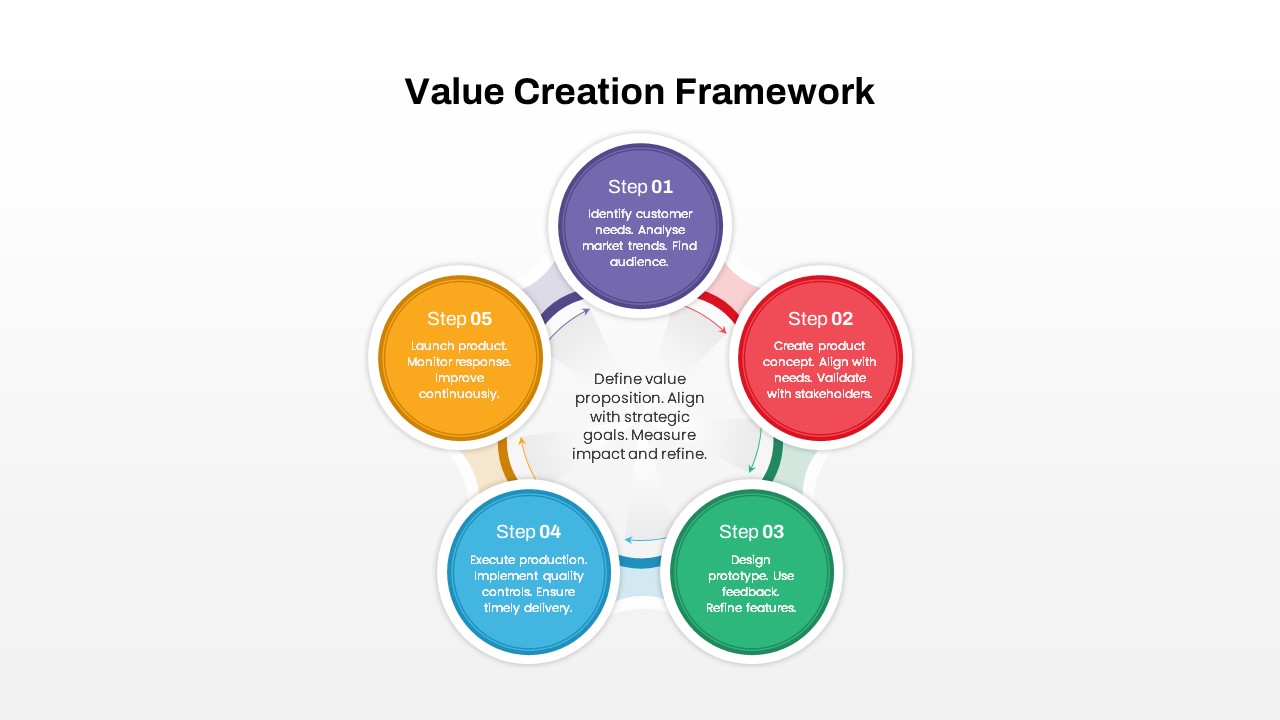
Value Creation Framework Process Diagram Template for PowerPoint & Google Slides
Business Plan
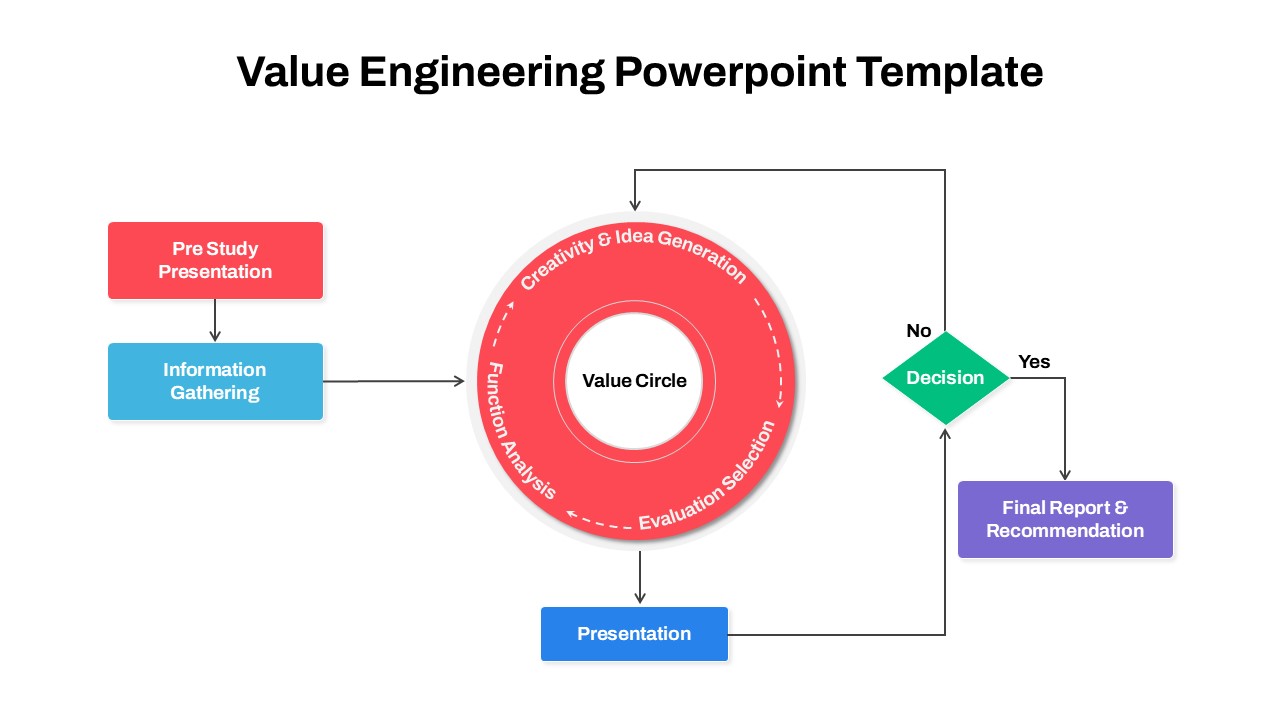
Circular Value Engineering Diagram Template for PowerPoint & Google Slides
Process
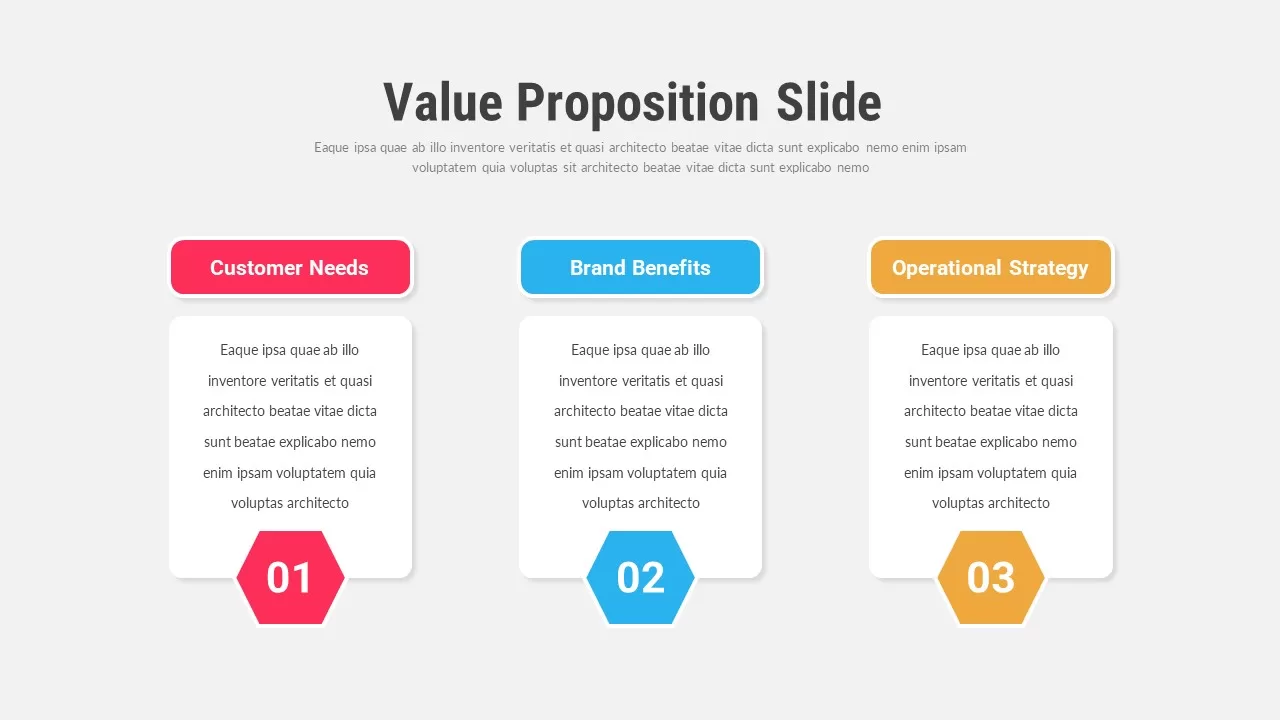
Value Proposition Slides Pack for PowerPoint & Google Slides
Infographics
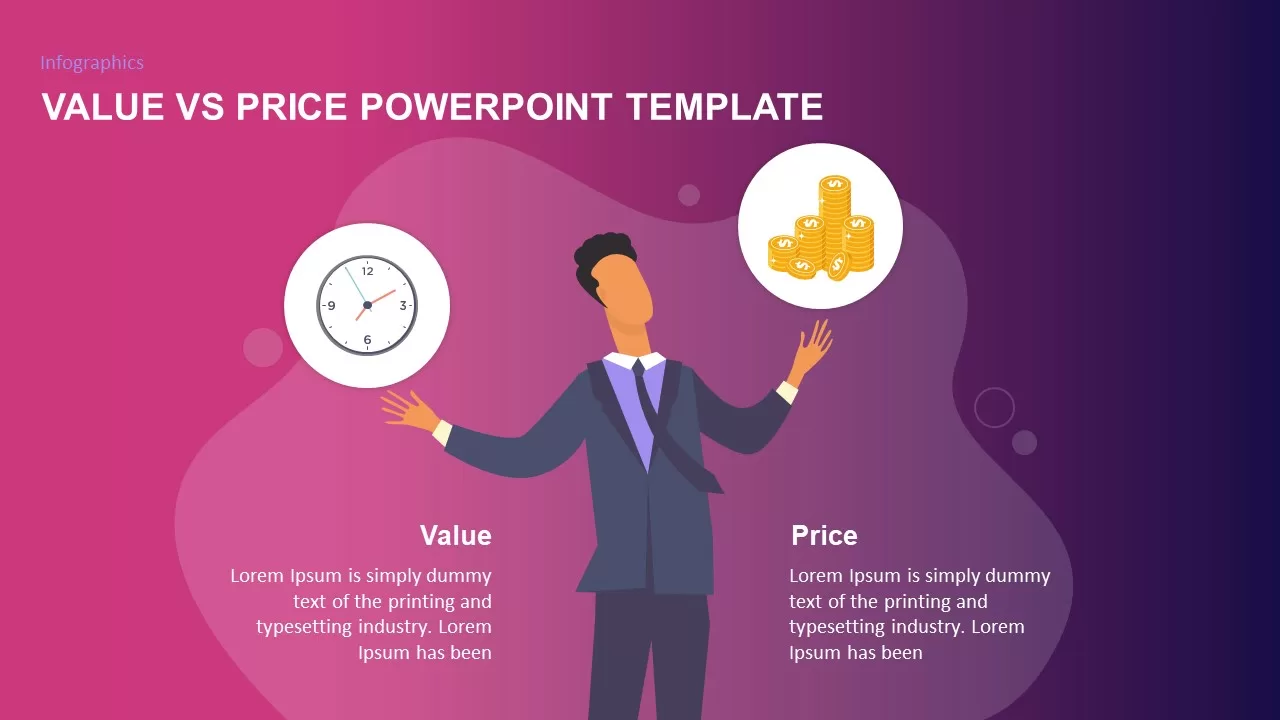
Value vs Price PowerPoint Template for PowerPoint & Google Slides
Comparison

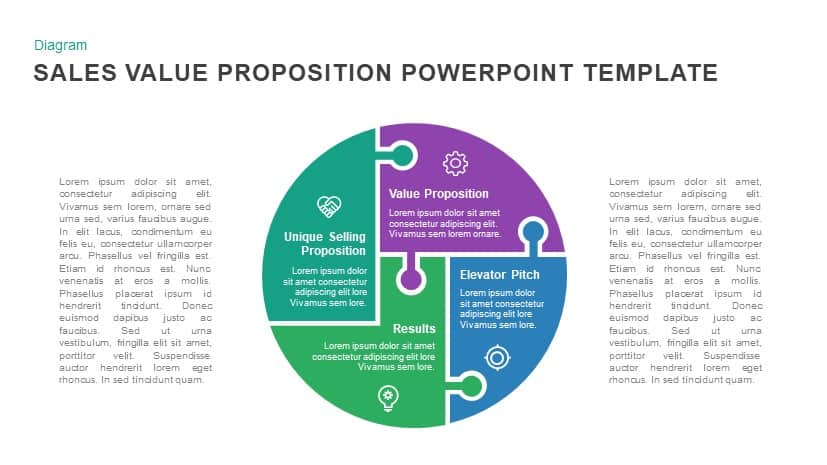
Sales Value Proposition template for PowerPoint & Google Slides
Infographics
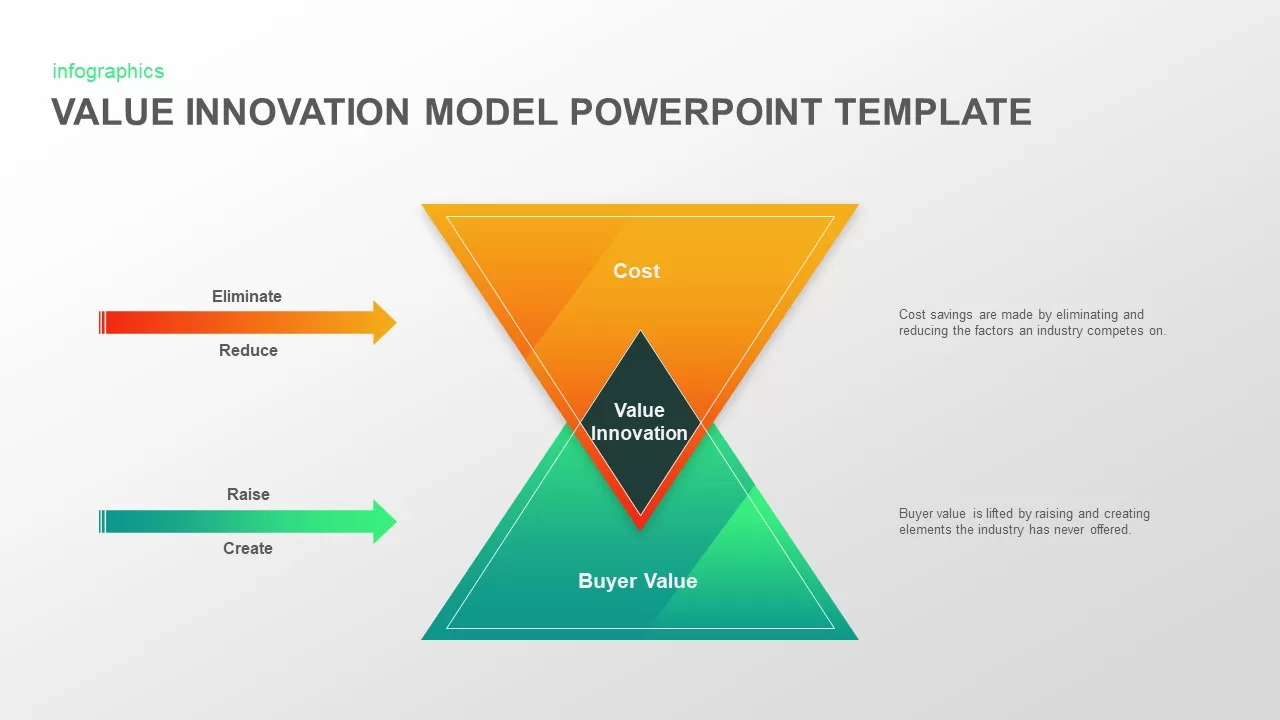
Value Innovation Model PowerPoint & Google Slides Template for Presentations
Business Proposal
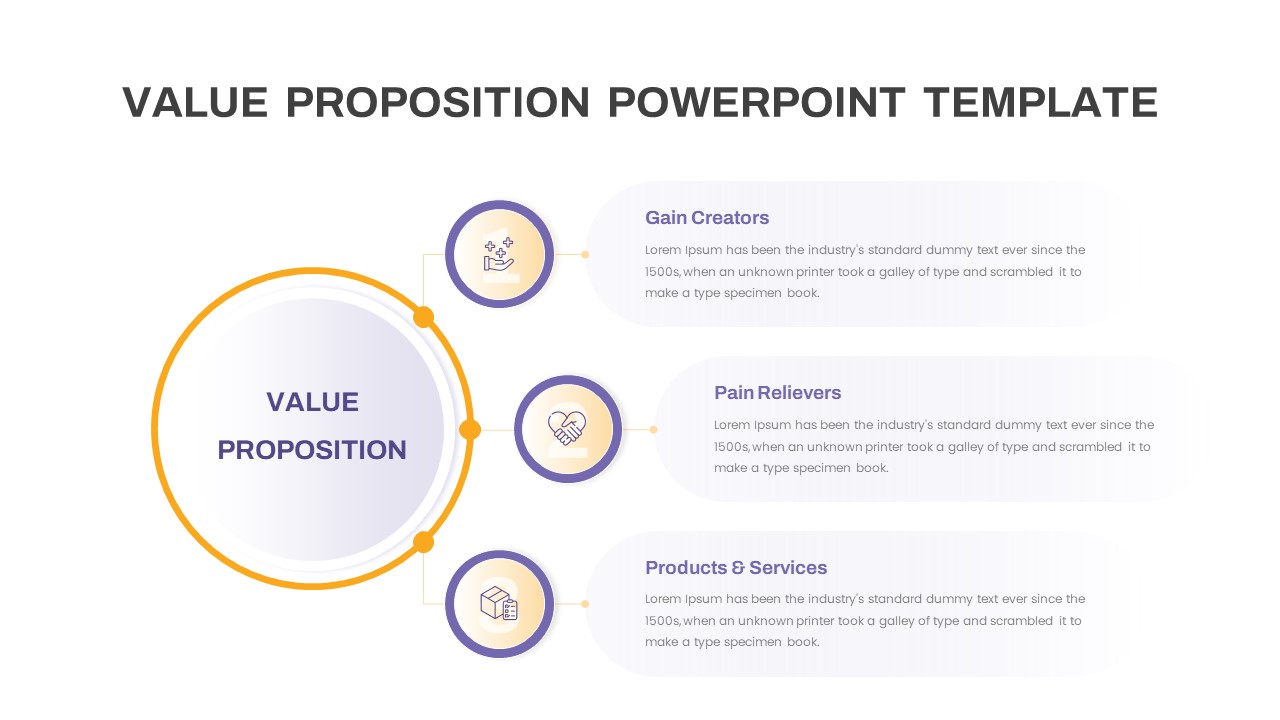
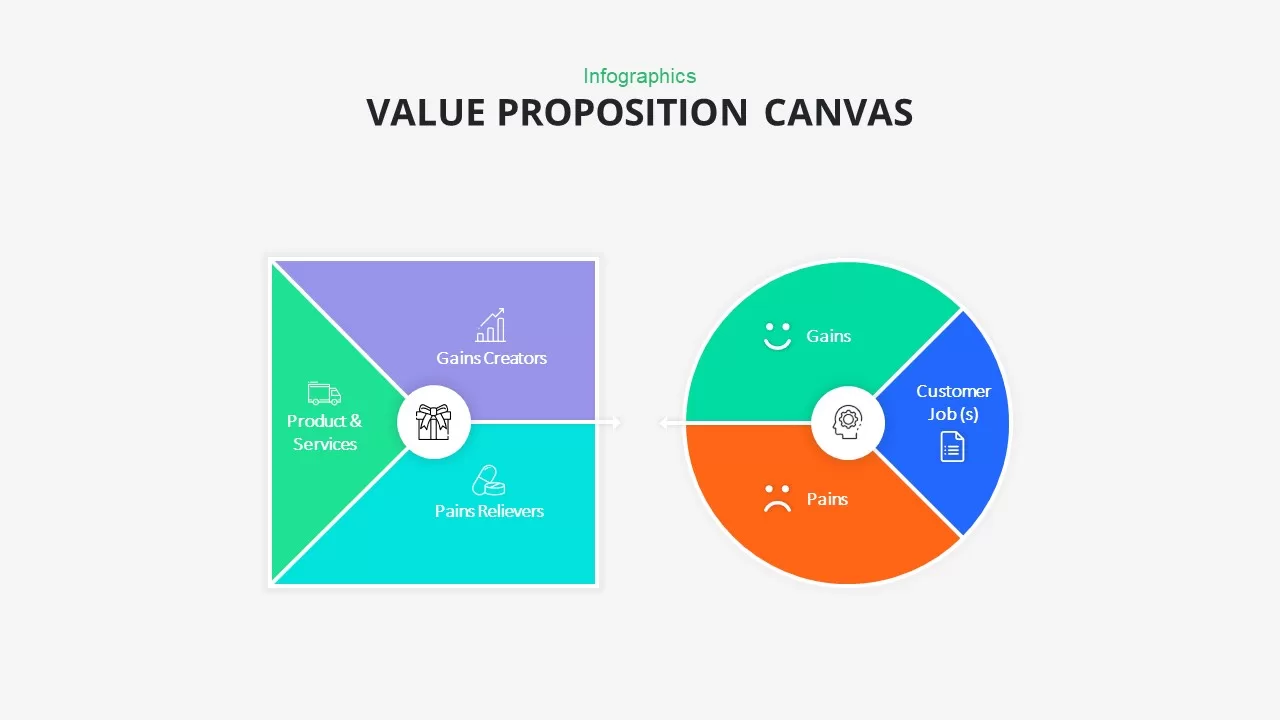
Value Proposition Canvas Infographic Template for PowerPoint & Google Slides
Business Report
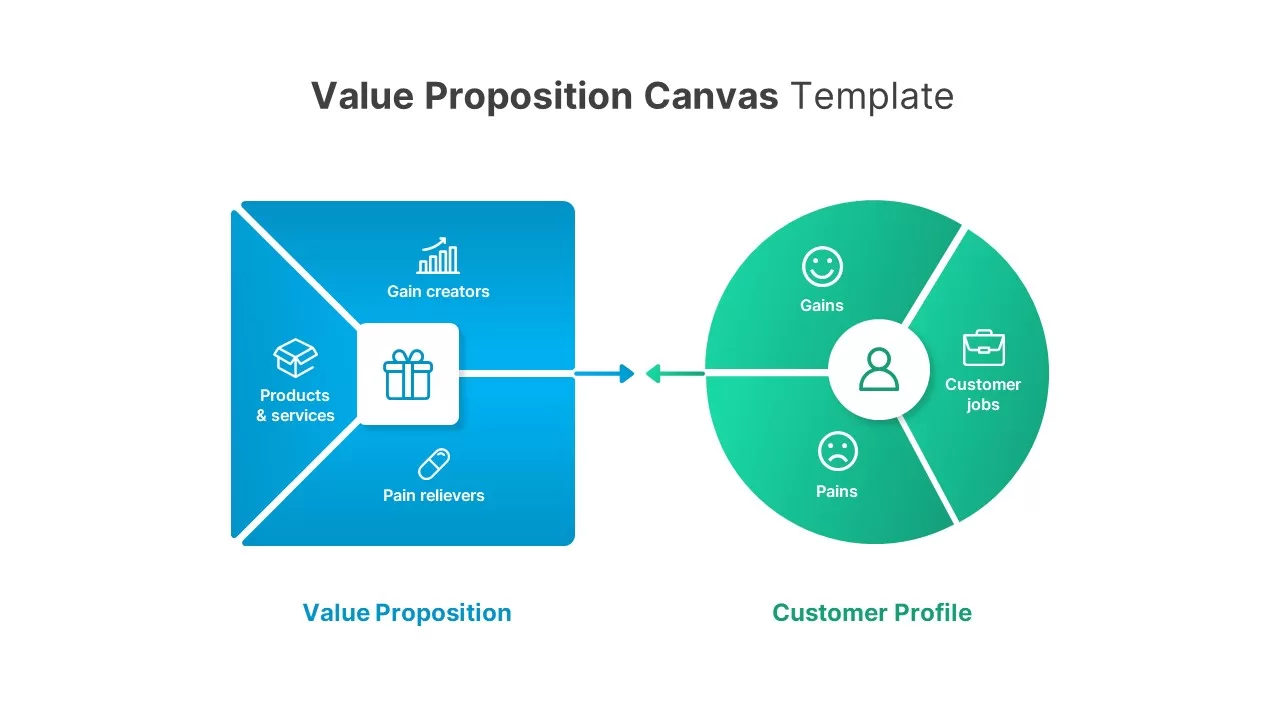
Value Proposition Canvas Template for PowerPoint & Google Slides
Business Strategy
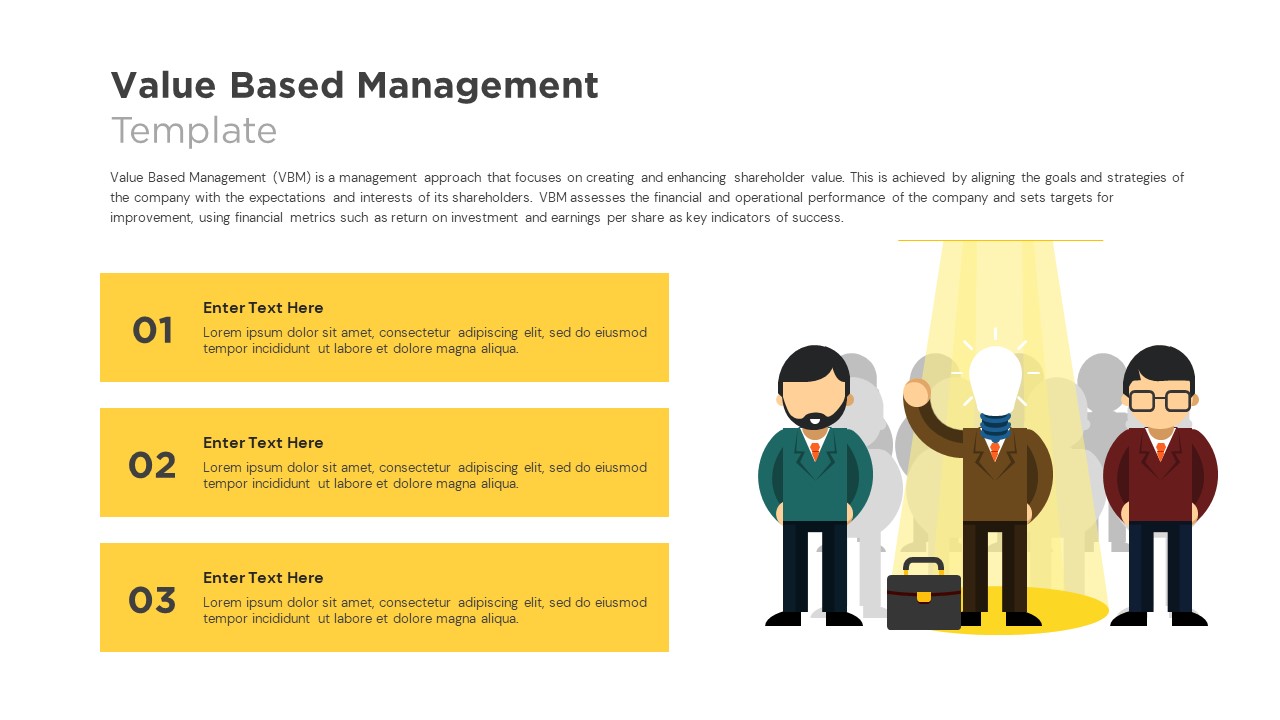
Value Based Management Step-by-Step Template for PowerPoint & Google Slides
Business Strategy
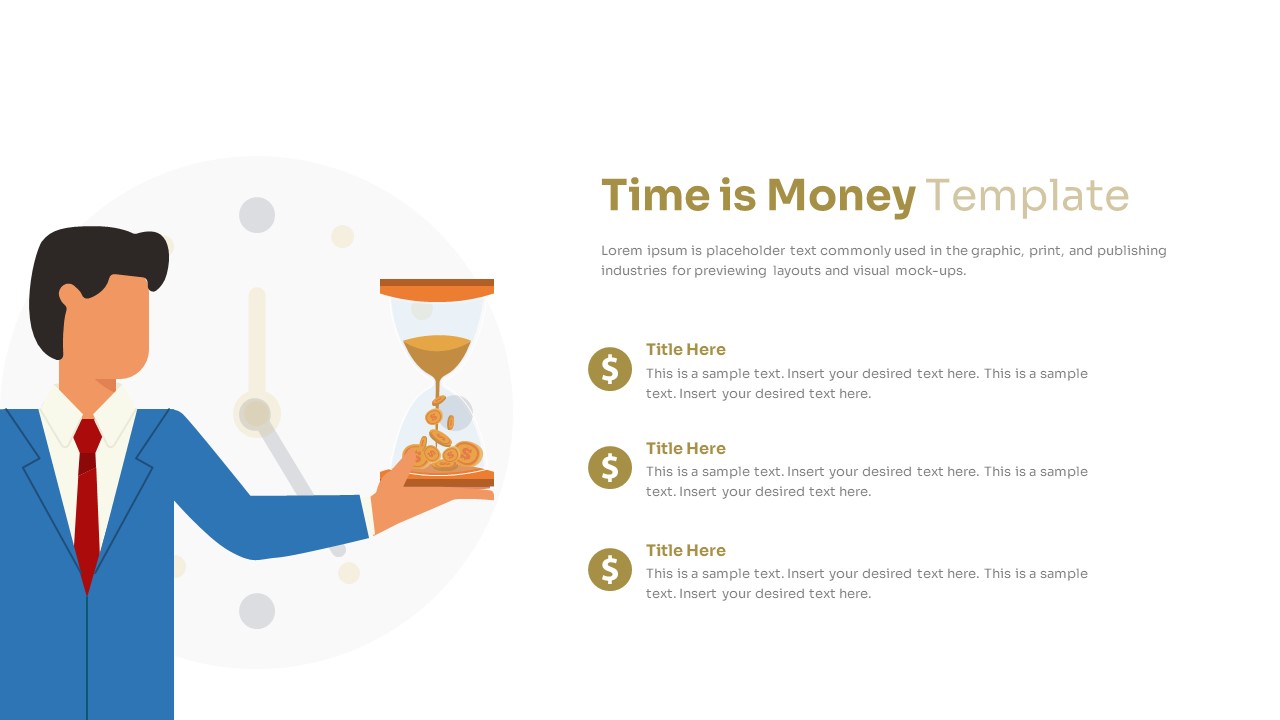
Time is Money Concept and Value Slide Template for PowerPoint & Google Slides
Finance
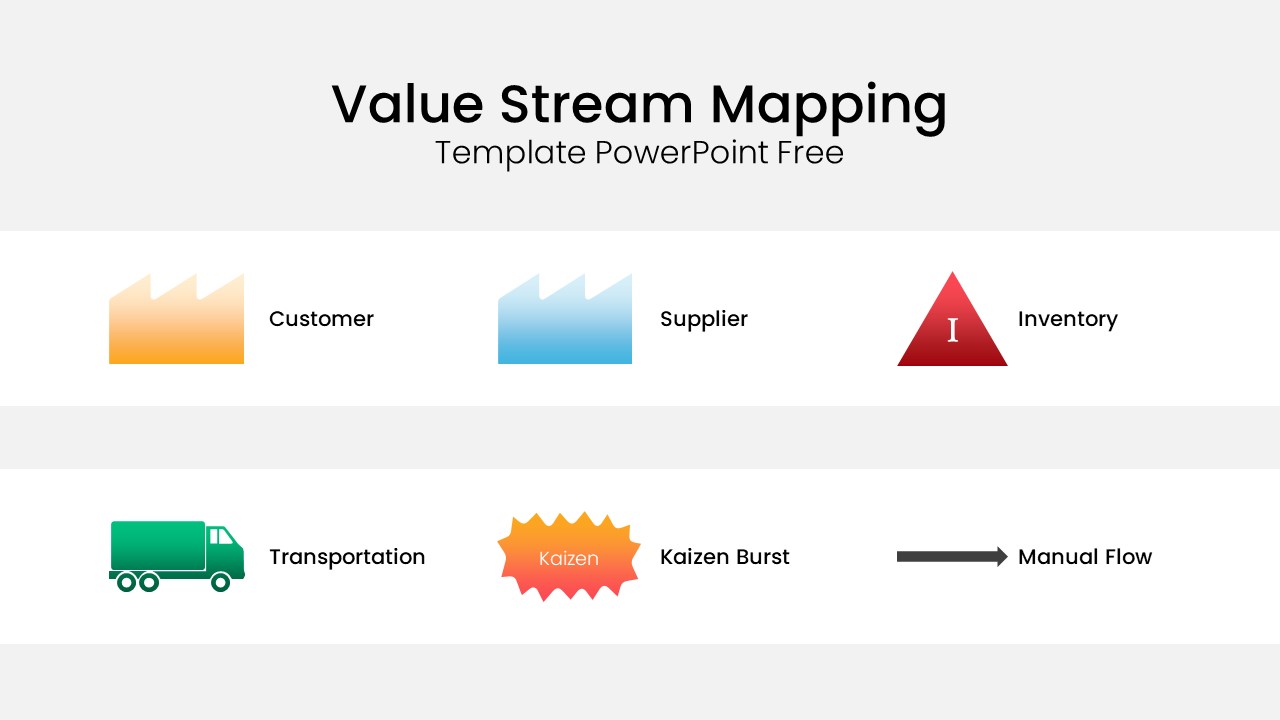
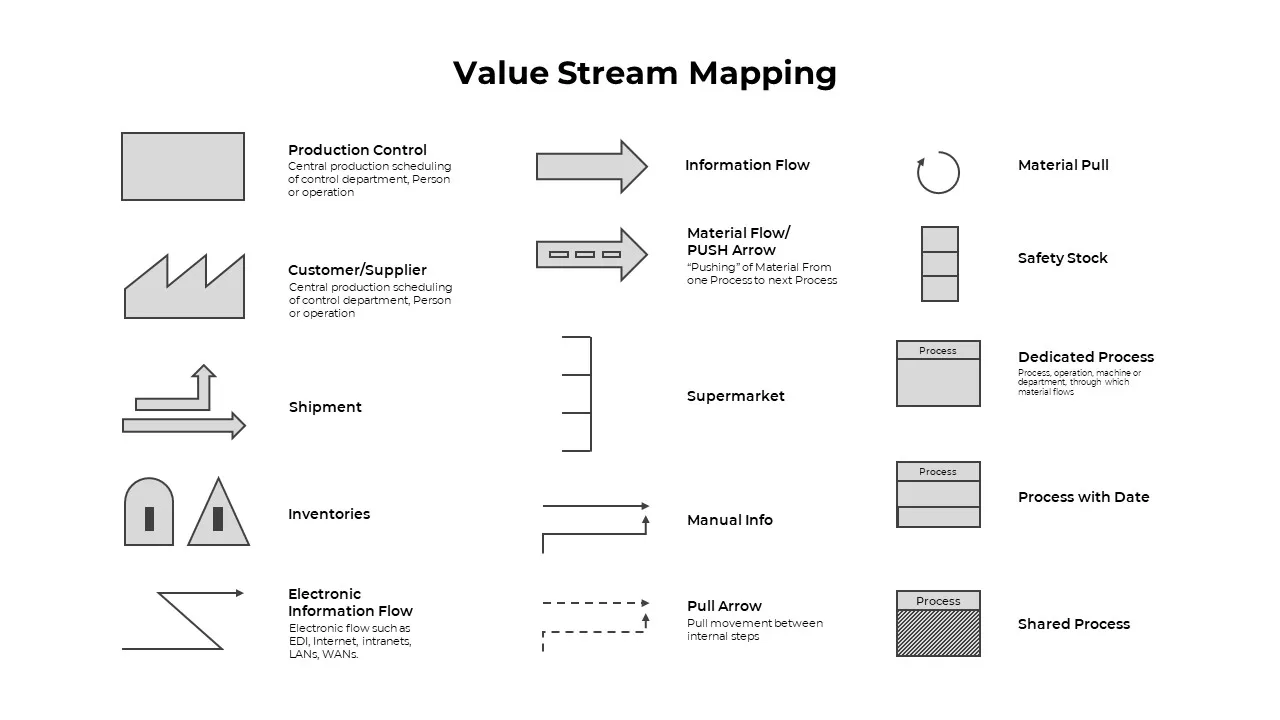
Value Stream Mapping Symbol Legend Template for PowerPoint & Google Slides
Charts
Free
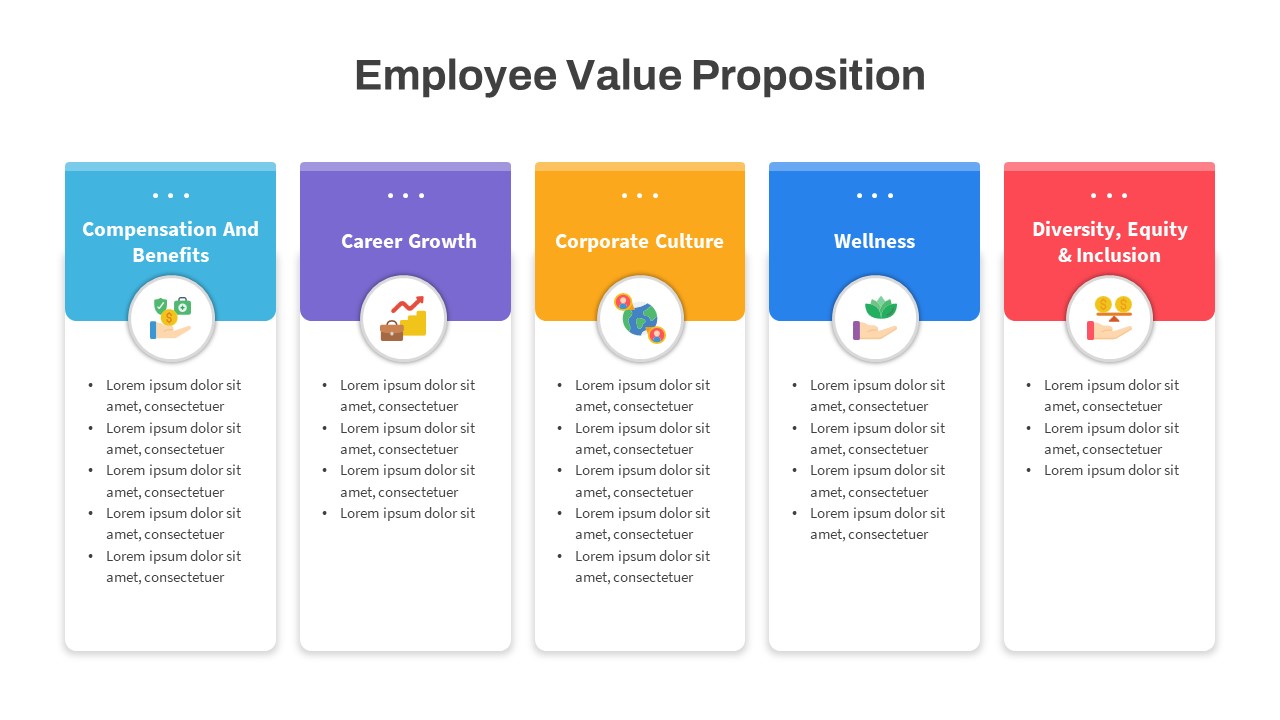
Employee Value Proposition Framework Template for PowerPoint & Google Slides
Recruitment
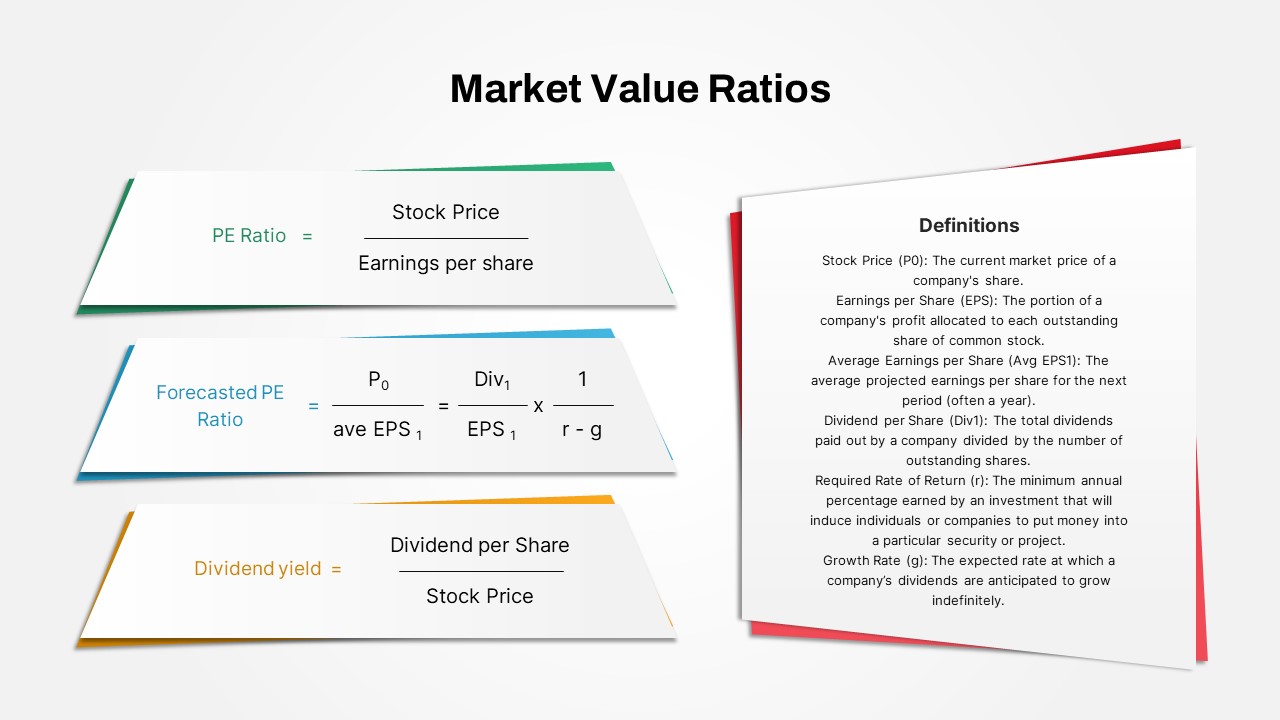
Market Value Ratios Formula Overview Template for PowerPoint & Google Slides
Business Report
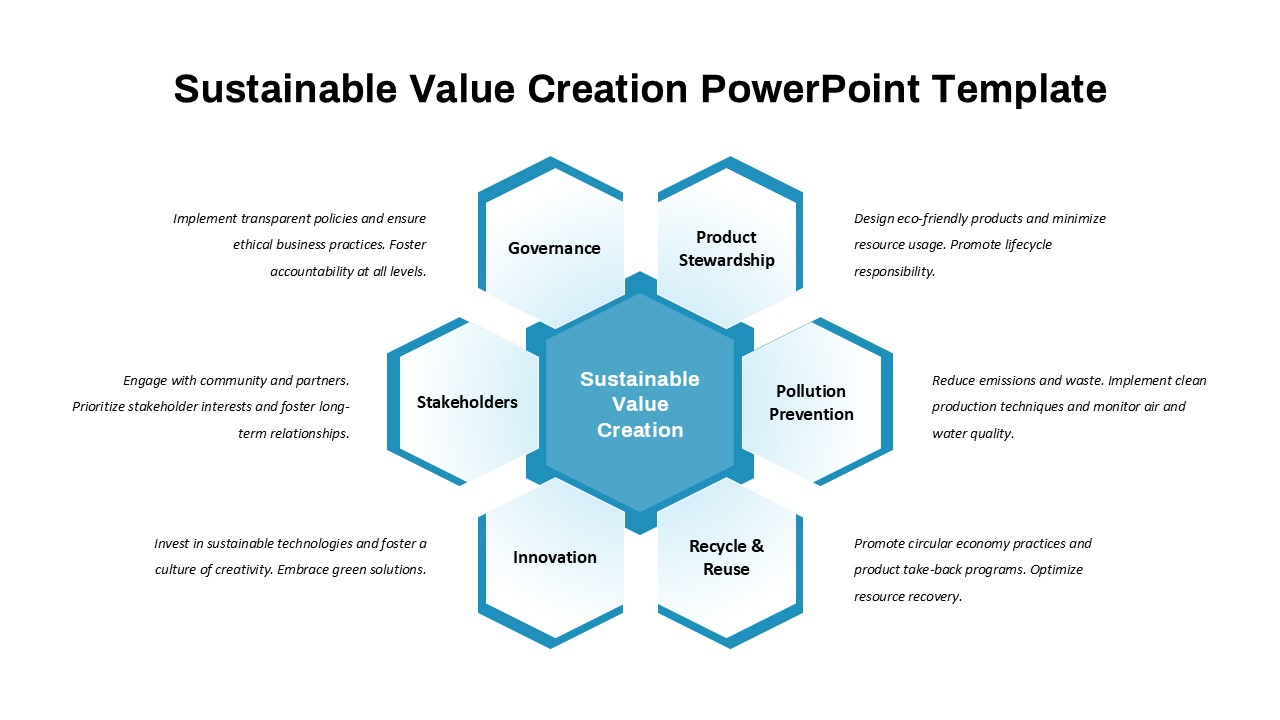
Sustainable Value Creation Framework Template for PowerPoint & Google Slides
Process
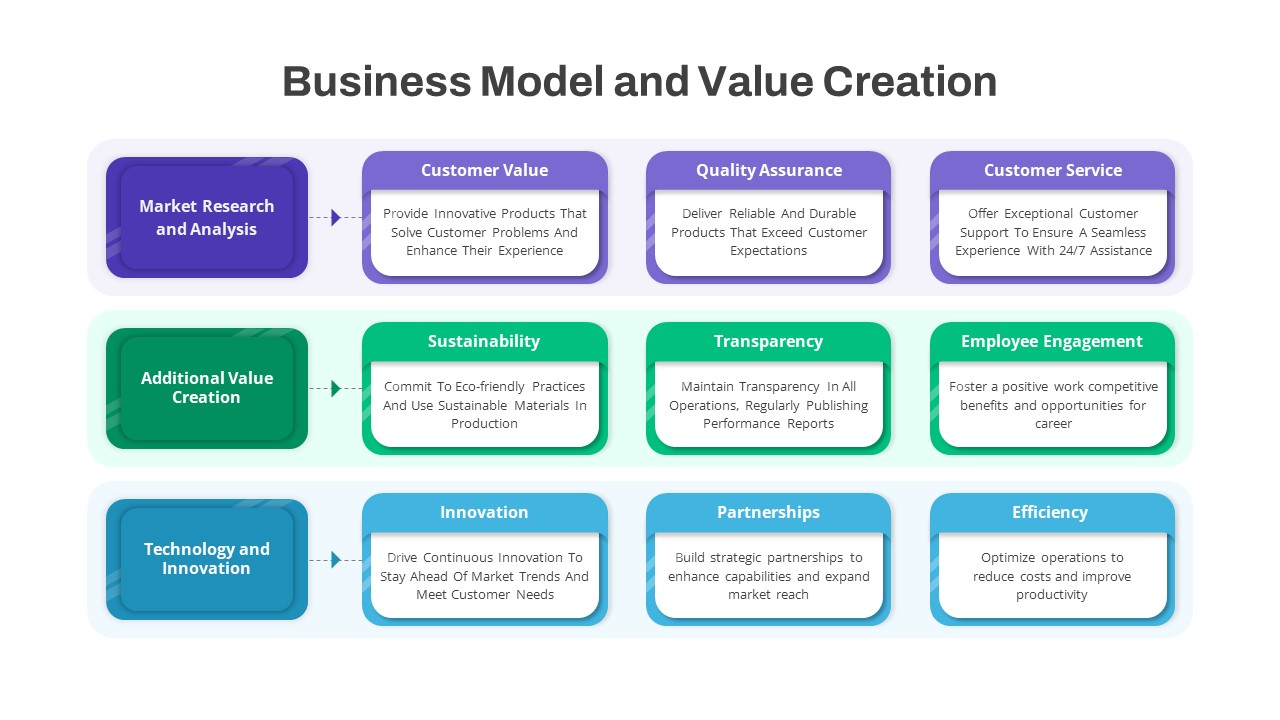
Business Model & Value Creation Template for PowerPoint & Google Slides
Process
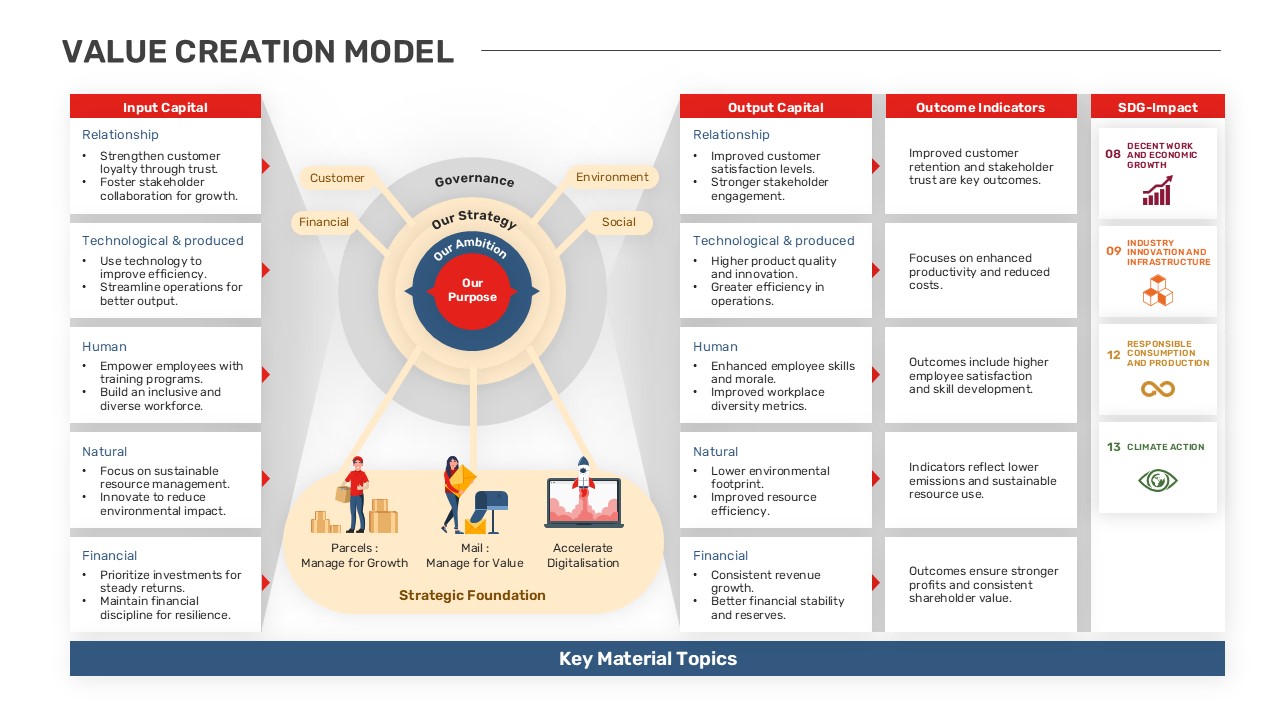
Comprehensive Value Creation Model Template for PowerPoint & Google Slides
Business Models
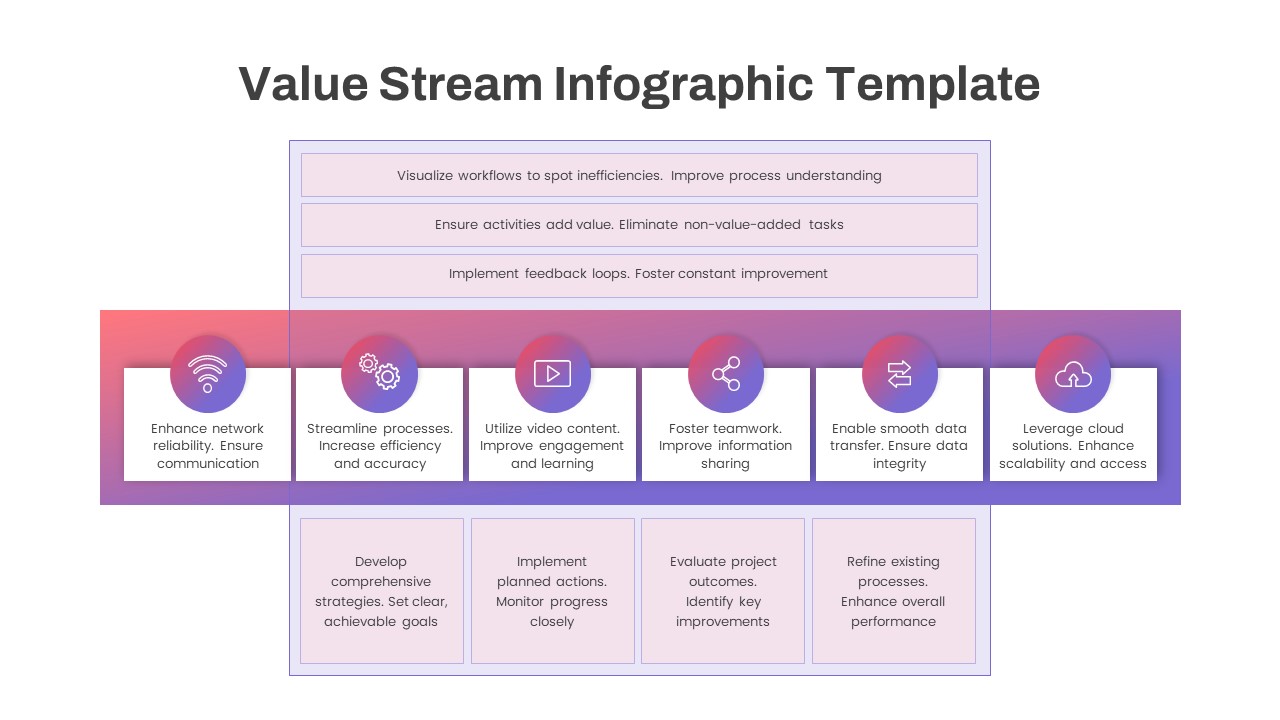
Comprehensive Value Stream Infographic Template for PowerPoint & Google Slides
Process
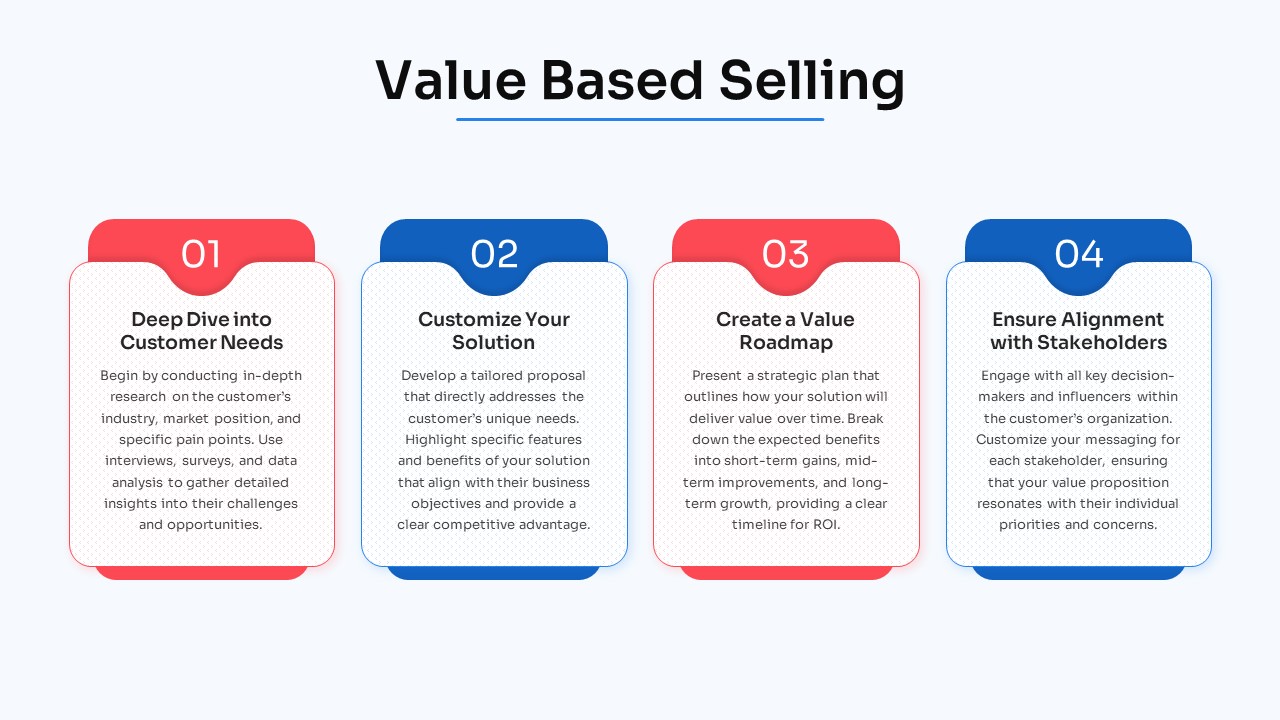
Free Four-Step Value-Based Selling Process Template for PowerPoint & Google Slides
Process
Free
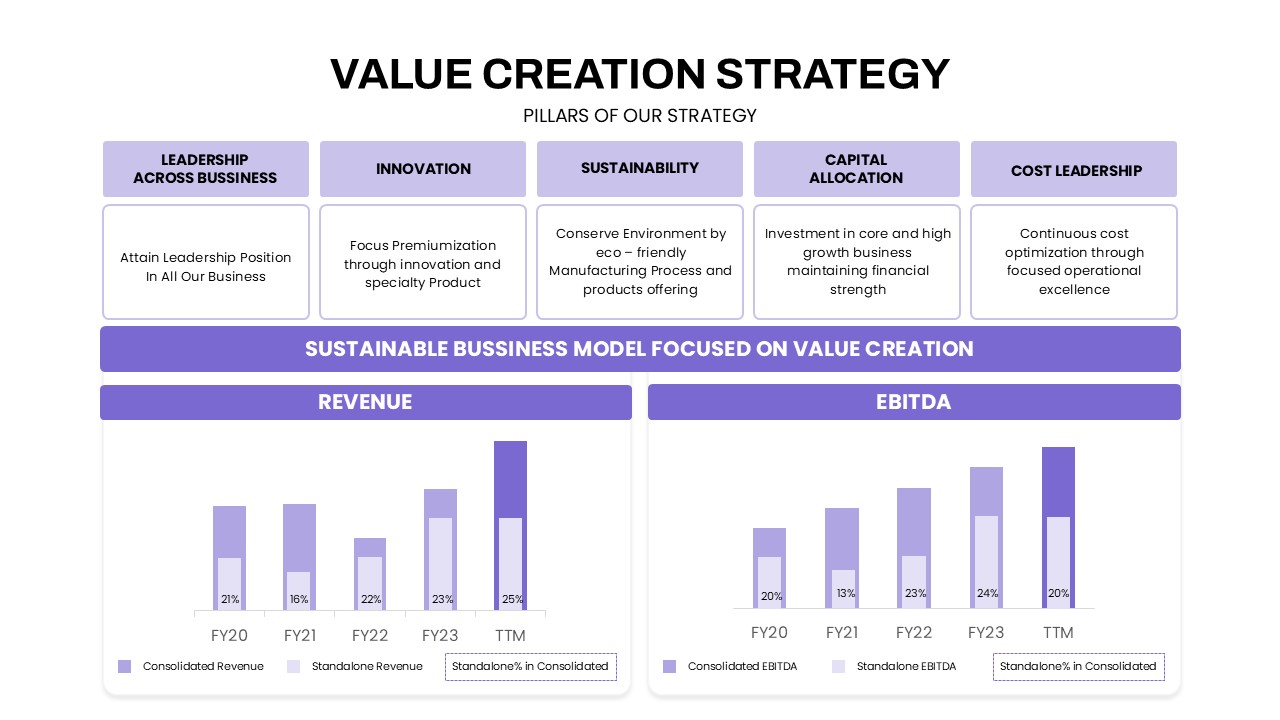
Value Creation Strategy Template for PowerPoint & Google Slides
Business Strategy
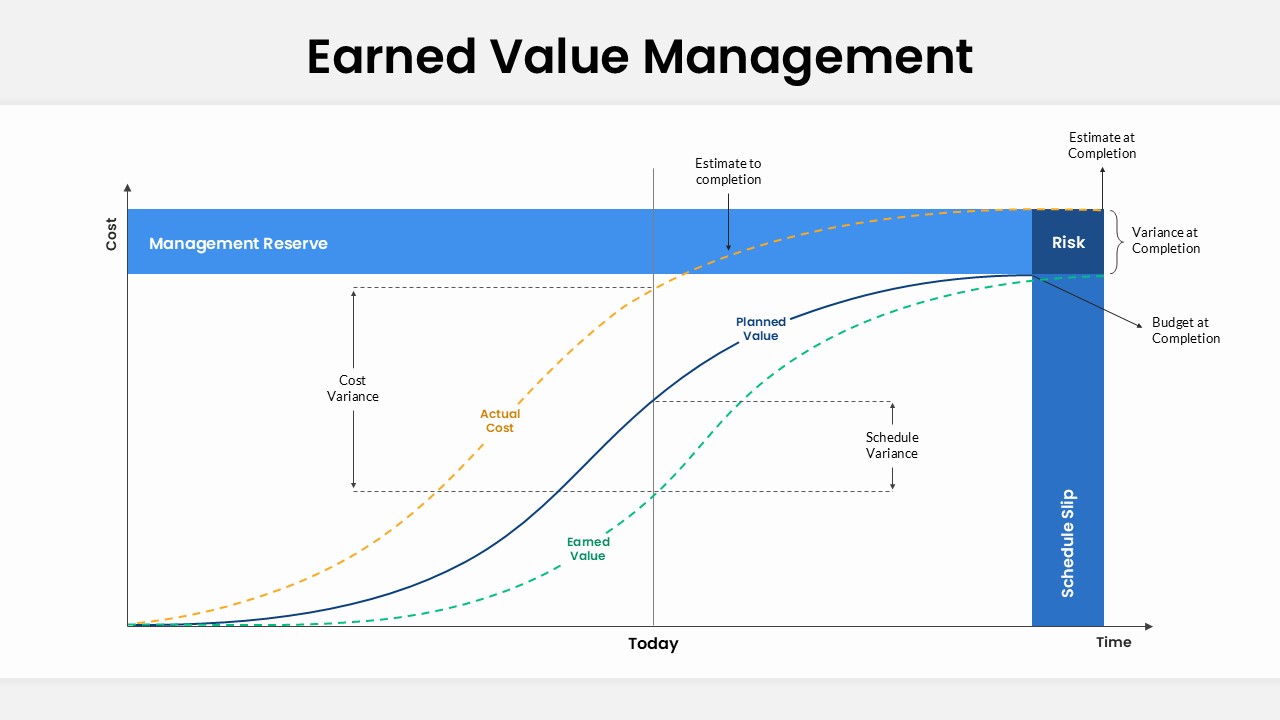
Earned Value Management (EVM) Slide Template for PowerPoint & Google Slides
Charts
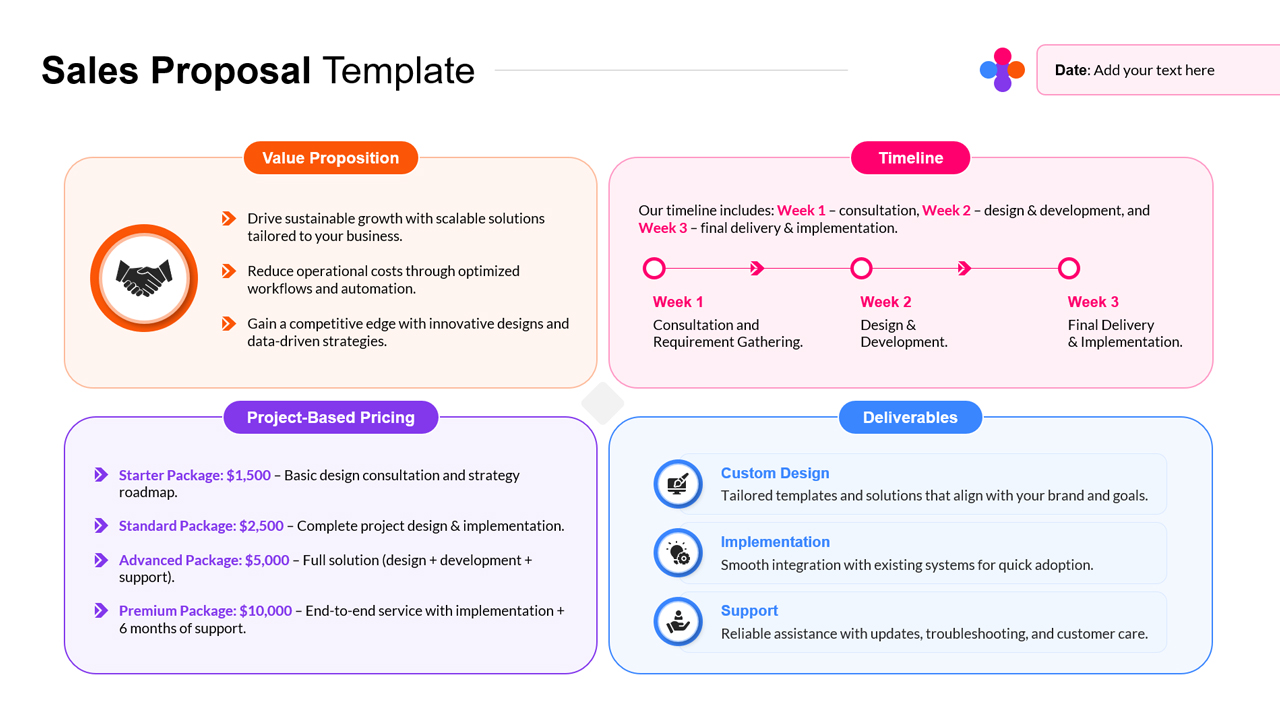
Sales Proposal Value Template for PowerPoint & Google Slides
Business Proposal
Value Stream Mapping for PowerPoint & Google Slides
Business
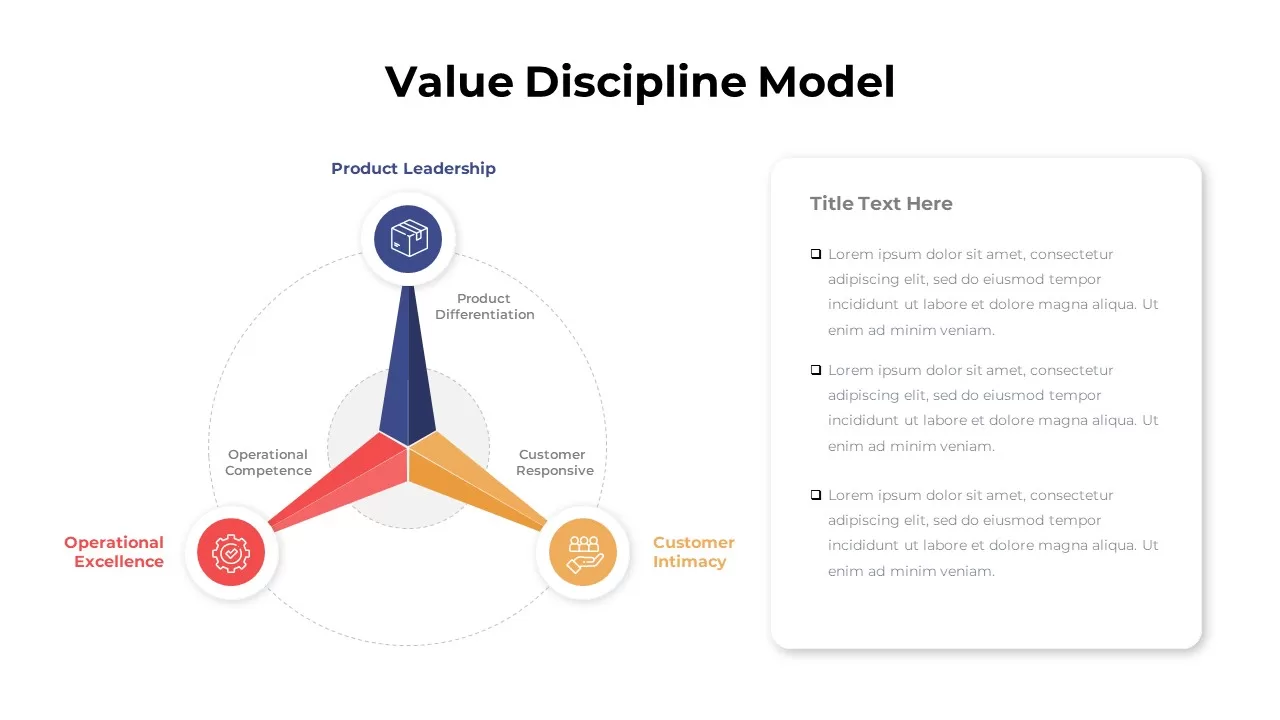
Value Discipline Model infographic for PowerPoint & Google Slides
Marketing
Modern Circle SWOT Analysis Diagram Template for PowerPoint & Google Slides
SWOT
Editable Force Field Analysis Diagram Template for PowerPoint & Google Slides
Business Plan

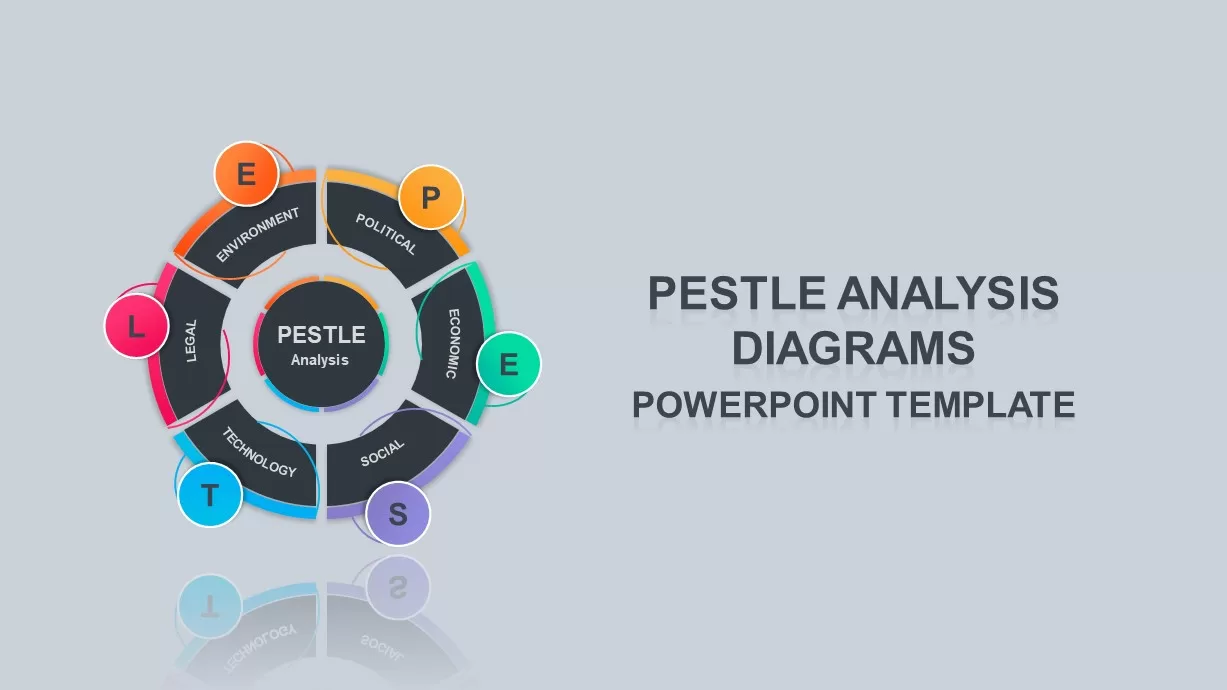
Professional PESTEL Analysis Diagram Template for PowerPoint & Google Slides
PEST
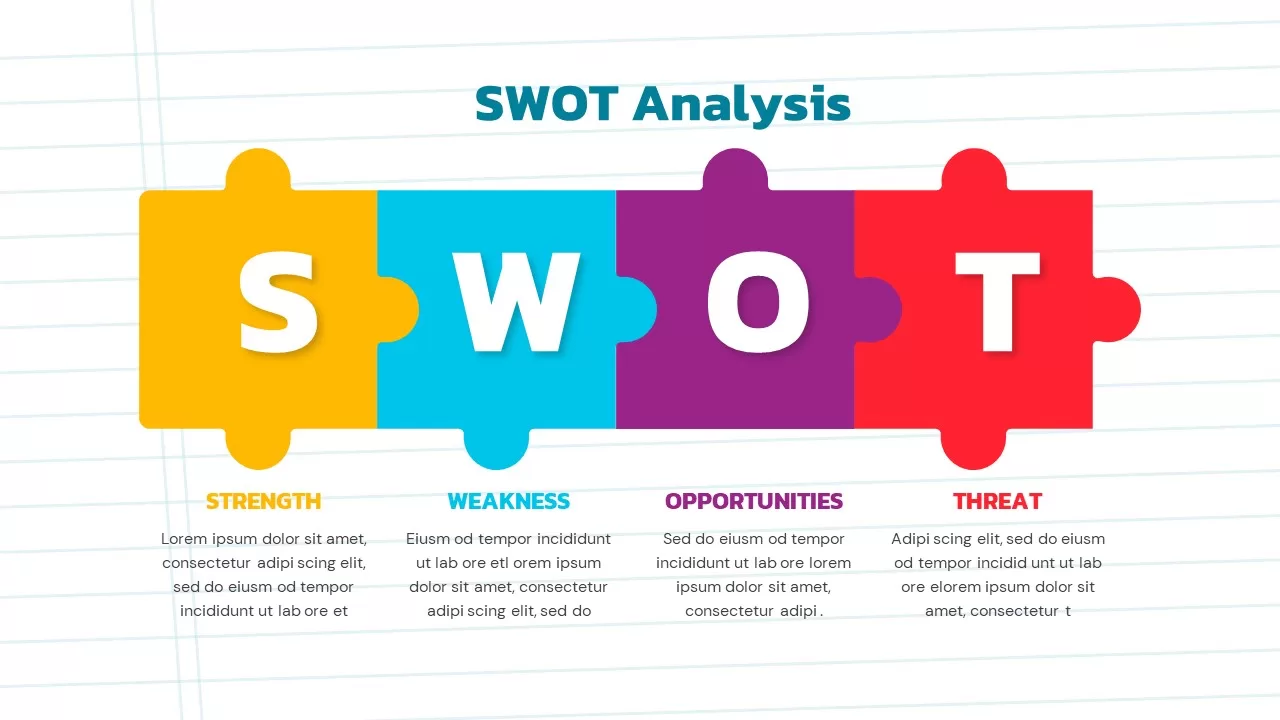
Puzzle-Style SWOT Analysis Table Diagram Template for PowerPoint & Google Slides
SWOT
PEST Analysis Circular Diagram Template for PowerPoint & Google Slides
PEST
PESTLE Analysis Table Layout Diagram Template for PowerPoint & Google Slides
PEST
SWOT Analysis Gear Diagram Slide Template for PowerPoint & Google Slides
SWOT

Interactive Gap Analysis Puzzle Diagram Template for PowerPoint & Google Slides
Gap
Cluster Analysis Infographic Diagram Template for PowerPoint & Google Slides
Business
Fishbone Diagram Analysis Template for PowerPoint & Google Slides
Flow Charts
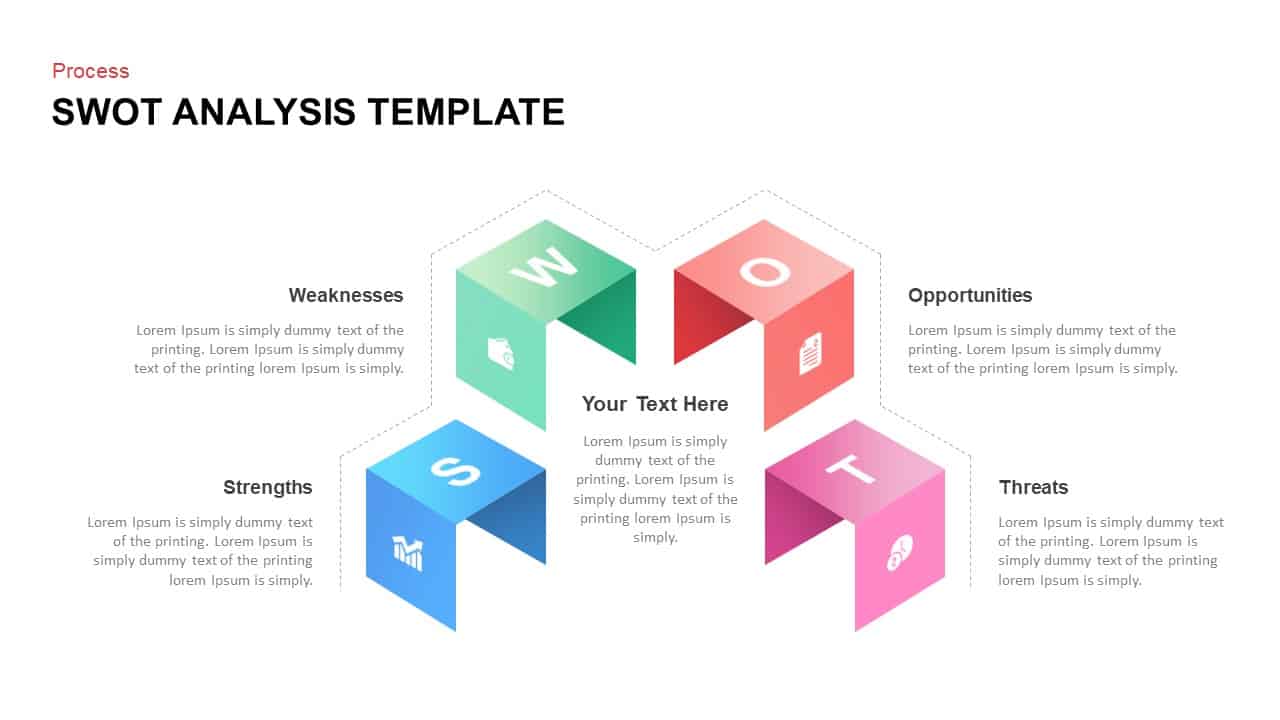
Four-Quadrant SWOT Analysis Diagram Template for PowerPoint & Google Slides
SWOT
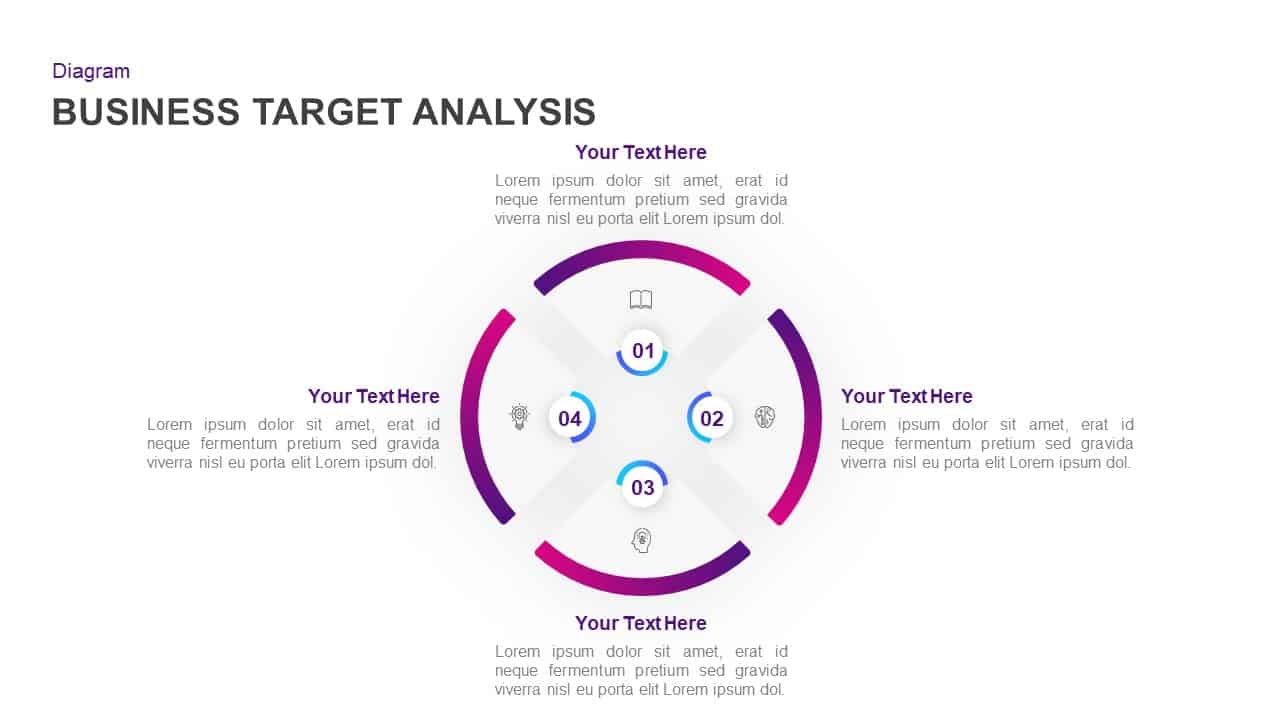
Business Target Analysis Diagram Template for PowerPoint & Google Slides
Circular
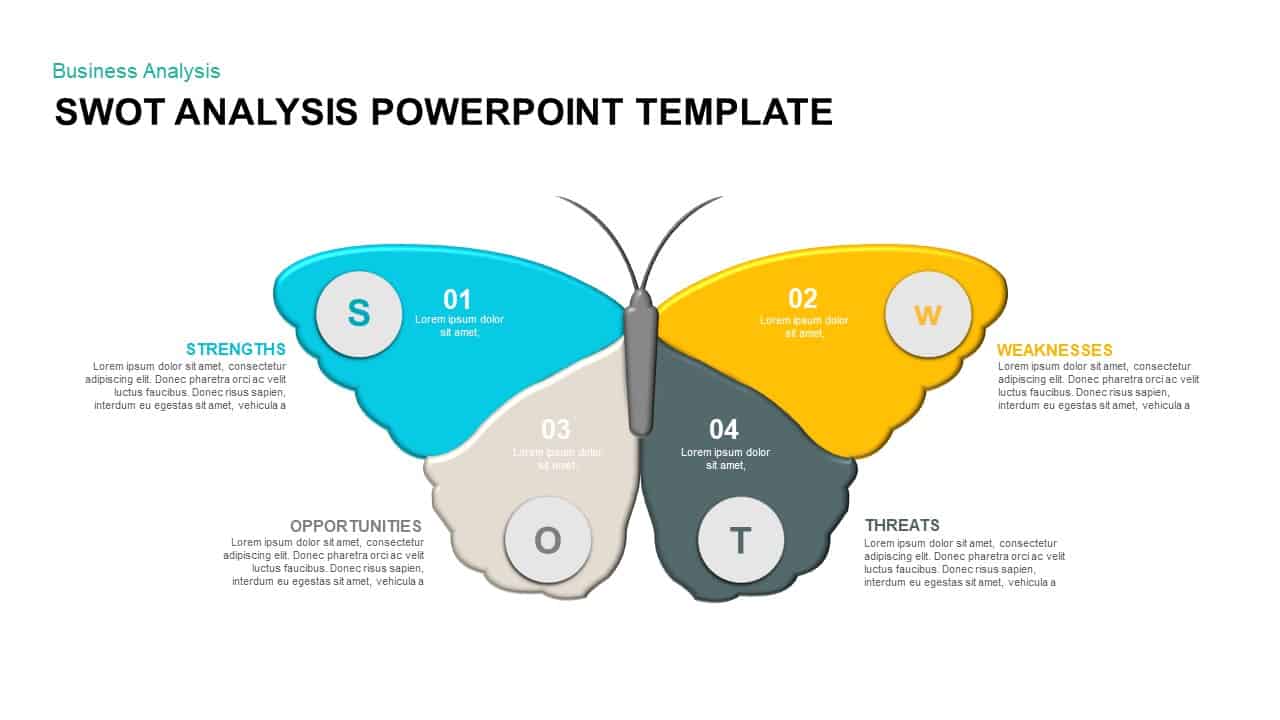
Butterfly SWOT Analysis Diagram Template for PowerPoint & Google Slides
SWOT
Four-Part SWOT Analysis Diagram Template for PowerPoint & Google Slides
SWOT
Fishbone Cause Analysis Diagram Template for PowerPoint & Google Slides
Process
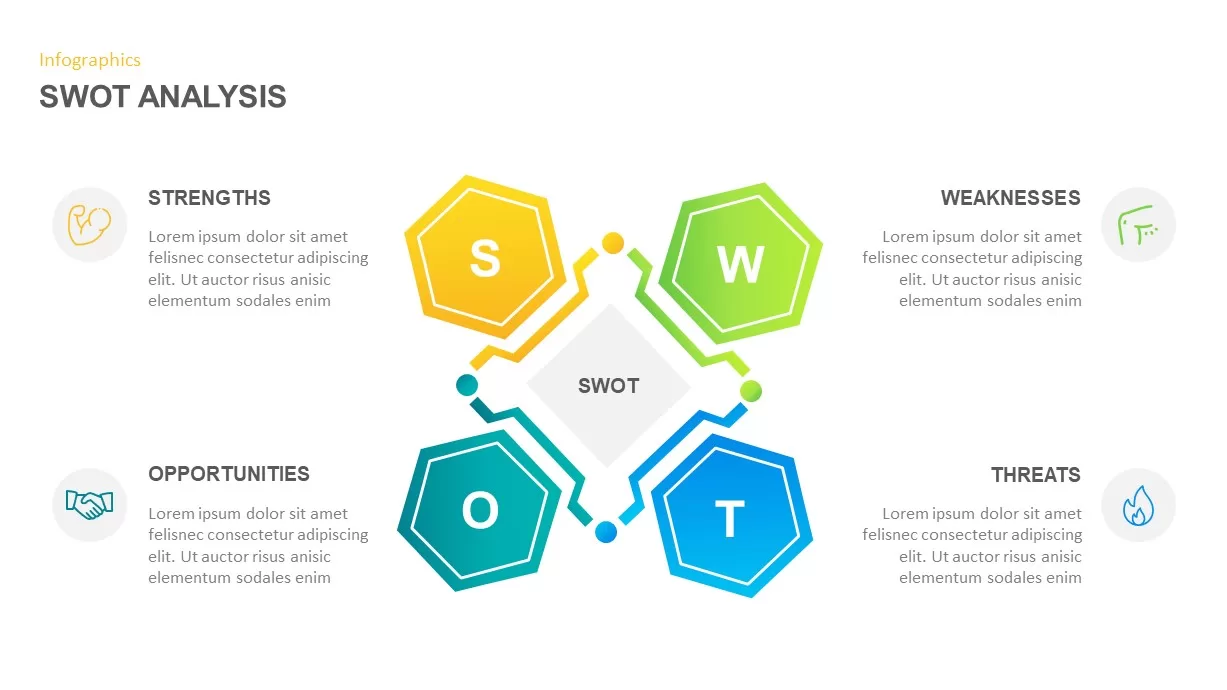
SWOT Analysis Infographic Diagram Template for PowerPoint & Google Slides
SWOT
IQ Scale Analysis Diagram template for PowerPoint & Google Slides
Employee Performance
Puzzle Piece SWOT Analysis Diagram Template for PowerPoint & Google Slides
Opportunities Challenges
Six-Step Business Analysis Diagram template for PowerPoint & Google Slides
Circular
Business Process Analysis Cycle Diagram Template for PowerPoint & Google Slides
Business Strategy
Free Root Cause Analysis Fishbone Diagram Template for PowerPoint & Google Slides
Process
Free
Experience Curve Analysis Diagram Template for PowerPoint & Google Slides
Business Strategy
Cost-Volume-Profit Analysis Diagram Template for PowerPoint & Google Slides
Finance

Colorful SWOT Analysis Diagram Template for PowerPoint & Google Slides
SWOT
Bottleneck Process Analysis Diagram Template for PowerPoint & Google Slides
Process
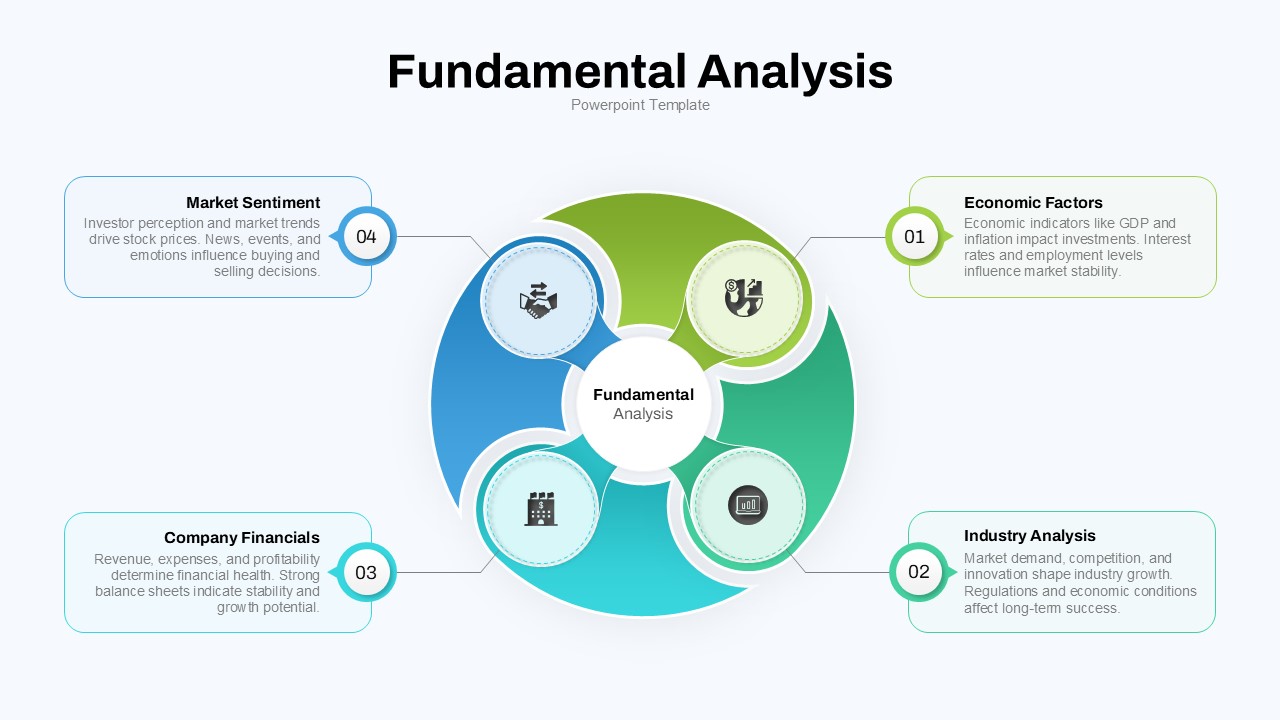
Fundamental Analysis Circular Diagram Template for PowerPoint & Google Slides
Circular
Cultural Web Analysis Circular Diagram Template for PowerPoint & Google Slides
Circular
DESTEP Marketing Analysis Diagram Template for PowerPoint & Google Slides
Circular
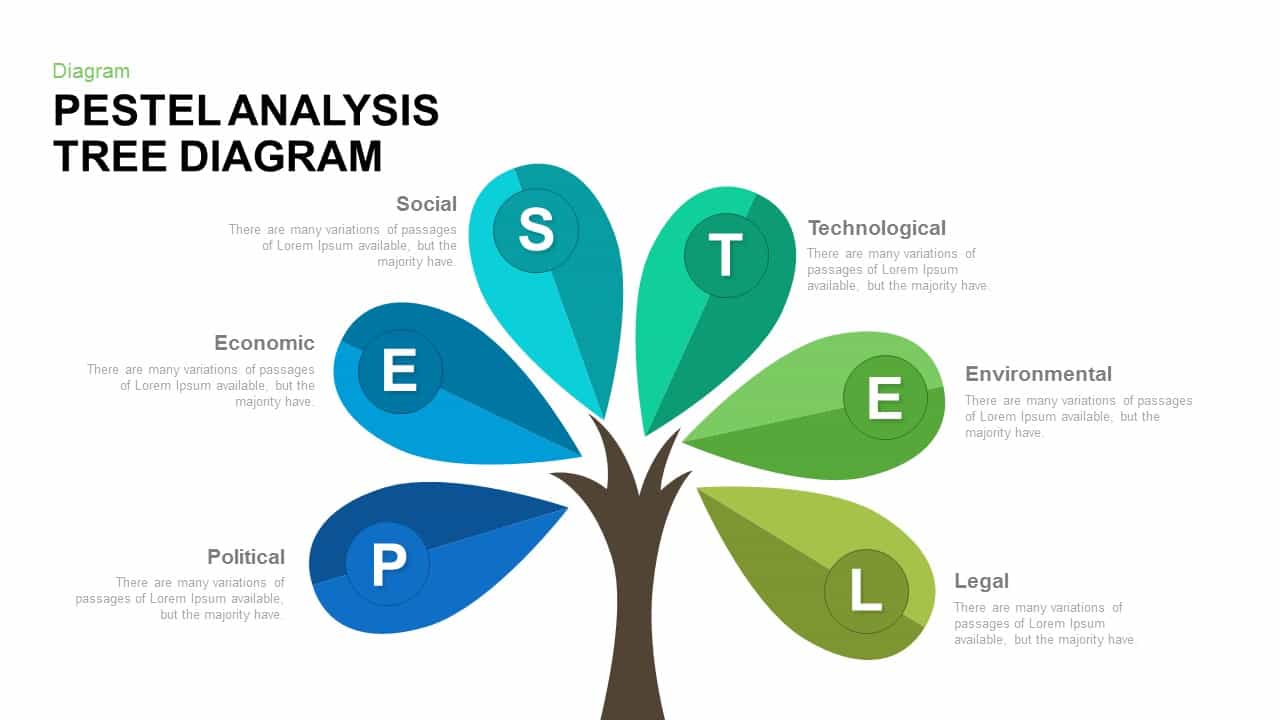
PESTEL Analysis Tree Diagram for PowerPoint & Google Slides
Process
5 Why Fishbone Diagram for Root Cause Analysis in PowerPoint & Google Slides
Process
PEST Analysis PowerPoint Template for PowerPoint & Google Slides
Business Strategy
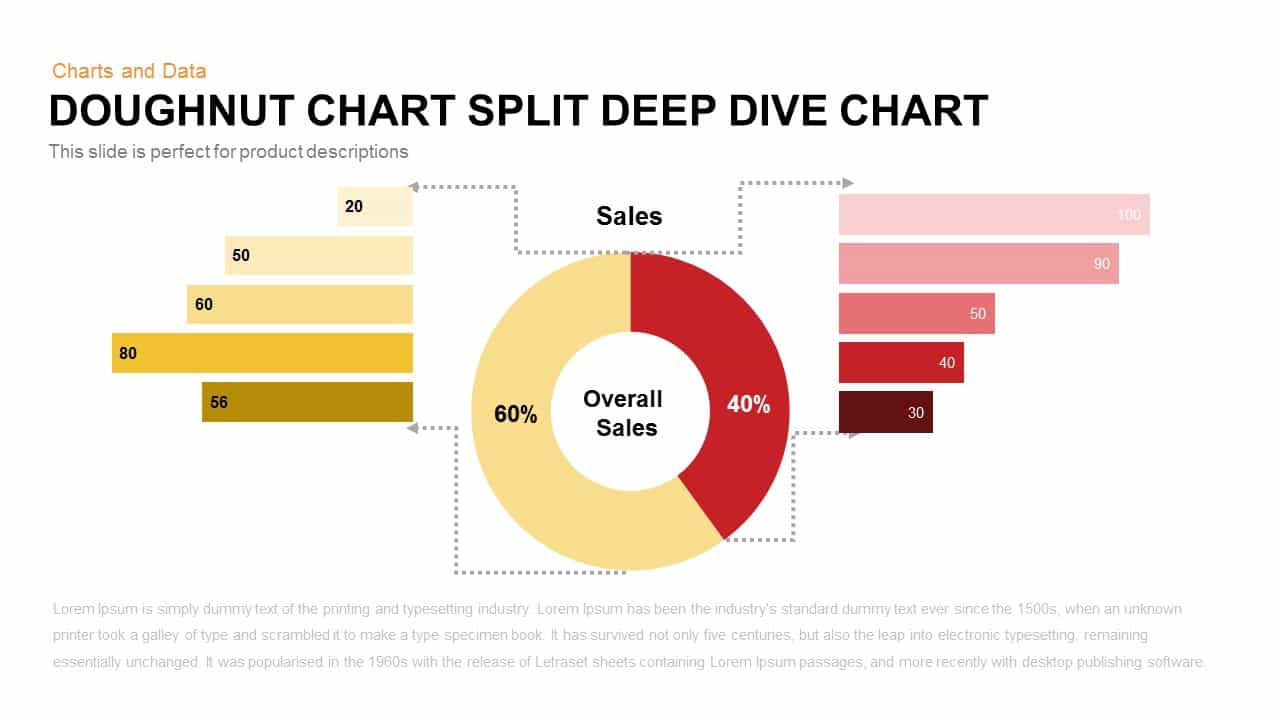
Split Doughnut Deep Dive Sales Analysis Template for PowerPoint & Google Slides
Pie/Donut
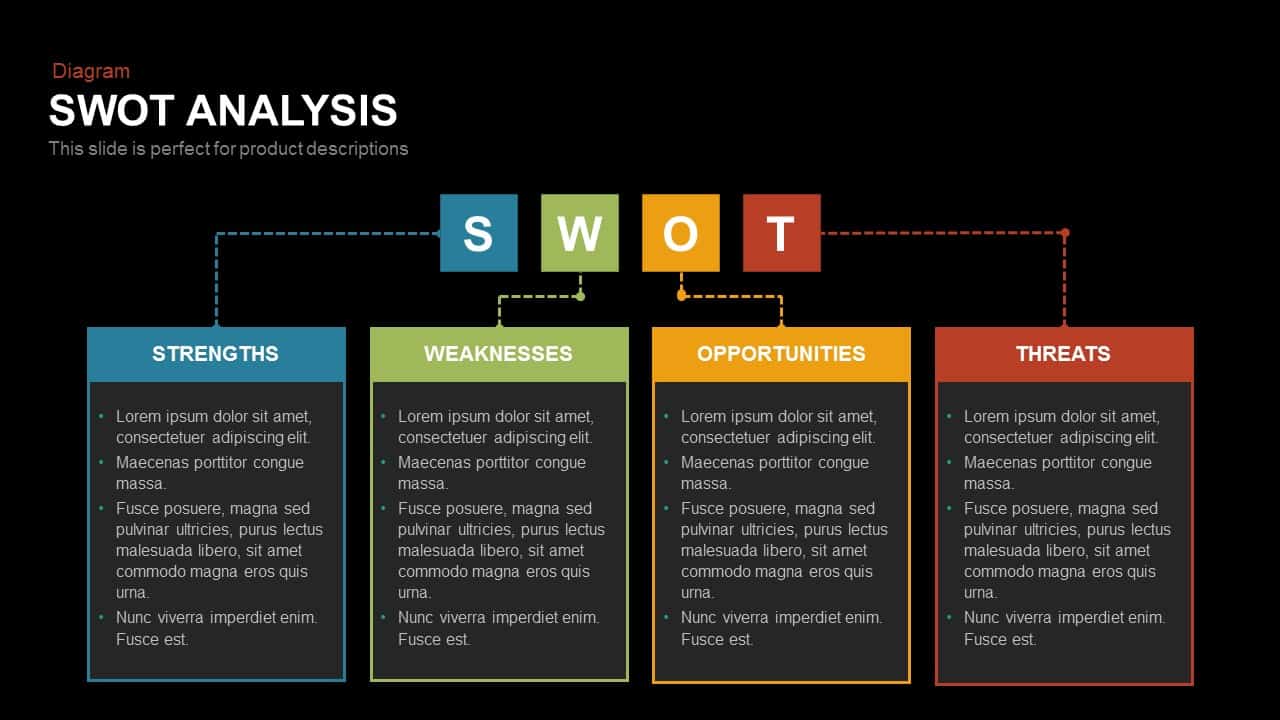
SWOT Analysis template for PowerPoint & Google Slides
SWOT
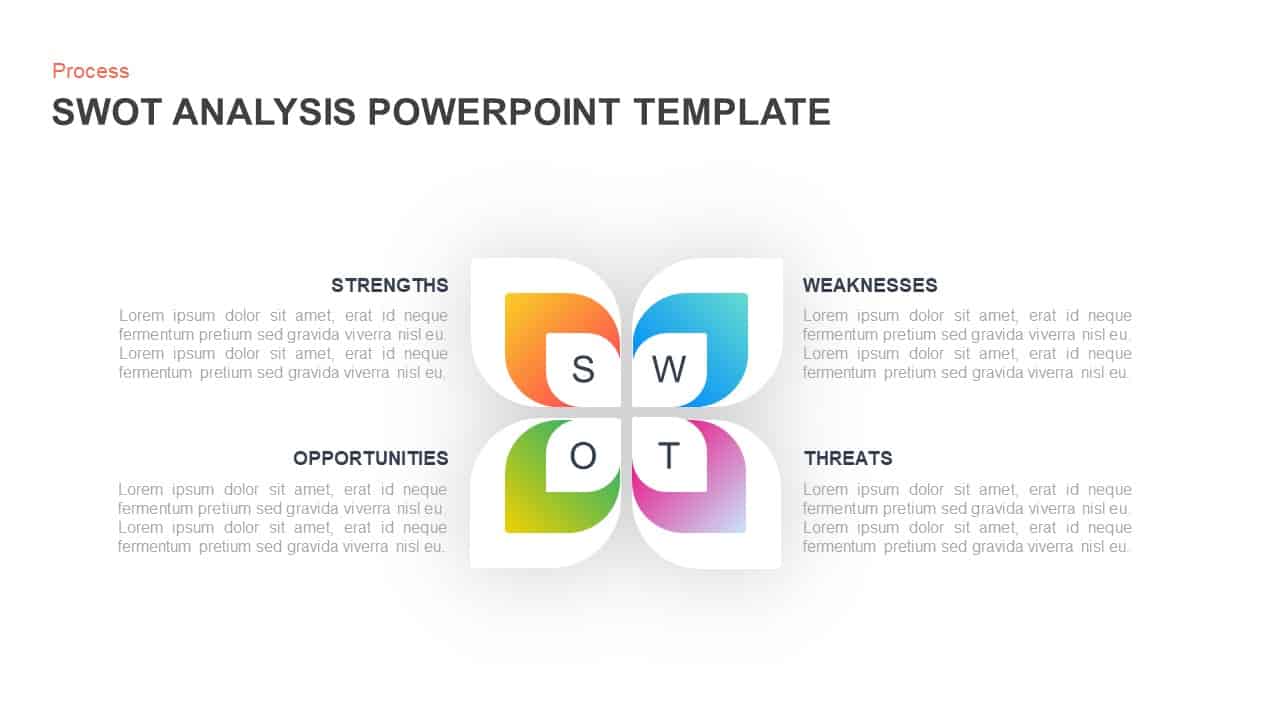
Gradient Petal SWOT Analysis Quadrant Template for PowerPoint & Google Slides
SWOT
3D Cube SWOT Analysis Infographic Template for PowerPoint & Google Slides
SWOT
PESTLE and PEST Strategic Analysis Diagrams Template for PowerPoint & Google Slides
Business Strategy
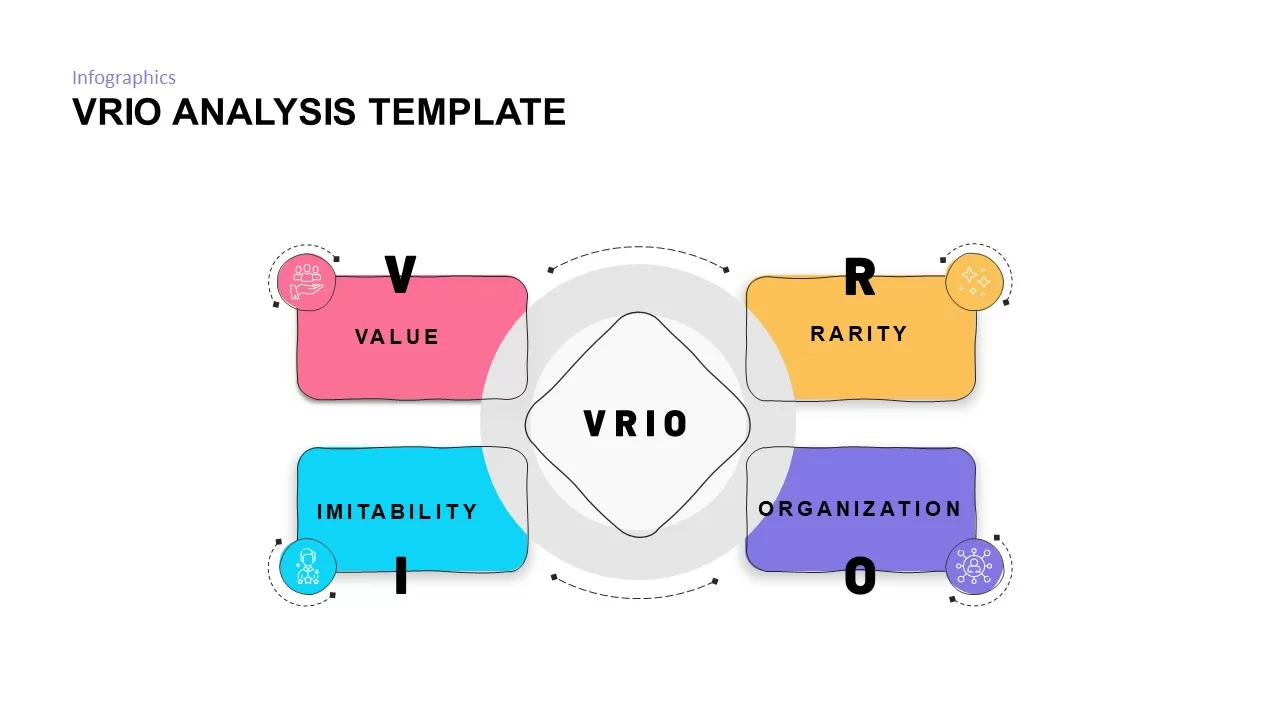
VRIO Analysis Framework template for PowerPoint & Google Slides
Business Strategy
Comprehensive Risk Impact Analysis Template for PowerPoint & Google Slides
Risk Management
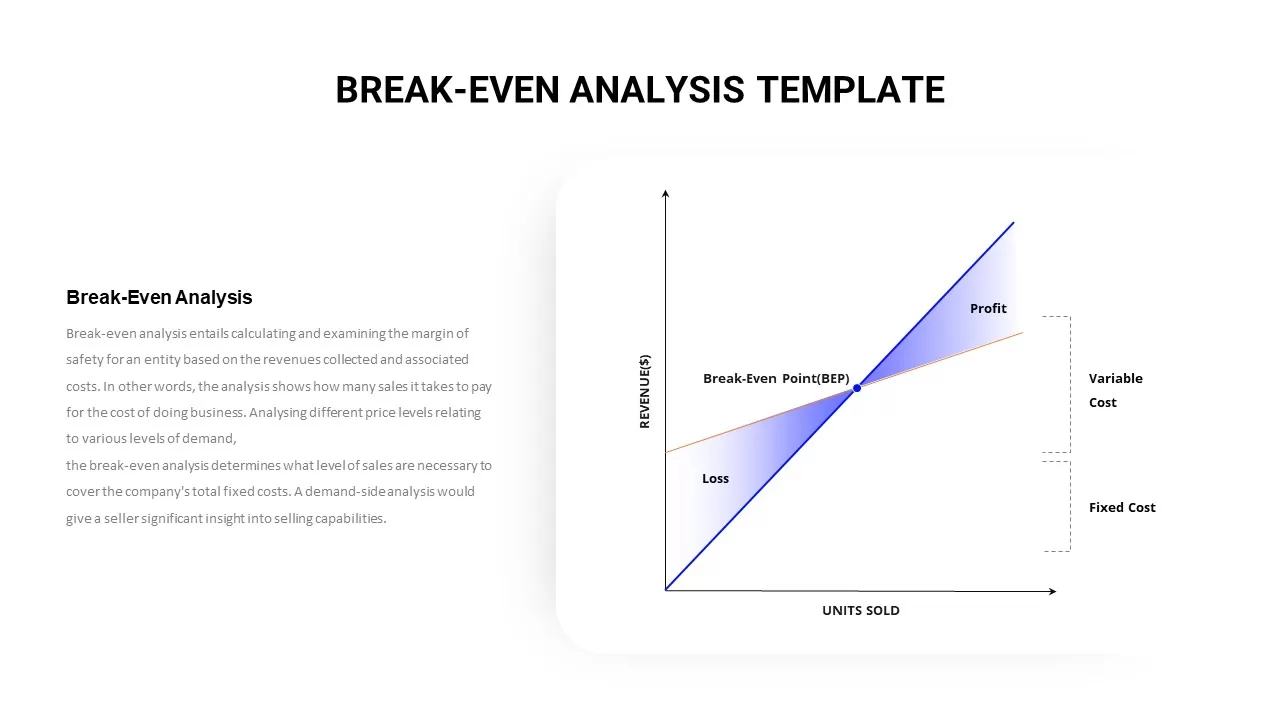
Break-Even Analysis Infographic Template for PowerPoint & Google Slides
Revenue
Heat Map Analysis Template for PowerPoint & Google Slides
Risk Management
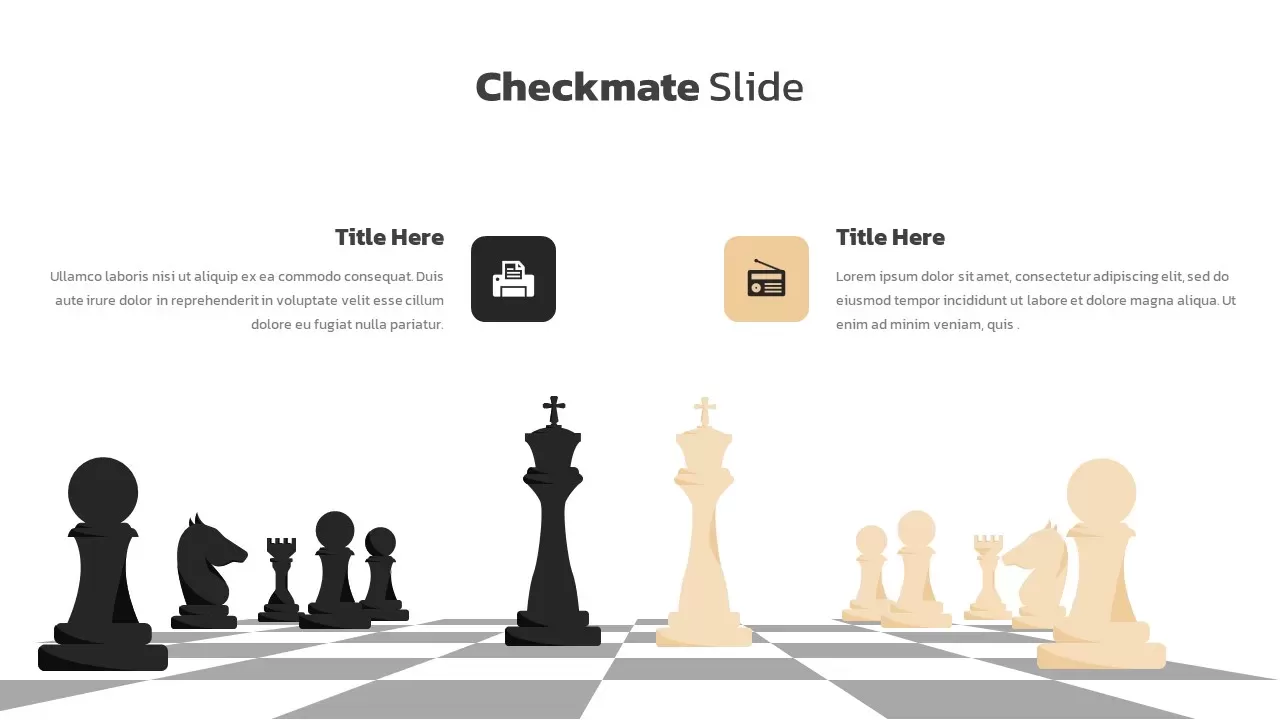
Checkmate Slide for Competitor Analysis Template for PowerPoint & Google Slides
Competitor Analysis
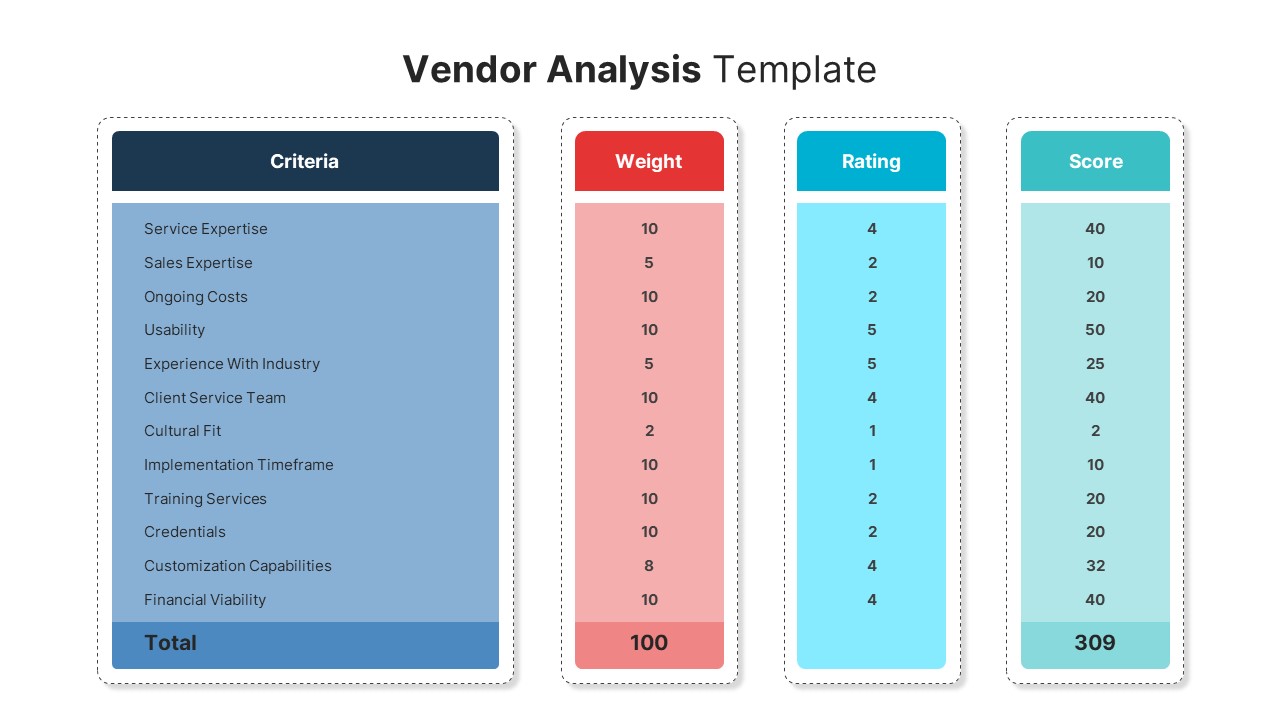
Vendor Analysis Criteria and Scoring template for PowerPoint & Google Slides
Business
Social Media Analysis Metrics Slide Deck Template for PowerPoint & Google Slides
Digital Marketing
Population Pyramid Chart Analysis Template for PowerPoint & Google Slides
Bar/Column
Proportional Area Chart Analysis Template for PowerPoint & Google Slides
Comparison Chart
Quarterly Network Volume Analysis Template for PowerPoint & Google Slides
Business Report
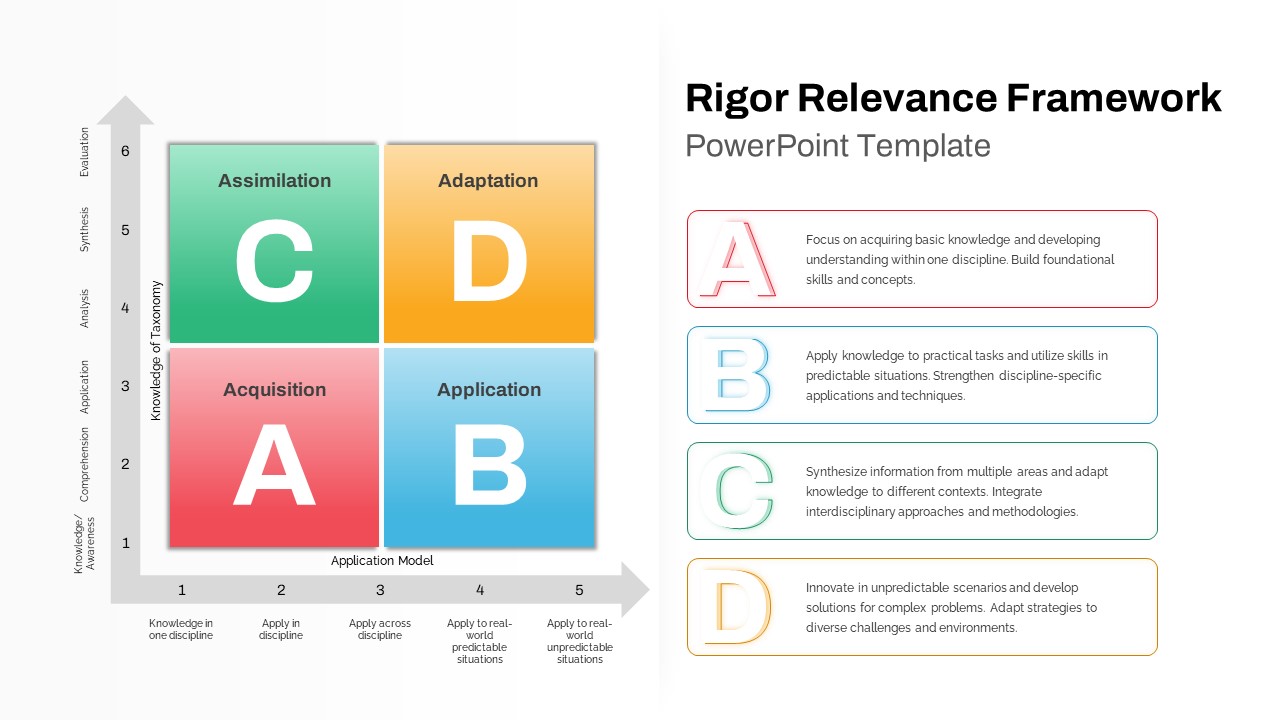
Rigor Relevance Framework Analysis Template for PowerPoint & Google Slides
Comparison
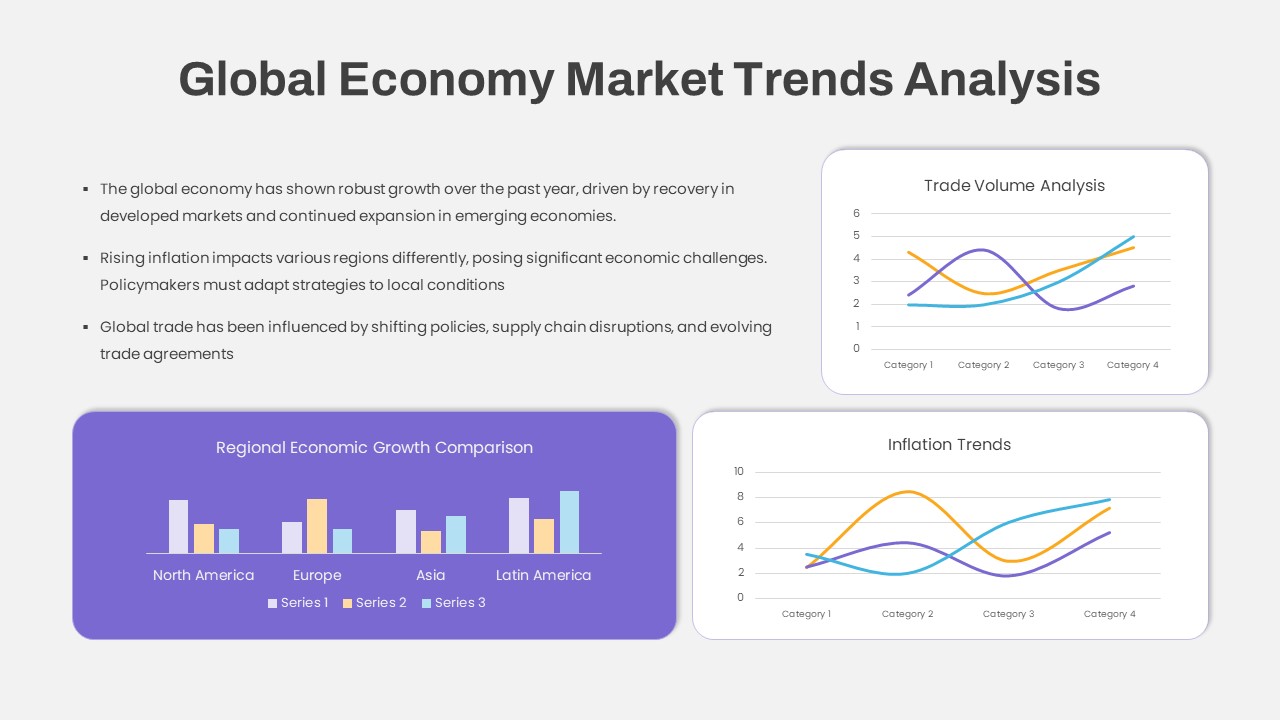
Global Economy Market Trends Analysis Template for PowerPoint & Google Slides
Comparison Chart
Skills Gap Analysis Comparison Chart Template for PowerPoint & Google Slides
Gap
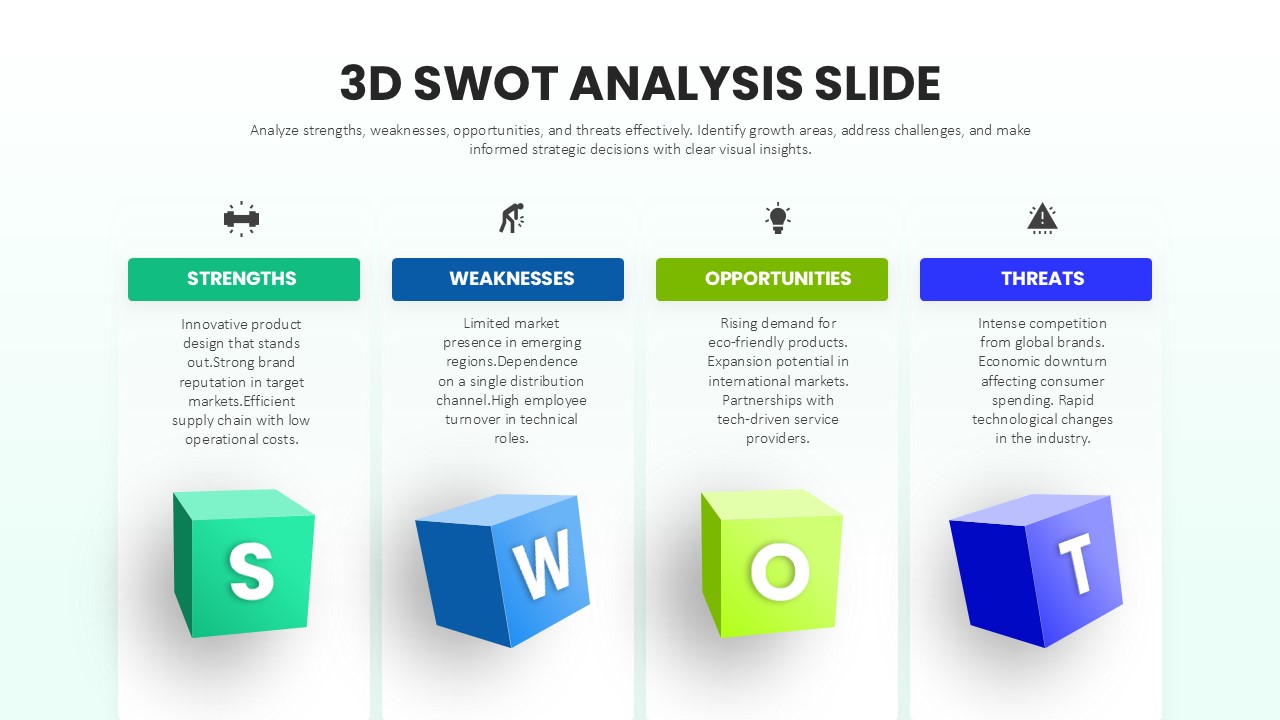
3D SWOT Analysis Template for PowerPoint & Google Slides
SWOT