Patient-Satisfaction KPI Dashboard for PowerPoint & Google Slides


Description
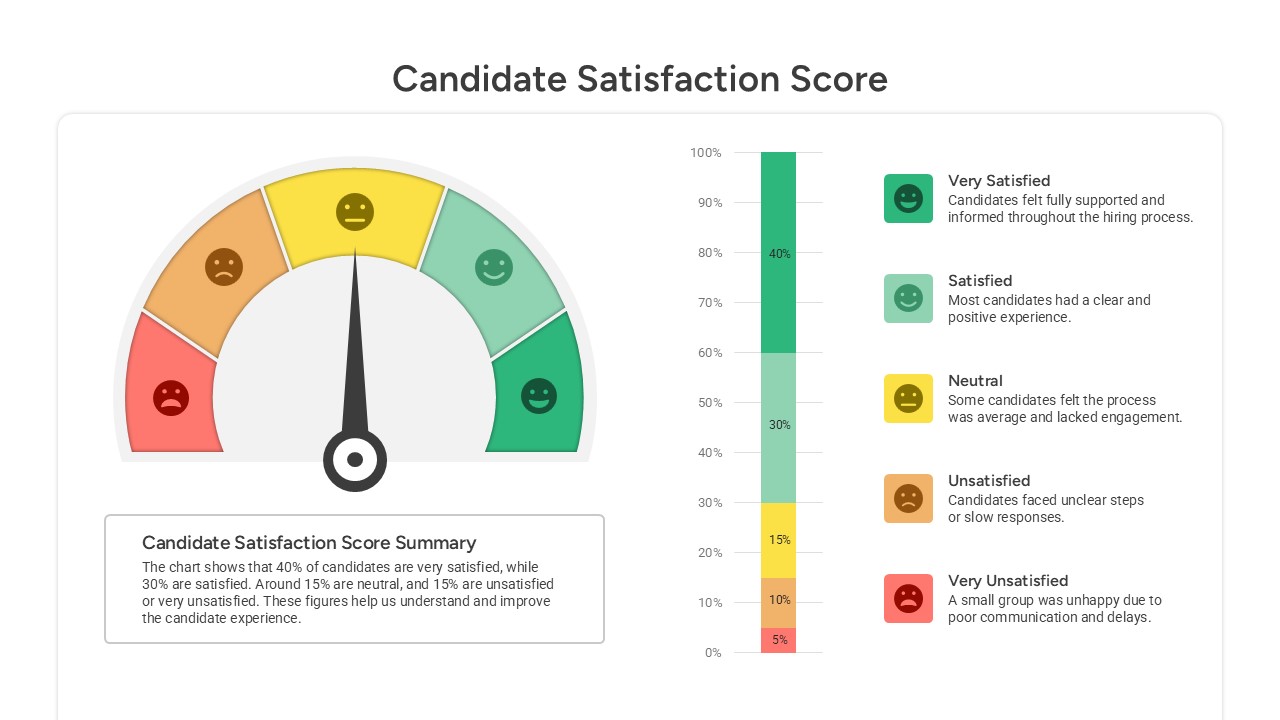
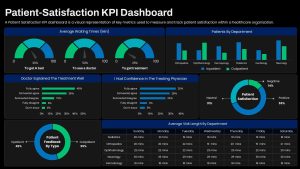
This Patient-Satisfaction KPI Dashboard offers a comprehensive visual representation of key metrics used to measure and track patient satisfaction within a healthcare organization. Designed for clear insights, it displays critical data such as average waiting times (to get a bed, see a doctor, and receive treatment), doctor explanations of treatments, and patient feedback confidence levels. The dashboard also includes a breakdown of patient satisfaction by department, categorized into inpatient and outpatient metrics, along with a satisfaction pie chart that highlights positive, neutral, and negative feedback.
In addition, the template showcases average visit lengths for various departments, presented in a daily format for easy tracking of trends. The data-driven visual layout provides intuitive, color-coded bar graphs and pie charts, offering a simple way to convey complex healthcare performance metrics. This template is ideal for presenting patient satisfaction surveys, evaluating healthcare services, and identifying areas for improvement.
Optimized for both PowerPoint and Google Slides, this template allows easy customization, making it suitable for use in presentations for hospital management, healthcare providers, and medical consultants.
Who is it for
Healthcare professionals, hospital administrators, patient experience managers, and healthcare consultants can effectively utilize this dashboard for tracking and presenting key performance indicators related to patient satisfaction. It’s also perfect for medical teams and department heads reviewing service performance or presenting findings during meetings or reports.
Other Uses
Beyond patient satisfaction tracking, this dashboard template can be adapted for a variety of healthcare-related metrics, such as staff performance reviews, patient treatment outcomes, or quality of care assessments. Its clear, visual style also makes it suitable for use in healthcare service presentations, strategic planning meetings, or healthcare-focused marketing materials.
Login to download this file

Item ID
SB05414
Related Templates

Customer Satisfaction KPI Dashboard Template for PowerPoint & Google Slides
Customer Experience
Employee Satisfaction Survey Dashboard Template for PowerPoint & Google Slides
Employee Performance
Free KPI Dashboard PowerPoint Template for PowerPoint & Google Slides
Charts
Free

Efficiency KPI Dashboard Metaphor Template for PowerPoint & Google Slides
Infographics
Sales Growth Dashboard: KPI Gauge & Line Template for PowerPoint & Google Slides
Revenue
Performance KPI Dashboard Slide Template for PowerPoint & Google Slides
Business Report
KPI Dashboard template for PowerPoint & Google Slides
Business Report
KPI Dashboard Overview template for PowerPoint & Google Slides
Finance
KPI Dashboard Data Visualization Template for PowerPoint & Google Slides
Bar/Column
KPI Dashboard Data Overview Slide Template for PowerPoint & Google Slides
Bar/Column
Michigan County Map with KPI Dashboard Template for PowerPoint & Google Slides
World Maps
DevOps KPI Dashboard Performance Metrics Template for PowerPoint & Google Slides
Software Development
Purchasing KPI Metrics Dashboard Template for PowerPoint & Google Slides
Business Report
Procurement KPI Dashboard & Metrics Template for PowerPoint & Google Slides
Business Report
4DX Scoreboard KPI Gauge Dashboard Template for PowerPoint & Google Slides
Business Strategy
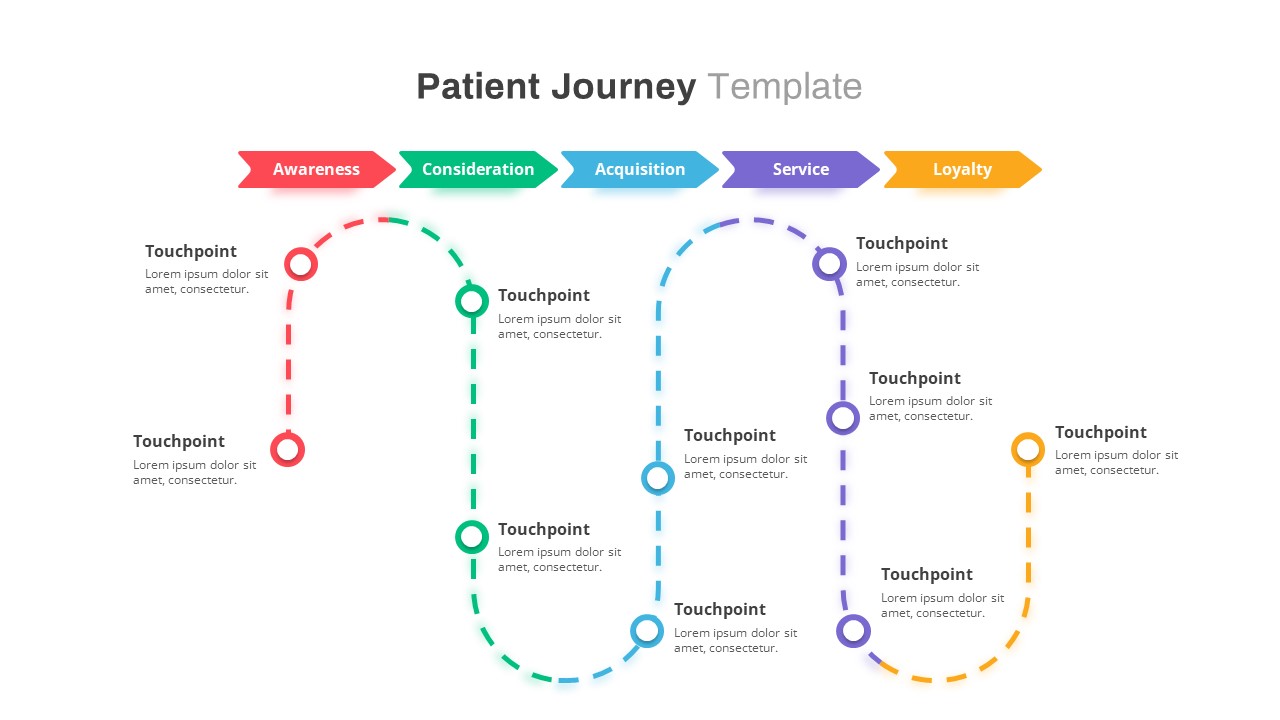
Healthcare Patient Journey Map Overview Template for PowerPoint & Google Slides
Health
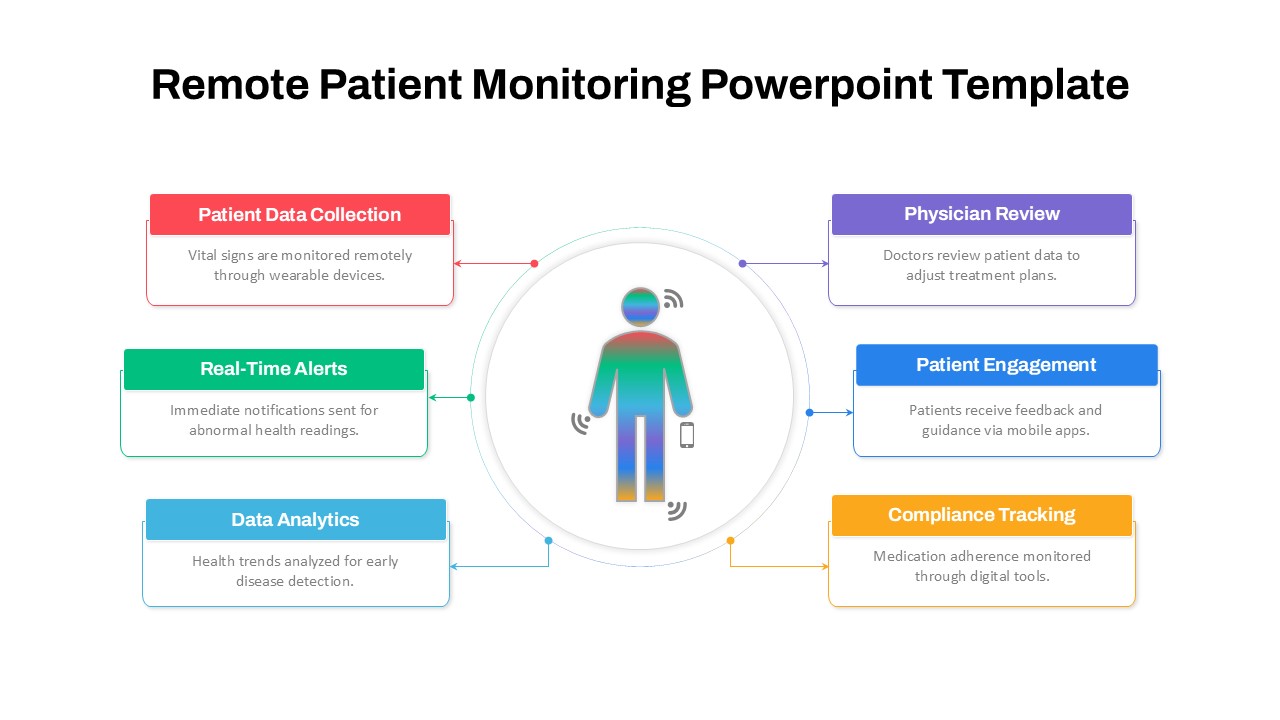
Remote Patient Monitoring Diagram Template for PowerPoint & Google Slides
Health
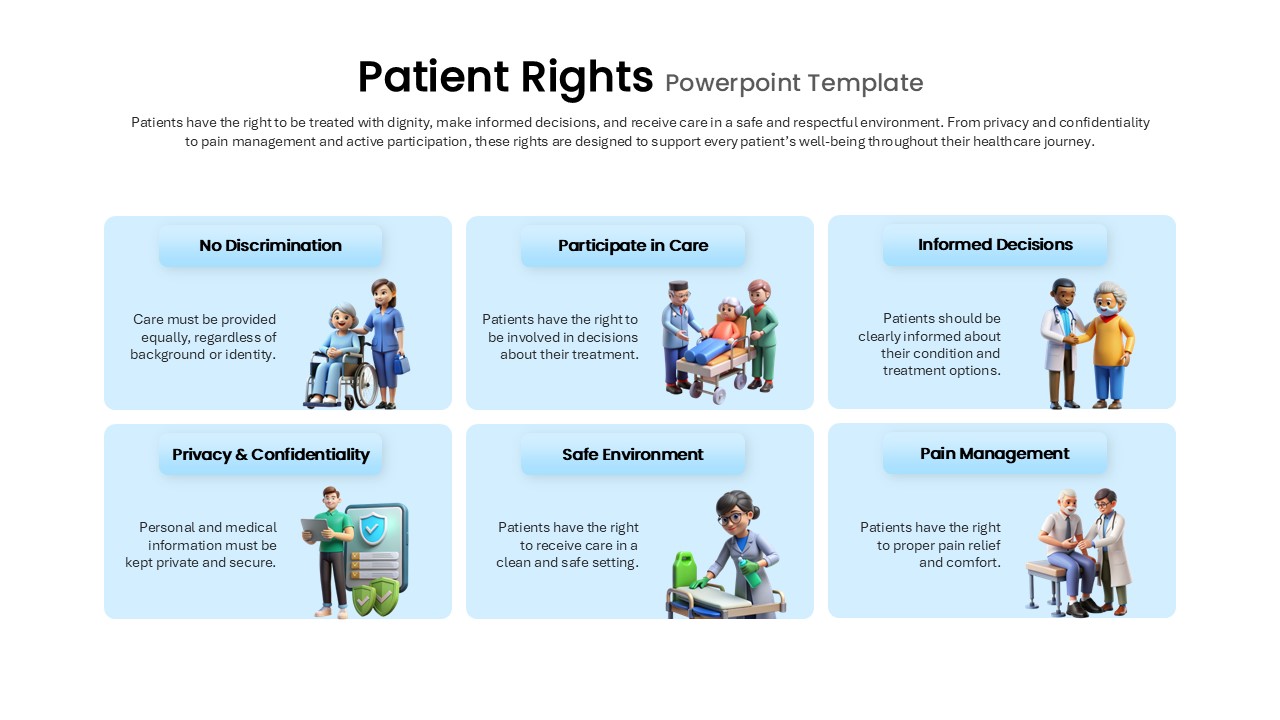
Patient Rights Guidelines template for PowerPoint & Google Slides
Medical
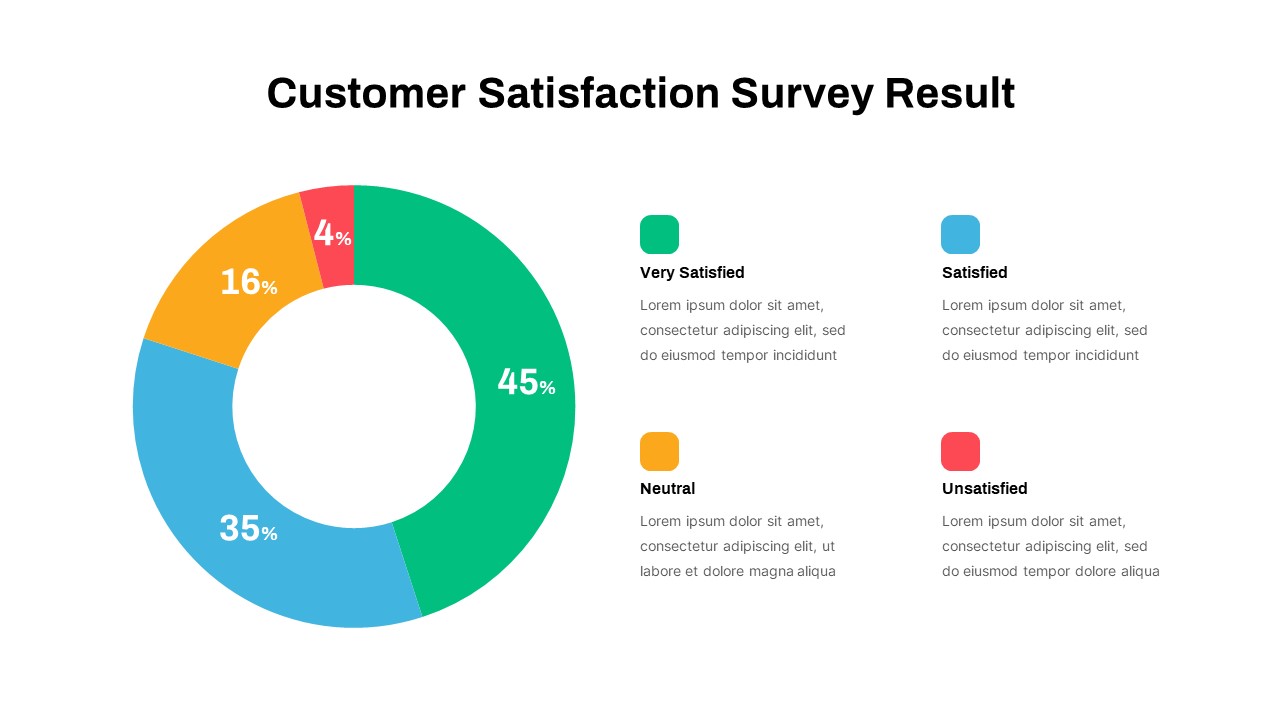
Customer Satisfaction Survey Result Template for PowerPoint & Google Slides
Marketing
Candidate Satisfaction Score template for PowerPoint & Google Slides
Business
Asia Map with KPI Metrics and Legend Template for PowerPoint & Google Slides
World Maps

Application Revenue Line Chart KPI Template for PowerPoint & Google Slides
Revenue
Professional Team Collage & KPI Slide Template for PowerPoint & Google Slides
Business
Circular Image Gallery & KPI Metrics Template for PowerPoint & Google Slides
Pie/Donut
Statistics Infographic & KPI Bar Chart Template for PowerPoint & Google Slides
Bar/Column
Monthly Recurring Revenue KPI Bar Chart Template for PowerPoint & Google Slides
Bar/Column
Free Balanced Scorecard Quadrant KPI Layout Template for PowerPoint & Google Slides
Employee Performance
Free
Year in Review KPI Highlights Slide for PowerPoint & Google Slides
Business Report
Comprehensive Release & Deployment KPI Template for PowerPoint & Google Slides
Software Development
Three Segment Donut Chart KPI Infographic Template for PowerPoint & Google Slides
Pie/Donut
E-commerce Analytics Dashboard Template for PowerPoint & Google Slides
Bar/Column

Dynamic Data Dashboard Infographic Template for PowerPoint & Google Slides
Bar/Column
Product Usage Analytics Dashboard Chart Template for PowerPoint & Google Slides
Bar/Column
Data Analytics Dashboard Design template for PowerPoint & Google Slides
Bar/Column
Business Dashboard Analytics & KPIs Template for PowerPoint & Google Slides
Bar/Column

Professional Team Efficiency Dashboard Template for PowerPoint & Google Slides
Business Report
Website Performance Dashboard template for PowerPoint & Google Slides
Charts
Sales Performance Dashboard template for PowerPoint & Google Slides
Business Report
Immigration Data Dashboard Template for PowerPoint & Google Slides
Bar/Column
Employee Skill Analysis Dashboard Template for PowerPoint & Google Slides
Employee Performance

Net Promoter Score Dashboard Template for PowerPoint & Google Slides
Customer Experience
Dashboard Templates for PowerPoint & Google Slides
Bar/Column
Modern Project Status Report Dashboard Template for PowerPoint & Google Slides
Project Status
Bull and Bear Stock Market Dashboard Template for PowerPoint & Google Slides
Infographics
Professional Nurse Infographic Dashboard Template for PowerPoint & Google Slides
Nursing
Interactive Benchmarking Gauge Dashboard Template for PowerPoint & Google Slides
Pie/Donut
Heat Map Risk Matrix Dashboard Template for PowerPoint & Google Slides
Comparison Chart
Project Status Dashboard Table Template for PowerPoint & Google Slides
Project Status
Project Status Dashboard with Metrics Template for PowerPoint & Google Slides
Project Status
Colorful Project Status Dashboard Template for PowerPoint & Google Slides
Project Status
Weekly Update Schedule Dashboard Template for PowerPoint & Google Slides
Agenda
Project Status Dashboard Template for PowerPoint & Google Slides
Project Status
Weekly Status Report Dashboard Template for PowerPoint & Google Slides
HR
Free Metro UI Dashboard Infographic Template for PowerPoint & Google Slides
Business Report
Free
Website Performance Monitoring Dashboard Template for PowerPoint & Google Slides
Business Report
One Pager Project Status Dashboard Template for PowerPoint & Google Slides
Project Status
One Pager Annual Report Dashboard Template for PowerPoint & Google Slides
Business Report
Social Media Analytics Dashboard Template for PowerPoint & Google Slides
Digital Marketing
Social Media Statistics 2023 Dashboard Template for PowerPoint & Google Slides
Comparison
Mastodon Metrics Infographic Dashboard Template for PowerPoint & Google Slides
Business Report
Soccer Match Stats Dashboard Slide Template for PowerPoint & Google Slides
Graphics
Weekly Project Status Dashboard Template for PowerPoint & Google Slides
Project Status
Freight Logistics Dashboard Infographic Template for PowerPoint & Google Slides
Comparison Chart
Free Quarterly Business Review Dashboard Template for PowerPoint & Google Slides
Business
Free
Cost Cutting Savings Dashboard Template for PowerPoint & Google Slides
Pie/Donut
Free Infographic Statistics Dashboard Slide for PowerPoint & Google Slides
Bar/Column
Free
Engineering Maintenance Dashboard Slide for PowerPoint & Google Slides
Software Development
Macroeconomic Indicators Dashboard Template for PowerPoint & Google Slides
PEST
Free Monthly Report PowerPoint Template for PowerPoint & Google Slides
Business Report
Free
Quarterly Financial Summary Dashboard Template for PowerPoint & Google Slides
Business Report
Banking Financial Overview Dashboard Template for PowerPoint & Google Slides
Finance
Quarterly Business Review Dashboard Template for PowerPoint & Google Slides
Pitch Deck
Monthly Business Review Dashboard Deck Template for PowerPoint & Google Slides
Business Report
Project Progress Dashboard Pie Charts Template for PowerPoint & Google Slides
Project
Monthly Sales Performance Dashboard Template for PowerPoint & Google Slides
Charts
HR Report Dashboard Template for PowerPoint & Google Slides
Employee Performance
Budget Forecast Dashboard & Donut Charts Template for PowerPoint & Google Slides
Pie/Donut
Risk Level Gauge Comparison Dashboard Template for PowerPoint & Google Slides
Comparison
Inventory Management Dashboard Template for PowerPoint & Google Slides
Process
Incident Tracking Dashboard for PowerPoint & Google Slides
Business Plan
Digital Marketing KPIs Dashboard Dark Template for PowerPoint & Google Slides
Business Report
Employee Performance Metrics Dashboard Template for PowerPoint & Google Slides
Employee Performance
Turnover Analysis Dashboard Template for PowerPoint & Google Slides
Employee Performance
Project Tracking Dashboard Table Template for PowerPoint & Google Slides
Project Status
Action Items Management Dashboard Table Template for PowerPoint & Google Slides
Project Status
Electronic Health Records Dashboard template for PowerPoint & Google Slides
Health
Customer Interview Insights Dashboard Template for PowerPoint & Google Slides
Customer Experience
Account Overview Dashboard template for PowerPoint & Google Slides
Business
Project Status Dashboard Report Template for PowerPoint & Google Slides
Project Status
Project Status Update Dashboard Table Template for PowerPoint & Google Slides
Project Status
Cohort Analysis Retention Dashboard Template for PowerPoint & Google Slides
Comparison Chart
Project Status Dashboard Template for PowerPoint & Google Slides
Project Status
Dashboard Project Status Template for PowerPoint & Google Slides
Project Status
Project Status Template Dashboard with Gauge for PowerPoint & Google Slides
Project Status
Task Completion Rate Dashboard Template for PowerPoint & Google Slides
Business
Project Status Dashboard with RAG Legend Template for PowerPoint & Google Slides
Project Status
End of Year Review Dashboard Template for PowerPoint & Google Slides
Business Report
Construction Project Dashboard Template for PowerPoint & Google Slides
Project
MVP Product Roadmap Delivery Dashboard for PowerPoint & Google Slides
Roadmap
Employee Headcount Dashboard Report Template for PowerPoint & Google Slides
Employee Performance