Interactive Oklahoma County Map Template for PowerPoint & Google Slides


Description
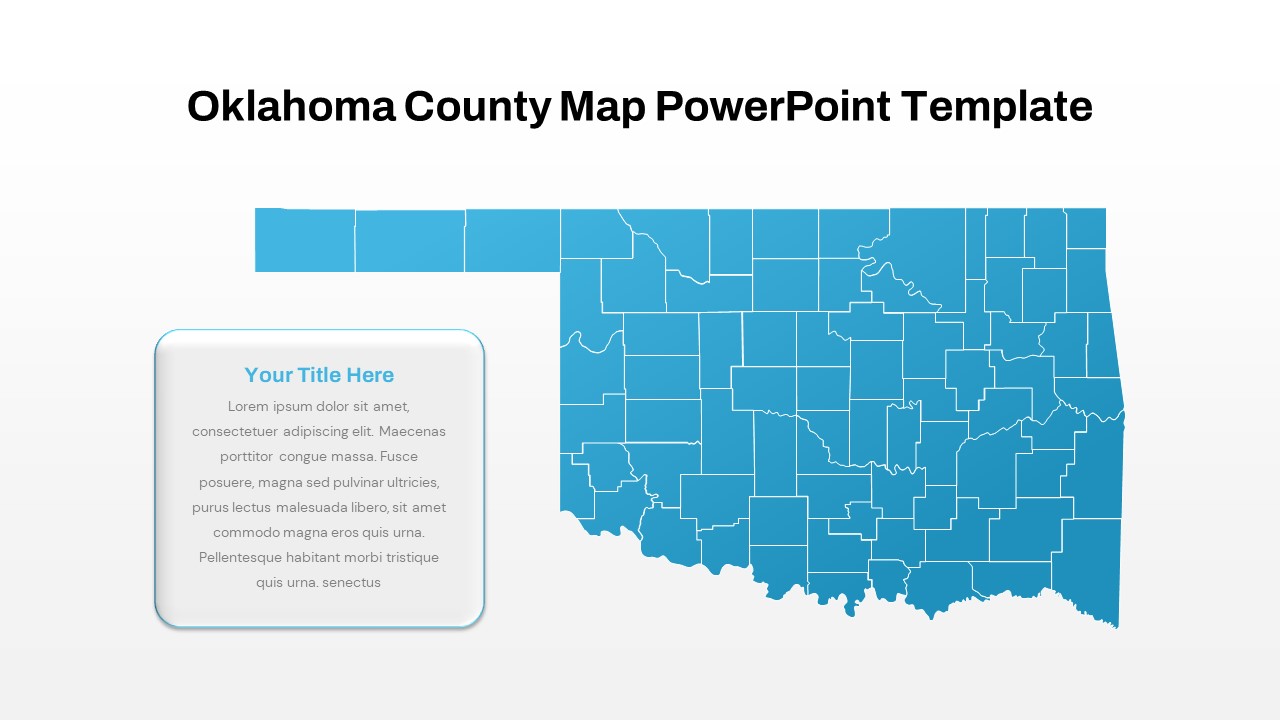
This slide delivers a high-resolution vector map of Oklahoma’s 77 counties in a unified light-blue palette, complete with a bold header and an editable callout panel. Each county shape is fully customizable, enabling you to recolor regions, add icons, or insert labels for clear regional emphasis. A top row of county swatches provides at-a-glance reference, while the floating text box supports headlines and detailed descriptions. The subtle white-to-gray gradient background and precise boundary lines ensure clean, professional legibility.
Built on PowerPoint and Google Slides masters, this template leverages vector graphics for infinite scalability without pixelation. Recolor individual counties or apply global theme colors in seconds, and tweak the callout box’s drop shadow and border to match your branding. Preconfigured aspect ratios keep your slide consistent, and placeholder text accelerates content updates. The design embraces a flat, minimal aesthetic, focusing on data clarity and ease of customization across devices and resolutions.
Optimized for presentations, reports, and virtual meetings, this slide offers consistent visual quality whether projected in a boardroom or shared online. The lightweight file size reduces loading times, and compatibility with slide libraries and cloud repositories streamlines team collaboration. Accessibility-focused contrast between county outlines and the background guarantees readability for diverse audiences, and the vector-based layout supports printing at any scale for handouts or large-format posters.
This template also includes a synchronized data table and customizable legend shapes that update automatically with your inputs. Use the callout panel to add annotations or embed charts alongside the map. With layered objects, you can drag-and-drop reorder elements and toggle visibility to create focused, uncluttered views.
Who is it for
Public sector planners, regional analysts, marketing teams, and academic researchers will leverage this Oklahoma county map to visualize demographic trends, sales territories, or resource allocations. Consultants, nonprofit organizations, and real estate firms can annotate regional data with precision. Educational institutions and civic groups can enrich lectures or community presentations with an interactive state map.
Other Uses
Beyond state-level analysis, repurpose this map for election result breakdowns, school district overlays, supply chain routing, or emergency response planning. Use the vector counties to create color-coded heat maps, sales performance charts, market penetration visuals, or geographic risk assessments, making this slide a versatile asset for any data-driven narrative.
Login to download this file

Item ID
SB04168
Related Templates

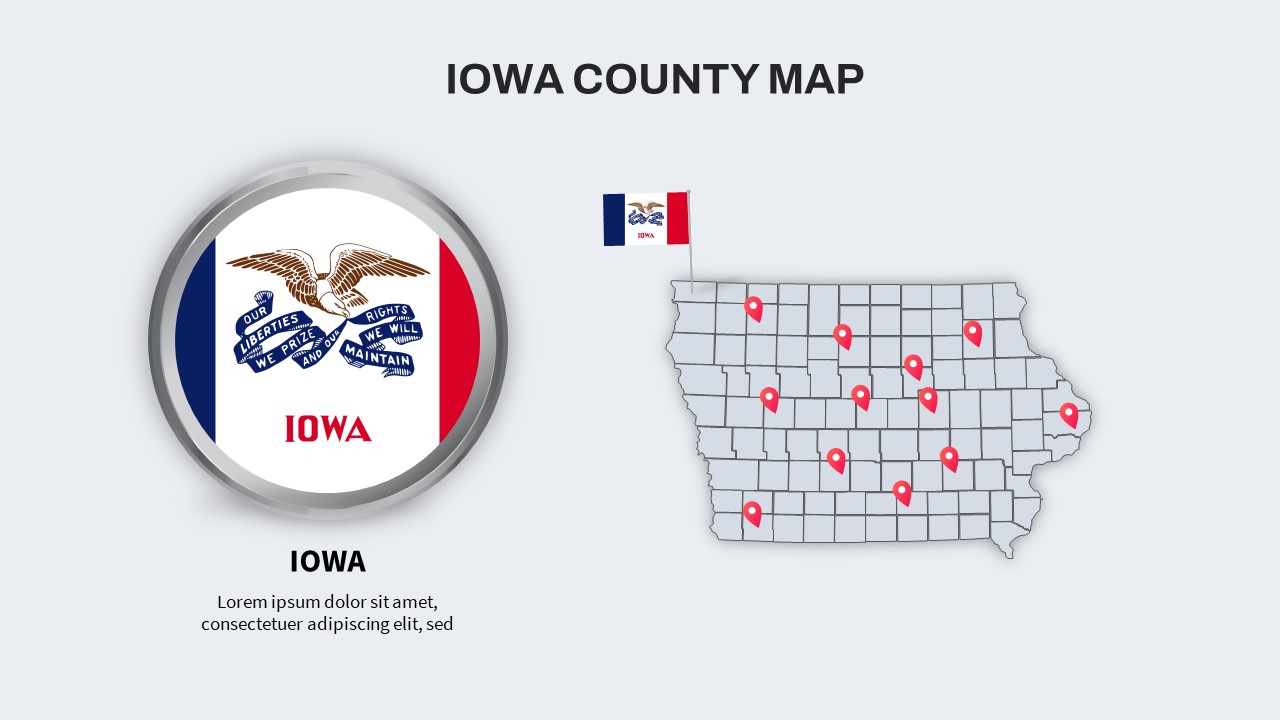
Iowa County Map with Location Markers Template for PowerPoint & Google Slides
World Maps
Michigan County Map with KPI Dashboard Template for PowerPoint & Google Slides
World Maps
Kentucky County Map Visualization Template for PowerPoint & Google Slides
World Maps
Interactive US Population Data Map Slide Template for PowerPoint & Google Slides
World Maps
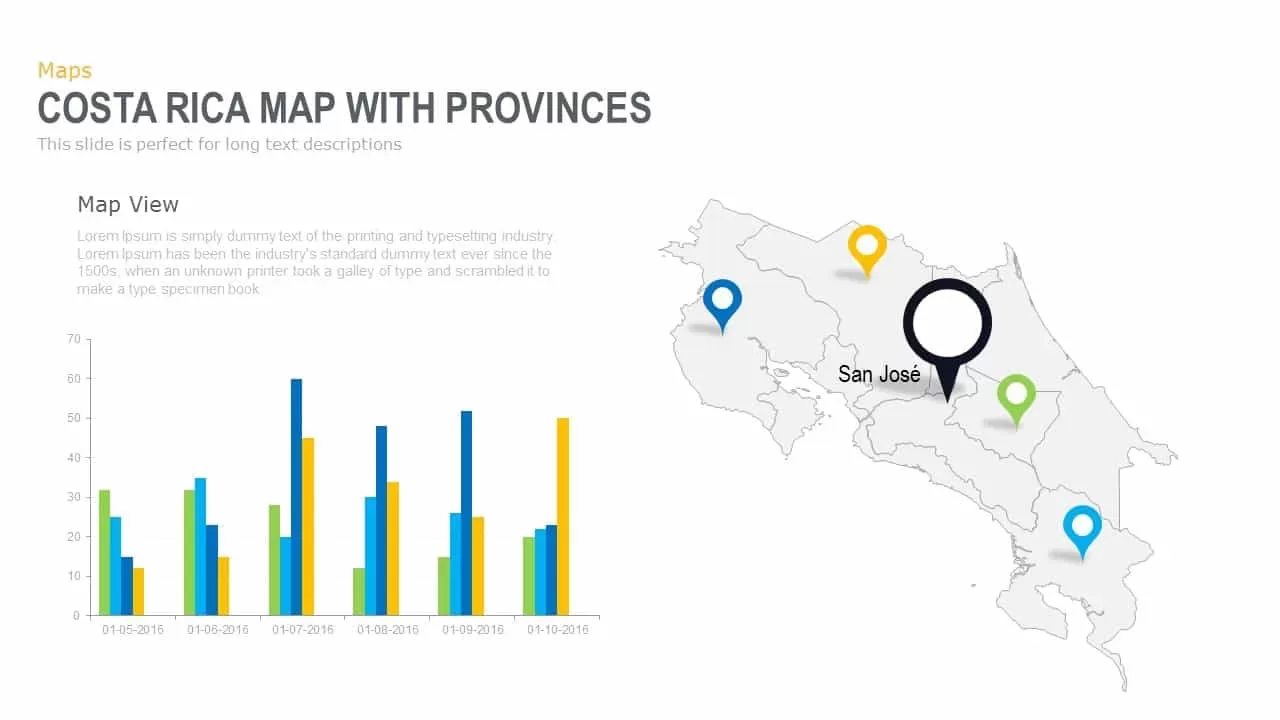
Interactive Costa Rica Province Map Template for PowerPoint & Google Slides
World Maps

Interactive Empathy Map Diagram Template for PowerPoint & Google Slides
Process
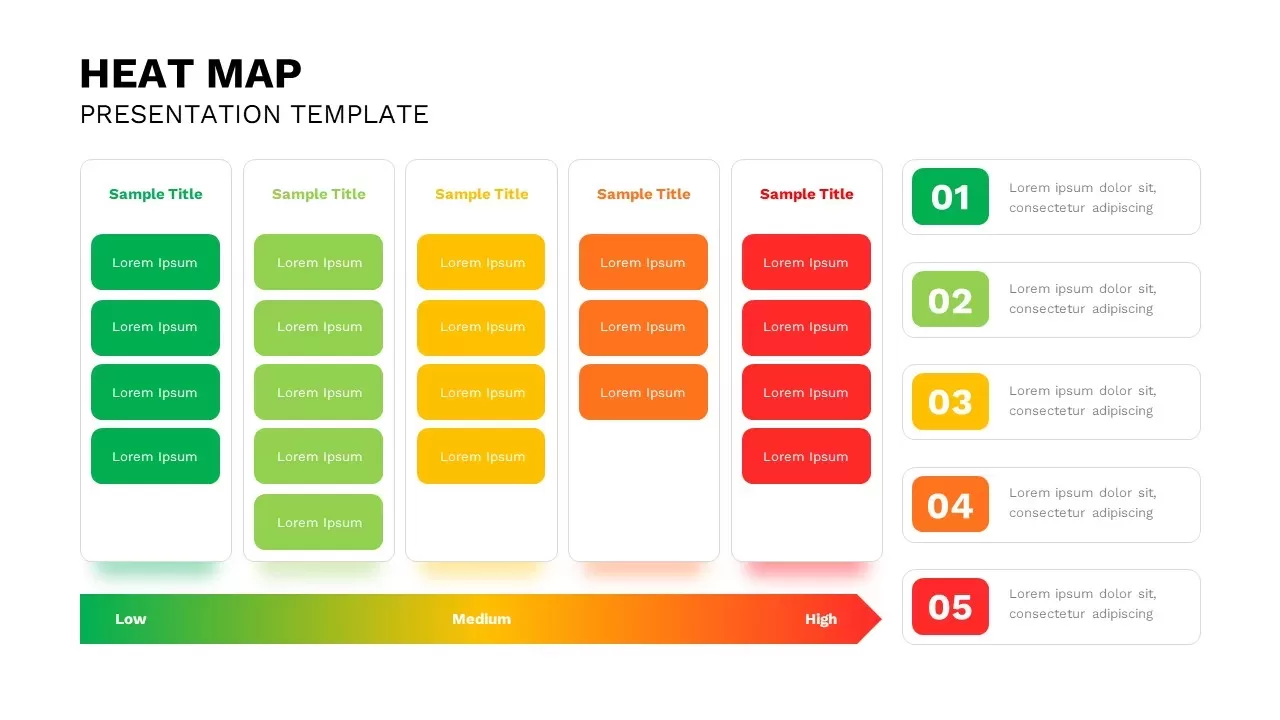
Professional Interactive Heat Map Matrix Template for PowerPoint & Google Slides
Comparison Chart
Interactive Heat Map Template for PowerPoint & Google Slides
Bar/Column
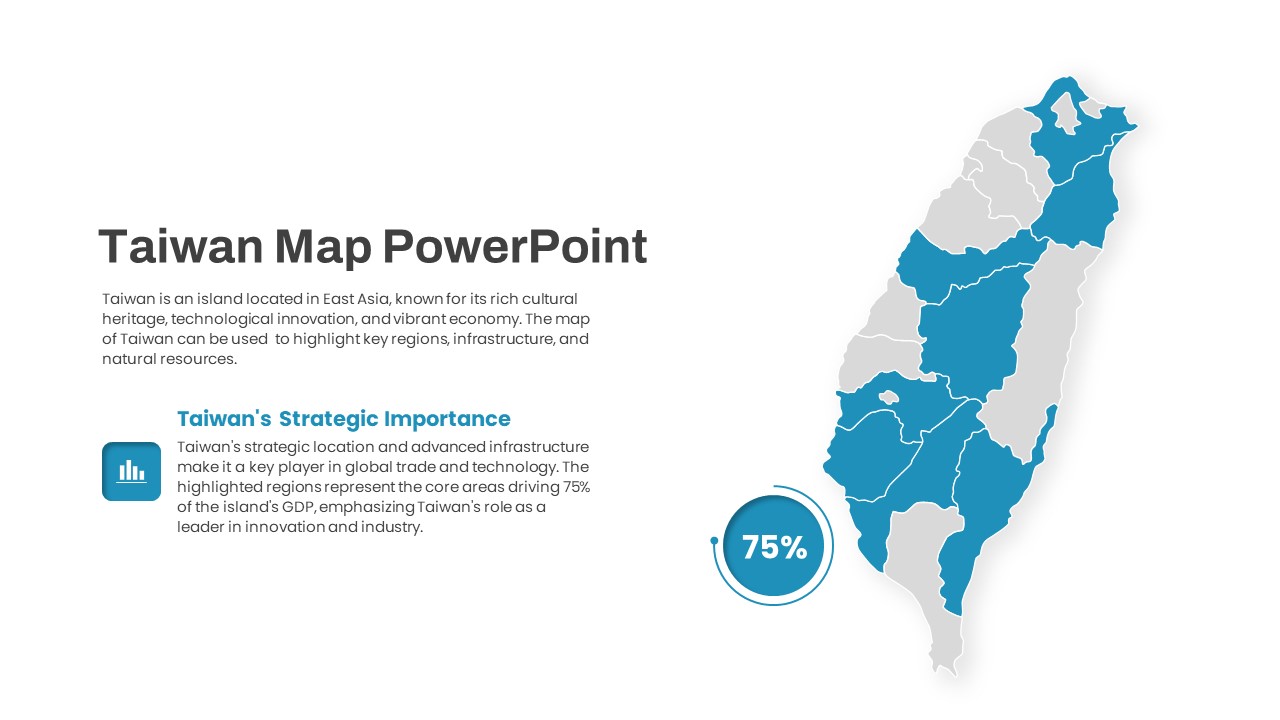
Interactive Taiwan Map Highlight Template for PowerPoint & Google Slides
World Maps

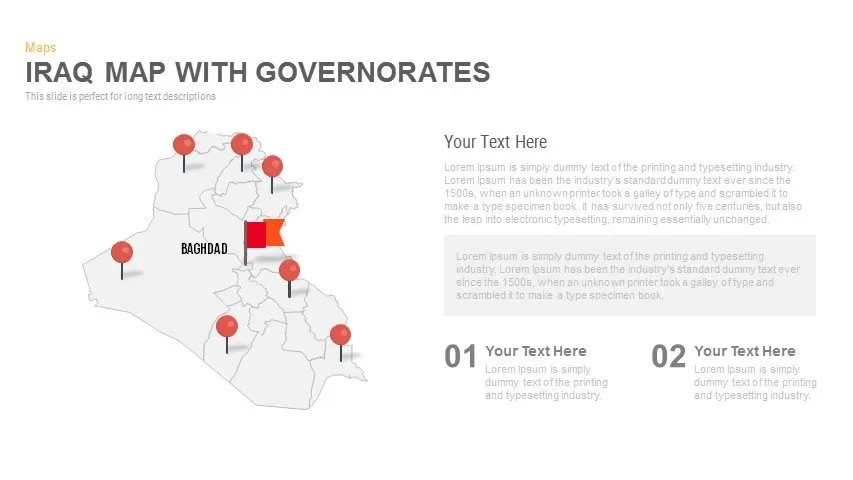
Interactive Iraq Map with Governorates Slide Pack for PowerPoint & Google Slides
World Maps
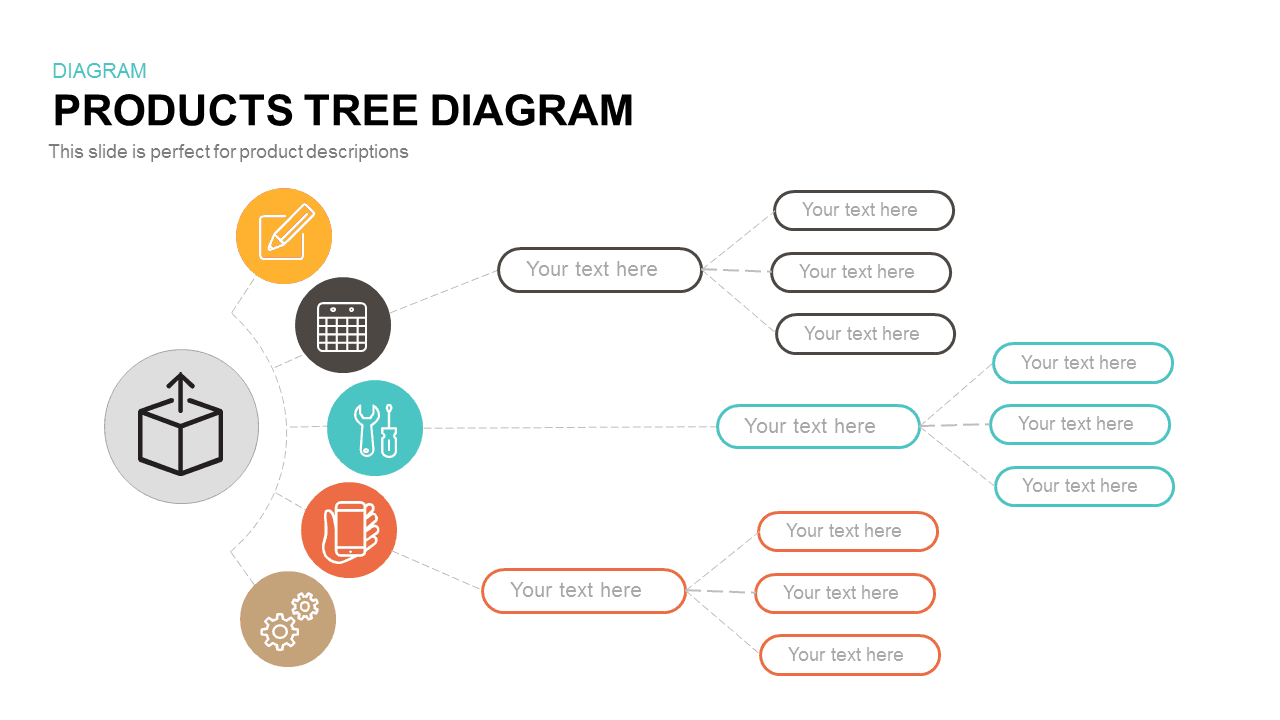
Interactive Products Tree Diagram template for PowerPoint & Google Slides
Org Chart
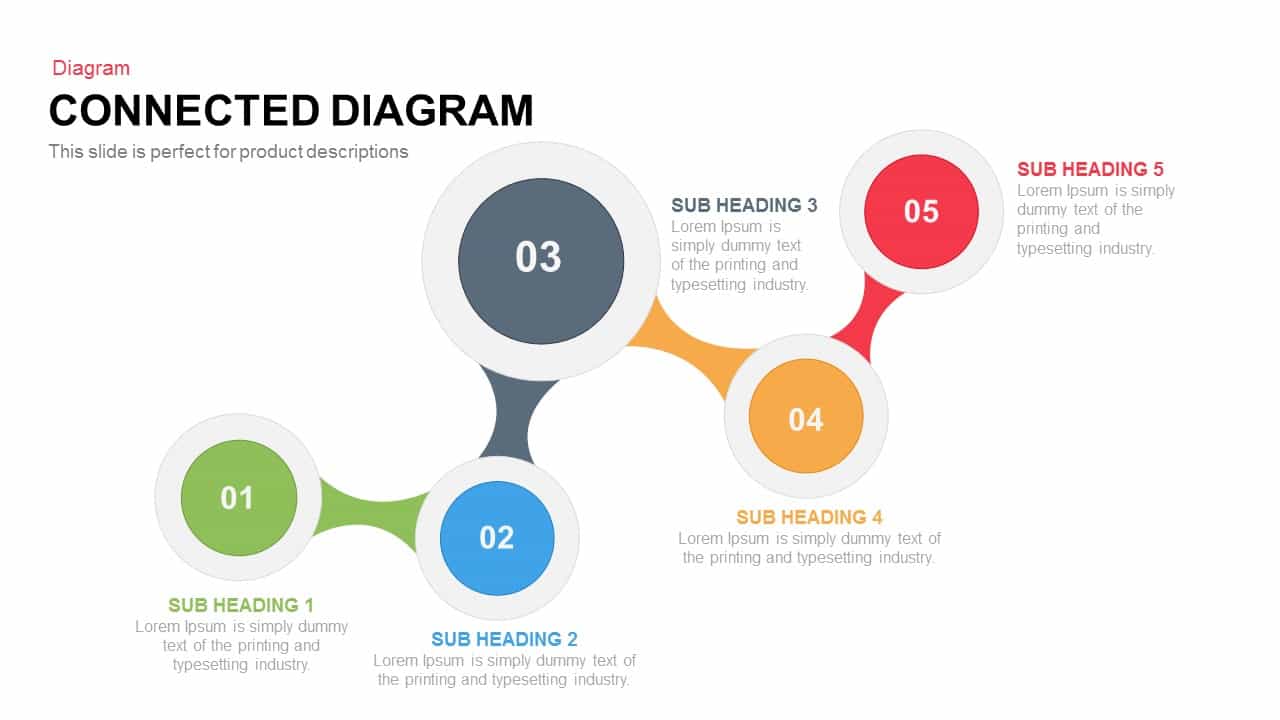
Interactive Connected Network Diagram Template for PowerPoint & Google Slides
Process
Interactive Product Comparison Bar Chart Template for PowerPoint & Google Slides
Bar/Column
Interactive Pricing Plan Comparison Template for PowerPoint & Google Slides
Comparison

Interactive Gap Analysis Puzzle Diagram Template for PowerPoint & Google Slides
Gap

Interactive RACI Responsibility Matrix Template for PowerPoint & Google Slides
Project
Interactive 3D Puzzle SWOT Analysis Slide Template for PowerPoint & Google Slides
SWOT
Interactive OKR Strategy Diagram Template for PowerPoint & Google Slides
Process
Free Interactive Online Course Presentation Template for PowerPoint & Google Slides
Pitch Deck
Free
Interactive Project Gantt Chart Timeline Template for PowerPoint & Google Slides
Gantt Chart
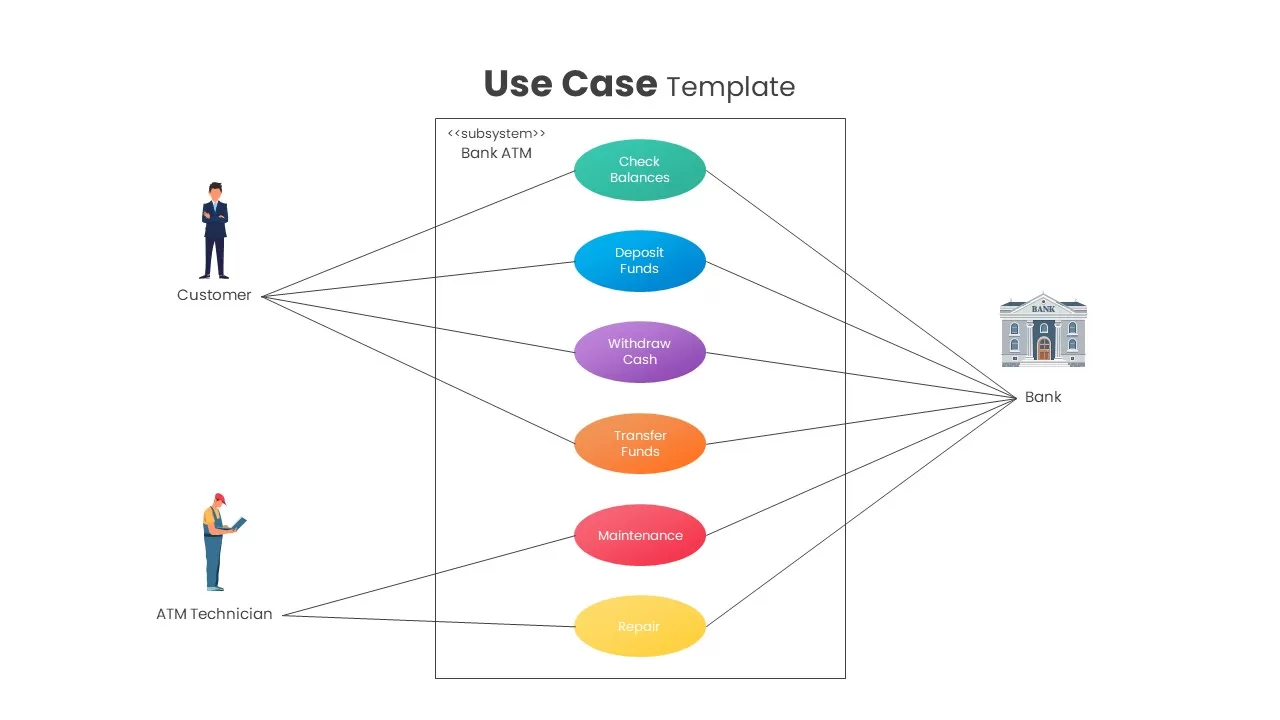
Interactive Bank ATM Use Case Diagram Template for PowerPoint & Google Slides
Software Development
Interactive Benchmarking Gauge Dashboard Template for PowerPoint & Google Slides
Pie/Donut
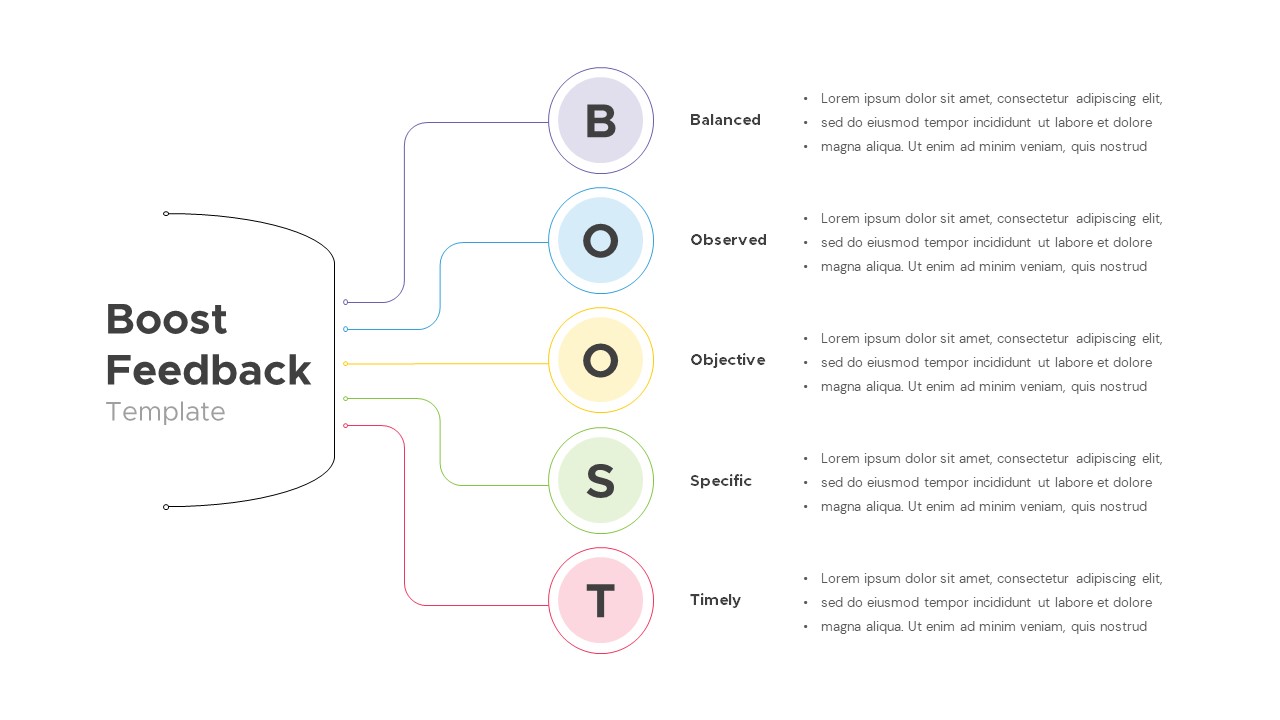
Interactive Boost Feedback Model Diagram Template for PowerPoint & Google Slides
Process

Free Interactive Trivia Presentation Template for PowerPoint & Google Slides
Graphics
Free
Free Interactive Two Truths and a Lie Game Template for PowerPoint & Google Slides
Decks
Free
Free Spin the Wheel Interactive Game Template for PowerPoint & Google Slides
Decks
Free
Interactive Slide Zoom & Transition Template for PowerPoint & Google Slides
Decks
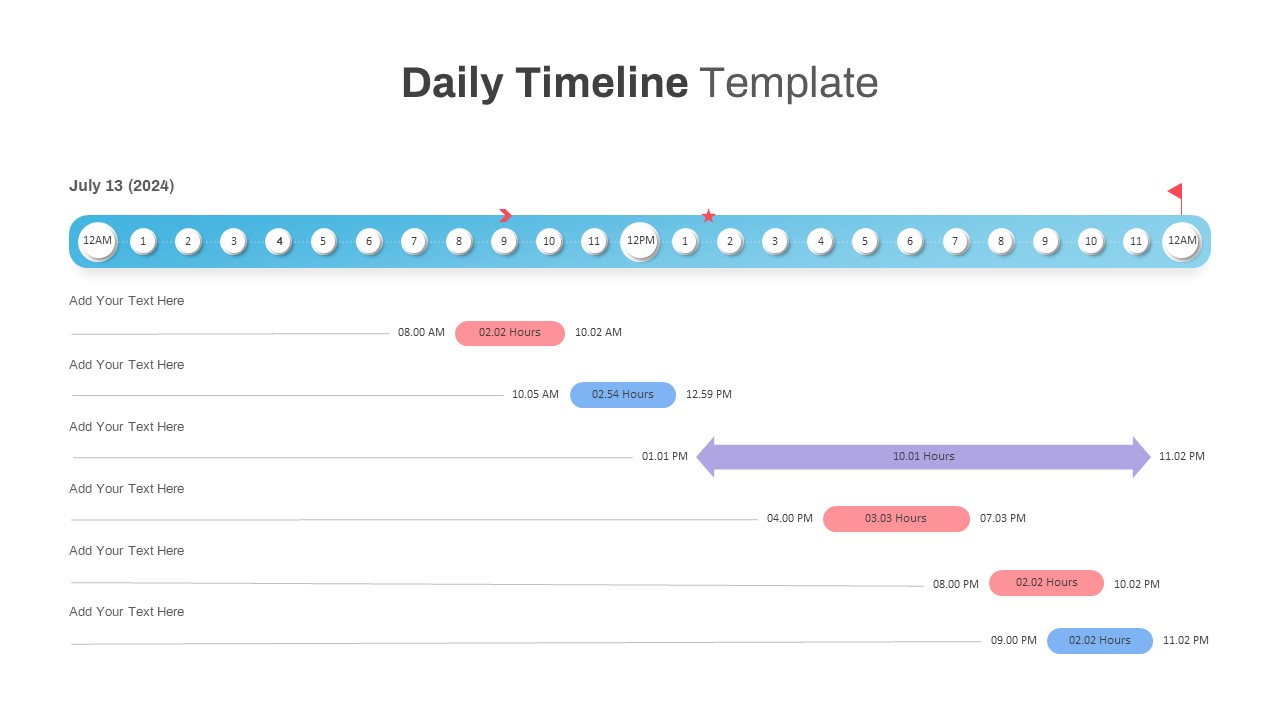
Interactive Daily Timeline Schedule Chart Template for PowerPoint & Google Slides
Timeline
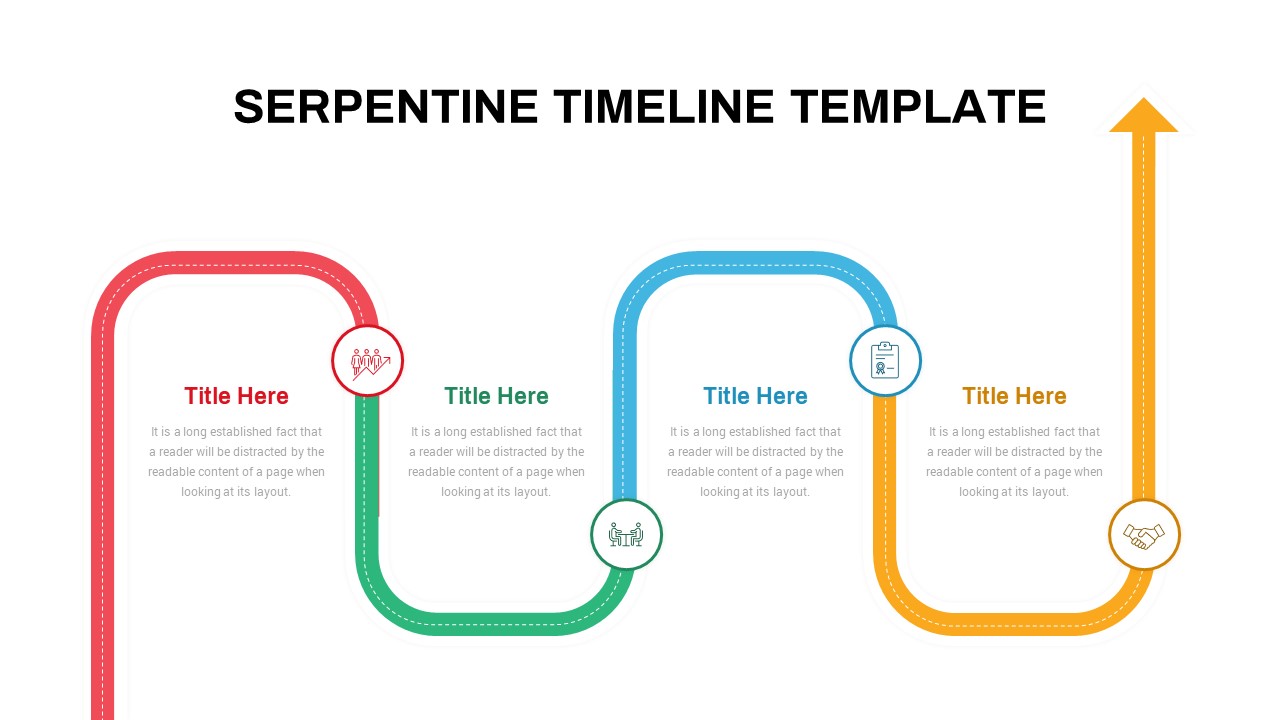
Interactive Serpentine Timeline Diagram Template for PowerPoint & Google Slides
Timeline
Interactive Milestone Timeline Template for PowerPoint & Google Slides
Timeline
Interactive Multi-Use Cost Comparison Template for PowerPoint & Google Slides
Comparison
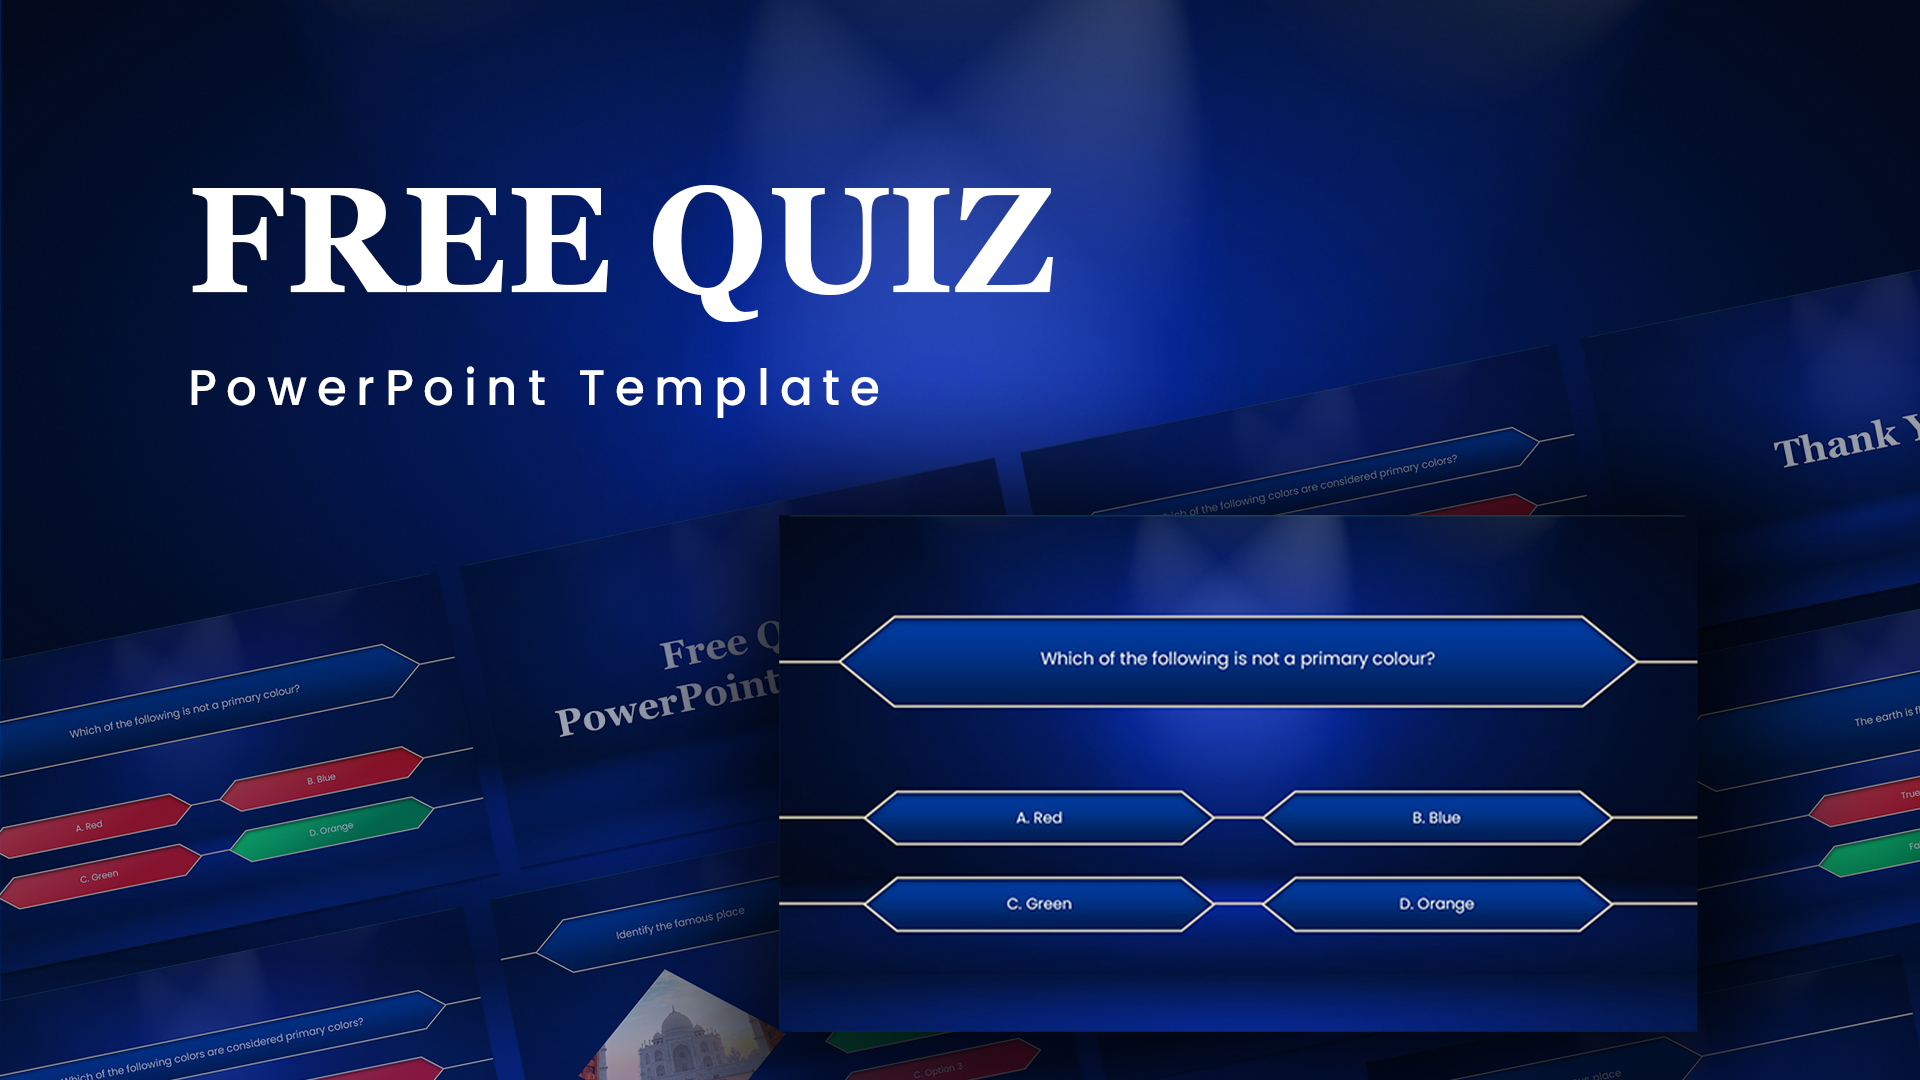
Free Animated Quiz Interactive Template for PowerPoint & Google Slides
Pitch Deck
Free
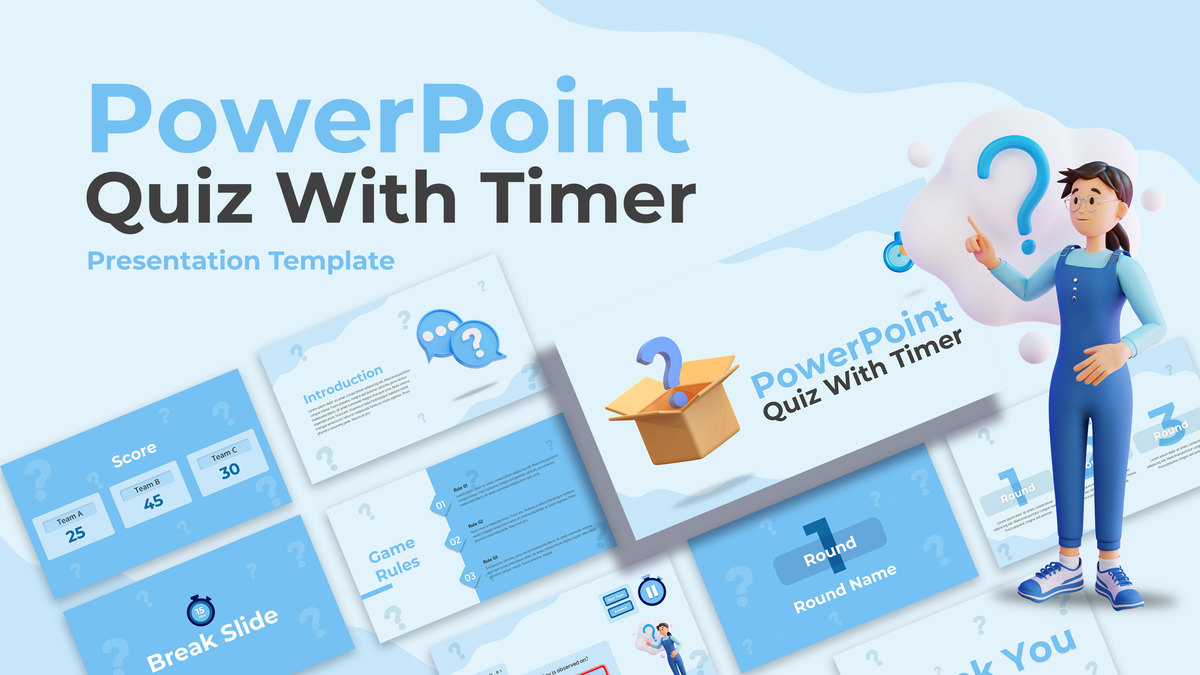
Interactive Quiz with Countdown Timer Template for PowerPoint & Google Slides
Pitch Deck
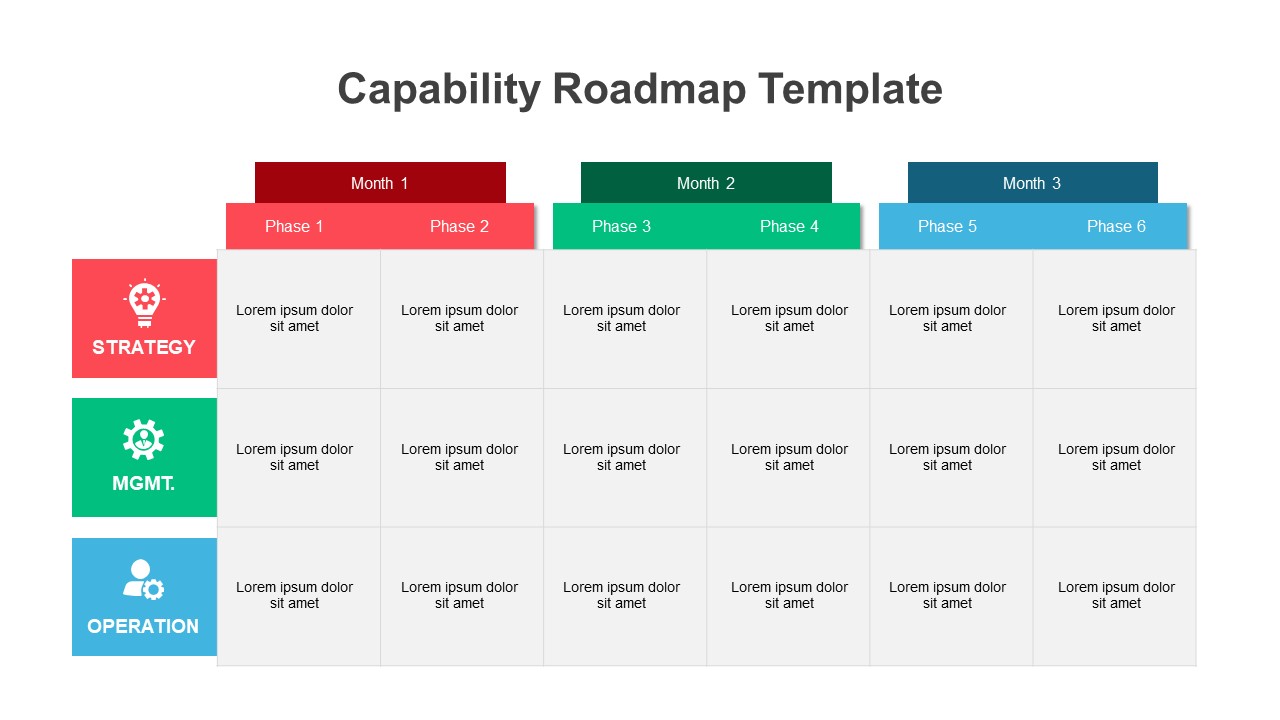
Interactive Strategic Capability Roadmap Template for PowerPoint & Google Slides
Roadmap
Interactive Jump Line Data Chart Template for PowerPoint & Google Slides
Comparison Chart
Interactive Quiz with Game Rules Template for PowerPoint & Google Slides
Graphics
Free
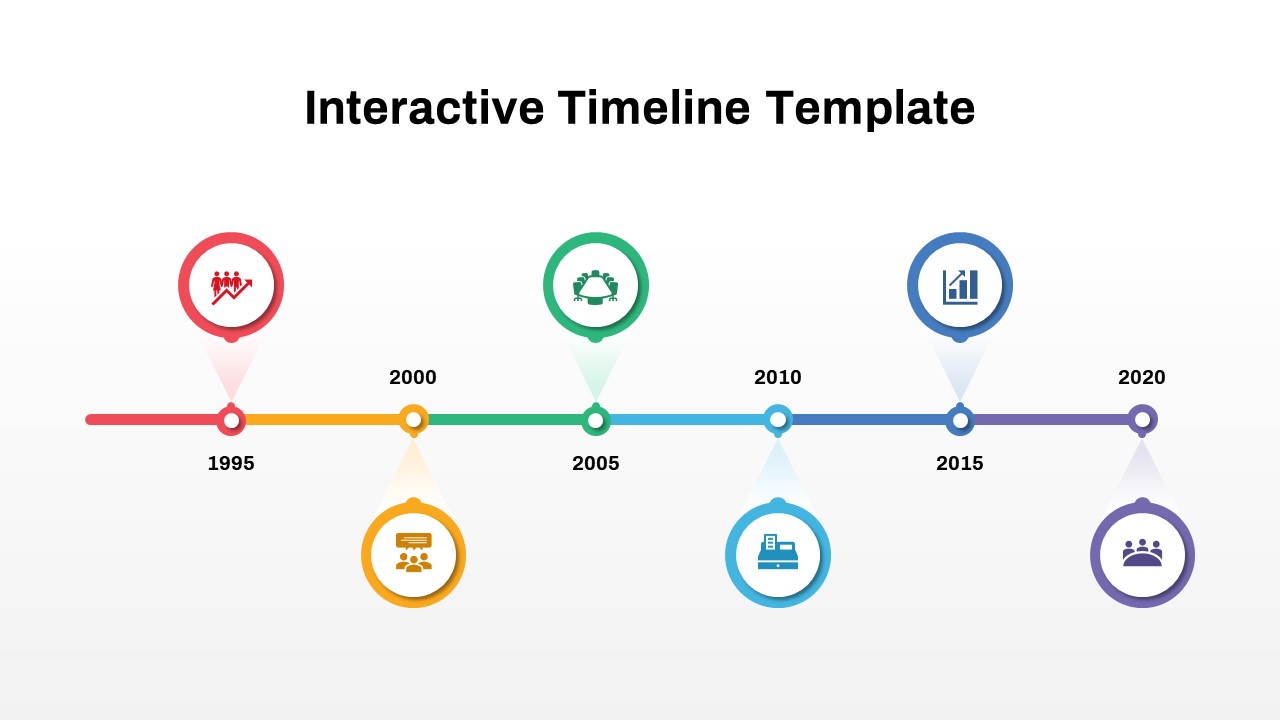
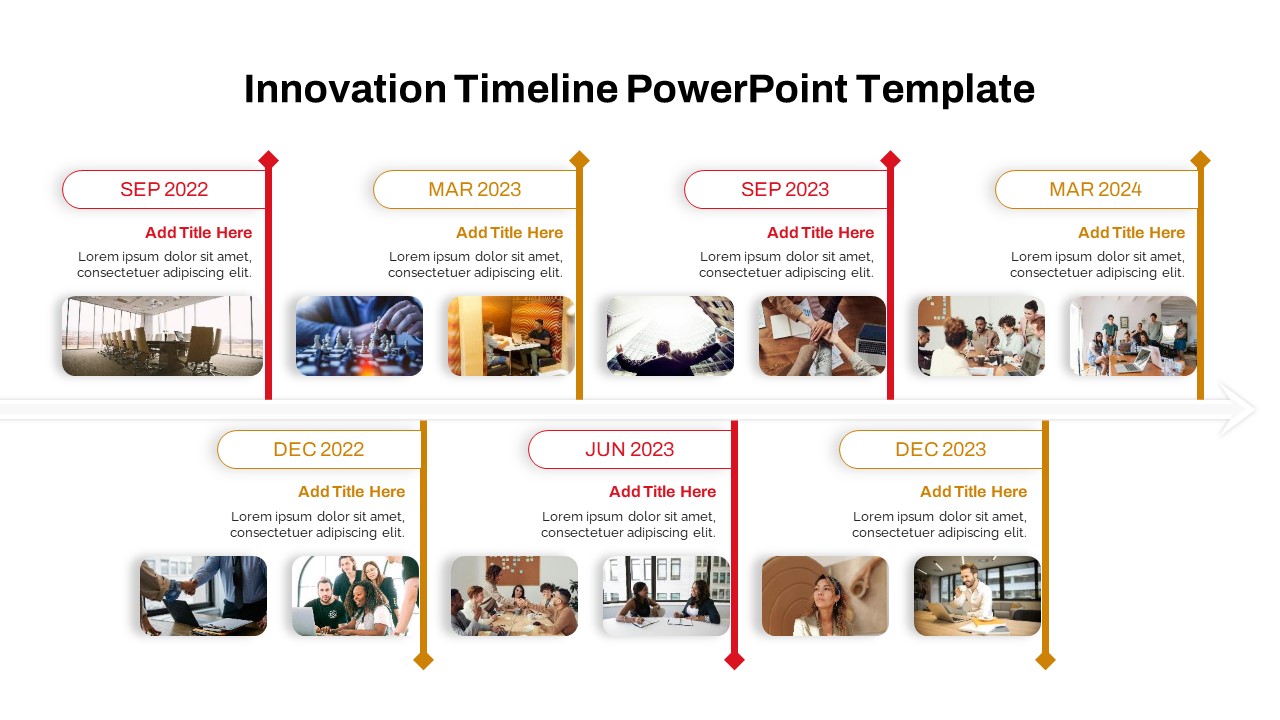
Interactive Innovation Timeline Roadmap Template for PowerPoint & Google Slides
Timeline
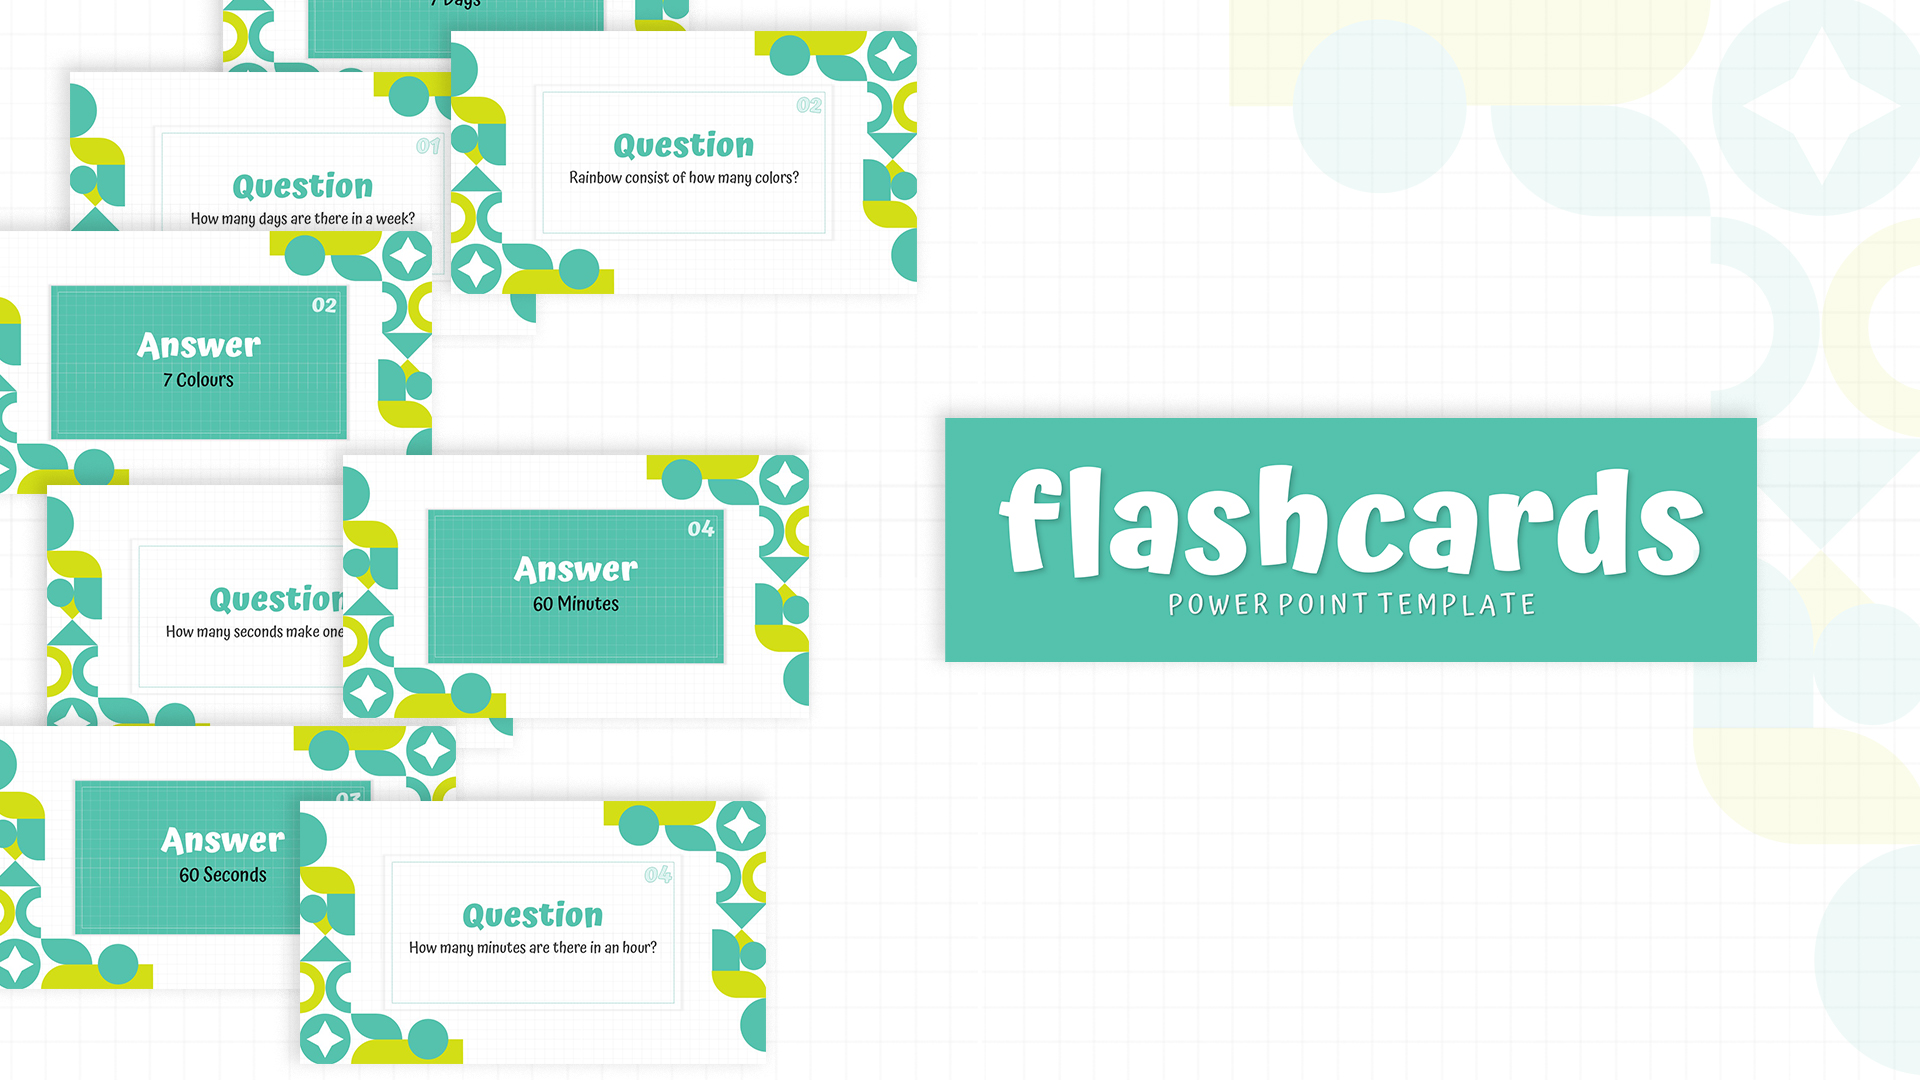
Free Interactive Flashcards Q&A Deck Template for PowerPoint & Google Slides
Free
Free
Free Interactive Notebook for PowerPoint & Google Slides
Business
Free
Mind Map PowerPoint template for PowerPoint & Google Slides
Mind Maps
Editable Colombia Map PowerPoint Template for PowerPoint & Google Slides
Business Models
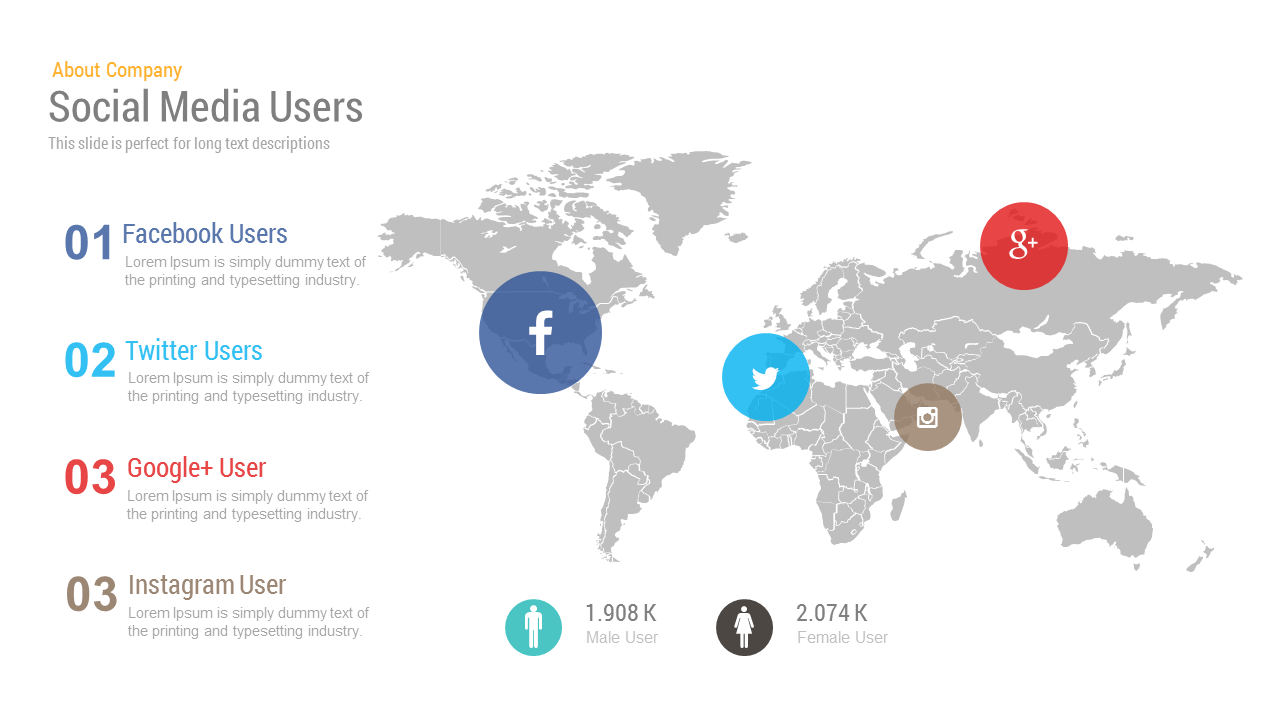
Free Social Media Users Map template for PowerPoint & Google Slides
World Maps
Free
World Map Data template for PowerPoint & Google Slides
World Maps
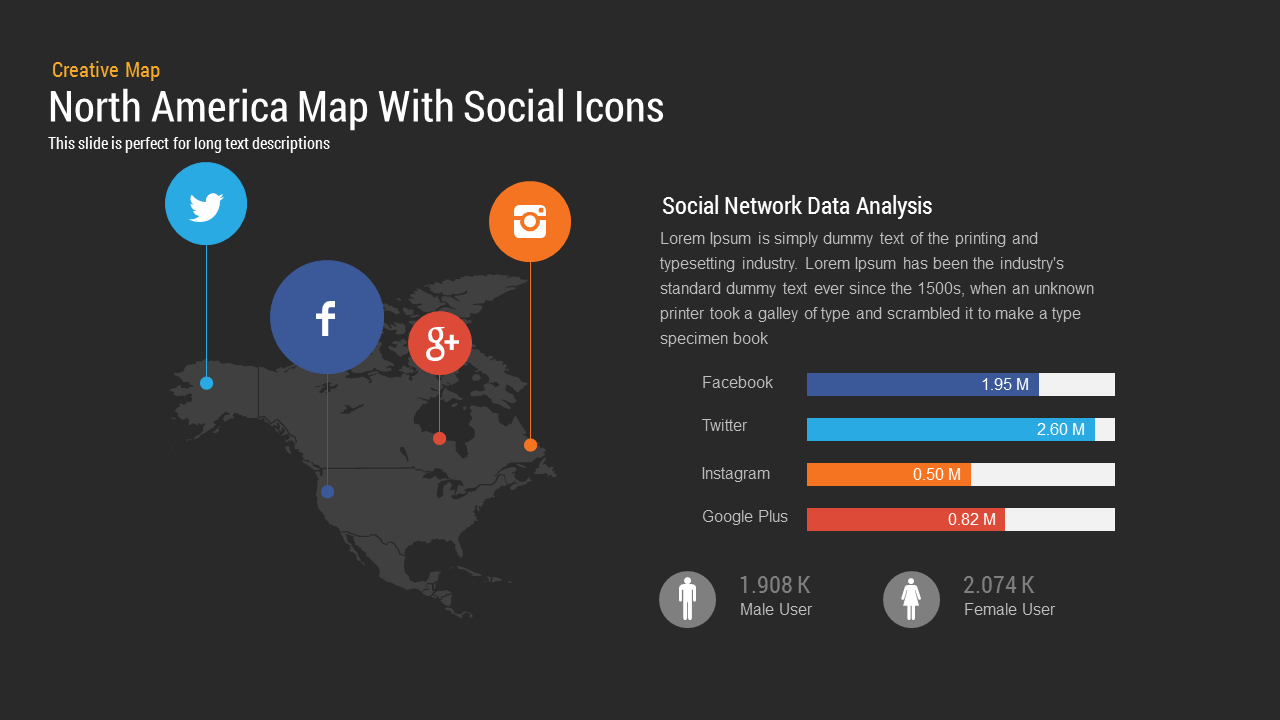
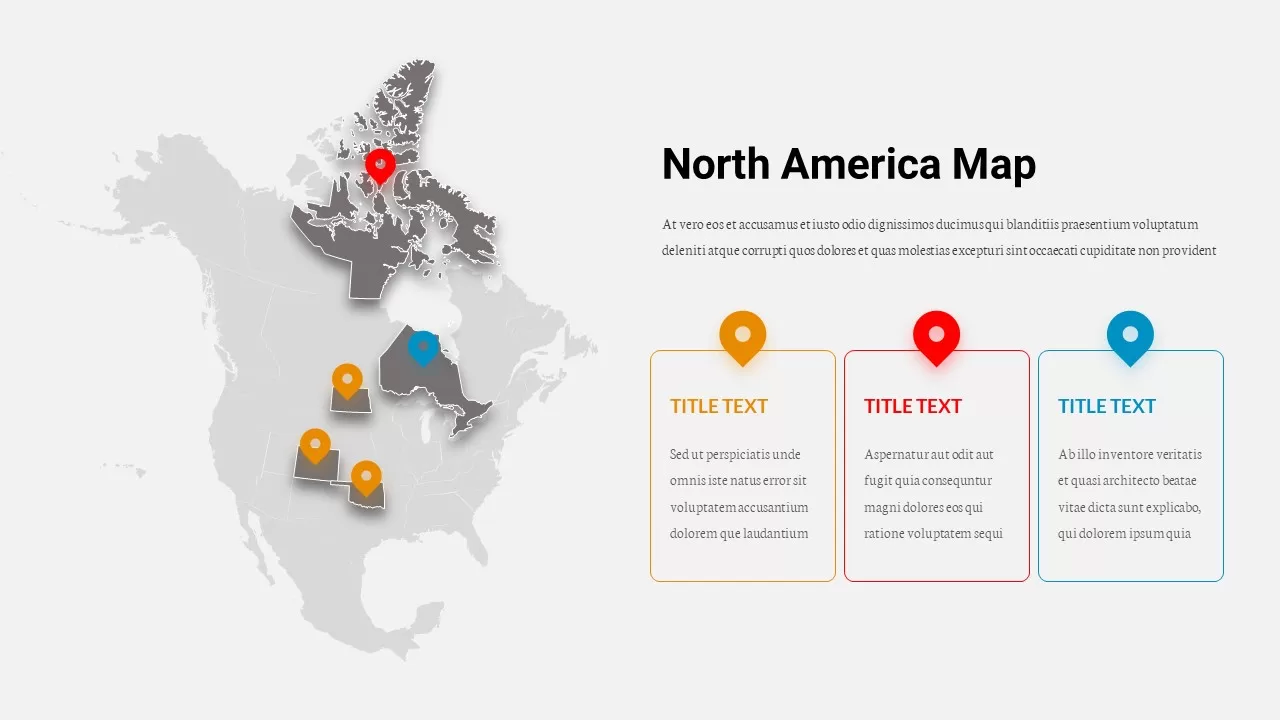
North America Map template for PowerPoint & Google Slides
World Maps
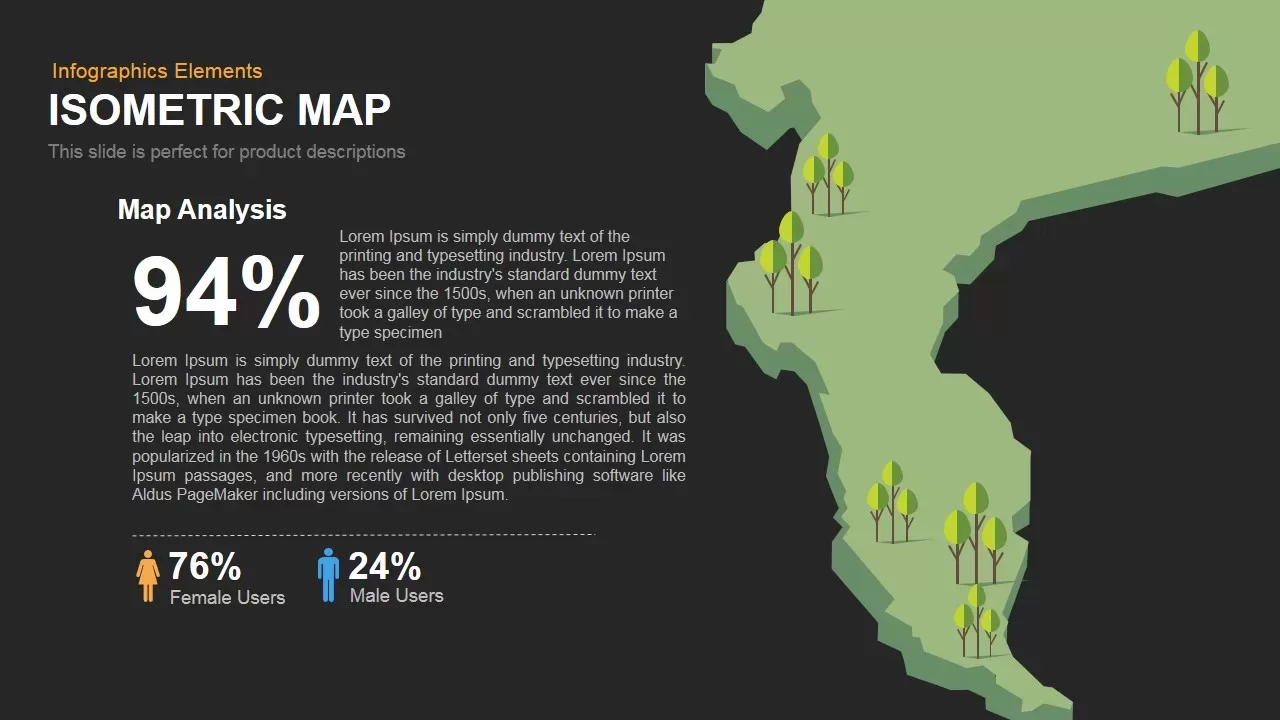
Isometric Map Analysis Slide Template for PowerPoint & Google Slides
World Maps
Risk Management Mind Map Radial Diagram template for PowerPoint & Google Slides
Mind Maps
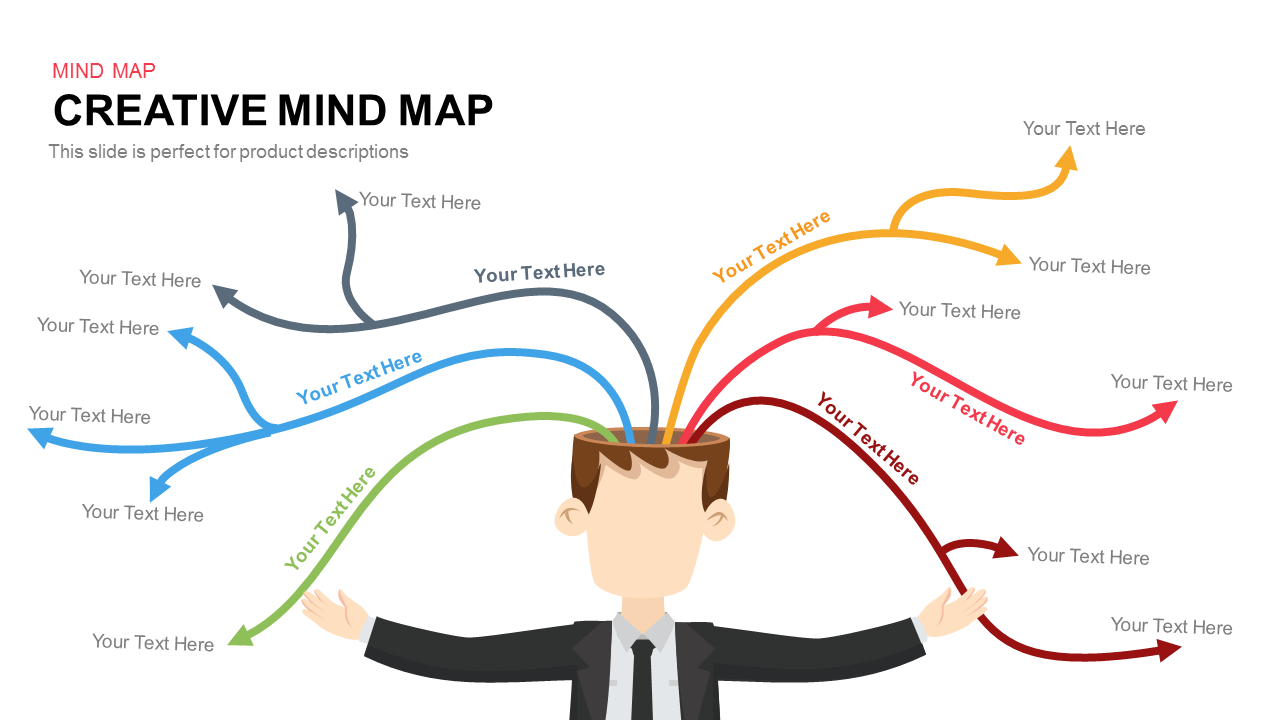
Colorful Creative Mind Map Diagram template for PowerPoint & Google Slides
Mind Maps
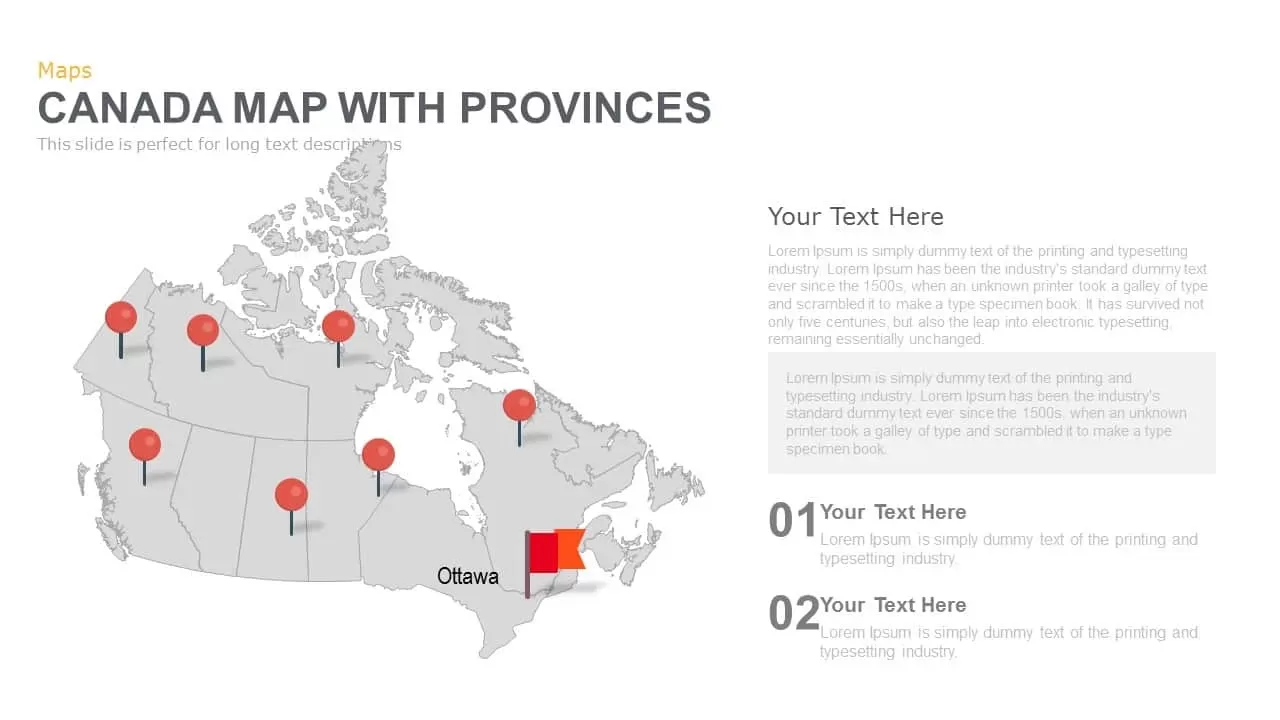
Canada Provinces Map Multi-Layout Template for PowerPoint & Google Slides
World Maps
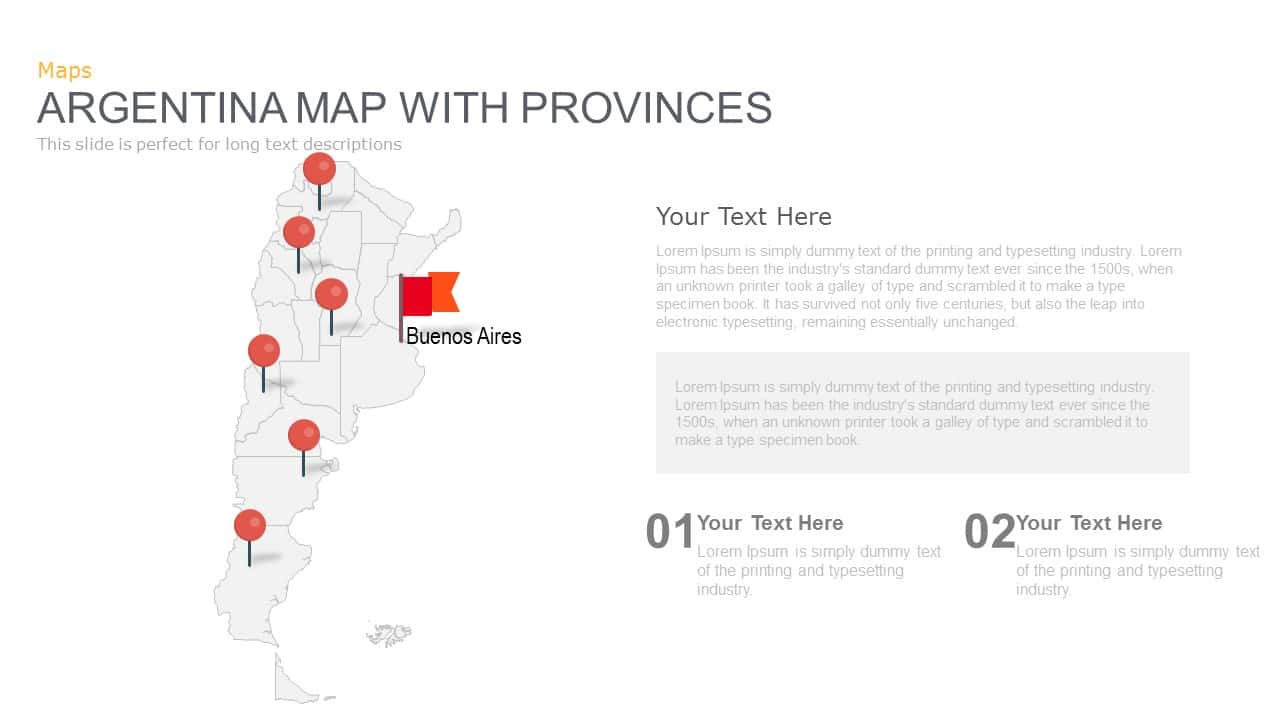
Argentina Province Map Markers Template for PowerPoint & Google Slides
World Maps
Curved Road Map Timeline Infographic Template for PowerPoint & Google Slides
Roadmap
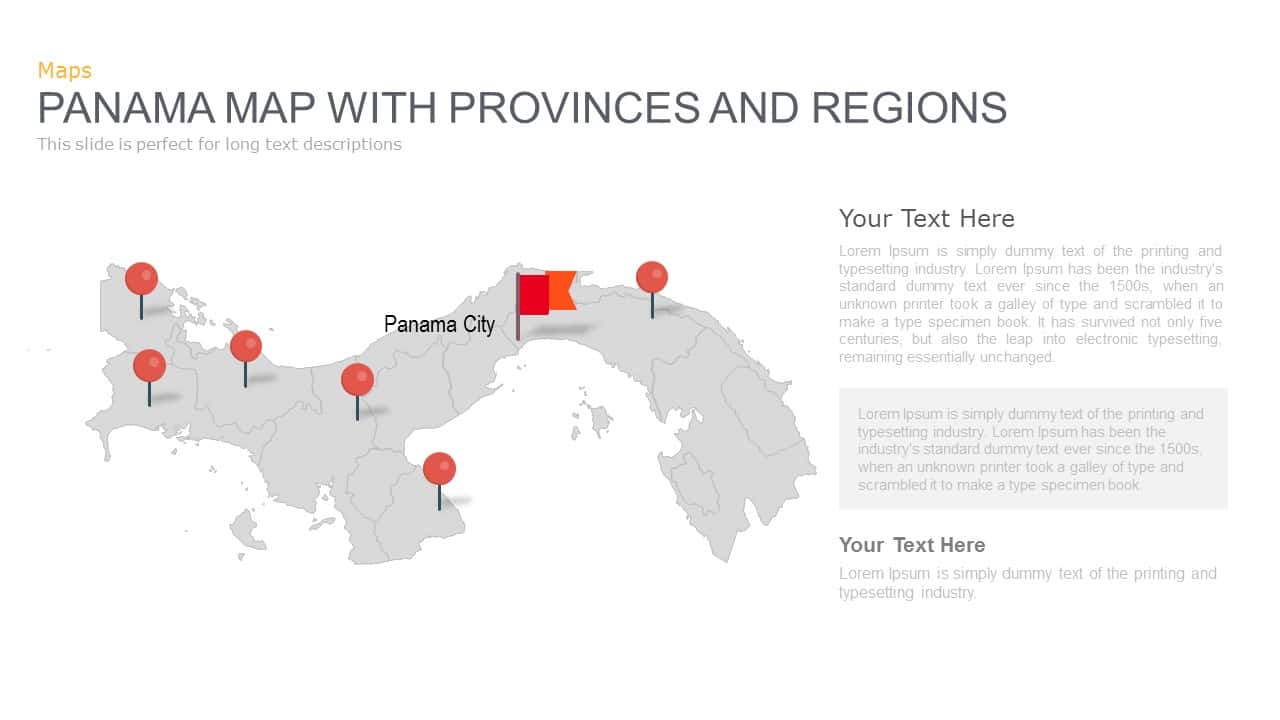
Panama Map with Region Markers Template for PowerPoint & Google Slides
World Maps
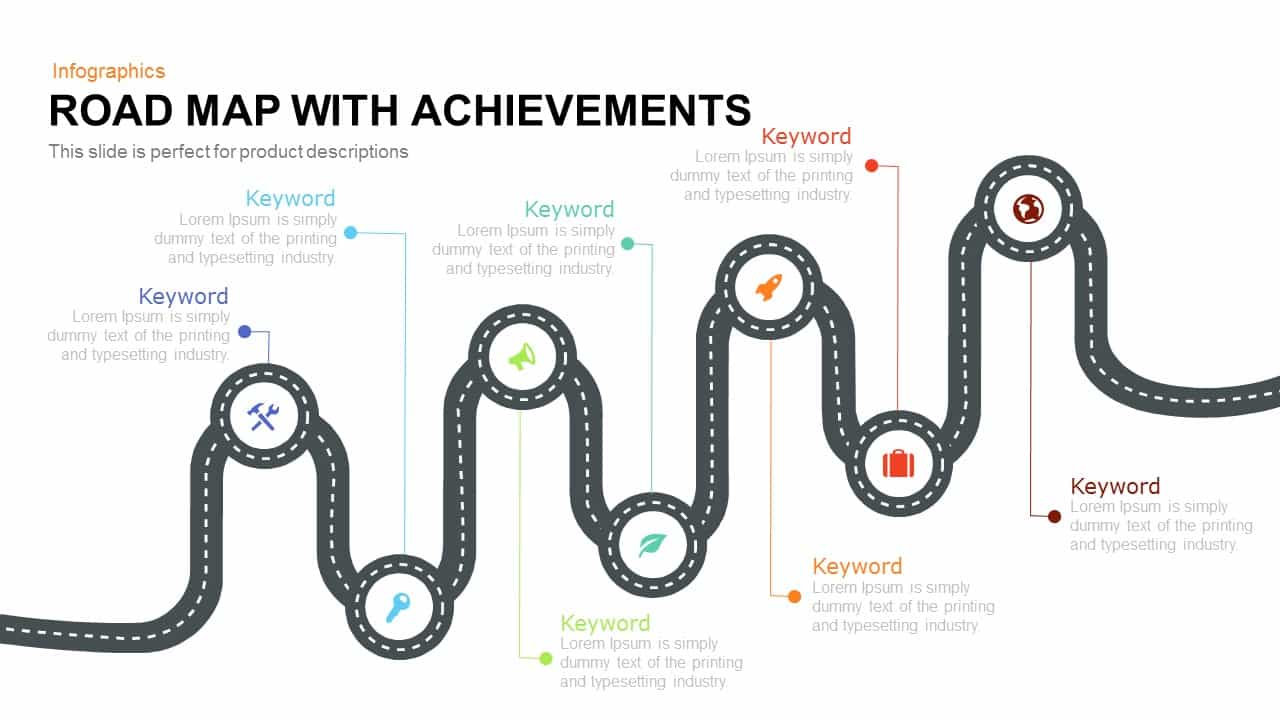
Road Map with Achievements Milestones Template for PowerPoint & Google Slides
Roadmap
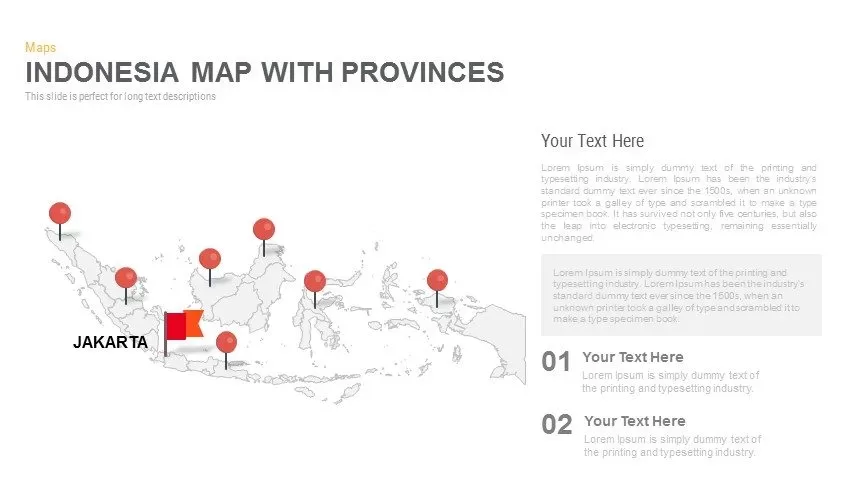
Indonesia Province Map Callout Slide Template for PowerPoint & Google Slides
Maps
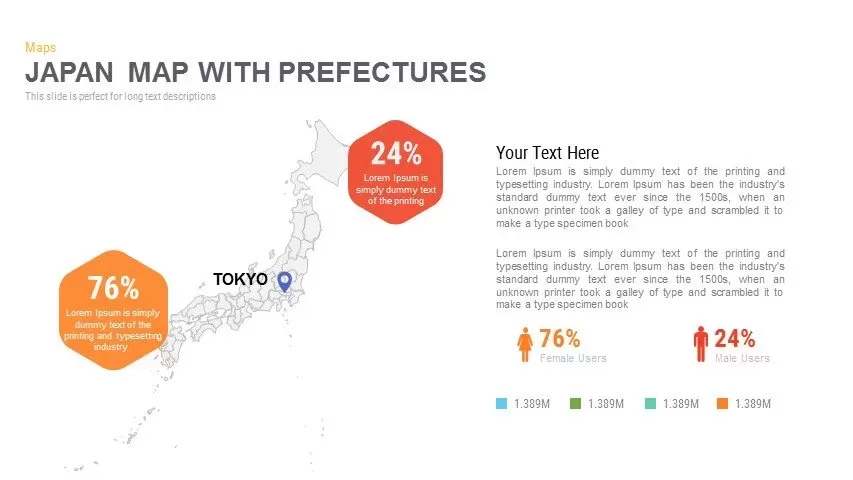
Japan Province Map Infographic Template for PowerPoint & Google Slides
Maps
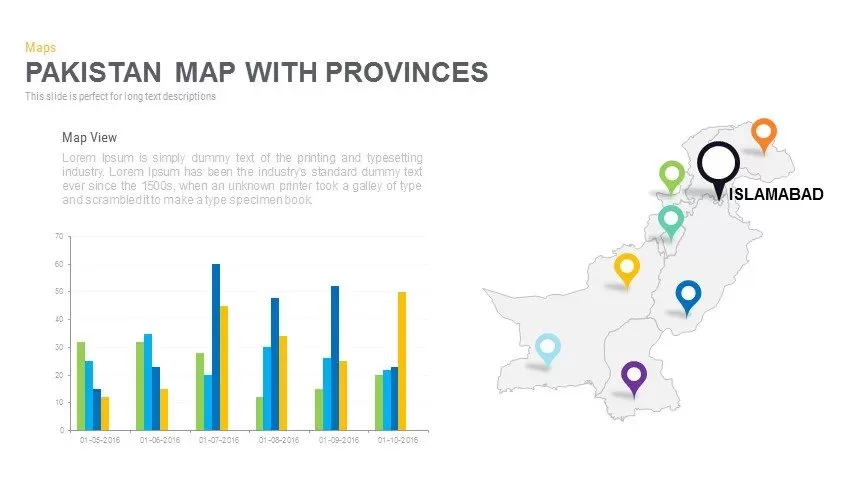
Pakistan Provinces Map Infographic Pack Template for PowerPoint & Google Slides
Maps
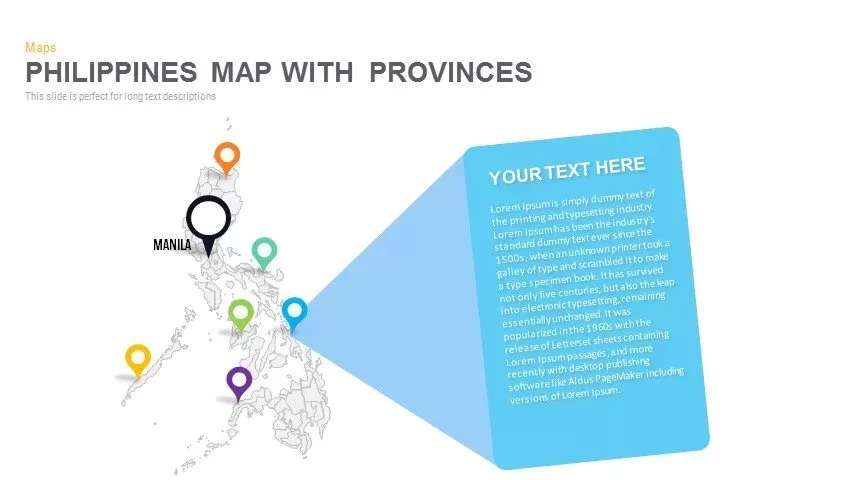
Philippines Map with Provinces Pack Template for PowerPoint & Google Slides
Maps
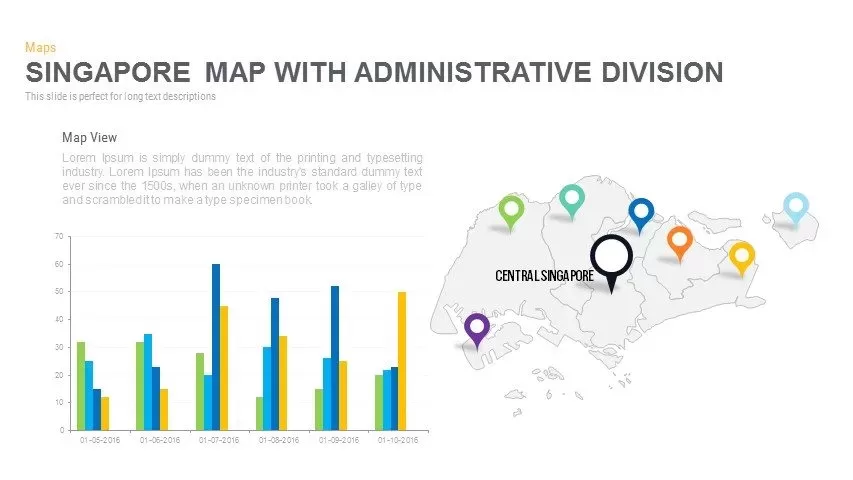
Singapore Map Pack Template for PowerPoint & Google Slides
Maps
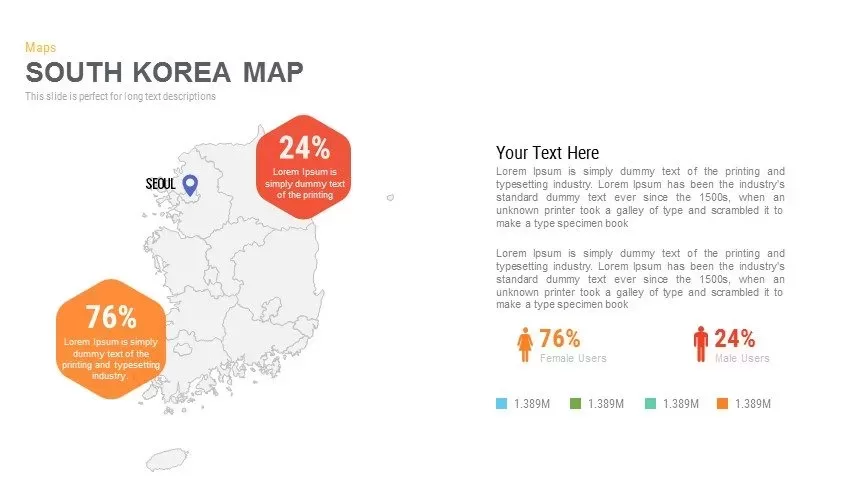
Infographic South Korea Map Template for PowerPoint & Google Slides
Maps
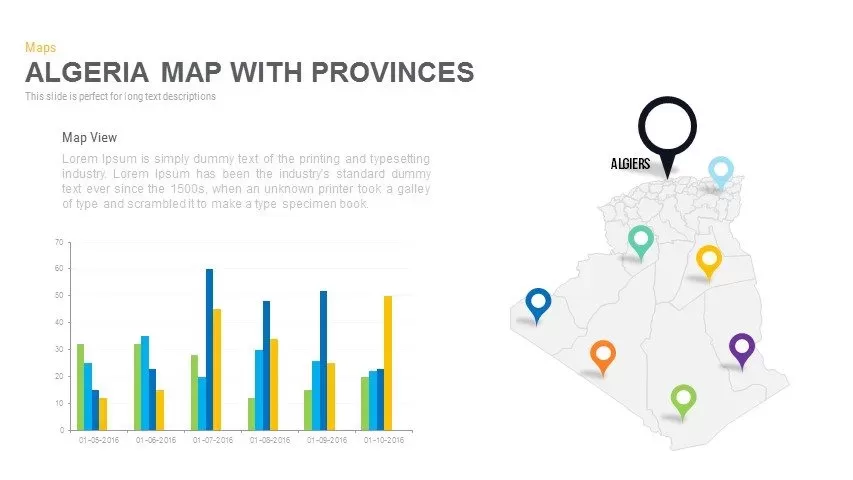
Algeria Map with Provinces Pack Template for PowerPoint & Google Slides
Maps
Angola Provinces Map Slide Pack Template for PowerPoint & Google Slides
World Maps
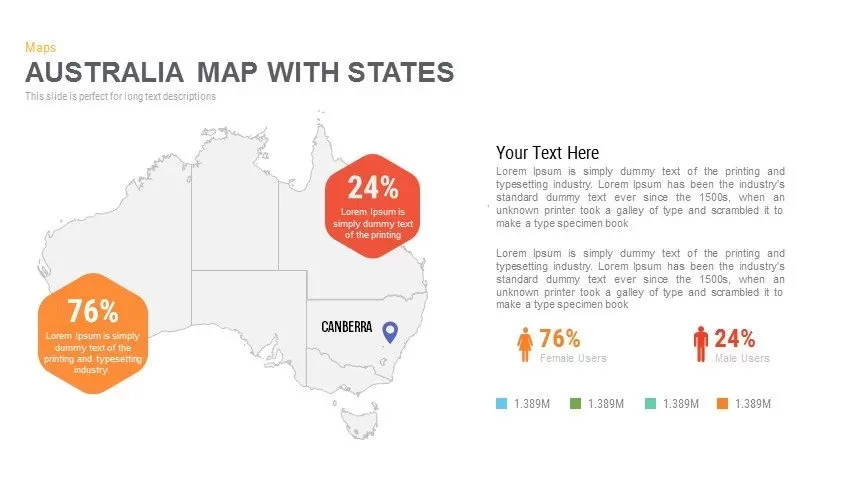
Australia Map with State Markers Template for PowerPoint & Google Slides
Maps
Angola Map with Provinces Slide Pack Template for PowerPoint & Google Slides
World Maps
Burkina Faso Map with Regions Slide Pack Template for PowerPoint & Google Slides
World Maps
Iran Map with Provinces Slide Pack Template for PowerPoint & Google Slides
World Maps
Zimbabwe Map with Provinces Slide Pack Template for PowerPoint & Google Slides
World Maps

Road Map Timeline Presentation template for PowerPoint & Google Slides
Roadmap
Risk Management Heat Map Diagram Template for PowerPoint & Google Slides
Comparison Chart
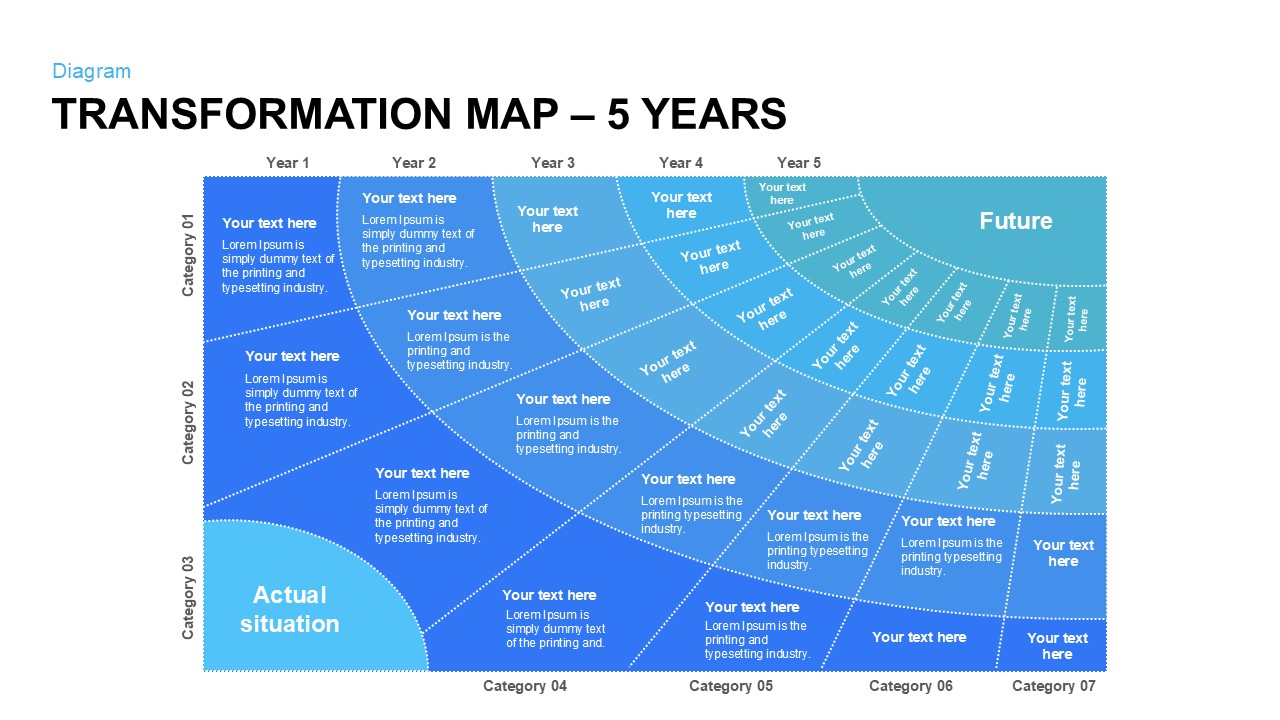
Five-Year Transformation Map Diagram Template for PowerPoint & Google Slides
Process
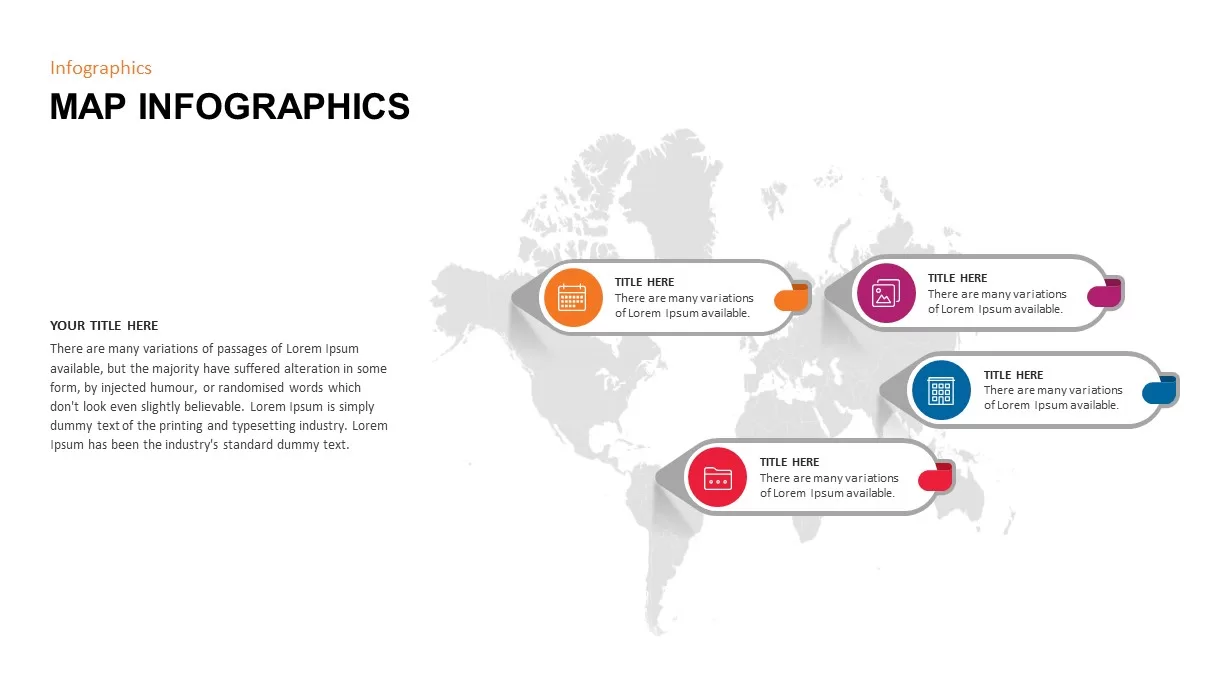
Modern World Map Callout Infographic Template for PowerPoint & Google Slides
World Maps
Eight-Node Mind Map Infographic Diagram Template for PowerPoint & Google Slides
Mind Maps
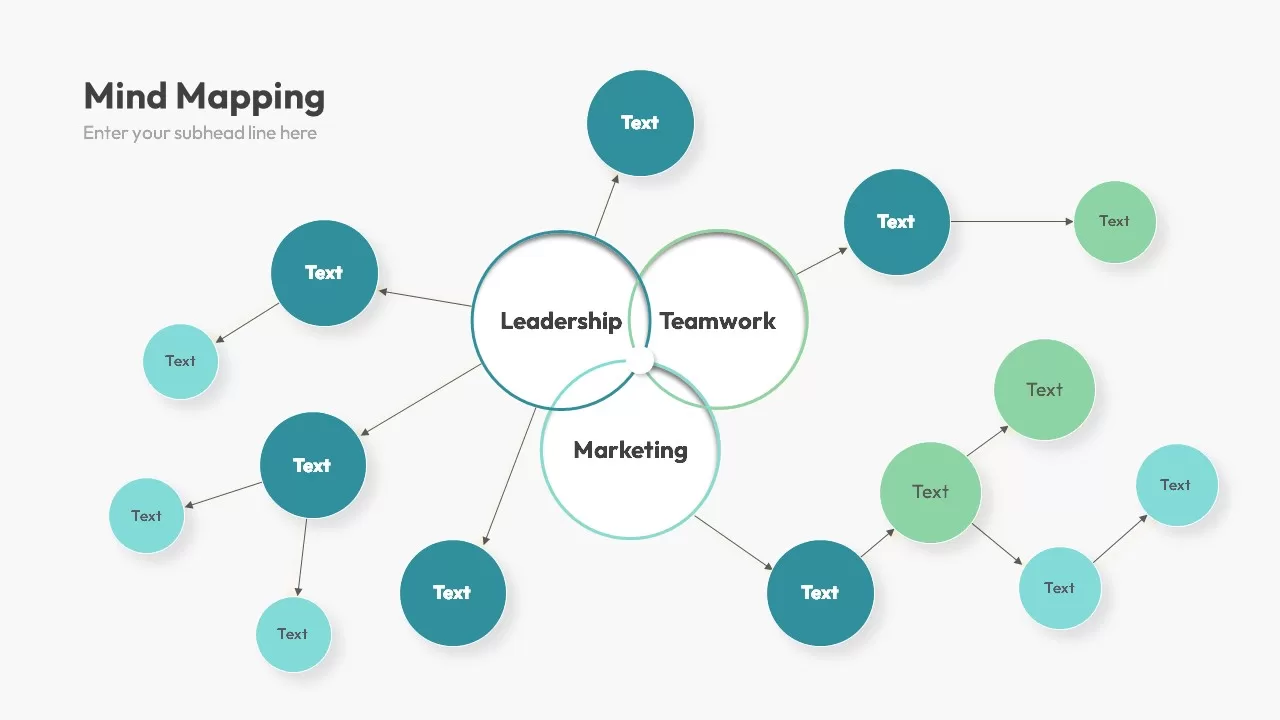
Tri-Cluster Mind Map Infographic Template for PowerPoint & Google Slides
Mind Maps
Mind Map Template for PowerPoint & Google Slides
Mind Maps
Colorful Mind Map Template for PowerPoint & Google Slides
Mind Maps
Colorful Mind Map Template for PowerPoint & Google Slides
Mind Maps
World Map Without Names Template for PowerPoint & Google Slides
World Maps
North America Percentage Map Infographic Template for PowerPoint & Google Slides
World Maps
North America Location Pin Map Overview Template for PowerPoint & Google Slides
World Maps
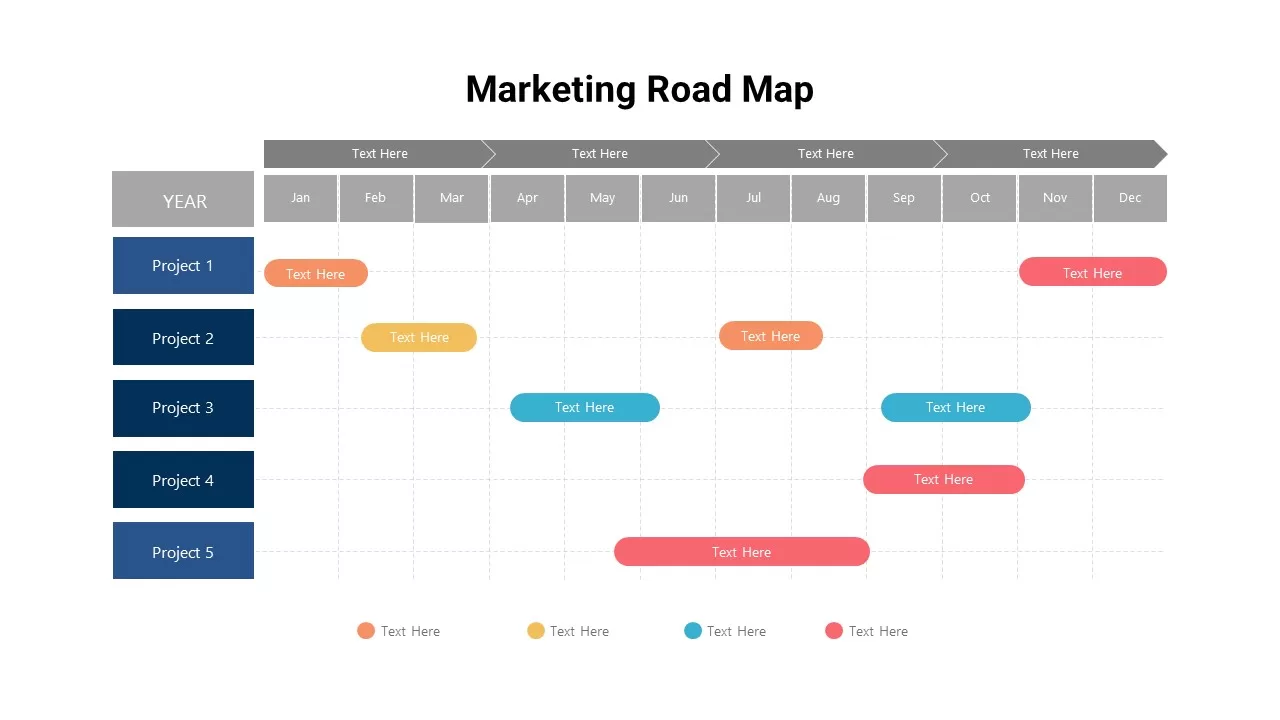
Marketing Projects Road Map Timeline Template for PowerPoint & Google Slides
Roadmap
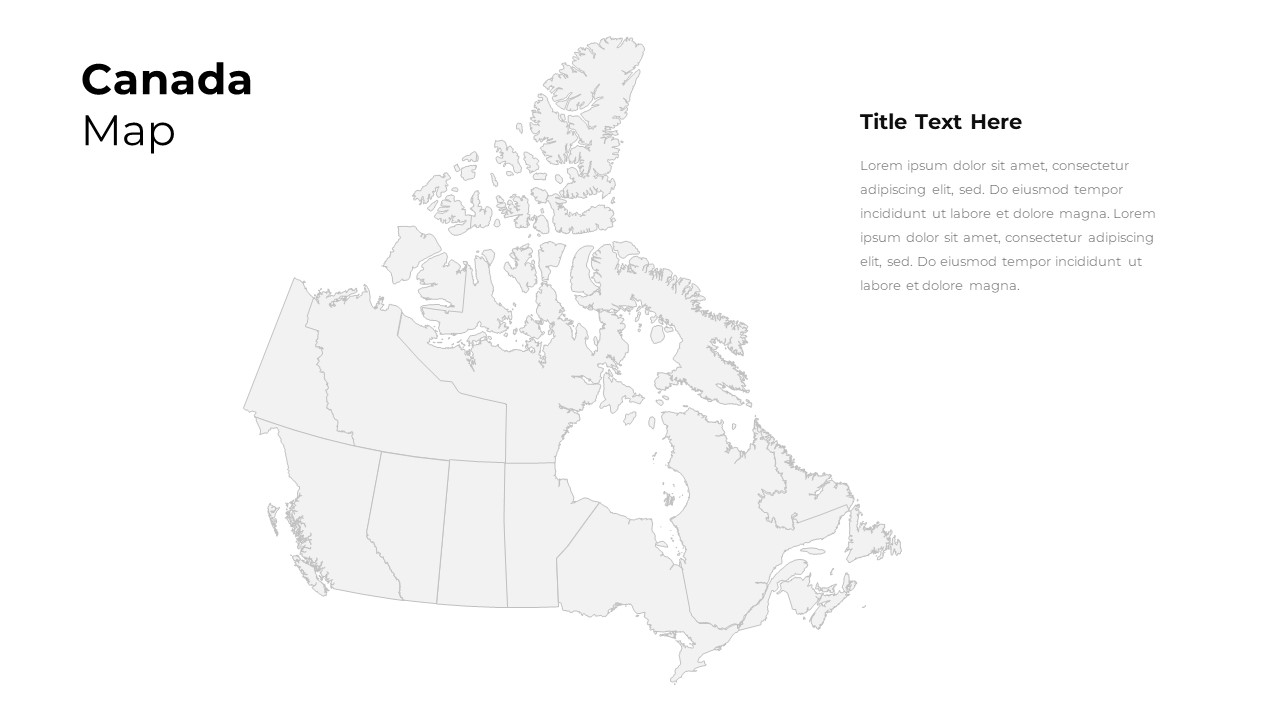
Customizable Canada Map Outline Template for PowerPoint & Google Slides
World Maps
North America Data Map Callouts Template for PowerPoint & Google Slides
World Maps
Heat Map Risk Assessment Presentation Template for PowerPoint & Google Slides
Risk Management
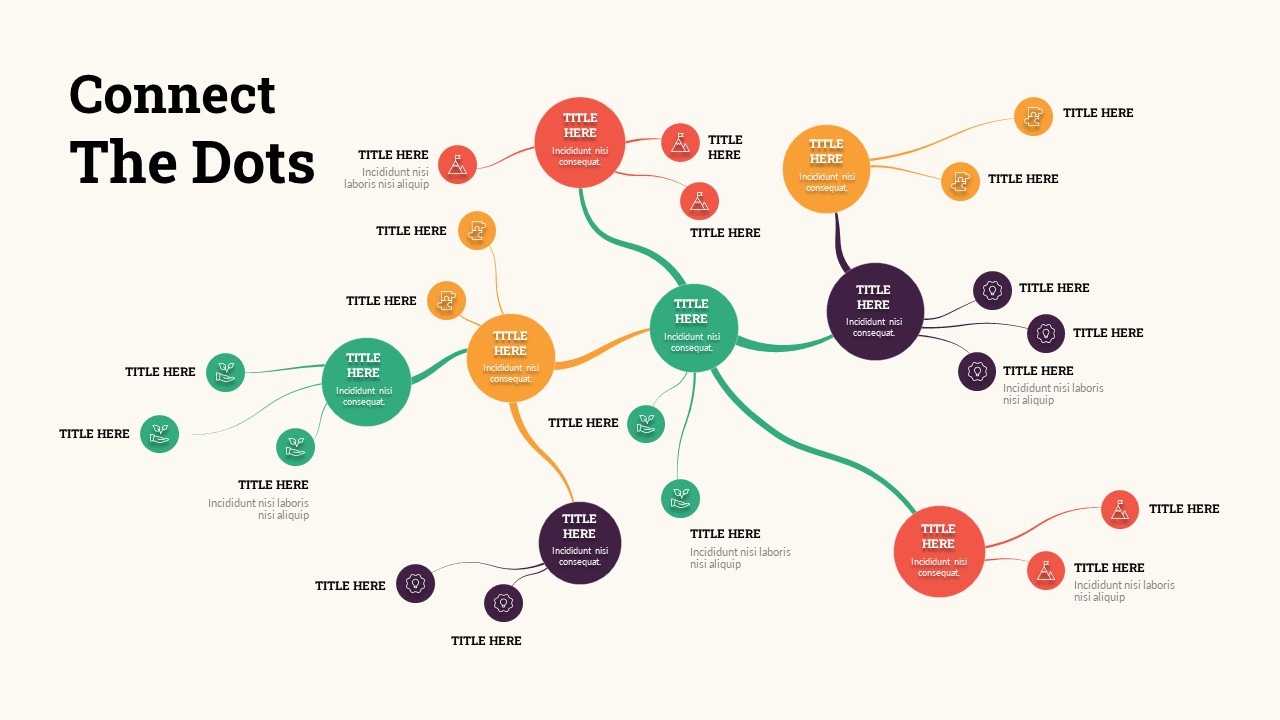
Connect the Dots Mind Map template for PowerPoint & Google Slides
Mind Maps
Connect the Dots Mind Map Diagram Template for PowerPoint & Google Slides
Mind Maps
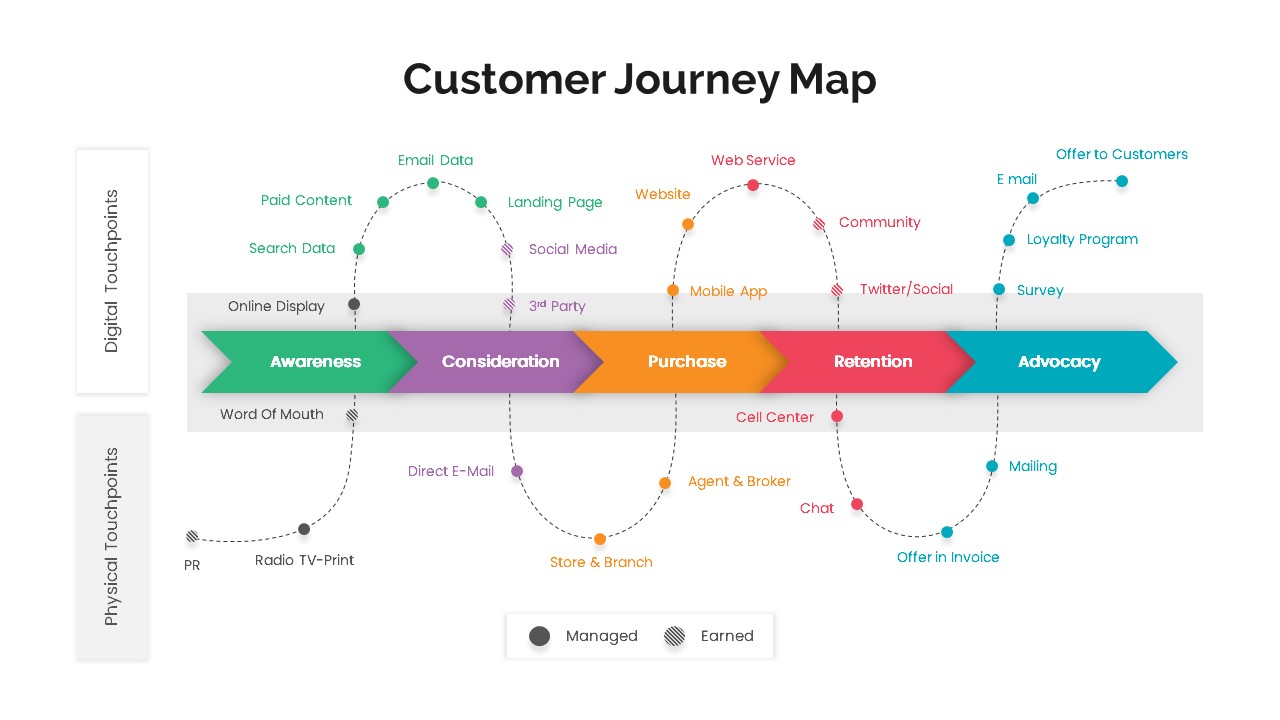
Versatile Customer Journey Map Template for PowerPoint & Google Slides
Customer Journey
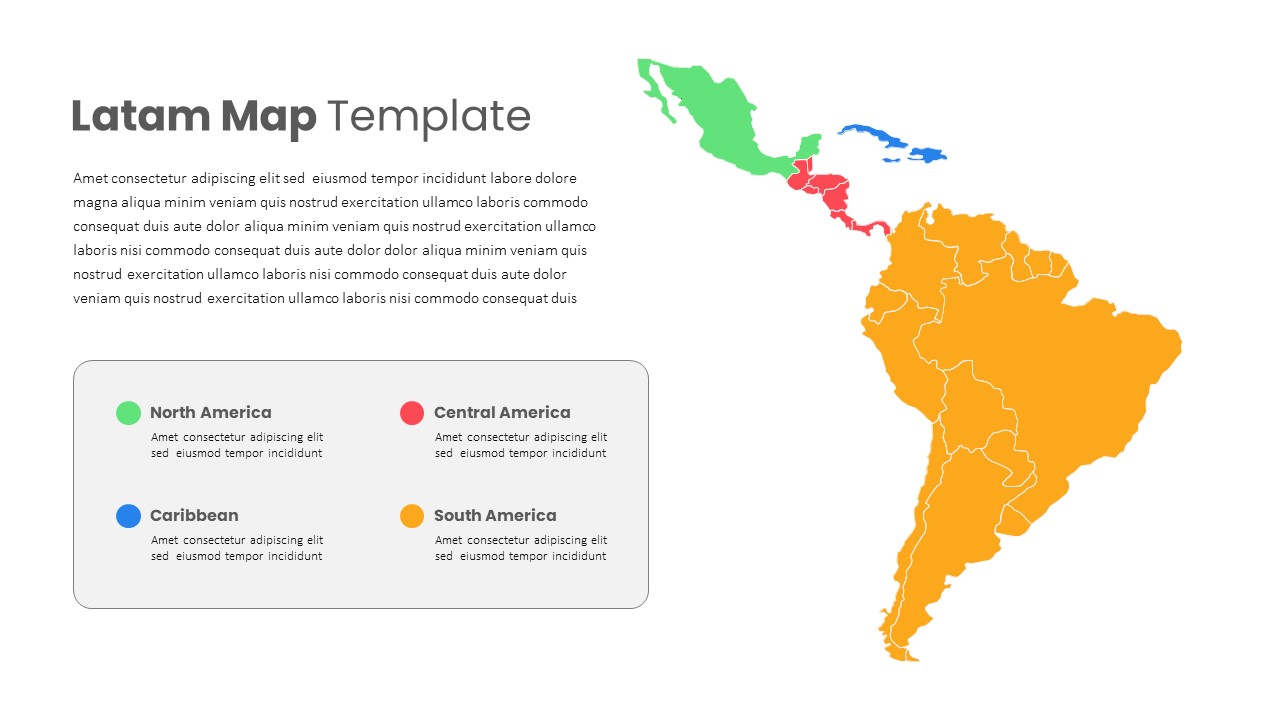
Latin America Regional Map Breakdown Template for PowerPoint & Google Slides
World Maps
Free Editable U.S. Map with Regional Metrics Template for PowerPoint & Google Slides
World Maps
Free
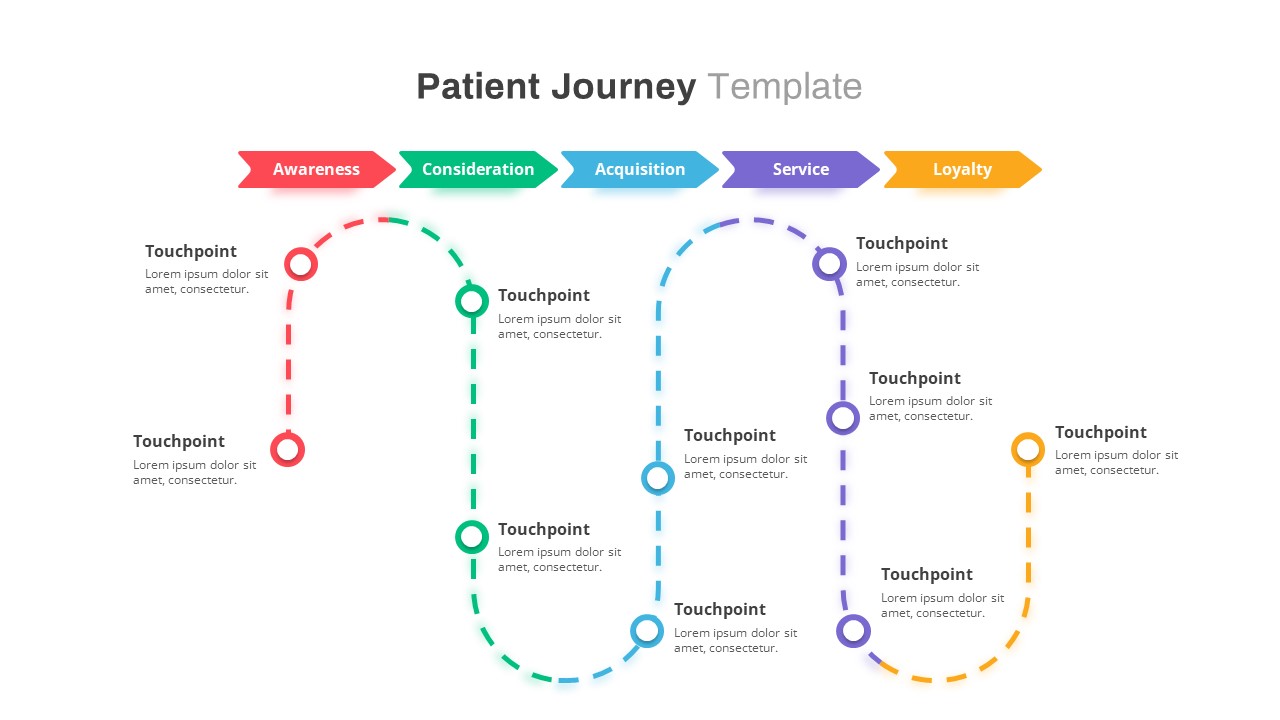
Healthcare Patient Journey Map Overview Template for PowerPoint & Google Slides
Health
Business Strategic Group Map Analysis Template for PowerPoint & Google Slides
Competitor Analysis
Free
UK Counties Map Data Visualization Template for PowerPoint & Google Slides
World Maps
Comprehensive Customer Journey Map Template for PowerPoint & Google Slides
Customer Journey
NAFTA Trading Block Map Infographic Template for PowerPoint & Google Slides
World Maps
Patterned Guyana Regional Map Template for PowerPoint & Google Slides
World Maps
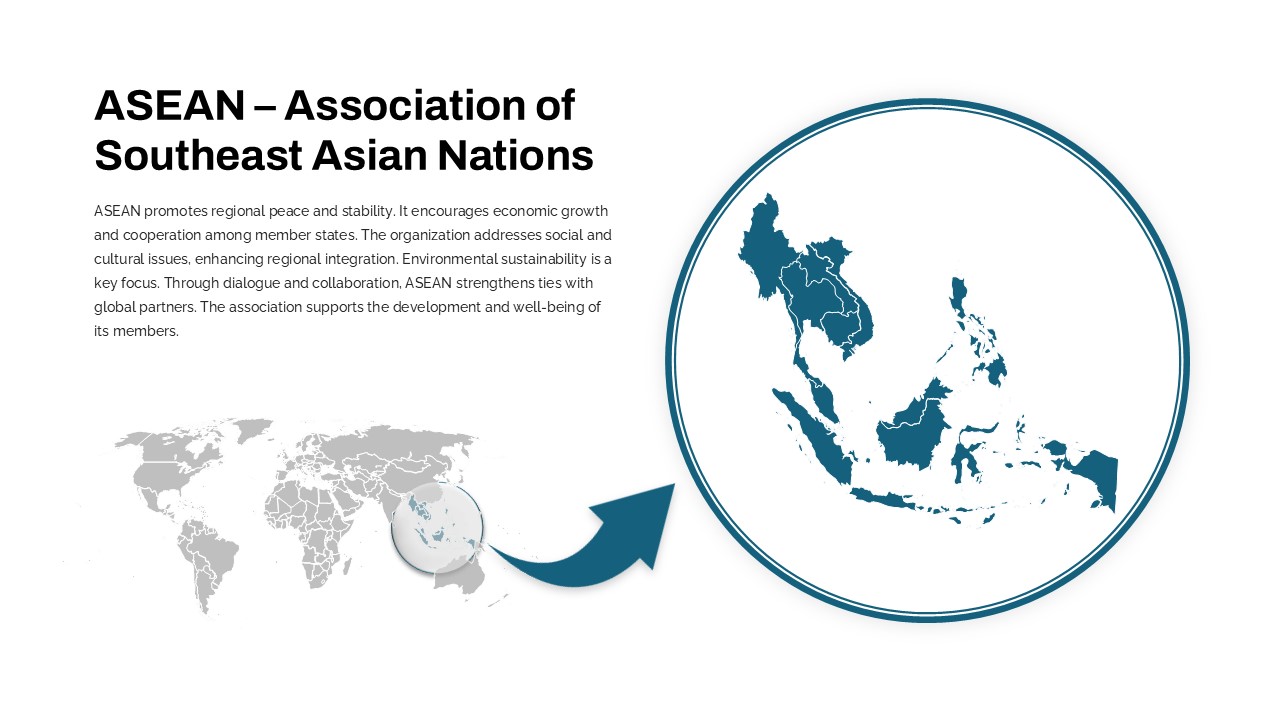
Professional ASEAN Region Zoom Map Slide Template for PowerPoint & Google Slides
World Maps
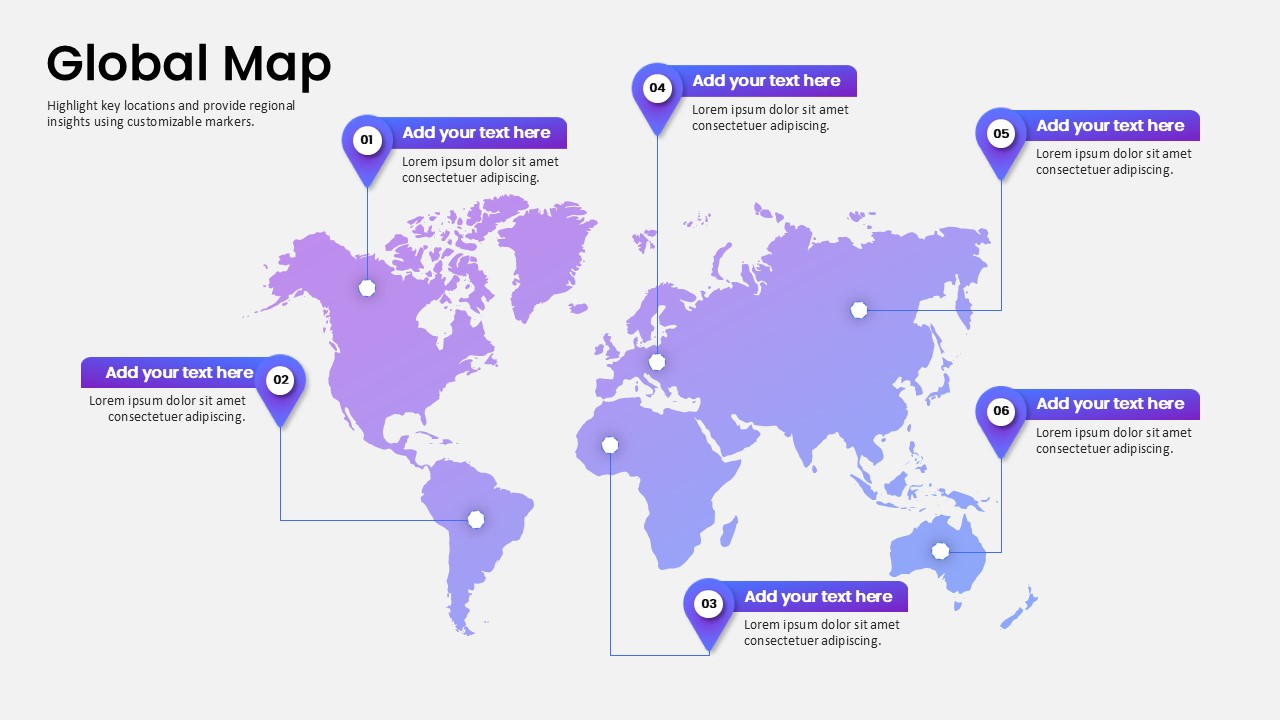
Global Map Highlighting Key Locations template for PowerPoint & Google Slides
World Maps
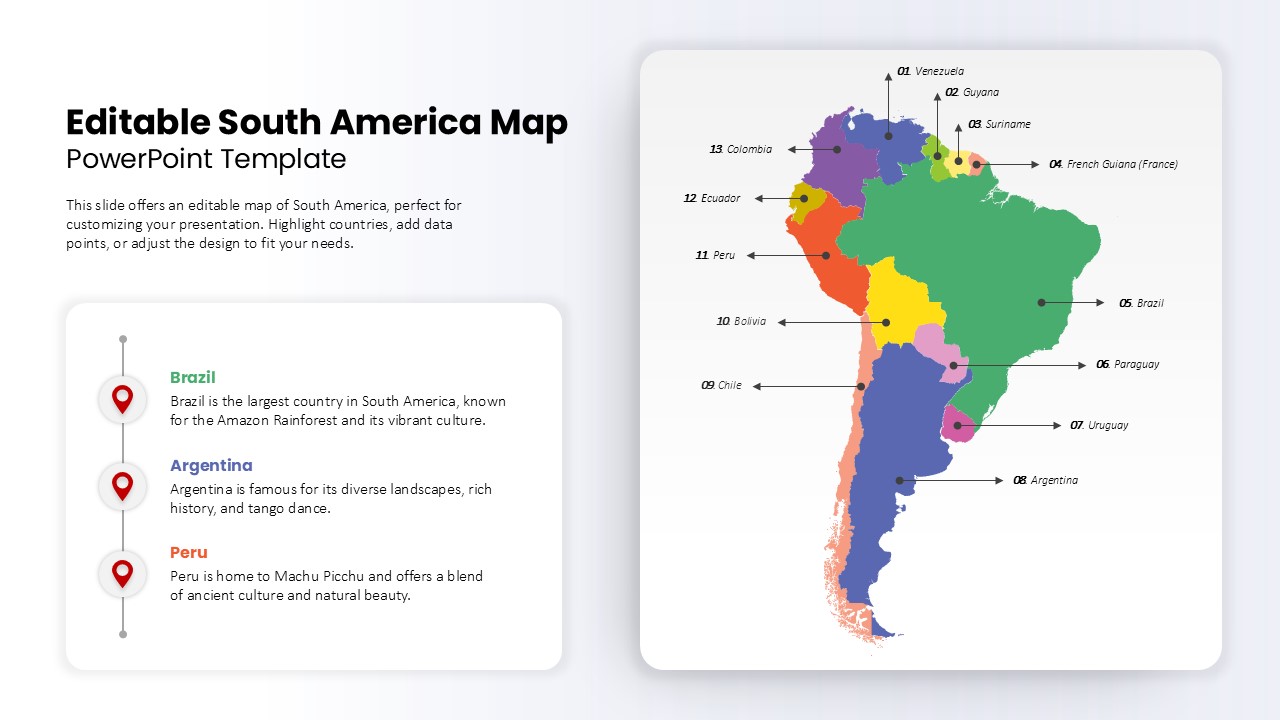
Editable South America Map Diagram Template for PowerPoint & Google Slides
Maps
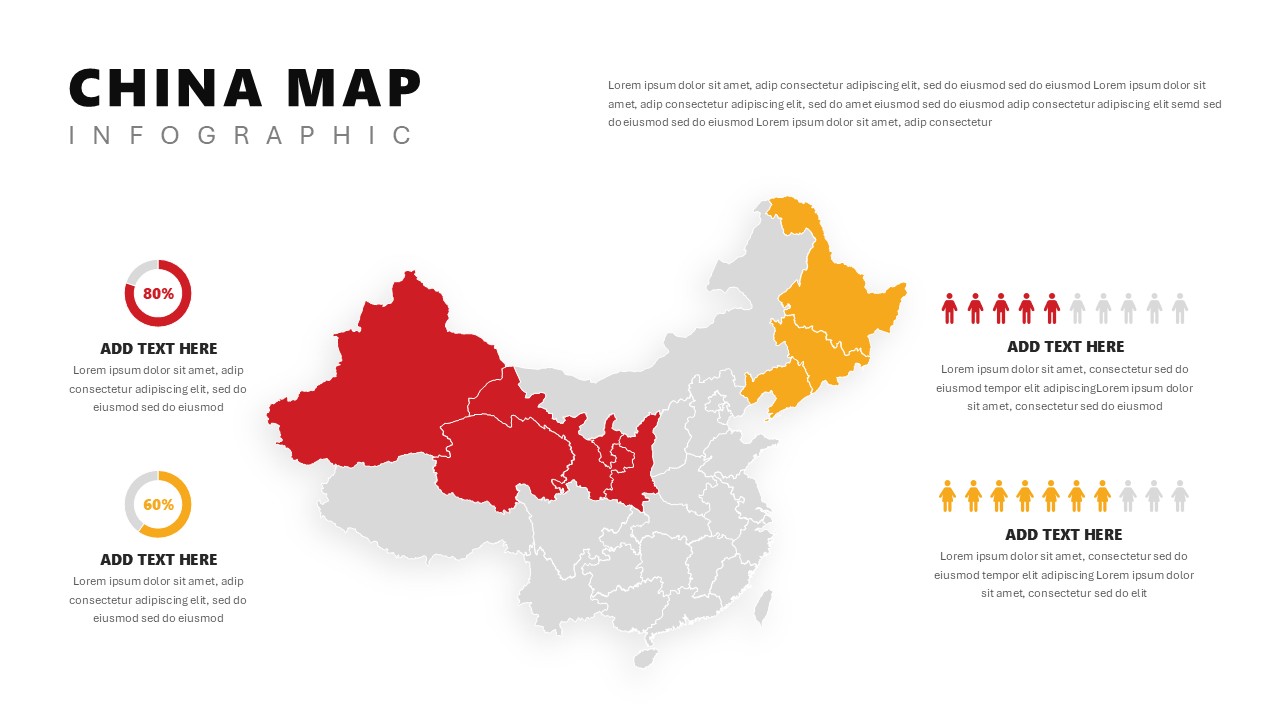
China Map Infographic Regional Stats Template for PowerPoint & Google Slides
World Maps
Hong Kong Geographic Map Infographic Template for PowerPoint & Google Slides
World Maps
Employee Journey Map with Stages template for PowerPoint & Google Slides
Recruitment
Global Map with Pinpoint Markers template for PowerPoint & Google Slides
Business
Creative Bubble Mind Map Template for PowerPoint & Google Slides
Mind Maps