Northeastern United States Regional Map for PowerPoint & Google Slides


Description
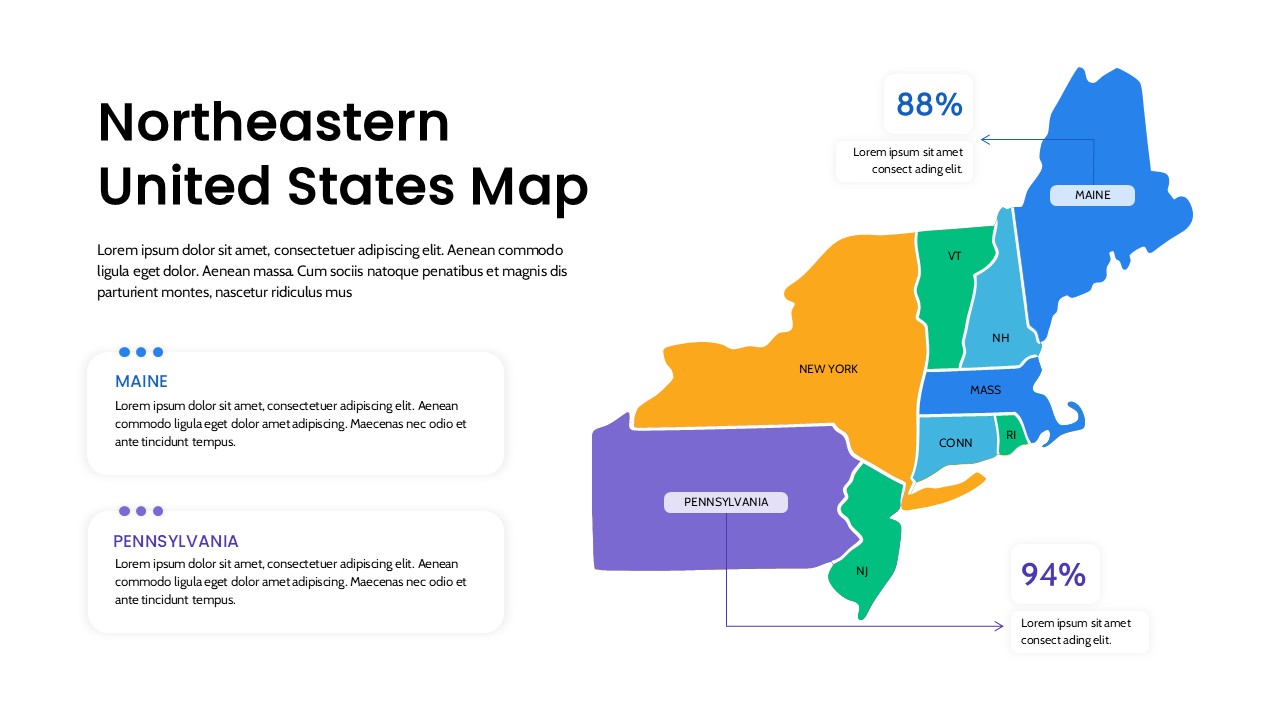
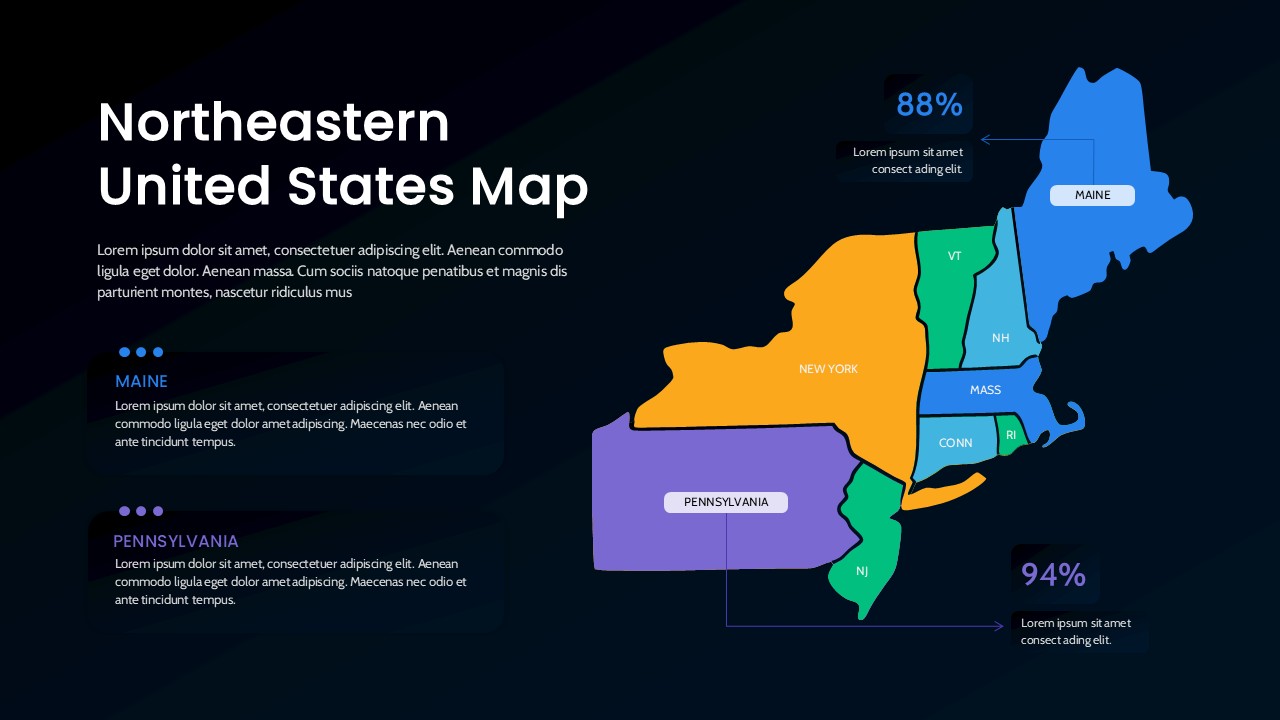
Present geographic insights with clarity using this visually engaging Northeastern United States map slide designed for professional presentations. The template highlights key states in the Northeast region, including Maine, New York, Pennsylvania, New Jersey, Massachusetts, Connecticut, Rhode Island, Vermont, and New Hampshire, each differentiated with bold, high-contrast colors. Clean state boundaries, clear labels, and smooth shapes ensure immediate recognition and easy comparison across regions. Callout boxes and percentage indicators allow you to showcase metrics, statistics, or performance highlights tied to specific states, making the slide ideal for data-driven storytelling.
The balanced layout pairs a detailed regional map on the right with explanatory text panels on the left, enabling presenters to combine qualitative insights with quantitative data. Rounded cards, subtle shadows, and modern typography create a polished aesthetic suitable for corporate, government, or academic use. All elements—including colors, labels, connectors, and text placeholders—are fully editable, allowing you to adapt the slide for sales territories, market penetration analysis, or demographic reporting. Optimized for both PowerPoint and Google Slides, the map retains visual integrity across devices and screen sizes.
Who is it for
This template is ideal for business analysts, marketers, consultants, educators, and policymakers who need to present regional data or insights focused on the Northeastern United States. Sales teams and strategists can also use it for territory planning and performance reviews.
Other Uses
Beyond regional analysis, reuse this slide for logistics planning, population studies, educational geography lessons, or operational coverage maps. It also works well for presentations on compliance, distribution networks, or regional growth strategies.
Login to download this file

Item ID
SB05621Designed By
Naseeba
Related Templates

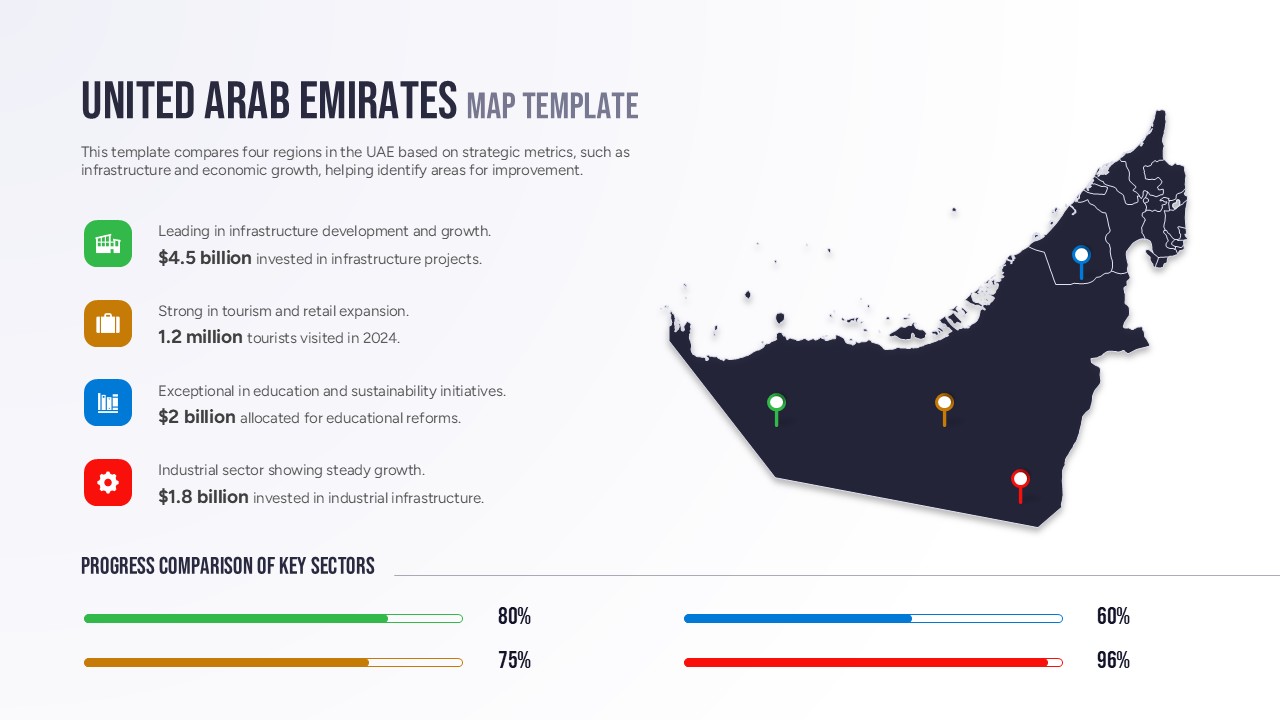
Free United Arab Emirates Regional Map for PowerPoint & Google Slides
World Maps
Free
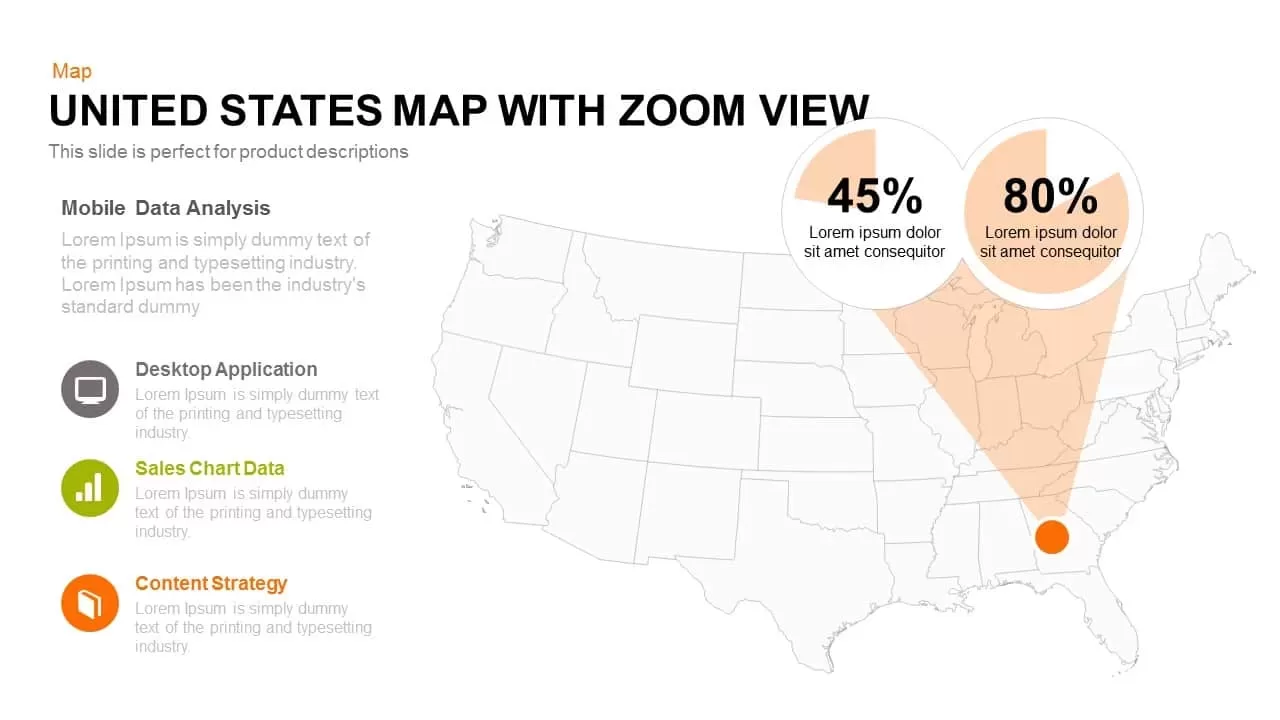
United States Map with Zoom View template for PowerPoint & Google Slides
World Maps
United States Flag Illustration Template for PowerPoint & Google Slides
World Maps

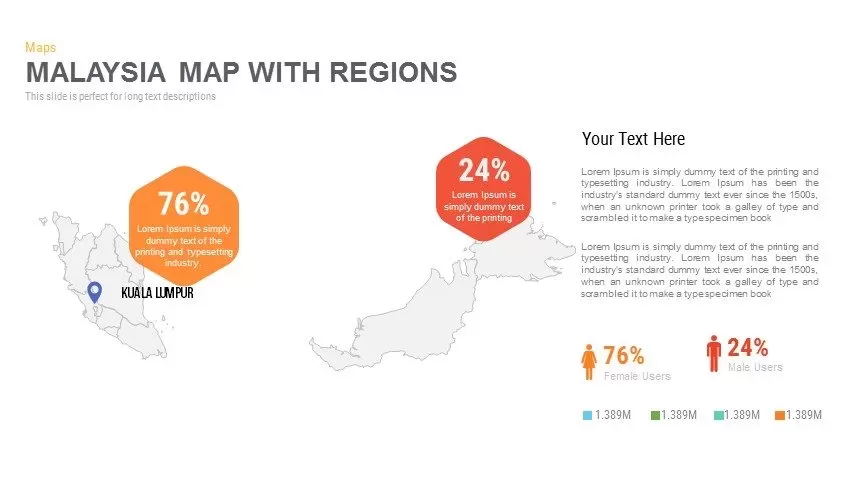
Malaysia Regional Map Infographic Template for PowerPoint & Google Slides
Maps
Egypt Regional Map Slide Pack Template for PowerPoint & Google Slides
World Maps
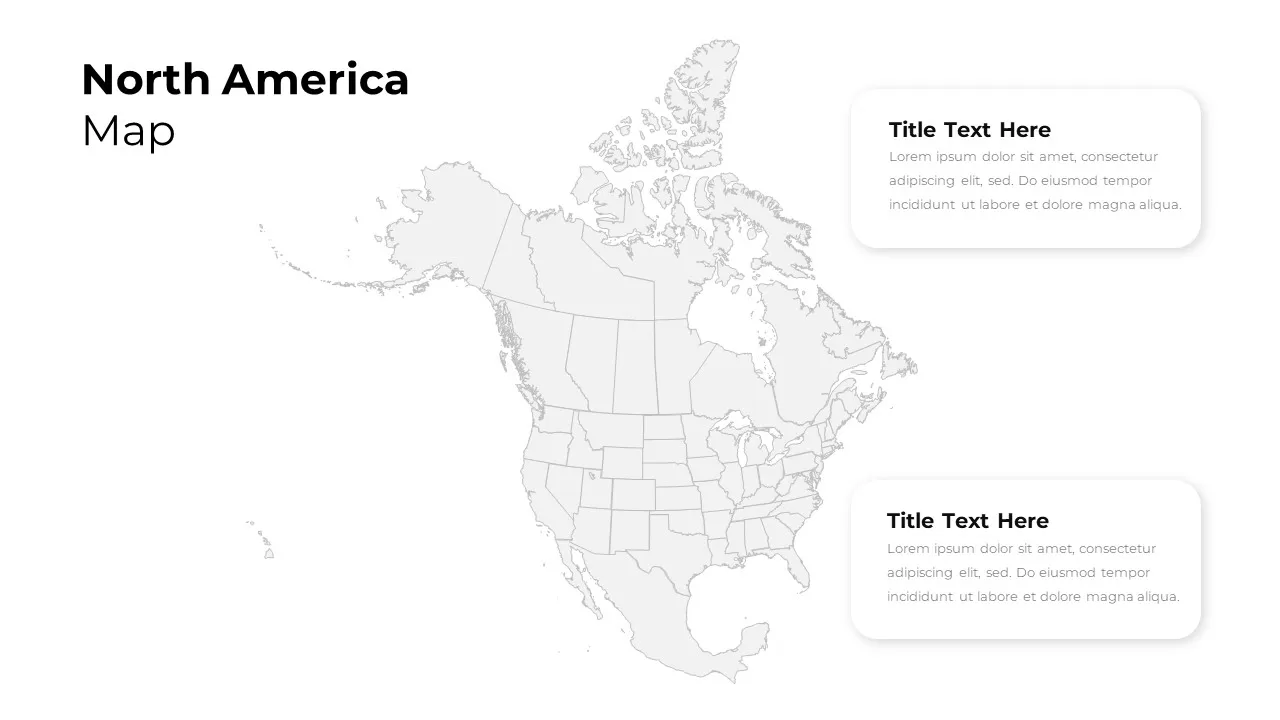
North America Regional Map Overview Template for PowerPoint & Google Slides
World Maps
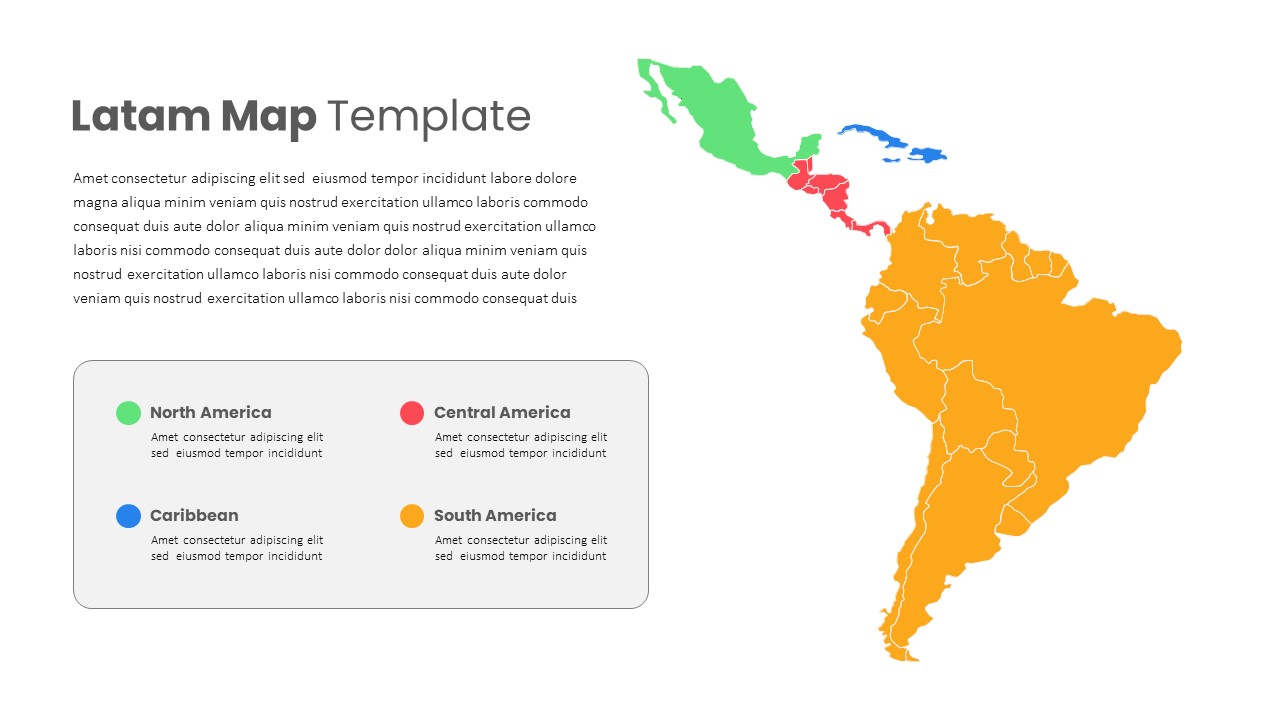
Latin America Regional Map Breakdown Template for PowerPoint & Google Slides
World Maps
Free Editable U.S. Map with Regional Metrics Template for PowerPoint & Google Slides
World Maps
Free
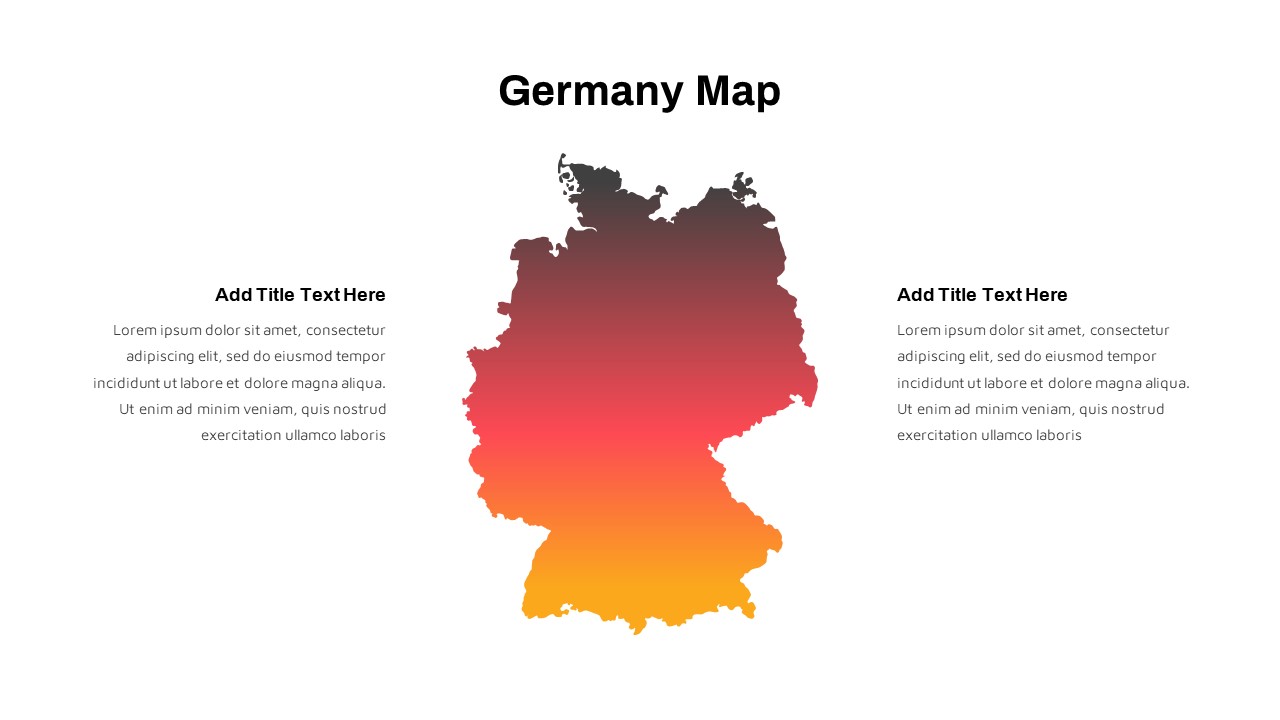
Germany Map with Regional Callouts Template for PowerPoint & Google Slides
World Maps
Syria Regional Data Map Infographic Template for PowerPoint & Google Slides
World Maps
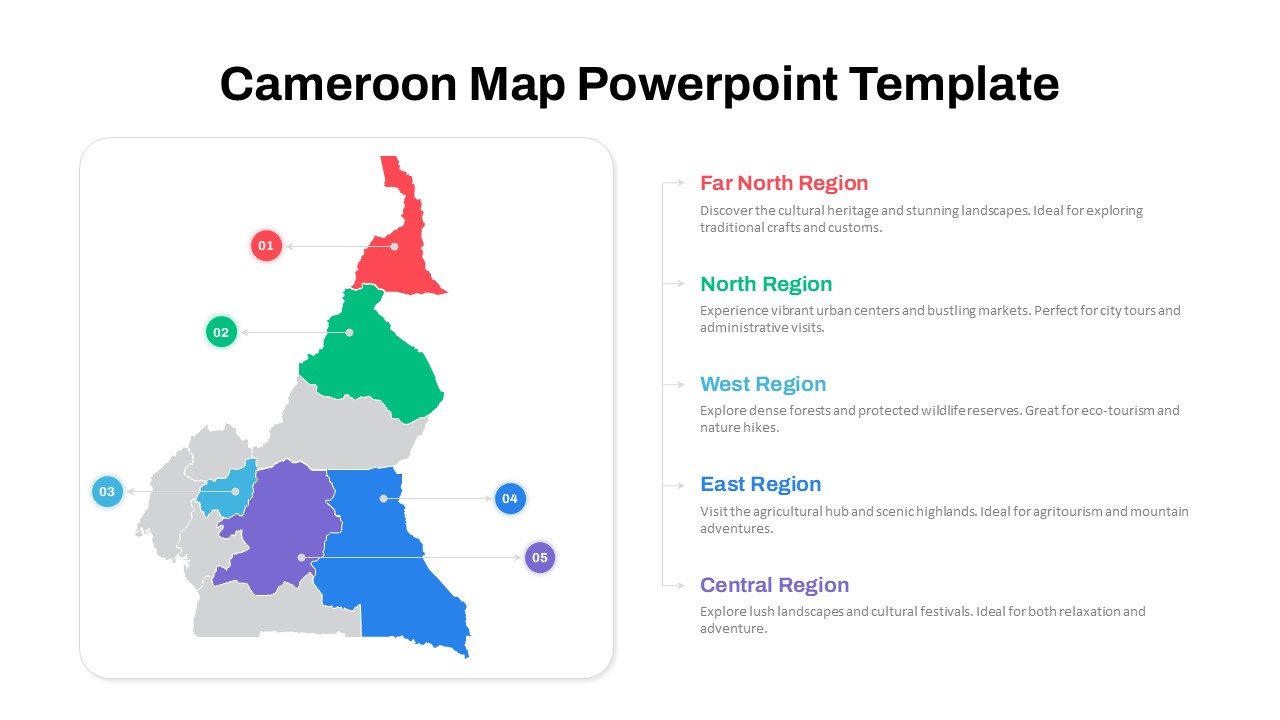
Numbered Cameroon Regional Map Slide Template for PowerPoint & Google Slides
World Maps
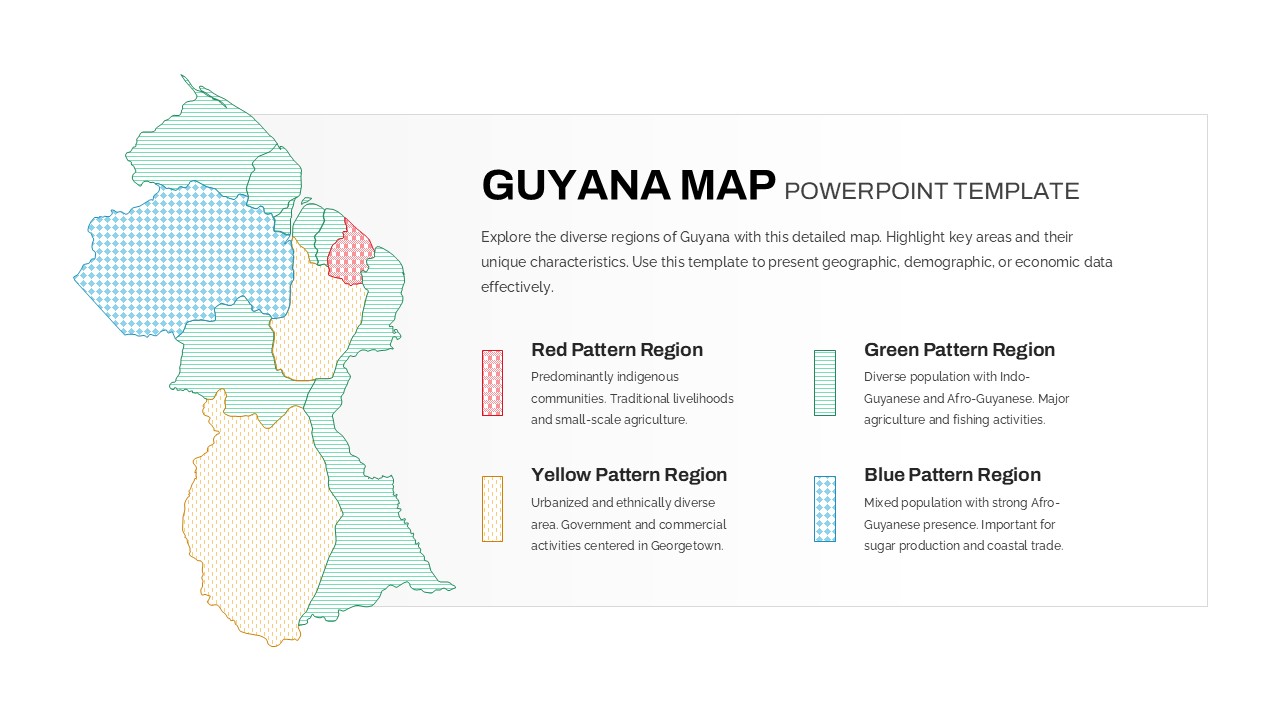
Patterned Guyana Regional Map Template for PowerPoint & Google Slides
World Maps
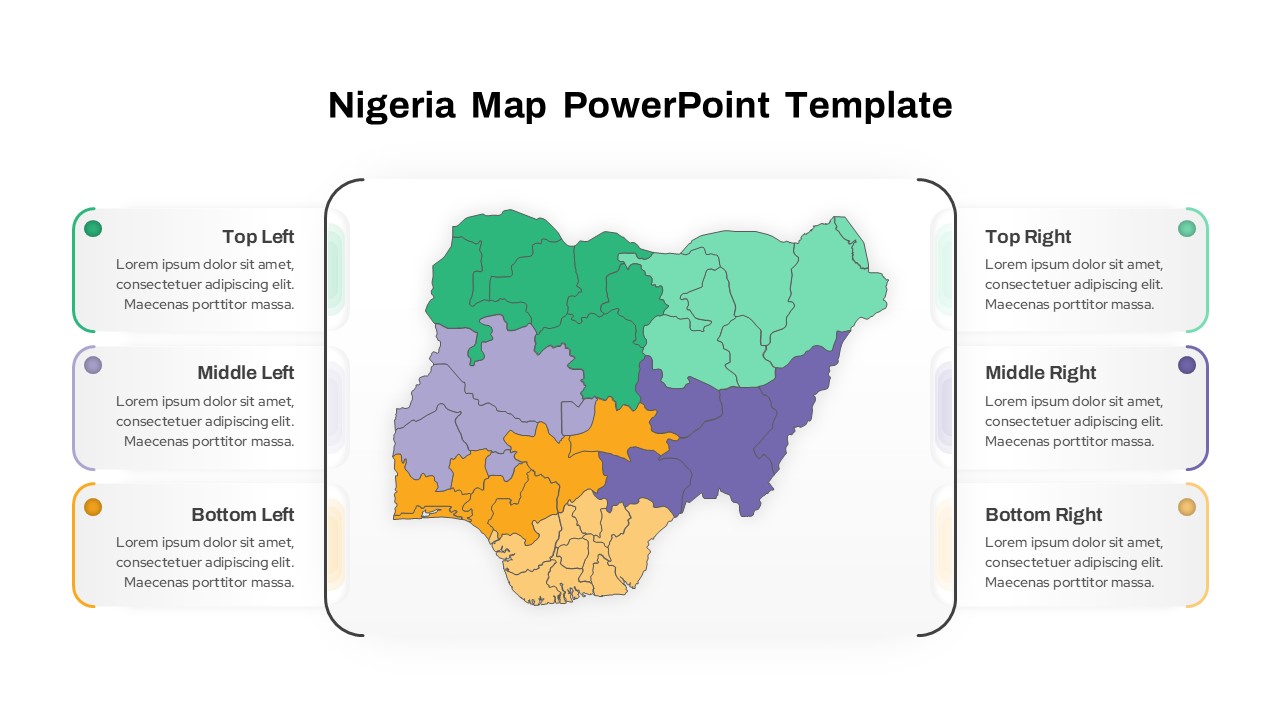
Nigeria Regional Callout Map Diagram Template for PowerPoint & Google Slides
Maps
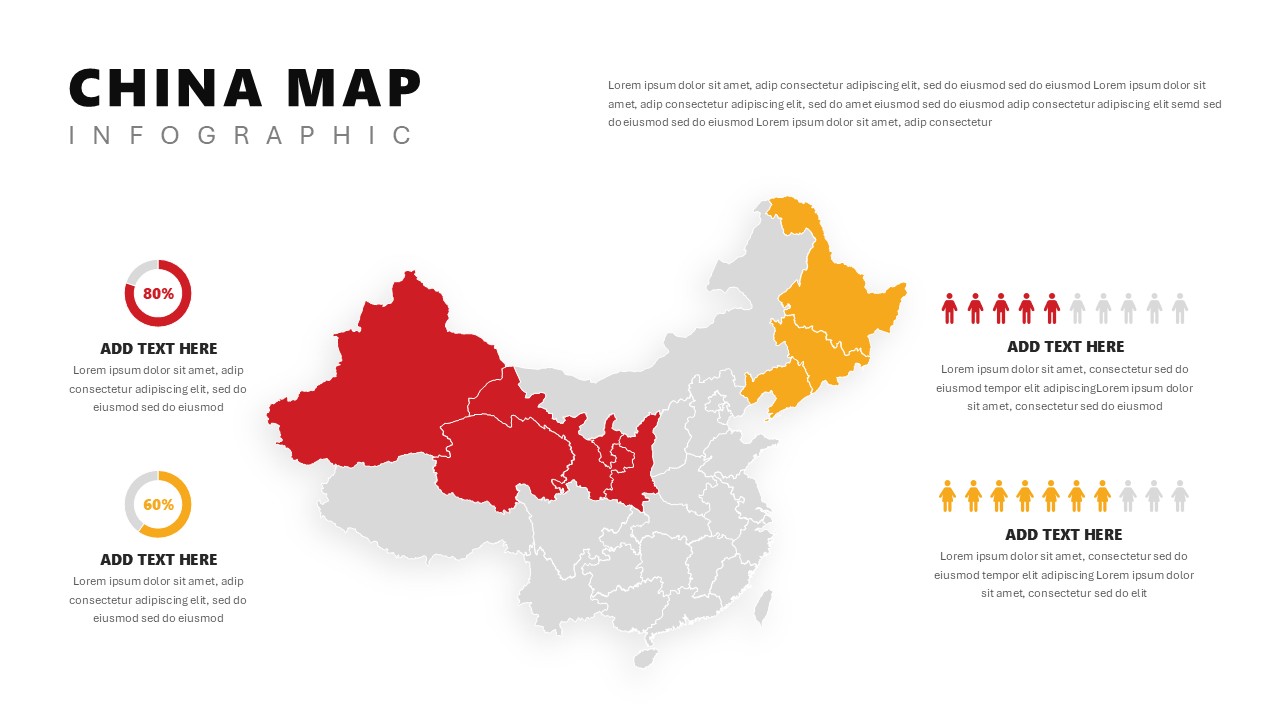
China Map Infographic Regional Stats Template for PowerPoint & Google Slides
World Maps
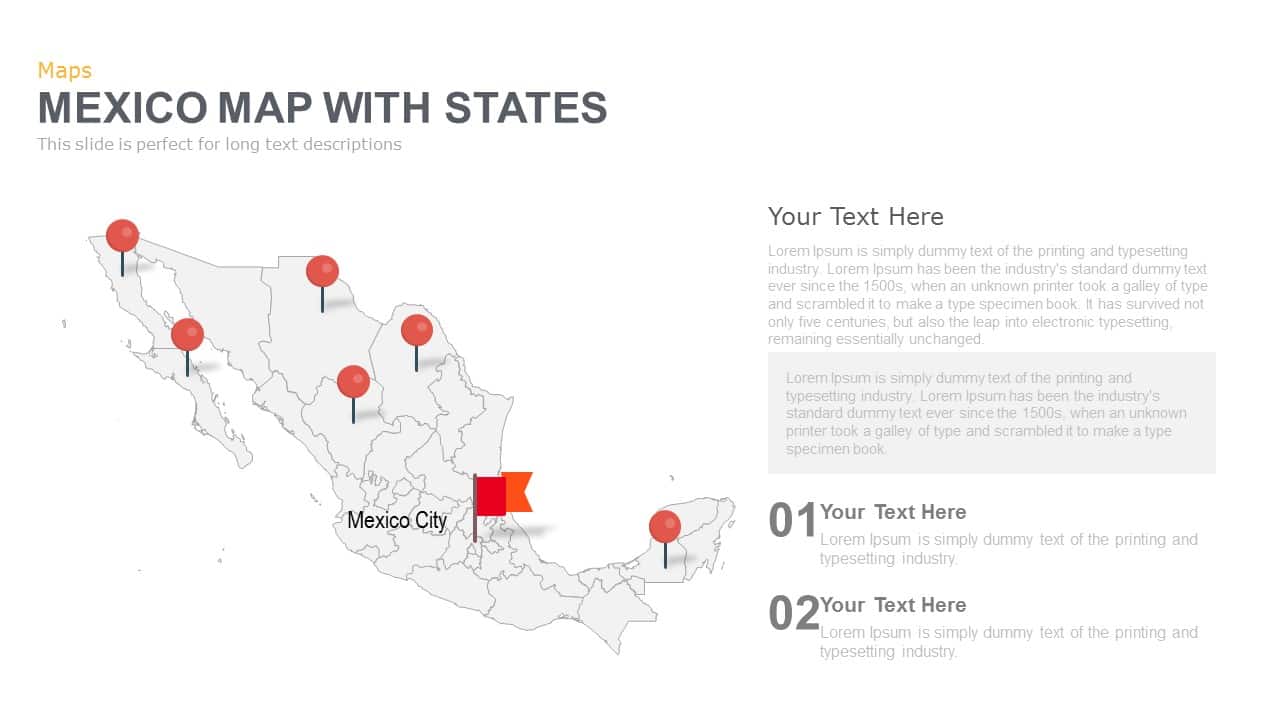
Mexico Map With States Template for PowerPoint & Google Slides
World Maps
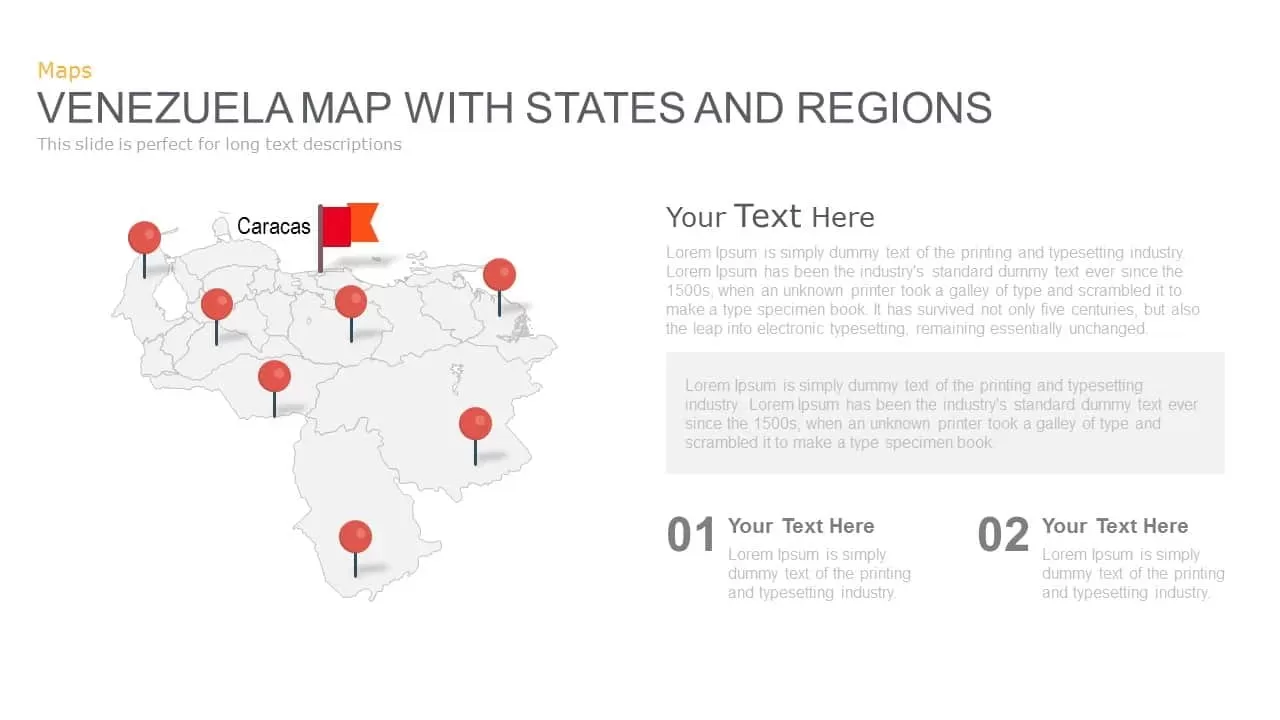
Venezuela Map with States and Regions Template for PowerPoint & Google Slides
World Maps
Regional Revenue Comparison Overview Template for PowerPoint & Google Slides
Comparison
Structural Ego-States template for PowerPoint & Google Slides
Infographics
The Five Awareness States diagram template for PowerPoint & Google Slides
Infographics
Mind Map PowerPoint template for PowerPoint & Google Slides
Mind Maps
Editable Colombia Map PowerPoint Template for PowerPoint & Google Slides
Business Models
World Map Data template for PowerPoint & Google Slides
World Maps
Creative World Map template for PowerPoint & Google Slides
World Maps

Worldwide Map with Bubbles template for PowerPoint & Google Slides
World Maps
Interactive US Population Data Map Slide Template for PowerPoint & Google Slides
World Maps
Africa Country Map Infographic Template for PowerPoint & Google Slides
World Maps
Asia Map with KPI Metrics and Legend Template for PowerPoint & Google Slides
World Maps
Diamond Mind Map Diagram Four Branches Template for PowerPoint & Google Slides
Mind Maps
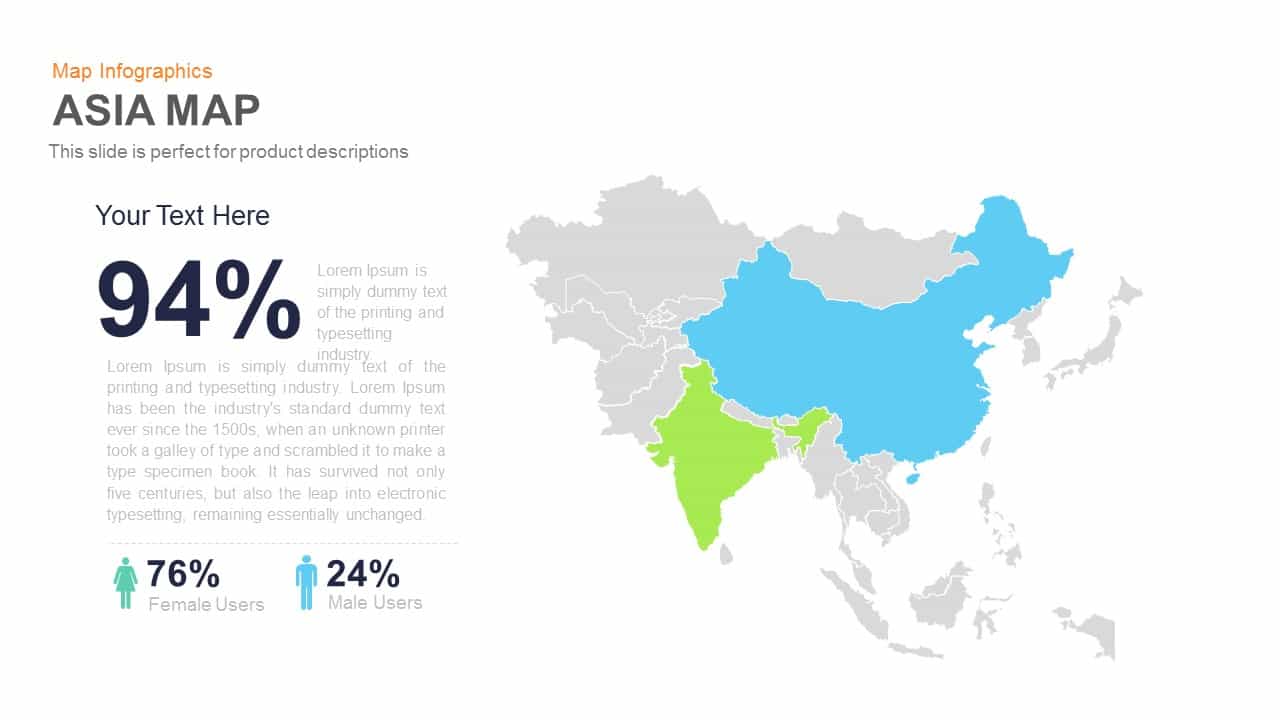
Asia Map Infographic with Demographics template for PowerPoint & Google Slides
World Maps
Simple Multi-Branch Mind Map Template for PowerPoint & Google Slides
Mind Maps
Customizable USA Map With State Markers Template for PowerPoint & Google Slides
World Maps
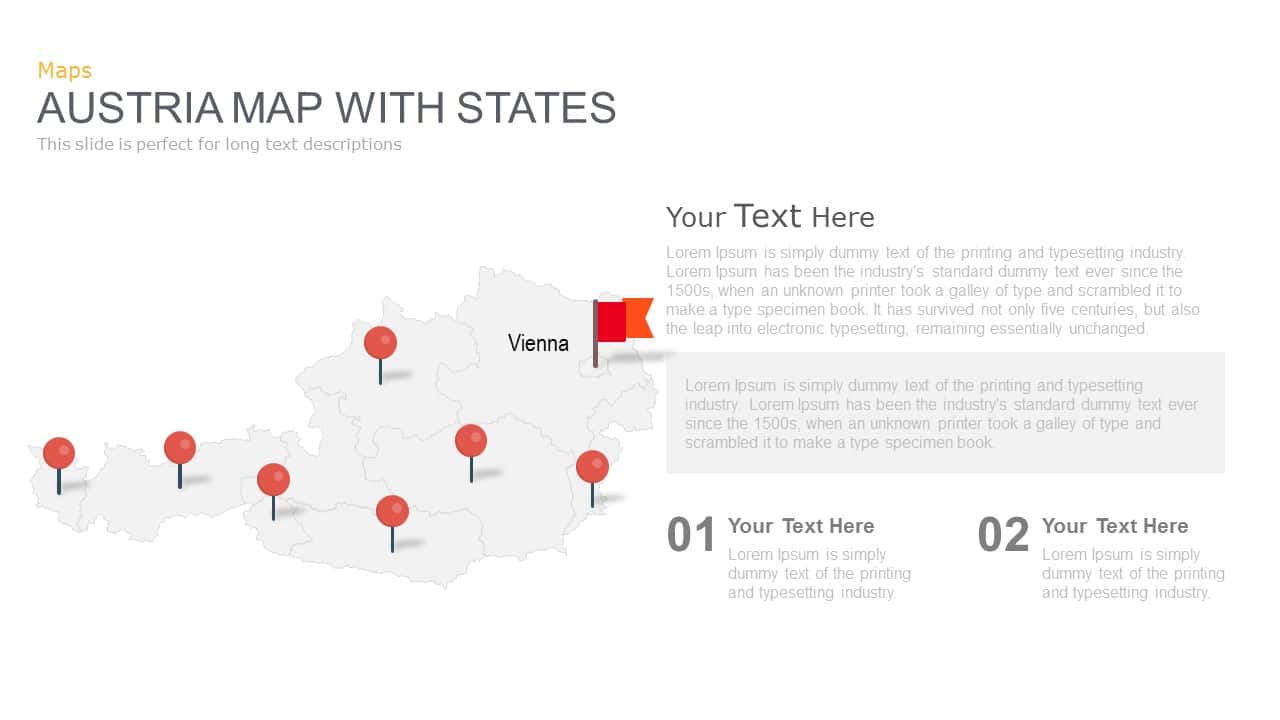
Austria Map With State Markers Template for PowerPoint & Google Slides
World Maps
Azerbaijan Map with Provinces & Callouts Template for PowerPoint & Google Slides
World Maps
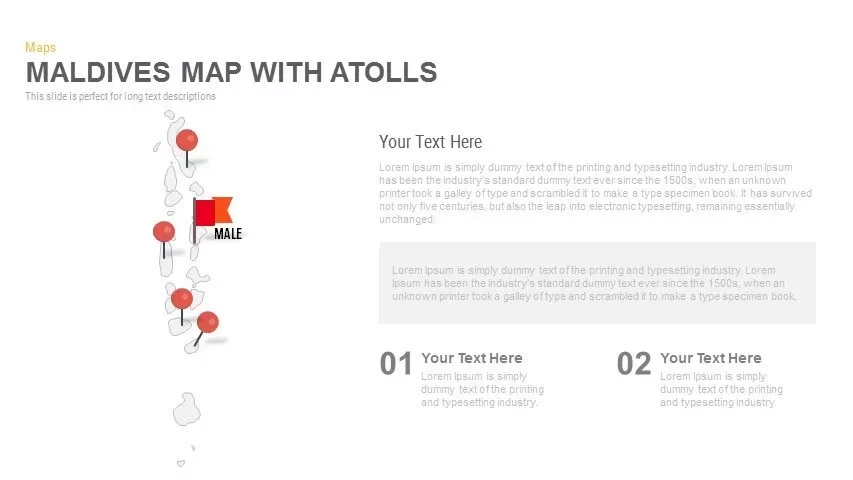
Maldives Map Infographic Template for PowerPoint & Google Slides
Maps
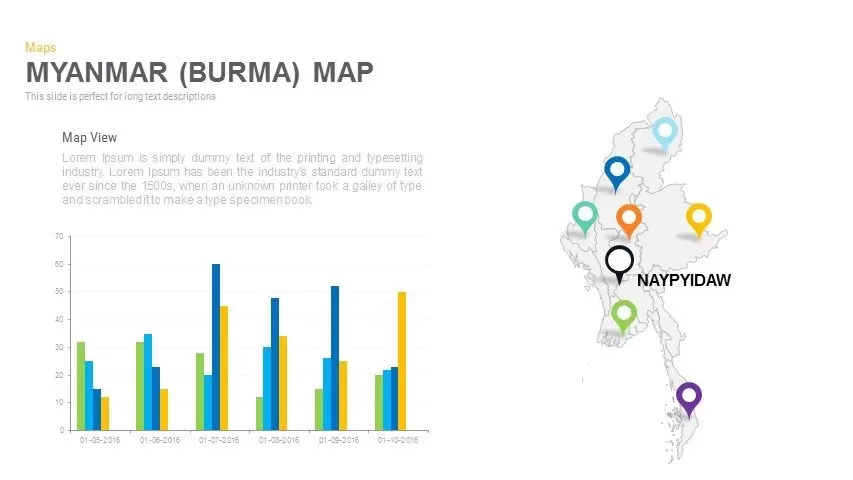
Myanmar (Burma) Provincial Map Infographic Template for PowerPoint & Google Slides
Maps
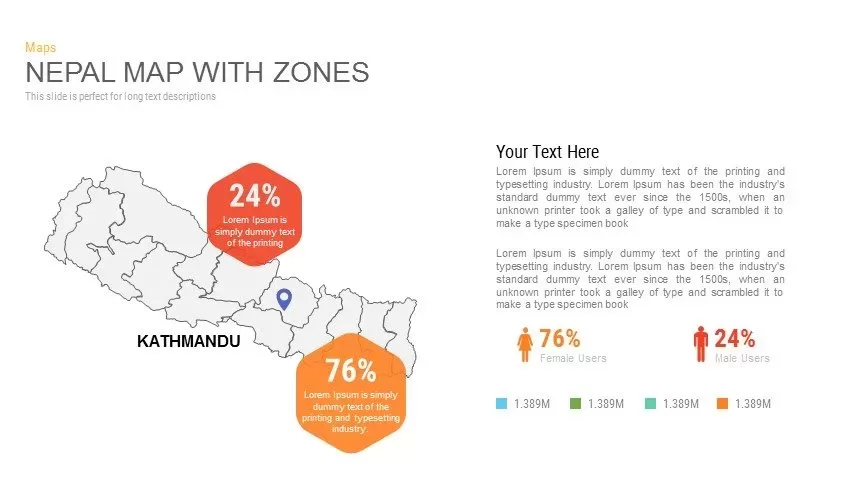
Nepal Map with Zones Infographic Template for PowerPoint & Google Slides
Maps
North Korea Map with Provinces Infographic Pack Template for PowerPoint & Google Slides
Maps
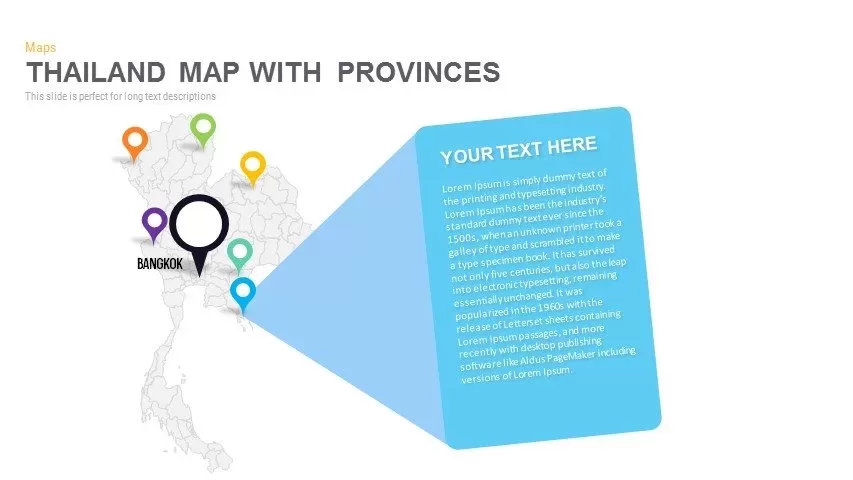
Thailand Provinces Map Infographic Pack Template for PowerPoint & Google Slides
Maps
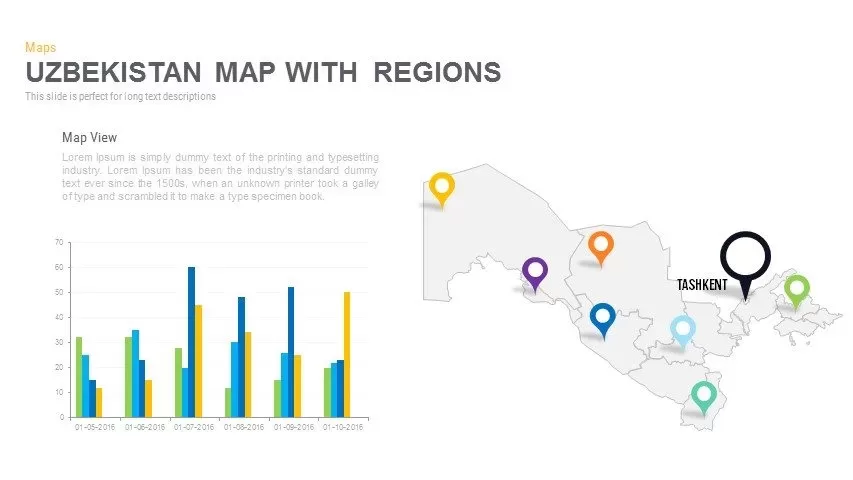
Uzbekistan Map with Regions Pack Template for PowerPoint & Google Slides
Maps
Vietnam Provinces Map Infographic Pack Template for PowerPoint & Google Slides
Maps
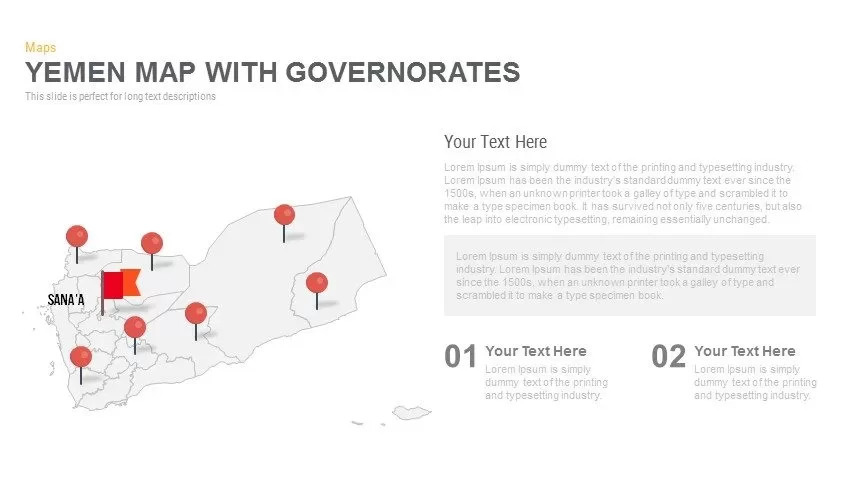
Yemen Governorates Infographic Map Template for PowerPoint & Google Slides
Maps
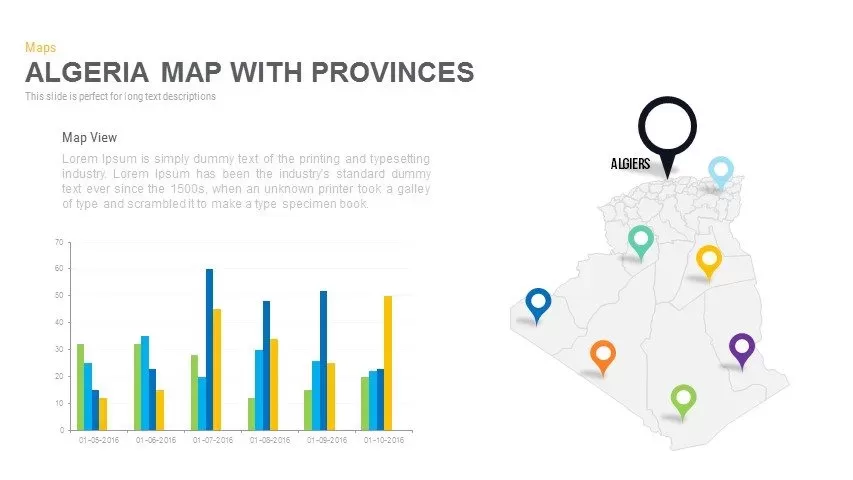
Algeria Map with Provinces Pack Template for PowerPoint & Google Slides
Maps
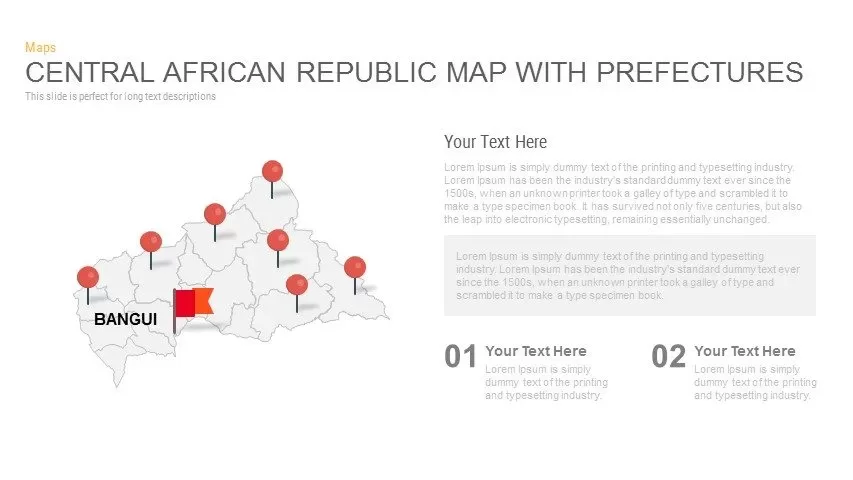
Central African Republic Prefectures Map Template for PowerPoint & Google Slides
World Maps
Chad Map with Regions Slide Pack Template for PowerPoint & Google Slides
World Maps
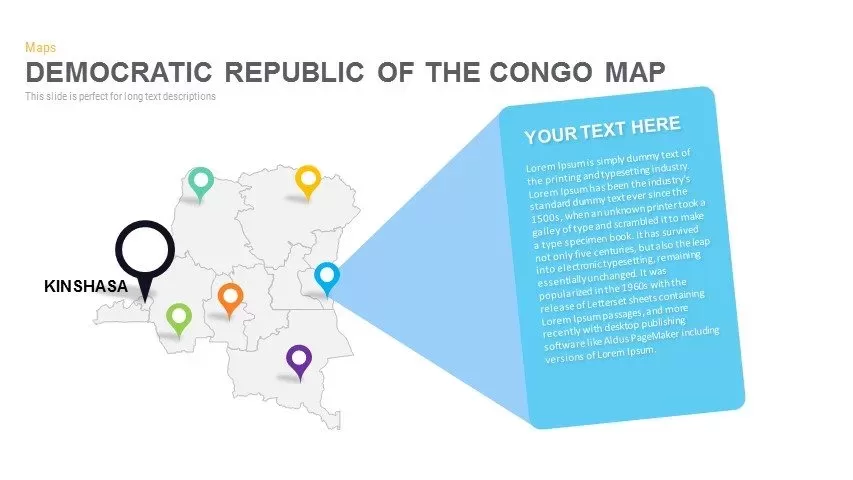
DR Congo Prefecture Map Slide Pack Template for PowerPoint & Google Slides
World Maps
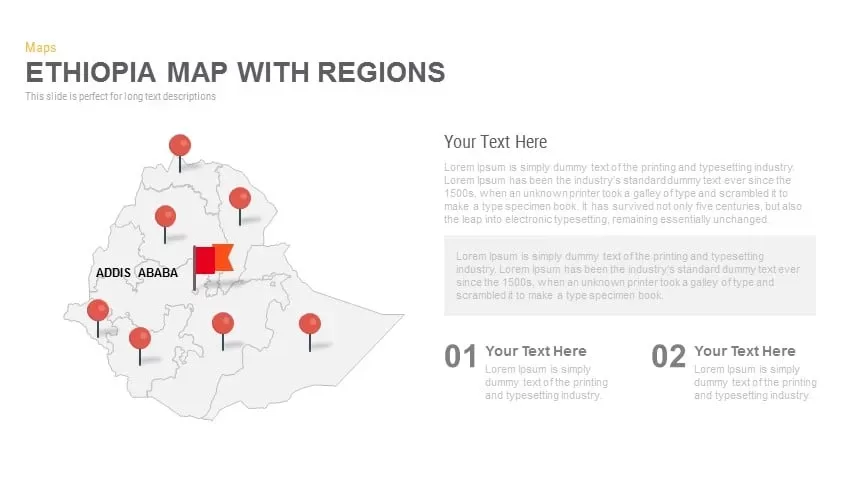
Ethiopia Map with Regions Slide Pack Template for PowerPoint & Google Slides
World Maps
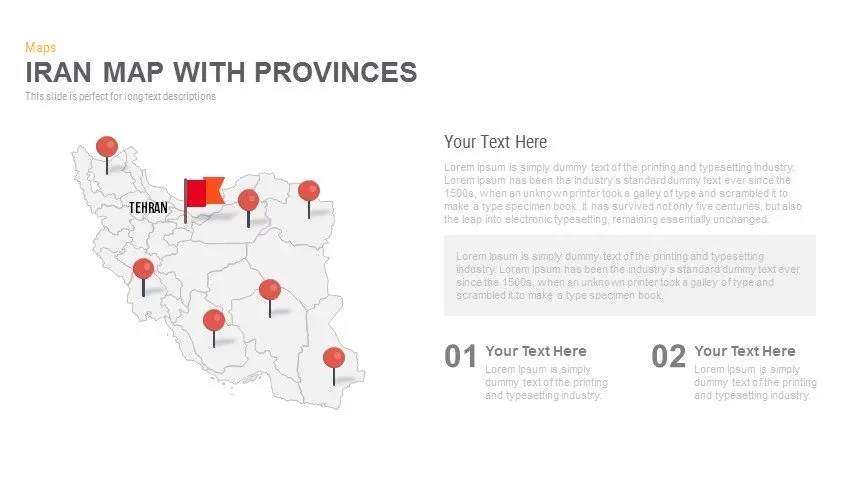
Iran Map with Provinces Slide Pack Template for PowerPoint & Google Slides
World Maps
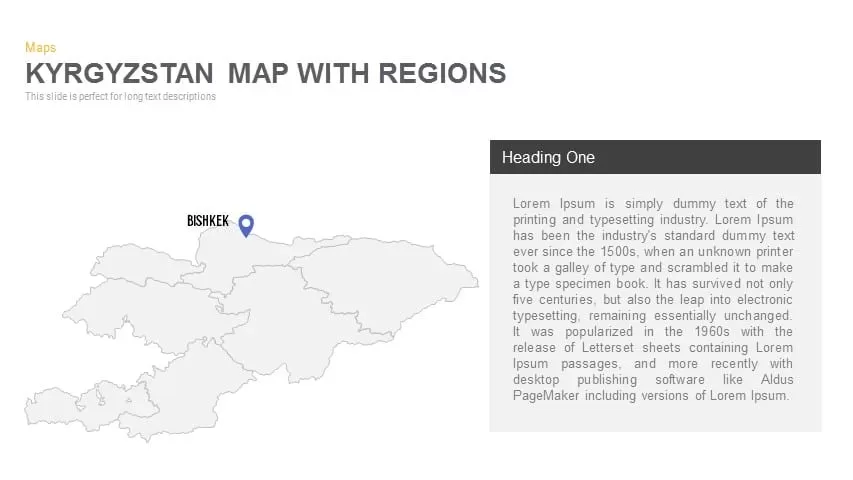
Kyrgyzstan Map with Regions Overview for PowerPoint & Google Slides
World Maps
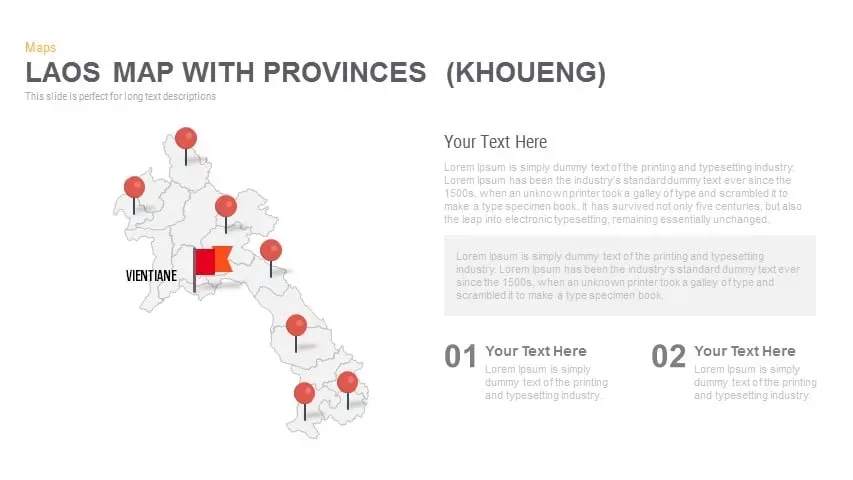
Laos Map with Provinces (Khoueng) Overview for PowerPoint & Google Slides
World Maps
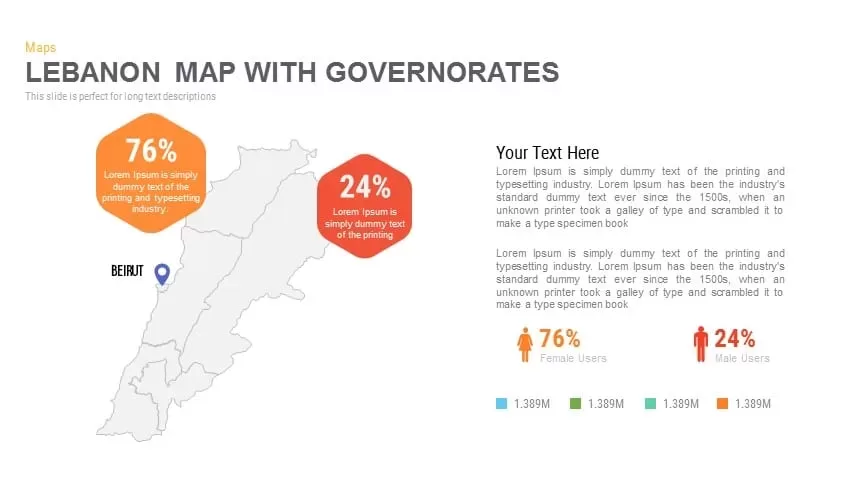
Lebanon Map with Governorates Overview for PowerPoint & Google Slides
World Maps
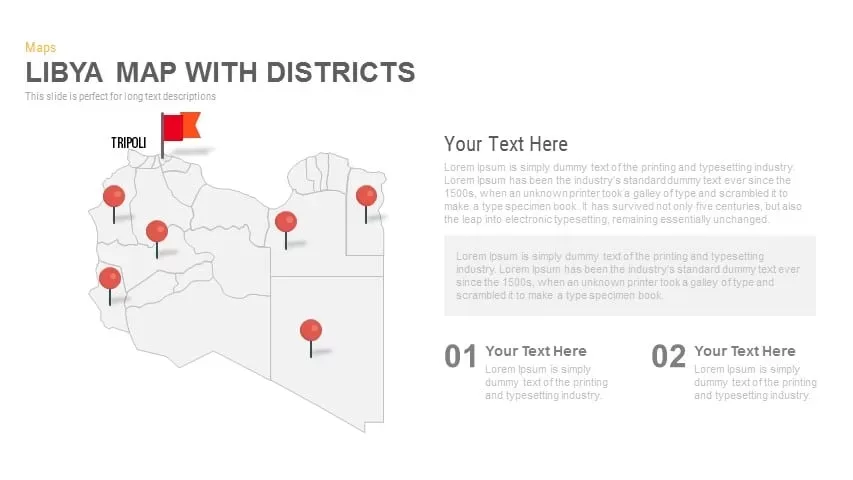
Libya Map with Districts Overview for PowerPoint & Google Slides
World Maps
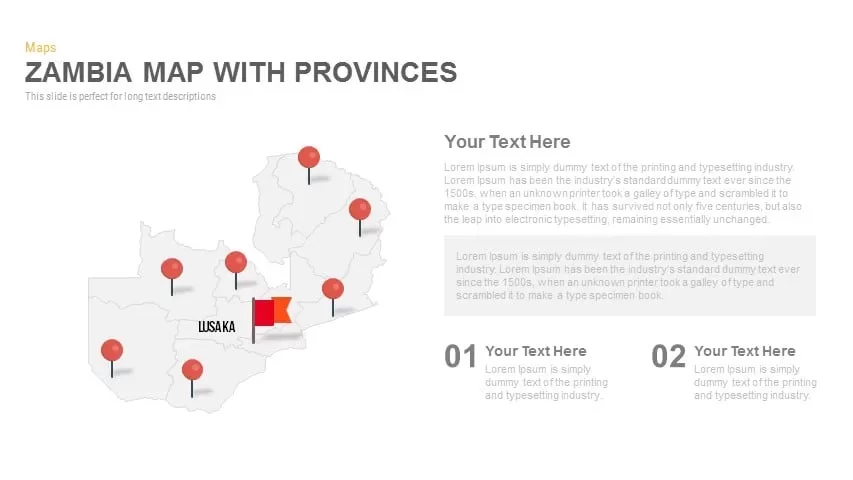
Zambia Map with Provinces Overview for PowerPoint & Google Slides
World Maps

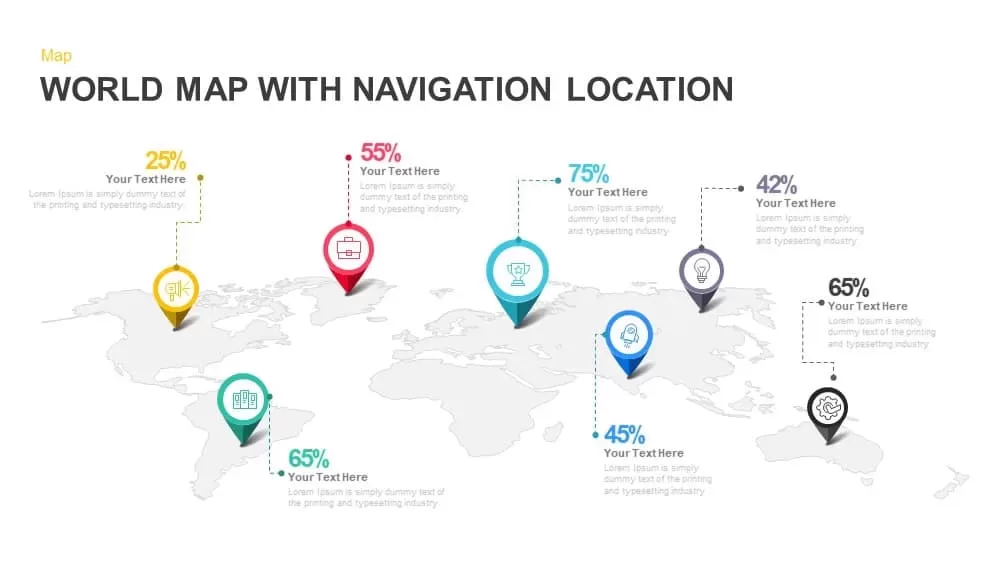
Global Map with Location Markers Template for PowerPoint & Google Slides
World Maps

Multi-Cluster Mind Map Infographic Template for PowerPoint & Google Slides
Mind Maps
Colorful Mind Map Infographic Template with Icons for PowerPoint & Google Slides
Mind Maps
Mind Map Infographic Slide Template for PowerPoint & Google Slides
Mind Maps
Mind Map Infographics template for PowerPoint & Google Slides
Mind Maps
Mind Map Diagram Template for PowerPoint & Google Slides
Mind Maps
Six-Stage Road Map Infographic Timeline Template for PowerPoint & Google Slides
Roadmap
Versatile Mind Map Infographic Template for PowerPoint & Google Slides
Mind Maps
Concept Map Presentation Template for PowerPoint & Google Slides
Mind Maps
Structured Mind Map Infographic Diagram Template for PowerPoint & Google Slides
Mind Maps
Dual Topic Mind Map Infographic Template for PowerPoint & Google Slides
Mind Maps
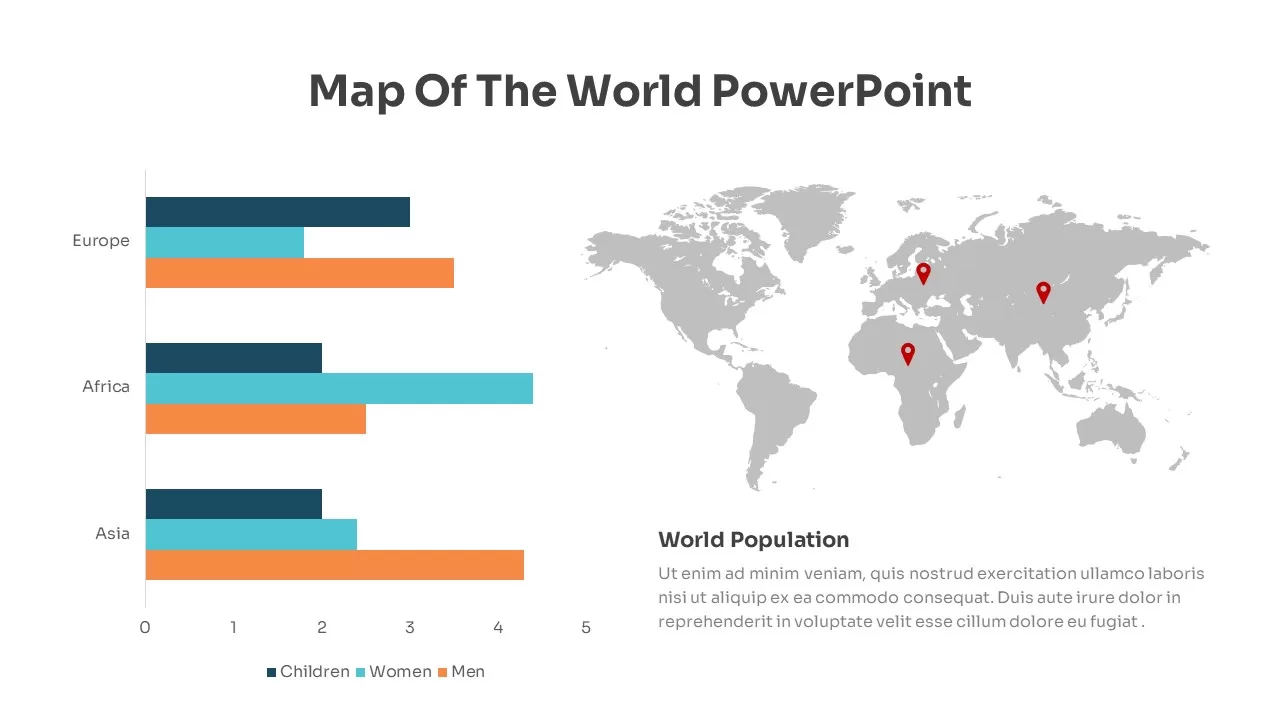
Global Population Demographics & Map Template for PowerPoint & Google Slides
Bar/Column
Editable World Map Callout Infographic Template for PowerPoint & Google Slides
World Maps
Editable World Map Callout Infographic Template for PowerPoint & Google Slides
World Maps
Mind Map Template for PowerPoint & Google Slides
Mind Maps
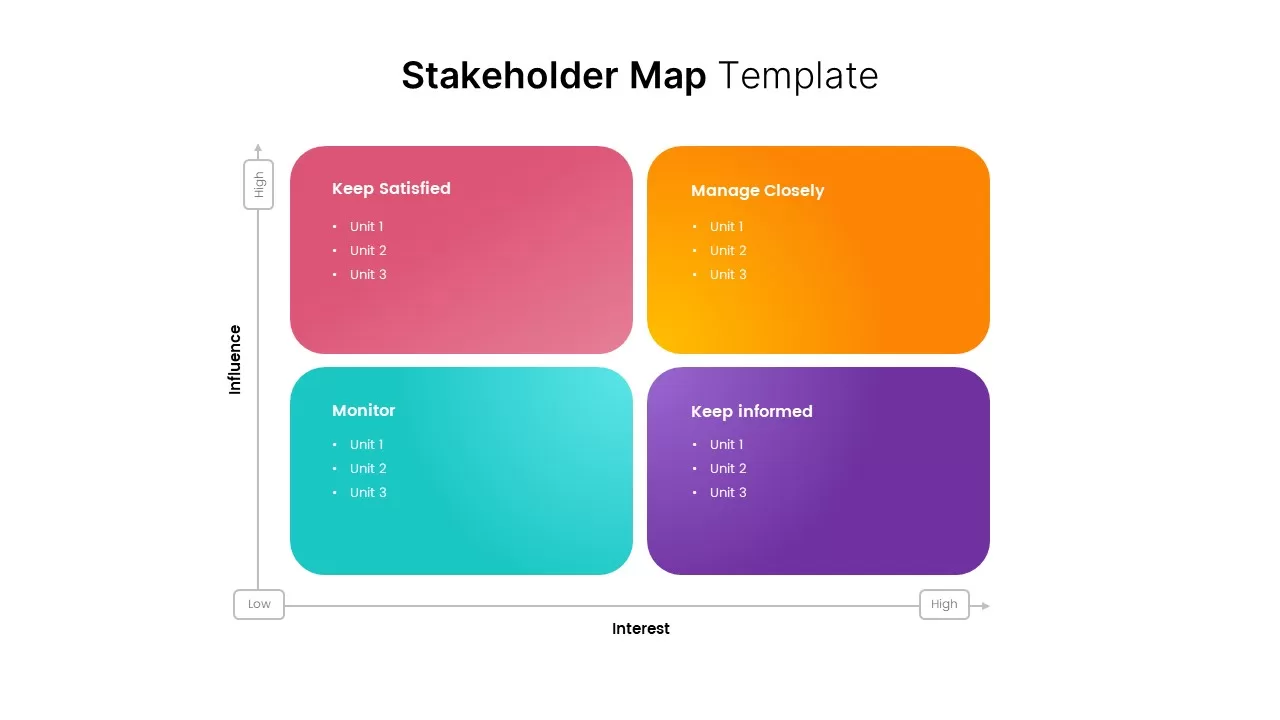
Stakeholder Map Template for PowerPoint & Google Slides
Business
Colorful Mind Map with Icons Template for PowerPoint & Google Slides
Mind Maps
Colorful Mind Map Template for PowerPoint & Google Slides
Mind Maps
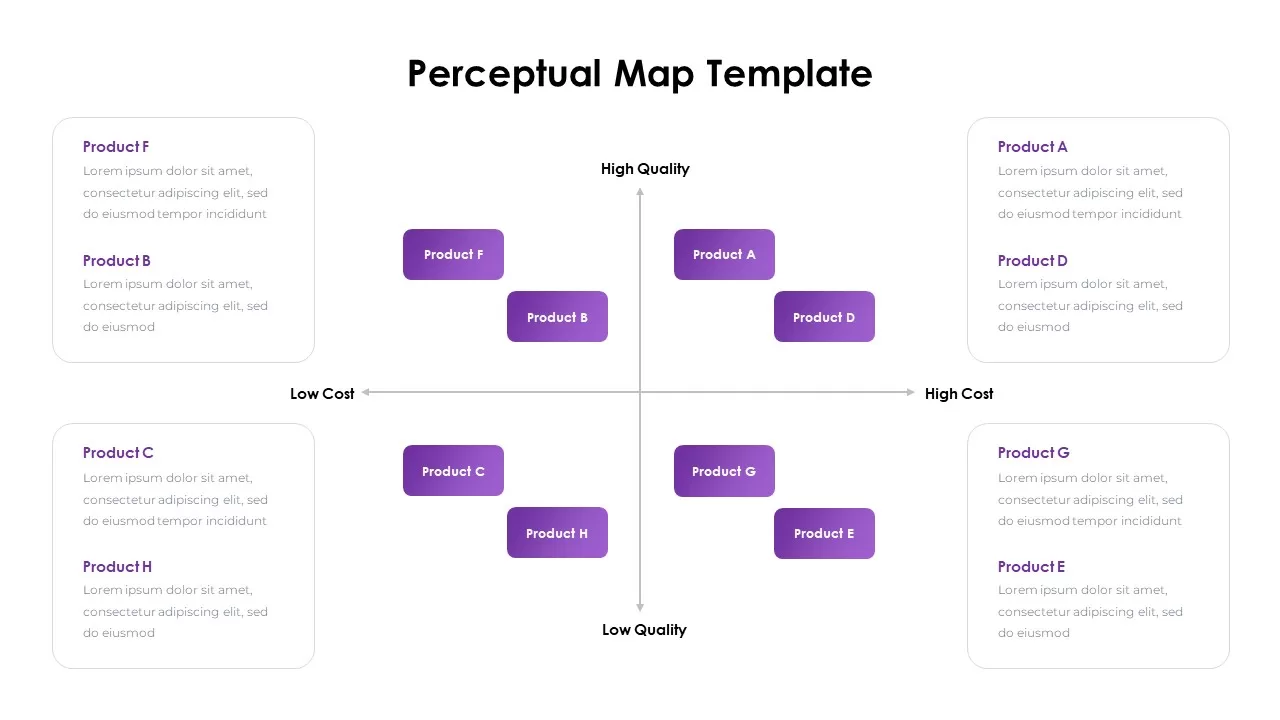
Perceptual Map infographic for PowerPoint & Google Slides
Competitor Analysis
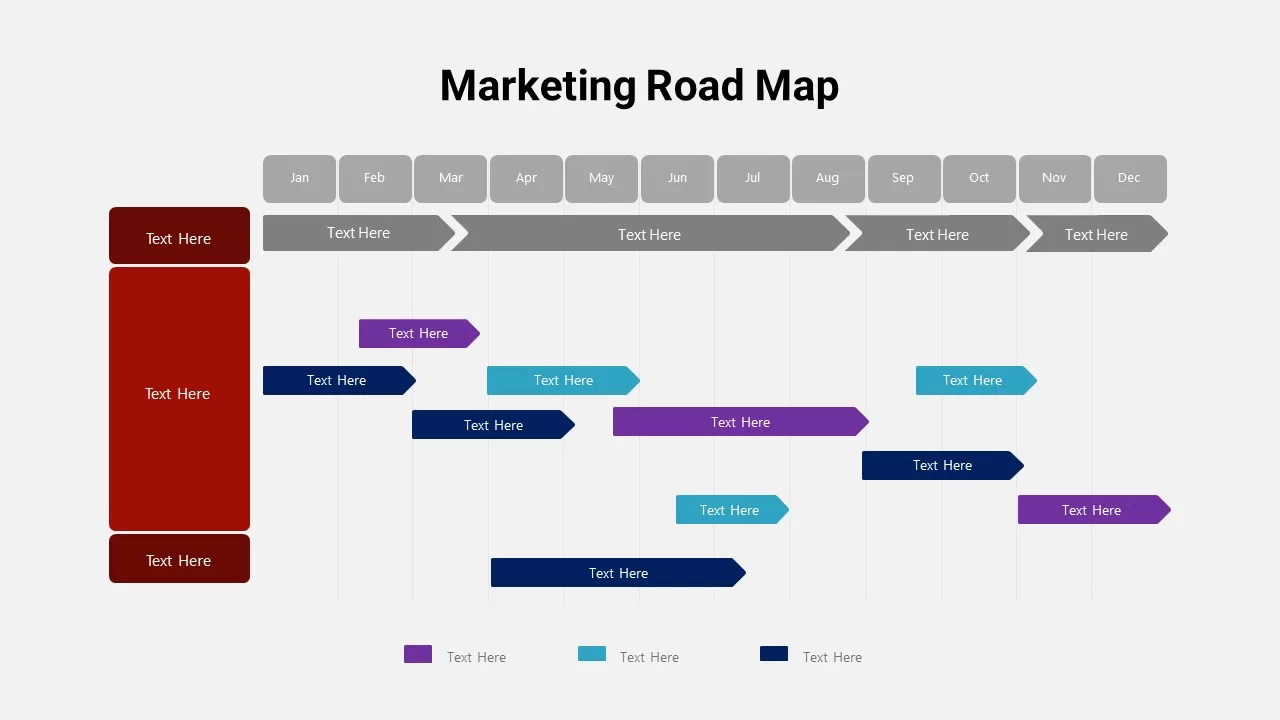
Detailed Marketing Road Map Timeline Template for PowerPoint & Google Slides
Timeline
North America Map Infographic Slide Template for PowerPoint & Google Slides
World Maps
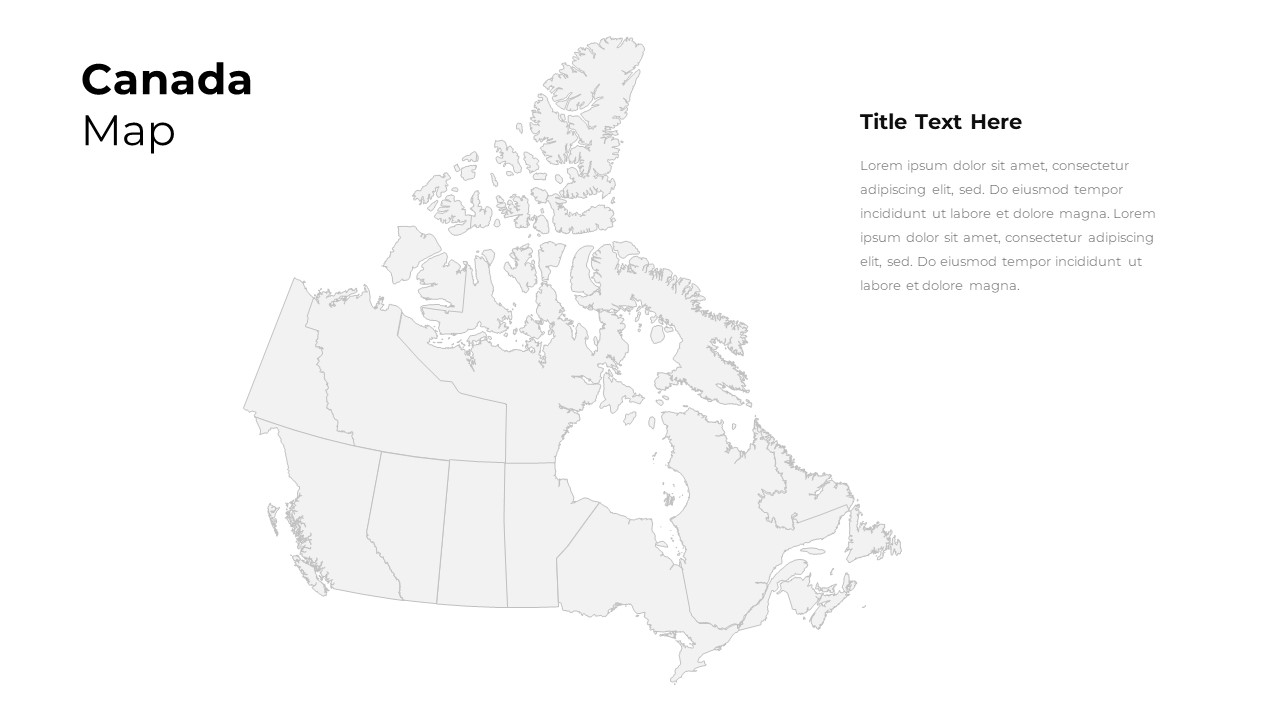
Customizable Canada Map Outline Template for PowerPoint & Google Slides
World Maps
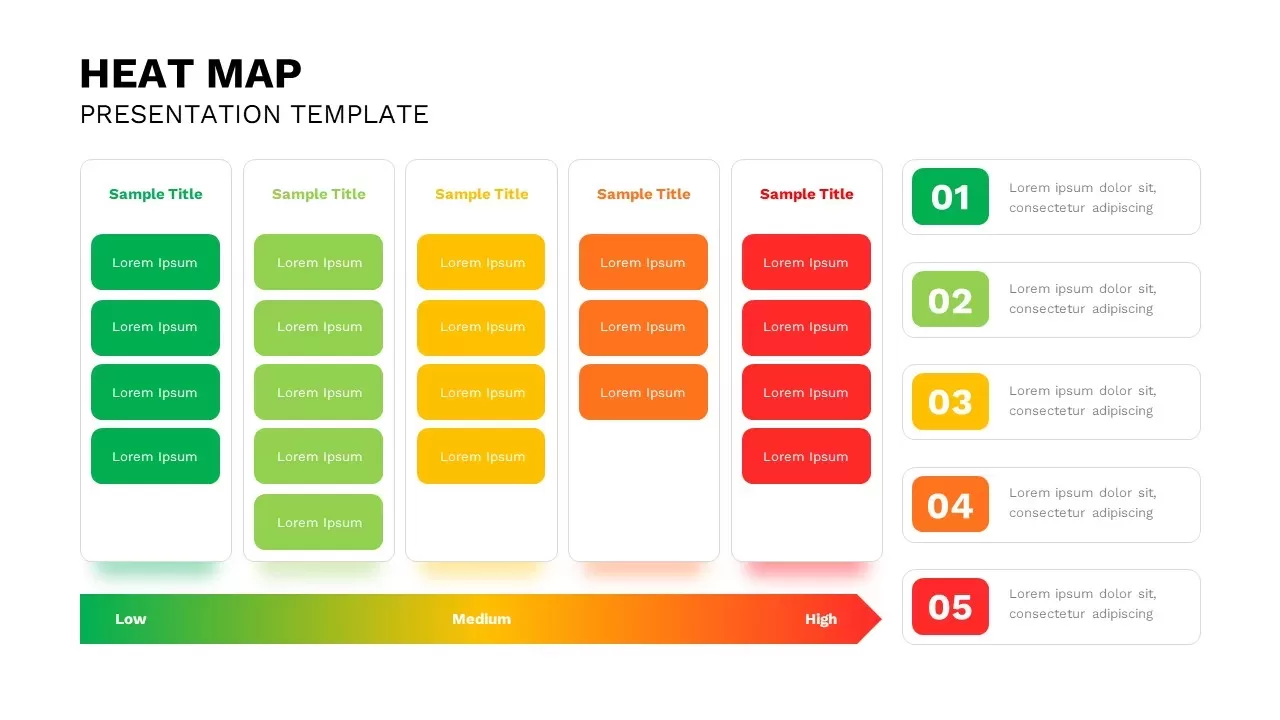
Heat Map Analysis Template for PowerPoint & Google Slides
Risk Management
Professional Risk Heat Map Visualization Template for PowerPoint & Google Slides
Risk Management
Interactive Heat Map Template for PowerPoint & Google Slides
Bar/Column
Heat Map Risk Matrix Dashboard Template for PowerPoint & Google Slides
Comparison Chart
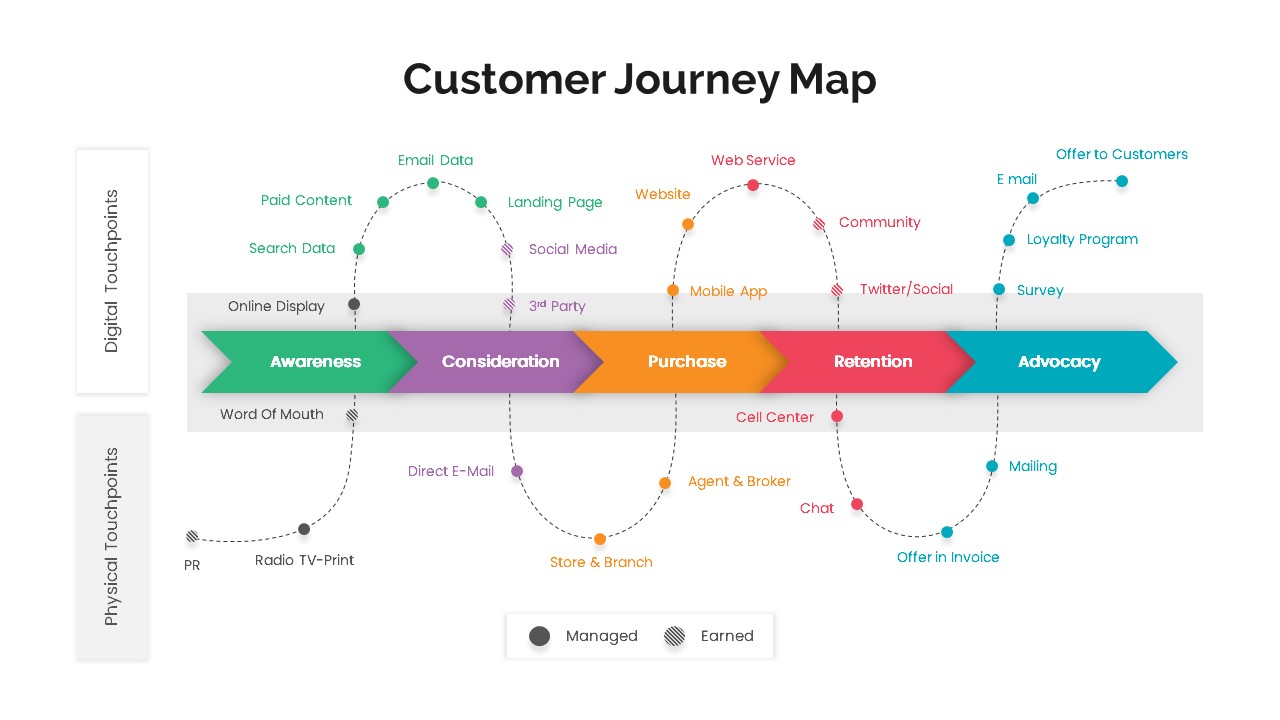
Versatile Customer Journey Map Template for PowerPoint & Google Slides
Customer Journey
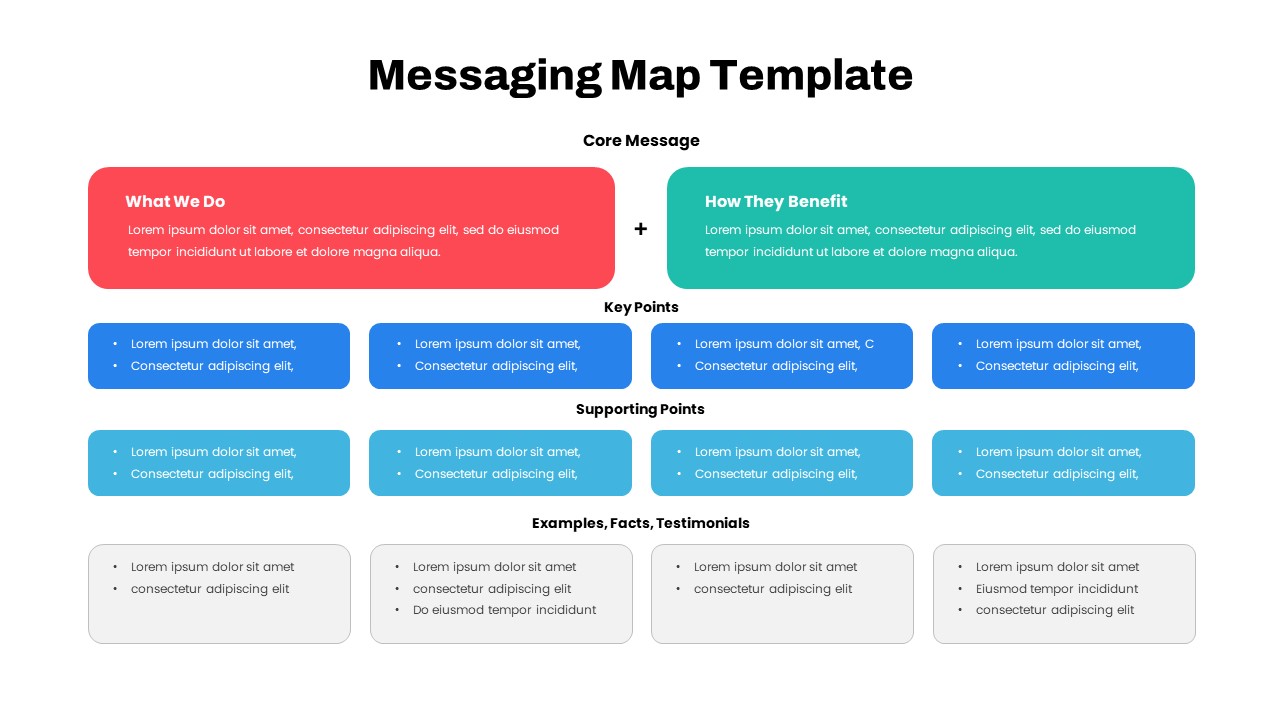
Comprehensive Messaging Map Framework Template for PowerPoint & Google Slides
Process
Free Global Market Distribution Map Template for PowerPoint & Google Slides
World Maps
Free
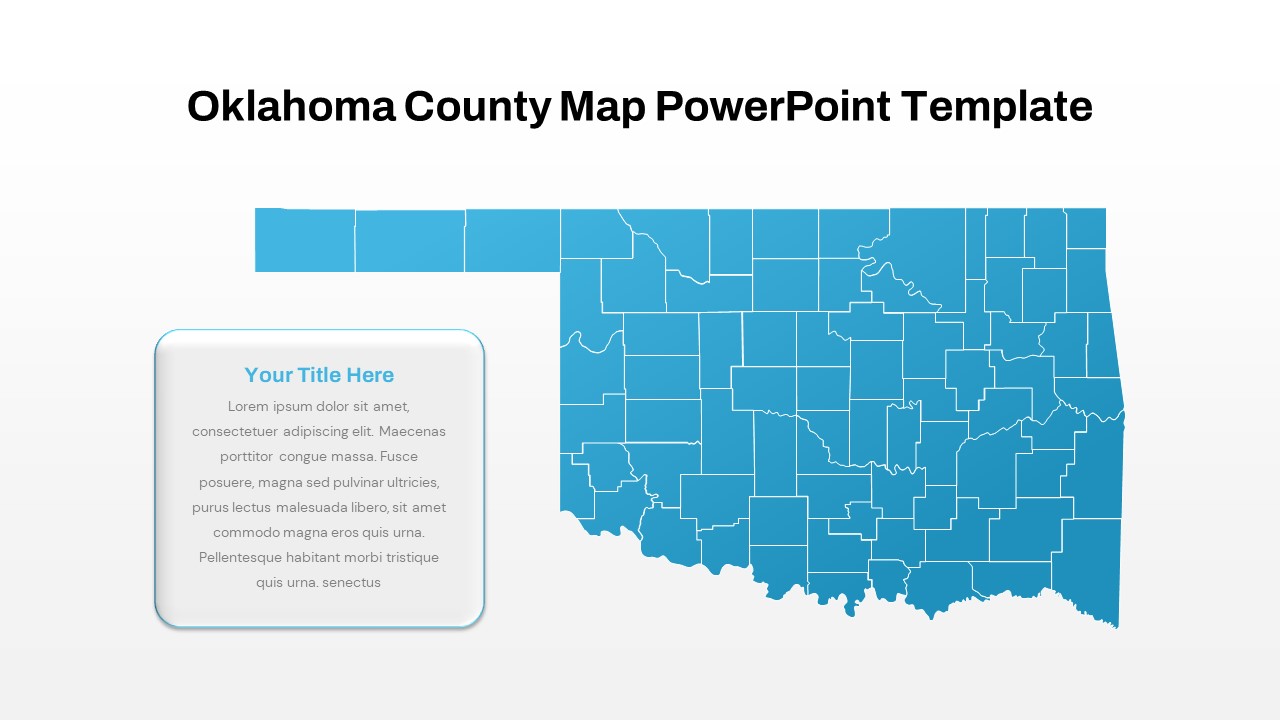
Interactive Oklahoma County Map Template for PowerPoint & Google Slides
World Maps
Modern Custom Eight-Branch Mind Map Template for PowerPoint & Google Slides
Mind Maps
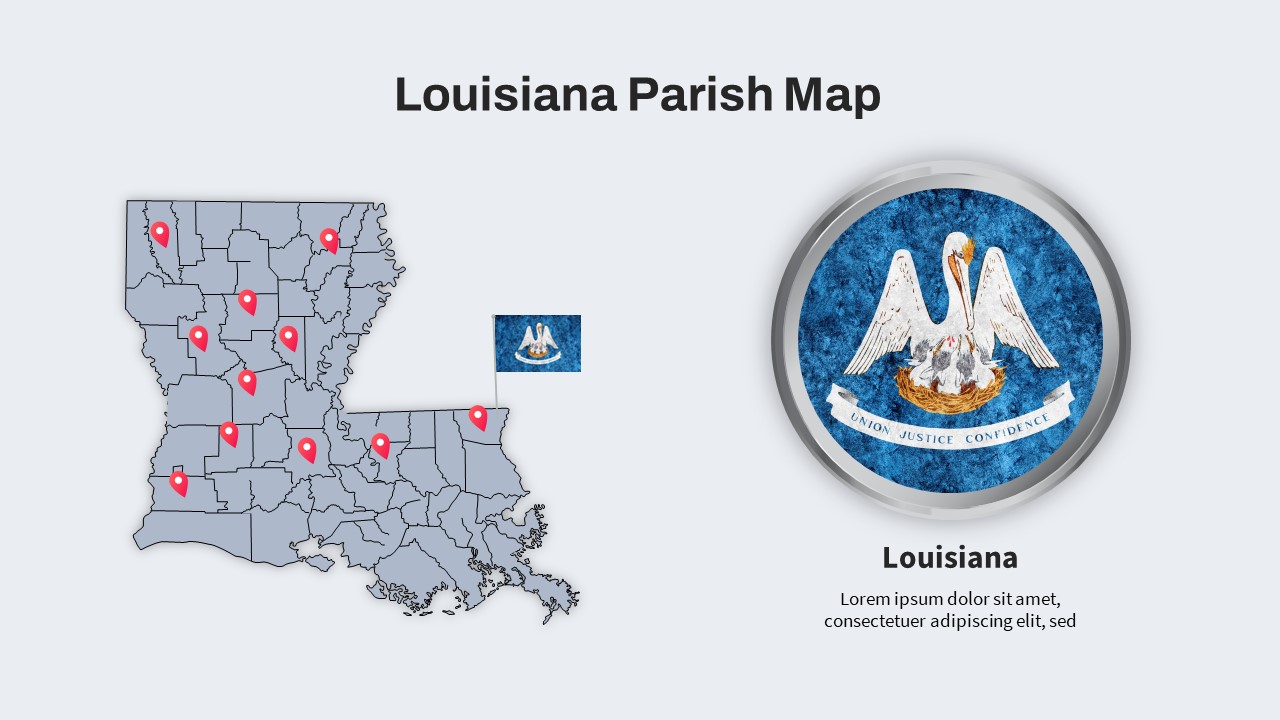
Louisiana Parish Map with Markers Template for PowerPoint & Google Slides
Maps
Colorful Multi-Branch Mind Map Slide Template for PowerPoint & Google Slides
Mind Maps
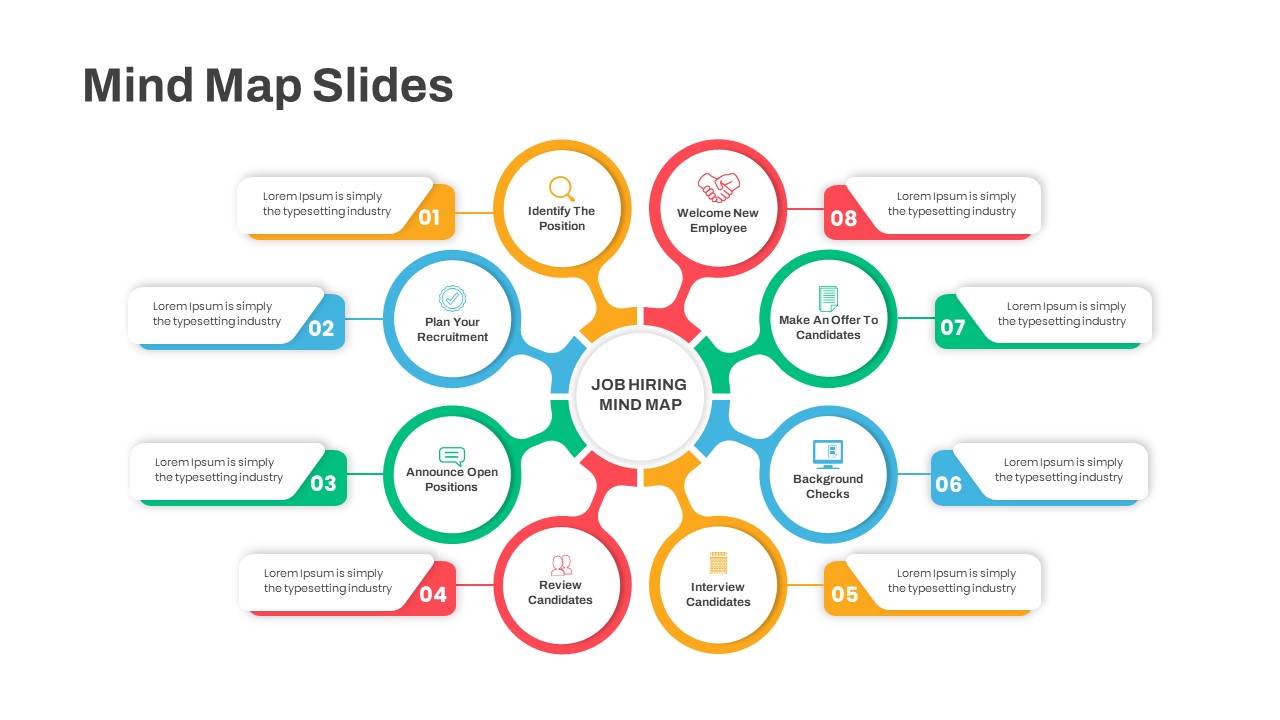
Eight-Step Job Hiring Mind Map Template for PowerPoint & Google Slides
Mind Maps
Michigan County Map with KPI Dashboard Template for PowerPoint & Google Slides
World Maps
Kentucky County Map Visualization Template for PowerPoint & Google Slides
World Maps
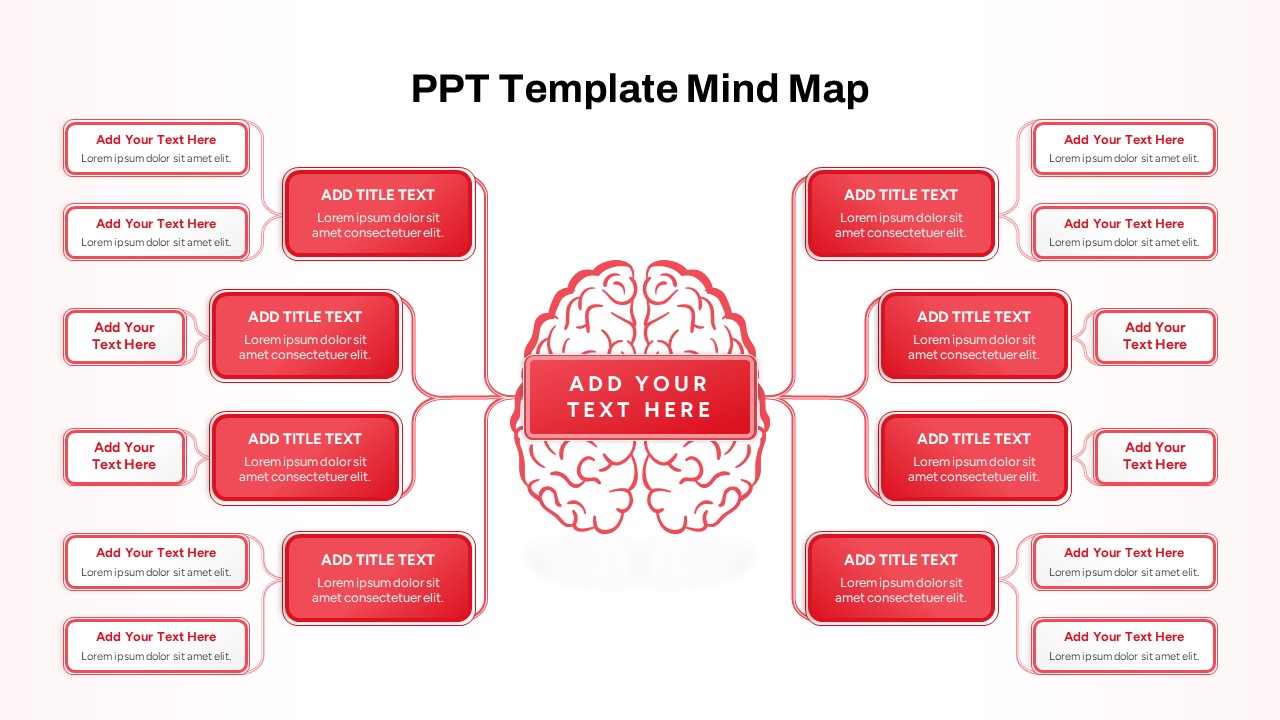
Red Brain Mind Map Diagram Template for PowerPoint & Google Slides
Mind Maps
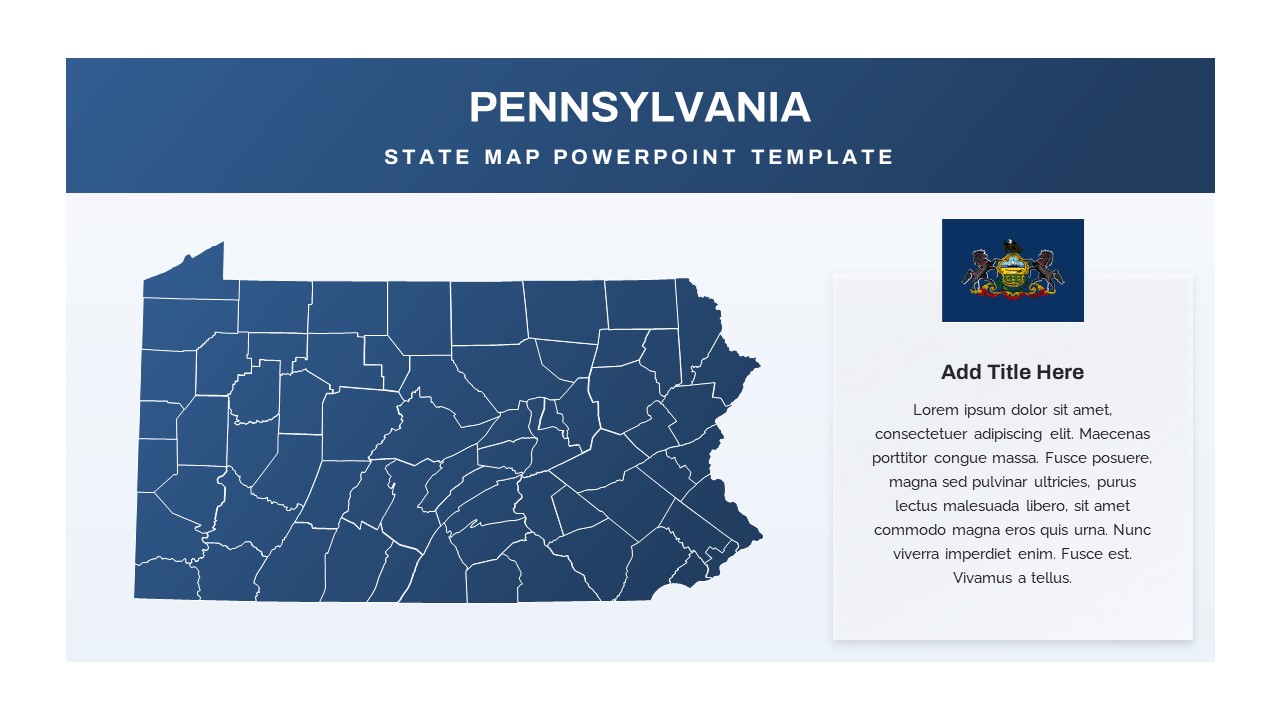
Pennsylvania State Map Diagram Template for PowerPoint & Google Slides
World Maps
Editable Ireland Map Infographic Slide Template for PowerPoint & Google Slides
World Maps
Free
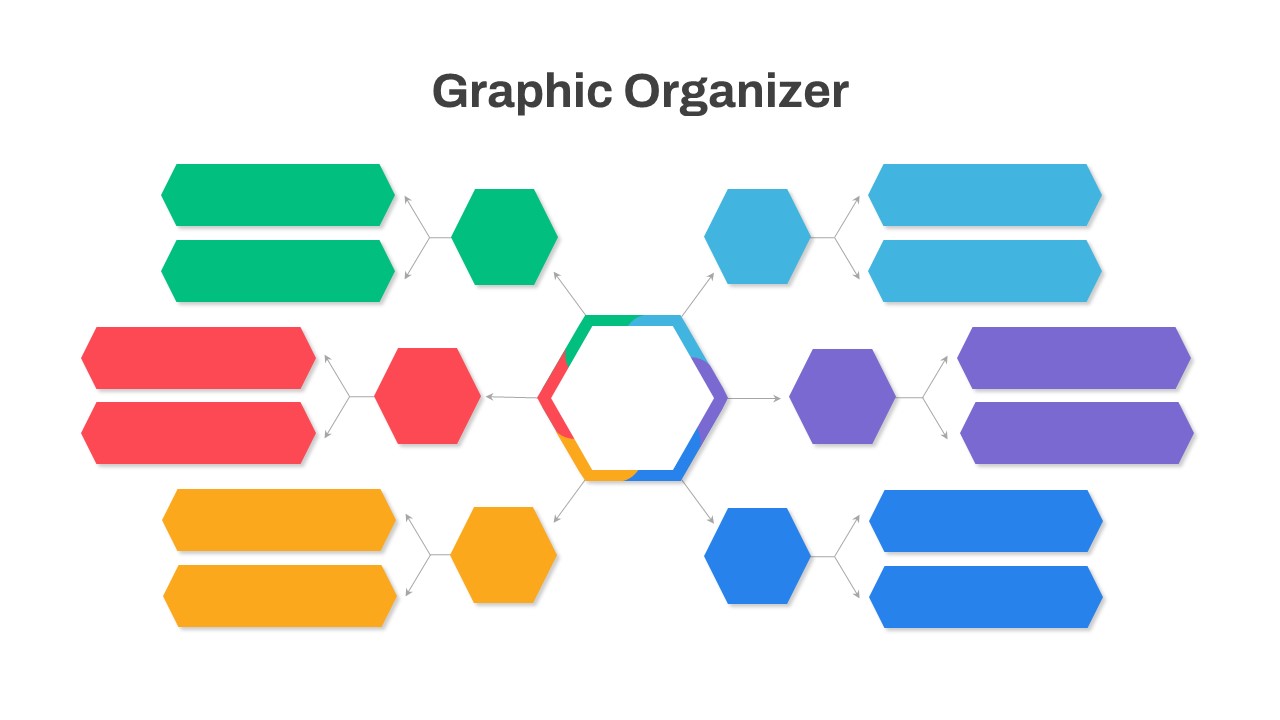
Graphic Organizer & Double Bubble Map Template for PowerPoint & Google Slides
Maps
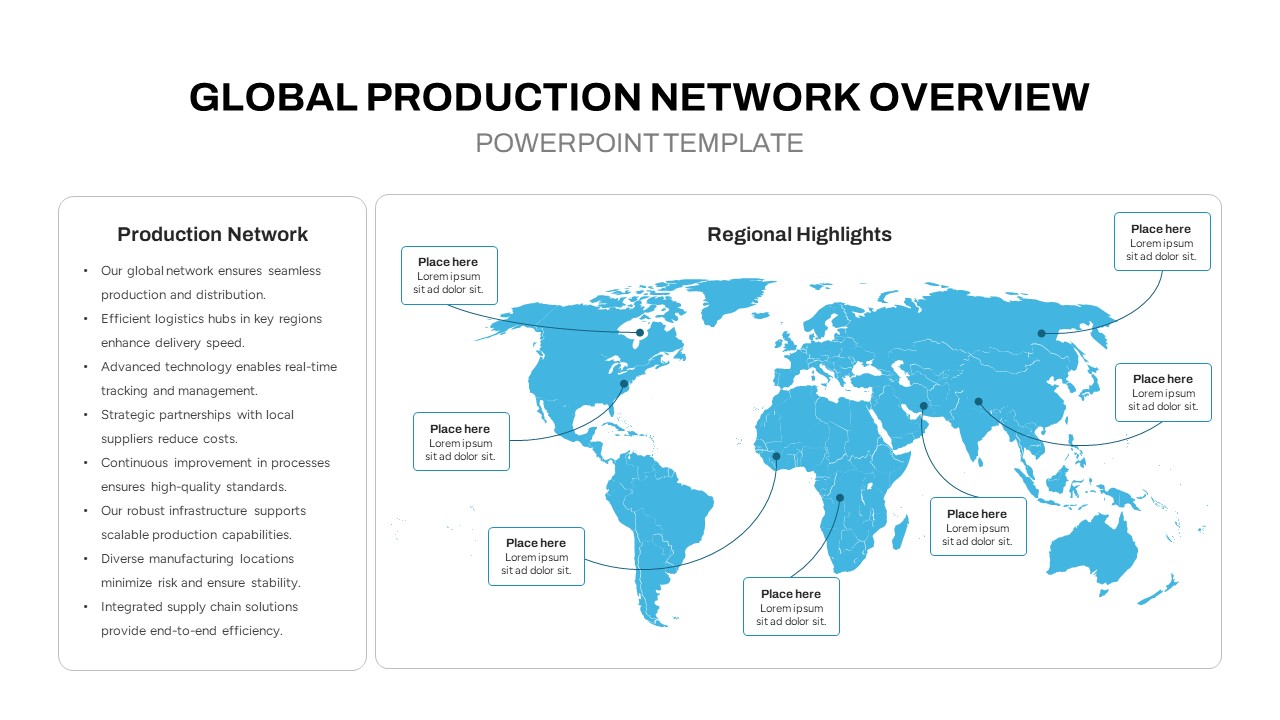
Global Production Network Overview Map Template for PowerPoint & Google Slides
World Maps
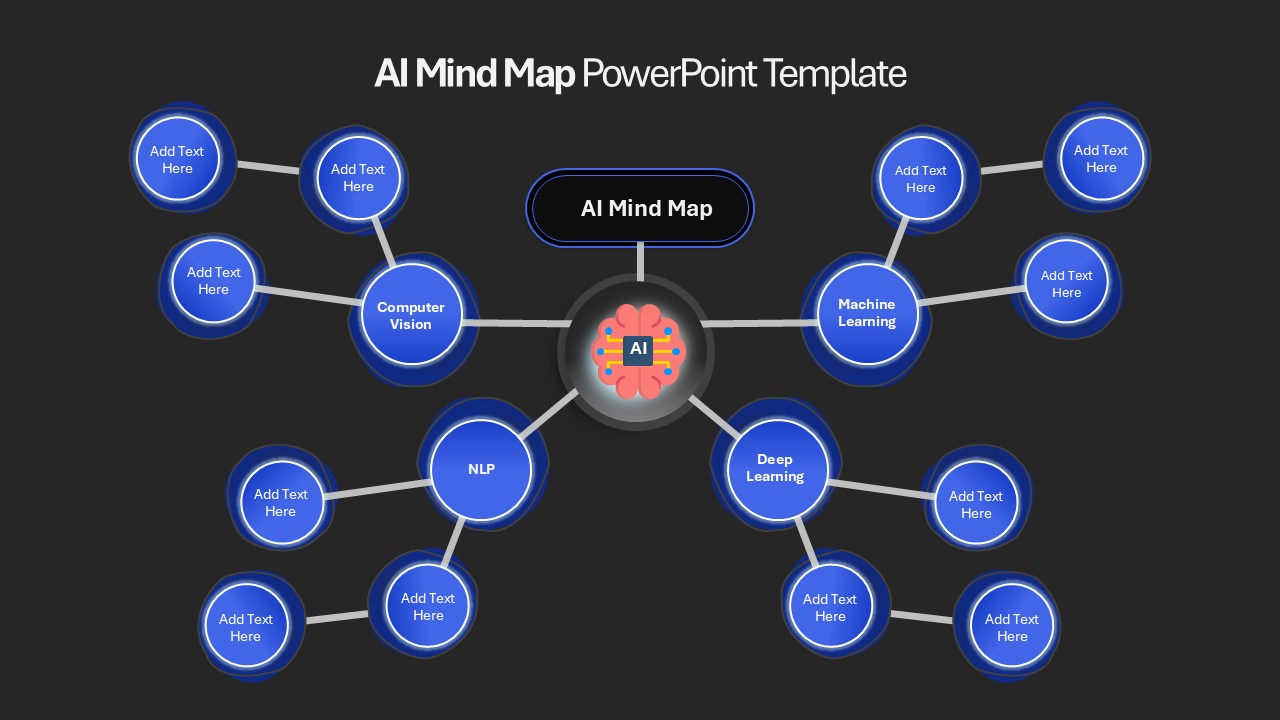
AI Mind Map & Hub-and-Spoke Diagram Template for PowerPoint & Google Slides
Mind Maps
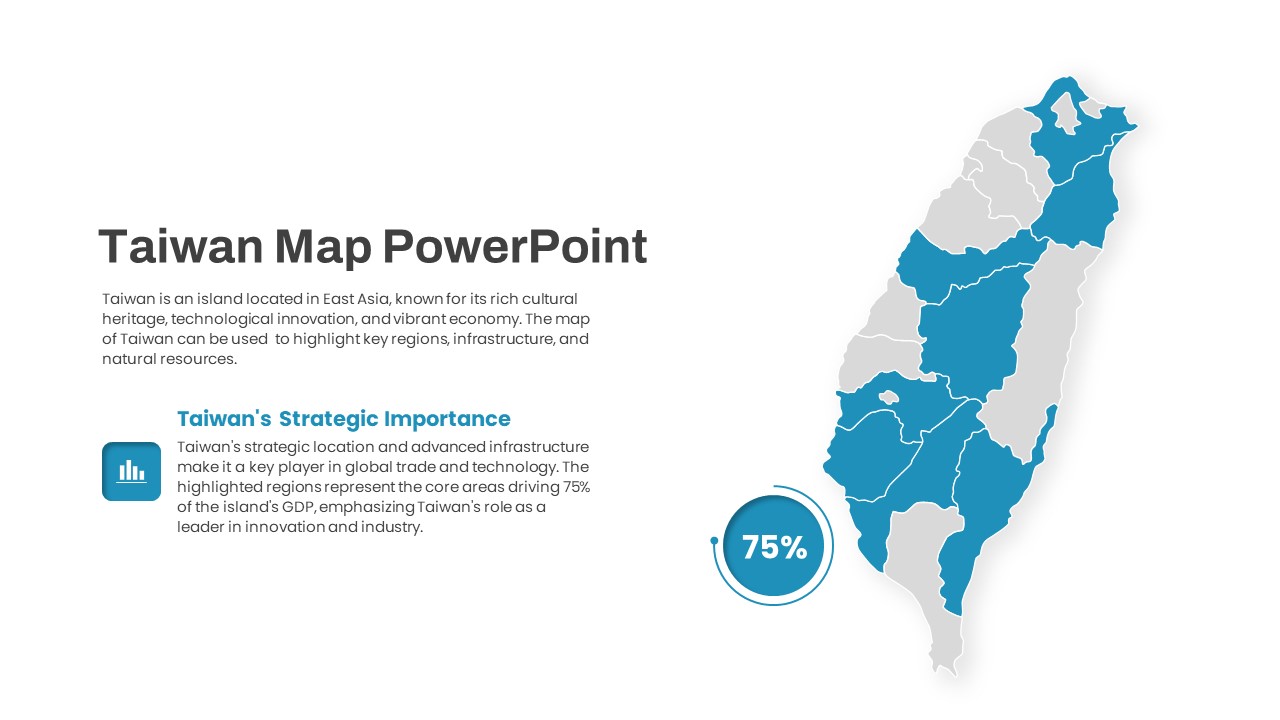
Interactive Taiwan Map Highlight Template for PowerPoint & Google Slides
World Maps
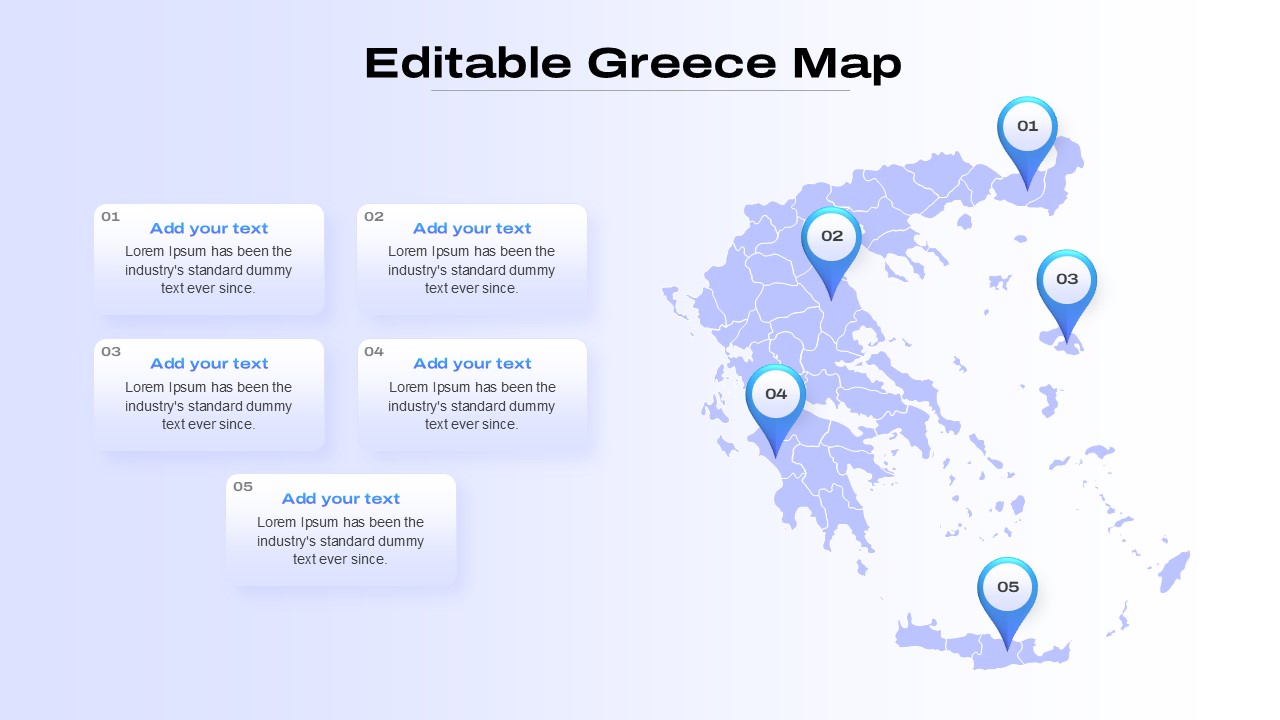
Editable Greece Map for PowerPoint & Google Slides
Maps
AI and Data Ecosystem Map Template for PowerPoint & Google Slides
AI
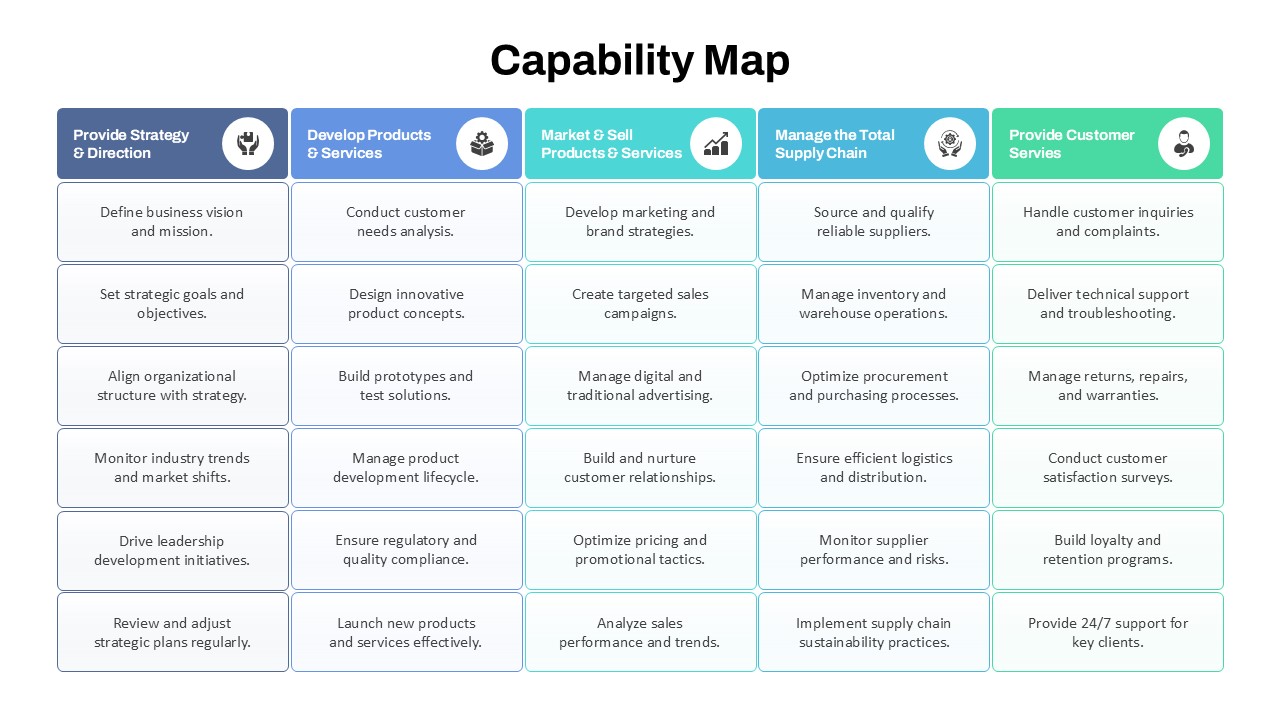
Capability Map Overview Template for PowerPoint & Google Slides
Business Strategy
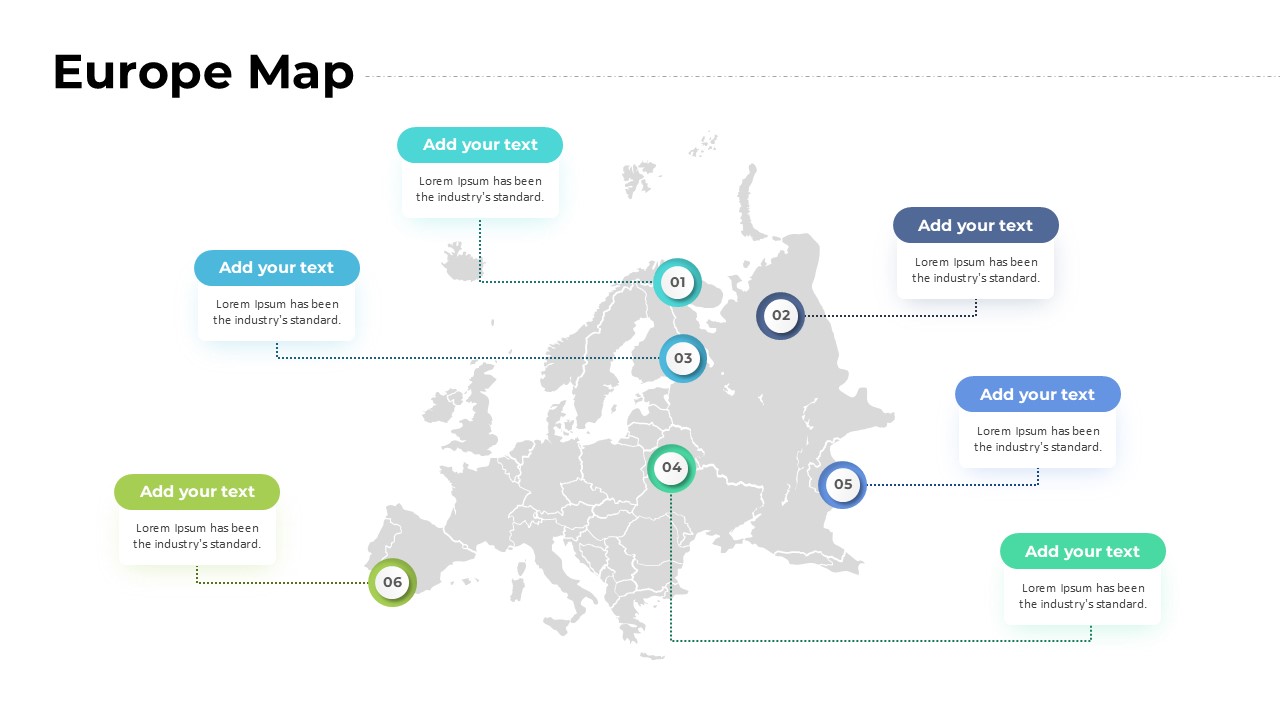
Europe Map with Six Editable Points Template for PowerPoint & Google Slides
World Maps
USA Map with Bar Chart Template for PowerPoint & Google Slides
World Maps