Mobile Infographics Data Visualization Template for PowerPoint & Google Slides


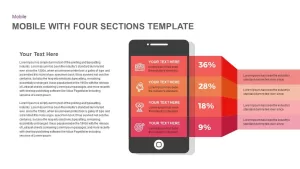
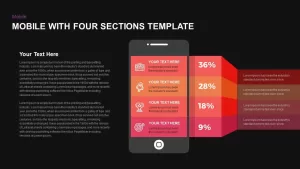
Transform quantitative data into an engaging, easy-to-interpret infographic with this bottle-shaped slide design. A large, subdued bottle silhouette anchors the layout, while four horizontal percentage bars—graded from mint green (55%) through teal (30%), aqua (25%), to deep blue (15%)—stack vertically across the bottle’s midsection. Each bar features a clear icon placeholder and “Your Text Here” headline, letting you represent product metrics, survey results, or resource allocations with precision. Flanking the central graphic, dual text columns provide ample space for context, insights, or callouts, ensuring audiences grasp both the numbers and their strategic implications at a glance.
Built on master slides with fully editable vector shapes, you can recolor the bars, swap icons, adjust label positions, or resize the bottle outline in seconds to align with your brand palette. The flat-plus-gradient aesthetic, crisp sans-serif typography, and generous white space maintain a clean, professional look across PowerPoint and Google Slides. Whether you’re reporting market share, analyzing customer preferences, or comparing departmental KPIs, this template turns raw percentages into a visually compelling story.
Who is it for
Marketing analysts, sales directors, and product managers will leverage this slide to showcase performance metrics and comparative data. Consultants, financial planners, and operations teams can also adopt the bottle infographic to present resource breakdowns and trend analyses.
Other Uses
Beyond percentage bars, repurpose this template for timeline milestones, milestone achievement rates, or progress reports by adjusting the bar lengths and labels. Duplicate bars to expand your dataset, reverse the stacking order for alternative emphasis, or overlay icons to represent cost centers, user segments, or campaign channels.
Login to download this file

Item ID
SB01195
Related Templates

Medical Infographics Data Visualization Template for PowerPoint & Google Slides
Health
Circle Graph Data Visualization Template for PowerPoint & Google Slides
Circular
3D Cone Chart Data Visualization template for PowerPoint & Google Slides
Bar/Column
Gear Pie Diagram Data Visualization Template for PowerPoint & Google Slides
Pie/Donut
Leaf Infographic Data Visualization Template for PowerPoint & Google Slides
Infographics
KPI Dashboard Data Visualization Template for PowerPoint & Google Slides
Bar/Column
Professional Heatmap Data Visualization Template for PowerPoint & Google Slides
Infographics
Waffle Chart Data Visualization Template for PowerPoint & Google Slides
Comparison Chart
Free Stacked Column Chart Data Visualization Template for PowerPoint & Google Slides
Bar/Column
Free
Simple Bar Chart Data Visualization Template for PowerPoint & Google Slides
Bar/Column
XY Bubble Chart Data Visualization Template for PowerPoint & Google Slides
Comparison Chart
Waterfall Chart Data Visualization Template for PowerPoint & Google Slides
Comparison Chart
UK Counties Map Data Visualization Template for PowerPoint & Google Slides
World Maps
Segmented Scatter Chart Data Visualization Template for PowerPoint & Google Slides
Business Strategy
Free Big Data Network Visualization Template for PowerPoint & Google Slides
Circular
Free
Mobile Data Analysis Chart template for PowerPoint & Google Slides
Charts
Mobile User Data Analysis Infographic for PowerPoint & Google Slides
Process
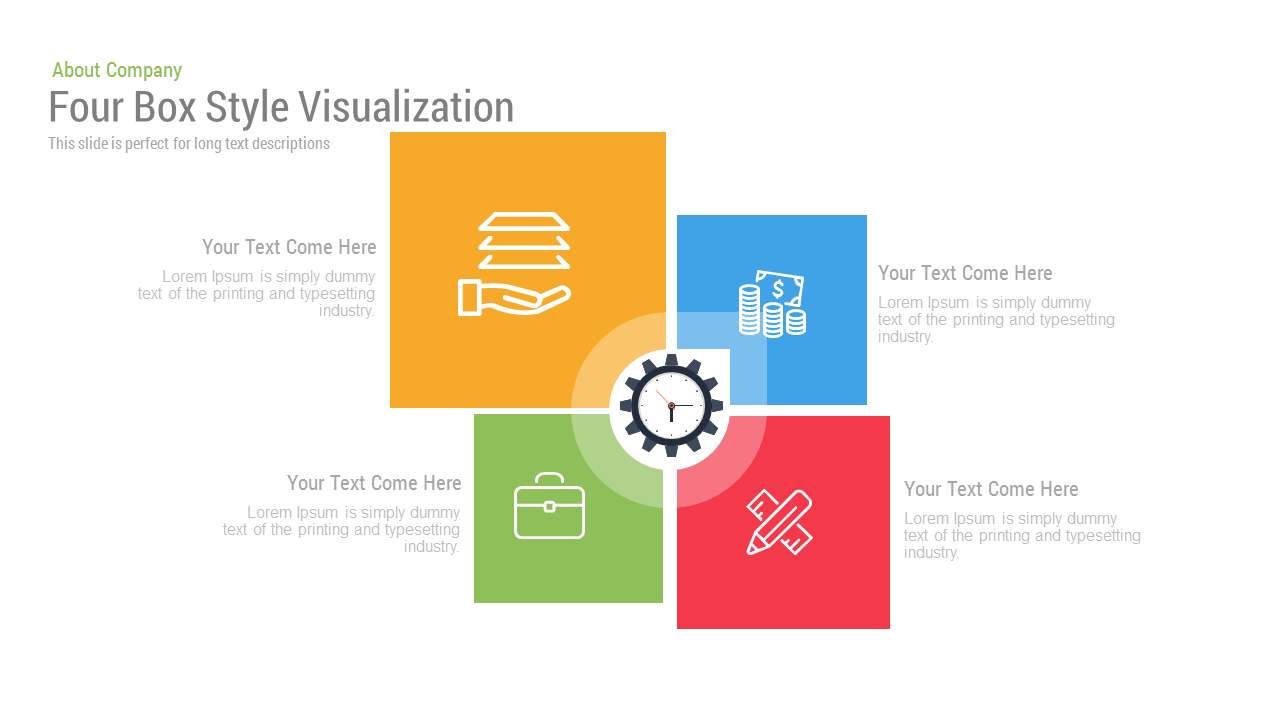
Free Four Box Style Visualization template for PowerPoint & Google Slides
Process
Free

Bold Diamond Risk Alert Visualization Template for PowerPoint & Google Slides
Risk Management
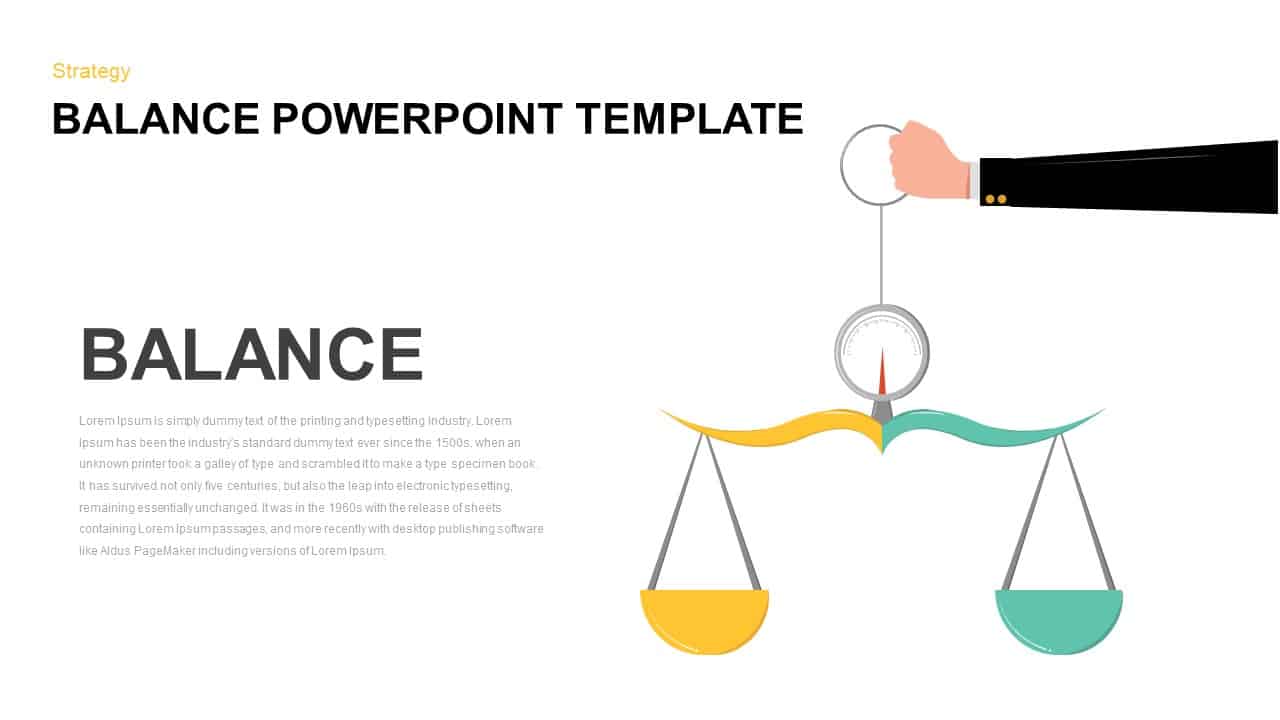
Balance Scale Visualization Infographic Template for PowerPoint & Google Slides
Comparison
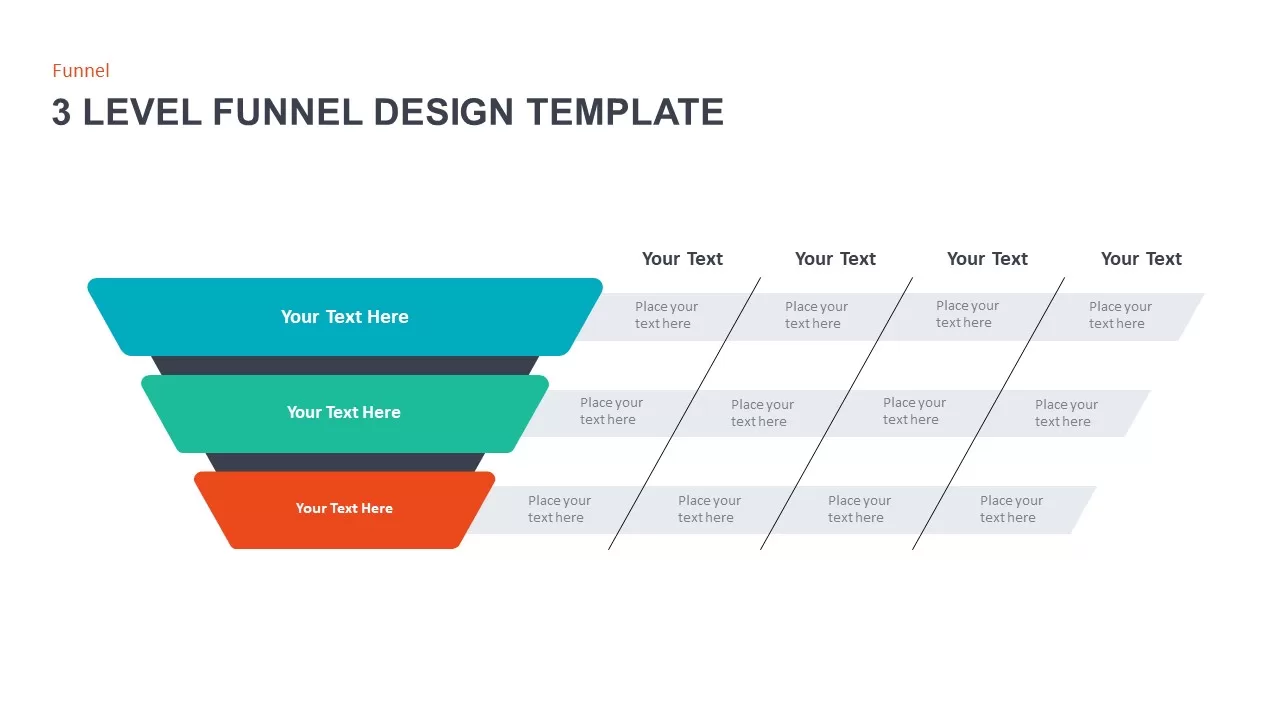
3 Level Funnel Design Visualization Template for PowerPoint & Google Slides
Funnel
Professional Risk Heat Map Visualization Template for PowerPoint & Google Slides
Risk Management
Growth Curve Line Chart Visualization Template for PowerPoint & Google Slides
Charts
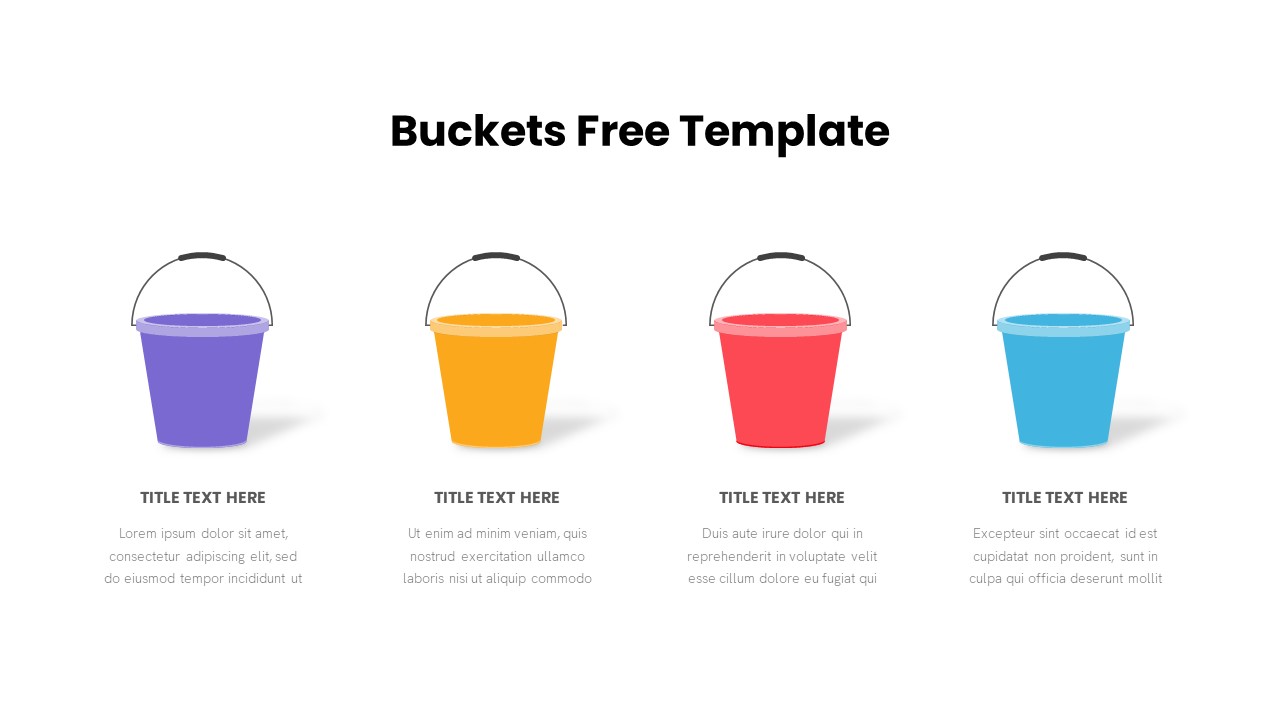
Free Bucket Process Visualization Template for PowerPoint & Google Slides
Process
Free
Animated Light Bulb Visualization Template for PowerPoint & Google Slides
Process
Progress Bar and Milestone Visualization Template for PowerPoint & Google Slides
Timeline
Dynamic Sunburst Chart Visualization Template for PowerPoint & Google Slides
Charts
Kentucky County Map Visualization Template for PowerPoint & Google Slides
World Maps
3D Cylinder Bar Chart Visualization Template for PowerPoint
Bar/Column
3D Bar Chart Data Infographics Template for PowerPoint & Google Slides
Bar/Column
4 Business Data Infographics Diagram for PowerPoint & Google Slides
Process
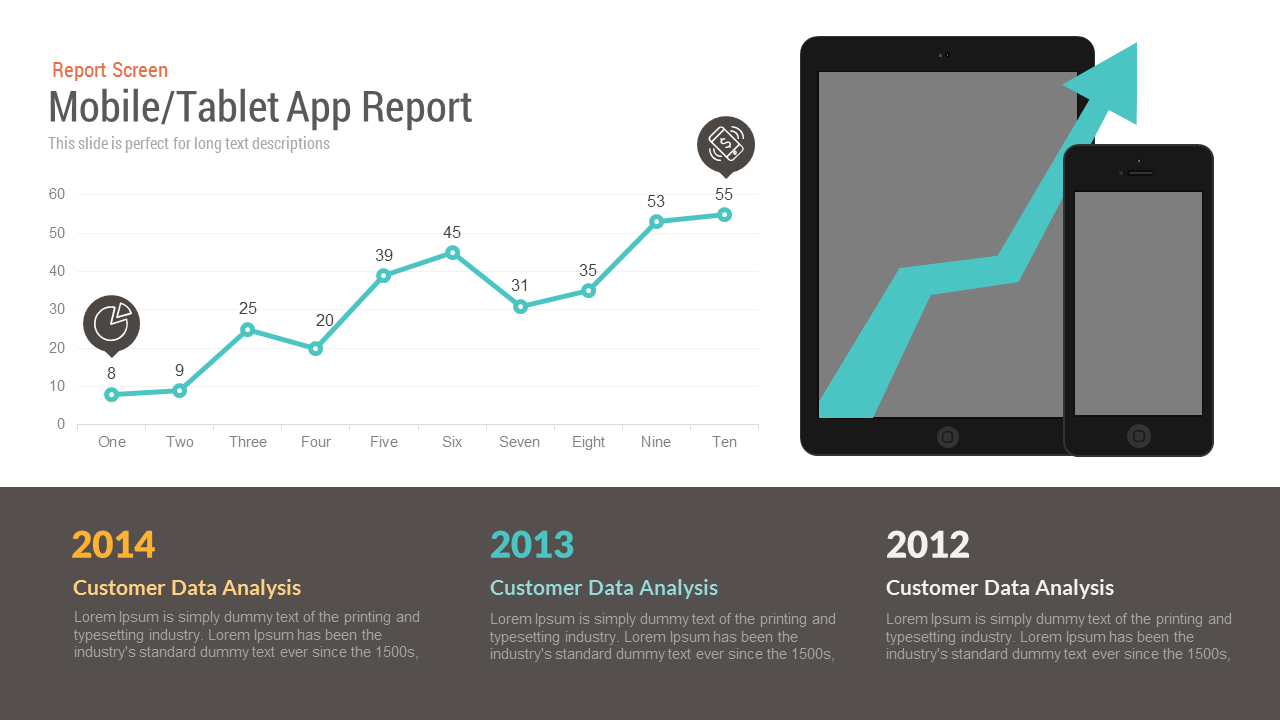
Mobile/Tablet App Report template for PowerPoint & Google Slides
Charts
Free
Mobile App Features template for PowerPoint & Google Slides
Technology
Mobile Usage Metrics template for PowerPoint & Google Slides
Comparison Chart

Clean Mobile Service Comparison Slide Template for PowerPoint & Google Slides
Comparison
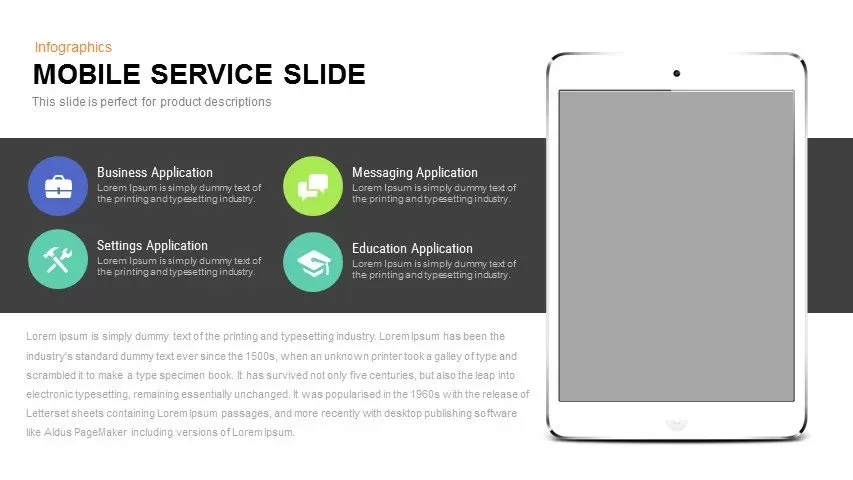
Mobile Service Features Infographic Template for PowerPoint & Google Slides
Process
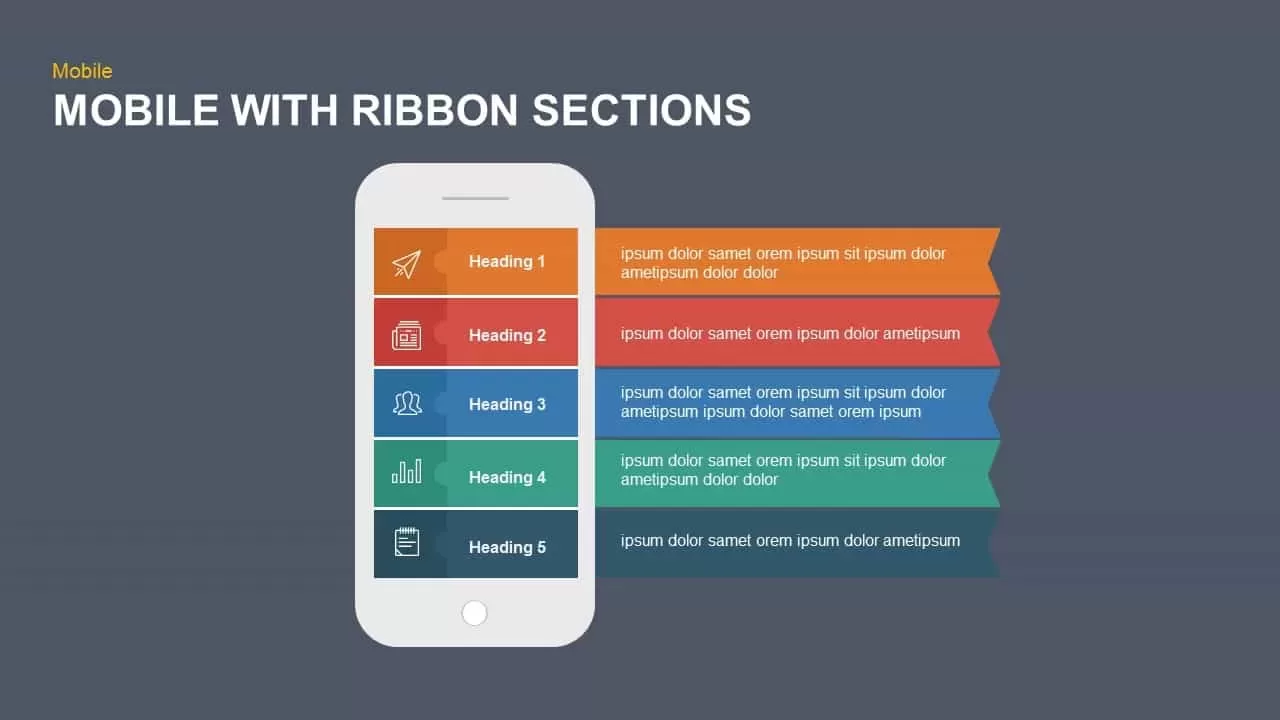
Mobile Ribbon Sections Diagram Template for PowerPoint & Google Slides
Process
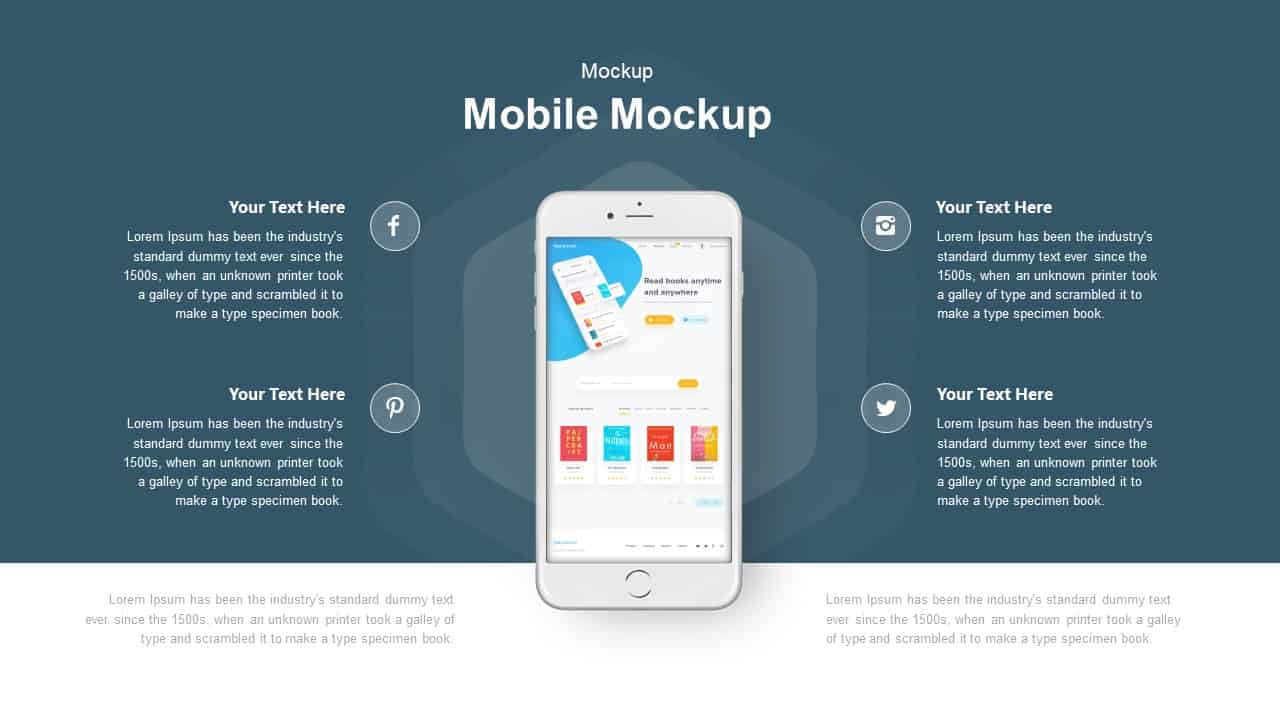
Mobile Mockup with Social Callouts Template for PowerPoint & Google Slides
Software Development
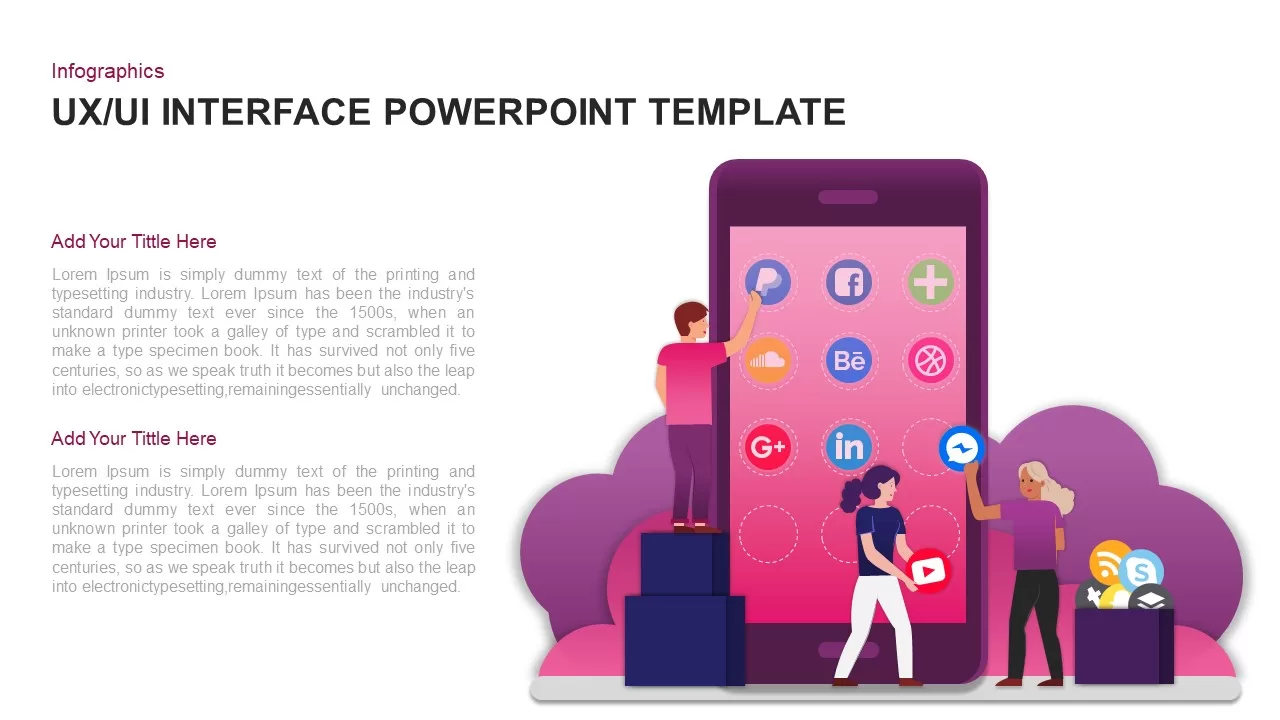
UX UI Mobile App Interface Infographic Template for PowerPoint & Google Slides
Software Development
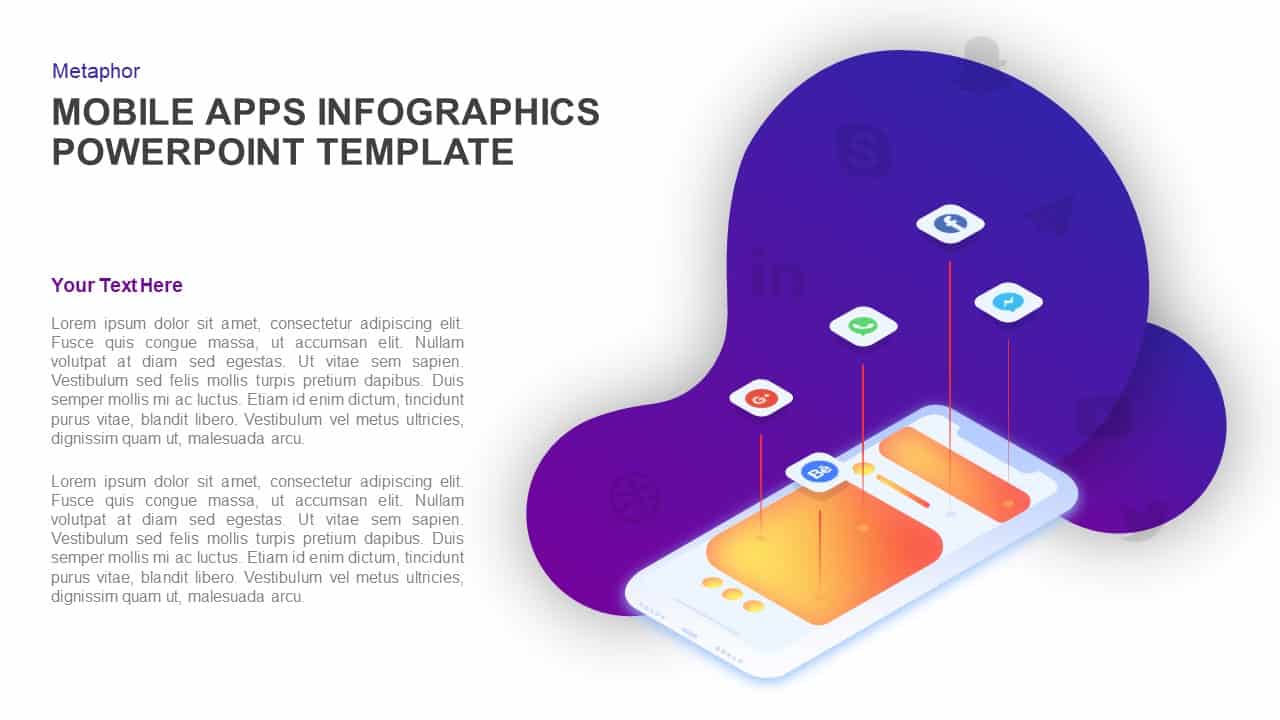
Mobile Apps Infographic Interface Template for PowerPoint & Google Slides
Software Development
Mobile App Social Media Metaphor Template for PowerPoint & Google Slides
Infographics
Professional Mobile App Showcase Deck Template for PowerPoint & Google Slides
Pitch Deck

Blue Circle Mobile Apps Presentation Template for PowerPoint & Google Slides
Information Technology
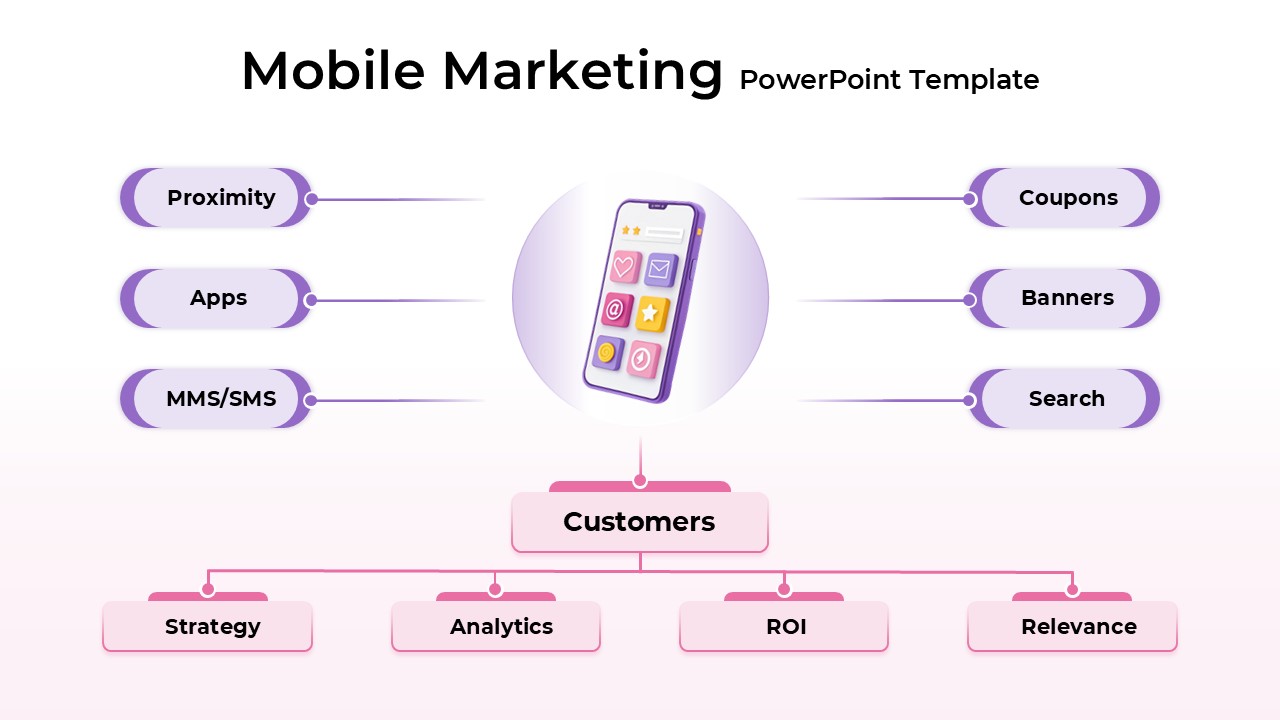
Mobile Marketing Strategy template for PowerPoint & Google Slides
Business
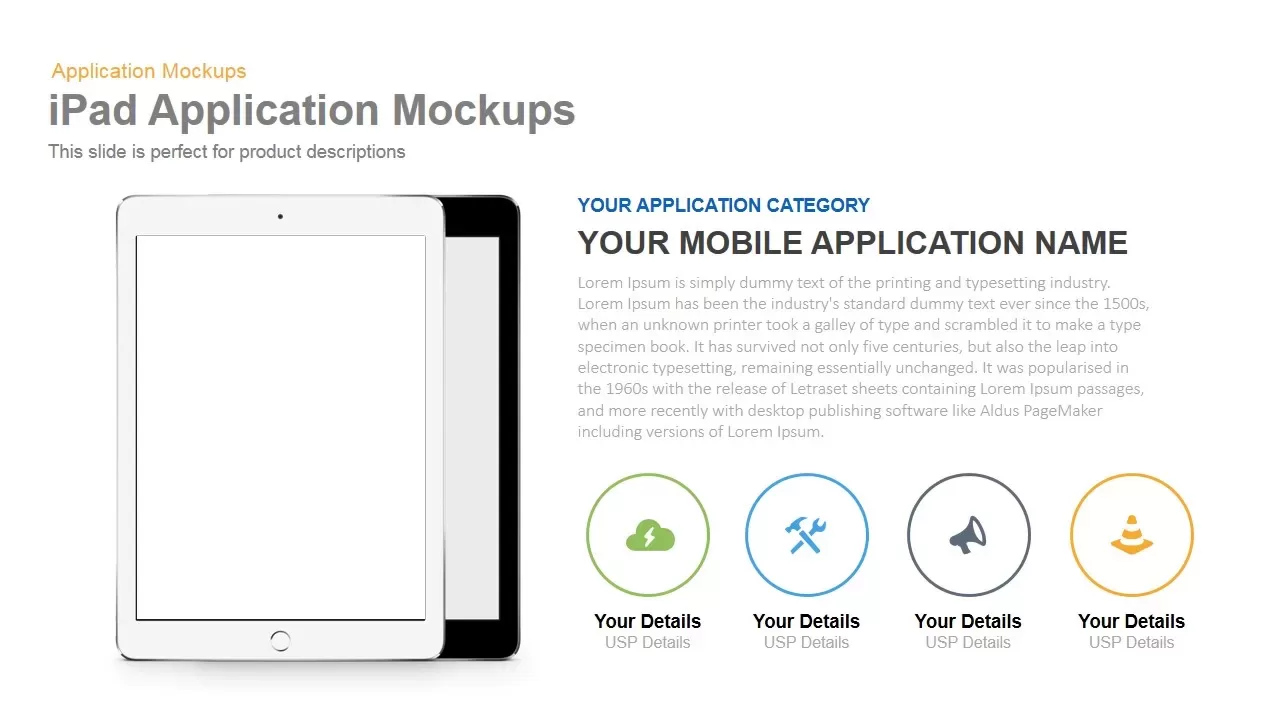
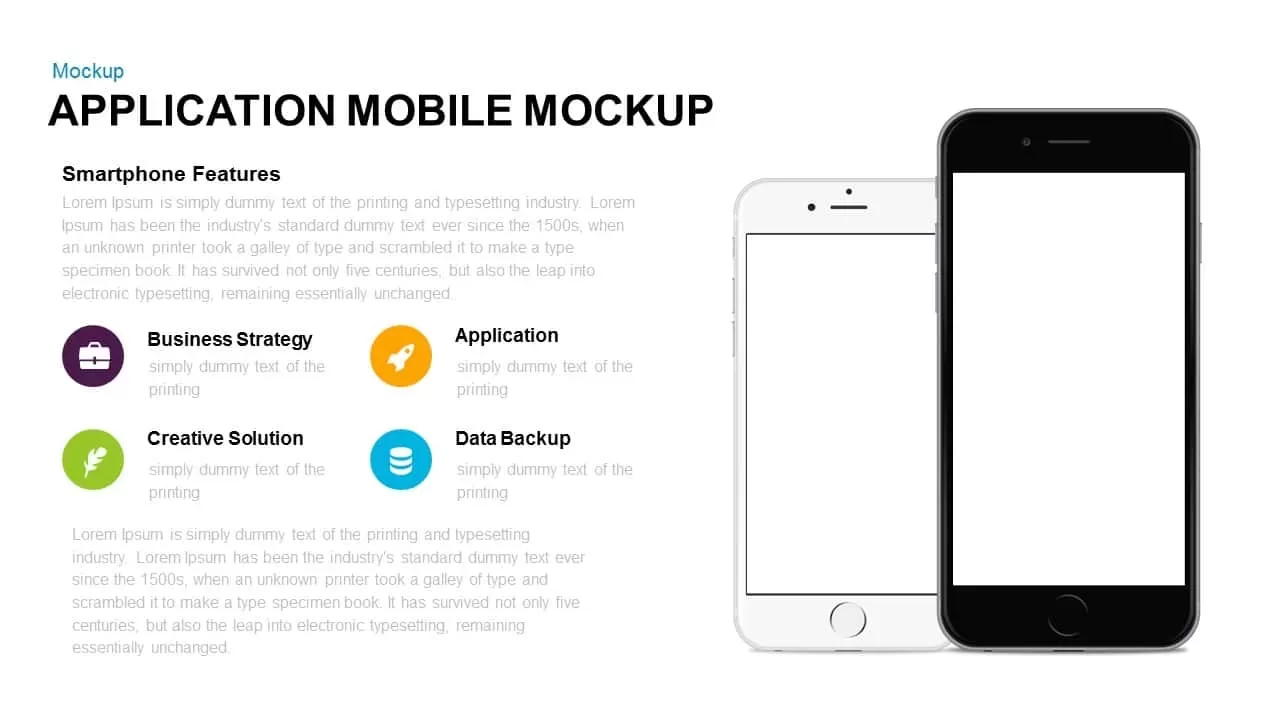
Mobile Application Features Mockup for PowerPoint & Google Slides
Graphics
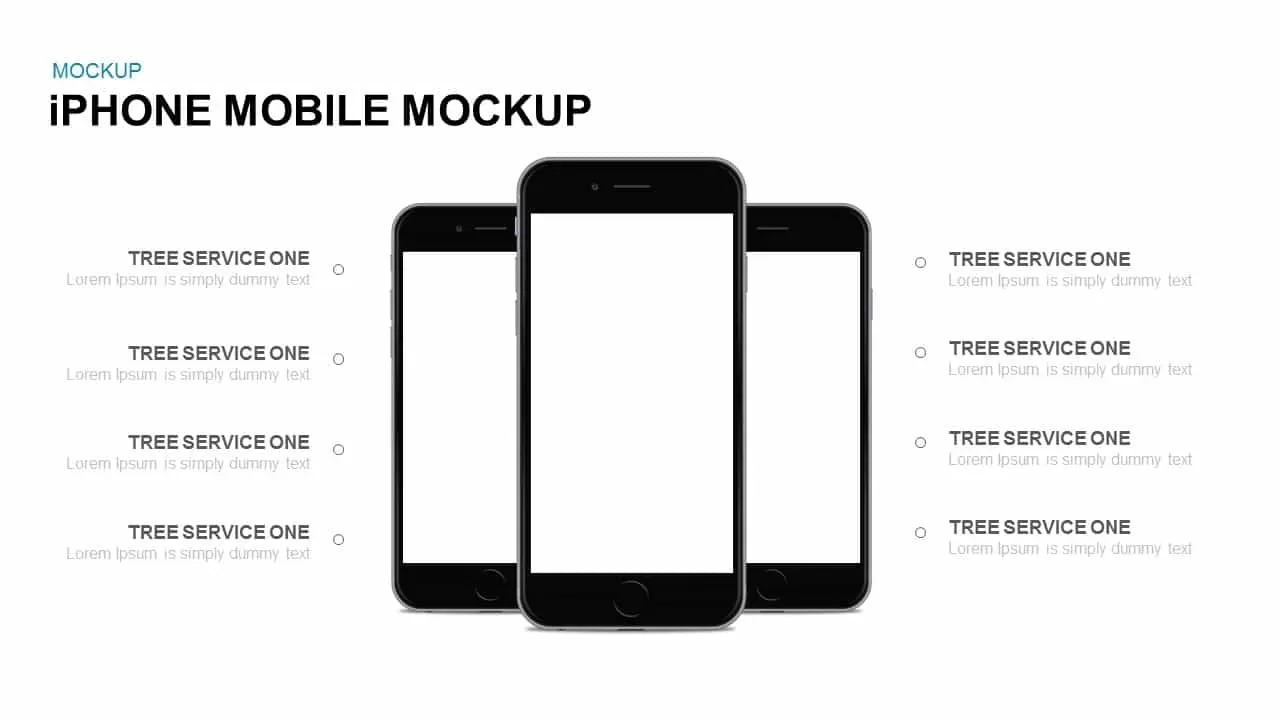
iPhone Mobile Mockup for PowerPoint & Google Slides
Graphics
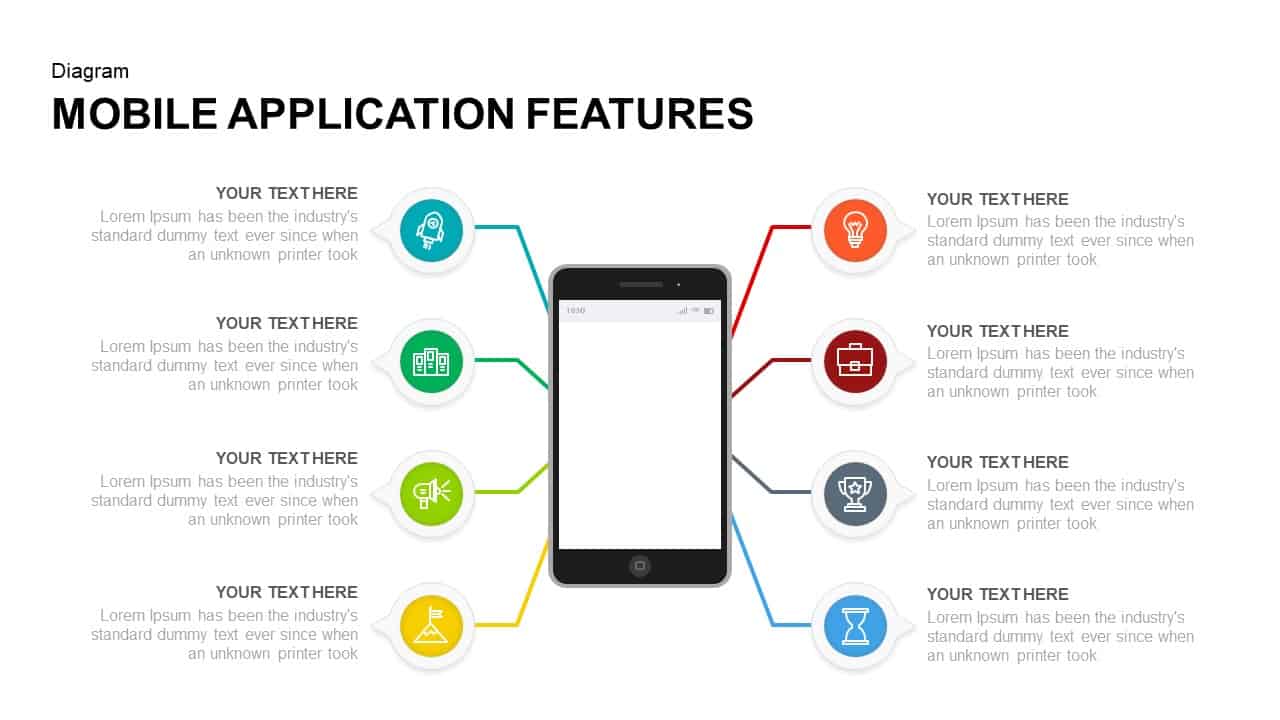
Mobile Application Features Diagram for PowerPoint & Google Slides
Technology
Data Science PowerPoint Presentation Template for PowerPoint & Google Slides
Pitch Deck
Data Center PowerPoint Template for PowerPoint & Google Slides
Information Technology

Creative data chart analytics template for PowerPoint & Google Slides
Charts
World Map Data template for PowerPoint & Google Slides
World Maps
Circle Chart Data template for PowerPoint & Google Slides
Pie/Donut
Creative Data Analysis Bar Chart template for PowerPoint & Google Slides
Bar/Column
Interactive US Population Data Map Slide Template for PowerPoint & Google Slides
World Maps
3D Stacked Infographic Layers Data Template for PowerPoint & Google Slides
Pyramid
Pencil Bar Chart Data Analysis Template for PowerPoint & Google Slides
Bar/Column
Creative Lab Beakers Data Infographic template for PowerPoint & Google Slides
Infographics
Dynamic Data Dashboard Infographic Template for PowerPoint & Google Slides
Bar/Column
Data Analytics Dashboard Design template for PowerPoint & Google Slides
Bar/Column
Data-Driven Marketing Cycle Diagram Template for PowerPoint & Google Slides
Customer Journey
Tornado Chart Data Comparison Slide Template for PowerPoint & Google Slides
Bar/Column
Bottle Data Percentage Infographic Template for PowerPoint & Google Slides
Infographics
Immigration Data Dashboard Template for PowerPoint & Google Slides
Bar/Column
Data Management and Analytics Diagram Template for PowerPoint & Google Slides
Circular
Data Migration Life Cycle Curved Diagram Template for PowerPoint & Google Slides
Process
DIKW Data to Wisdom Pyramid Model Template for PowerPoint & Google Slides
Pyramid
Data-driven GDP Growth Infographic Pack Template for PowerPoint & Google Slides
Infographics
KPI Dashboard Data Overview Slide Template for PowerPoint & Google Slides
Bar/Column
North America Data Map Callouts Template for PowerPoint & Google Slides
World Maps
Donut Chart Data Breakdown template for PowerPoint & Google Slides
Pie/Donut

Modern Big Data Infographic Deck Template for PowerPoint & Google Slides
Decks
Layered Data Governance Maturity Model Template for PowerPoint & Google Slides
Process
Simple Area Chart Data Trends Analysis Template for PowerPoint & Google Slides
Comparison Chart
Data Over Time Line Chart template for PowerPoint & Google Slides
Charts
Multipurpose Spline Chart Data Trend Template for PowerPoint & Google Slides
Bar/Column
Editable Africa Map Infographic Data Template for PowerPoint & Google Slides
World Maps
Advanced Data Flow Diagram Pack Template for PowerPoint & Google Slides
Flow Charts
Interactive Jump Line Data Chart Template for PowerPoint & Google Slides
Comparison Chart
Syria Regional Data Map Infographic Template for PowerPoint & Google Slides
World Maps
Data Analysis Bar Chart with Insights Template for PowerPoint & Google Slides
Bar/Column
Free
Data Lake Hub-and-Spoke Diagram Template for PowerPoint & Google Slides
Cloud Computing
ETL Data Pipeline Workflow Diagram Template for PowerPoint & Google Slides
Process
Data Privacy template for PowerPoint & Google Slides
Information Technology
Data Protection Strategies template for PowerPoint & Google Slides
Information Technology
Comprehensive Data & AI Capability Model Template for PowerPoint & Google Slides
AI
Data Flywheel Strategy template for PowerPoint & Google Slides
Business
Data Privacy and Compliance in ML template for PowerPoint & Google Slides
Technology
Data-Driven AI in Insurance Infographic Template for PowerPoint & Google Slides
Circular
AI and Data Ecosystem Map Template for PowerPoint & Google Slides
AI
Data Studio Insights template for PowerPoint & Google Slides
Business Report
Data Protection & Encryption in the Cloud Overview template for PowerPoint & Google Slides
Cloud Computing
Customer Data Platform Workflow Diagram Template for PowerPoint & Google Slides
Information Technology
Data-Driven Marketing Lifecycle Diagram Template for PowerPoint & Google Slides
Process
Data-Driven Decision Making overview template for PowerPoint & Google Slides
Business
First Party Data Overview Template for PowerPoint & Google Slides
Business
Data Governance Roles Pyramid Diagram Template for PowerPoint & Google Slides
Pyramid
Business Data Table Template for PowerPoint & Google Slides
Table
Colorful Business Data Comparison Table Template for PowerPoint & Google Slides
Table
Six Column Data Table Template for PowerPoint & Google Slides
Table
Data Gap Analysis Template for PowerPoint & Google Slides
Business