Materiality Assessment Matrix Diagram Template for PowerPoint & Google Slides

Description
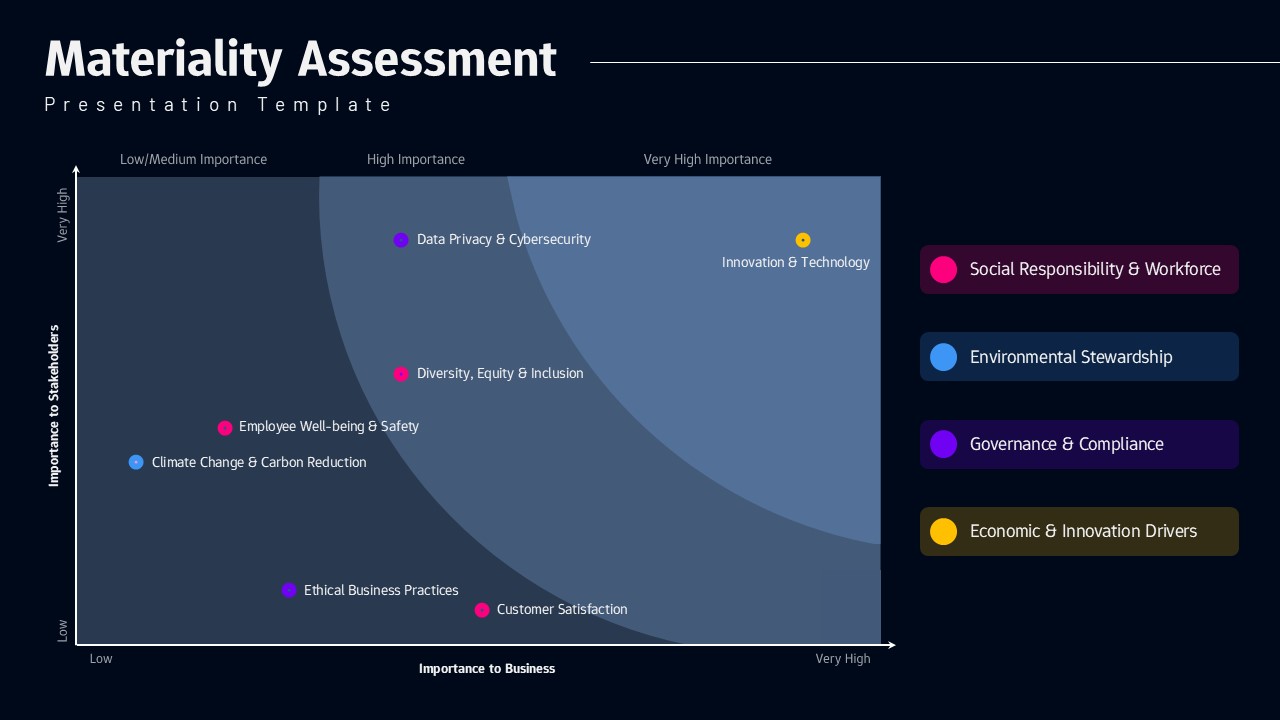
Present your ESG priorities with clarity using this professionally designed Materiality Assessment matrix slide. Built as a two-axis framework, the layout maps key topics according to Importance to Stakeholders (vertical axis) and Importance to Business (horizontal axis). The visual quadrant design helps organizations identify and communicate which sustainability issues require immediate focus and strategic investment.
Color-coded markers categorize themes such as Social Responsibility & Workforce, Environmental Stewardship, Governance & Compliance, and Economic & Innovation Drivers. Topics like Data Privacy & Cybersecurity, Innovation & Technology, Diversity, Equity & Inclusion, and Climate Change & Carbon Reduction are clearly positioned to reflect their relative impact. The gradient background subtly emphasizes high and very high priority zones, guiding executive discussions and board-level decision-making. Fully editable text labels, data points, and color elements allow you to tailor the matrix to your own stakeholder surveys and materiality analyses. Optimized for both PowerPoint and Google Slides, this slide maintains structure and clarity across devices and presentation formats.
Who is it for
This slide is ideal for sustainability leaders, ESG consultants, corporate strategy teams, compliance officers, and investor relations professionals presenting materiality findings to executives, boards, or external stakeholders.
Other Uses
Beyond ESG reporting, repurpose this matrix for risk assessment workshops, strategic priority mapping, customer insight analysis, or innovation roadmapping sessions. It also works effectively for annual reports, CSR presentations, and integrated business strategy discussions.
Login to download this file

Item ID
SB05724Designed By
Nithya
Related Templates

Risk Assessment Heatmap Matrix Slide Template for PowerPoint & Google Slides
Comparison Chart
IT Gap Analysis Assessment Matrix Template for PowerPoint & Google Slides
Information Technology
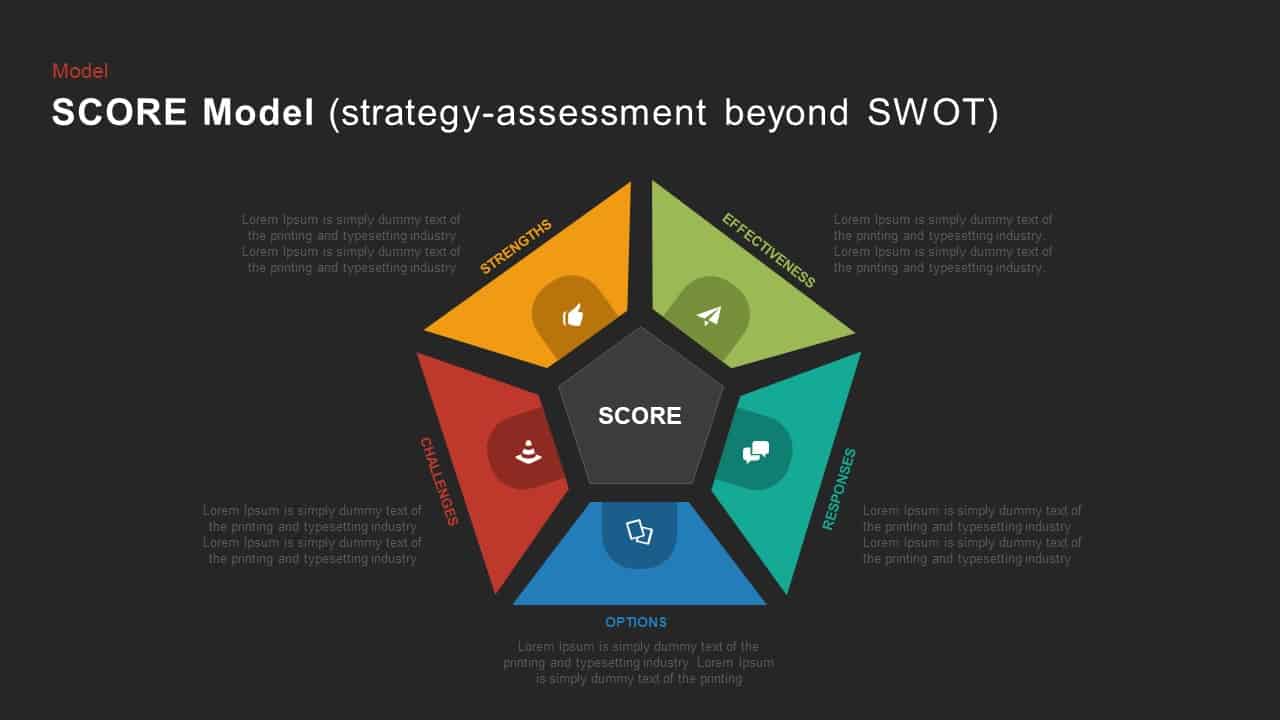
SCORE Model Pentagon Assessment Diagram Template for PowerPoint & Google Slides
Circular
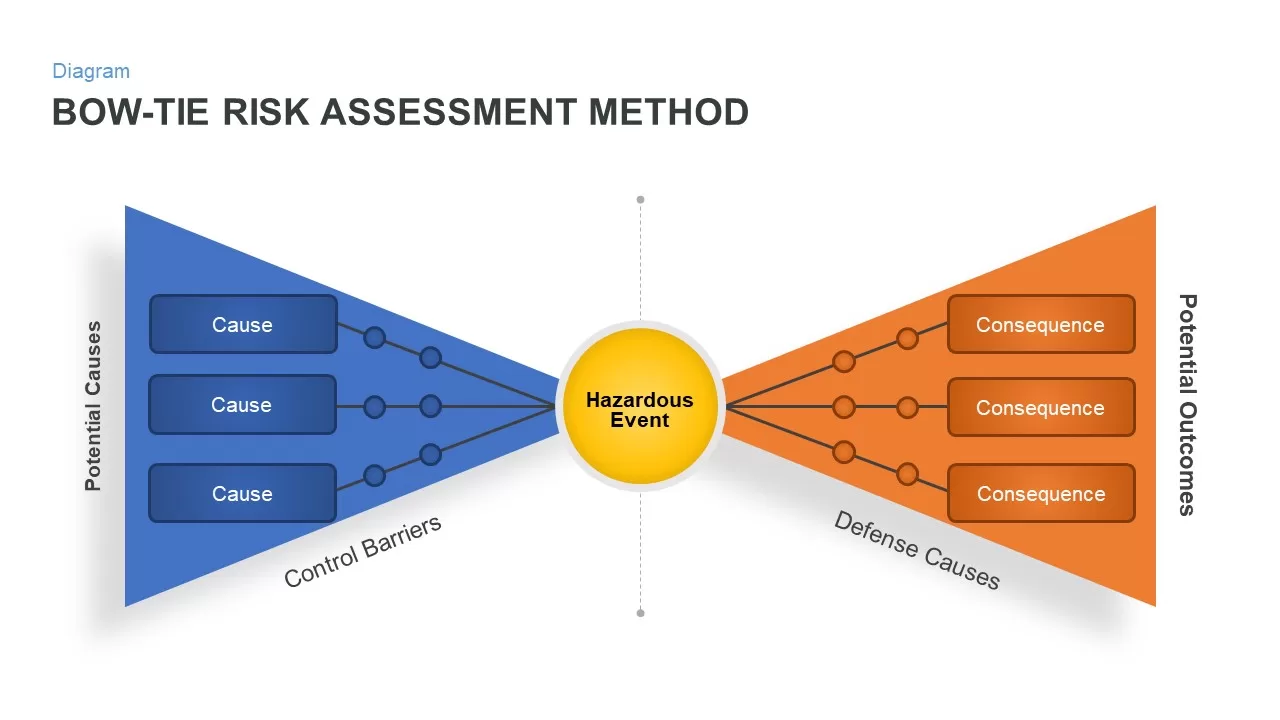
Bow-Tie Risk Assessment Diagram Template for PowerPoint & Google Slides
Risk Management
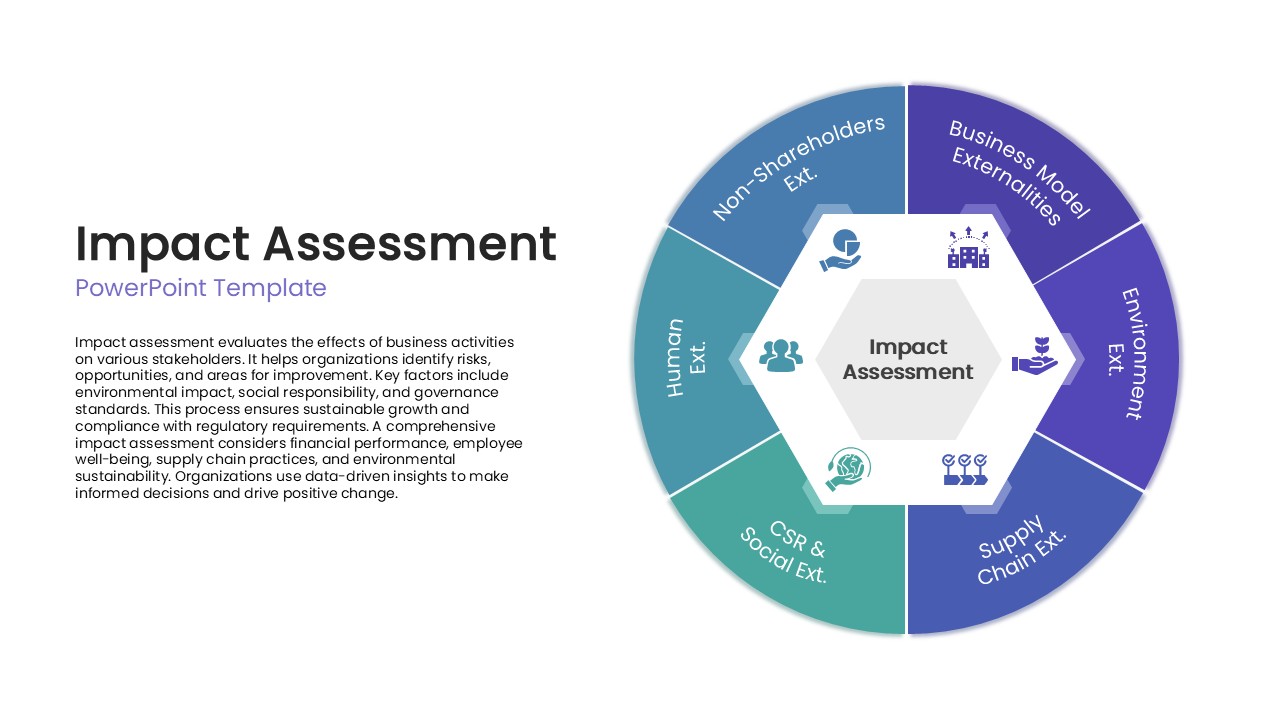
Impact Assessment Circular Diagram Template for PowerPoint & Google Slides
Circular
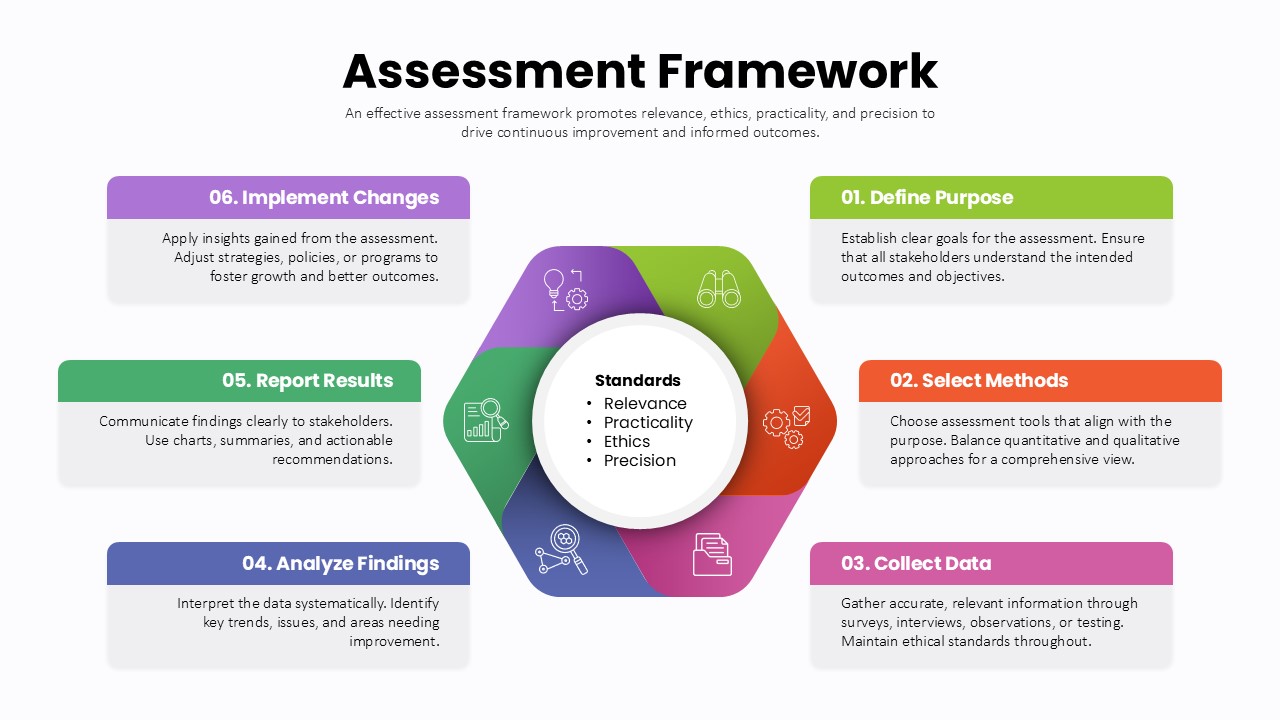
Assessment Framework Circular Diagram Template for PowerPoint & Google Slides
Circular
Heat Map Risk Assessment Presentation Template for PowerPoint & Google Slides
Risk Management
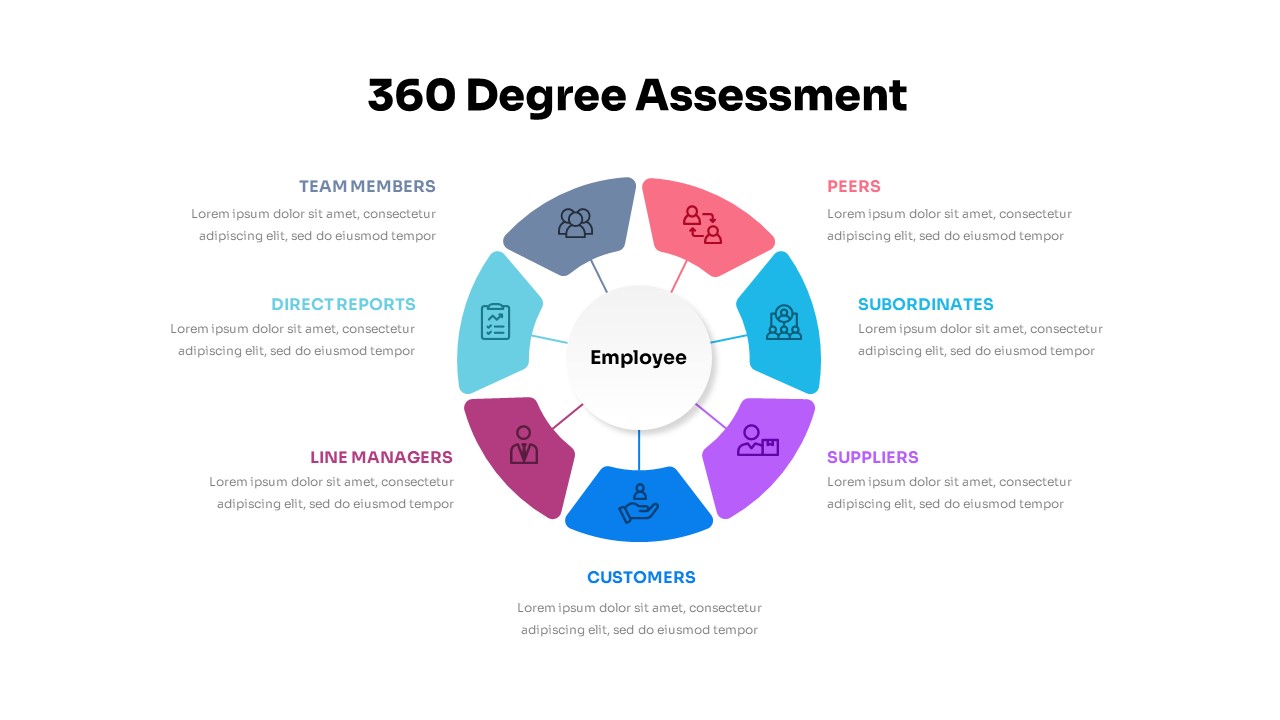
360 Degree Assessment Template for PowerPoint & Google Slides
Employee Performance
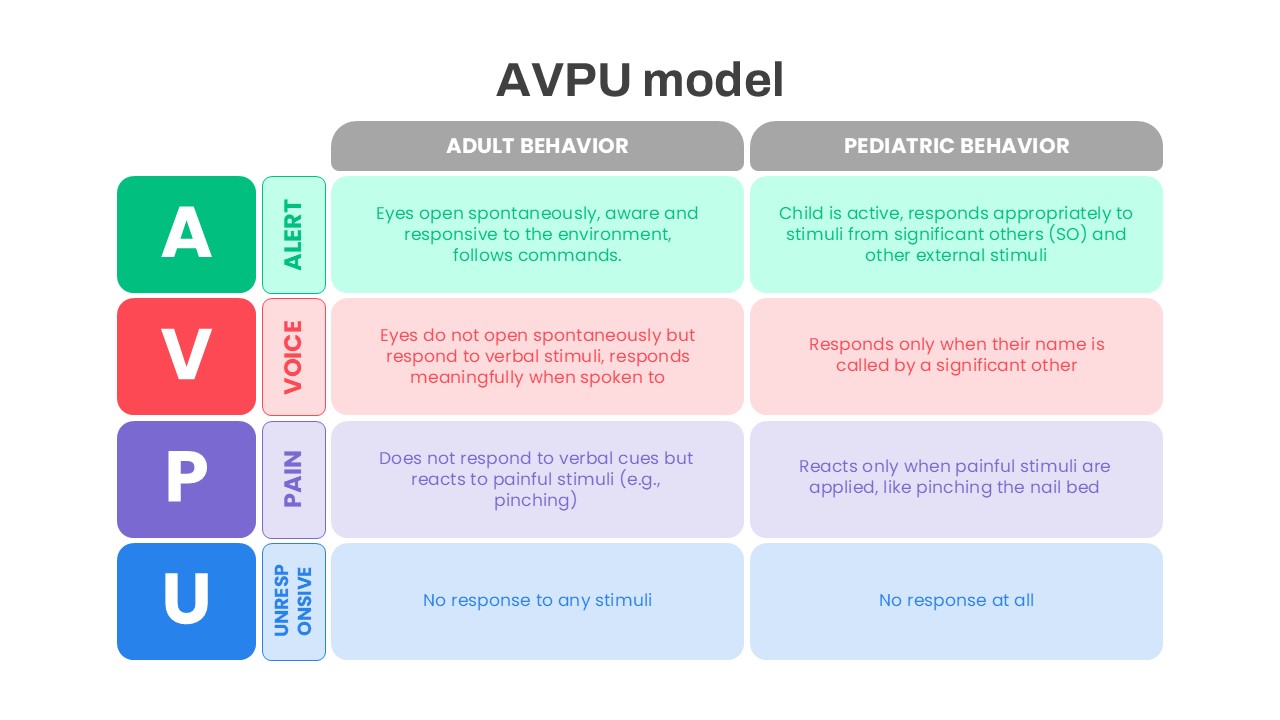
AVPU Model Behavior Assessment Template for PowerPoint & Google Slides
Health
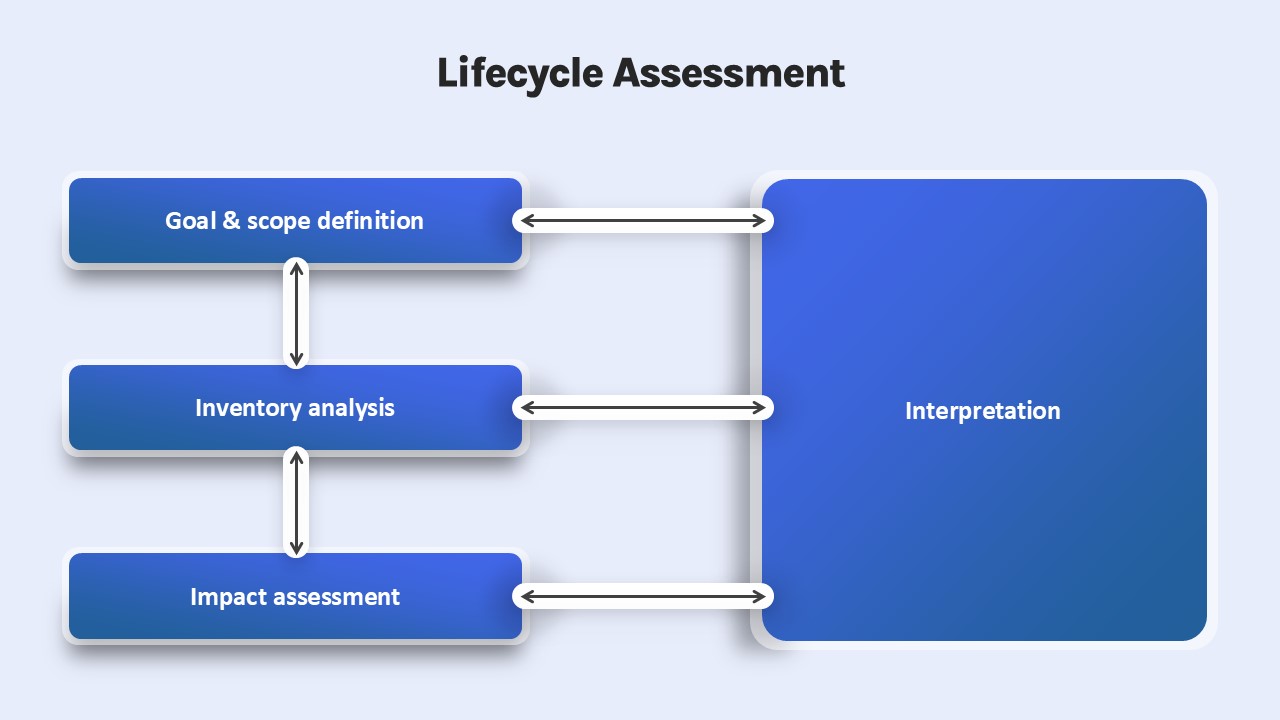
Lifecycle Assessment template for PowerPoint & Google Slides
Process
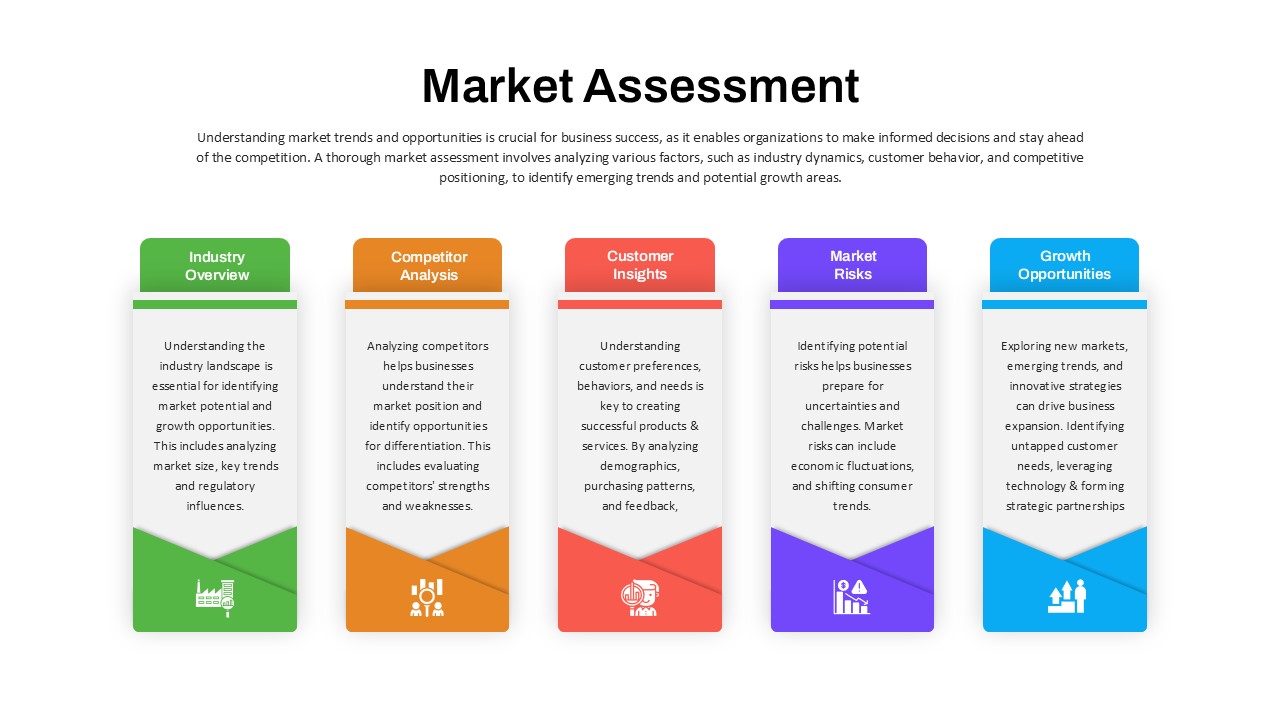
Market Assessment Infographic Slide Template for PowerPoint & Google Slides
Process
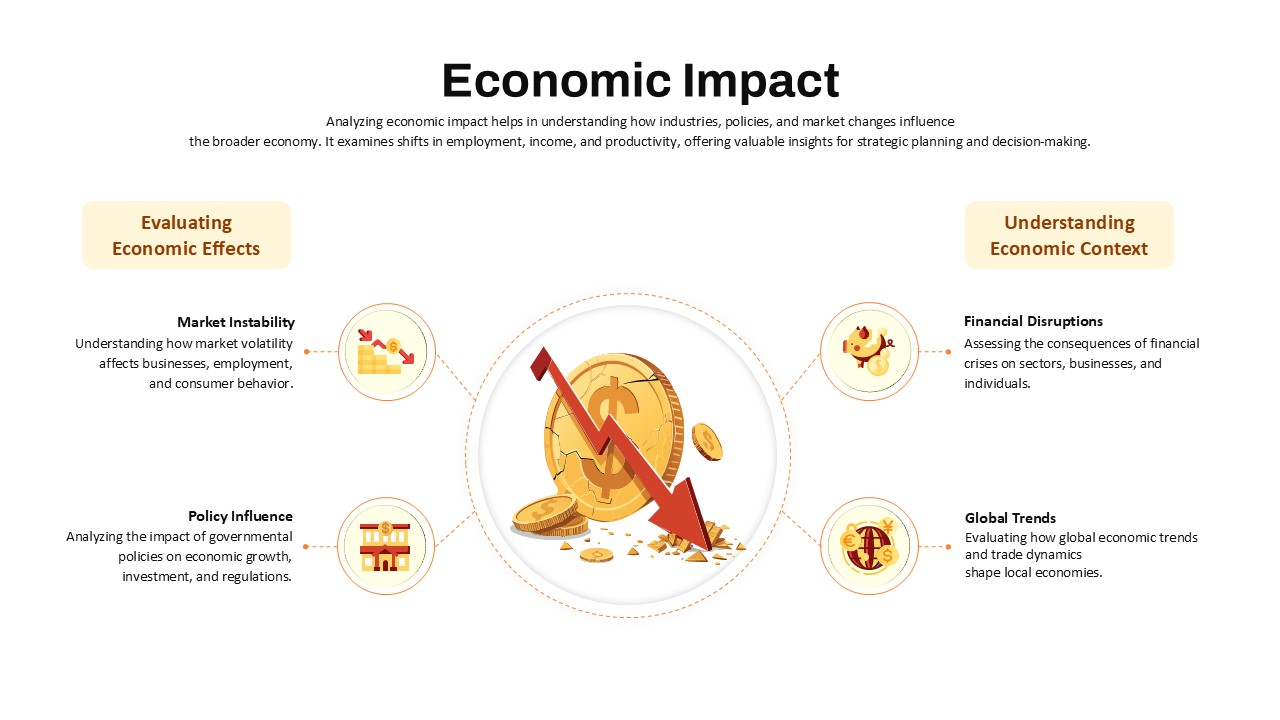
Economic Impact Assessment template for PowerPoint & Google Slides
Business Report
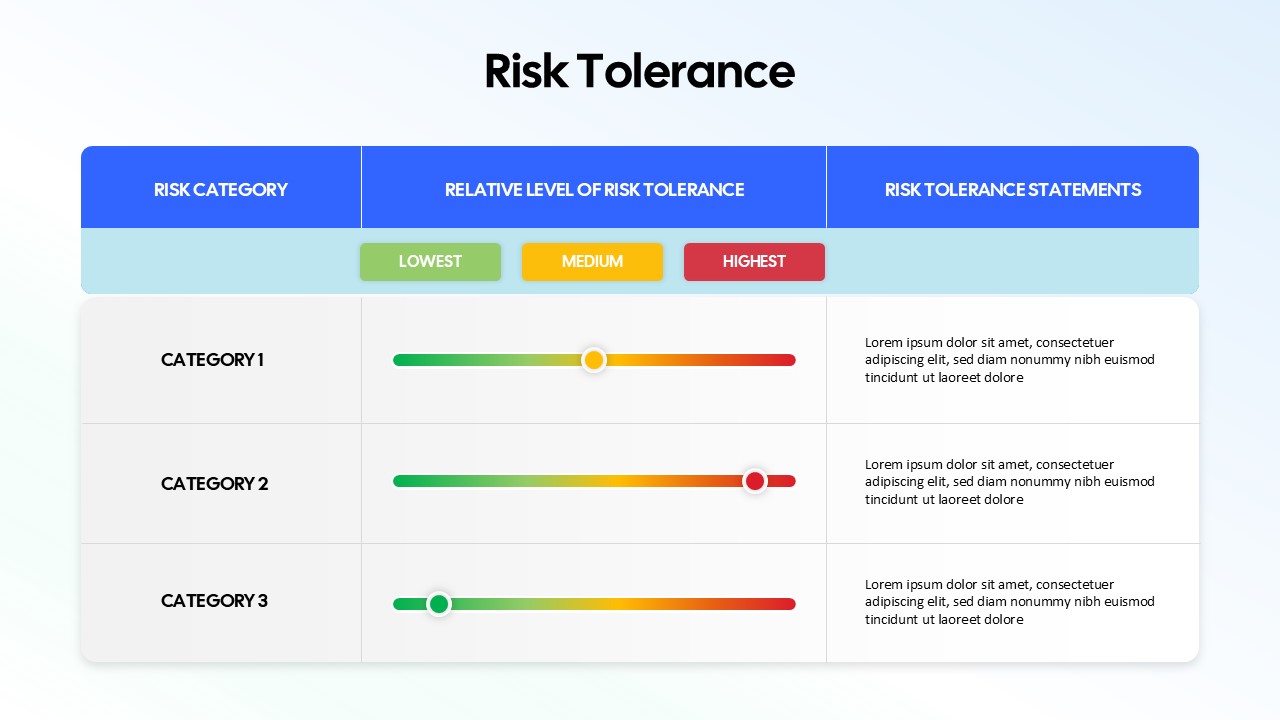
Risk Tolerance Assessment Sliders Template for PowerPoint & Google Slides
Finance
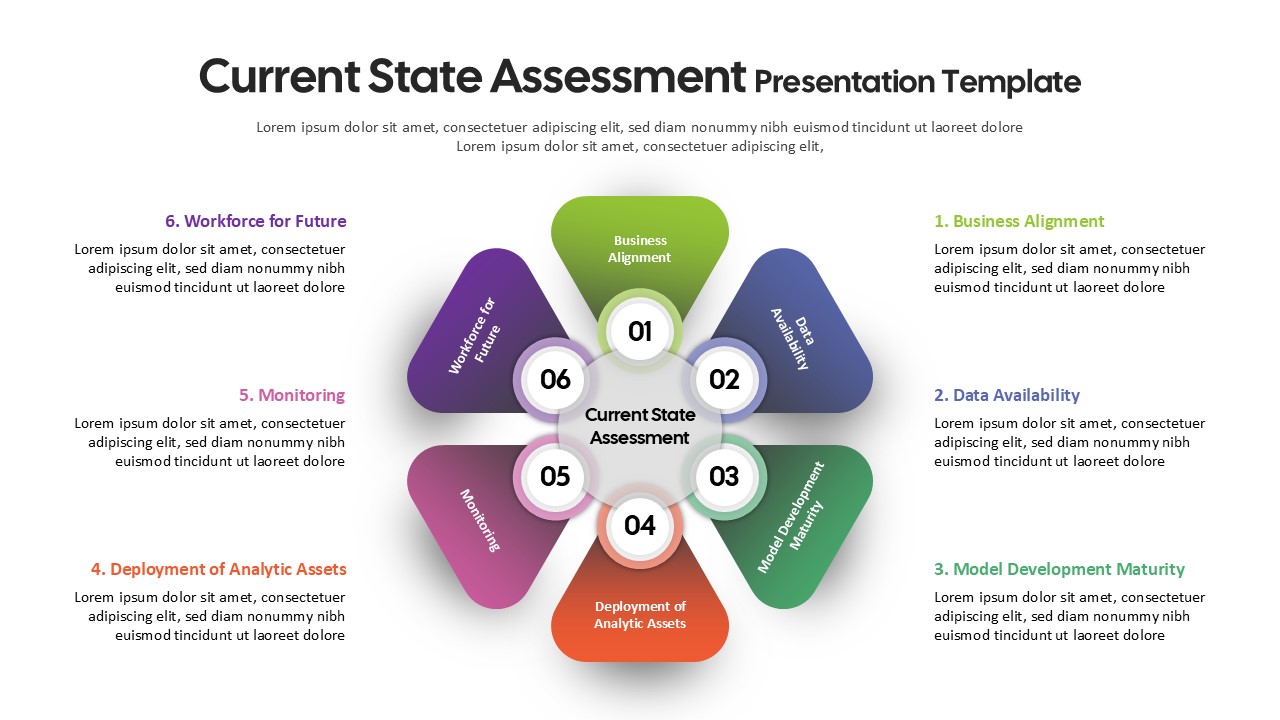
Current State Assessment Template for PowerPoint & Google Slides
Gap
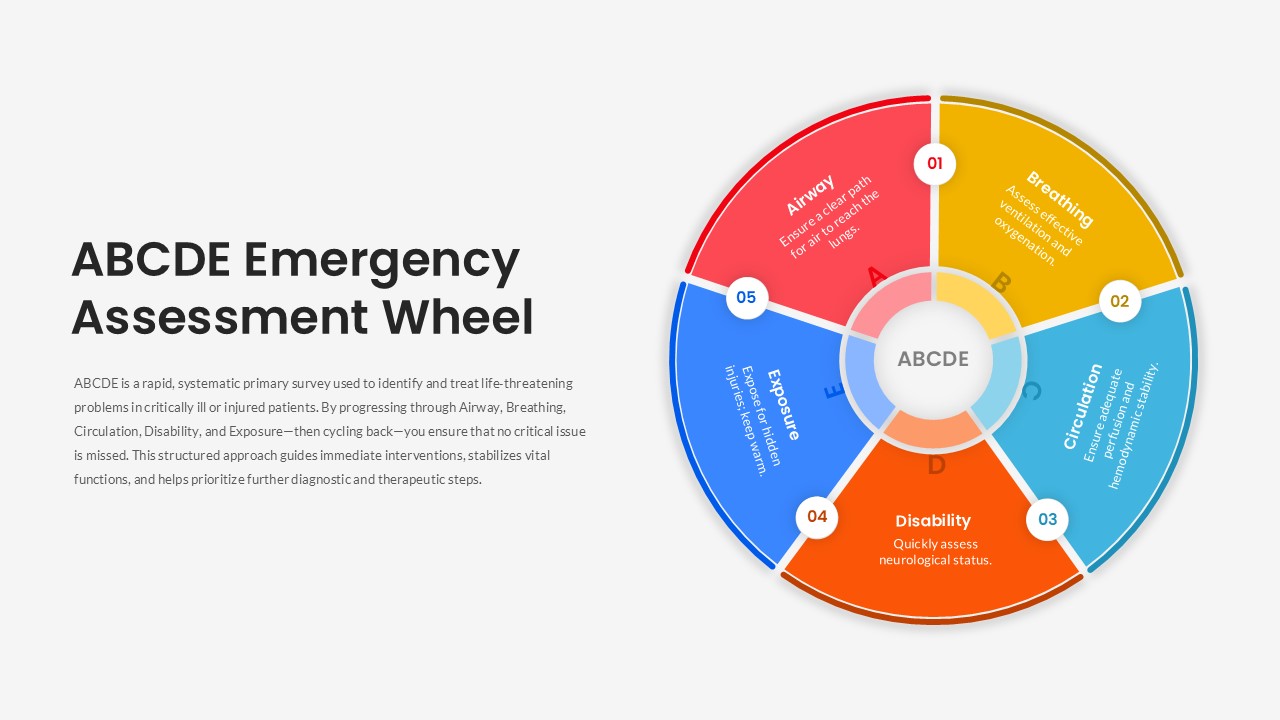
ABCDE Emergency Assessment Wheel Template for PowerPoint & Google Slides
Circular

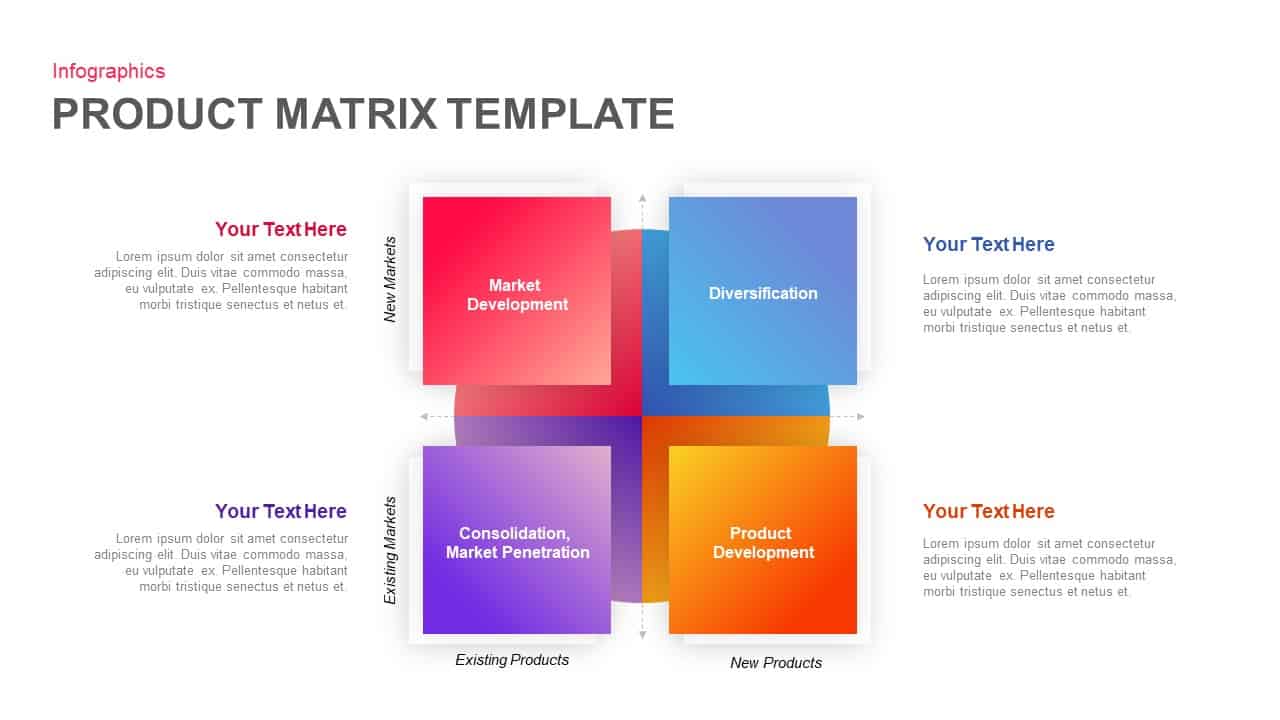
Ansoff Growth Matrix Strategy Diagram Template for PowerPoint & Google Slides
Business Strategy
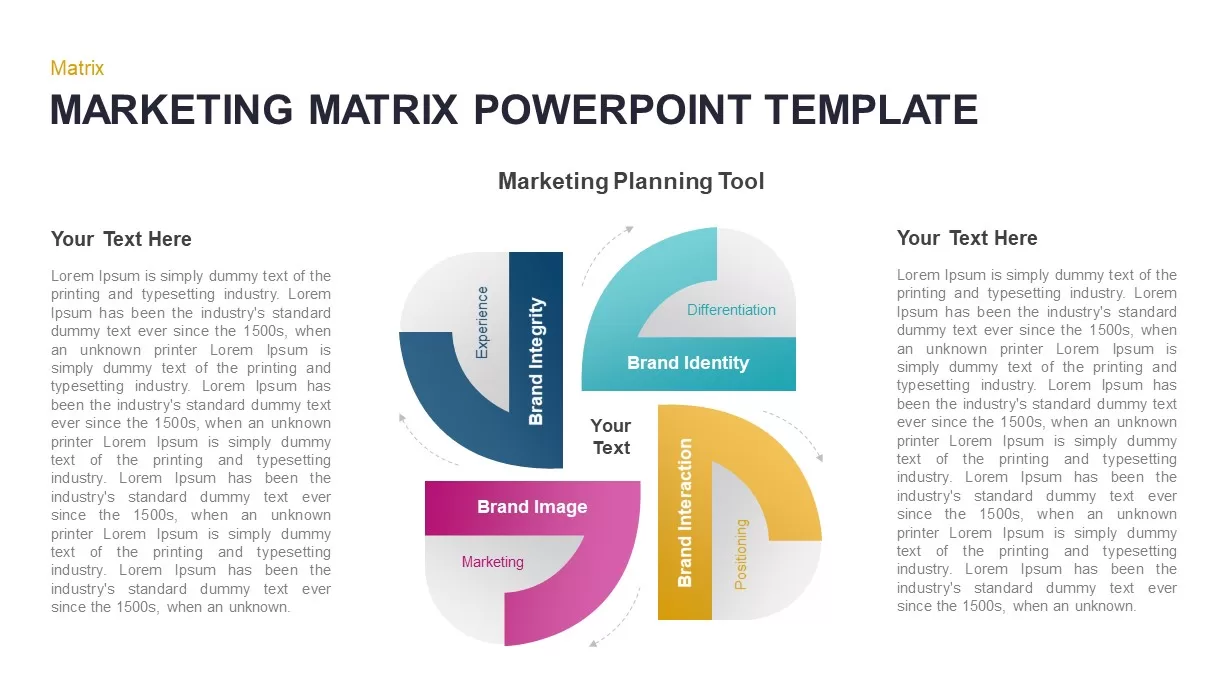
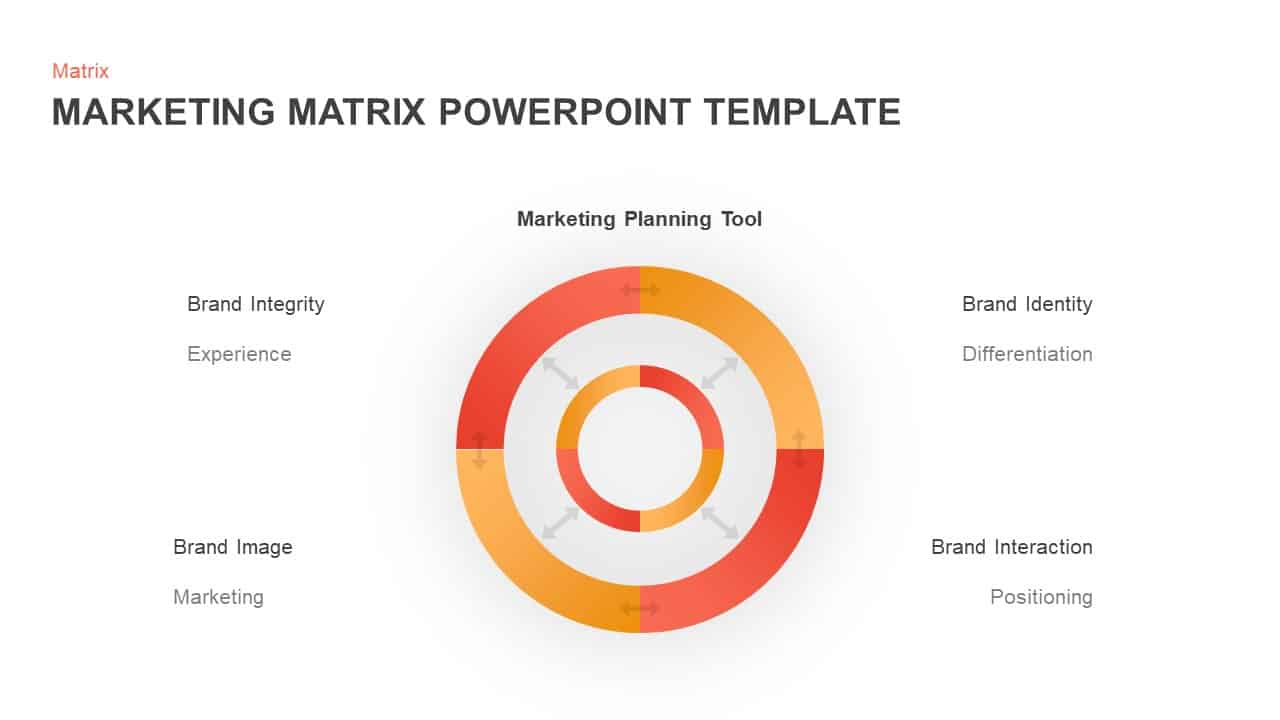
Marketing Matrix Brand Quadrant Diagram Template for PowerPoint & Google Slides
Process
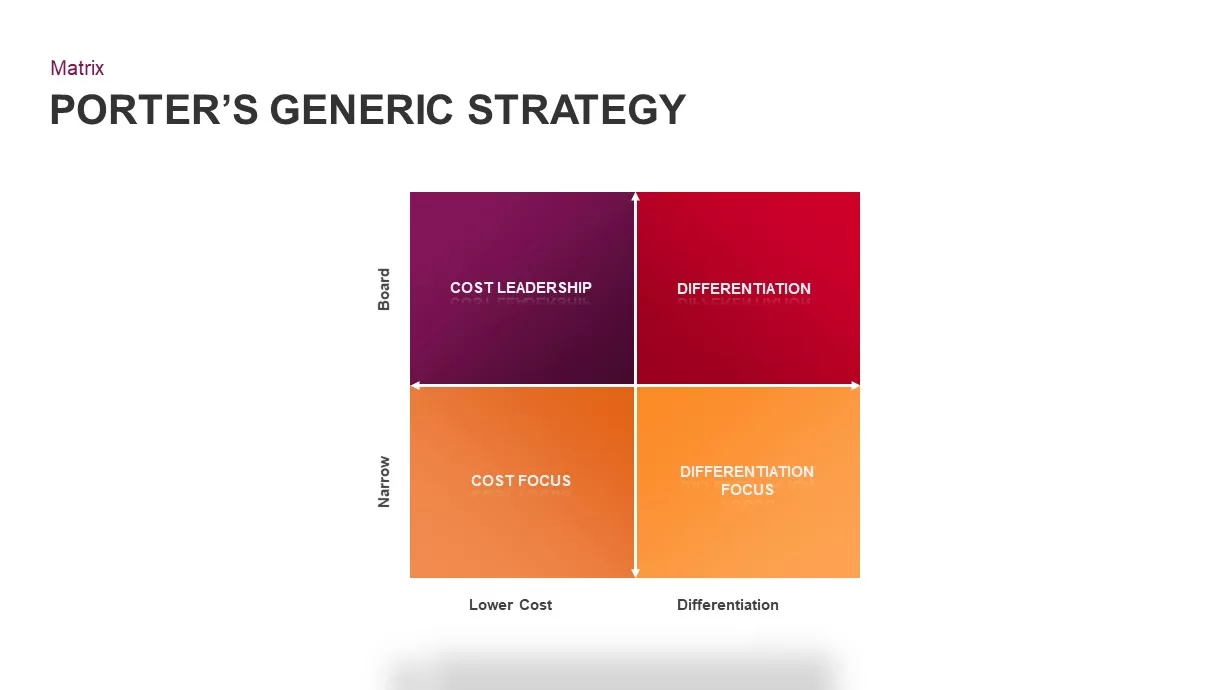
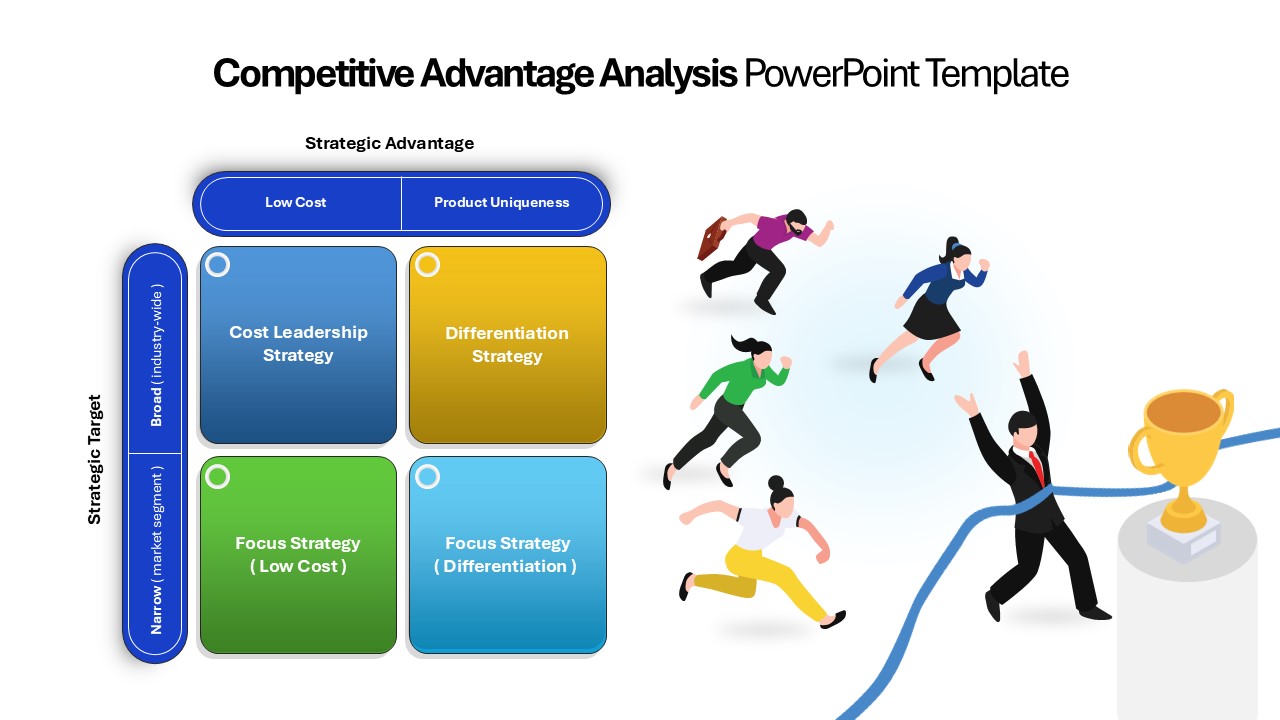
Porter’s Generic Strategy Matrix Diagram Template for PowerPoint & Google Slides
Competitor Analysis
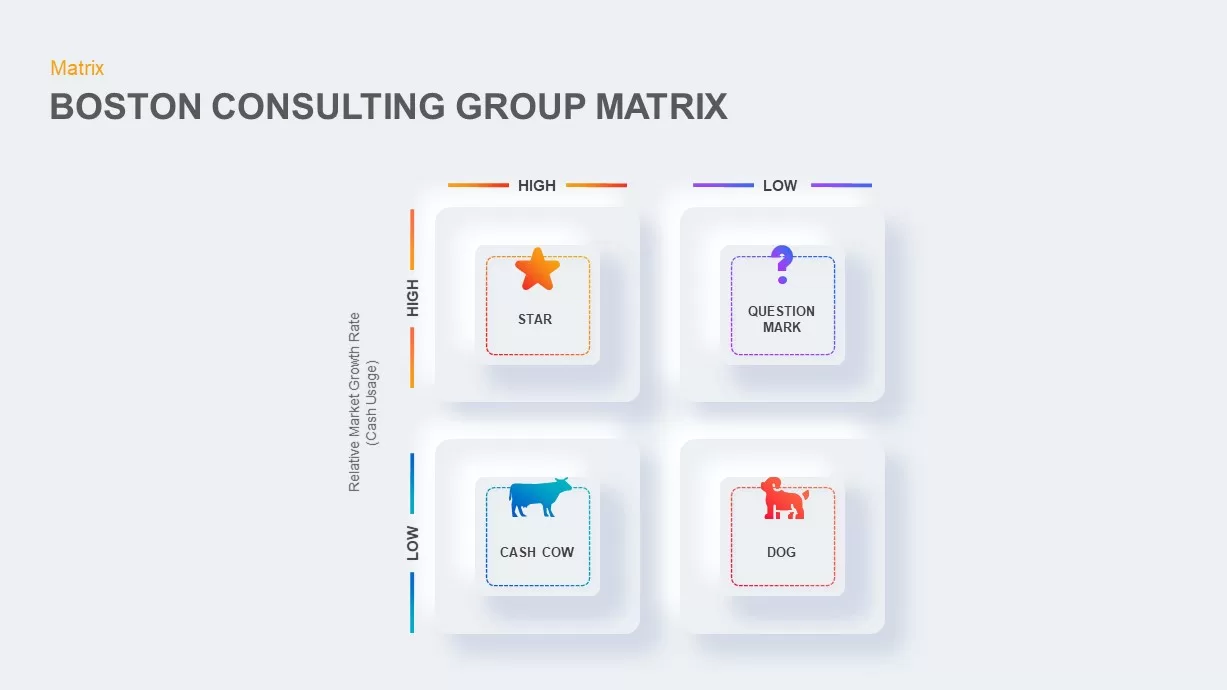
Boston Consulting Group Matrix Diagram Template for PowerPoint & Google Slides
BCG
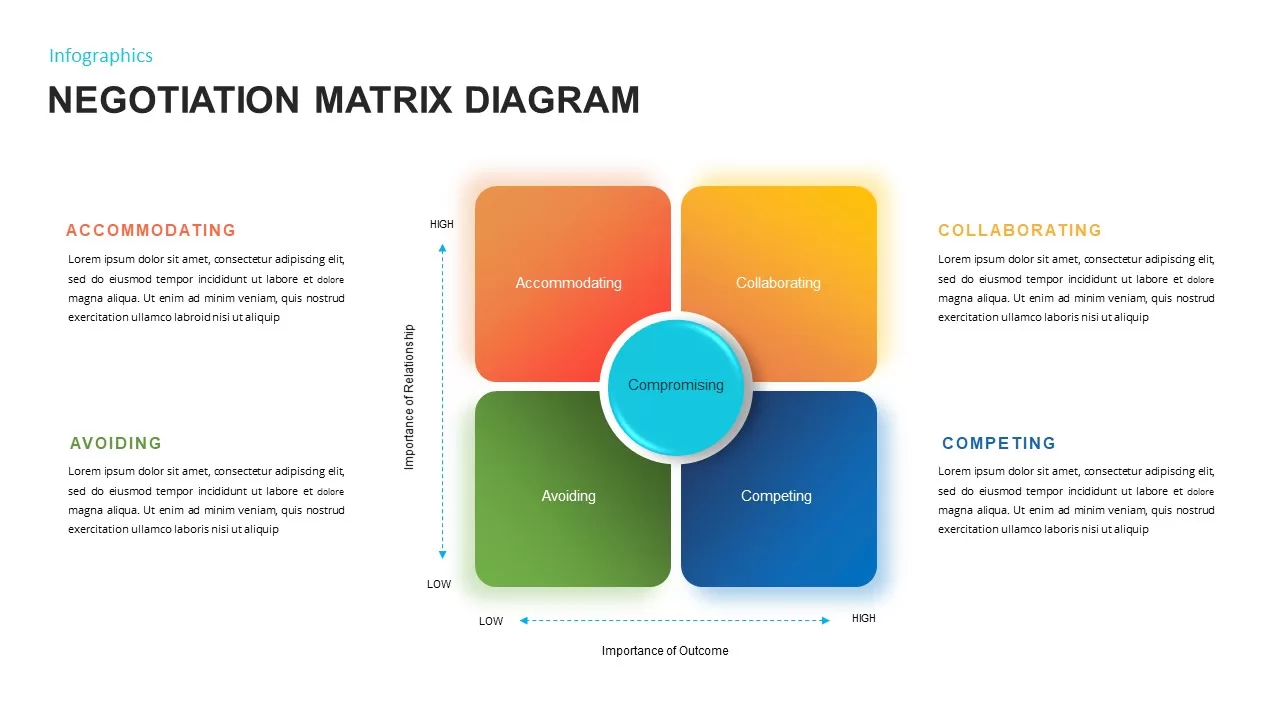
Negotiation Matrix Diagram Template for PowerPoint & Google Slides
Business
Bubble Chart Scatter, Diagram & Matrix Template for PowerPoint & Google Slides
Comparison Chart
Matrix Grid Diagram Template for PowerPoint & Google Slides
Comparison
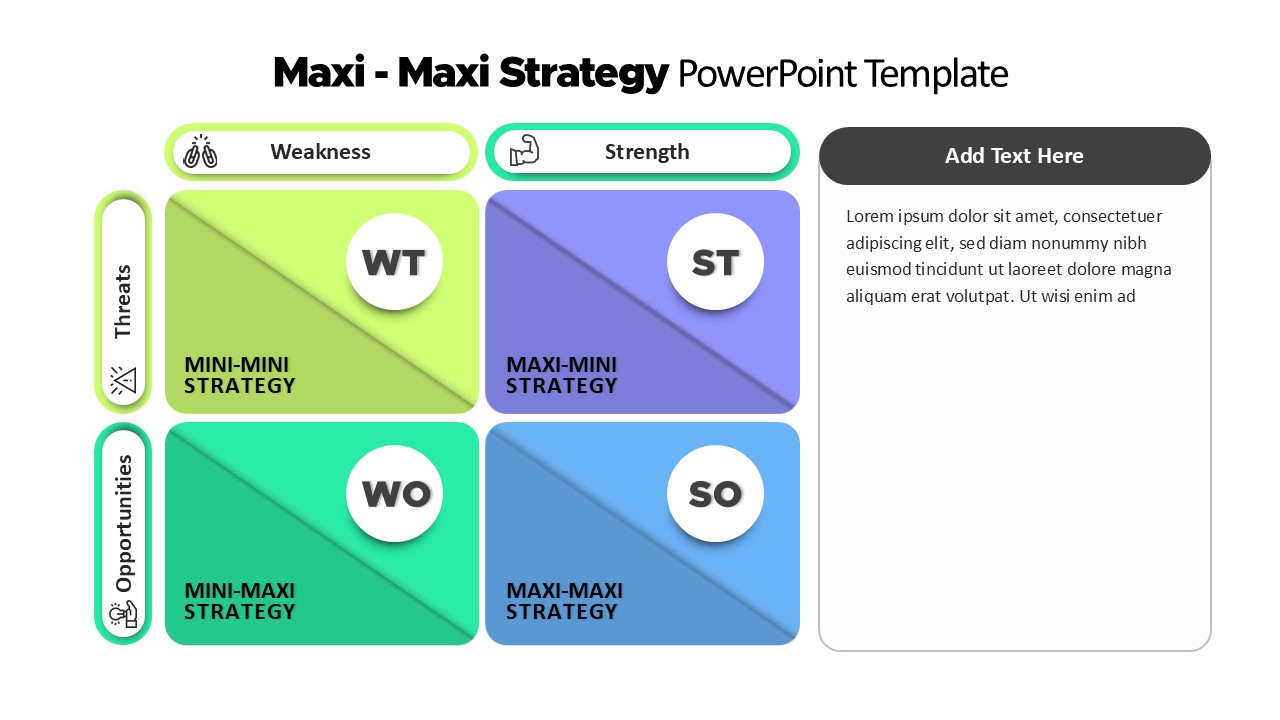
Maxi-Maxi Strategy Matrix SWOT Diagram Template for PowerPoint & Google Slides
SWOT
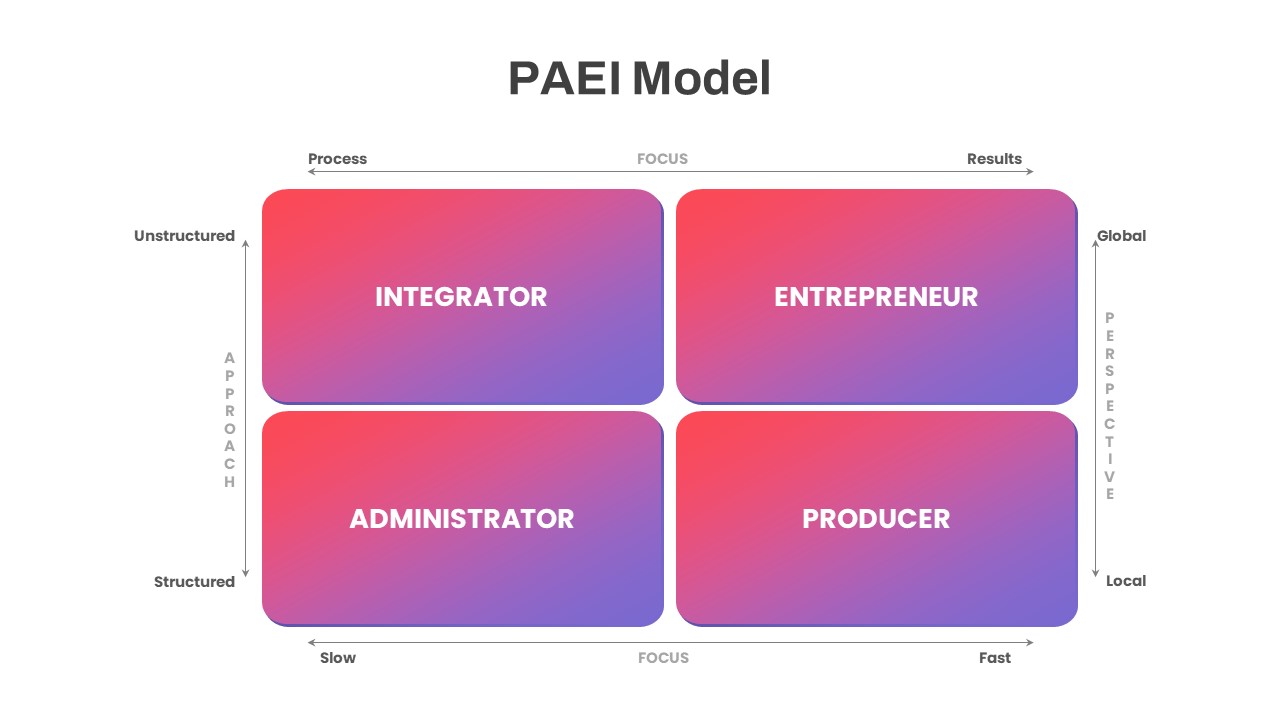
PAEI Leadership Roles 2×2 Matrix Diagram Template for PowerPoint & Google Slides
Business Models
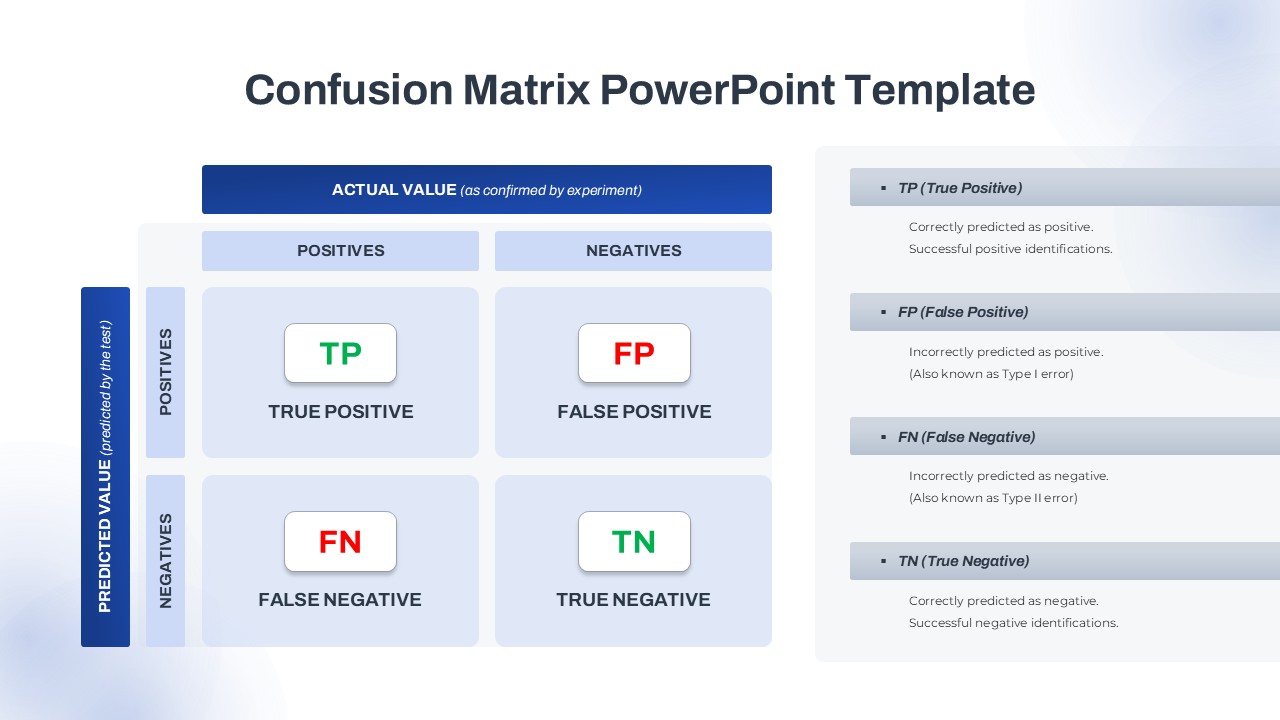
Confusion Matrix Diagram Overview Template for PowerPoint & Google Slides
Comparison
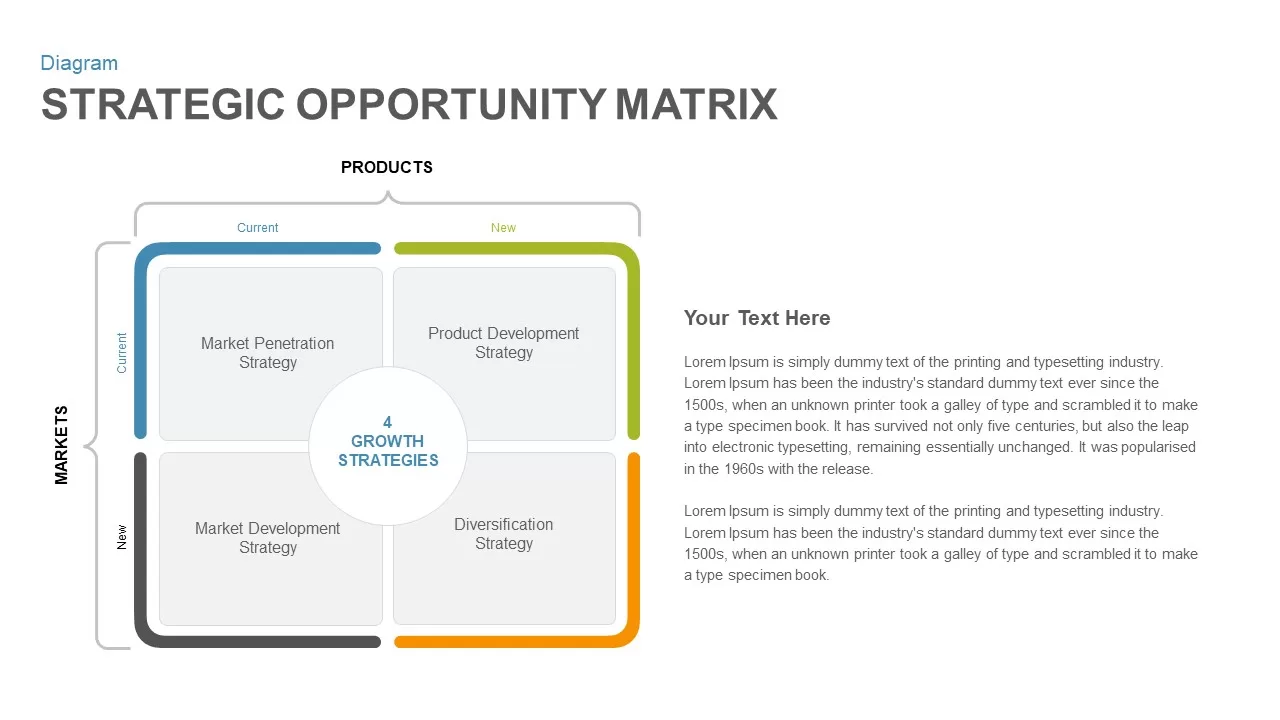
Strategic Opportunity Matrix Diagram for PowerPoint & Google Slides
Business Strategy
Innovation Ambition Matrix & Funnel Strategy Slides for PowerPoint & Google Slides
Process
Market Development Matrix Chart Template for PowerPoint & Google Slides
Comparison Chart
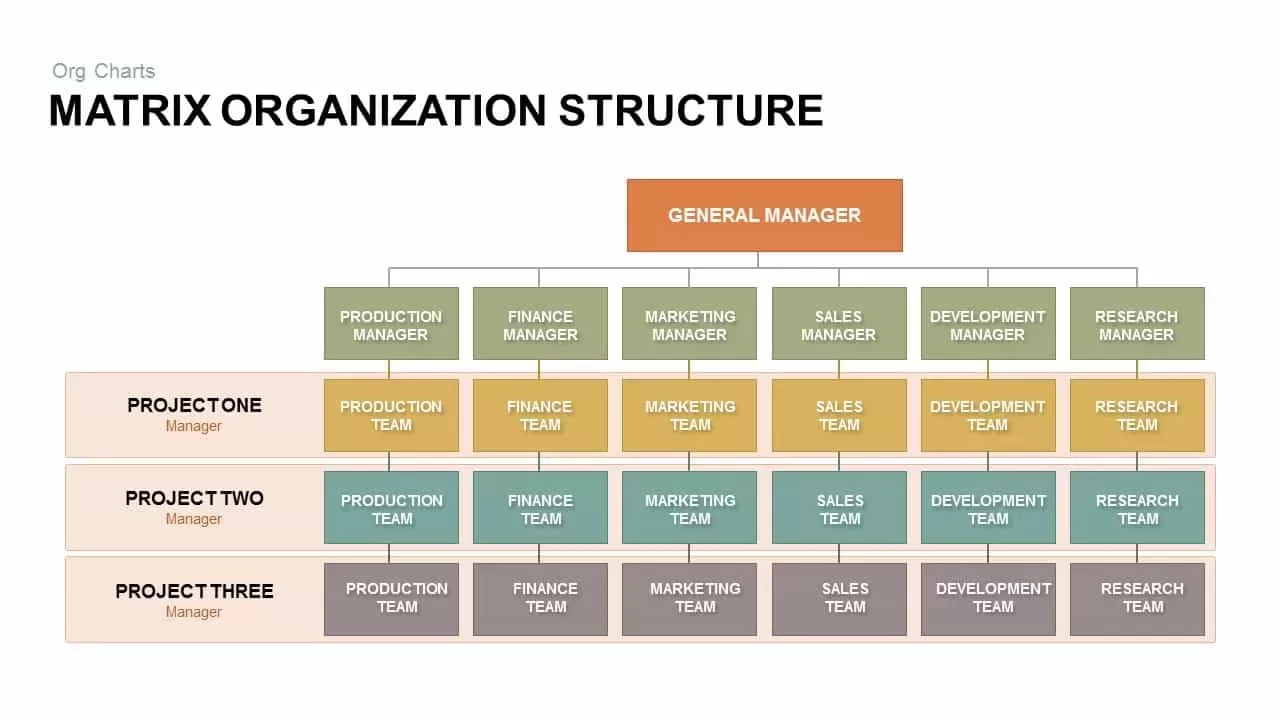
Matrix Organization Structure template for PowerPoint & Google Slides
Org Chart
Ansoff Matrix Growth Strategy Model Template for PowerPoint & Google Slides
BCG

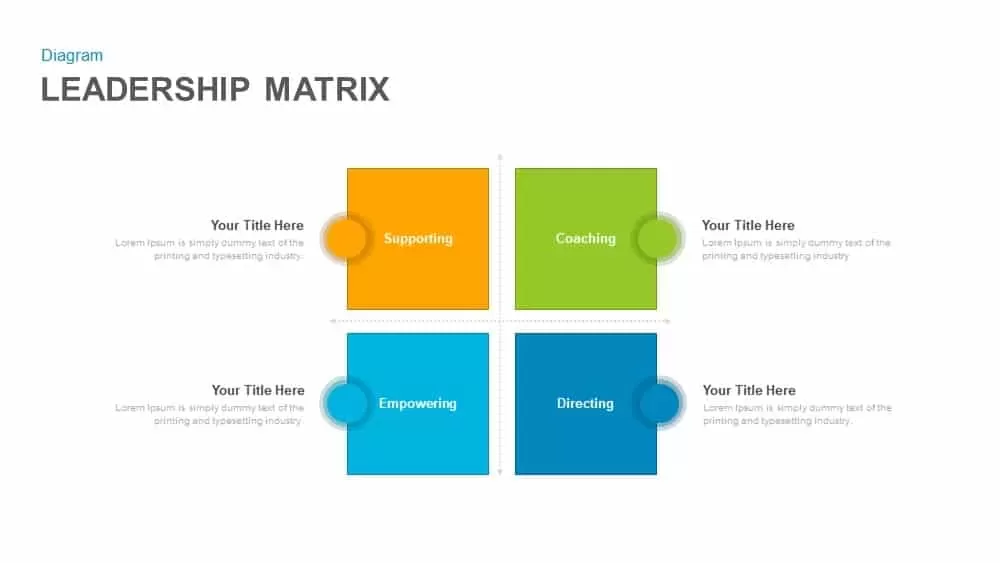
Leadership Matrix with Four Quadrants Template for PowerPoint & Google Slides
Comparison
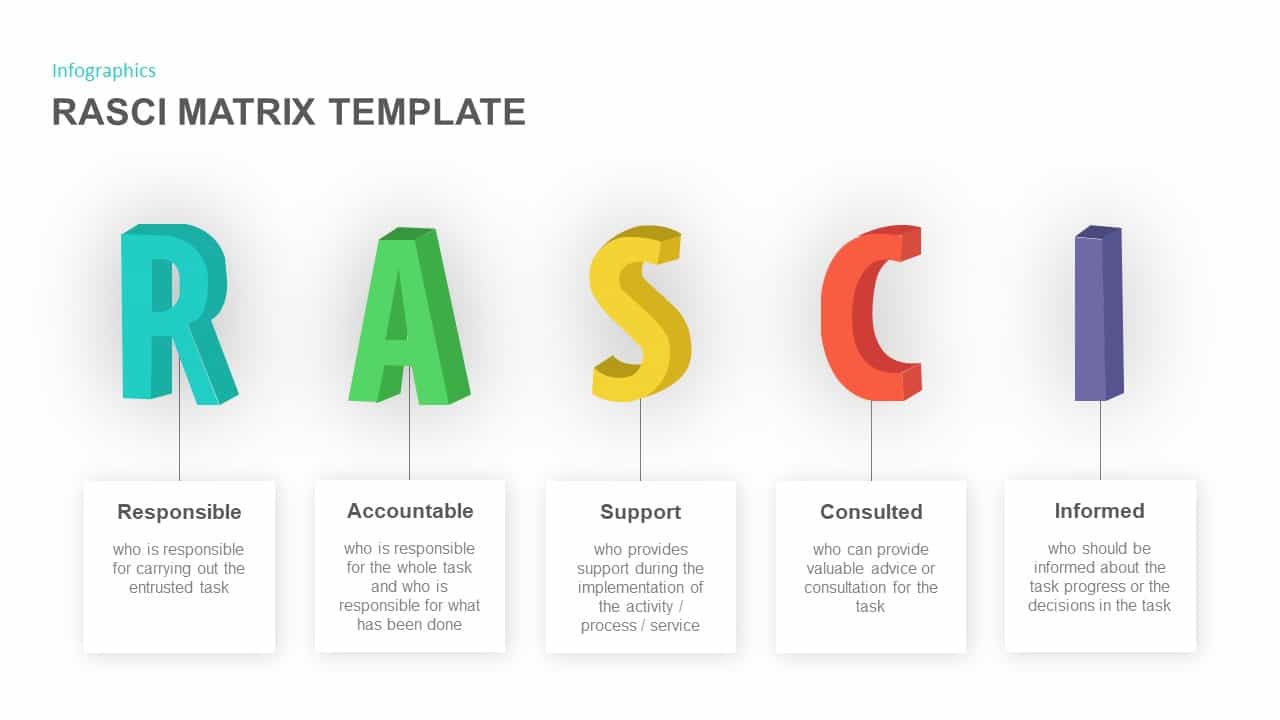
RASCI Assignment Matrix Infographic Template for PowerPoint & Google Slides
Infographics
Product Market Expansion Matrix Template for PowerPoint & Google Slides
Business
RASCI Responsibility Matrix Chart Template for PowerPoint & Google Slides
Business

Interactive RACI Responsibility Matrix Template for PowerPoint & Google Slides
Project
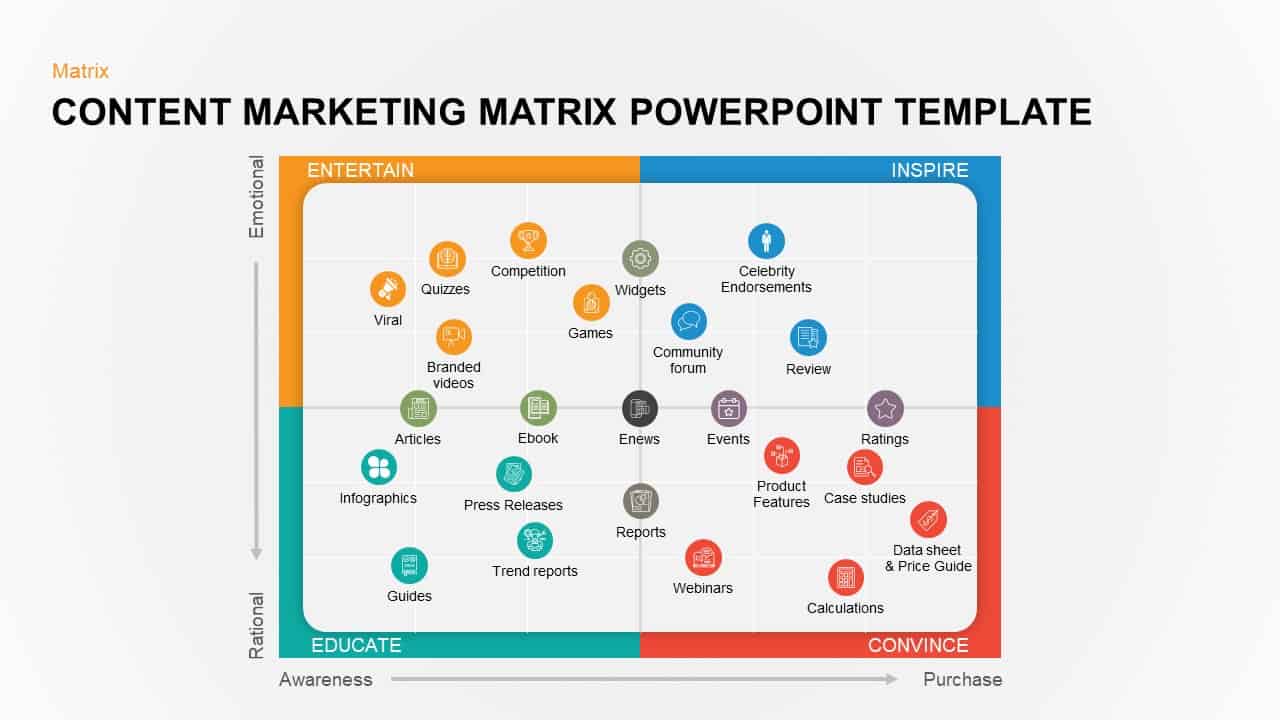
Colorful Content Marketing Matrix Template for PowerPoint & Google Slides
Comparison
Concentric Marketing Matrix Slide Template for PowerPoint & Google Slides
Circular
Three-Year Strategic Plan Matrix Template for PowerPoint & Google Slides
Timeline
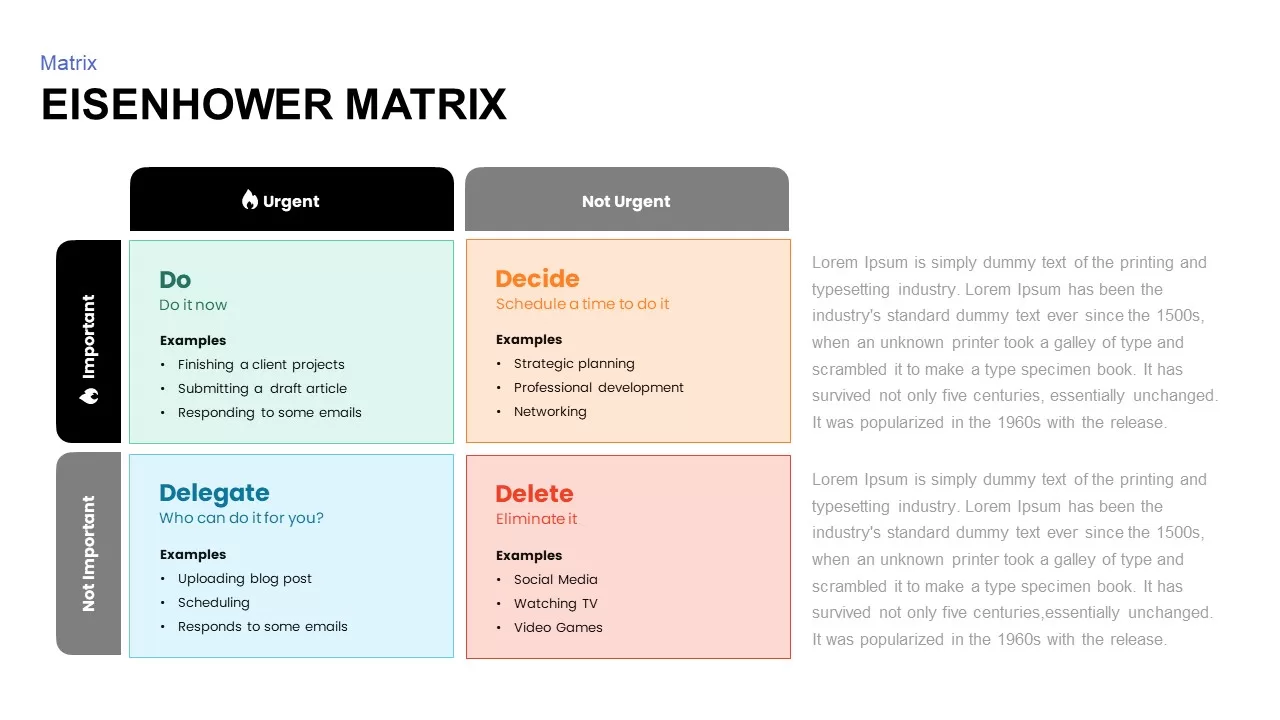
Eisenhower Matrix Task Prioritization Template for PowerPoint & Google Slides
Comparison Chart
RASCI Responsibility Assignment Matrix Template for PowerPoint & Google Slides
Project
Strategic ADL Matrix by Industry Life Cycle & Position Template for PowerPoint & Google Slides
Business Strategy
Supply Positioning Model Matrix Template for PowerPoint & Google Slides
Comparison Chart
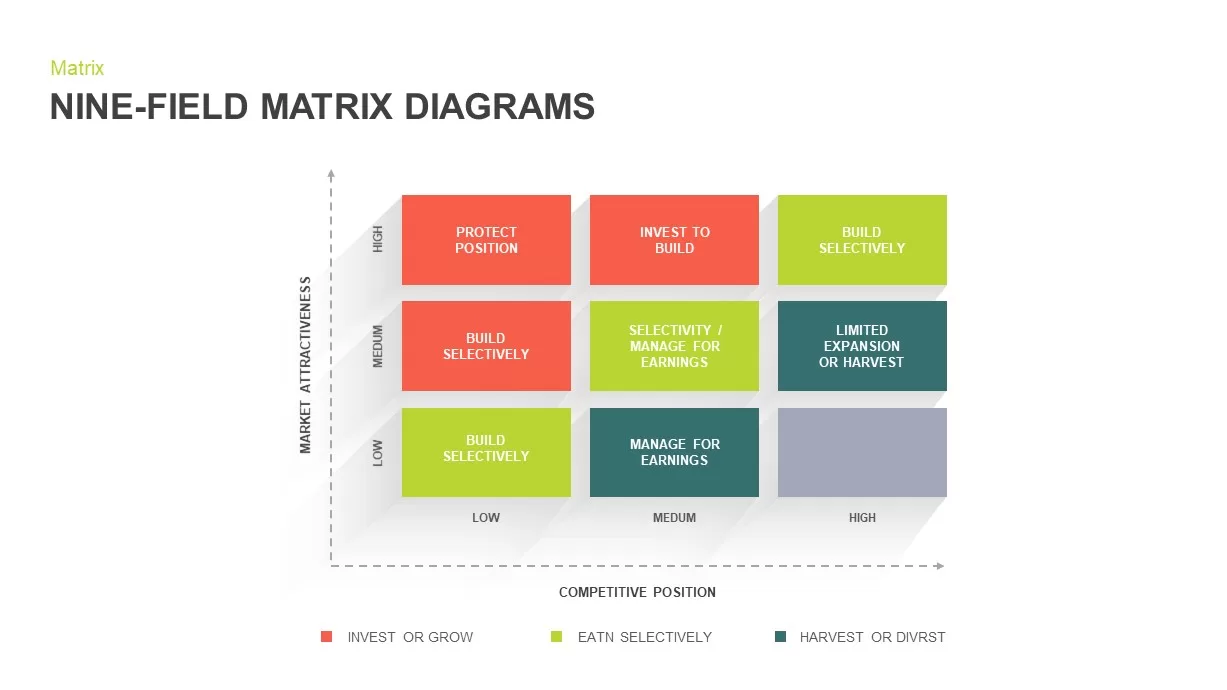
Nine-Field Matrix Diagrams Collection Template for PowerPoint & Google Slides
Comparison Chart
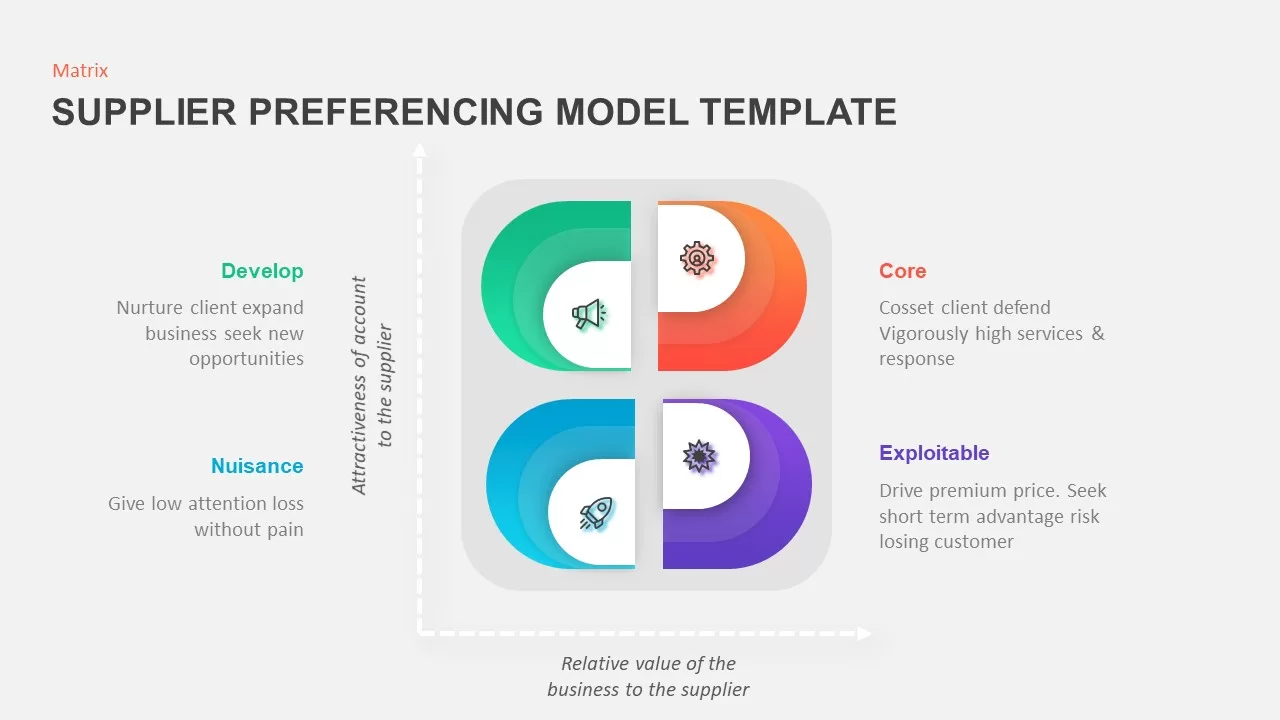
Supplier Preferencing Model Matrix Template for PowerPoint & Google Slides
Business Strategy
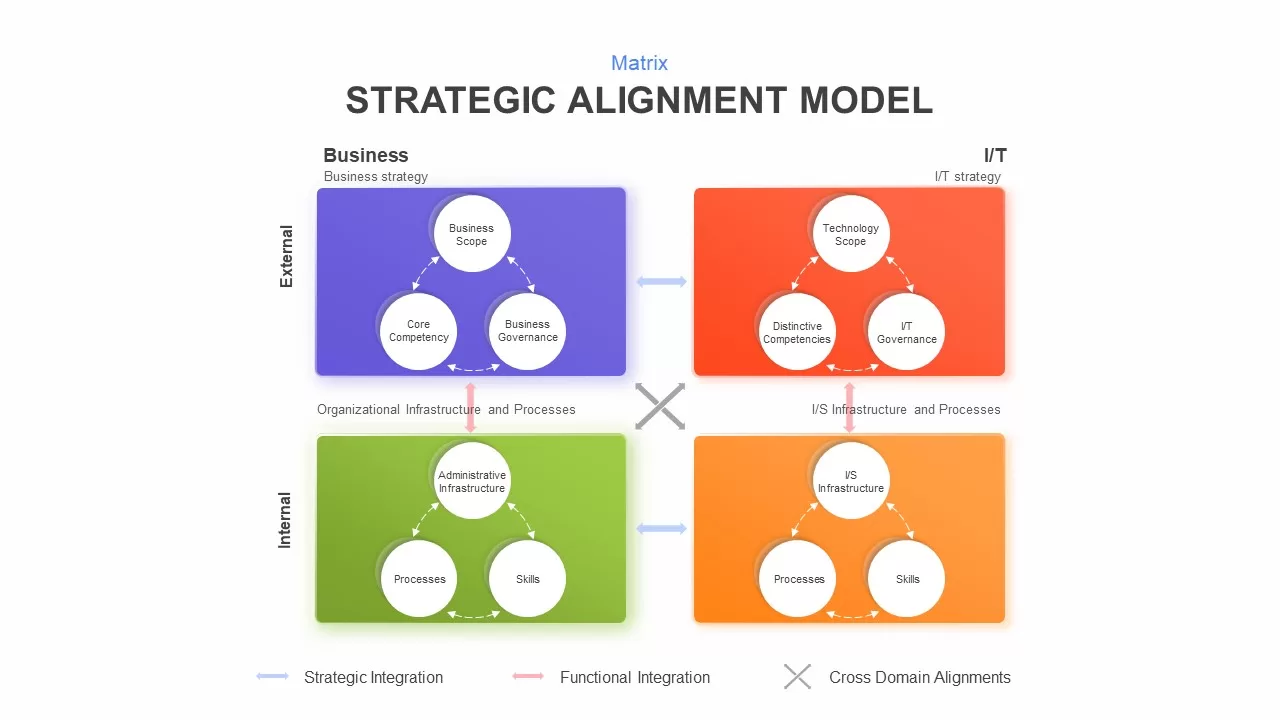
Strategic Alignment Matrix Model Template for PowerPoint & Google Slides
Project
Editable Four-Quadrant TOWS Matrix Template for PowerPoint & Google Slides
Opportunities Challenges
Eisenhower Matrix Decision-Making template for PowerPoint & Google Slides
Infographics
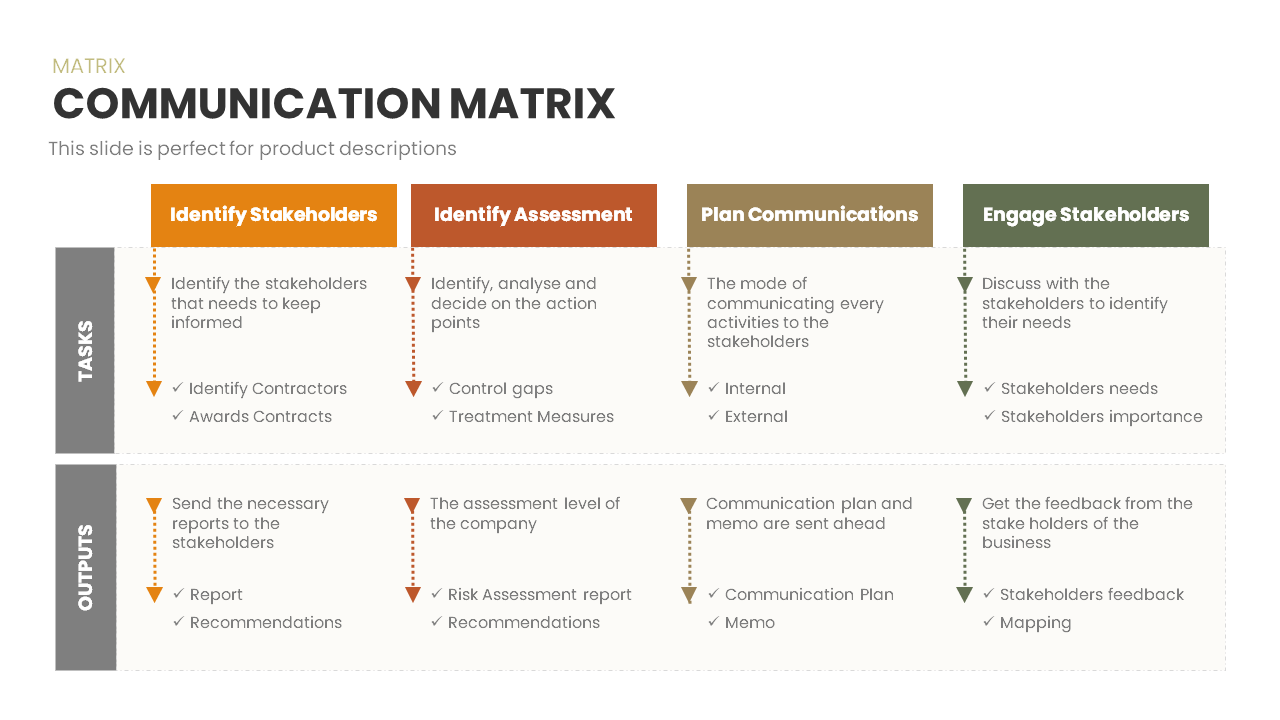
Communication Matrix Overview Template for PowerPoint & Google Slides
Business
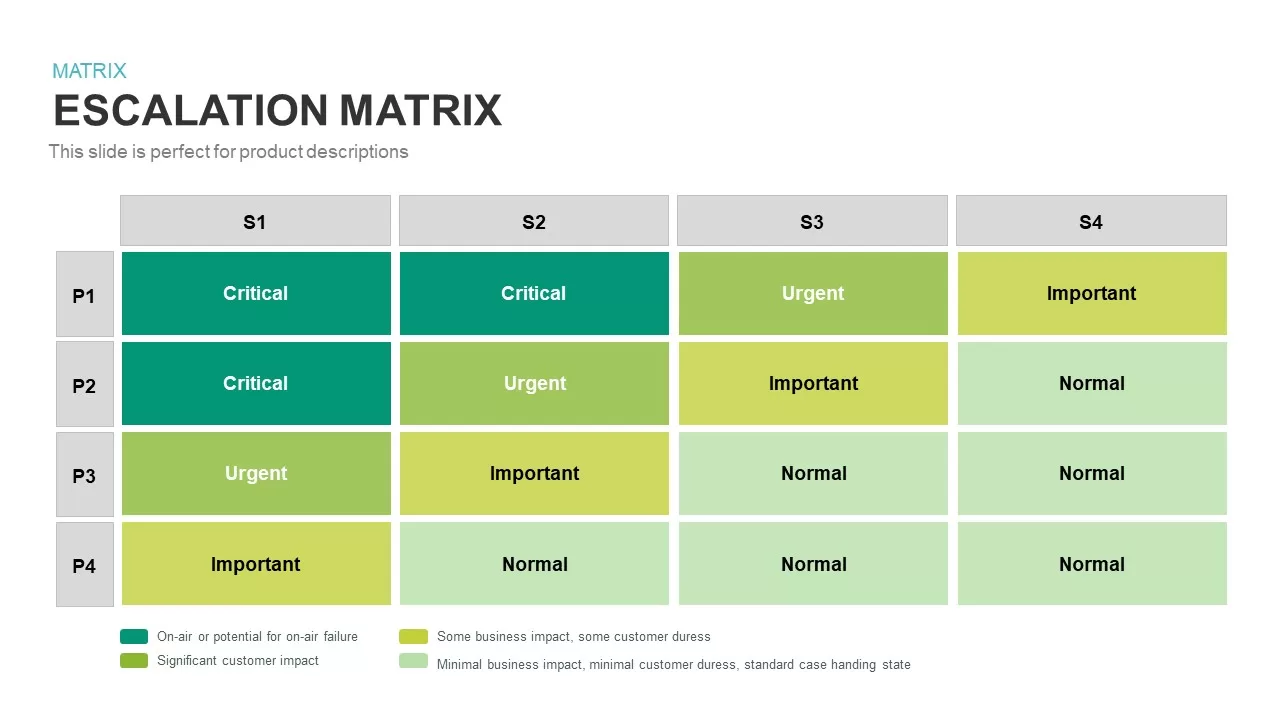
Escalation Matrix template for PowerPoint & Google Slides
Business
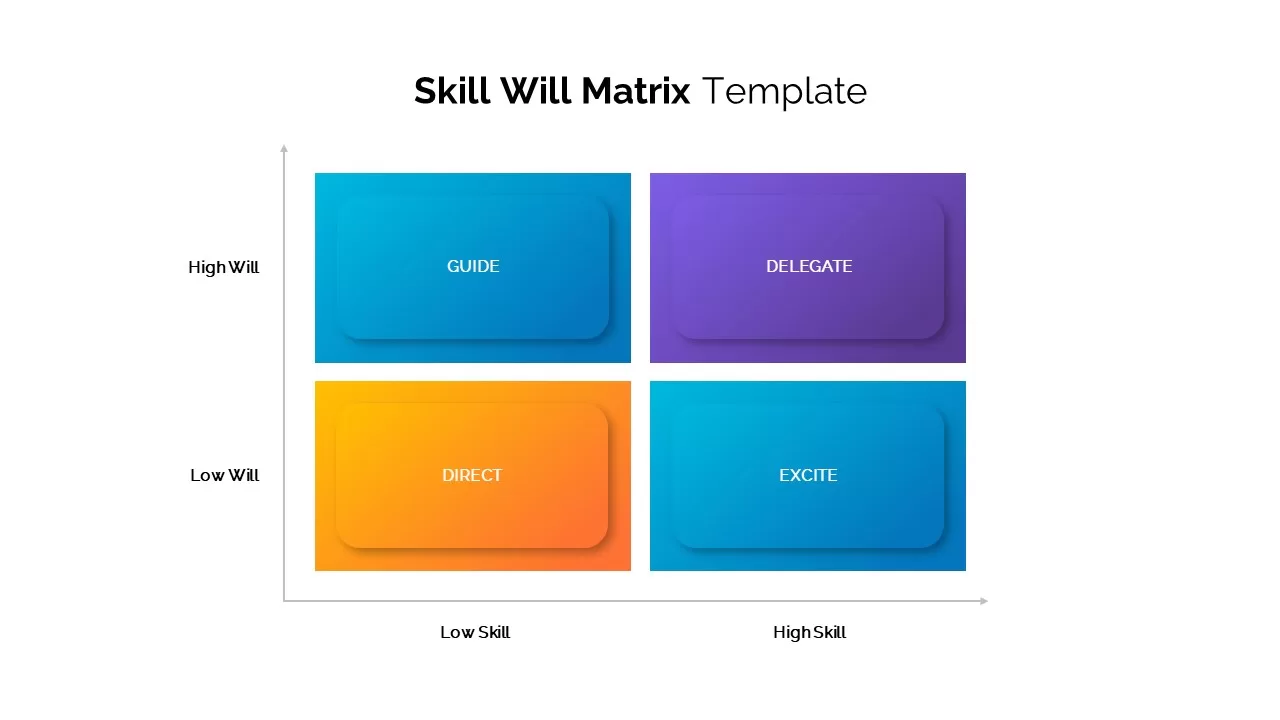
Skill Will Matrix Template for PowerPoint & Google Slides
Infographics
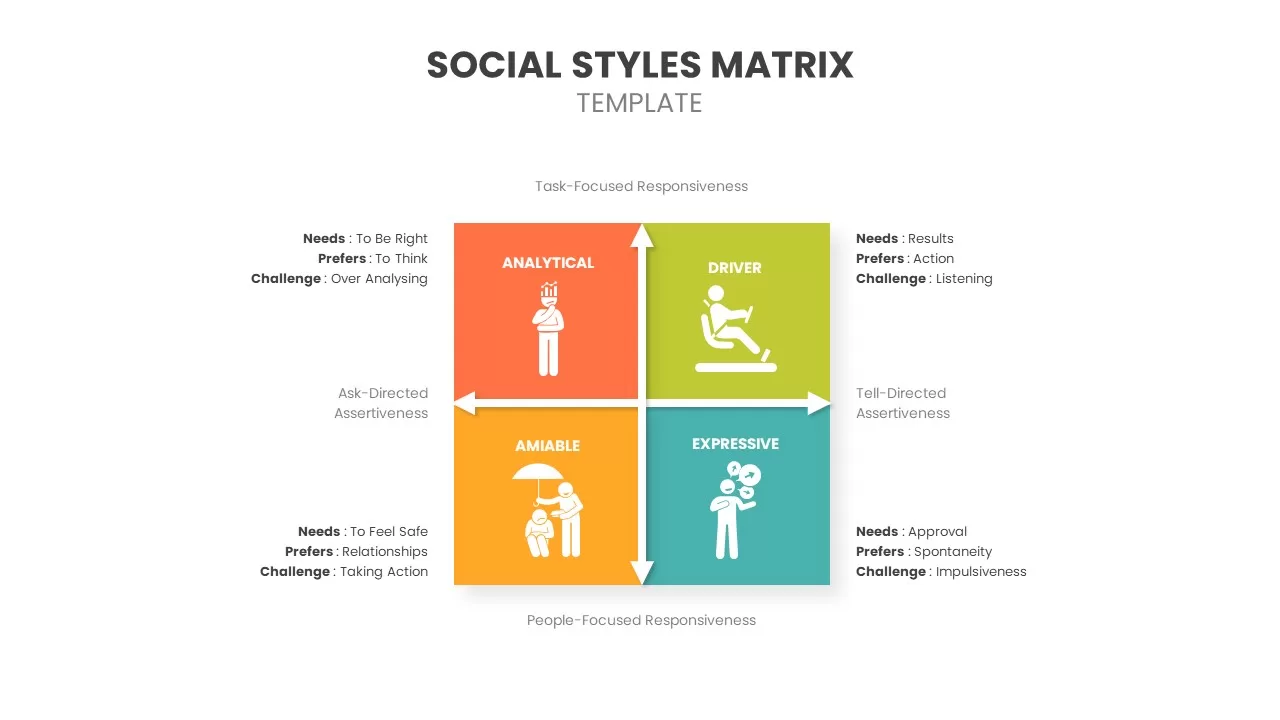
Social Styles Matrix Template for PowerPoint & Google Slides
Business
Pugh Matrix Decision Comparison Chart Template for PowerPoint & Google Slides
Comparison Chart
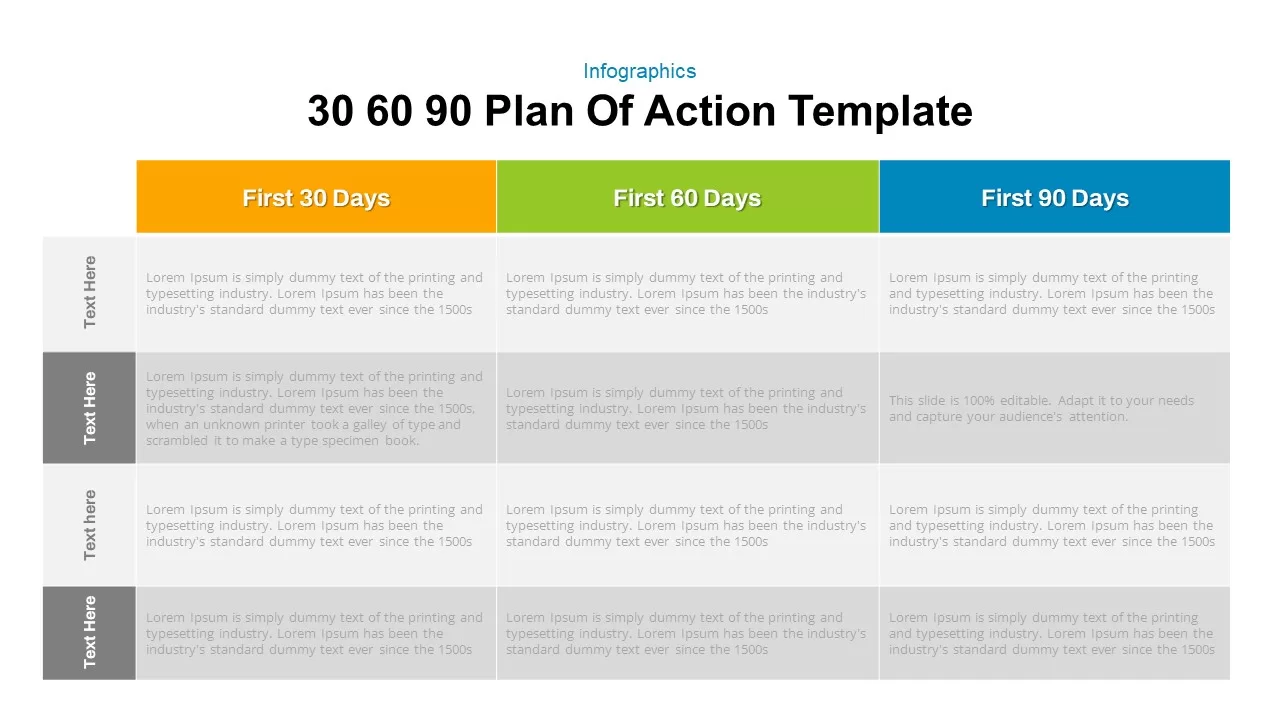
30 60 90 Day Plan Matrix Table Template for PowerPoint & Google Slides
Timeline
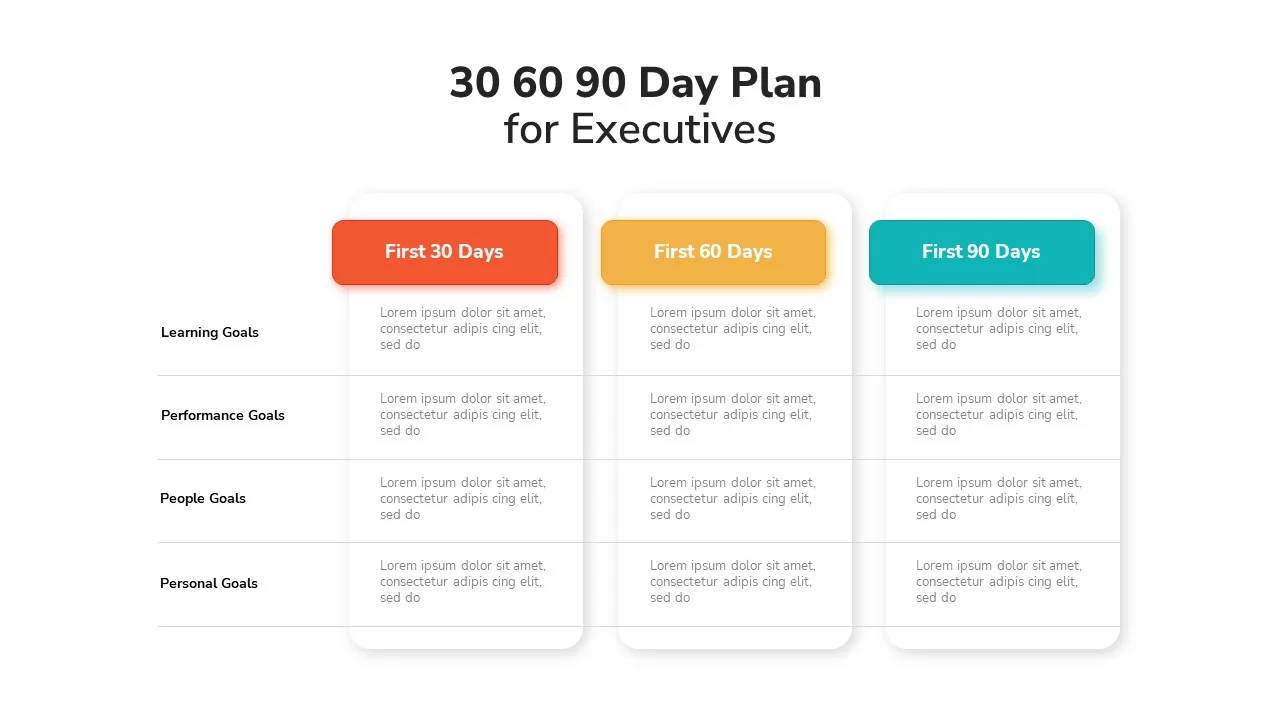
Executive 30-60-90 Day Plan Matrix Template for PowerPoint & Google Slides
Timeline
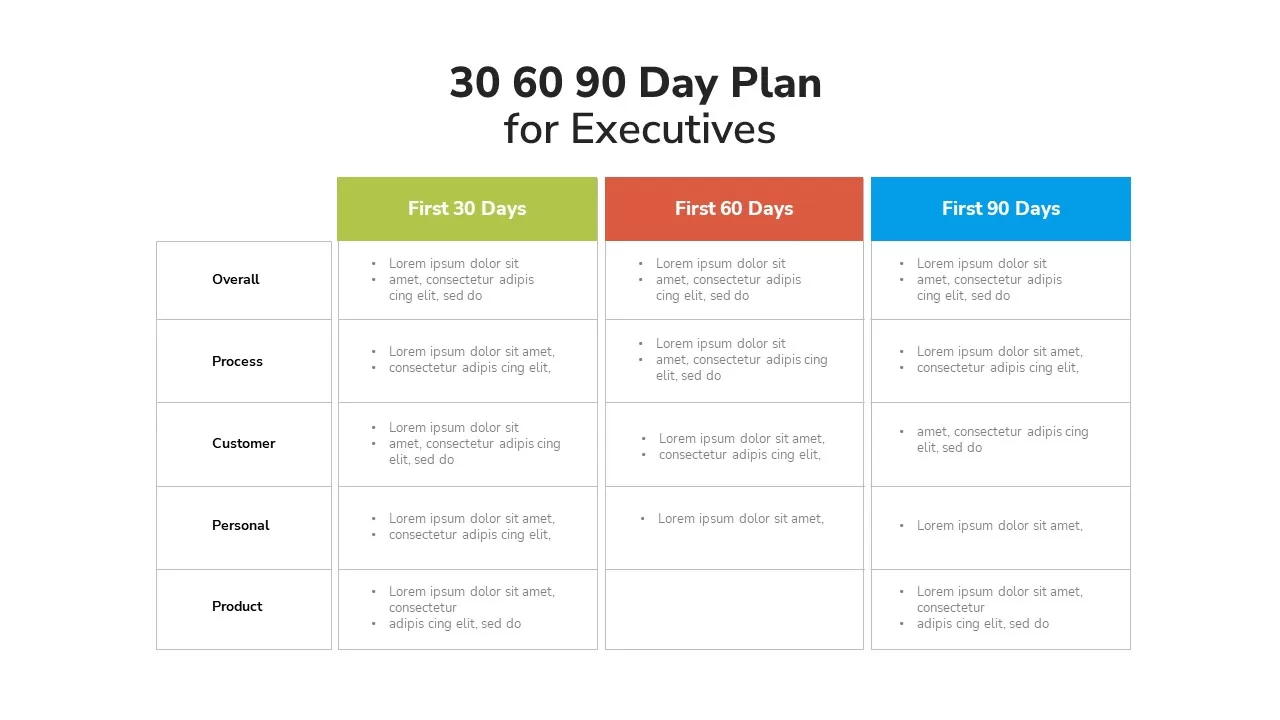
Executive 30-60-90 Day Plan Matrix Template for PowerPoint & Google Slides
Timeline
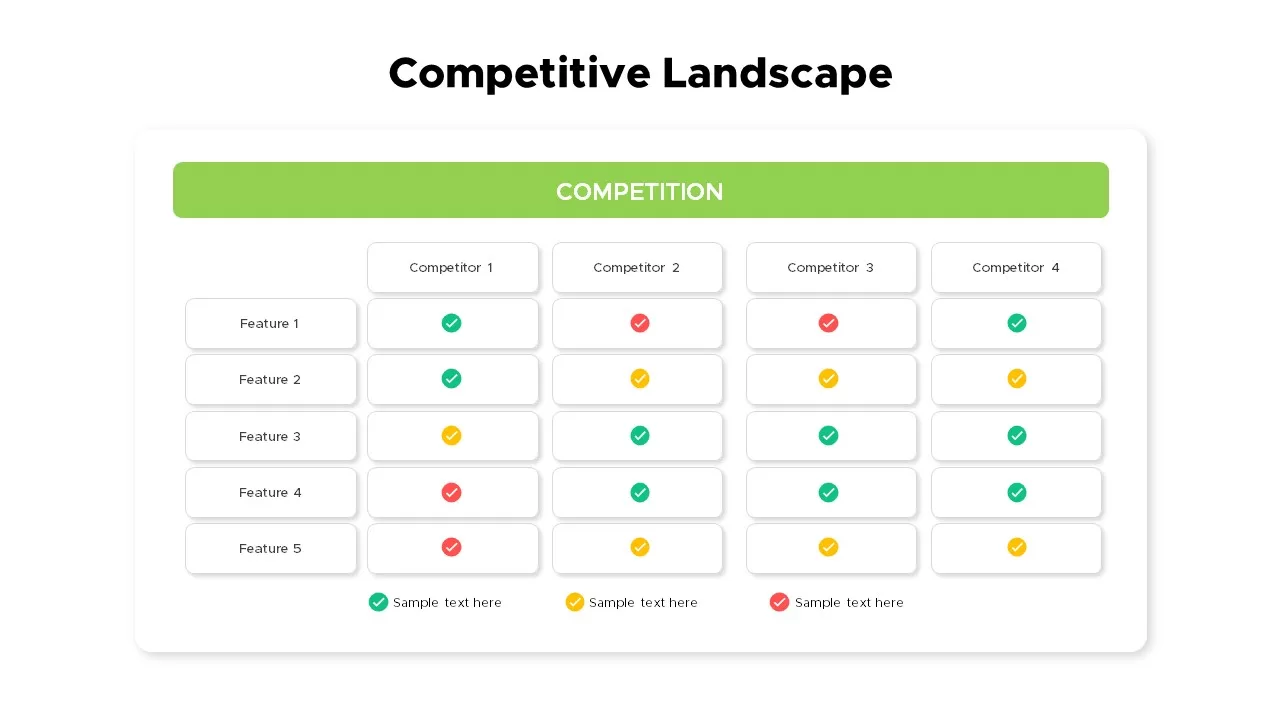
Competitive Landscape Matrix Template for PowerPoint & Google Slides
Comparison
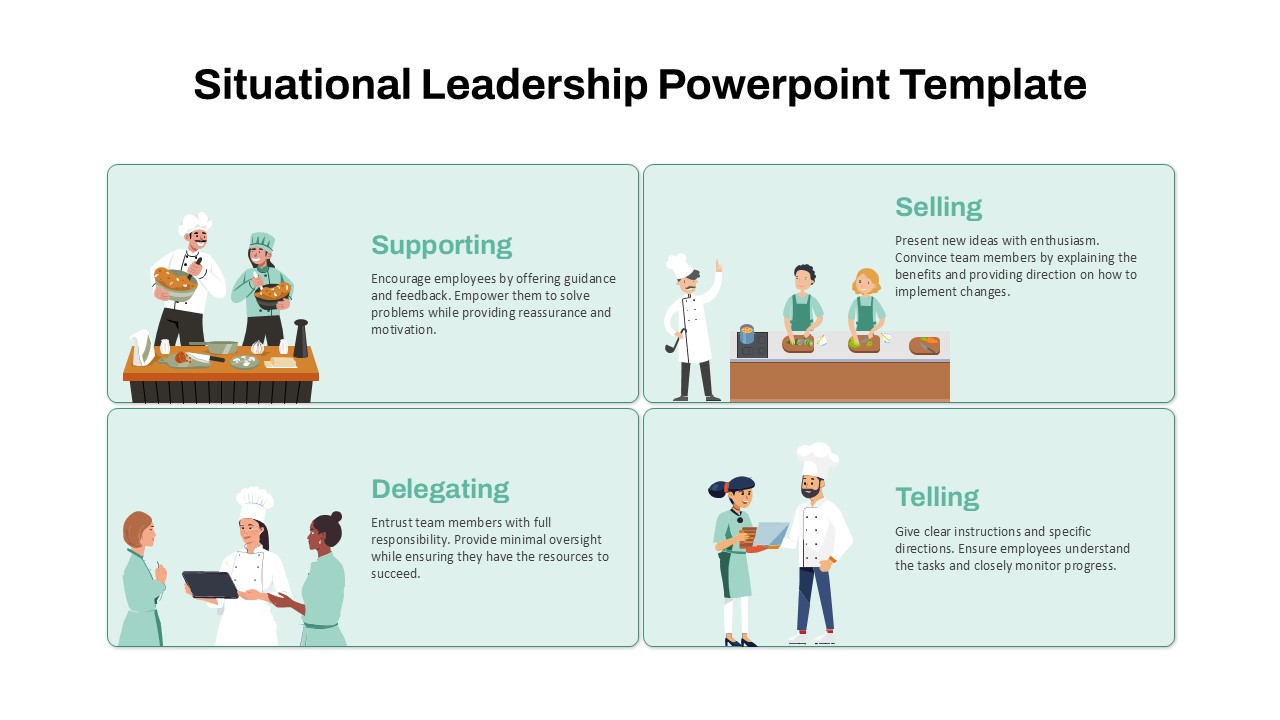
Situational Leadership Matrix Template for PowerPoint & Google Slides
Process
9-Box Matrix for Performance & Potential Template for PowerPoint & Google Slides
Employee Performance
Professional Interactive Heat Map Matrix Template for PowerPoint & Google Slides
Comparison Chart
Heat Map Risk Matrix Dashboard Template for PowerPoint & Google Slides
Comparison Chart
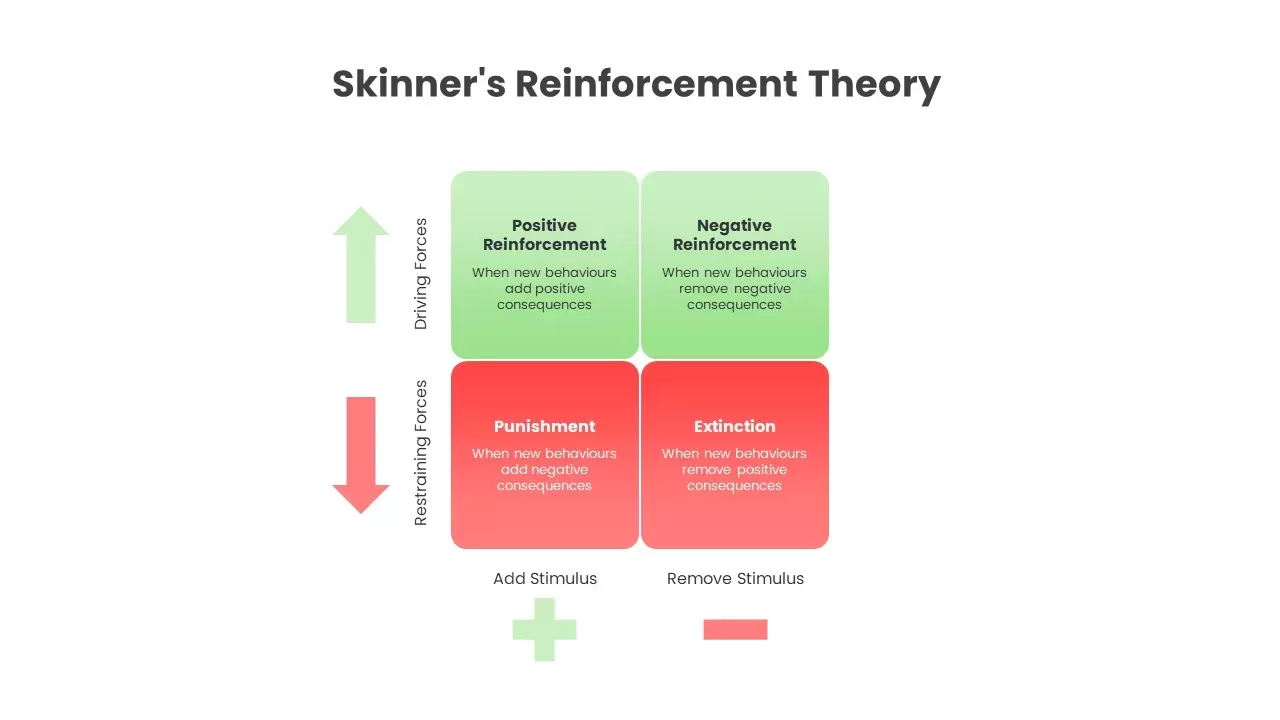
Skinner’s Reinforcement Theory Matrix Template for PowerPoint & Google Slides
Comparison
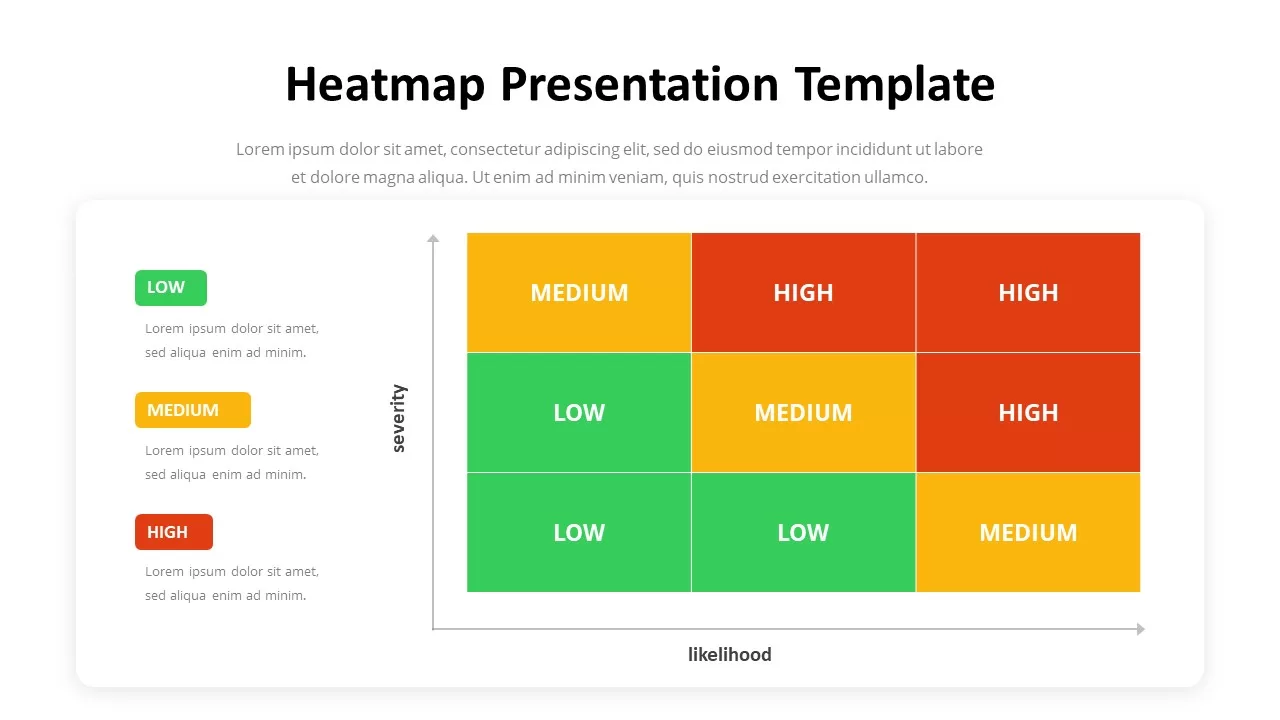
Heatmap Matrix Template for PowerPoint & Google Slides
Maps
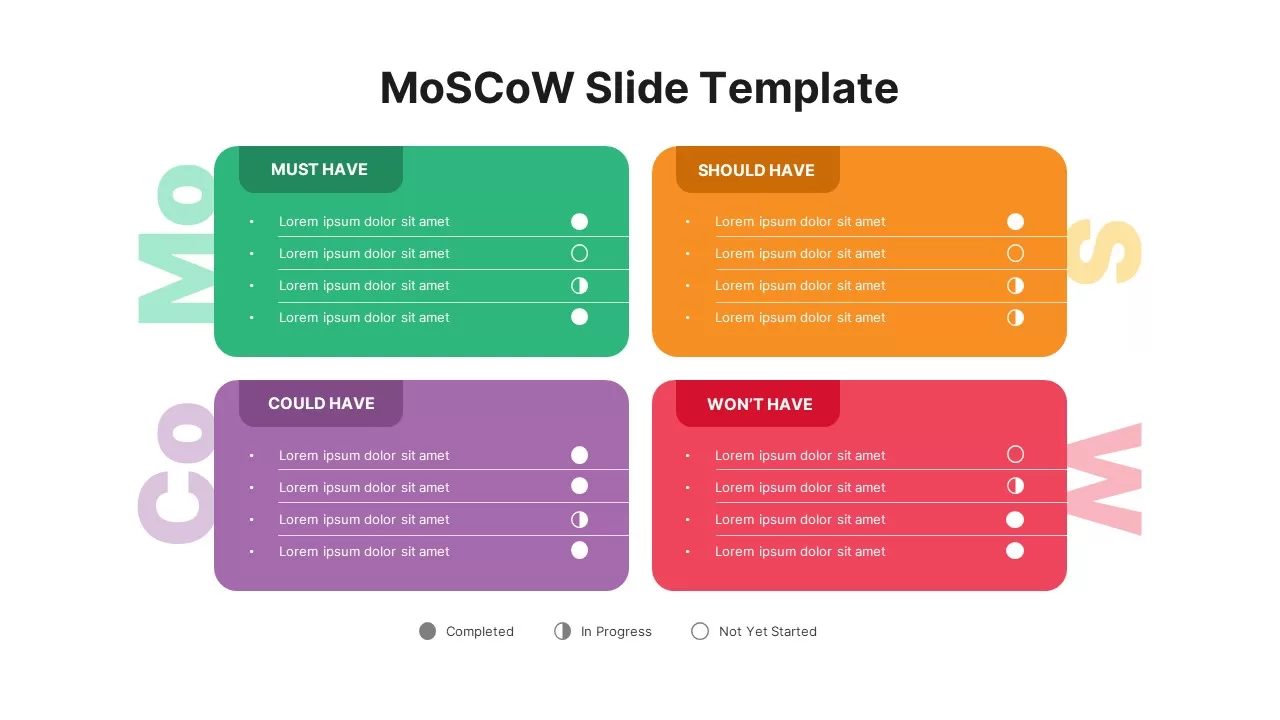
MoSCoW Prioritization Matrix Slide Template for PowerPoint & Google Slides
Business Strategy
Vendor Comparison Matrix with High-Level Requirements template for PowerPoint & Google Slides
Comparison Chart
MABA Attractiveness Matrix Chart Template for PowerPoint & Google Slides
Comparison Chart
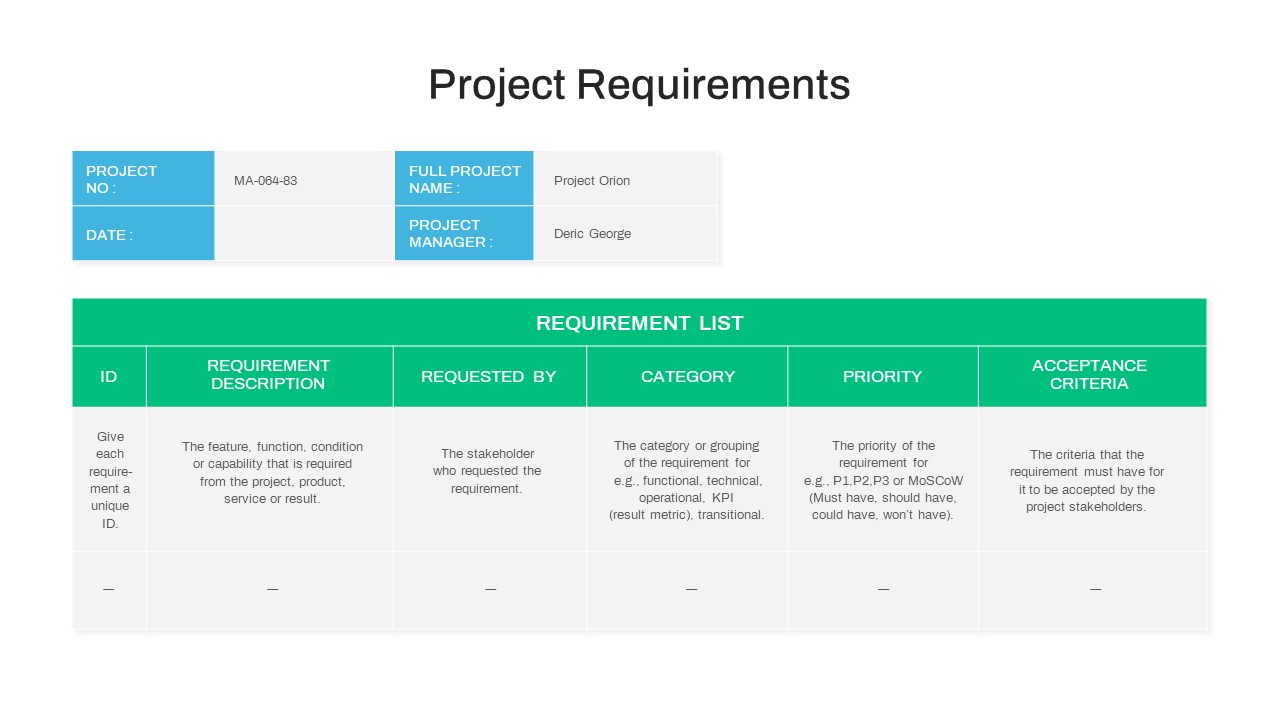
Project Requirements Matrix Template for PowerPoint & Google Slides
Project
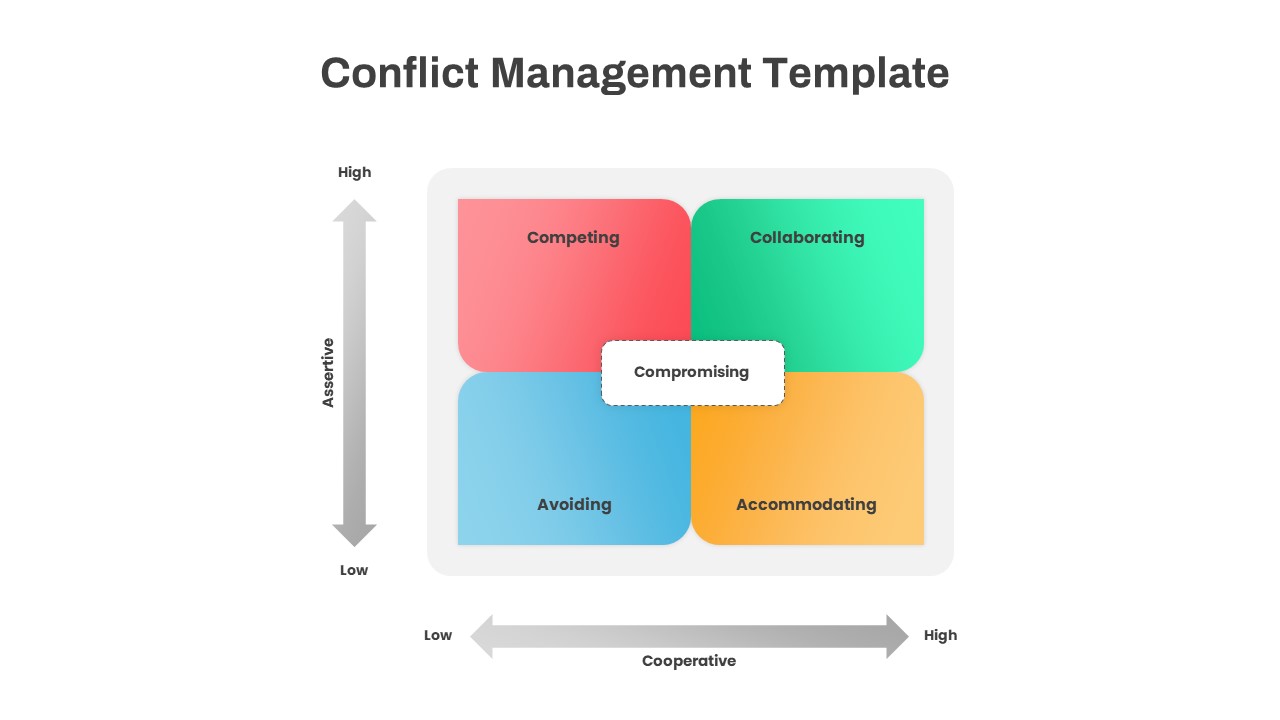
Conflict Management Matrix Template for PowerPoint & Google Slides
Leadership
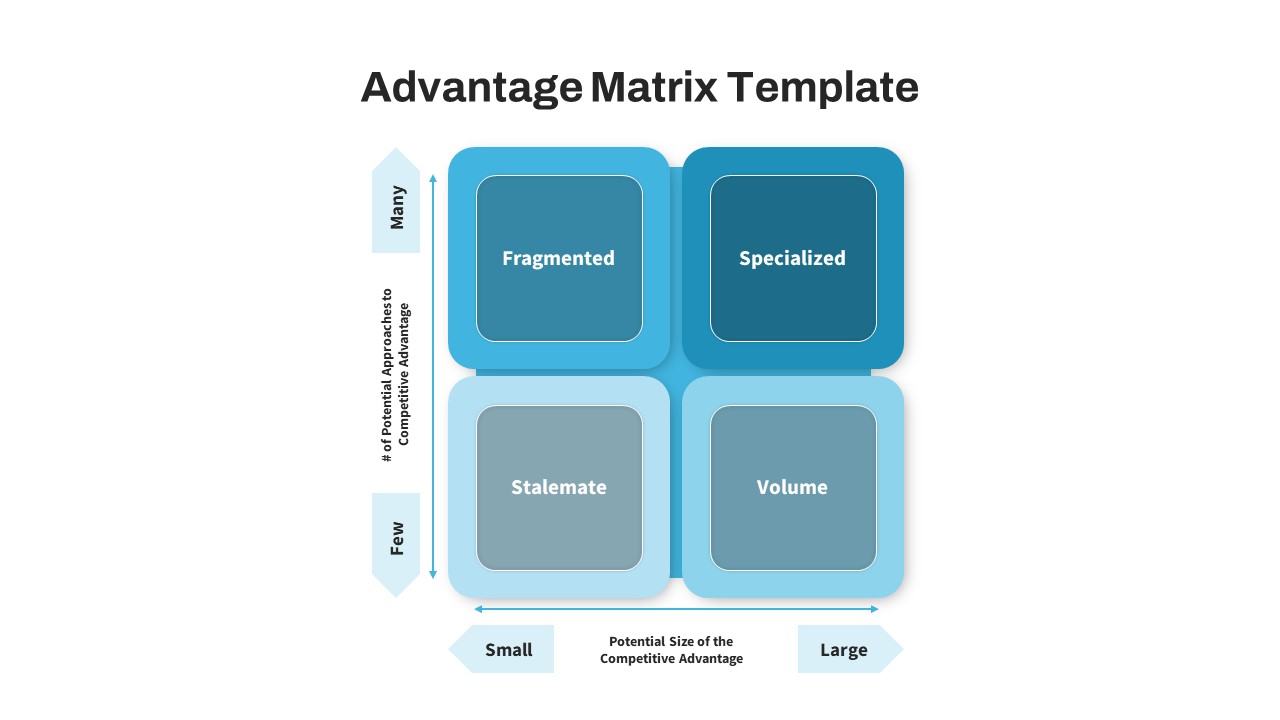
Advantage Matrix 2×2 Framework Template for PowerPoint & Google Slides
Competitor Analysis
Business Growth Strategies Matrix Template for PowerPoint & Google Slides
Comparison
Free Competitor Analysis Matrix Template for PowerPoint & Google Slides
Competitor Analysis
Free
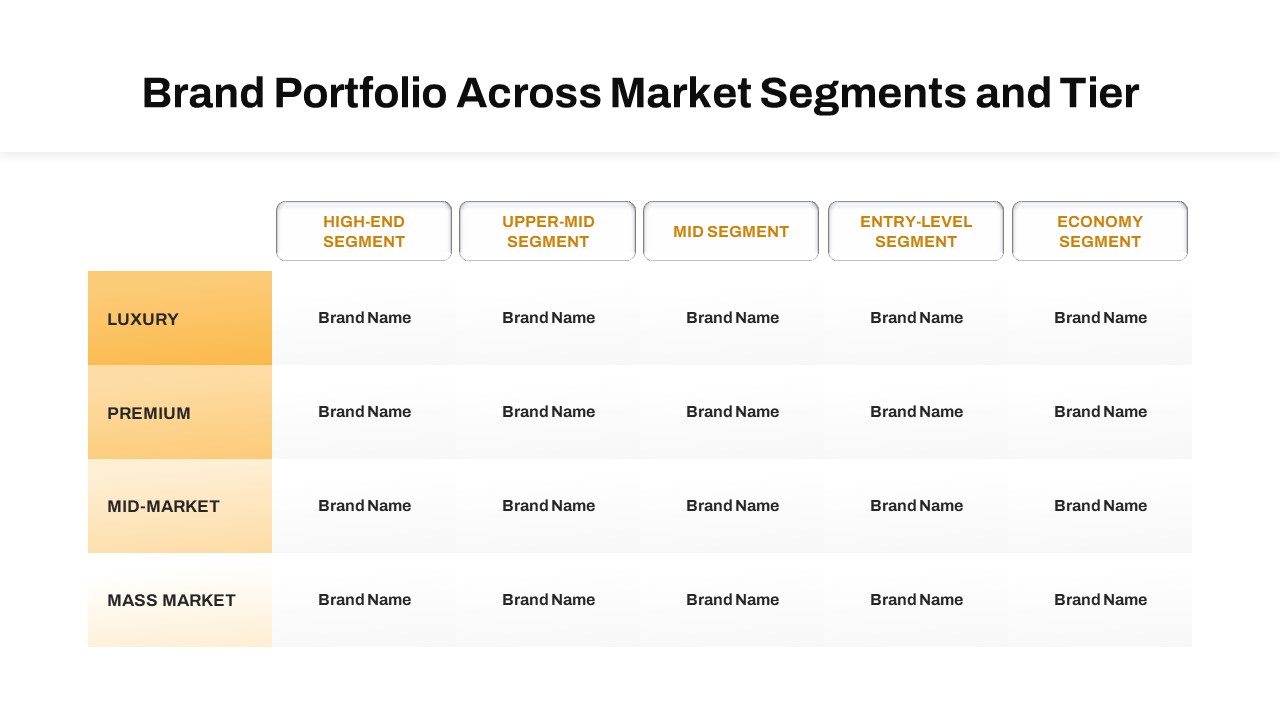
Brand Portfolio Matrix: Segments & Tiers Template for PowerPoint & Google Slides
Business Report
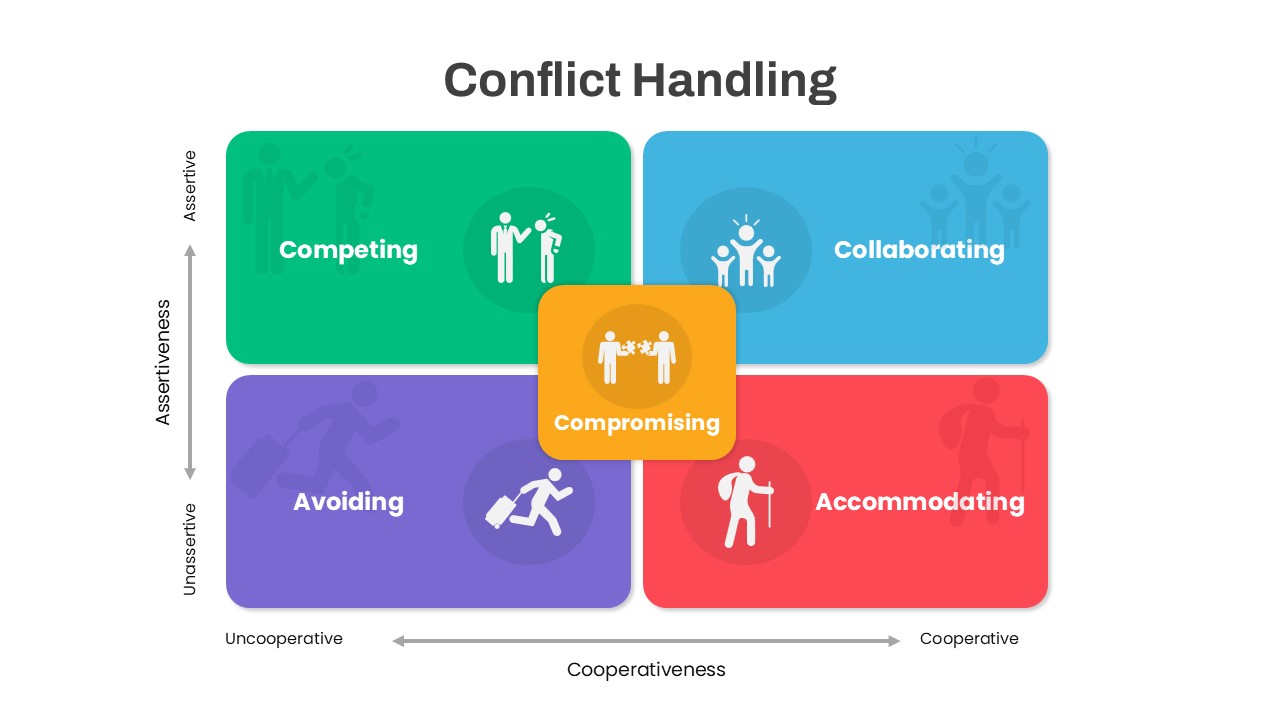
Colorful Conflict Handling Matrix Template for PowerPoint & Google Slides
Comparison
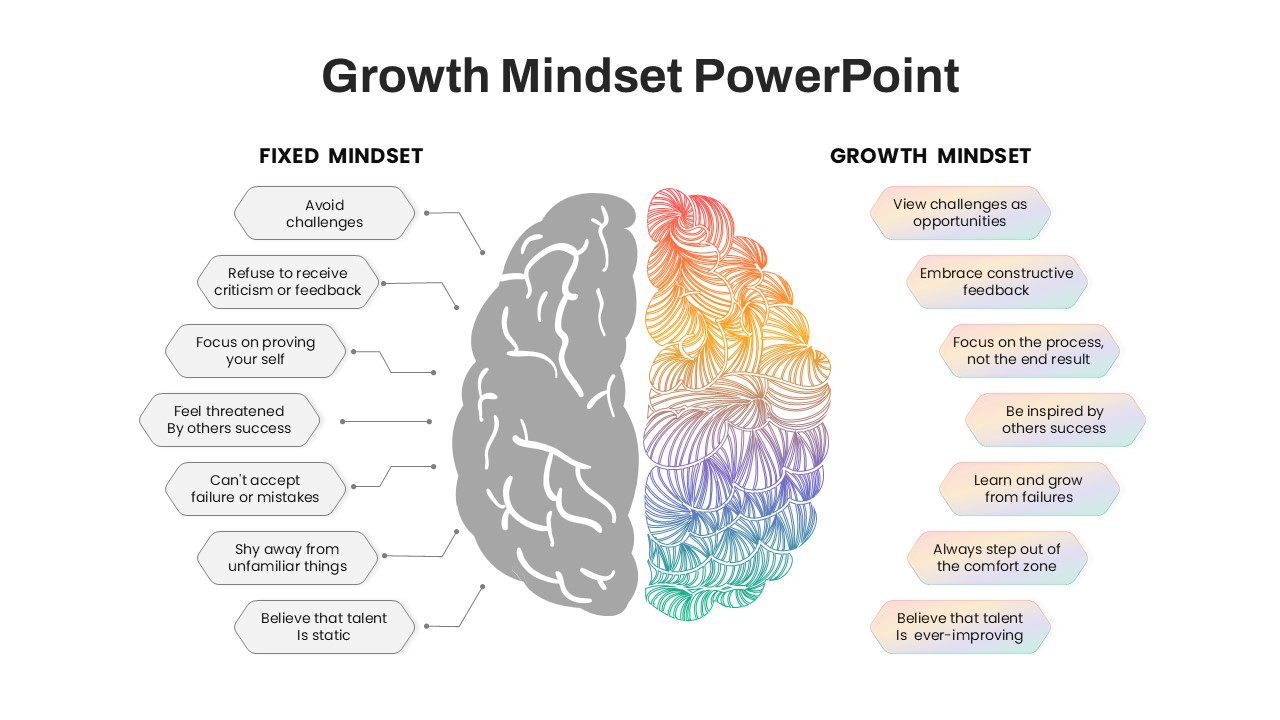
Fixed vs Growth Mindset Matrix Template for PowerPoint & Google Slides
Comparison
Decision Matrix & Prioritization Chart Template for PowerPoint & Google Slides
Comparison Chart
Ansoff Growth Matrix Professional Template for PowerPoint & Google Slides
Comparison
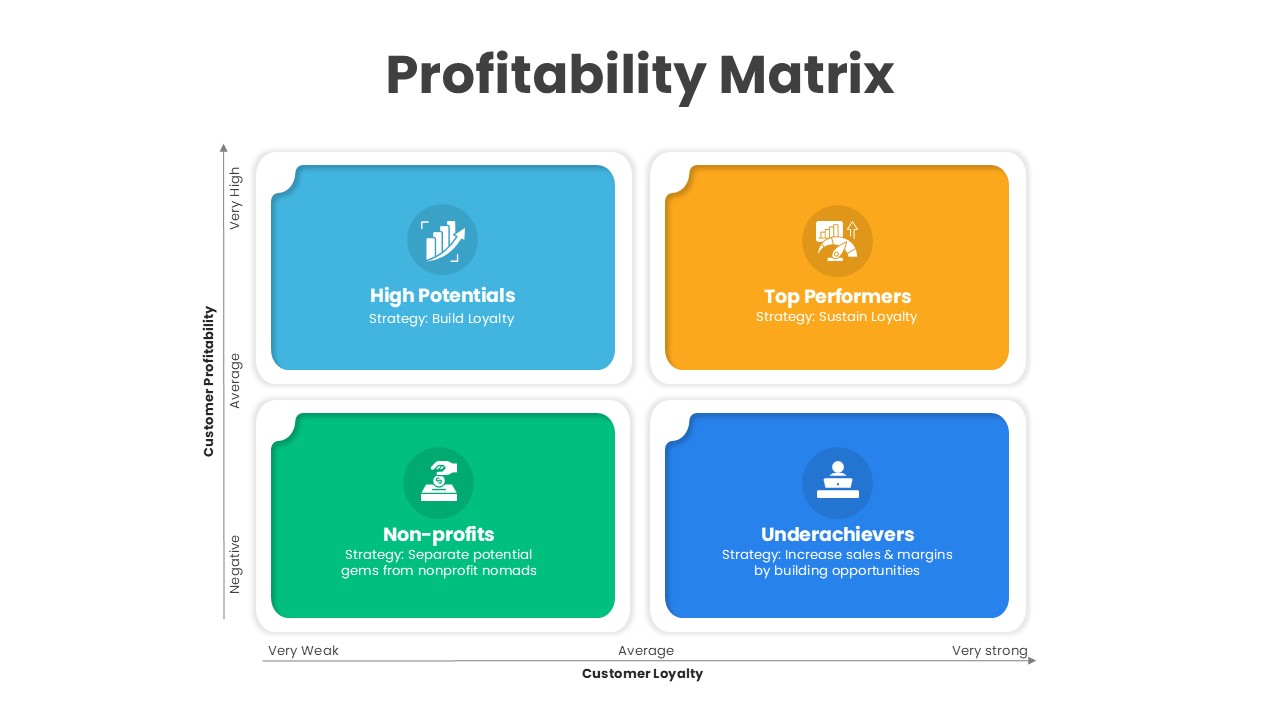
Customer Loyalty & Profitability Matrix Template for PowerPoint & Google Slides
Comparison
Porter’s Generic Strategies Matrix Template for PowerPoint & Google Slides
Business Strategy
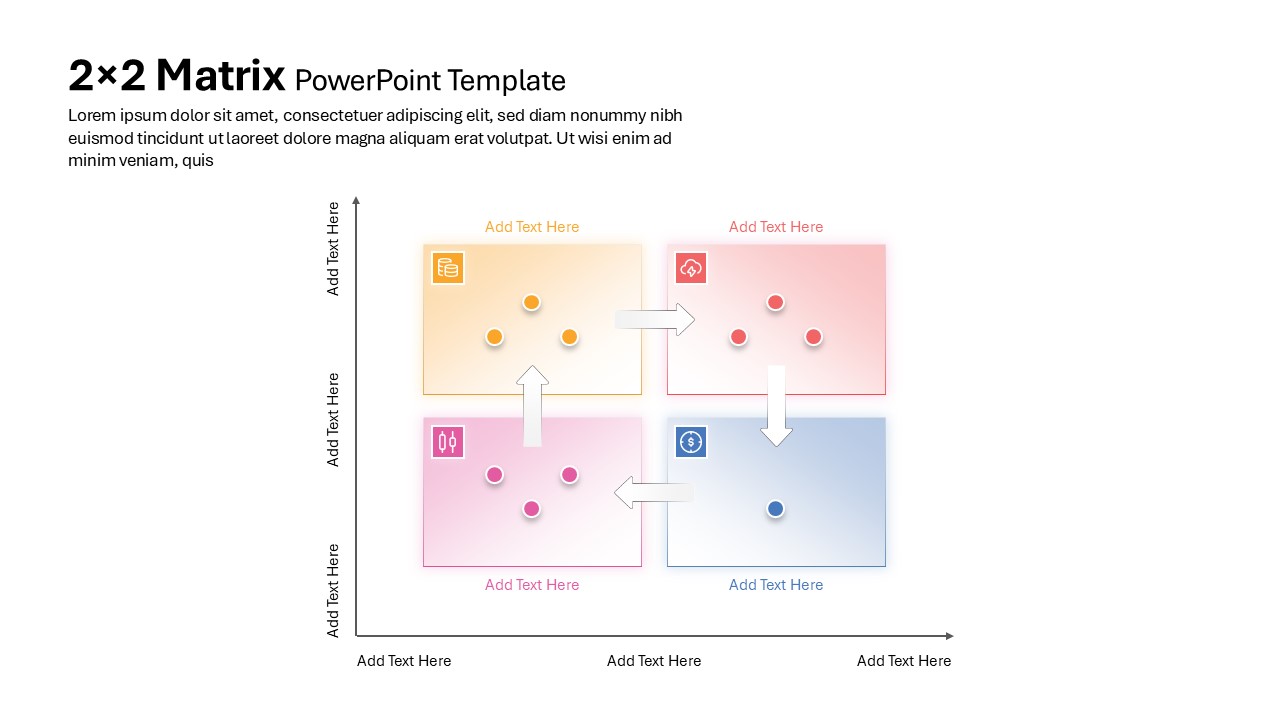
2×2 Matrix PowerPoint & Google Slides Template
Business Models
Competitor Profile Matrix Comparison Template for PowerPoint & Google Slides
Comparison Chart
Risk Scoring & Ranking Heatmap Matrix Template for PowerPoint & Google Slides
Risk Management
Feasibility Matrix Comparison Chart Template for PowerPoint & Google Slides
Comparison Chart
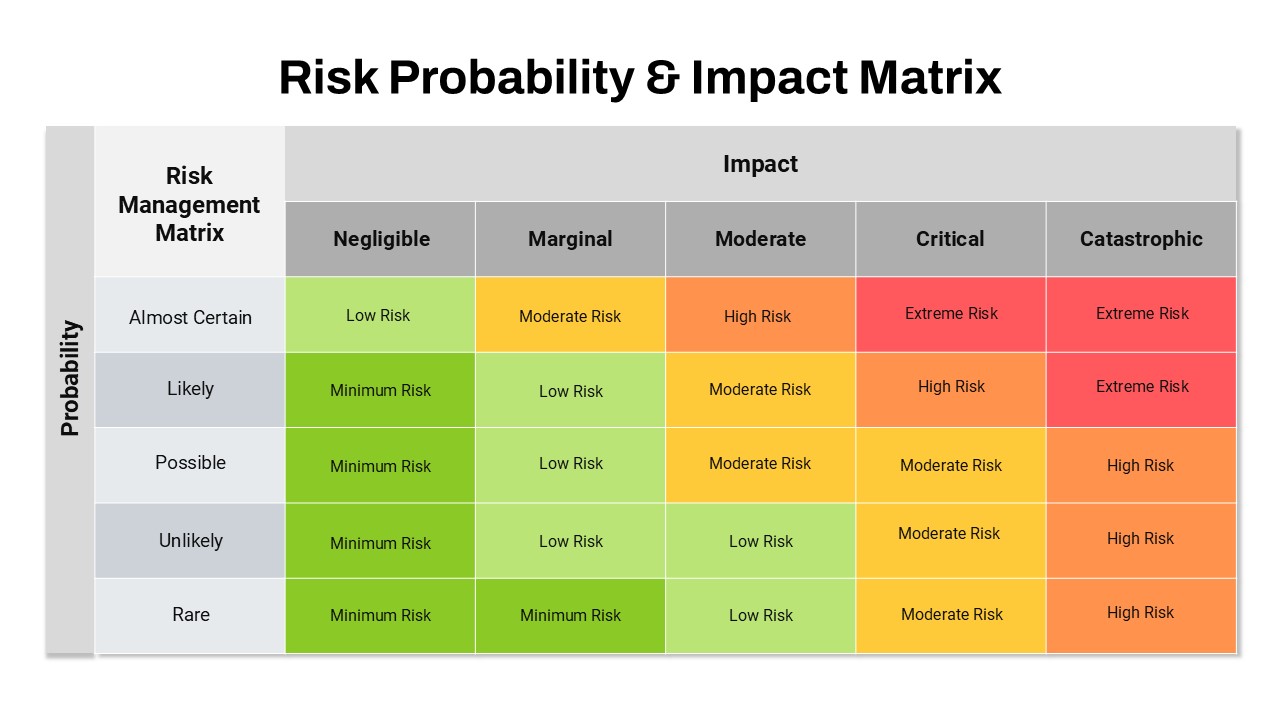
Risk Probability and Impact Matrix Template for PowerPoint & Google Slides
Risk Management
Quantitative Risk Analysis Matrix template for PowerPoint & Google Slides
Risk Management
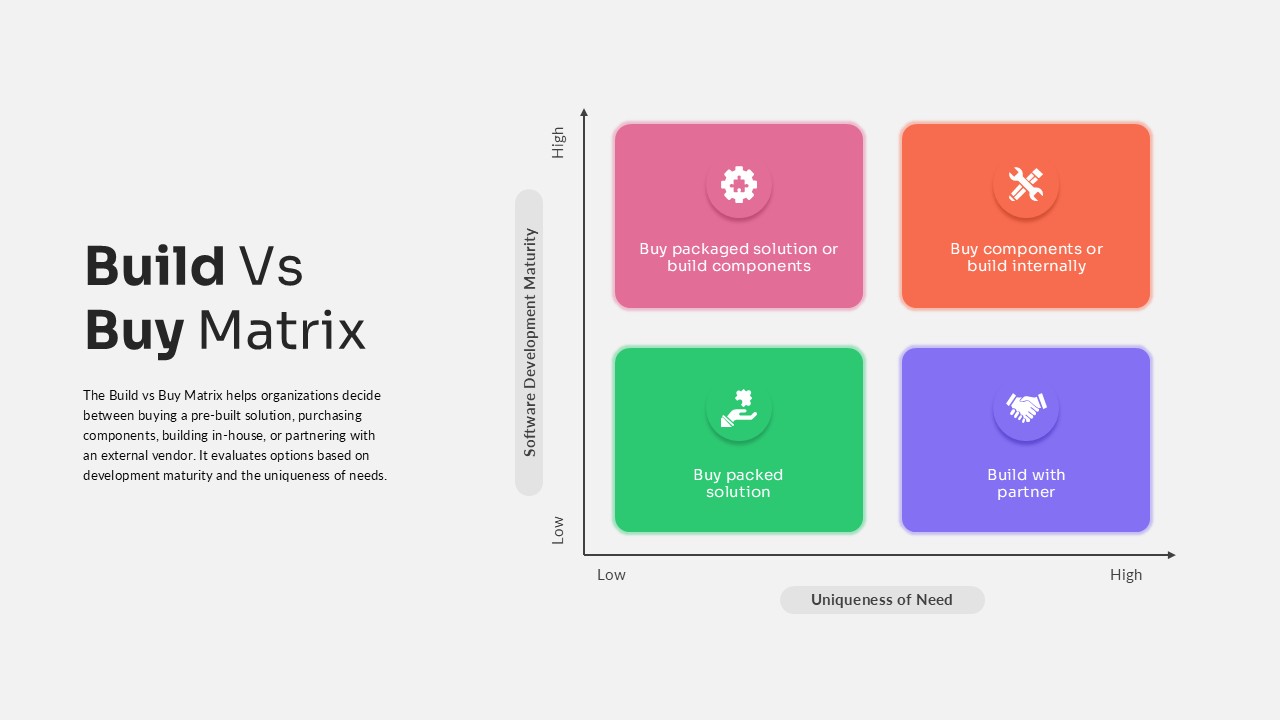
Build vs Buy Matrix Decision Framework template for PowerPoint & Google Slides
Business Strategy
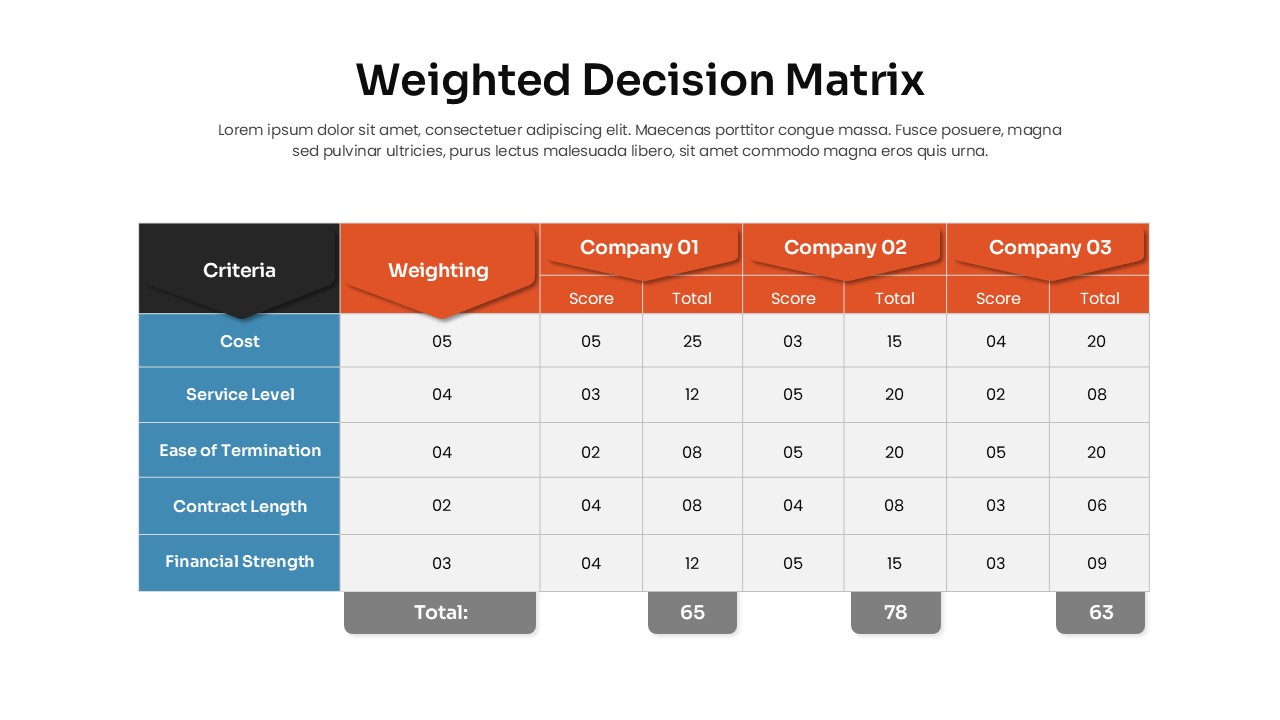
Weighted Decision Matrix template for PowerPoint & Google Slides
Business Models
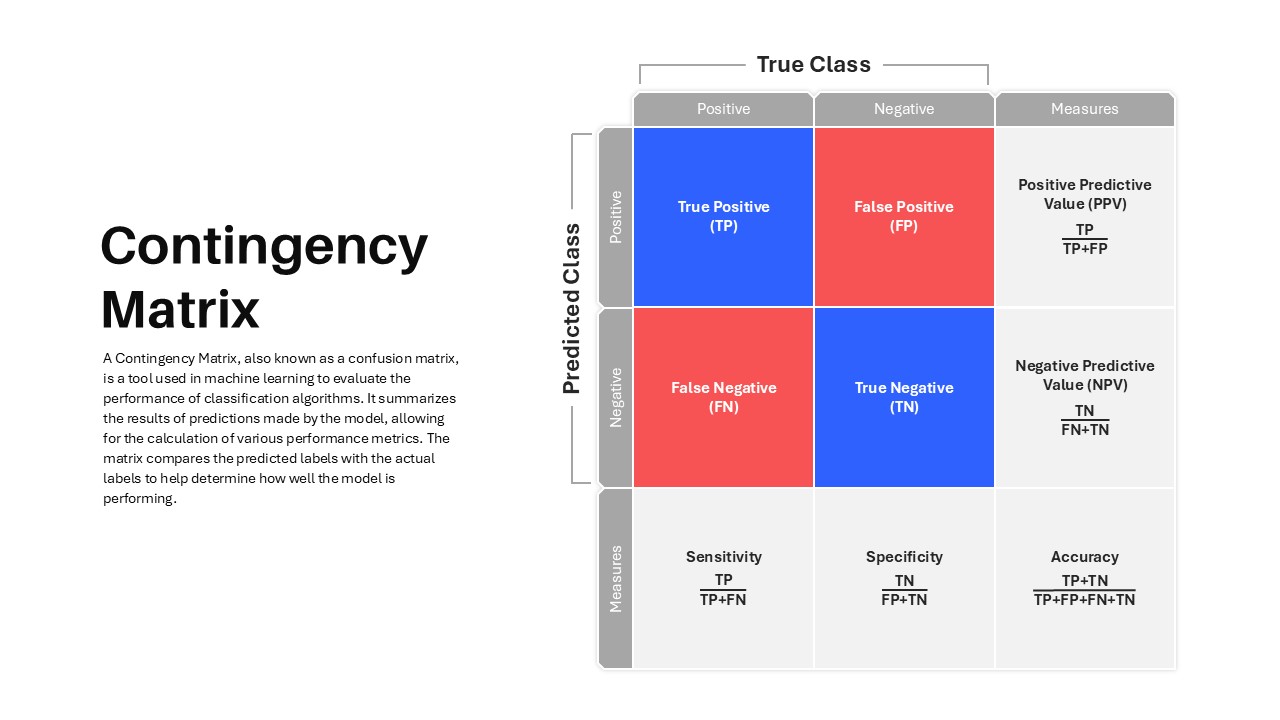
Contingency Matrix in Machine Learning template for PowerPoint & Google Slides
Technology
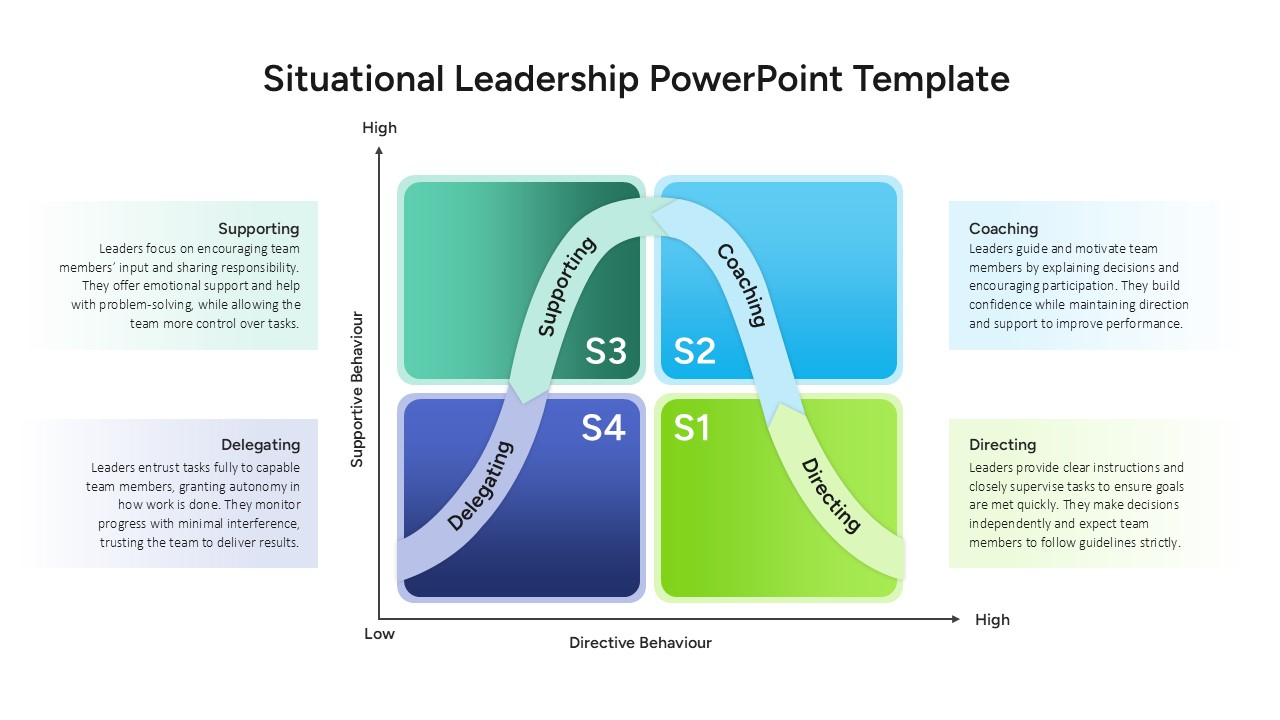
Situational Leadership Matrix Template for PowerPoint & Google Slides
Leadership
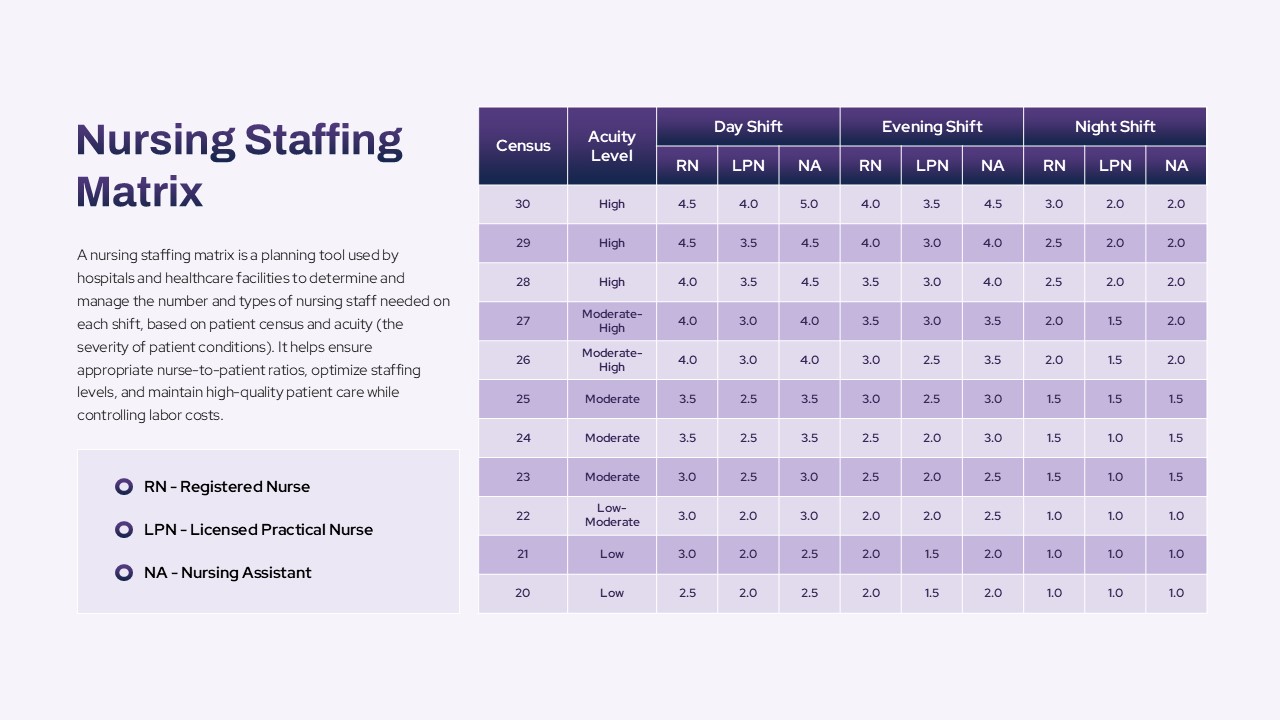
Nursing Staffing Matrix Planning Template for PowerPoint & Google Slides
Nursing
Disaster Response Role Matrix RACI Chart Template for PowerPoint & Google Slides
Project Status
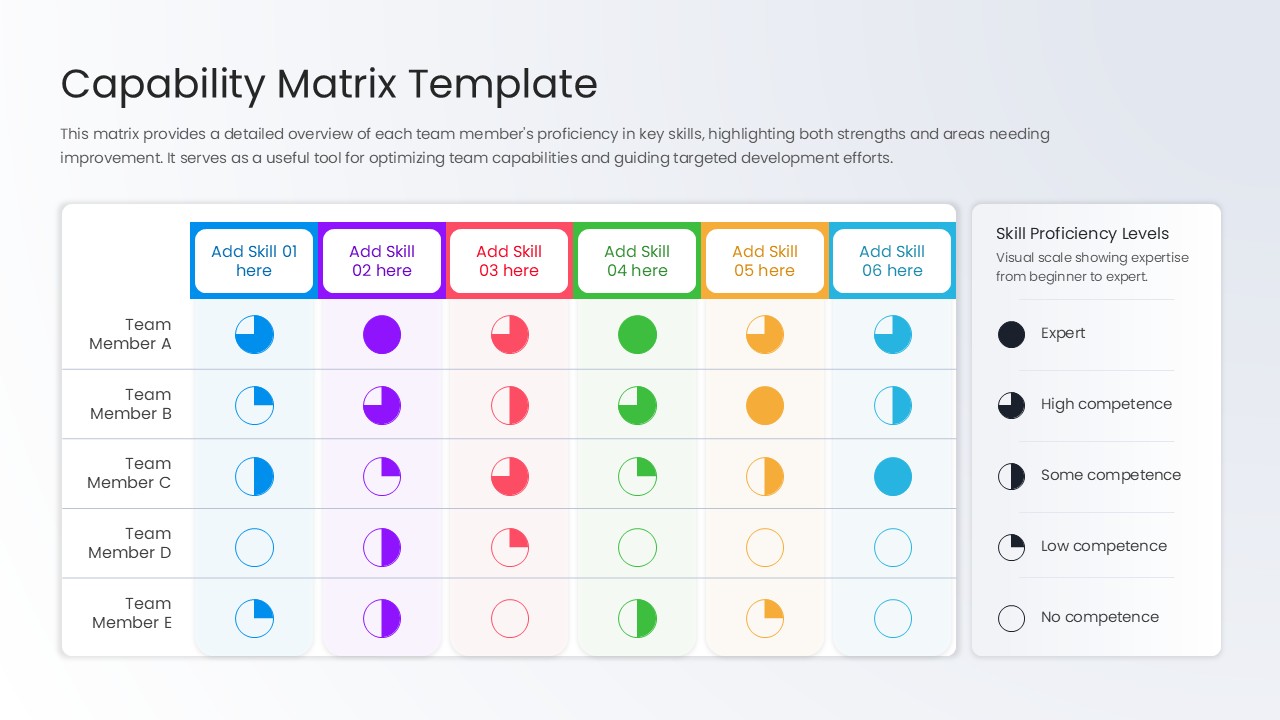
Capability Matrix Template for PowerPoint & Google Slides
HR
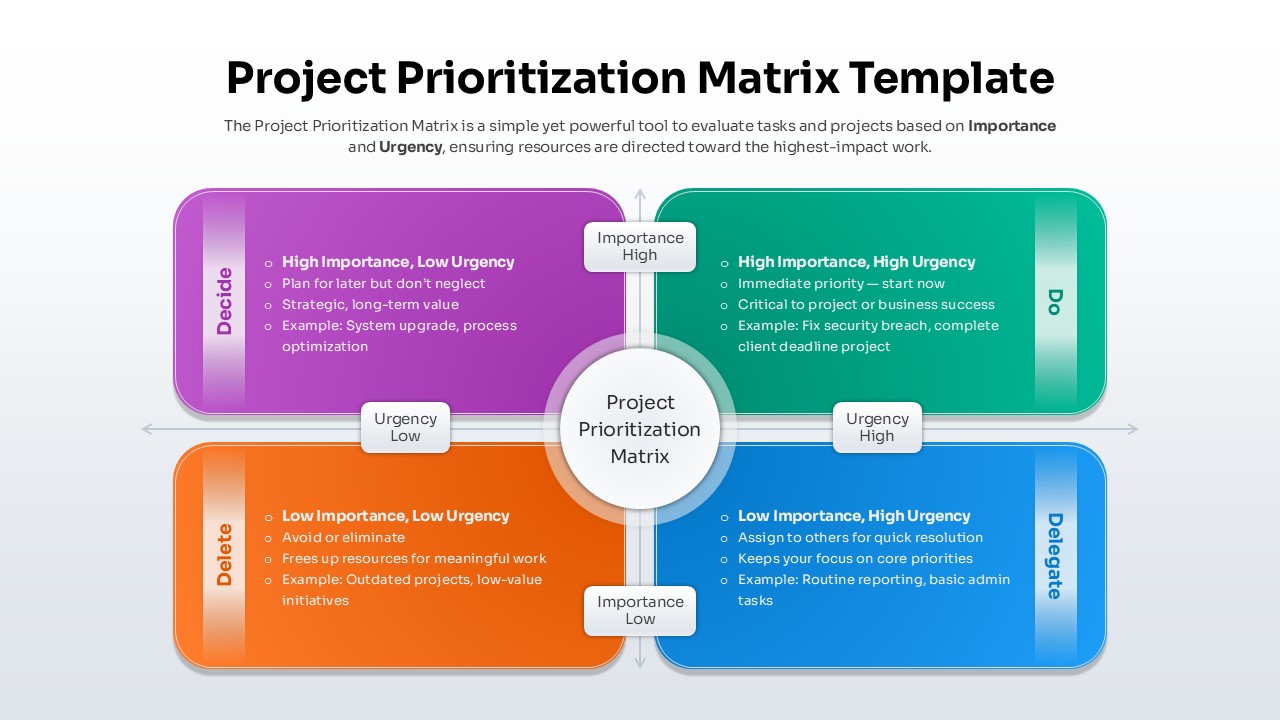
Project Prioritization Matrix Template for PowerPoint & Google Slides
Project
Personal SWOT Analysis Matrix Cards Template for PowerPoint & Google Slides
SWOT
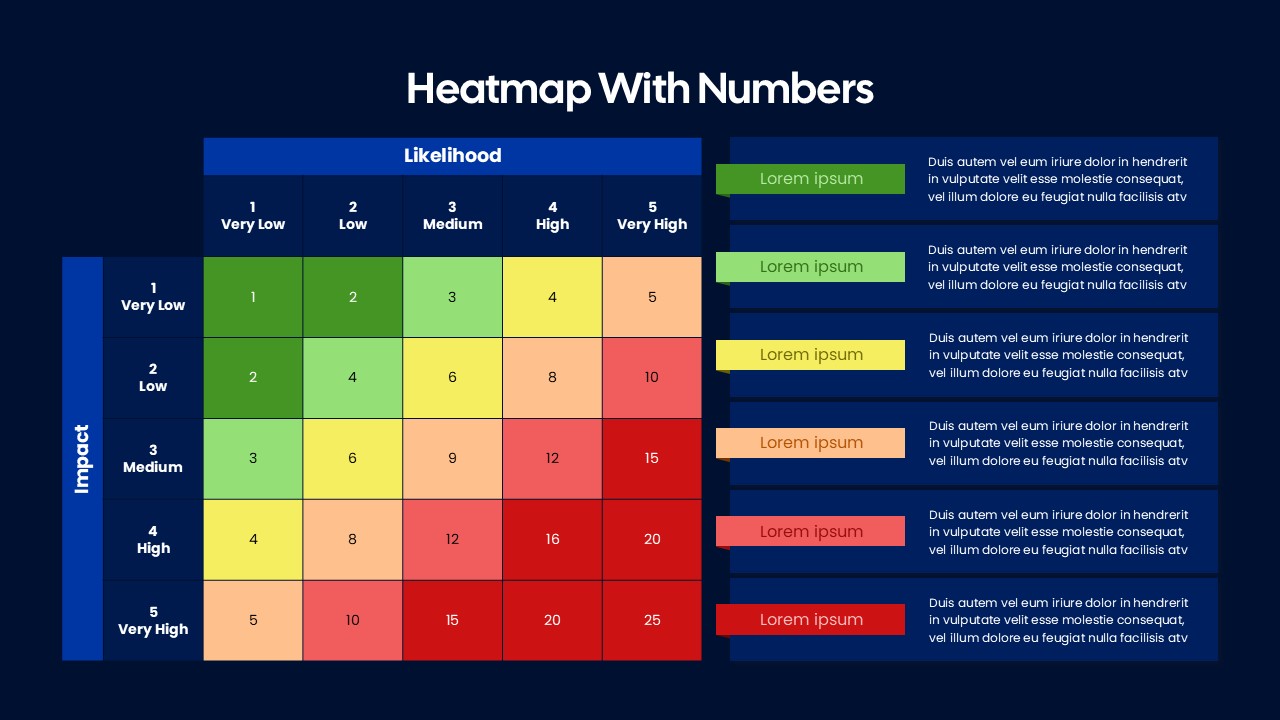
Heatmap Matrix with Numbers Template for PowerPoint & Google Slides
Project
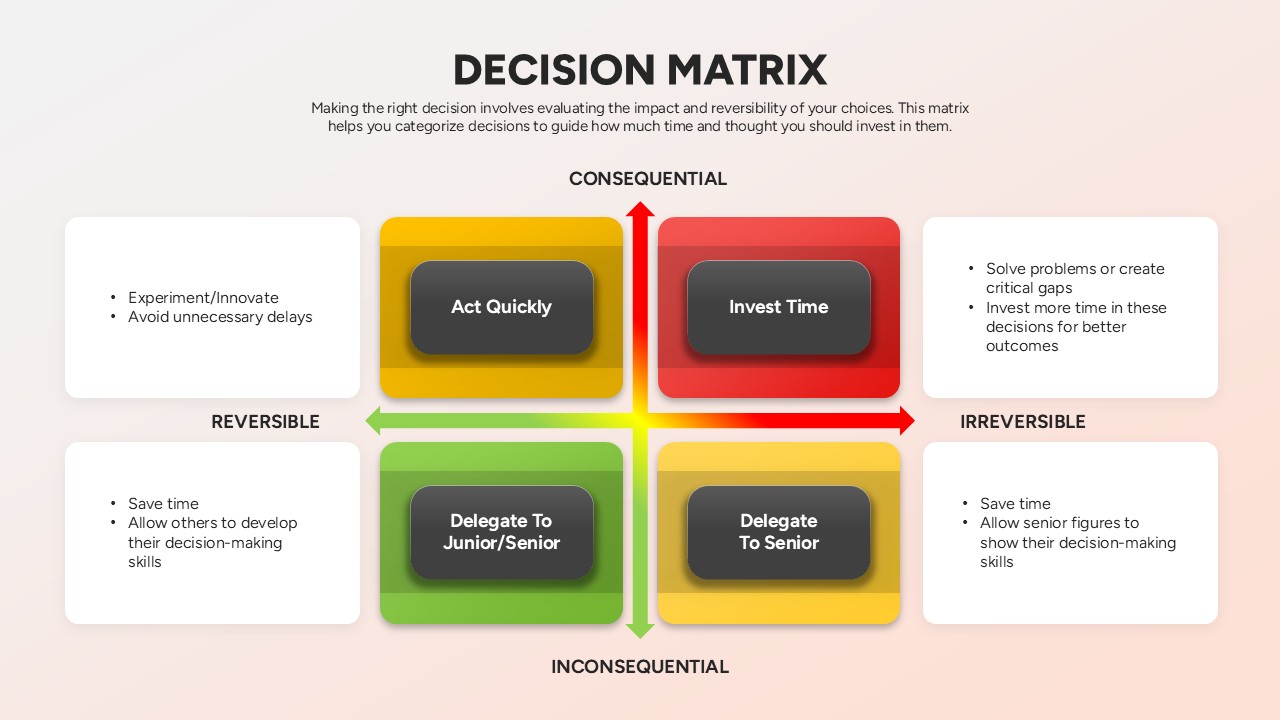
Decision Matrix Evaluation Framework Slide Template for PowerPoint & Google Slides
Leadership
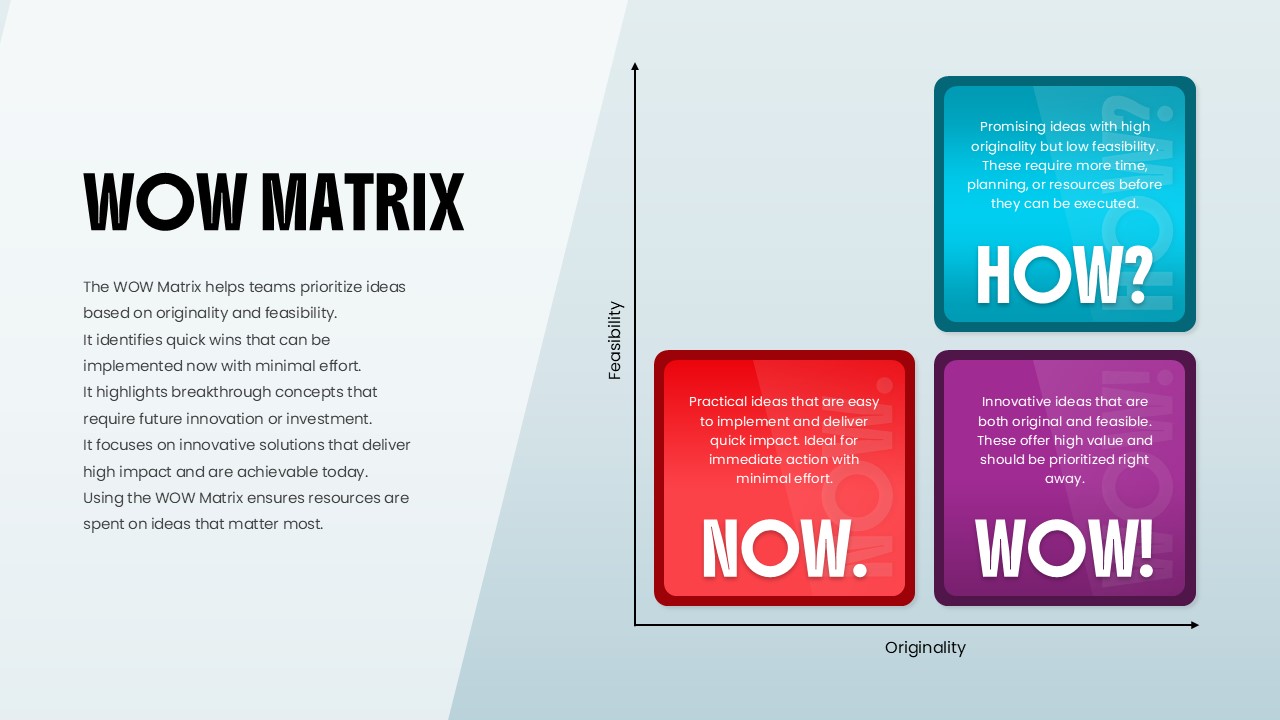
WOW Matrix Template for PowerPoint & Google Slides
Business Strategy

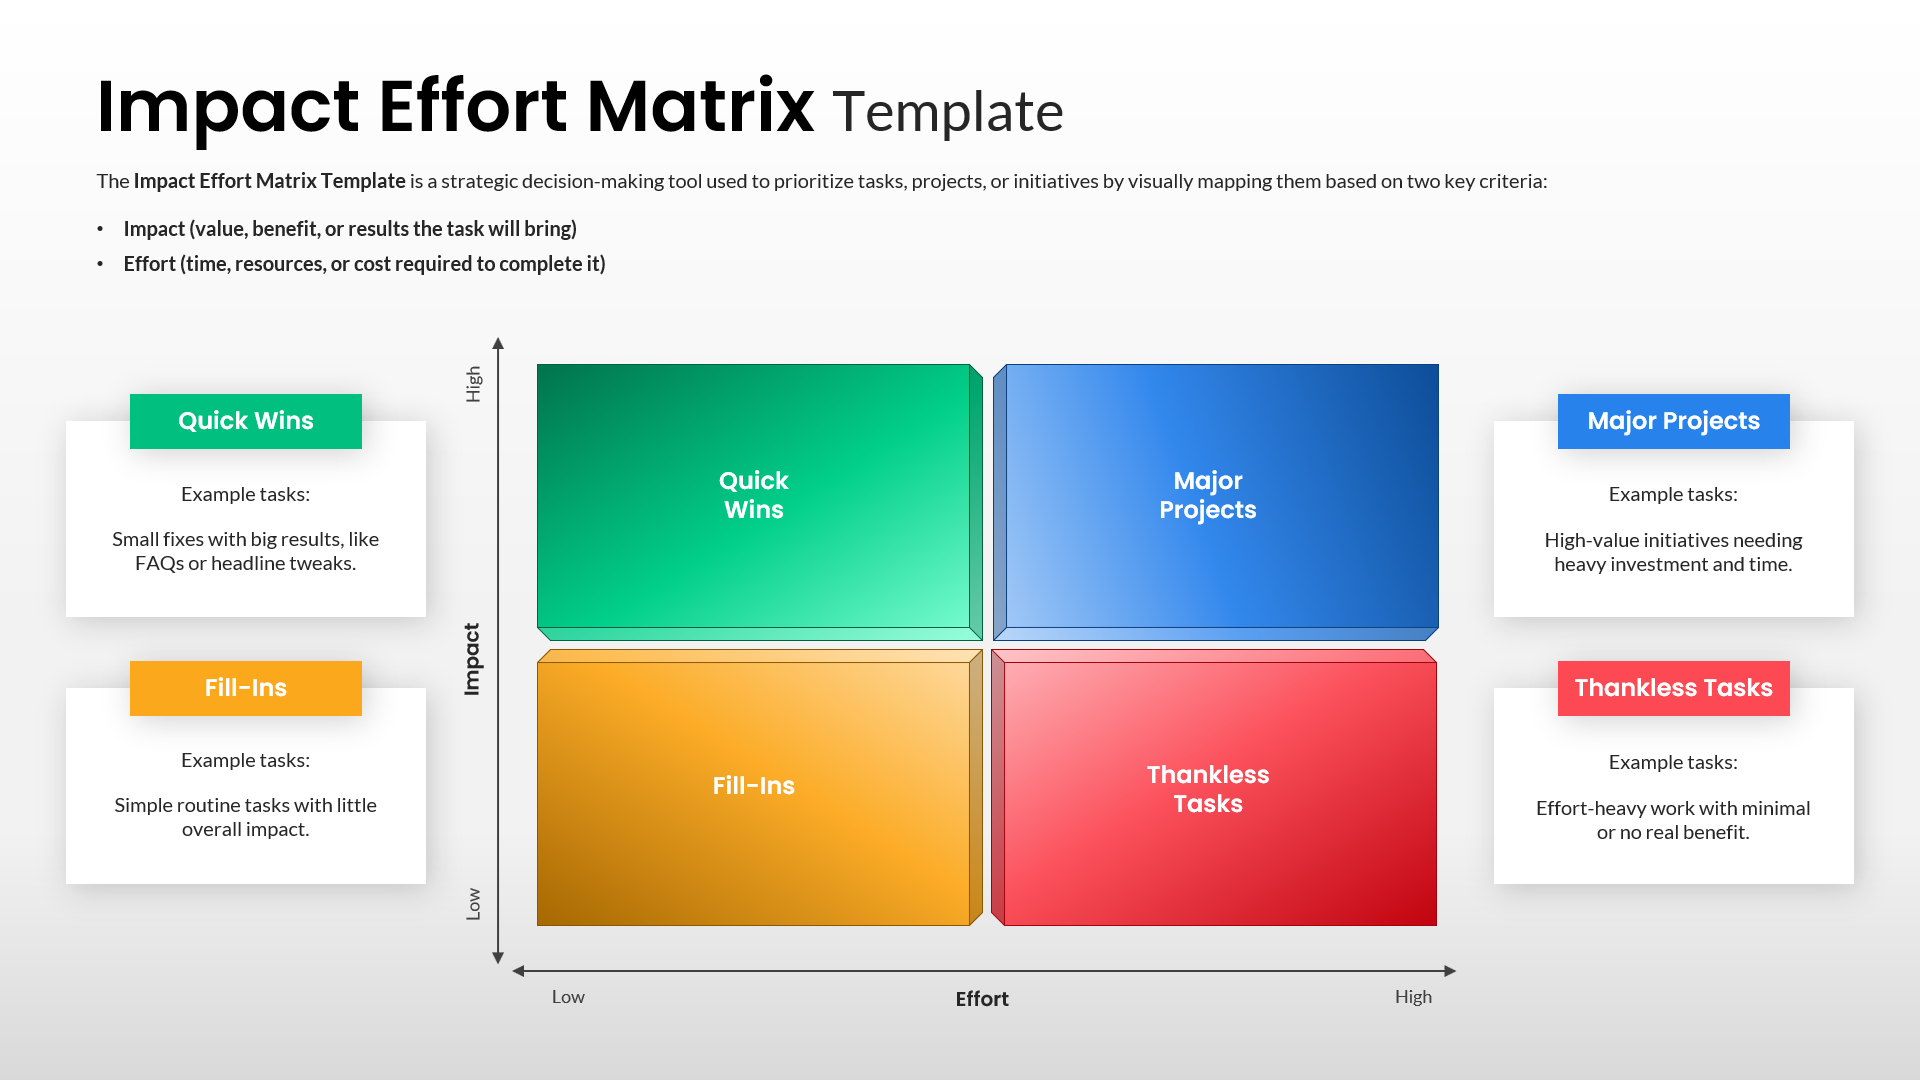
Impact Effort Matrix Template for PowerPoint & Google Slides
Comparison Chart
Ansoff Growth Matrix Template for PowerPoint & Google Slides
Business Strategy
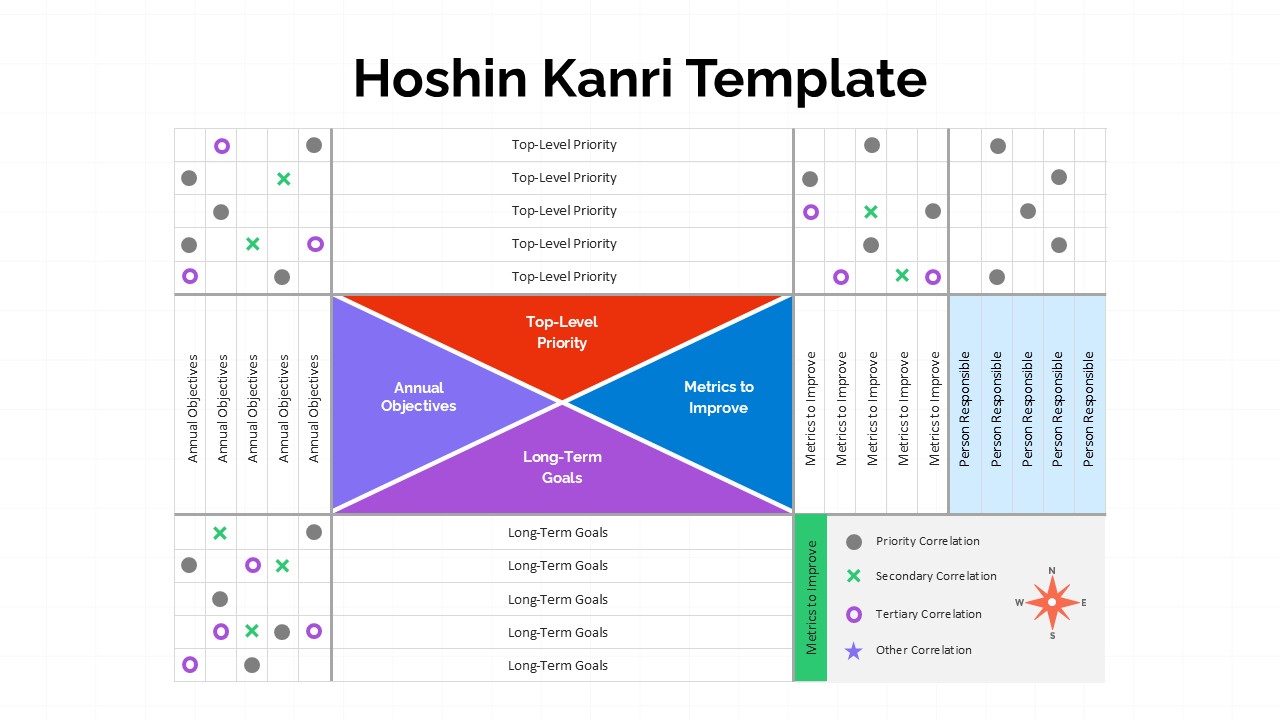
Hoshin Kanri Strategic Planning Matrix Template for PowerPoint & Google Slides
Business Strategy
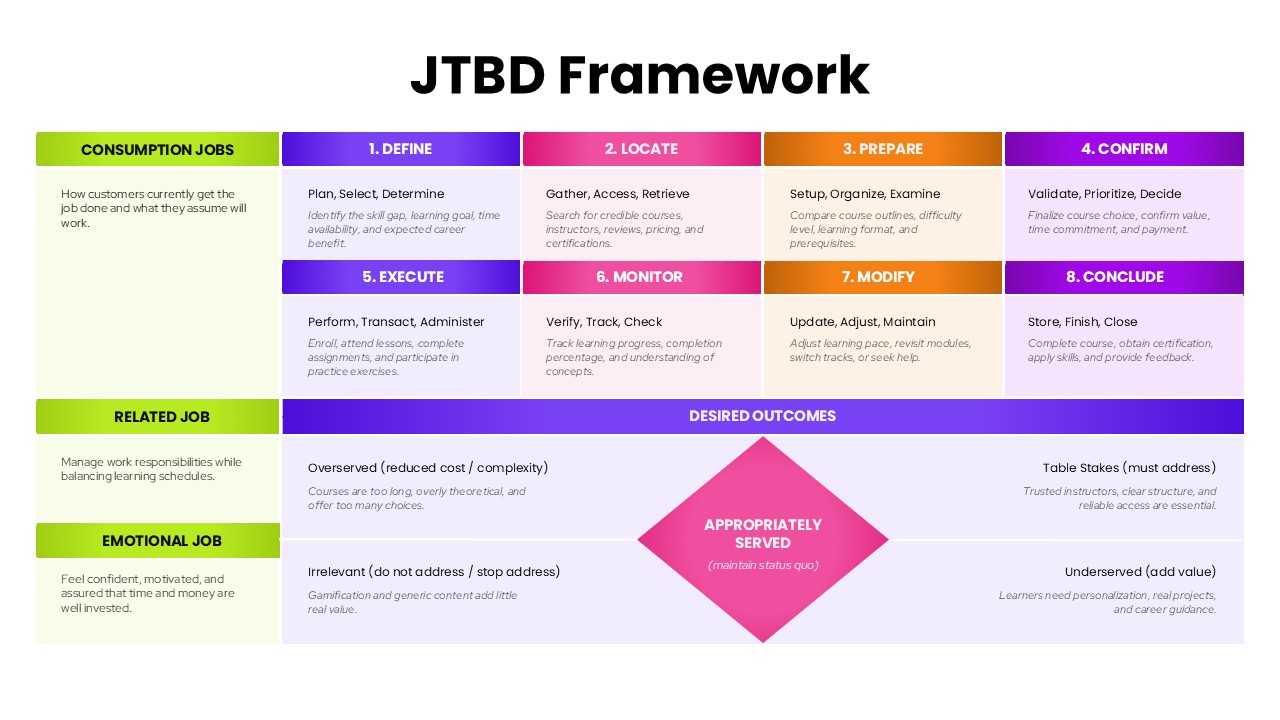
JTBD Framework Process and Outcomes Matrix Template for PowerPoint & Google Slides
Marketing
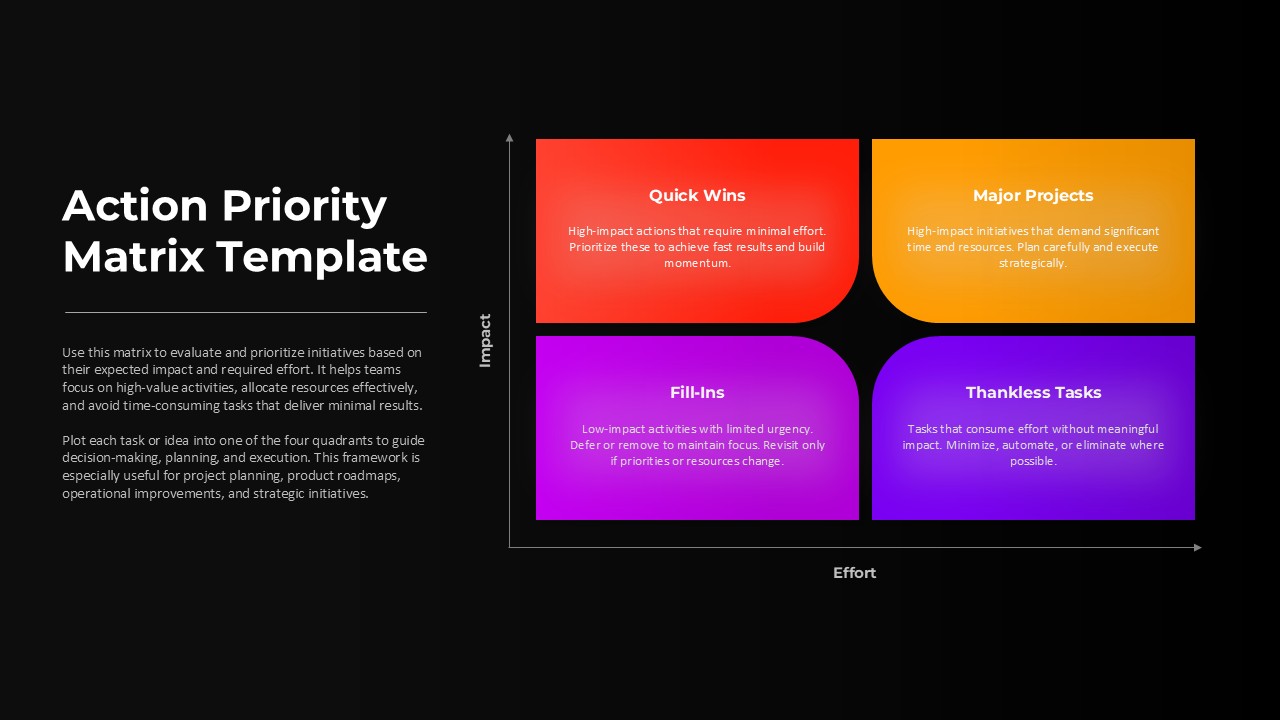
Action Priority Impact Effort Matrix Template for PowerPoint & Google Slides
Business Strategy