Machine Learning Diagram Template for PowerPoint & Google Slides


Description
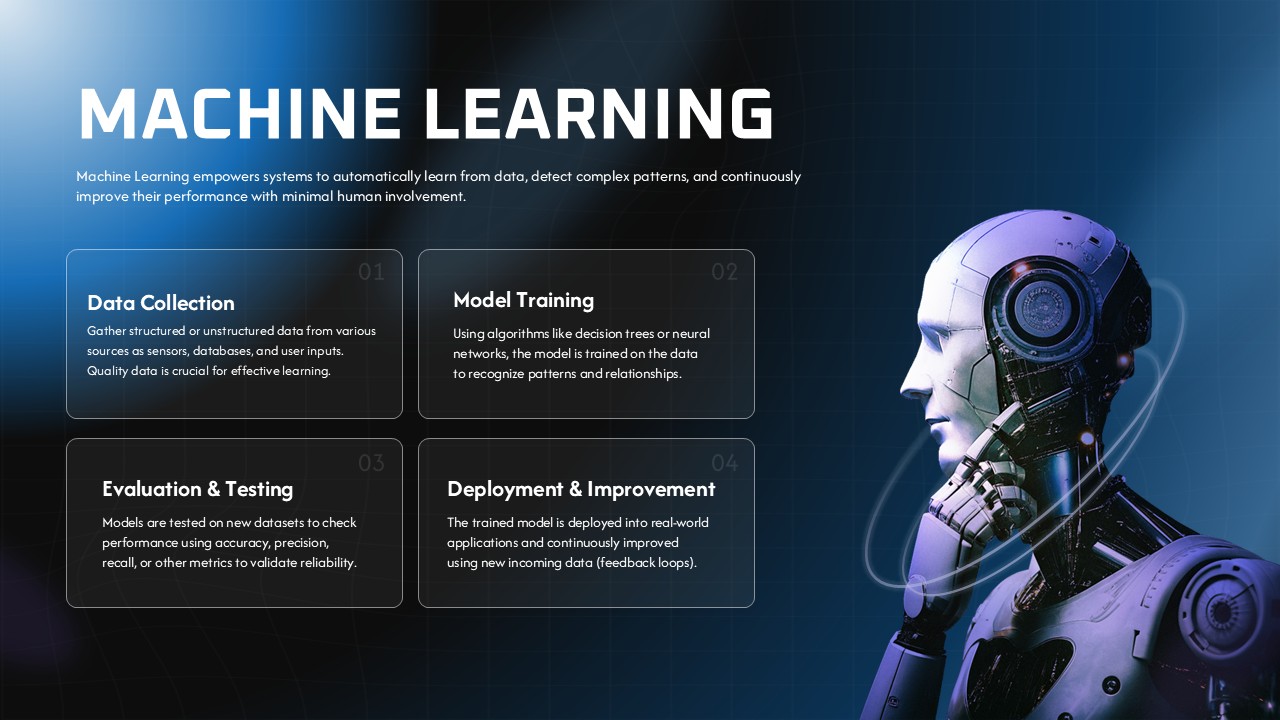
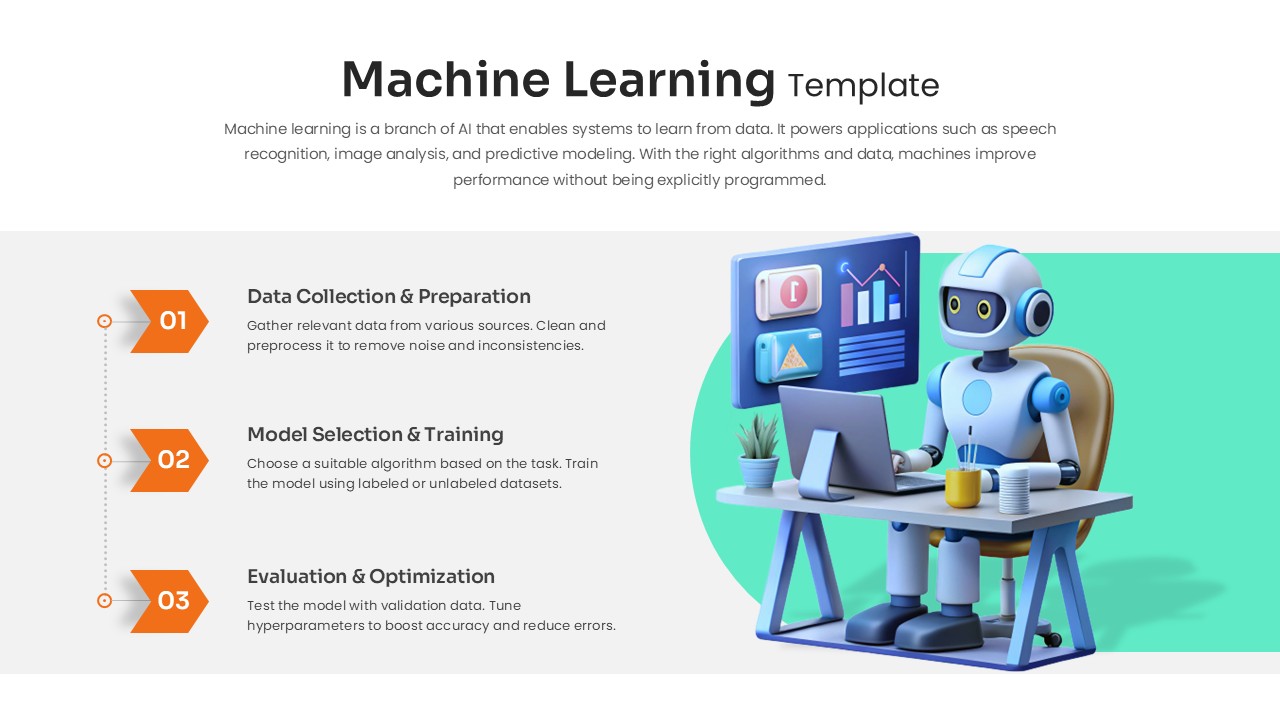
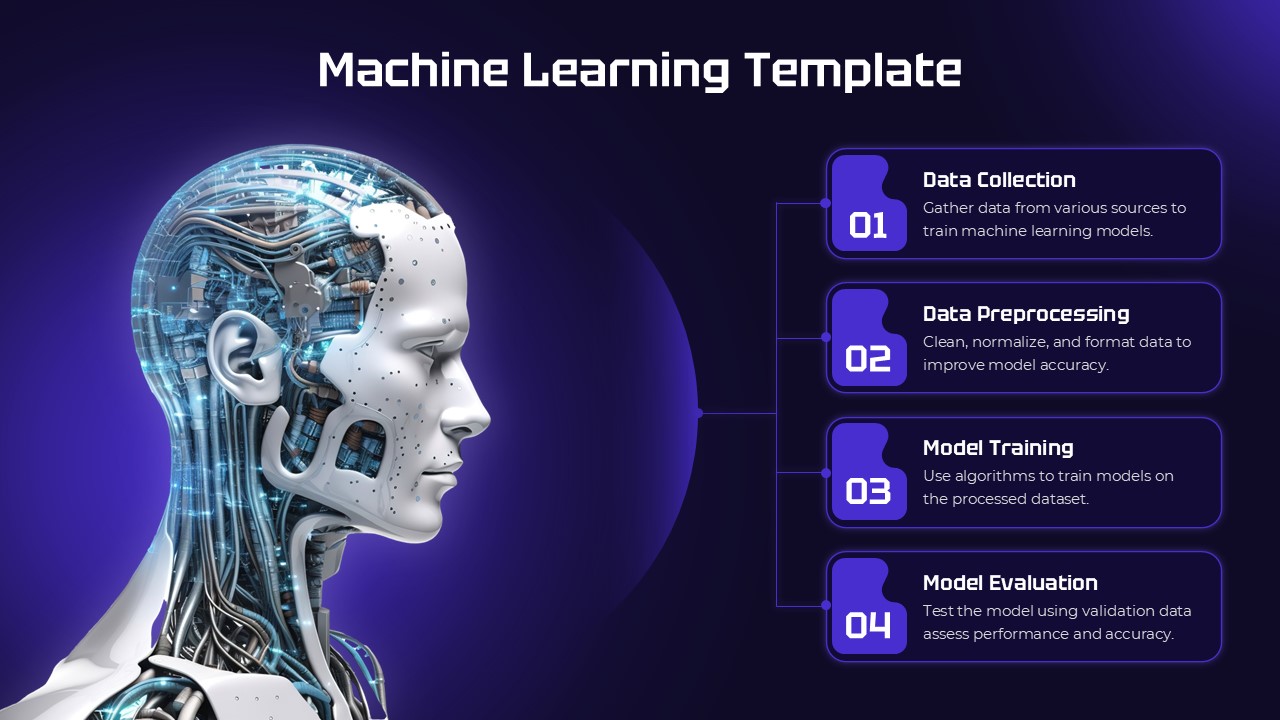
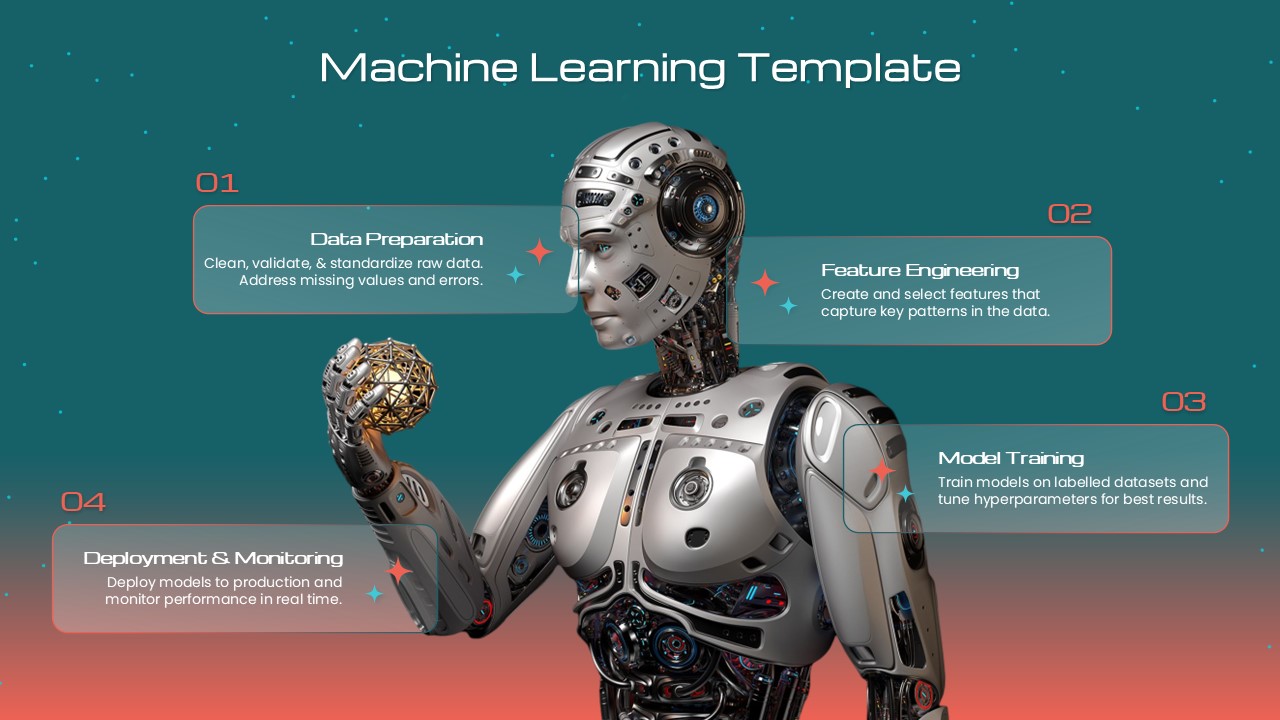
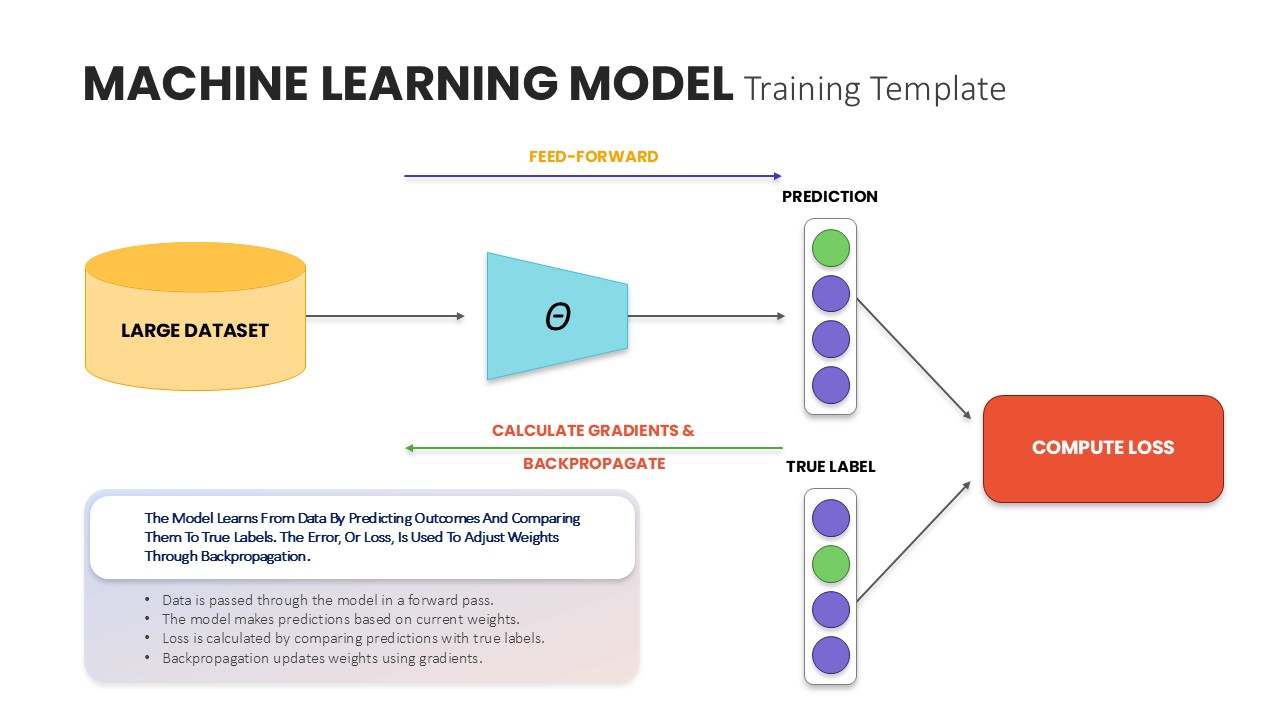
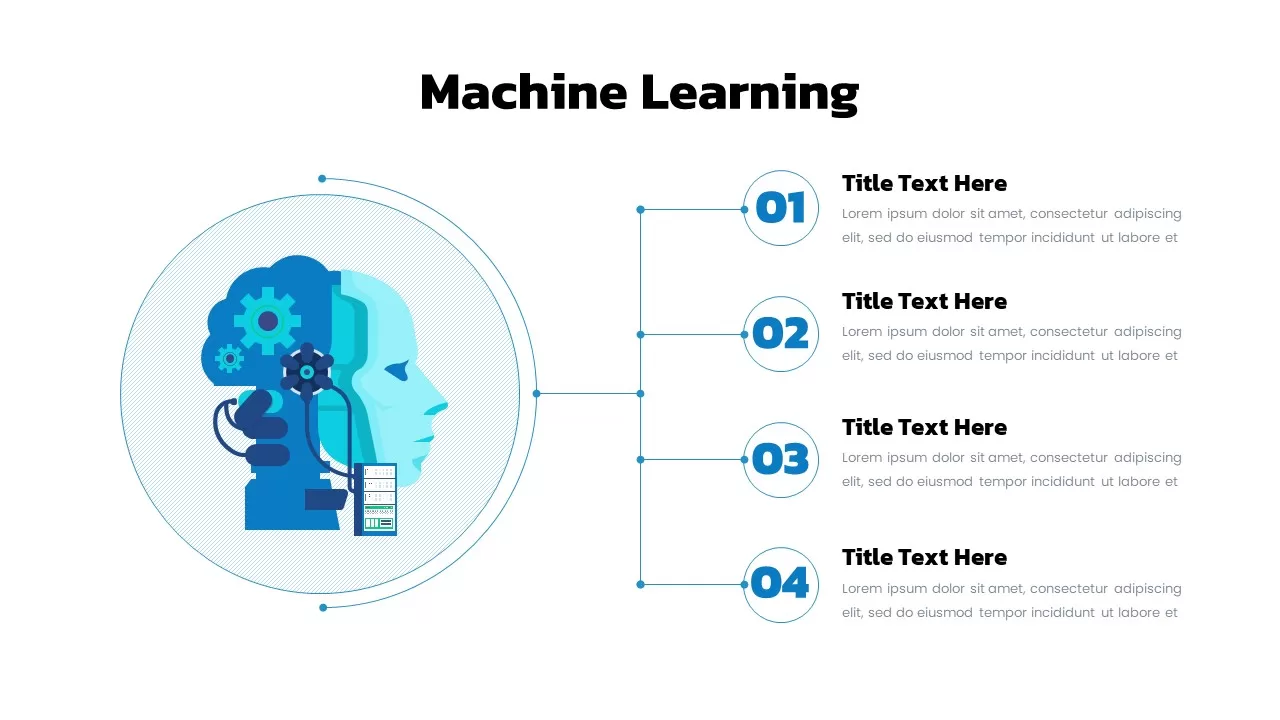
Leverage this versatile machine learning process diagram slide to present key stages of any AI workflow with clarity and visual impact. The left side features a stylized human head silhouette integrated with gears, circuit lines, and server racks, embodying core elements of data ingestion, algorithmic logic, and computational infrastructure. On the right, four numbered circular markers are connected by a sleek vertical connector bar. Each marker anchors a bold headline and text block, allowing you to detail specific phases—data preparation, model training, validation, and production deployment—in a clean, sequential flow that guides audience focus.
The minimalist design pairs a crisp white background with balanced blue and cyan accents, while the bold black title “Machine Learning” ensures immediate recognition of the topic. Subtle dashed patterns and line elements add visual depth without overwhelming the content. All graphics are vector-based and fully editable: swap icons, adjust number styles, or change color accents to align with corporate branding guidelines in seconds.
Engineered for maximum efficiency, this asset leverages master slides in both PowerPoint and Google Slides. You can duplicate, reorder, or resize elements on-the-fly without resolution loss, and placeholder text areas enable rapid customization. Integration with slide libraries or team templates ensures consistent design language across decks.
Whether you’re preparing an executive summary for stakeholders, a technical demo for engineering teams, or an educational module for students, this slide streamlines the ideation-to-delivery process. Eliminate formatting headaches and version-control issues by using this ready-to-go layout that maintains full clarity across devices.
Beyond core AI presentations, repurpose this layout for data pipelines, DevOps workflows, performance metrics, or process optimizations. Simply update headers and icons to map any four-step sequence in your next slide deck.
Who is it for
Data scientists, AI engineers, and technology consultants will benefit from this slide when outlining complex ML workflows. Product managers, CTOs, and educators can also leverage its clear sequential layout to communicate technical roadmaps, deployment stages, or training modules.
Other Uses
Use this flexible four-step diagram to illustrate project milestones, DevOps processes, feature rollout plans, or performance evaluation phases. Swap the machine learning graphic for custom visuals to adapt the slide for marketing funnels, customer journey mapping, or organizational workflows.
Login to download this file

Item ID
SB03151
Related Templates

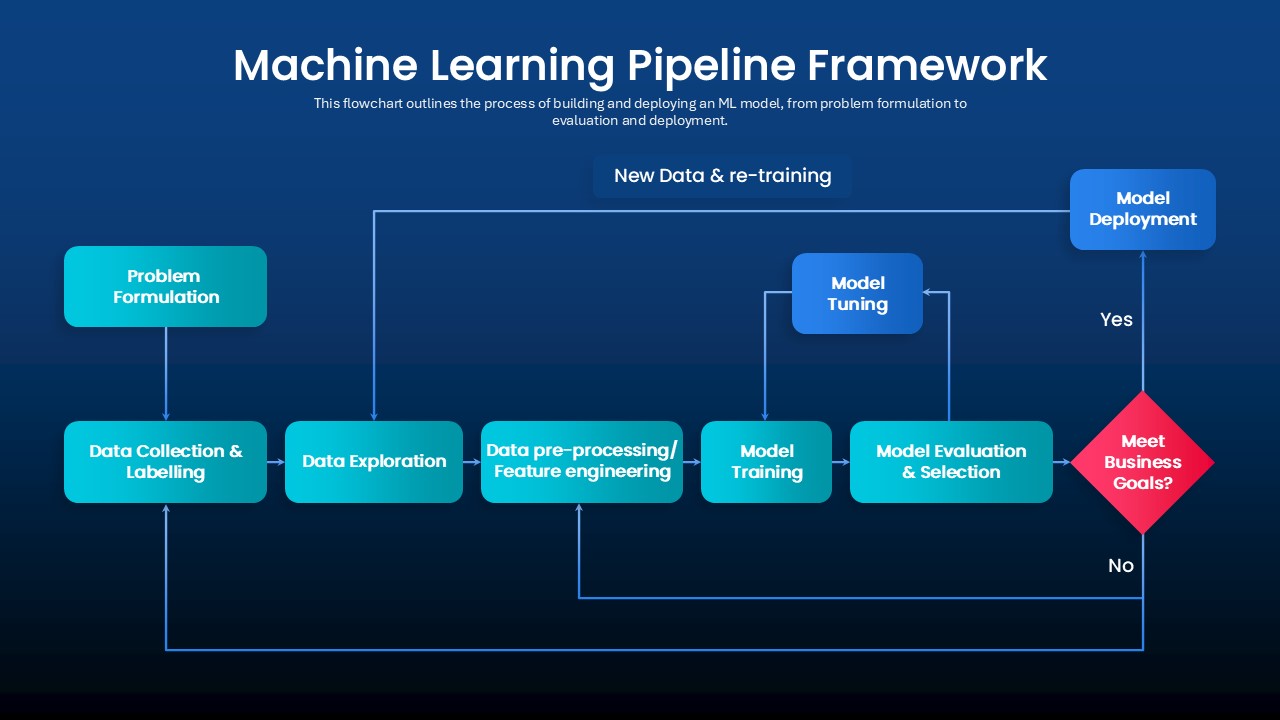
Machine Learning Pipeline Framework Template for PowerPoint & Google Slides
Charts
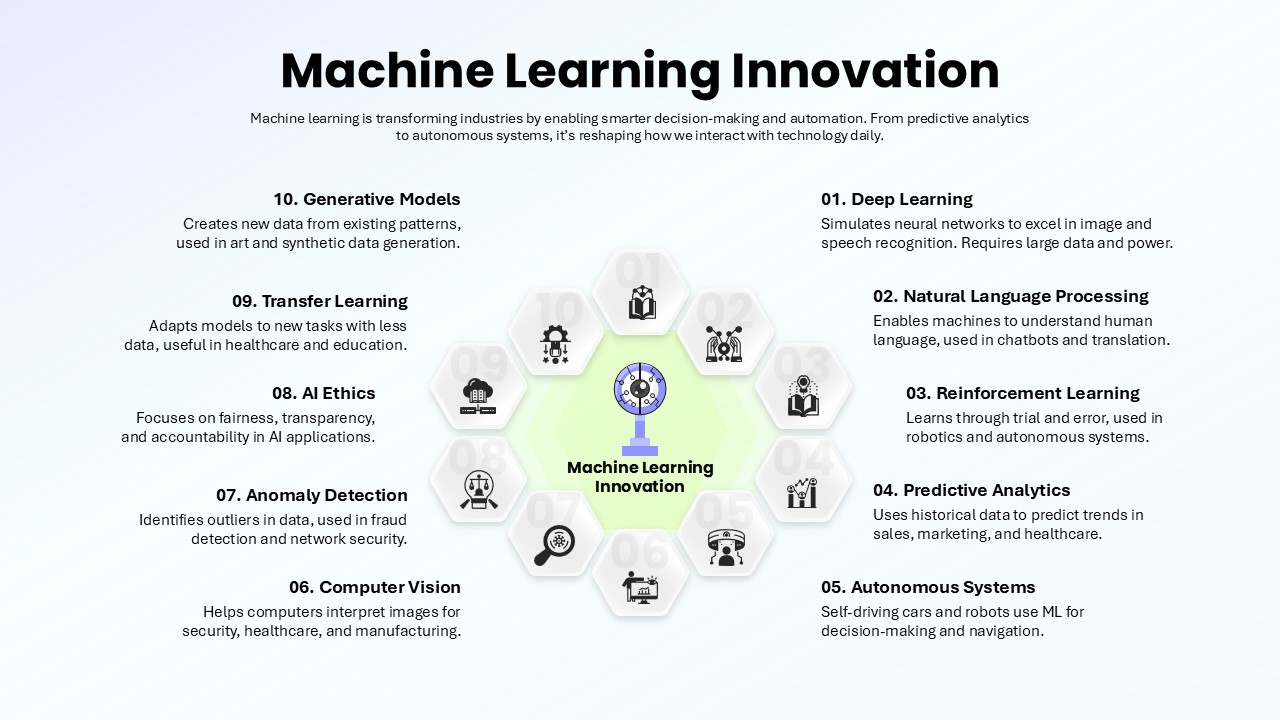
Machine Learning Innovation Overview template for PowerPoint & Google Slides
AI
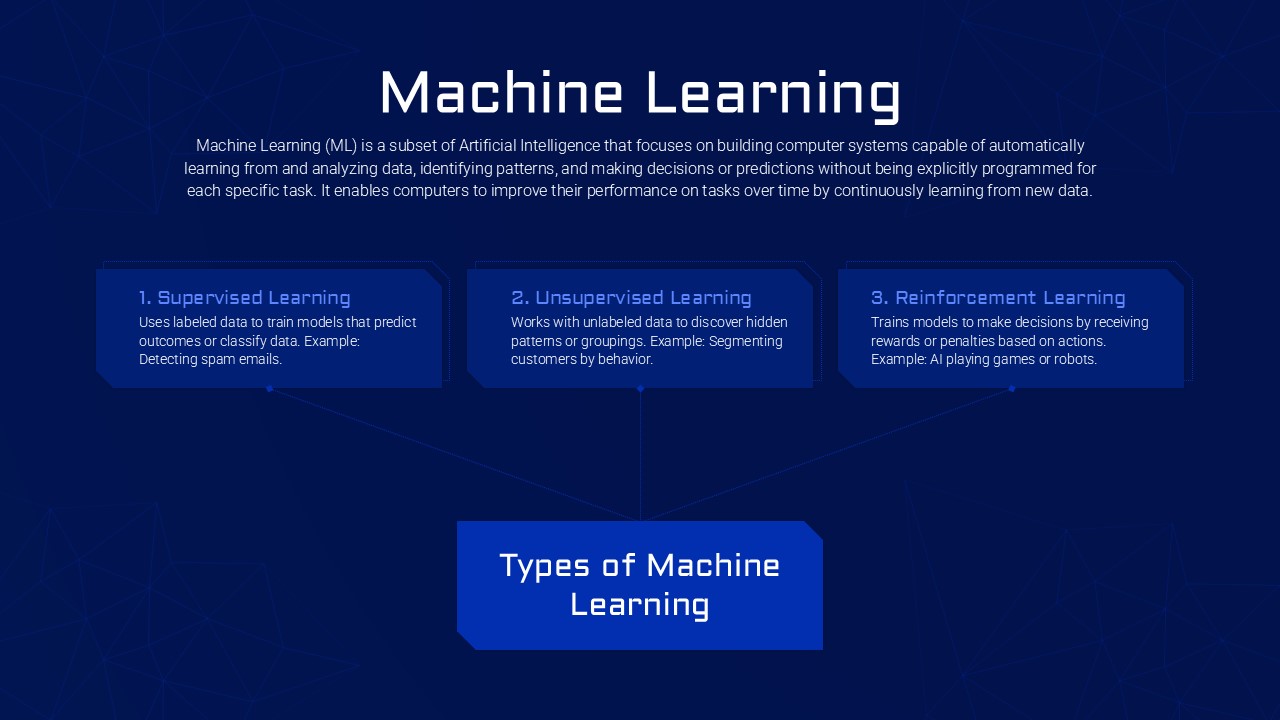
Machine Learning Types template for PowerPoint & Google Slides
Technology
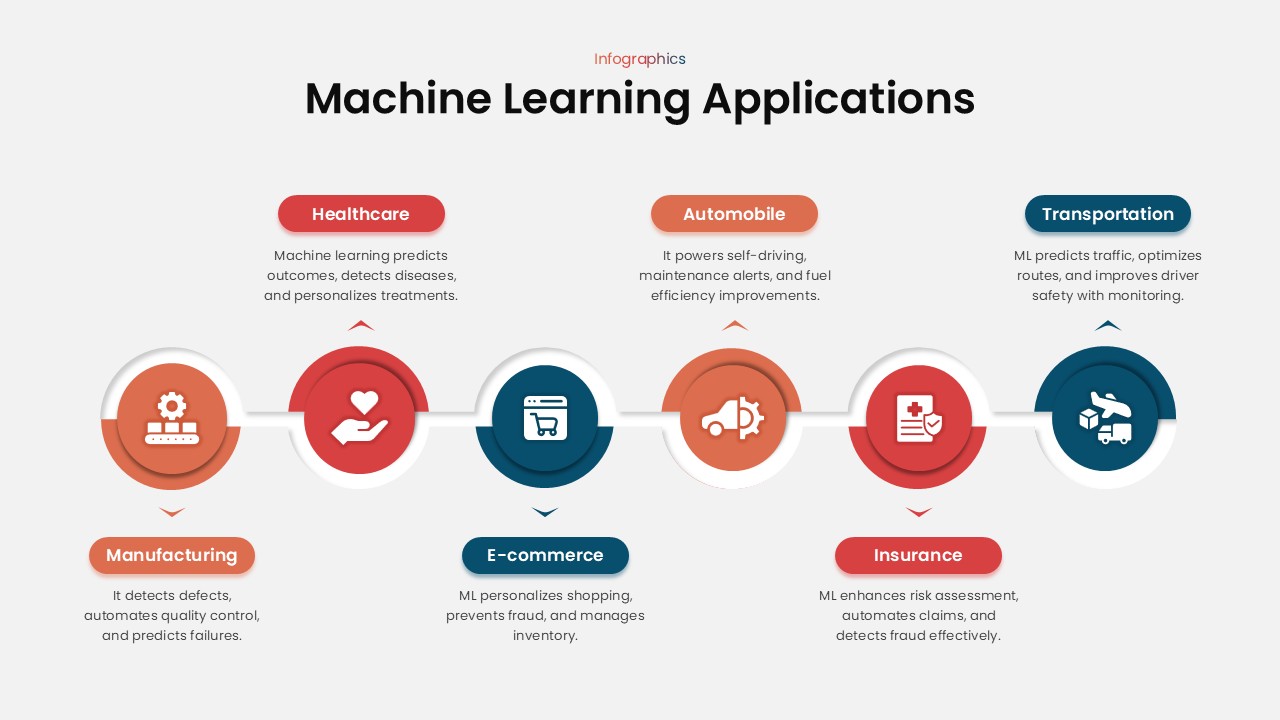
Machine Learning Applications template for PowerPoint & Google Slides
Technology
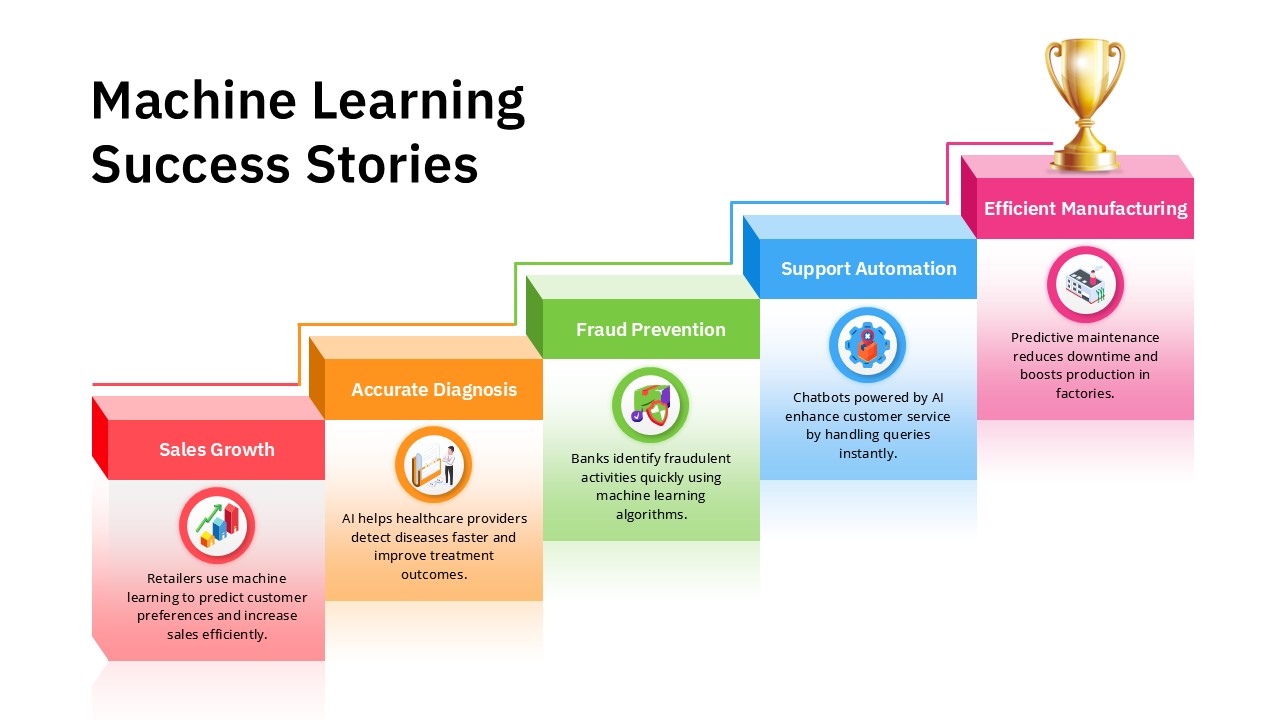
Machine Learning Success Stories Infographic Template for PowerPoint & Google Slides
Process
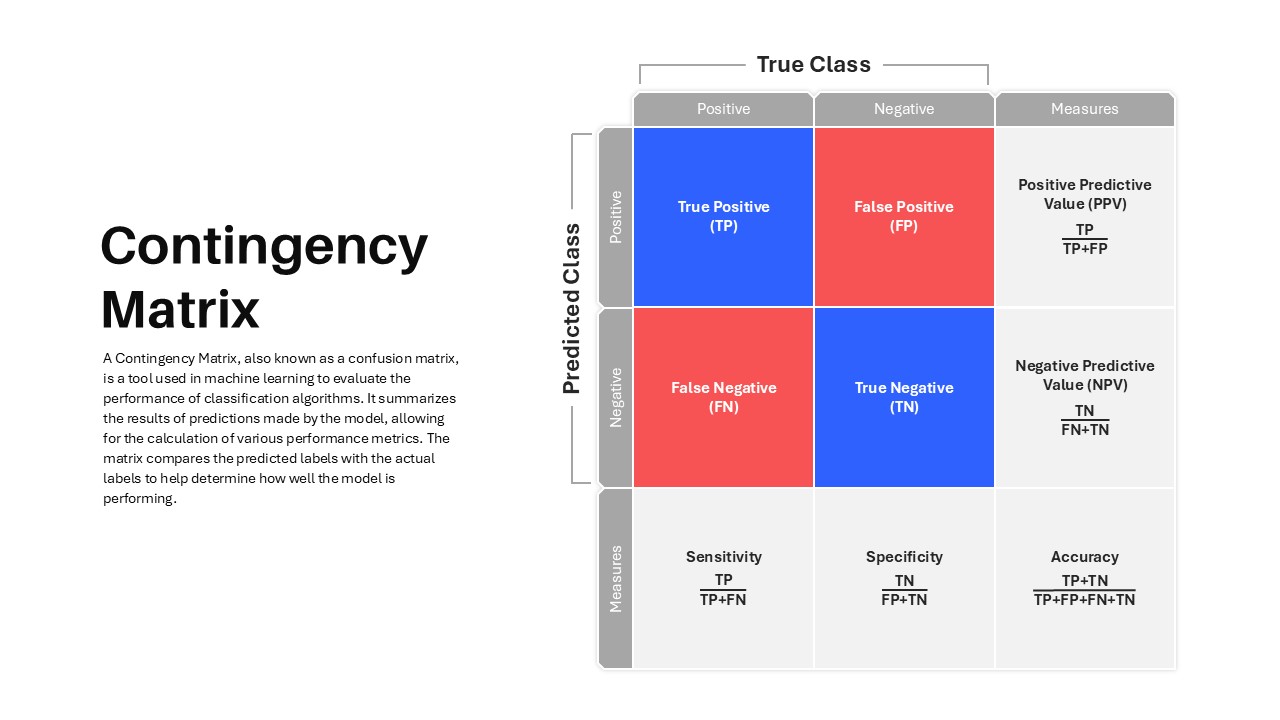
Contingency Matrix in Machine Learning template for PowerPoint & Google Slides
Technology
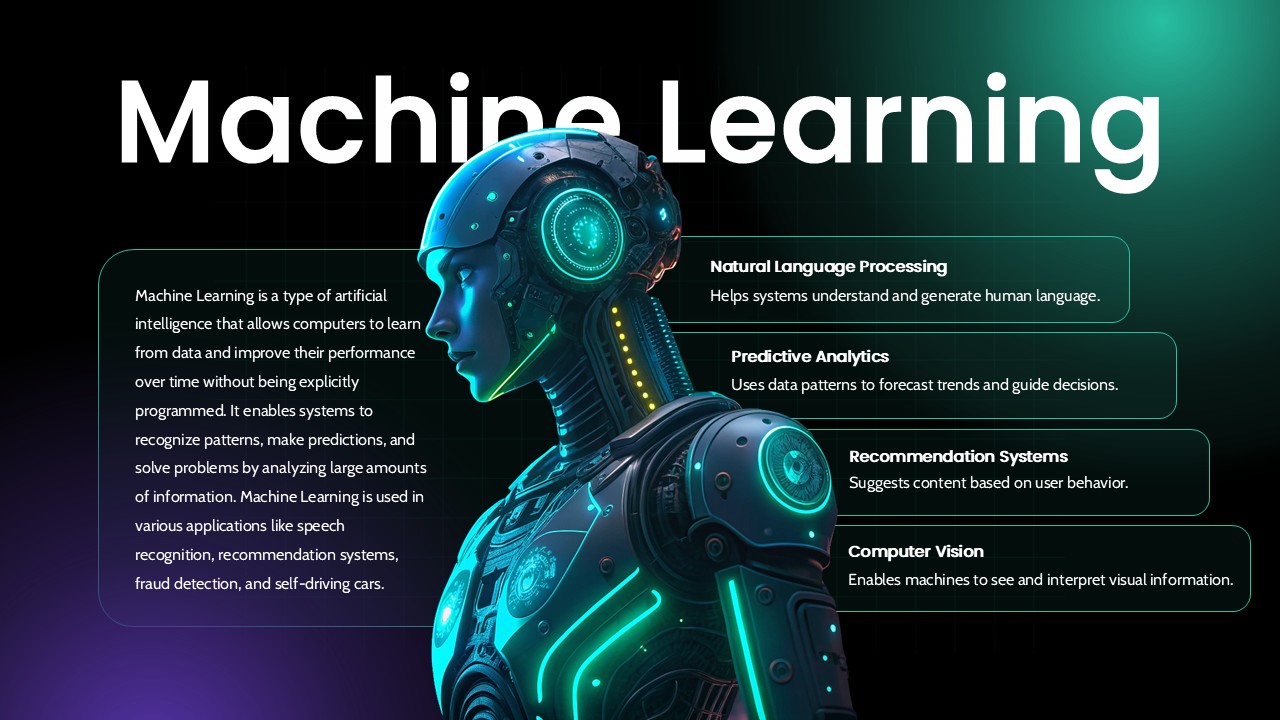
Machine Learning Overview Slide Template for PowerPoint & Google Slides
Machine Learning
Machine Learning Four-Step Process Template for PowerPoint & Google Slides
Machine Learning
Machine Learning Three-Step Process Template for PowerPoint & Google Slides
Machine Learning
Free Machine Learning Concept Slide Template for PowerPoint & Google Slides
Machine Learning
Free
Futuristic Machine Learning Workflow Template for PowerPoint & Google Slides
Machine Learning
Futuristic Machine Learning Types Overview Template for PowerPoint & Google Slides
AI
Machine Learning Pipeline Overview Template for PowerPoint & Google Slides
Machine Learning
Machine Learning Presentation Use Cases Template for PowerPoint & Google Slides
Machine Learning
Machine Learning 4-Step Workflow Template for PowerPoint & Google Slides
Machine Learning
Machine Learning Model Management Template for PowerPoint & Google Slides
Machine Learning
Machine Learning Pipeline & MLOps Flow Template for PowerPoint & Google Slides
Machine Learning
Machine Learning Process Template for PowerPoint & Google Slides
Machine Learning
Seven Stage Machine Learning Pipeline Template for PowerPoint & Google Slides
Machine Learning
Machine Learning Model Training Template for PowerPoint & Google Slides
Machine Learning
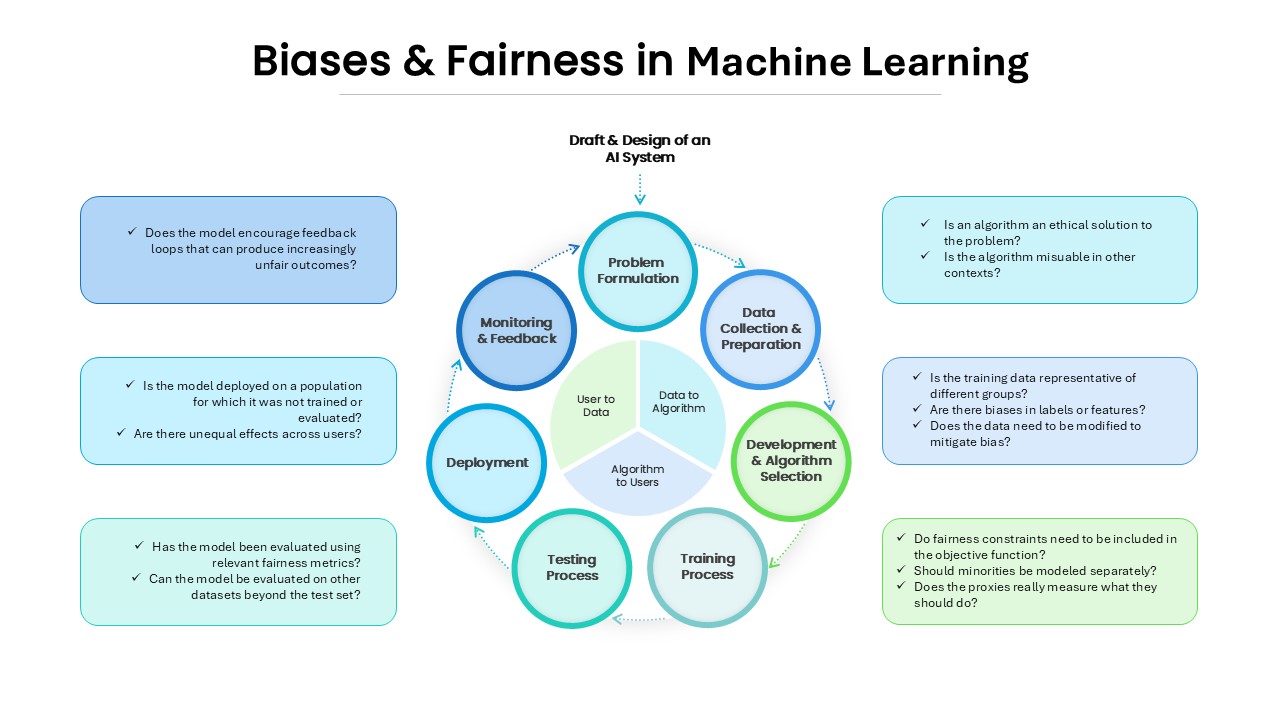
Biases and Fairness in Machine Learning for PowerPoint & Google Slides
Information Technology
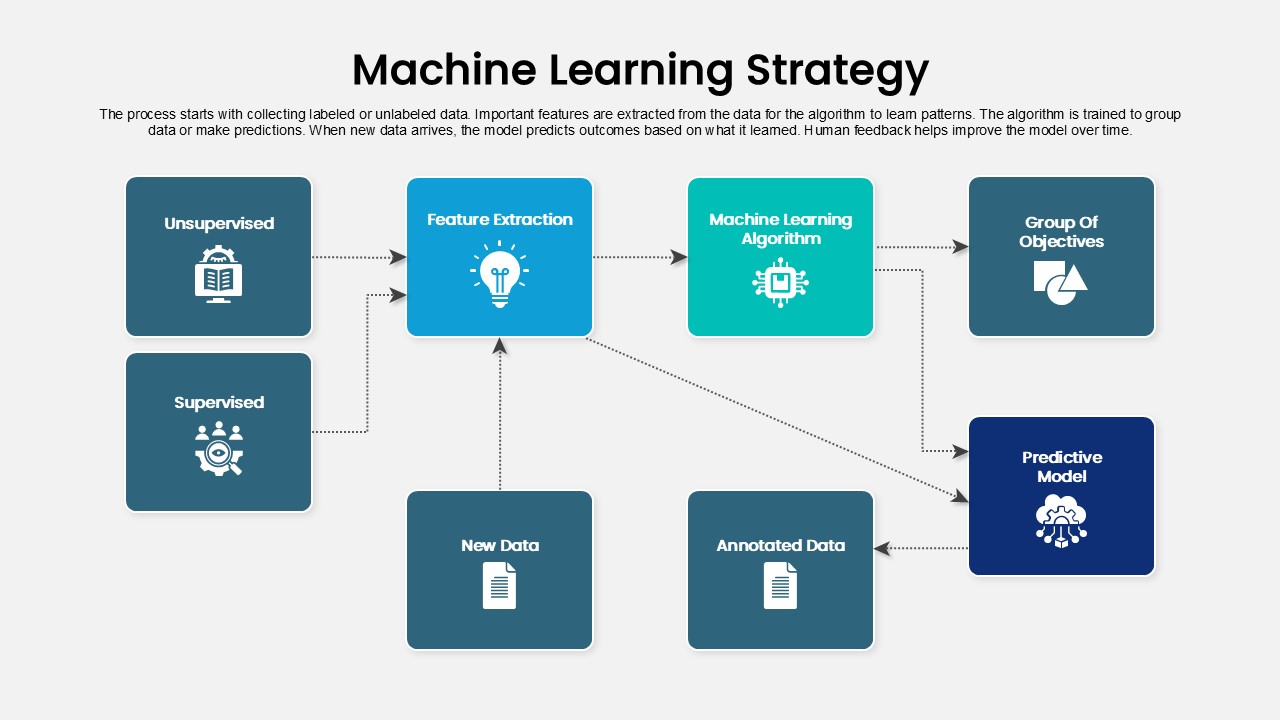
Machine Learning Strategy Flowchart
Machine Learning
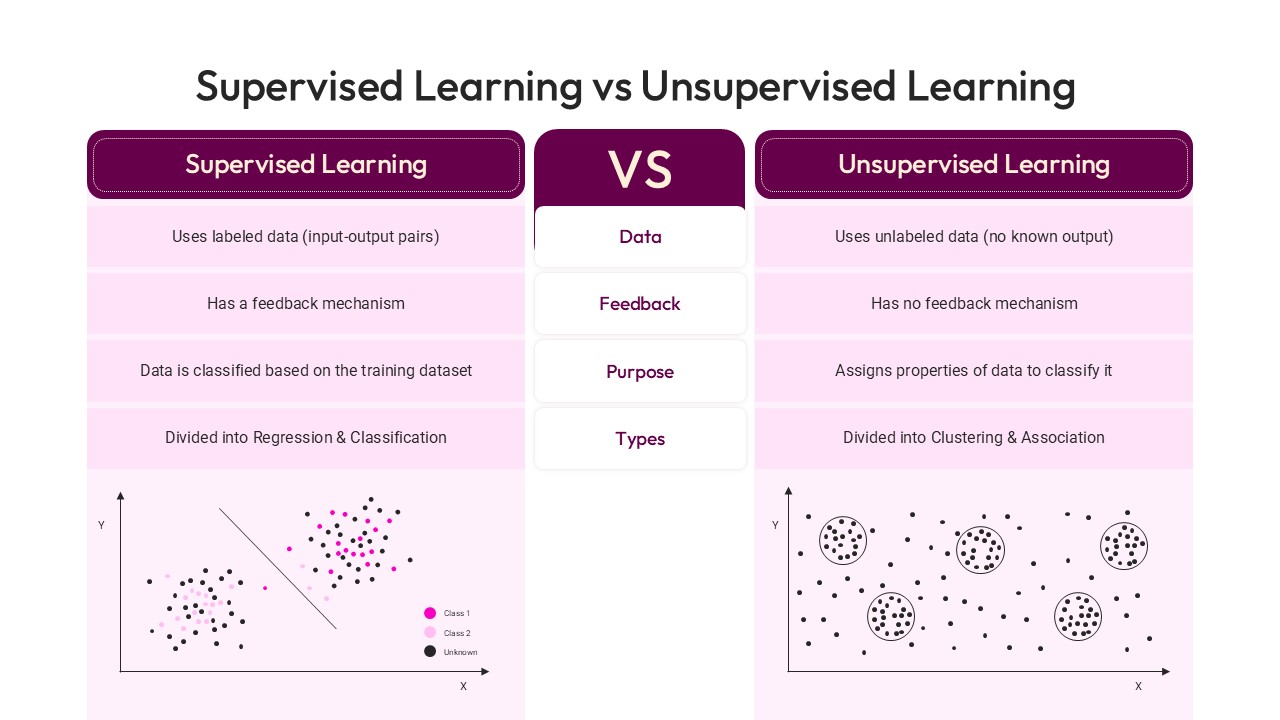
Supervised Learning vs Unsupervised Learning template for PowerPoint & Google Slides
Technology

4MAT Learning Cycle Circular Diagram Template for PowerPoint & Google Slides
Circular
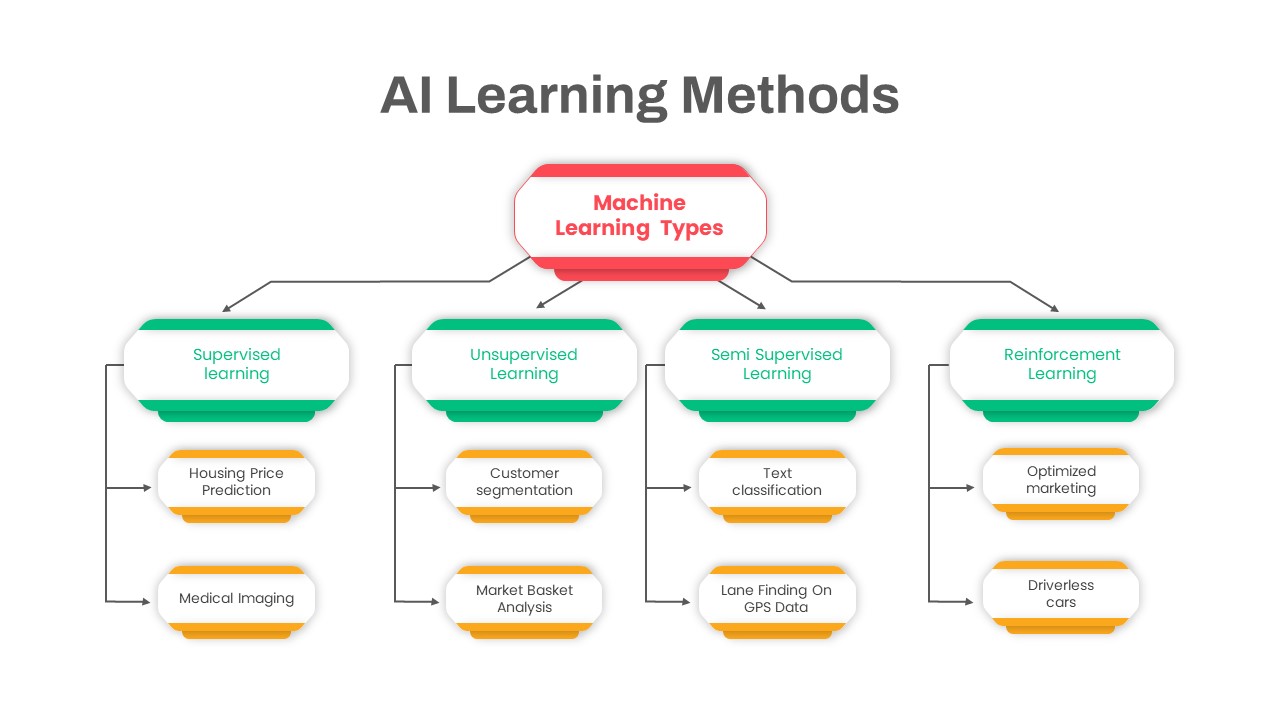
AI Learning Methods Flowchart Diagram Template for PowerPoint & Google Slides
Flow Charts
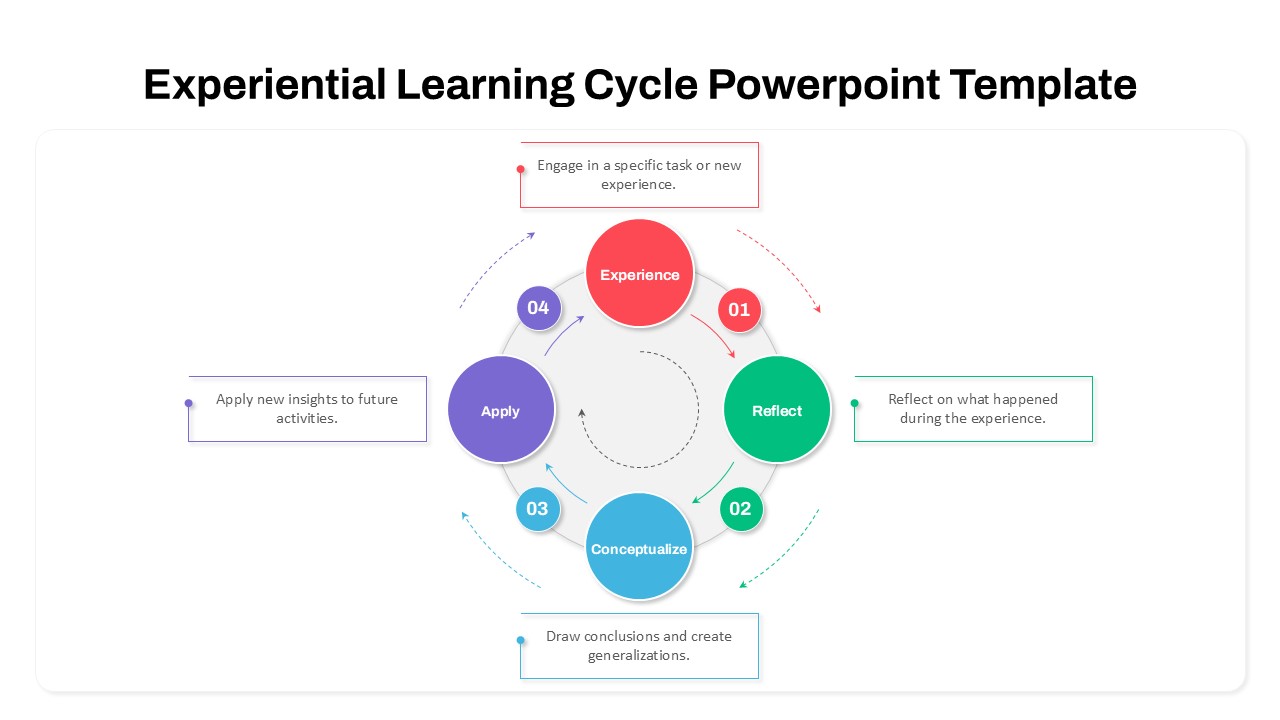
Experiential Learning Cycle Diagram Template for PowerPoint & Google Slides
Circular
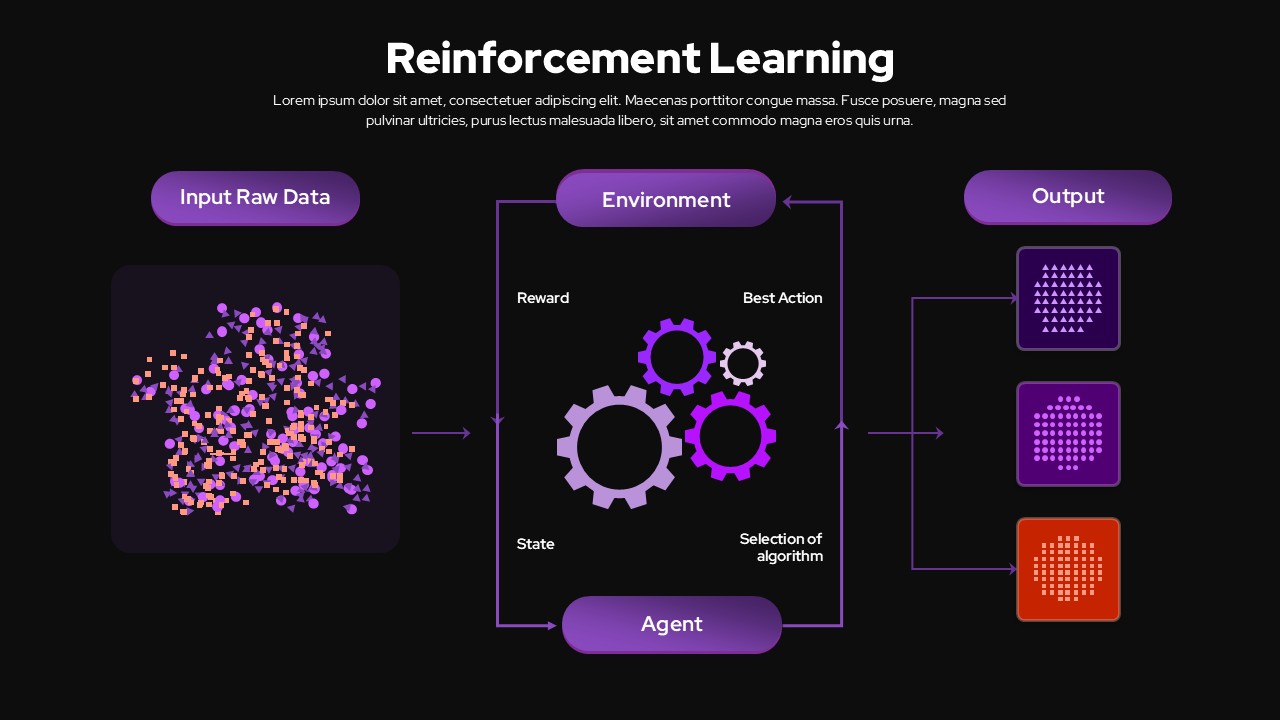
Reinforcement Learning Diagram Dark Template for PowerPoint & Google Slides
Machine Learning
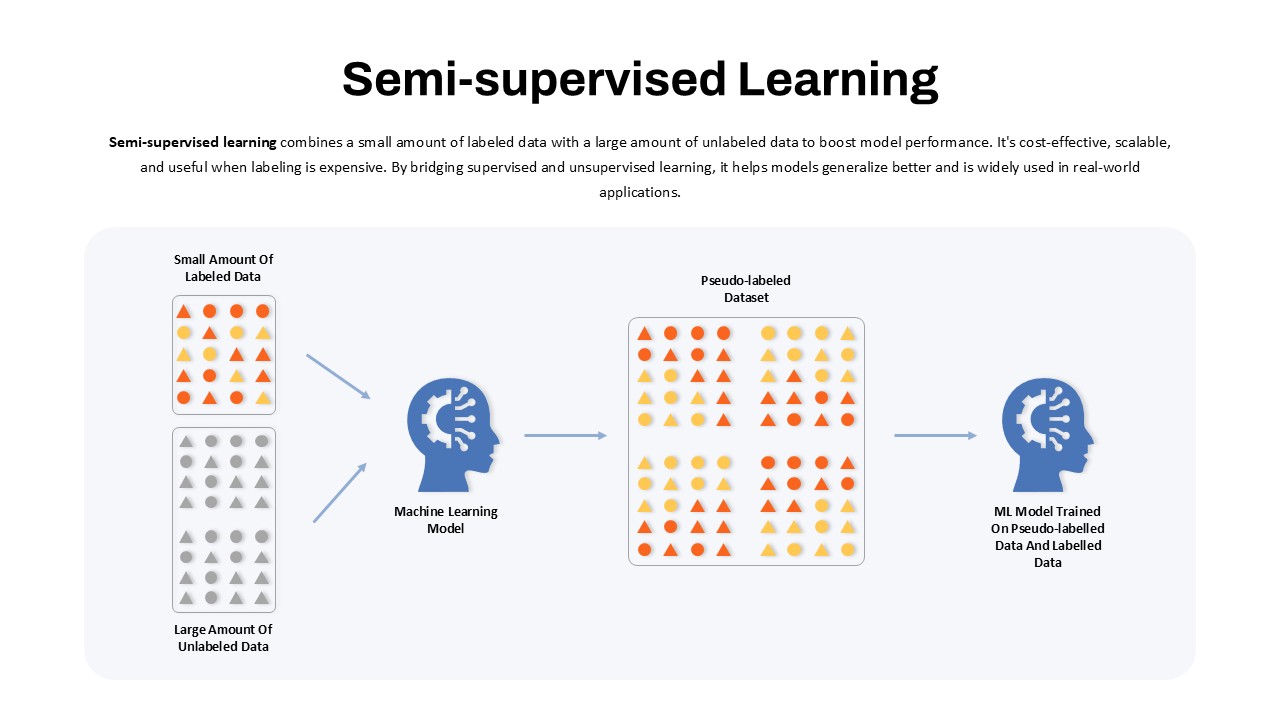
Semi-Supervised Learning Flow Diagram Template for PowerPoint & Google Slides
Machine Learning
Q-Learning Process Flow Diagram Template for PowerPoint & Google Slides
Process
Online Learning PowerPoint Template for PowerPoint & Google Slides
Customer Journey
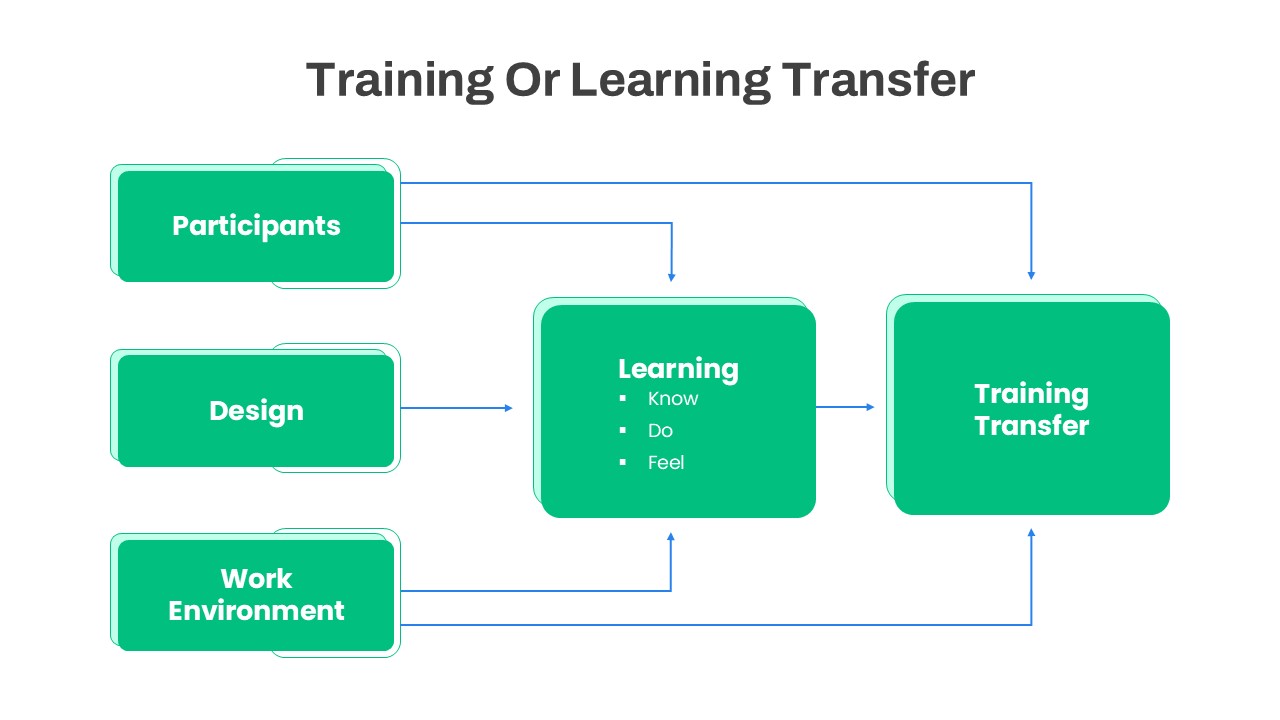
Training or Learning Transfer PowerPoint Template for PowerPoint & Google Slides
Business Proposal
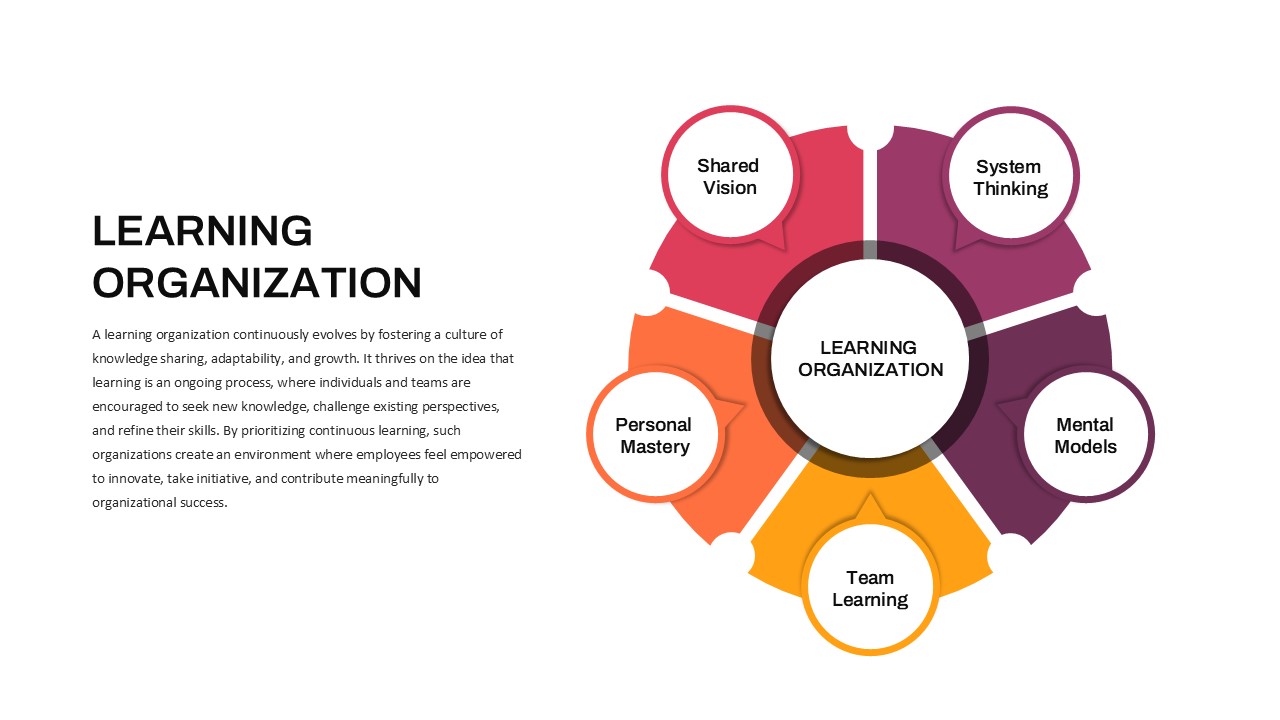
Learning Organization PowerPoint Template for PowerPoint & Google Slides
Business Strategy
E-Learning Report Analysis Template for PowerPoint & Google Slides
Infographics
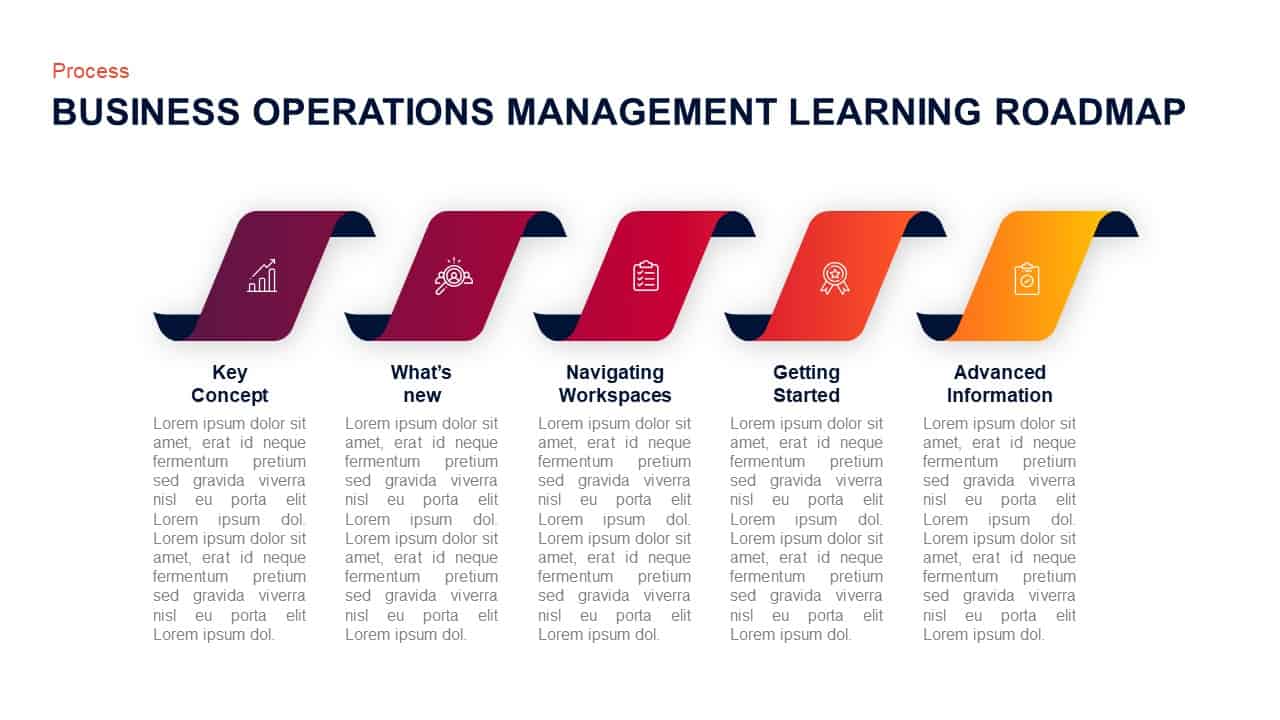
Operations Management Learning Roadmap Template for PowerPoint & Google Slides
Roadmap
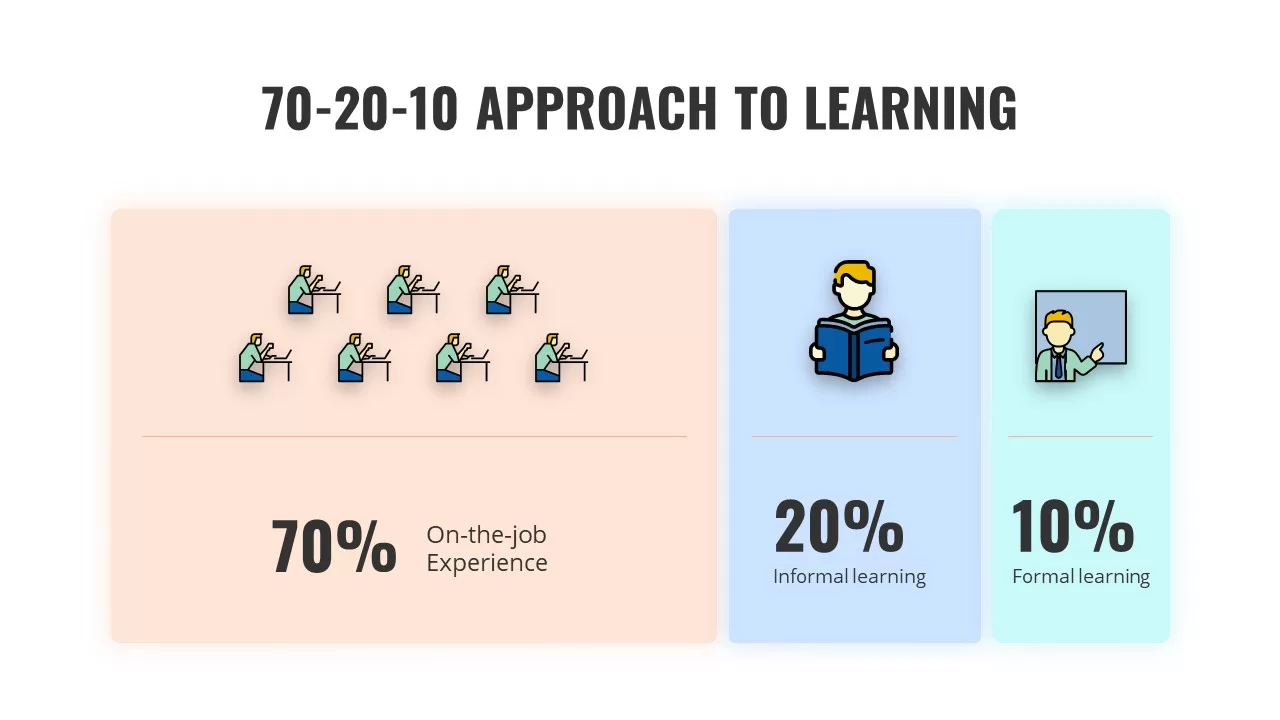
70-20-10 Learning Approach Infographic Template for PowerPoint & Google Slides
Process
Free Stylish E-Learning Presentation Template for PowerPoint & Google Slides
Pitch Deck
Free
E-Learning Education Presentation Deck Template for PowerPoint & Google Slides
Decks
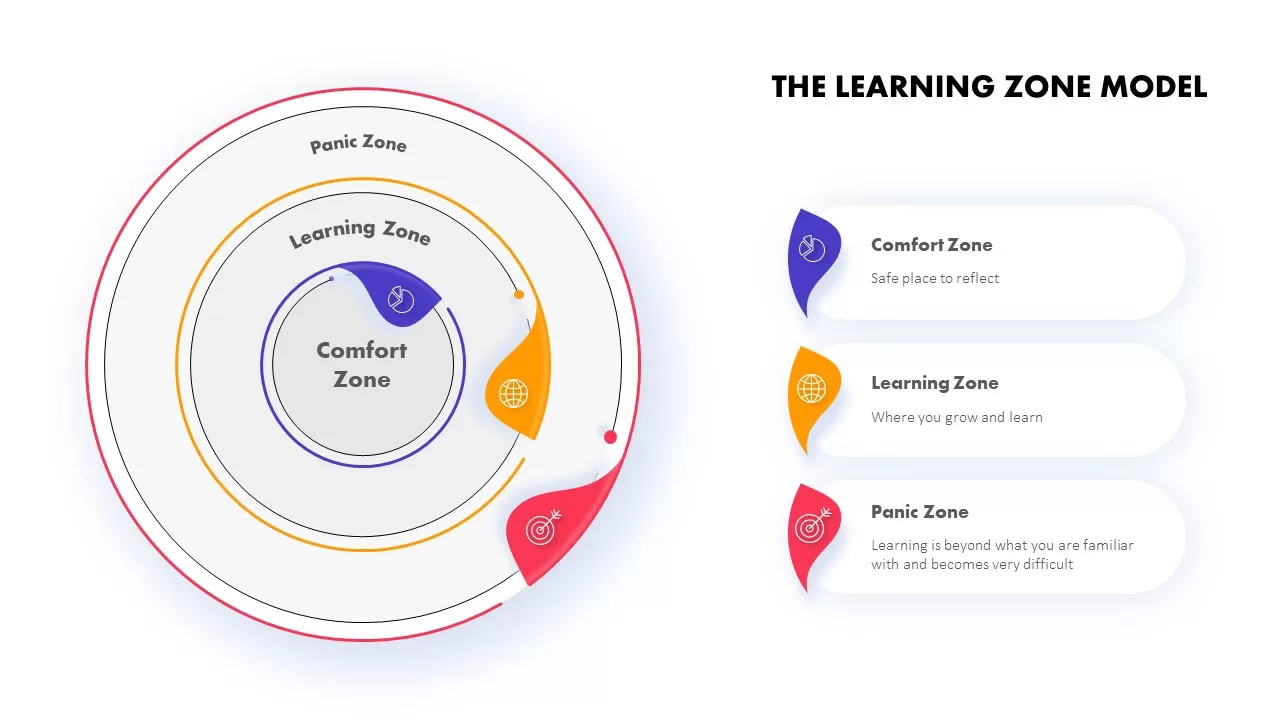
The Learning Zone Model Template for PowerPoint & Google Slides
Process
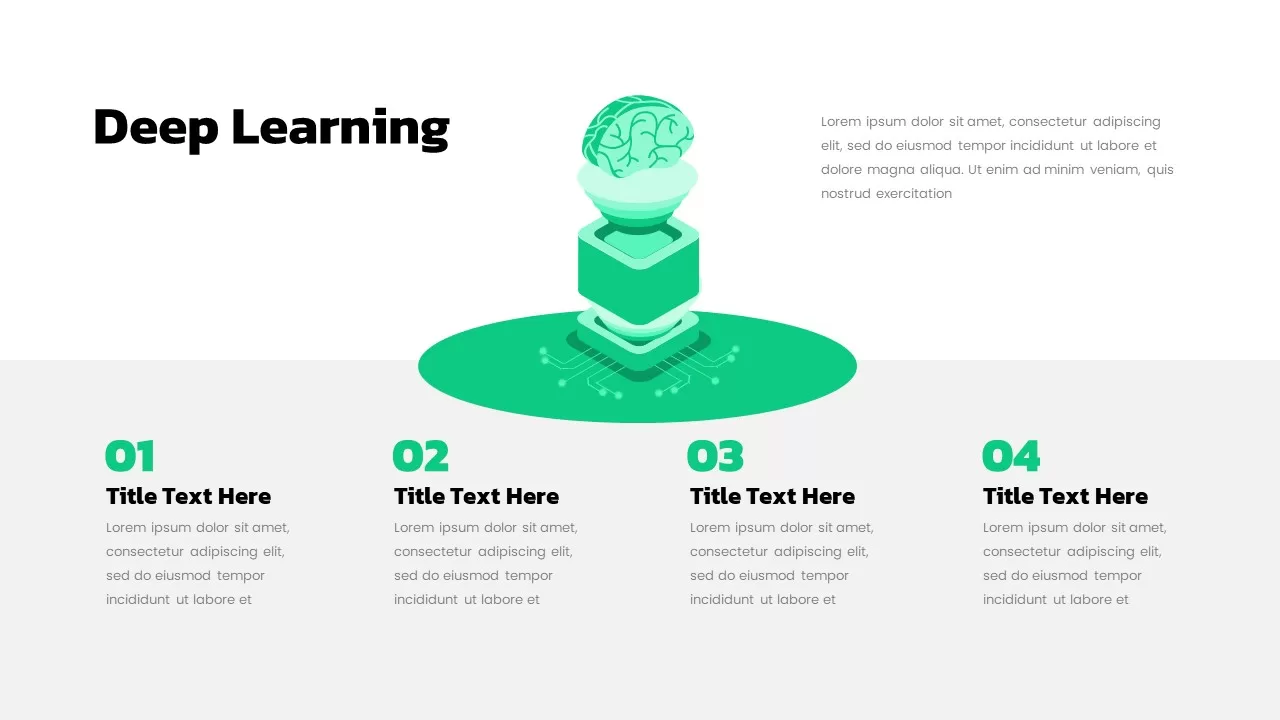
Deep Learning Concept Illustration Template for PowerPoint & Google Slides
Machine Learning
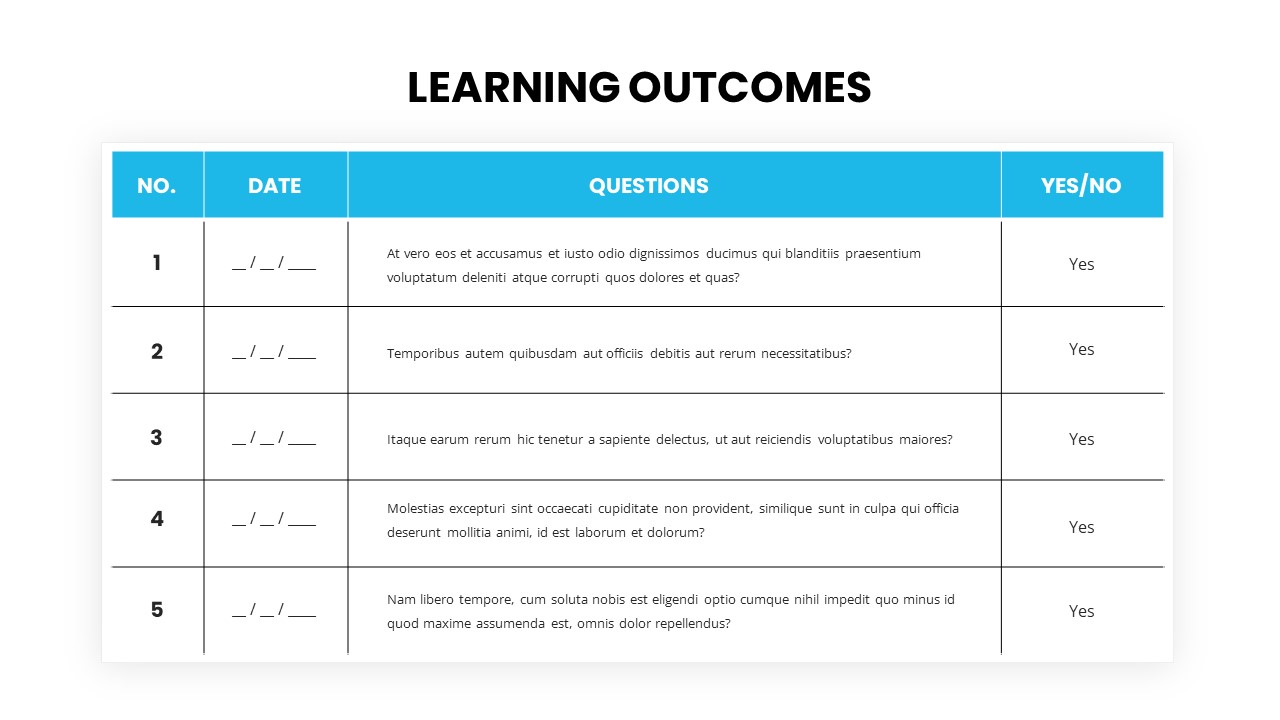
Learning Outcomes table template for PowerPoint & Google Slides
Charts

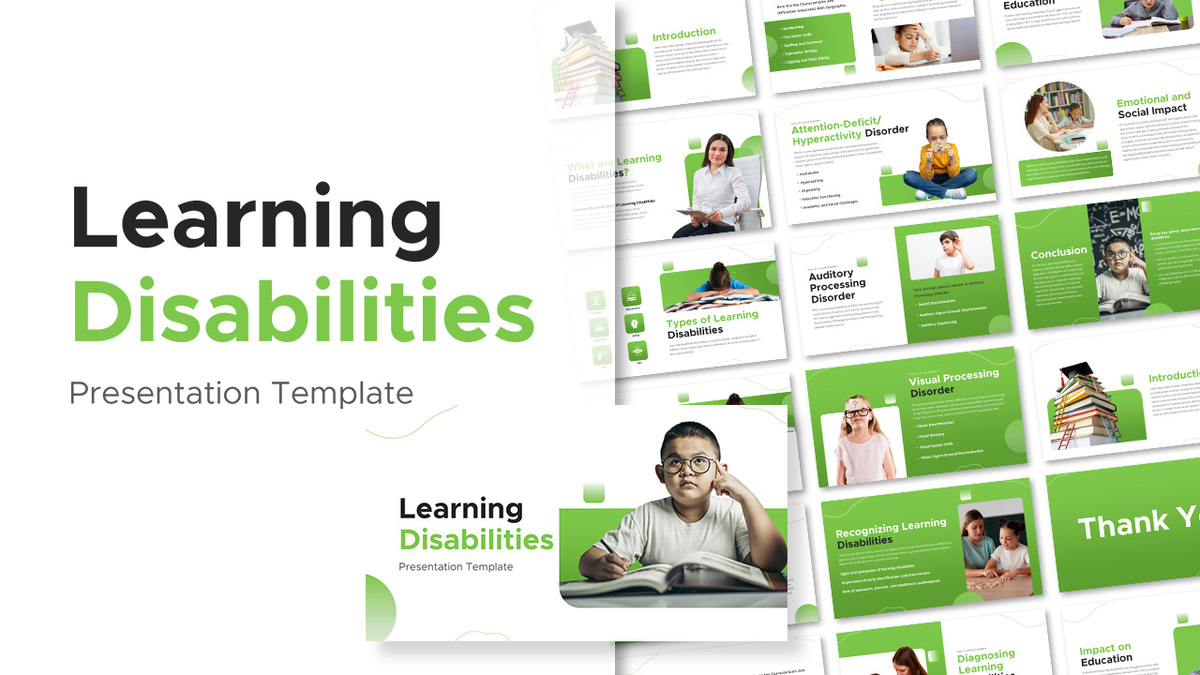
Learning Disabilities Presentation Template for PowerPoint & Google Slides
Company Profile
Free Learning Retention Pyramid Chart Template for PowerPoint & Google Slides
Pyramid
Free
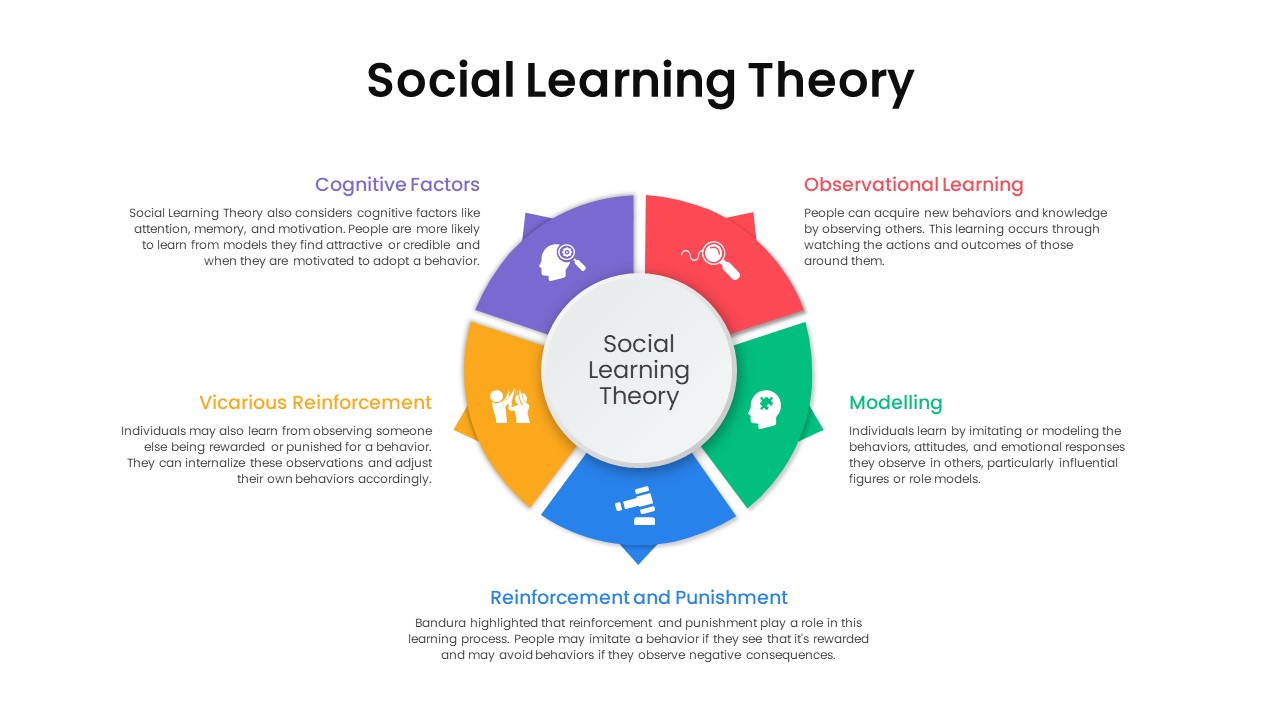
Social Learning Theory Infographic Template for PowerPoint & Google Slides
Circular
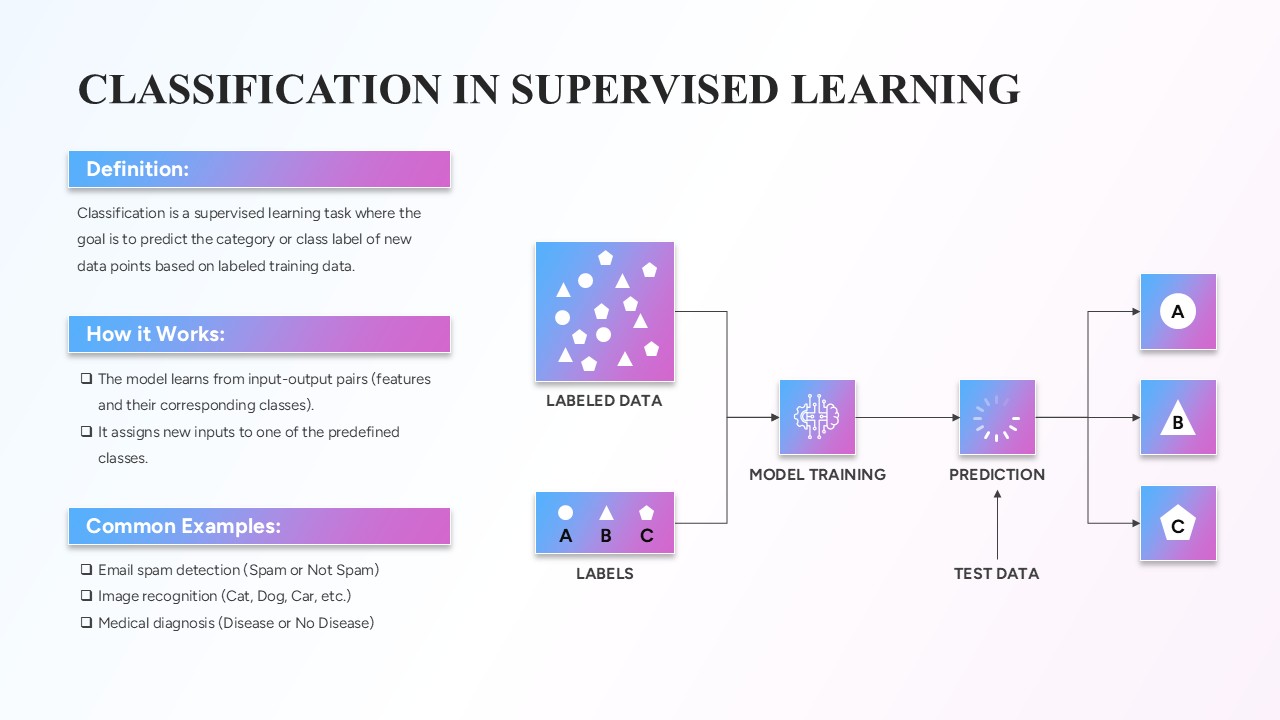
Classification in Supervised Learning template for PowerPoint & Google Slides
Infographics
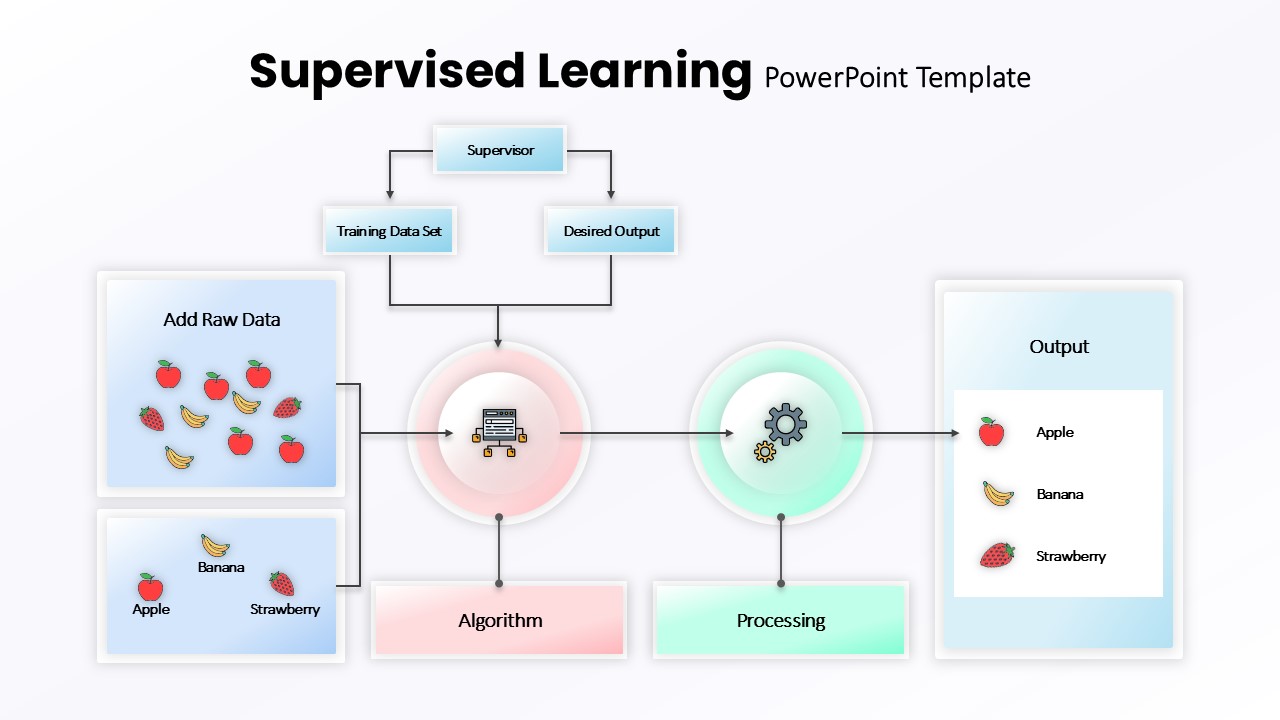
Supervised Learning Overview template for PowerPoint & Google Slides
Technology
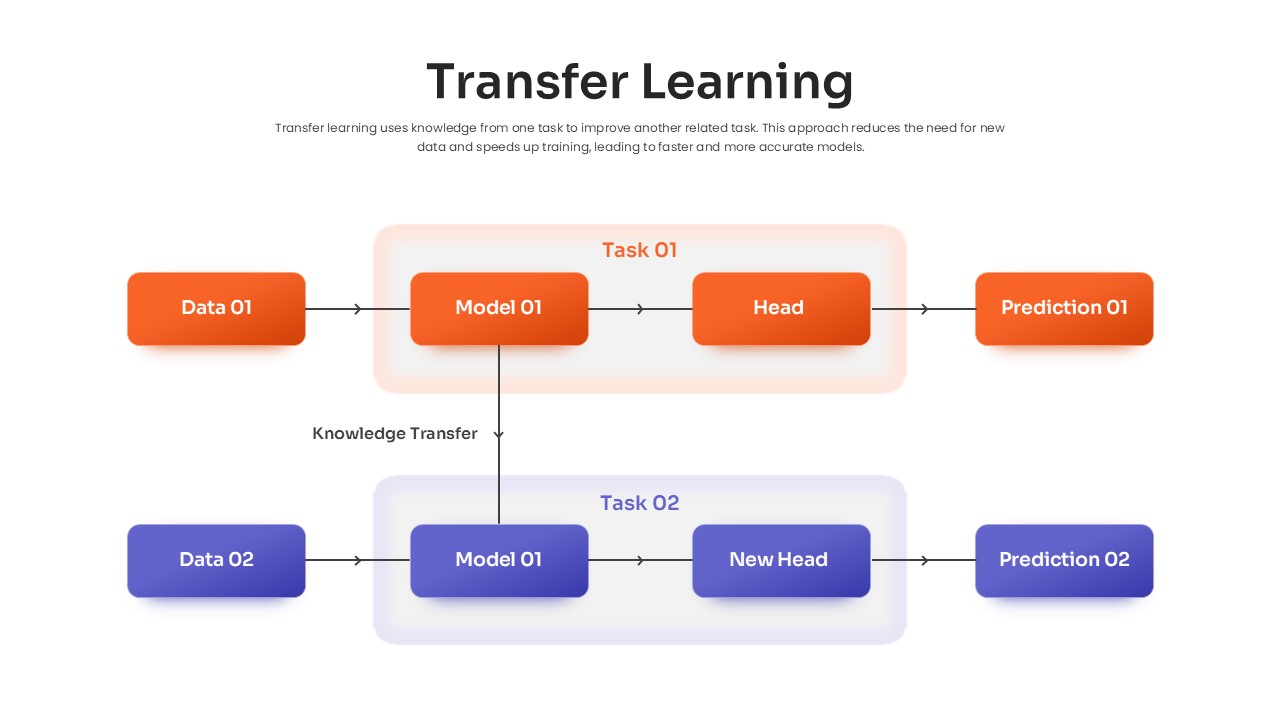
Transfer Learning Process template for PowerPoint & Google Slides
Technology
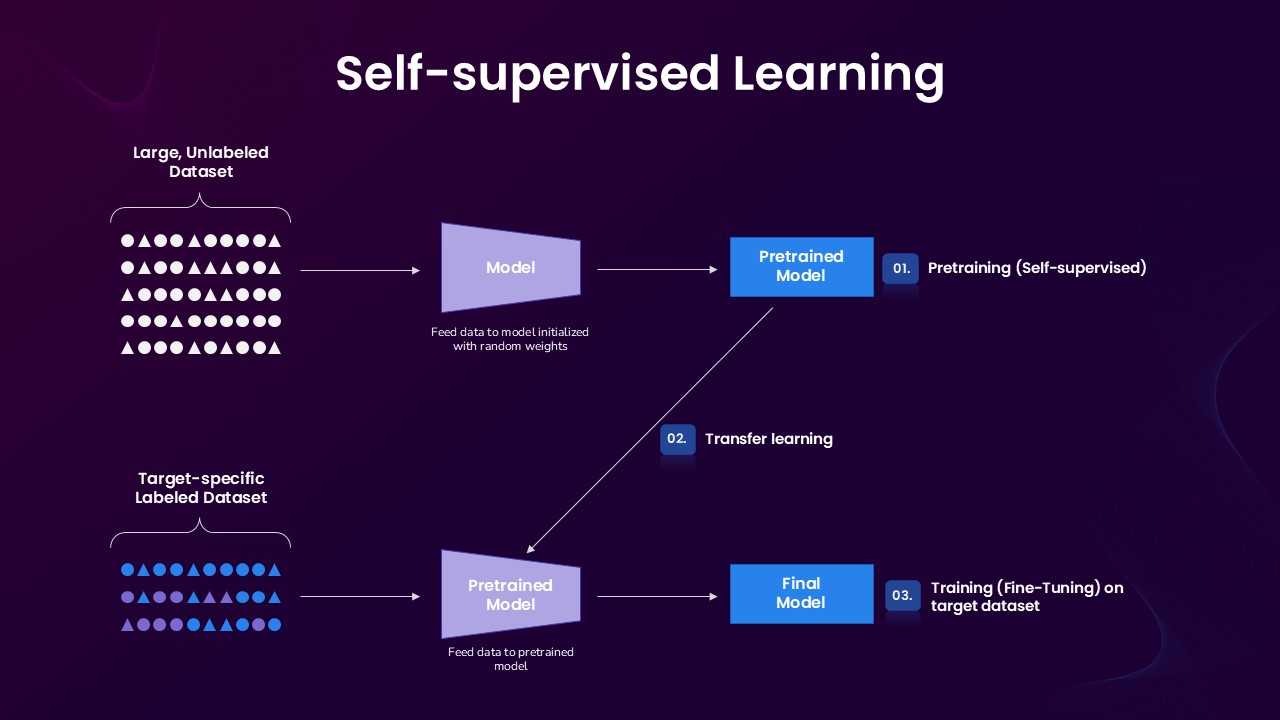
Self-supervised Learning Process template for PowerPoint & Google Slides
Technology
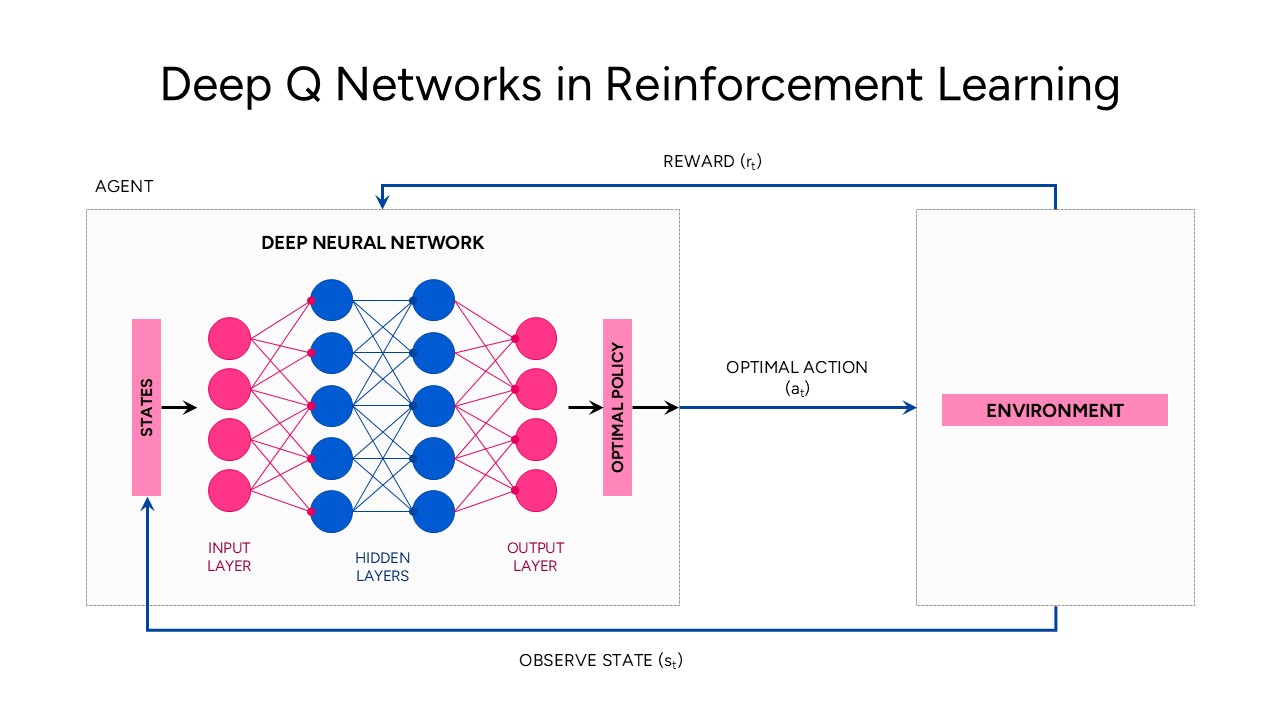
Deep Q Networks in Reinforcement Learning template for PowerPoint & Google Slides
Technology
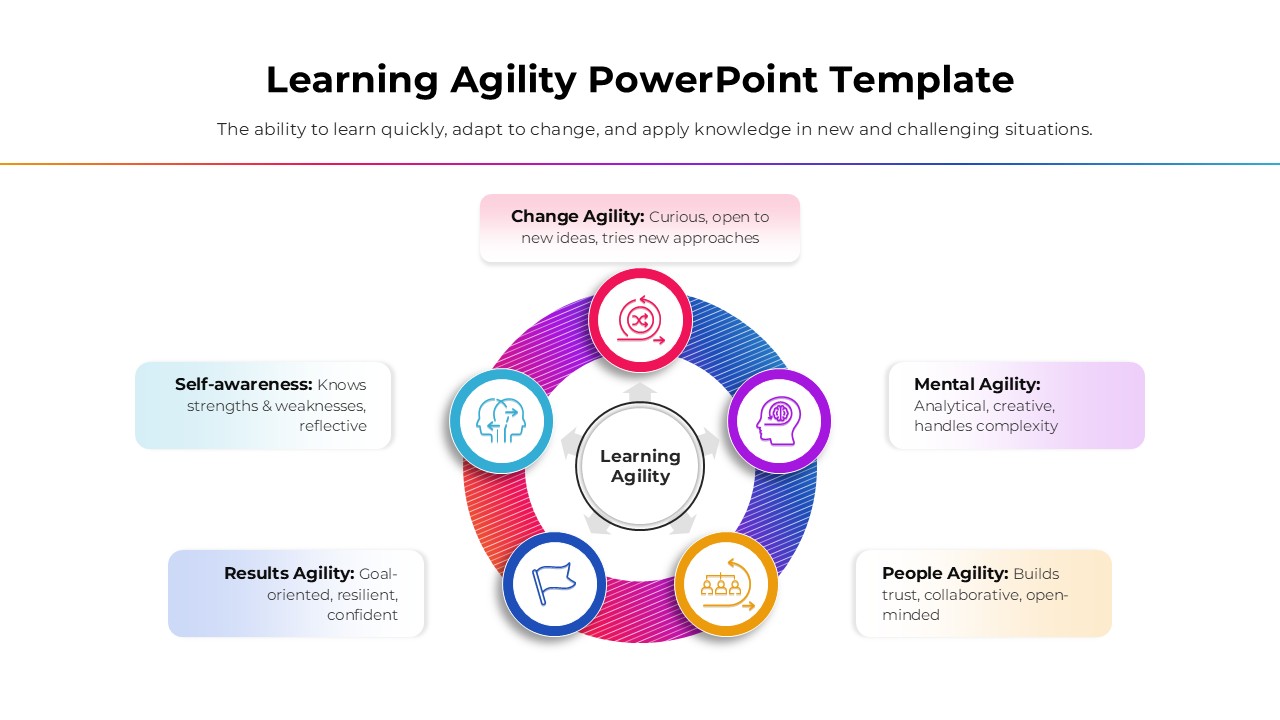
Learning Agility template for PowerPoint & Google Slides
Business
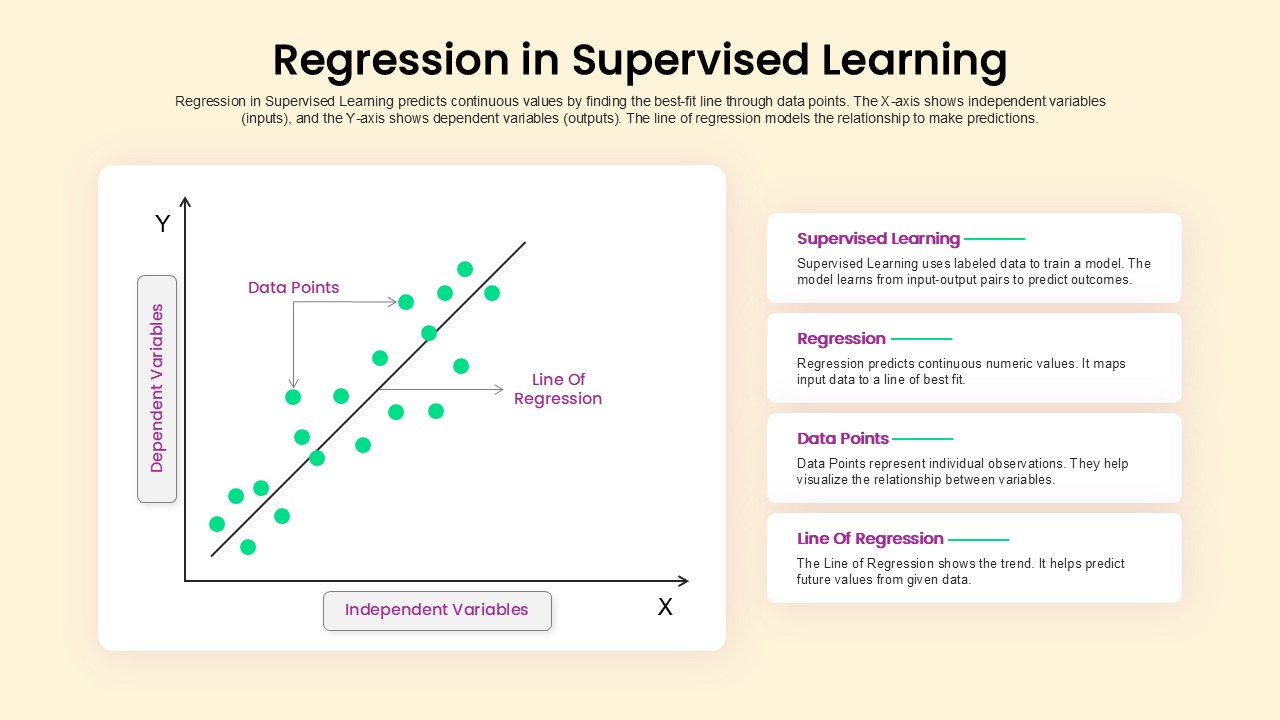
Regression in Supervised Learning Overview template for PowerPoint & Google Slides
Process
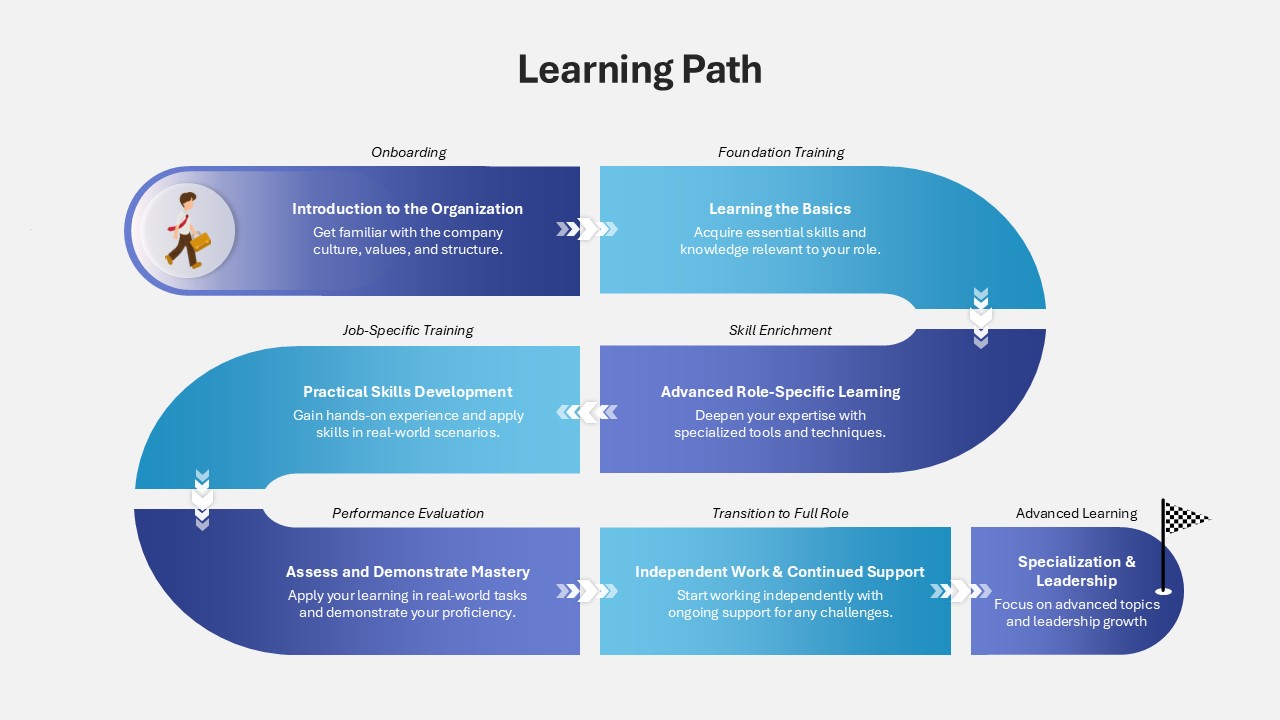
Learning Path Infographic Template for PowerPoint & Google Slides
Process
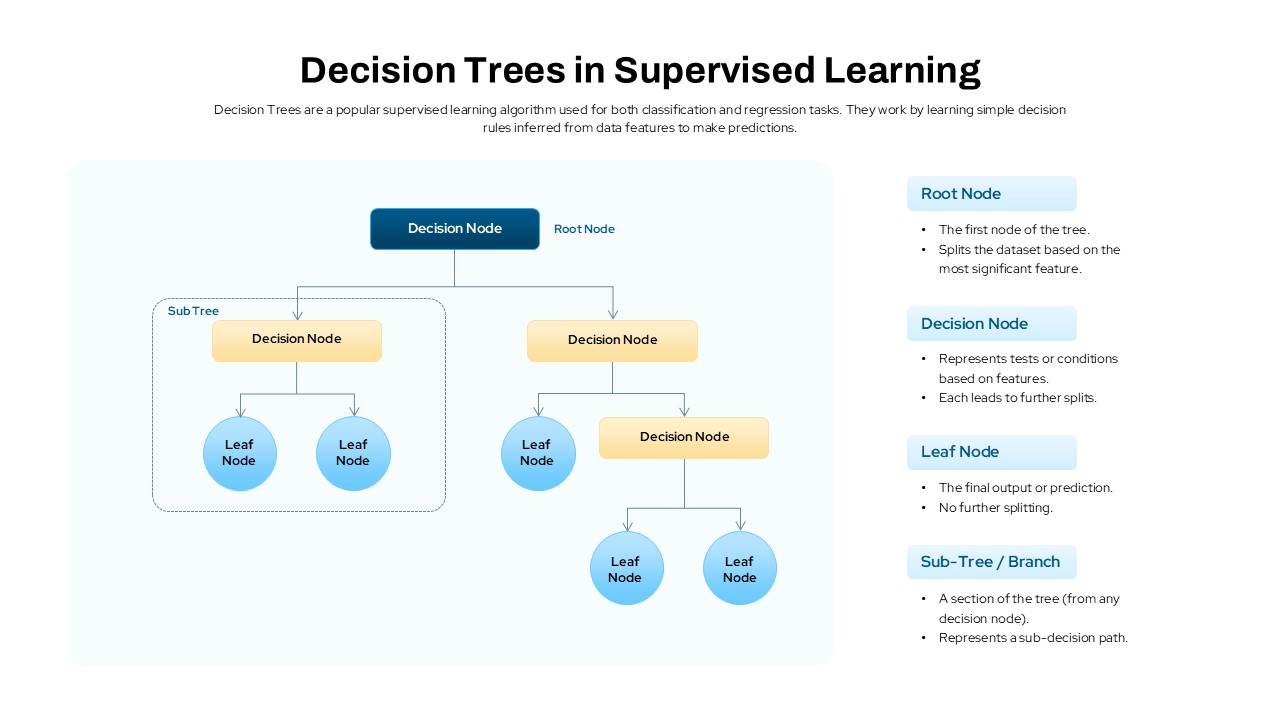
Decision Trees in Supervised Learning Template for PowerPoint & Google Slides
Machine Learning
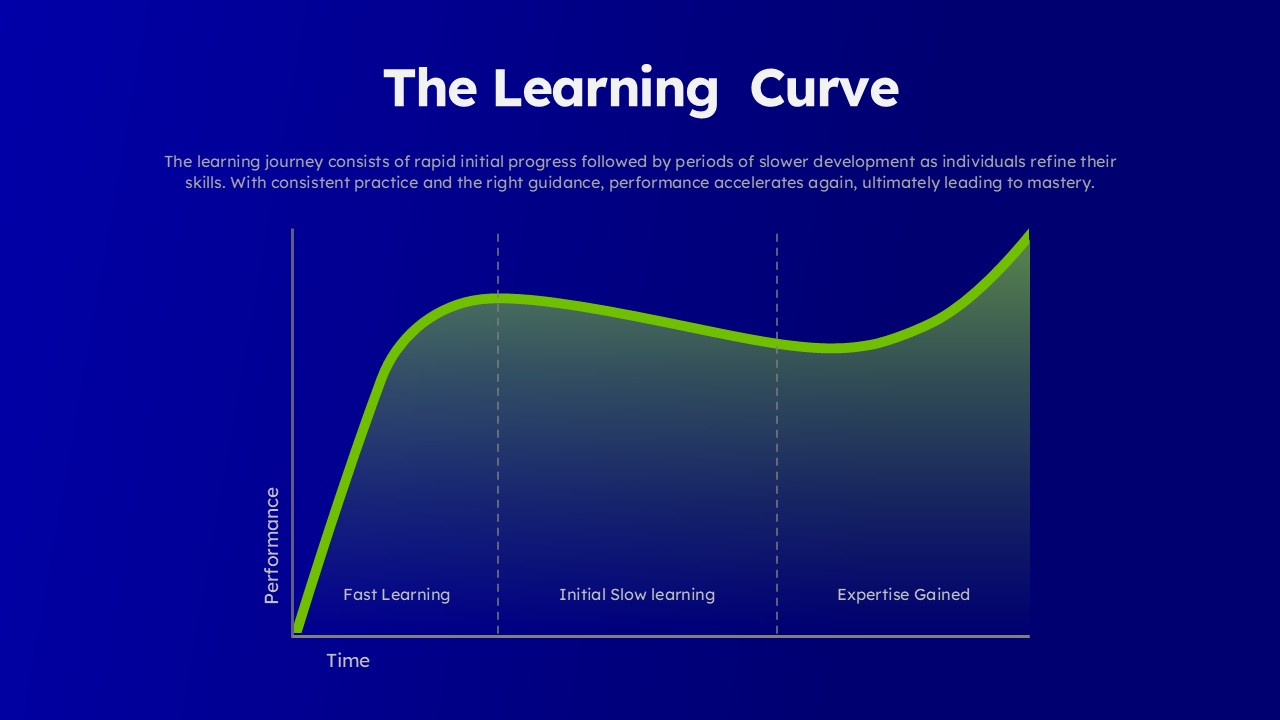
Learning Curve Performance Growth Chart Template for PowerPoint & Google Slides
Employee Performance
Snake Diagram Pack of 8 Slides template for PowerPoint & Google Slides
Process
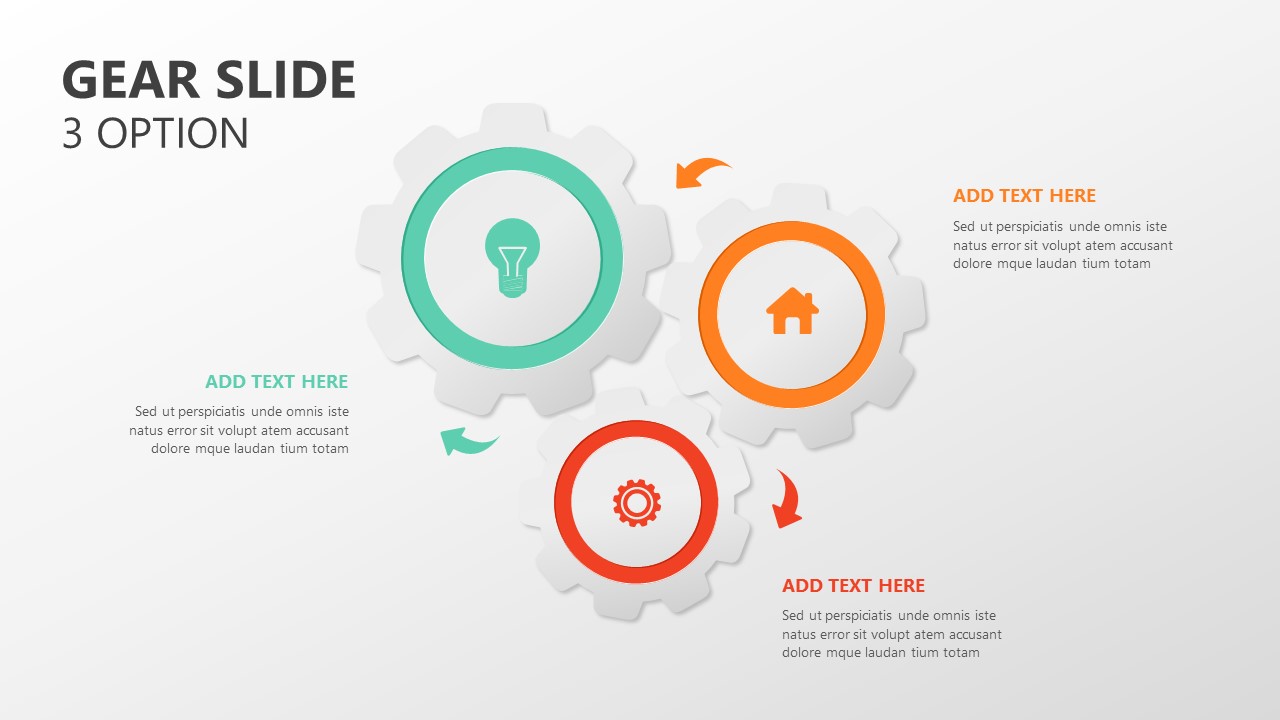
Gear Process Diagram PowerPoint Template for PowerPoint & Google Slides
Process
Sales Process Workflow Funnel Diagram PowerPoint Template for PowerPoint & Google Slides
Funnel
Puzzle Diagram PowerPoint Template for PowerPoint & Google Slides
Process
Transportation Logistics PowerPoint Diagram template for PowerPoint & Google Slides
Process
Emoji Scale PowerPoint Diagram for PowerPoint & Google Slides
Infographics
4 Step Problem Solving PowerPoint Diagram for PowerPoint & Google Slides
Process
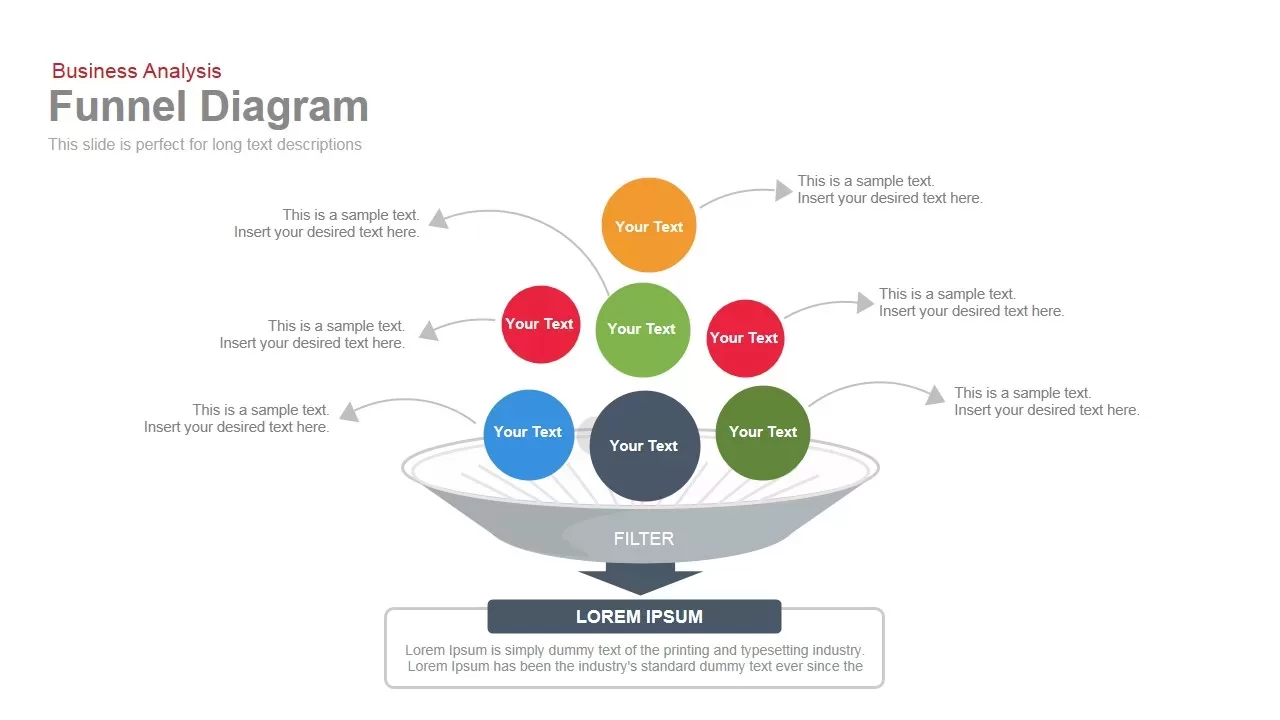
Business Funnel Diagram template for PowerPoint & Google Slides
Funnel
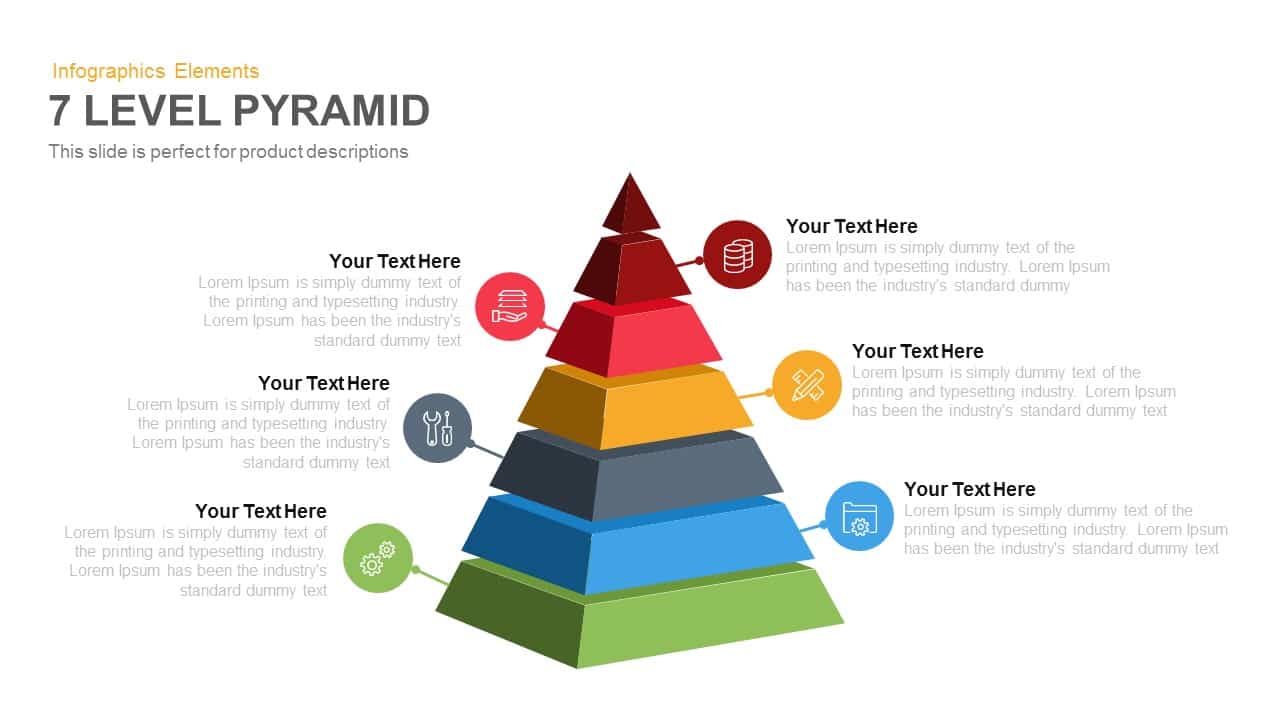
7-Level 3D Pyramid Infographic Diagram Template for PowerPoint & Google Slides
Pyramid
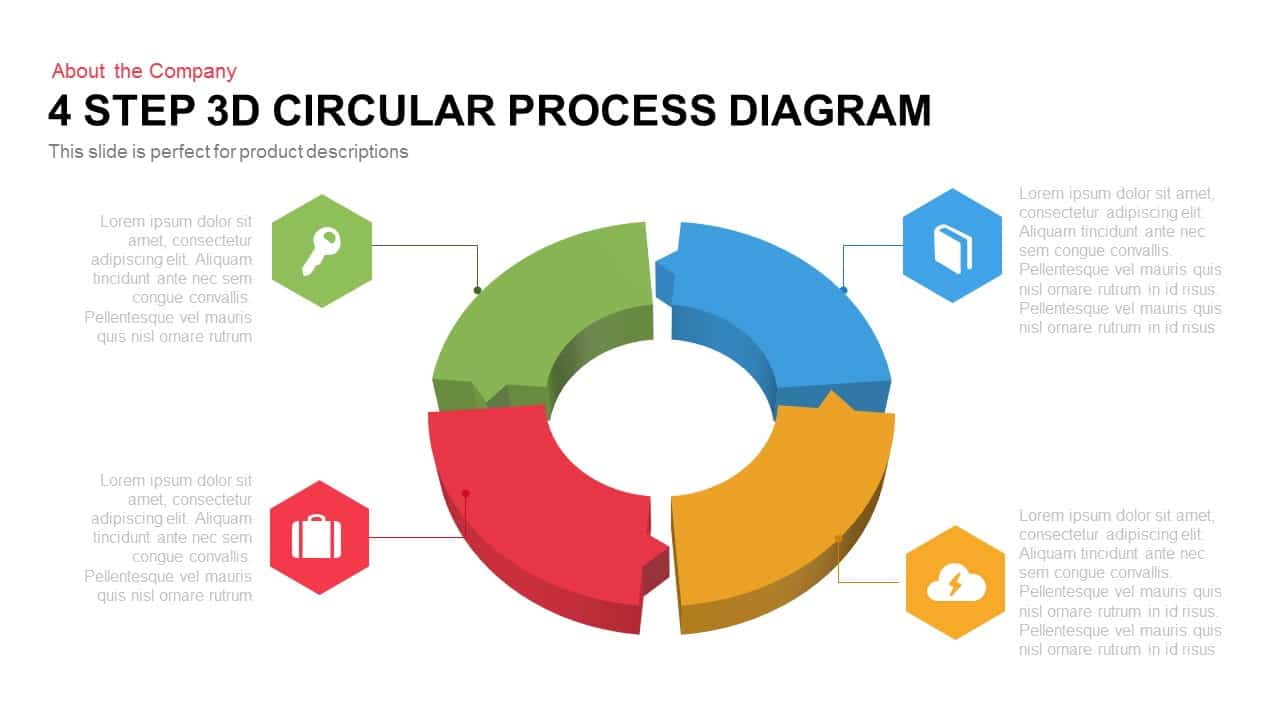
4 Step 3D Circular Process Diagram template for PowerPoint & Google Slides
Process

15-Step Process Flow Diagram Template for PowerPoint & Google Slides
Process

Four-Circle Venn Process Diagram template for PowerPoint & Google Slides
Process

Problem Solving Concept Diagram Template for PowerPoint & Google Slides
Infographics
Five-Stage Pyramid Infographics Diagram Template for PowerPoint & Google Slides
Pyramid
Three-Circle Diagram Infographic Template for PowerPoint & Google Slides
Circular
8 Steps Arrow Process Diagram template for PowerPoint & Google Slides
Process

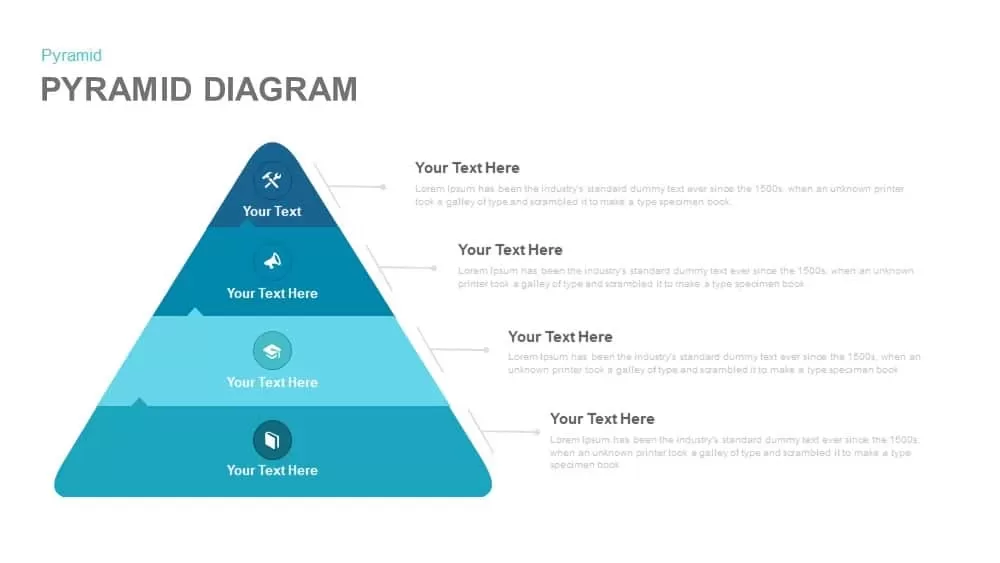
Four-Level Business Pyramid Diagram Template for PowerPoint & Google Slides
Pyramid
Modern Four Stage Gear Diagram Template for PowerPoint & Google Slides
Process
Five-Stage Process Diagram Template for PowerPoint & Google Slides
Process
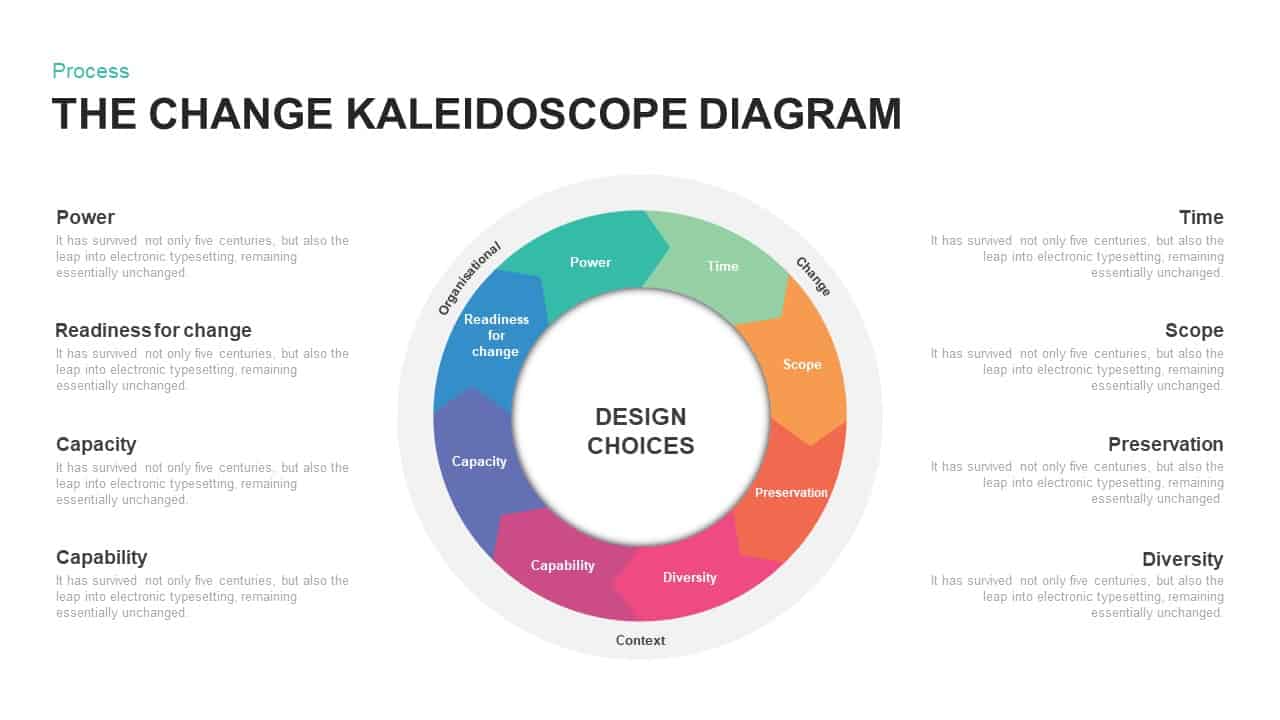
Change Kaleidoscope Process Diagram Template for PowerPoint & Google Slides
Circular
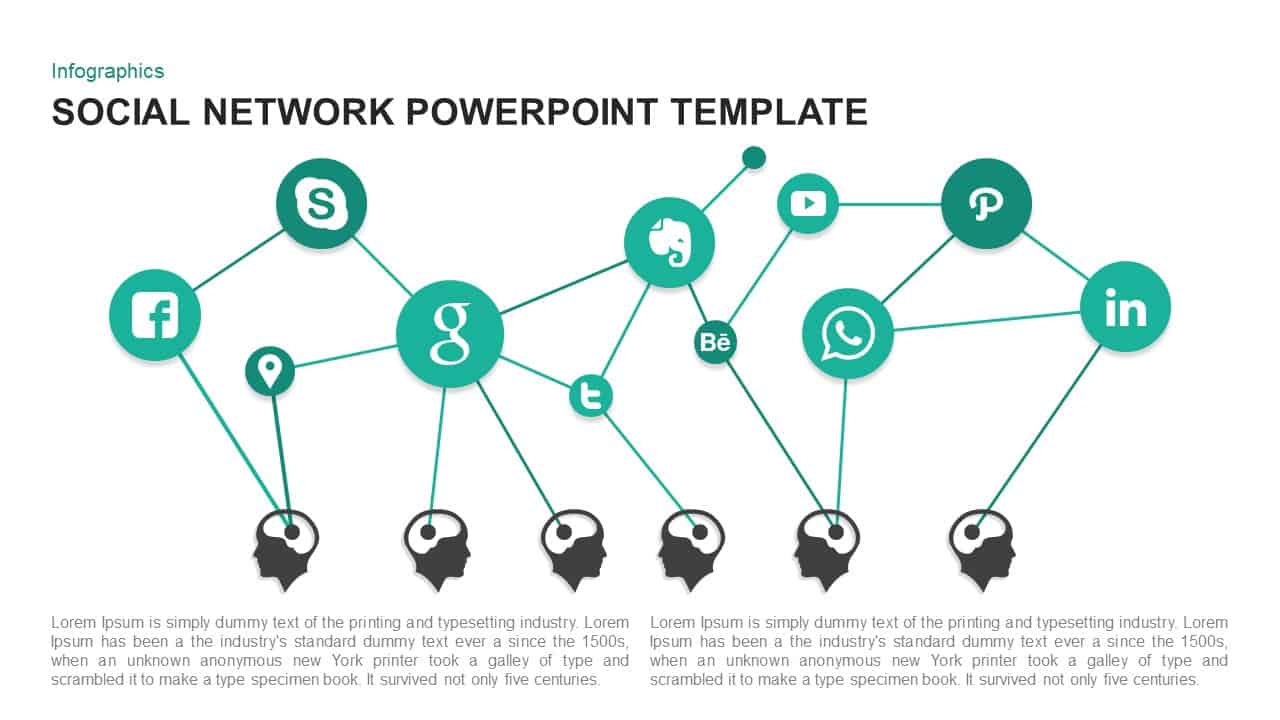
Social Network Infographic Diagram Template for PowerPoint & Google Slides
Digital Marketing
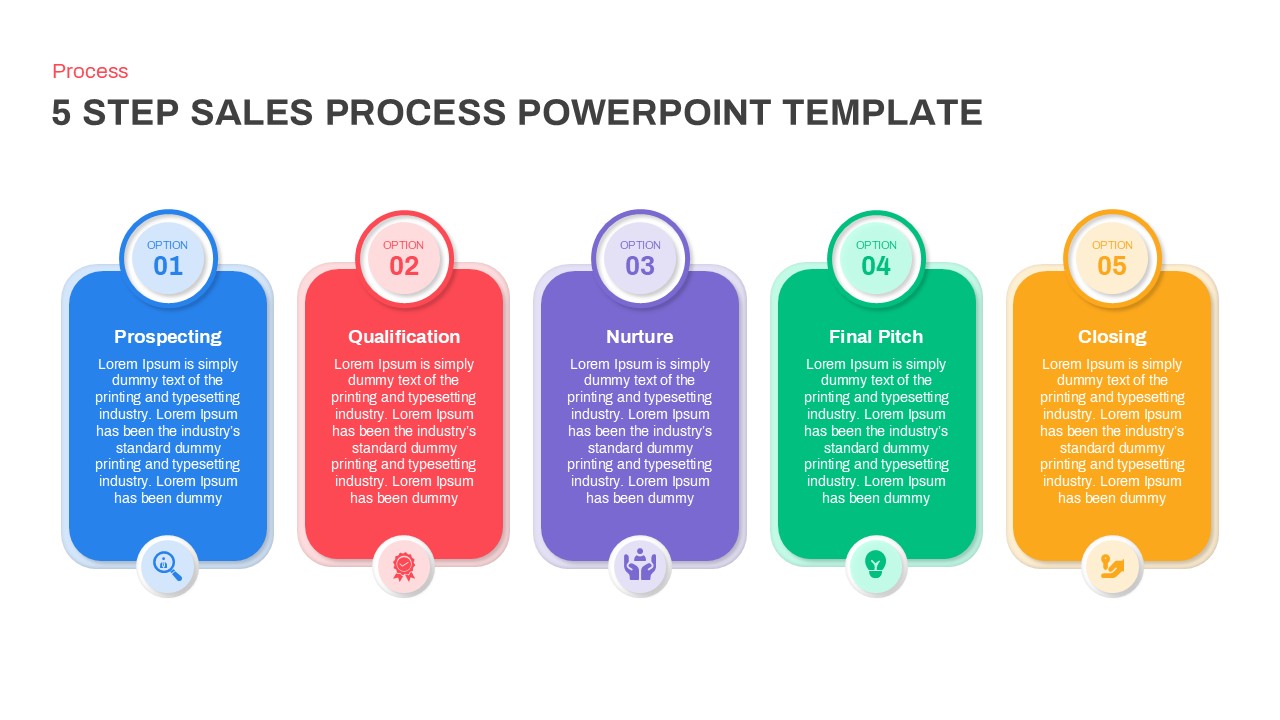
Modern 5-Step Sales Process Diagram Template for PowerPoint & Google Slides
Process
Agile Work Streams Arrow Diagram Template for PowerPoint & Google Slides
Process
4-Stage Linear Process Flow Diagram Template for PowerPoint & Google Slides
Process
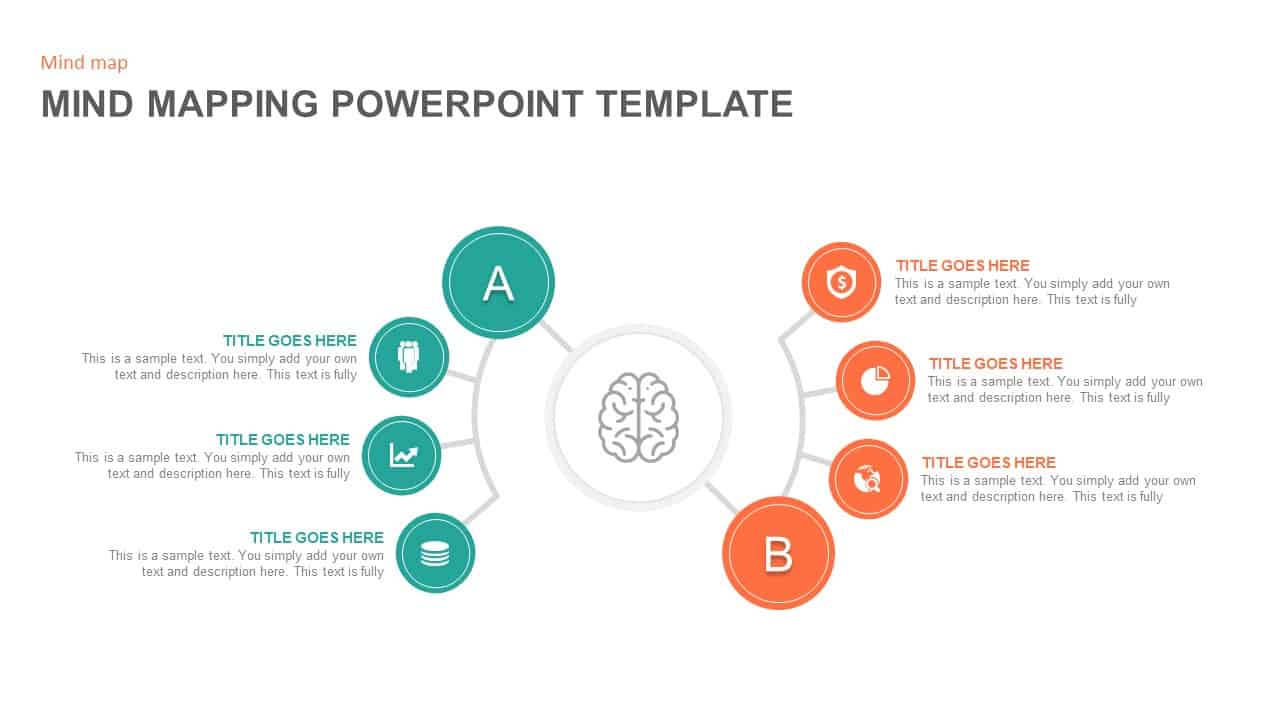
Creative Mind Mapping Diagram with Icons Template for PowerPoint & Google Slides
Mind Maps
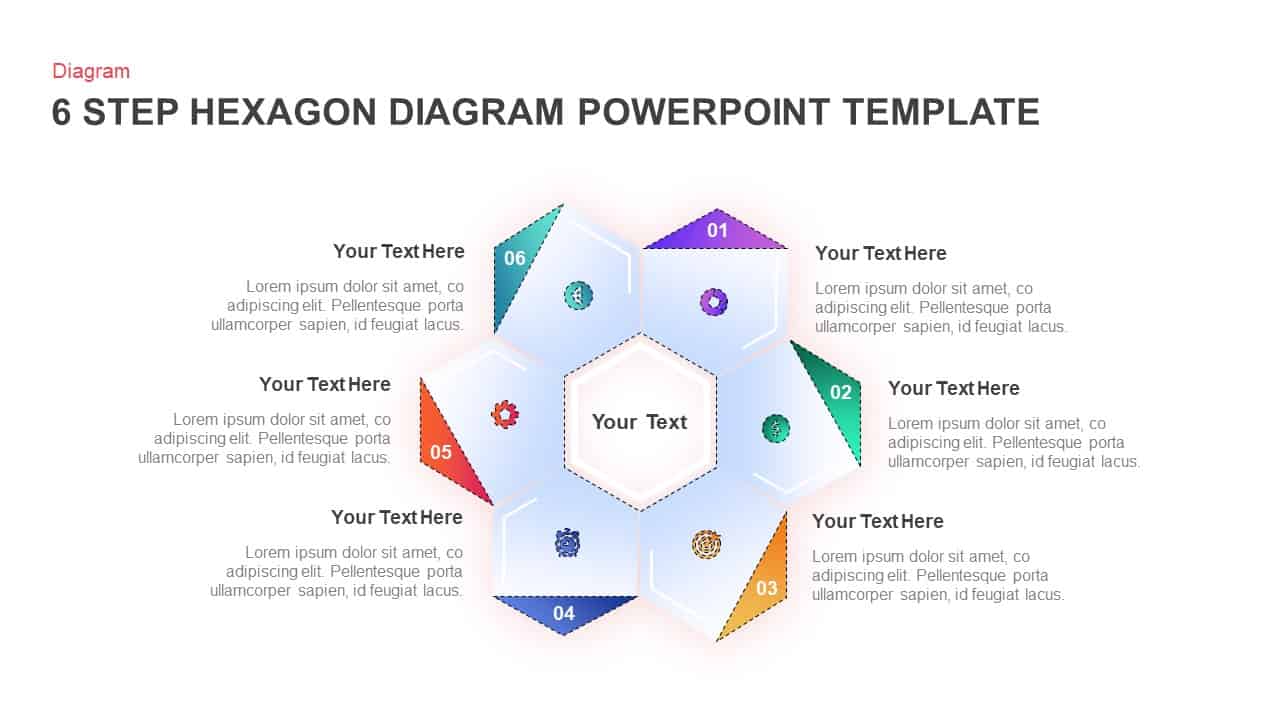
6 Step Hexagon Diagram template for PowerPoint & Google Slides
Process
Multi-Color Enneagram Circular Diagram Template for PowerPoint & Google Slides
Circular
Dynamic Gear Diagram Infographics Template for PowerPoint & Google Slides
Process
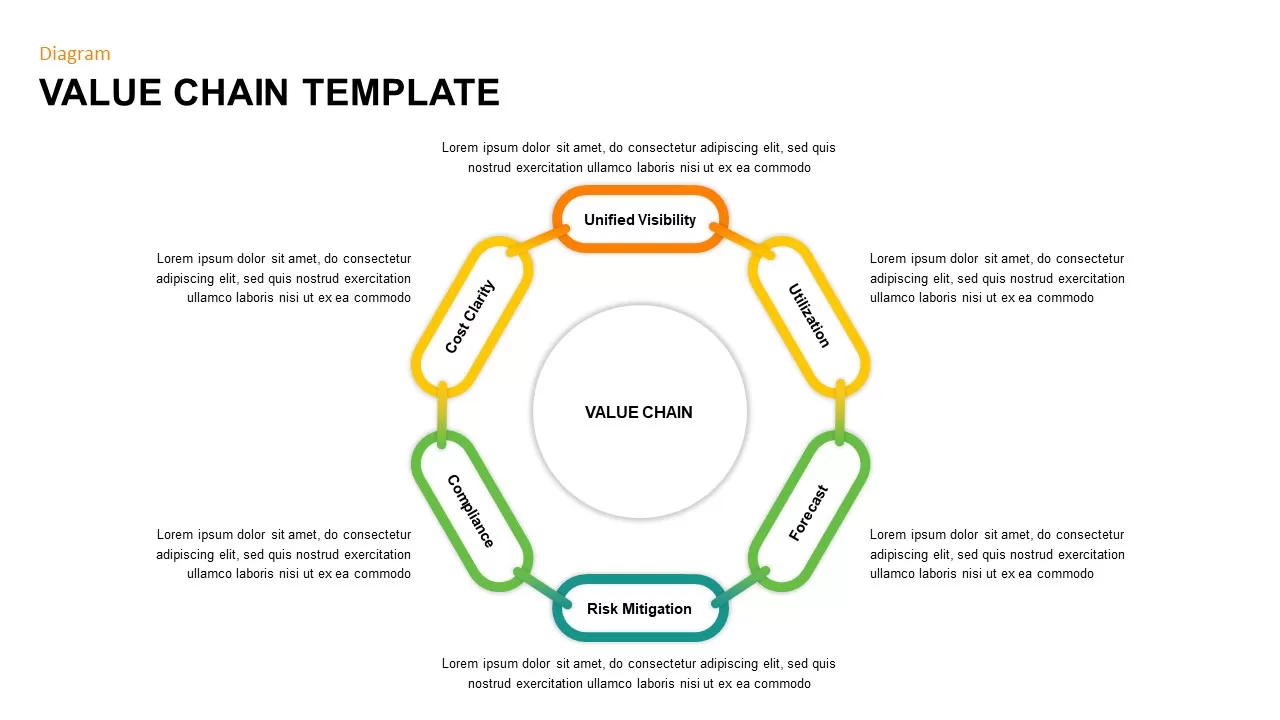
Value Chain Diagram template for PowerPoint & Google Slides
Business Strategy
Snake Shaped Curve Diagram template for PowerPoint & Google Slides
Business
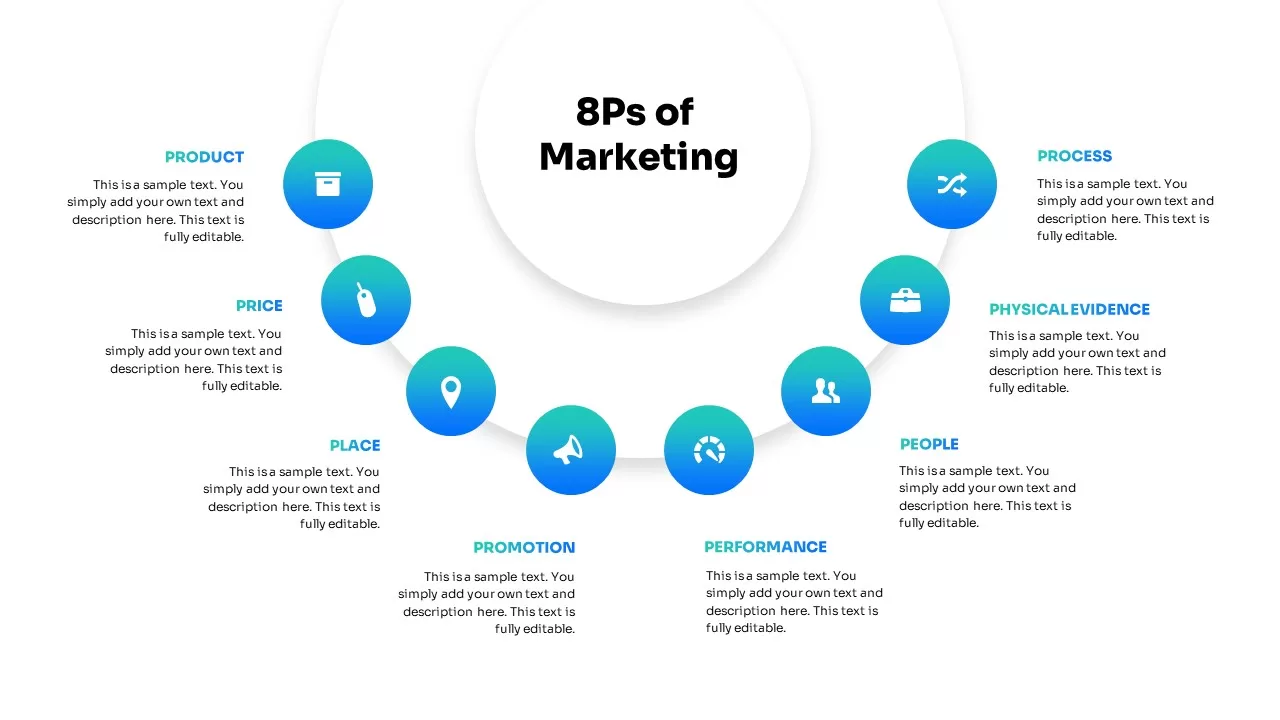
Curved 8Ps of Marketing Diagram Template for PowerPoint & Google Slides
Marketing
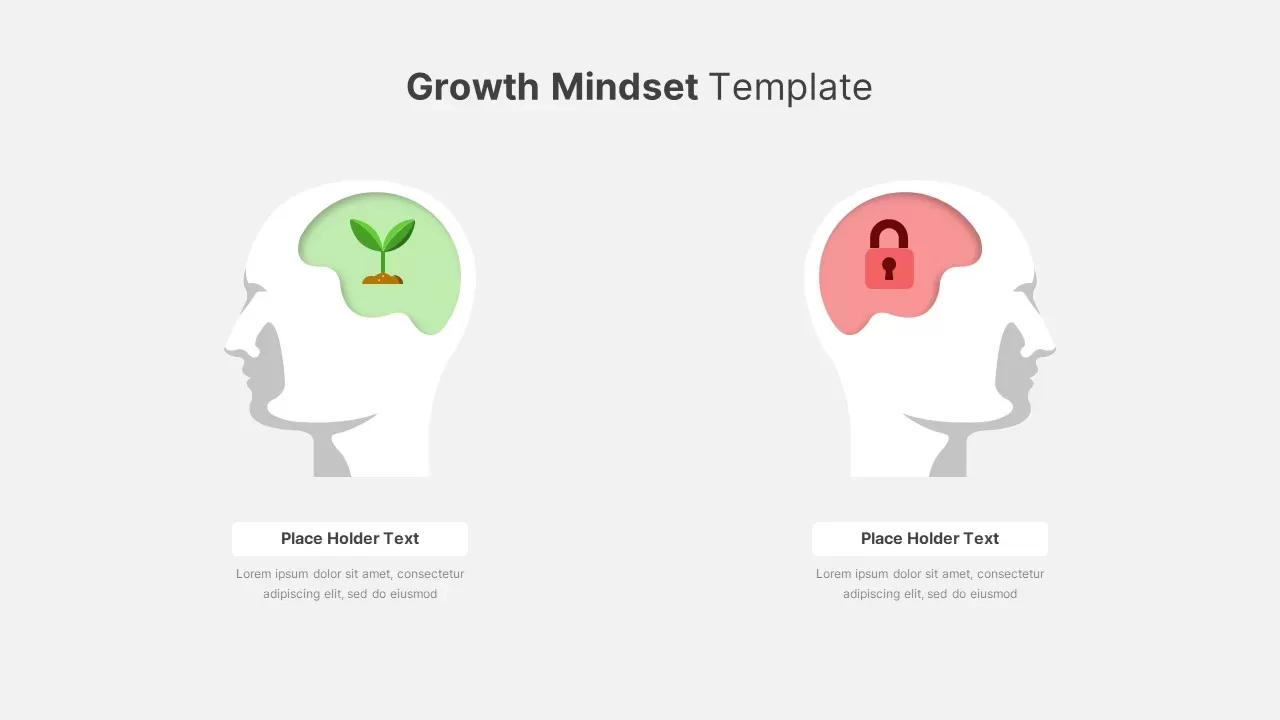
Growth vs Fixed Mindset Diagram Template for PowerPoint & Google Slides
Comparison
Pentagon Arrow Process Diagram Template for PowerPoint & Google Slides
Process
Six-Step Colorful Flywheel Diagram Template for PowerPoint & Google Slides
Circular
Gear Process Diagram Template for PowerPoint & Google Slides
Process
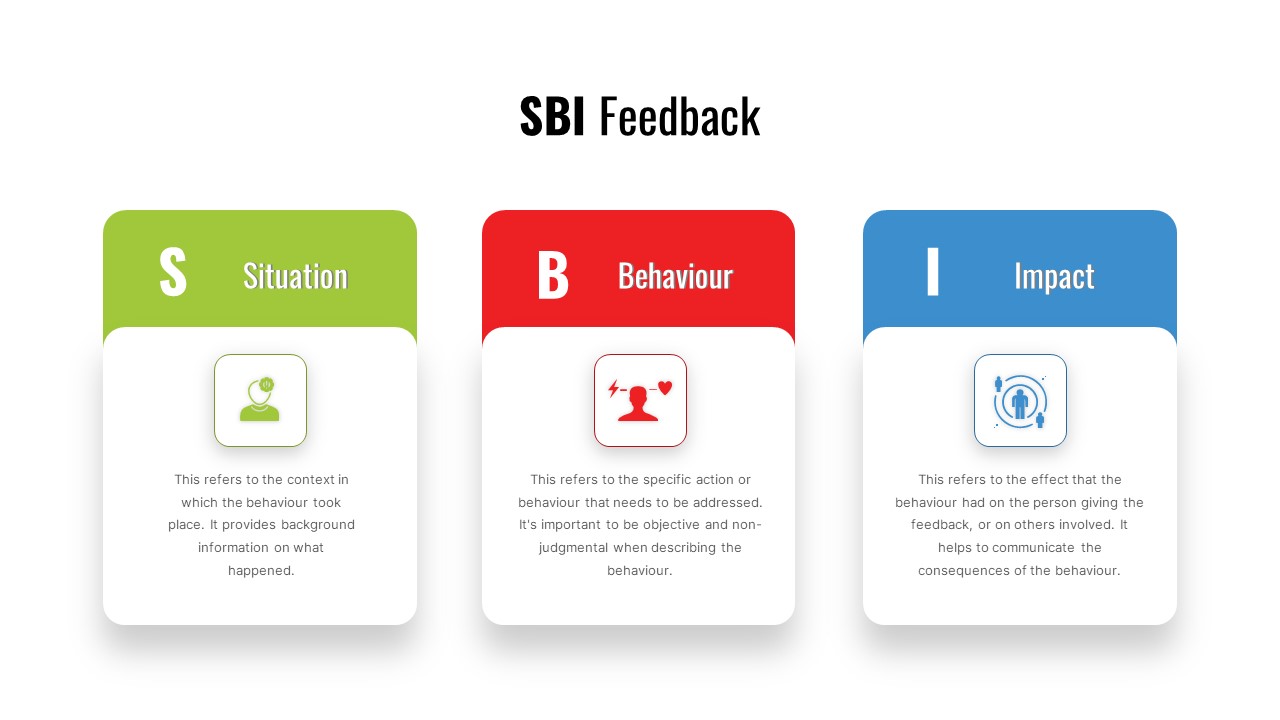
SBI Feedback Model Process Diagram Template for PowerPoint & Google Slides
Process
Cost-Volume-Profit Analysis Diagram Template for PowerPoint & Google Slides
Finance
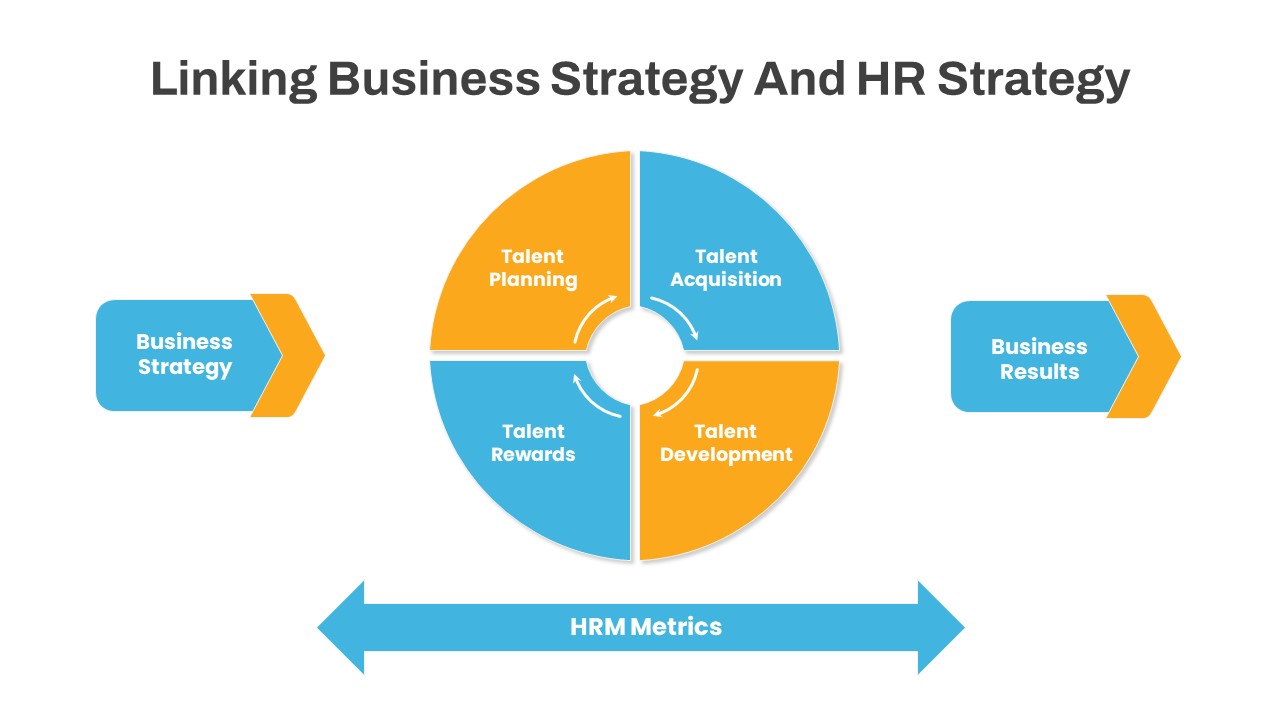
Linking Business HR Strategy Circular Diagram Template for PowerPoint & Google Slides
Business Strategy
ETL Data Pipeline Workflow Diagram Template for PowerPoint & Google Slides
Process
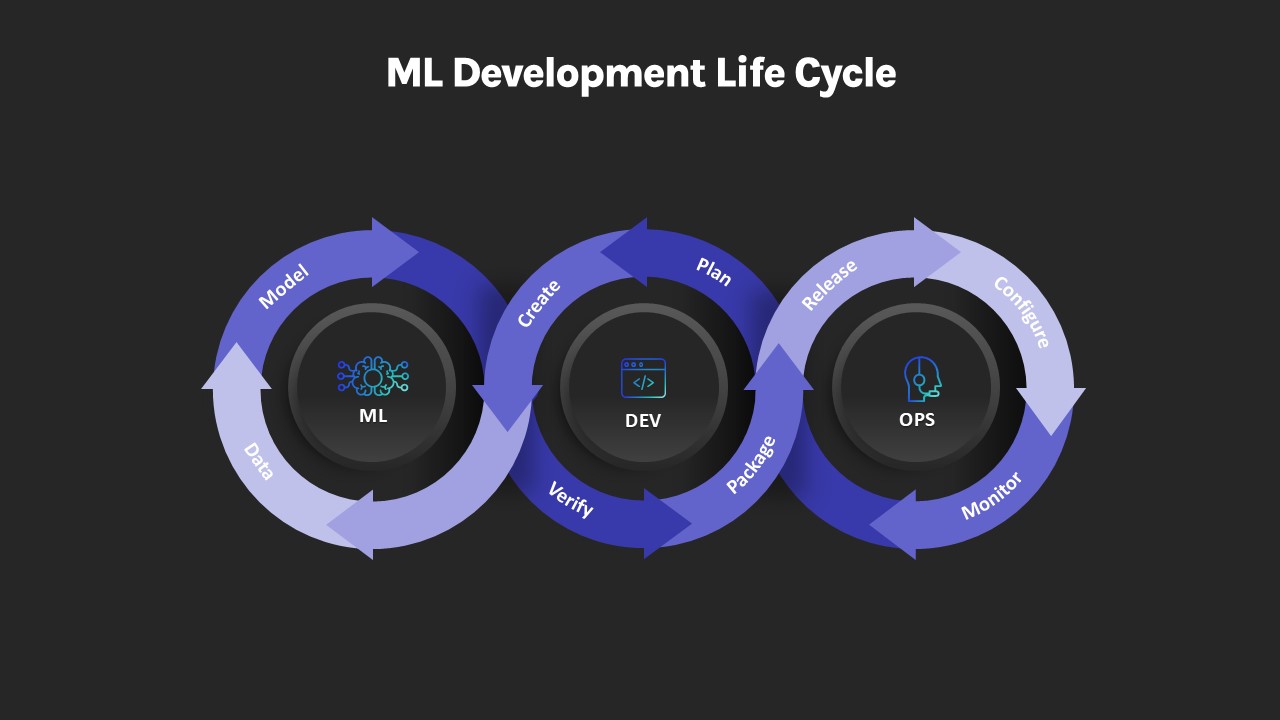
ML Development Life Cycle Diagram Template for PowerPoint & Google Slides
Machine Learning
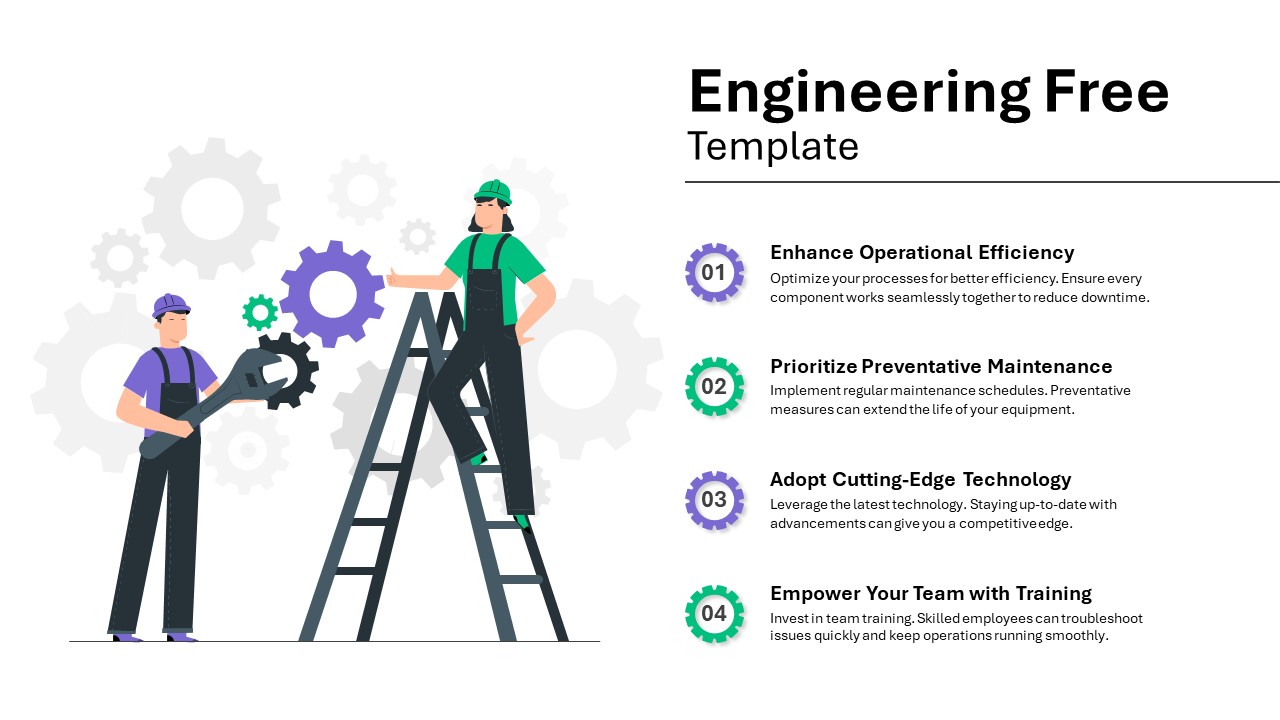
Engineering Efficiency Diagram Template for PowerPoint & Google Slides
Process
Free
Integrative Thinking Comparison Diagram Template for PowerPoint & Google Slides
Comparison
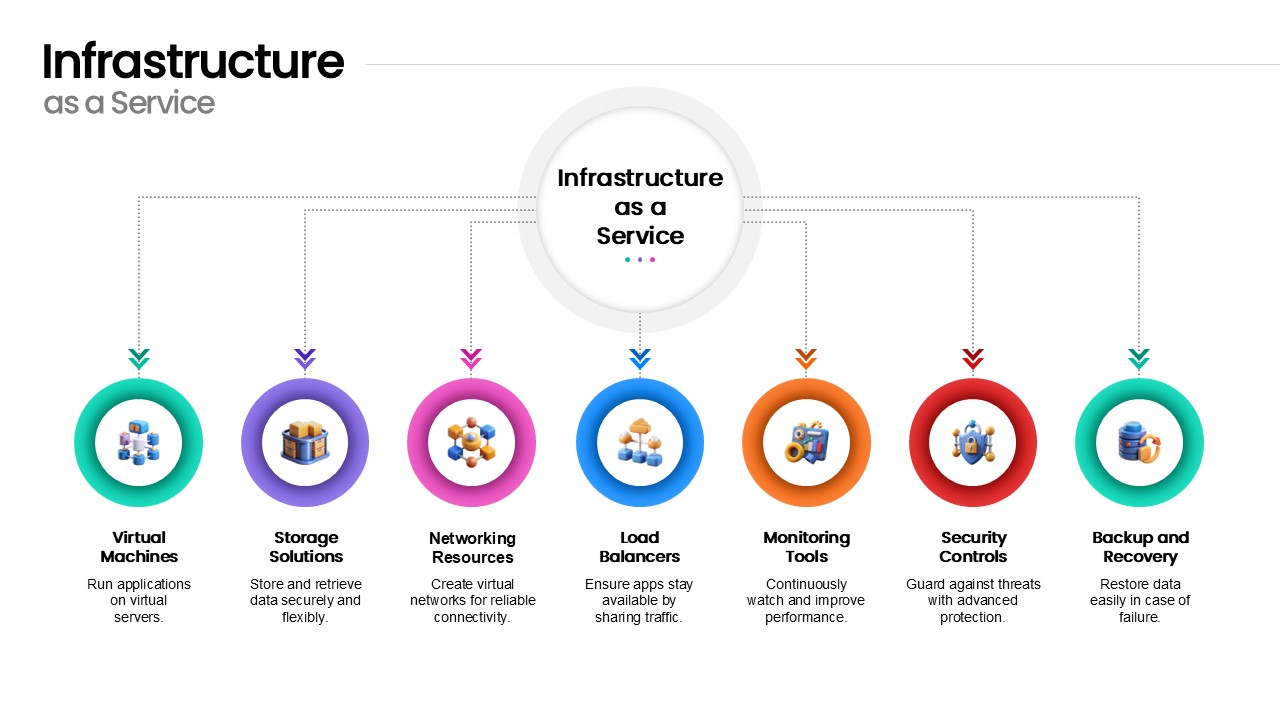
Infrastructure as a Service Diagram Template for PowerPoint & Google Slides
Cloud Computing
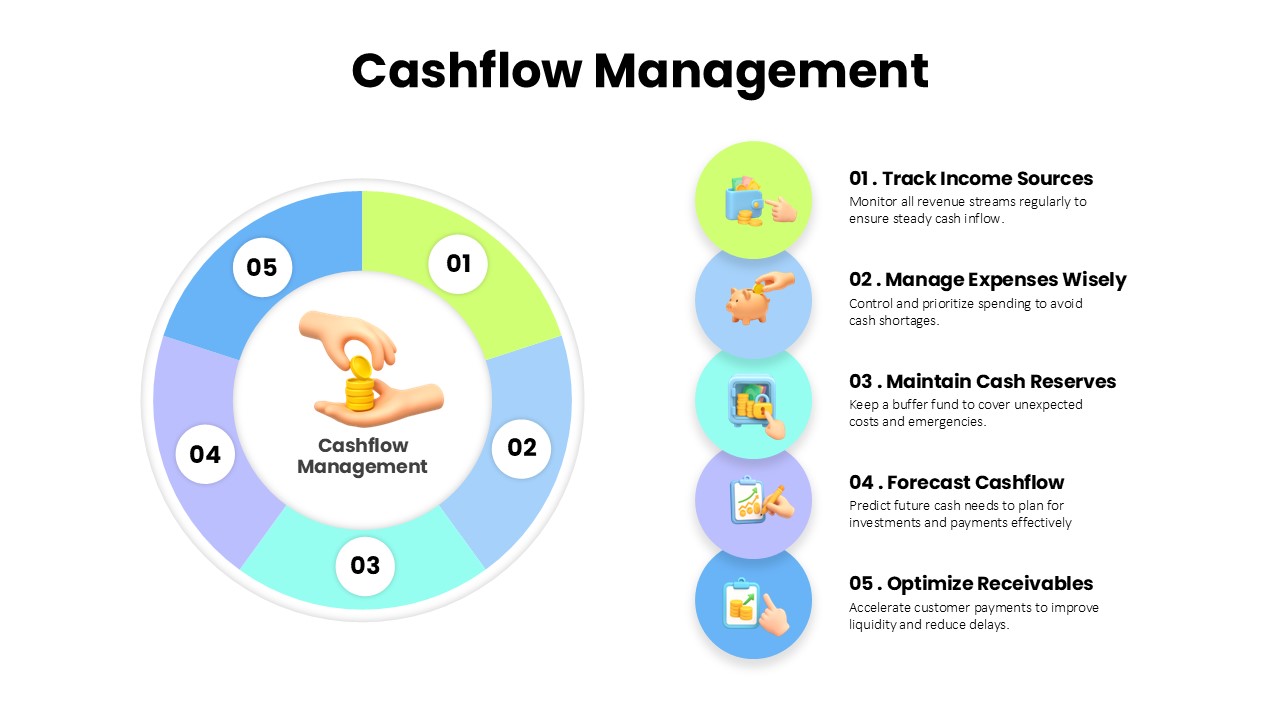
Cashflow Management Cycle Diagram Template for PowerPoint & Google Slides
Finance
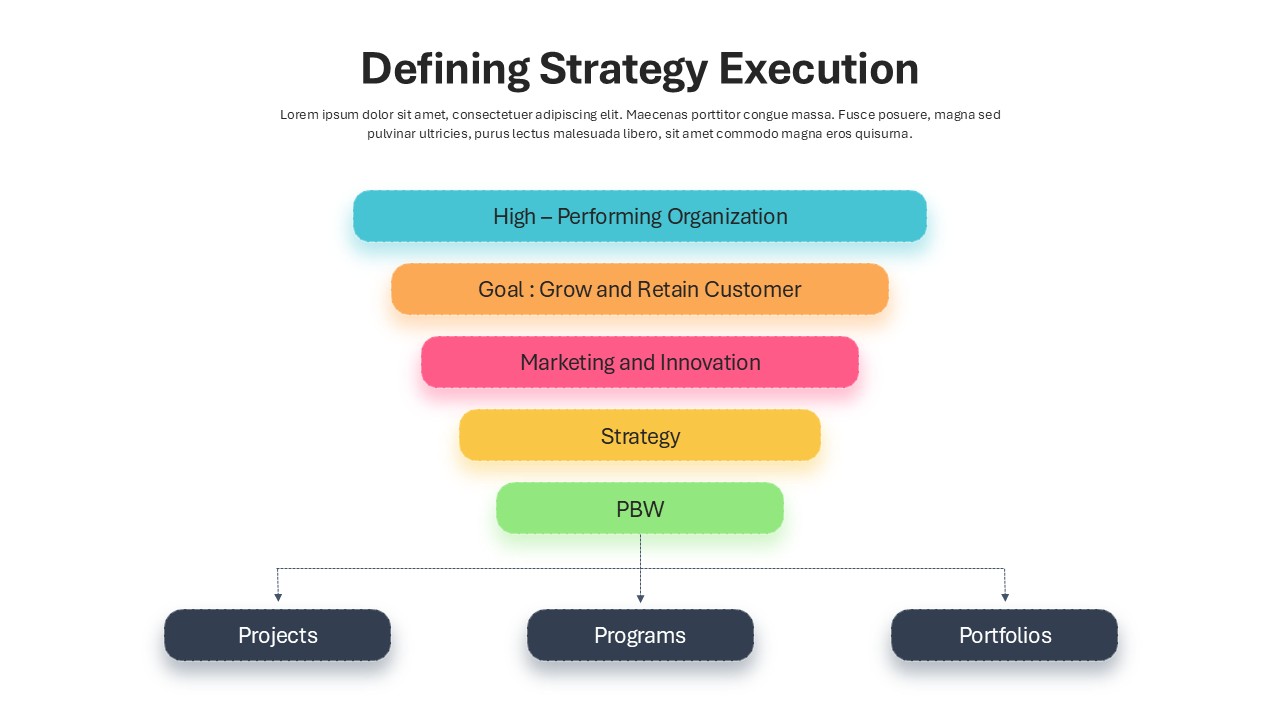
Defining Strategy Execution Diagram Template for PowerPoint & Google Slides
Funnel
Barnlund Communication Model Diagram Template for PowerPoint & Google Slides
Process
Materiality Assessment Matrix Diagram Template for PowerPoint & Google Slides
Risk Management